Embed Size (px)
Citation preview
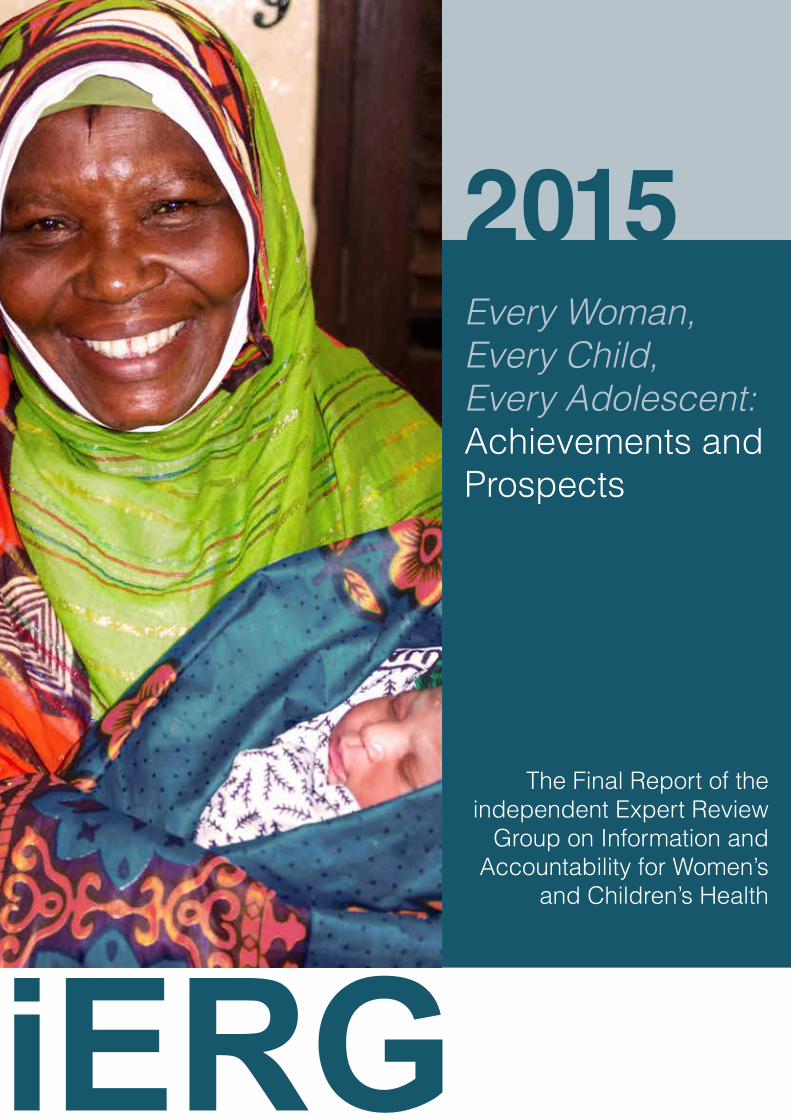
The Final Report of the independent Expert Review
Group on Information and Accountability for Women’s
and Children’s Health
Every Woman, Every Child, Every Adolescent: Achievements and Prospects
2015

The Final Report of the independent Expert Review Group on Information and Accountability for Women’s and Children’s Health
2015
Every Woman, Every Child,Every Adolescent:Achievements and Prospects
WHO Library Cataloguing-in-Publication Data
Every woman, every child, every adolescent: achievements and prospects: the final report of the independent Expert Review Group on Information and Accountability for Women’s and Children’s health.
1.Women’s Health. 2.Child Welfare. 3.Health Status Disparities. 4.Adolescent. 5.Poverty. 6.Social Responsibility. 7.International Cooperation. 8.Interinstitutional Relations. I.independent Expert Review Group (iERG) on Information and Accountability for Women’s and Children’s Health.
ISBN 978 92 4 150928 2 (NLM classification: WA 310)
© World Health Organization 2015
All rights reserved. Publications of the World Health Organization are available on the WHO website (www.who.int) or can be purchased from WHO Press, World Health Organization, 20 Avenue Appia, 1211 Geneva 27, Switzerland (tel.: +41 22 791 3264; fax: +41 22 791 4857; e-mail: [email protected]).
Requests for permission to reproduce or translate WHO publications –whether for sale or for non-commercial distribution– should be addressed to WHO Press through the WHO website (www.who.int/about/licensing/copyright_form/en/index.html).
The designations employed and the presentation of the material in this publication do not imply the expression of any opinion whatsoever on the part of the World Health Organization concerning the legal status of any country, territory, city or area or of its authorities, or concerning the delimitation of its frontiers or boundaries. Dotted and dashed lines on maps represent approximate border lines for which there may not yet be full agreement.
The mention of specific companies or of certain manufacturers’ products does not imply that they are endorsed or recommended by the World Health Organization in preference to others of a similar nature that are not mentioned. Errors and omissions excepted, the names of proprietary products are distinguished by initial capital letters.
All reasonable precautions have been taken by the World Health Organization to verify the information contained in this publication. However, the published material is being distributed without warranty of any kind, either expressed or implied. The responsibility for the interpretation and use of the material lies with the reader. In no event shall the World Health Organization be liable for damages arising from its use.
This publication contains the collective views of the independent Expert Review Group (iERG) on Information and Accountability for Women’s and Children’s Health and does not necessarily represent the decisions or the policies of the World Health Organization.
Printed in Luxembourg
Photo credits: Front cover, 2015 Tarek Meguid; page 18, 2015 Paolo Patruno/UMWomen/CC BY 4.0; Chapter 1, © 2009 Javier Arcenillas/GEAPHOTOWORDS, Courtesy of Photoshare; page 24, 2013 Lieve Blancquaert; page 28, © 2006 Abhijit Dey, Courtesy of Photoshare; Chapter 2, © UNICEF/NYHQ2004-1267/Pirozzi; page 32, 2013 Lieve Blancquaert; page 38, © 2014 Aji Styawan, Courtesy of Photoshare; page 53, © 2010 Sandipan Majumdar, Courtesy of Photoshare; page 56, © UNICEF/PFPG2015-3066/Karki; page 58, © UNICEF/LAOA2005-5540/Holmes; Chapter 3, © UNICEF/INDA2013-00461/Vishwanathan; page 66, © 2008 Paul Jeffrey, Courtesy of Photoshare; page 69, © 2013 Chelsea Hedquist, Courtesy of Photoshare; page 70, 2015 Tarek Meguid; page 73, © UNICEF/NYHQ2006-1486/Pirozzi; Chapter 4, 2014 Yvan Tran; page 77, © UNICEF/BANA2006-00682/Noorani; 2015 Tarek Meguid; © 2000 Liz Gilbert, Courtesy of Photoshare; page 79, 2013 Lieve Blancquaert; page 80, © 2010 Sumon Yusuf, Courtesy of Photoshare; page 83, © UNICEF/MENA2014-00022/Romenzi; page 84, 2015 Tarek Meguid; Chapter 5, © UNICEF/NYHQ2012-1986/Noorani; page 89, © 2014 Donna Murray, Courtesy of Photoshare; page 96, 2013 Direct Relief/CC BY 4.0; Acknowledgements, 2014 Kathleen Ferrier; WHO/Violaine Martin; 2014 Pan American Health Organization/CC BY 4.0; 2014 Tarek Meguid; 2015 Anne Rayner/CC BY 4.0; Annex 3, 2013 Lieve Blancquaert; Back cover, © 2009 Center for Communication Programs, Courtesy of Photoshare.
Design by Paprika (Annecy, France)
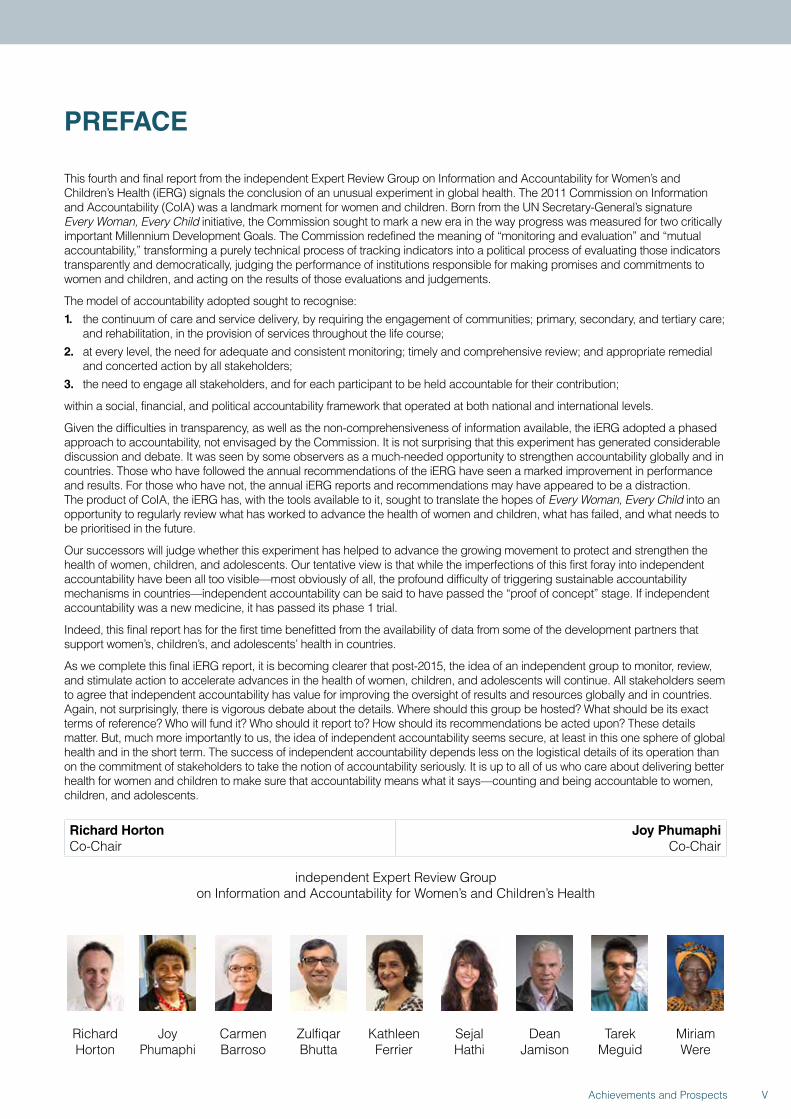
PREFACE
This fourth and final report from the independent Expert Review Group on Information and Accountability for Women’s and Children’s Health (iERG) signals the conclusion of an unusual experiment in global health. The 2011 Commission on Information and Accountability (CoIA) was a landmark moment for women and children. Born from the UN Secretary-General’s signature Every Woman, Every Child initiative, the Commission sought to mark a new era in the way progress was measured for two critically important Millennium Development Goals. The Commission redefined the meaning of “monitoring and evaluation” and “mutual accountability,” transforming a purely technical process of tracking indicators into a political process of evaluating those indicators transparently and democratically, judging the performance of institutions responsible for making promises and commitments to women and children, and acting on the results of those evaluations and judgements.
The model of accountability adopted sought to recognise:1. the continuum of care and service delivery, by requiring the engagement of communities; primary, secondary, and tertiary care;
and rehabilitation, in the provision of services throughout the life course;2. at every level, the need for adequate and consistent monitoring; timely and comprehensive review; and appropriate remedial
and concerted action by all stakeholders;3. the need to engage all stakeholders, and for each participant to be held accountable for their contribution;
within a social, financial, and political accountability framework that operated at both national and international levels.
Given the difficulties in transparency, as well as the non-comprehensiveness of information available, the iERG adopted a phased approach to accountability, not envisaged by the Commission. It is not surprising that this experiment has generated considerable discussion and debate. It was seen by some observers as a much-needed opportunity to strengthen accountability globally and in countries. Those who have followed the annual recommendations of the iERG have seen a marked improvement in performance and results. For those who have not, the annual iERG reports and recommendations may have appeared to be a distraction. The product of CoIA, the iERG has, with the tools available to it, sought to translate the hopes of Every Woman, Every Child into an opportunity to regularly review what has worked to advance the health of women and children, what has failed, and what needs to be prioritised in the future.
Our successors will judge whether this experiment has helped to advance the growing movement to protect and strengthen the health of women, children, and adolescents. Our tentative view is that while the imperfections of this first foray into independent accountability have been all too visible—most obviously of all, the profound difficulty of triggering sustainable accountability mechanisms in countries—independent accountability can be said to have passed the “proof of concept” stage. If independent accountability was a new medicine, it has passed its phase 1 trial.
Indeed, this final report has for the first time benefitted from the availability of data from some of the development partners that support women’s, children’s, and adolescents’ health in countries.
As we complete this final iERG report, it is becoming clearer that post-2015, the idea of an independent group to monitor, review, and stimulate action to accelerate advances in the health of women, children, and adolescents will continue. All stakeholders seem to agree that independent accountability has value for improving the oversight of results and resources globally and in countries. Again, not surprisingly, there is vigorous debate about the details. Where should this group be hosted? What should be its exact terms of reference? Who will fund it? Who should it report to? How should its recommendations be acted upon? These details matter. But, much more importantly to us, the idea of independent accountability seems secure, at least in this one sphere of global health and in the short term. The success of independent accountability depends less on the logistical details of its operation than on the commitment of stakeholders to take the notion of accountability seriously. It is up to all of us who care about delivering better health for women and children to make sure that accountability means what it says—counting and being accountable to women, children, and adolescents.
Richard HortonCo-Chair
Joy PhumaphiCo-Chair
independent Expert Review Group on Information and Accountability for Women’s and Children’s Health
Joy Phumaphi
Carmen Barroso
Zulfiqar Bhutta
Dean Jamison
Tarek Meguid
Miriam Were
Richard Horton
Kathleen Ferrier
Sejal Hathi
VAchievements and Prospects
ABBREVIATIONS
AFRO WHO African RegionAIDS Acquired immune deficiency syndromeANC Antenatal careAUH Asignación Universal por HijoCAREP Care seeking for suspected pneumoniaCCT Conditional cash transferCEE Central and Eastern EuropeCIS Commonwealth of Independent StatesCoIA Commission on Information and
Accountability for Women’s and Children’s Health
CoLSC UN Commission on Life-Saving Commodities
CRS Creditor Reporting SystemCRVS Civil registration and vital statisticsDG Director-GeneralDHS Demographic and Health SurveysDPR Korea Democratic People’s Republic of KoreaDRC Democratic Republic of the CongoDTP3 Diphtheria-tetanus-pertussisEBF Exclusive breastfeedingEMoC Emergency obstetric careEMRO WHO Eastern Mediterranean RegionEPMM Ending Preventable Maternal MortalityEURO WHO European RegionEWEC Every Woman Every ChildFARDC Forces Armées de la République
Démocratique du CongoFFD3 Third International Conference on
Financing for DevelopmentFP2020 Family Planning 2020FPS Family planning needs satisfiedG7 Group of SevenGavi The Global Alliance for Vaccines and
ImmunisationGBD Global Burden of DiseaseGDP Gross domestic productGFF Global Financing FacilityHIV Human immunodeficiency virusIAP Independent Advisory PanelICPD International Conference on Population
and DevelopmentICT Information and communication technologyiERG Independent Expert Review GroupIPPF International Planned Parenthood
Federation
IPU Inter-Parliamentary UnionITU International Telecommunication UnionLAC Latin America and CaribbeanLao PDR Lao People’s Democratic RepublicMDGs Millennium Development GoalsMDSR Maternal death surveillance and responseMICS Multiple Indicator Cluster SurveysMMR Maternal mortality ratio NMR Neonatal mortality rateODA Official Development AssistanceOECD Organisation for Economic Co-operation
and DevelopmentOECD-DAC OECD – Development Assistance
Committee OHCHR Office of the High Commissioner for
Human RightsPAHO Pan American Health OrganizationPEPFAR President’s Emergency Plan for AIDS ReliefPMNCH Partnership for Maternal, Newborn,
and Child HealthPNC Postnatal careRMNCAH Reproductive, maternal, newborn, child,
and adolescent healthSAGE Strategic Advisory Group of Experts
on ImmunizationSBA Skilled birth attendantSDGs Sustainable Development GoalsSEARO WHO South-East Asia RegionSTI Sexually transmitted infectionTB TuberculosisTFR Total fertility rateU5MR Under-five mortality rateUNAIDS Joint United Nations Programme on
HIV/AIDSUNECA UN Economic Commission for AfricaUNFPA United Nations Population FundUNGA United Nations General AssemblyUNICEF United Nations Children’s Fund UNSG United Nations Secretary-GeneralUSAID United States Agency for
International DevelopmentWHO World Health OrganizationWPRO WHO Western Pacific Region
VI Achievements and Prospects
Case studies
Political decisions and their impact on India’s Family Planning Programme .......................................................................29China: Impressive efforts to improve maternal and child health ...........................................................................................42Philippines: The politics of family planning and its implications for the health of current and future generations ..............73Rape and access to abortion in the Democratic Republic of the Congo ............................................................................85Argentina: Conditional cash transfer programmes and their impact on women’s and children’s health and gender roles .....................................................................................................................................................................94
CONTENTS
Preface ...................................................................................................................................................V
Executive Summary ............................................................................................................................. 3
1. Introduction ..................................................................................................................................... 21
2. Progress in Women’s and Children’s Health in Countries .......................................................... 31
3. The Commission on Information and Accountability: A Final Report Card ............................... 63
4. Post-2015: Accountability for Sustainable Development ............................................................ 75
5. Conclusions and Recommendations ............................................................................................ 87
References .......................................................................................................................................... 97
Acknowledgements ............................................................................................................................ 99
Country Profiles .................................................................................................................................101
Donor Profiles ................................................................................................................................... 255
Annexes
Annex 1. Terms of reference of the iERG and its countries of concern .............................................................................. 274Annex 2: Recommendations of the Commission on Information and Accountability for Women’s and Children’s Health ............................................................................................................................................................275Annex 3: Socioeconomic, gender and urban/rural inequalities in RMNCH indicators in 98 countries ............................276Annex 4. Core indicators for monitoring country progress in implementing the CoIA recommendations .......................307Annex 5. Evidence submitted to, and commissioned by, the iERG ...................................................................................309Annex 6. The iERG’s input on the Background Paper on Accountability for the updated Global Strategy for Women’s, Children’s, and Adolescents’ Health .............................................................................................................. 312
1Achievements and Prospects
Figures, tables, and panels
Figure 1. Trends in child mortality in the 75 iERG countries, by average annual rate of reduction, 2000-2012 .................36Figure 2. Global causes of child deaths in 2013 ...................................................................................................................38Figure 3. Percent of under-5 deaths in the poorest and richest quintiles, in 50 of the 75 iERG countries and select
countries of comparison ..........................................................................................................................................40Figure 4. Trends in maternal mortality in the 75 iERG countries, by average annual rate of reduction, 2000-2013 ..........44Figure 5. 75 iERG countries ranked by reduction trends in under-5 and maternal mortality ..............................................50Figure 6. Global contraceptive users: FP2020 goal vs. historic trend .................................................................................. 51Figure 7. Stakeholders with commitments to the Global Strategy, by constituency, September 2010–May 2015 ............58Figure 8. Trends in Global Strategy disbursements ..............................................................................................................59Figure 9. Disbursements against Global Strategy commitments .........................................................................................59Figure 10. ODA for RMNCH in the 75 iERG countries, 2006–2013 .....................................................................................60Figure 11. ODA for family planning in the 75 iERG countries, 2008–2013 ...........................................................................60Figure 12. Geographic targeting of donor funding and countries’ needs, 2011–2013 ........................................................ 61Figure 13. Government RMNCH expenditures in the 75 iERG countries, 2006–2013 .......................................................62Figure 14. Summary of global progress on implementation of the recommendations from CoIA ......................................64Figure 15. Age distribution of under-20 mortality in low- and middle-income countries, 2010 ...........................................78Summary of global progress on implementation of the recommendations from CoIA ....................................................... 12
Table 1. Under-5 mortality, number of deaths, and annualised rates of change, for 75 iERG countries (with 95% CI), 2013 ........33Table 2. Selected causes of global child deaths in 1990 and 2013 .....................................................................................39Table 3. MMR, number of maternal deaths, and annualised rates of change, for 75 iERG countries (with 95% CI) .........46Table 4. Progress towards national newborn health plans in those iERG countries with the highest newborn mortality
rate and/or burden of neonatal deaths .....................................................................................................................55
Panel 1. Sustainable Development Goals ..............................................................................................................................25Panel 2. Targets for SDG-3 .....................................................................................................................................................27Panel 3. Life-saving commodities ..........................................................................................................................................52Panel 4. Recommendations of the UN Commission on Life-Saving Commodities for Women’s and Children’s Health ...54Panel 5. 11 health indicators for women and children adopted by the Commission on Information and Accountability ..65Panel 6. Bilateral sector-allocable ODA by RMNCH marker score (in US$ millions) ...........................................................67Panel 7. Recommendations from the iERG, 2012-2014 ........................................................................................................ 72Panel 8. Conceptual framework for the new Global Strategy for Women’s, Children’s, and Adolescents’ Health ............. 81Panel 9. Estimates of child and maternal deaths averted for the period 2015–2030 ..........................................................90
2 Achievements and Prospects
EXECUTIVE SUMMARY
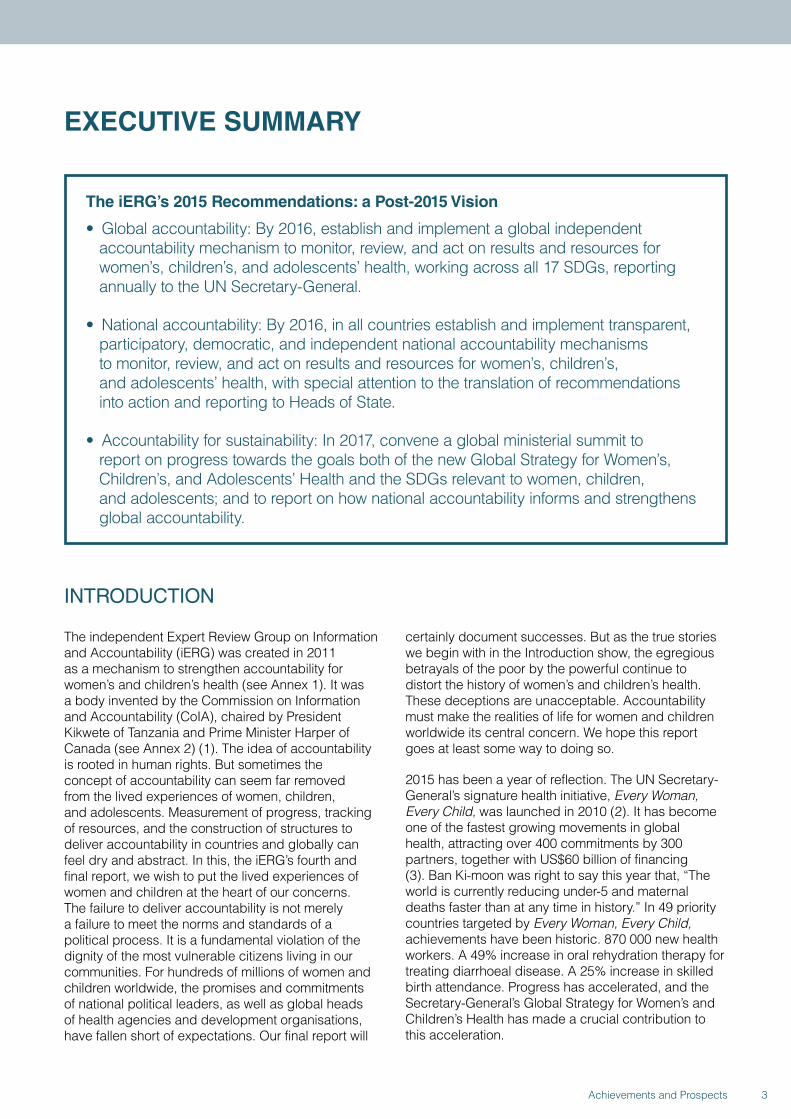
The iERG’s 2015 Recommendations: a Post-2015 Vision
• Global accountability: By 2016, establish and implement a global independent accountability mechanism to monitor, review, and act on results and resources for women’s, children’s, and adolescents’ health, working across all 17 SDGs, reporting annually to the UN Secretary-General.
• National accountability: By 2016, in all countries establish and implement transparent, participatory, democratic, and independent national accountability mechanisms to monitor, review, and act on results and resources for women’s, children’s, and adolescents’ health, with special attention to the translation of recommendations into action and reporting to Heads of State.
• Accountability for sustainability: In 2017, convene a global ministerial summit to report on progress towards the goals both of the new Global Strategy for Women’s, Children’s, and Adolescents’ Health and the SDGs relevant to women, children, and adolescents; and to report on how national accountability informs and strengthens global accountability.
INTRODUCTION
The independent Expert Review Group on Information and Accountability (iERG) was created in 2011 as a mechanism to strengthen accountability for women’s and children’s health (see Annex 1). It was a body invented by the Commission on Information and Accountability (CoIA), chaired by President Kikwete of Tanzania and Prime Minister Harper of Canada (see Annex 2) (1). The idea of accountability is rooted in human rights. But sometimes the concept of accountability can seem far removed from the lived experiences of women, children, and adolescents. Measurement of progress, tracking of resources, and the construction of structures to deliver accountability in countries and globally can feel dry and abstract. In this, the iERG’s fourth and final report, we wish to put the lived experiences of women and children at the heart of our concerns. The failure to deliver accountability is not merely a failure to meet the norms and standards of a political process. It is a fundamental violation of the dignity of the most vulnerable citizens living in our communities. For hundreds of millions of women and children worldwide, the promises and commitments of national political leaders, as well as global heads of health agencies and development organisations, have fallen short of expectations. Our final report will
certainly document successes. But as the true stories we begin with in the Introduction show, the egregious betrayals of the poor by the powerful continue to distort the history of women’s and children’s health. These deceptions are unacceptable. Accountability must make the realities of life for women and children worldwide its central concern. We hope this report goes at least some way to doing so.
2015 has been a year of reflection. The UN Secretary-General’s signature health initiative, Every Woman, Every Child, was launched in 2010 (2). It has become one of the fastest growing movements in global health, attracting over 400 commitments by 300 partners, together with US$60 billion of financing (3). Ban Ki-moon was right to say this year that, “The world is currently reducing under-5 and maternal deaths faster than at any time in history.” In 49 priority countries targeted by Every Woman, Every Child, achievements have been historic. 870 000 new health workers. A 49% increase in oral rehydration therapy for treating diarrhoeal disease. A 25% increase in skilled birth attendance. Progress has accelerated, and the Secretary-General’s Global Strategy for Women’s and Children’s Health has made a crucial contribution to this acceleration.
3Achievements and Prospects
But there is always a reckoning. As much as the global community should admire the achievements of the Global Strategy, it left substantial room for improvement. In 2010, a commitment was made, one that should not be forgotten (2):
“In the 49 countries of the world with the lowest income, progress would be incredible. Between 2011 and 2015, we could prevent the deaths of more than 15 million children under 5, including more than 3 million newborns. We could prevent...about 570 000 women from dying from complications relating to pregnancy and childbirth.”
This headline promise was turned into an advocacy campaign for the Global Strategy: “Saving 16 million lives by 2015.” But in the Progress Report on the Global Strategy, published earlier this year, the true figure was revealed—2.4 million deaths averted since 2010. This substantial difference between what was promised and what was delivered is hard to comprehend. There are at least two possible explanations. First, that the Global Strategy failed. Second, that the calculation of 16 million deaths was
exaggerated or an error. If the former explanation is true, the global community needs to conduct a careful autopsy on what went wrong and why. If the latter explanation is correct, how did the full technical capacity of WHO and partner agencies make such a mistake? It is not good enough, as the Progress Report does, to gloss over this discrepancy in numbers by saying that the Global Strategy has delivered “substantial gains.”
2015 has also been a year of transition. Ban Ki-moon has called the process leading to the post-2015 Sustainable Development Goals (SDGs), “The Road to Dignity” (4). 17 SDGs have been agreed upon, and health is one of those Goals (SDG-3) (Panels 1 and 2; see main report). Women’s and children’s health is embedded within that Goal. In parallel, a new Global Strategy has been drafted to meet the challenge of a more inclusive and complex era (5). Agreement about the SDGs and the elements of a new Global Strategy does not mean that the approach to women and children is “business as usual.” There are already several critical differences in the approach and attitudes to women and children.
PROGRESS IN WOMEN’S AND CHILDREN’S HEALTHAccording to the latest figures available to the iERG, 6.3 million children under 5 died in 2013 (11, 12). Figures for the 75 iERG countries, taken from the Global Burden of Disease (GBD), are shown in Table 1 (see main report) (11). An alternative presentation, using data from the UN Interagency Group for Child Mortality Estimation, is shown in Figure 1. The headline message from these numbers is that although the 2013 estimate represents a 64% reduction in child mortality since 1970 (when 17.6 million deaths took place), most countries will not achieve the MDG-4 target—which requires a 4.4% rate of mortality decline annually. The GBD collaboration singles out five countries that have made especially strong progress—in Southeast Asia, Cambodia, Lao PDR, and Viet Nam; and in eastern sub-Saharan Africa, Ethiopia and Rwanda. With annualised rates of decline in child mortality above 4%, these countries show that political commitment and judicious investments in health and (especially) maternal education can deliver results above expectation. The global causes of child death are shown in Figure 2 (see main report) (12). An alternative presentation of selected causes of child deaths is shown in Table 2 (see main report) (13). A particular concern is the growing importance of newborn mortality. In 2013, 2.8 million neonatal deaths occurred globally (14). Most of these deaths were preventable. Newborn mortality is falling, but more slowly than for under-5 deaths. The result is that newborn deaths now account for 44% of total under-5 deaths. Deaths in newborns can be divided into
two categories—early (0-6 days of age) and late (7-28 days of age). Most early neonatal deaths are caused by preterm birth (41%) or intrapartum (27%) complications. For late neonatal deaths, infections are the largest cause (almost half of newborn deaths). Equity analyses reveal severe disparities, despite often impressive average reductions in child deaths. Figure 3 (see main report) displays the proportion of under-5 deaths in the poorest and richest quintiles for a selection of iERG countries, together with several other nations included as comparators. The countries are ranked according to the percentage of all under-5 deaths that occur in the poorest quintile. Almost half of Brazil’s under-5 deaths take place in this poorest quintile.
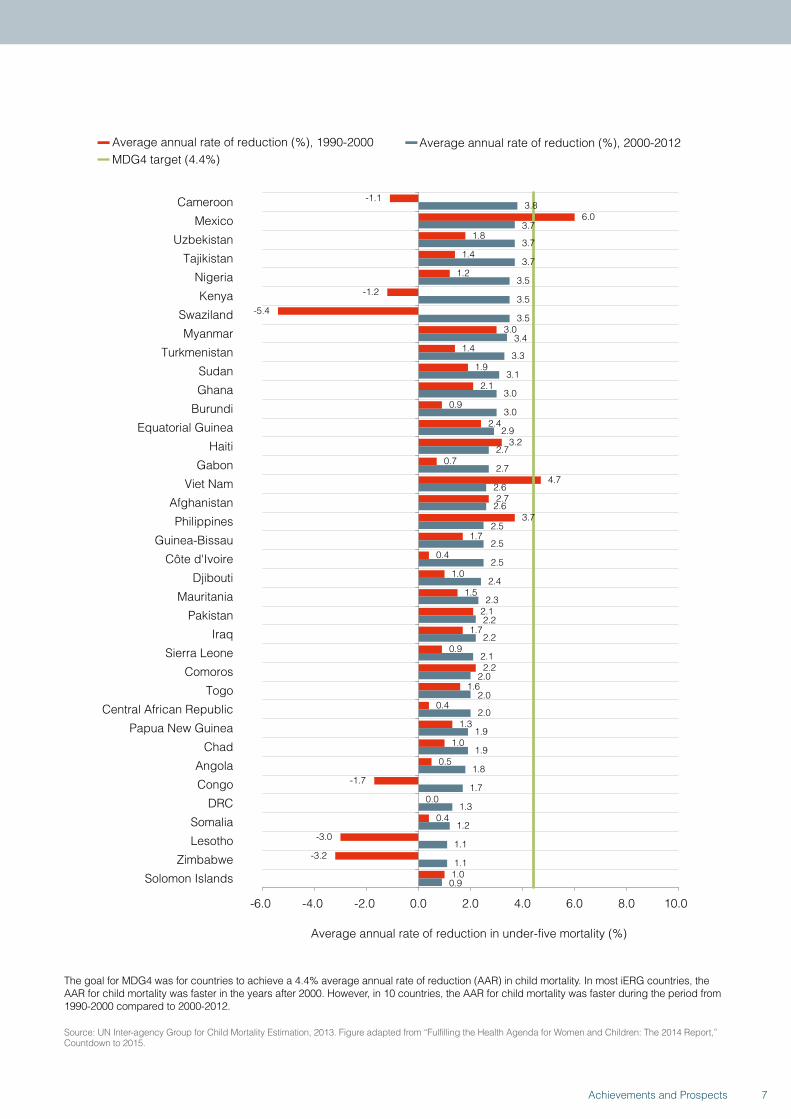
For maternal mortality (MDG-5a), the GBD study has reported estimates for 2013: 292 982 deaths, compared with 376 034 deaths in 1990 (15). Table 3 (see main report) shows their maternal mortality data for the 75 iERG countries of concern. Figure 4 shows data from the Maternal Mortality Estimate Interagency Group, with trends in maternal mortality in the 75 iERG countries. These data are divided by average annual rate of reduction for two periods: 1990-2000 and 2000-2013. Although not universally consistent, one can see many examples of acceleration in reductions in maternal mortality (in 56 countries, although with 19 nations showing decadal decelerations in progress). Figure 5 shows countries ranked by reduction trends in under-5 and maternal mortality, from best to worst.
4 Achievements and Prospects
Countries that rank highly on both measures fall into the lower left of the diagram. If rankings on under-5 and maternal mortality were highly correlated, the points in the figure would cluster along the 45 degree line, which they quite evidently do not. The fact that they are as scattered as they are suggests that very different policies and influences may be affecting success in these two domains.
Achieving universal access to reproductive health services (MDG-5b) is the most off-track MDG of all. A report from the Guttmacher Institute in 2014 provides a comprehensive recent assessment of access to basic sexual and reproductive health services (16a). Currently, 225 million women in developing countries wish to avoid pregnancy, but are not using modern contraceptives. If all women who sought to avoid pregnancy used modern contraception, the number of unintended pregnancies would fall by 70% and unsafe abortions would drop by 74%. If contraceptive needs were met and all pregnant women and their newborns received basic standards of care, maternal deaths would fall from 290 000 to 96 000, newborn deaths would decline to 660 000, and HIV transmission from mother-to-child would be nearly eliminated. For women aged 15-49, a package of essential sexual and reproductive health services, costing no more than $25 per woman aged 15-49 years, would include: contraceptive services, pregnancy and newborn care, services for pregnant women living with HIV, and treatment of four other STIs. In its submission to the iERG, Family Planning 2020 (FP2020) provided its latest judgement on progress made and gaps remaining in improving access to modern contraceptives (Figure 6). The Guttmacher Institute also drew the iERG’s attention to the neglected importance of unsafe abortion rates. Although estimates for safe and unsafe abortion have not been made since 2008, it is clear that unsafe abortion remains common in many low-income settings, especially among adolescents.
The iERG commissioned Professor Cesar Victora (University of Pelotas, Brazil) to examine socioeconomic, gender, and urban/rural inequalities for women’s and children’s health. His full findings are reported in Annex 3. The key findings from this equity analysis are:
• Pro-rich inequalities are observed for all indicators, except for breastfeeding.
• The widest gaps are seen for skilled birth attendance.• Postnatal care coverage is especially low across
all quintiles.• Pro-urban inequalities are seen for all indicators,
except for exclusive breastfeeding.
• Boys and girls show similar coverage levels for post-natal care, exclusive breastfeeding, DPT3 vaccine, and pneumonia care seeking.
• For family planning, there are consistent pro-rich coverage patterns.
• Inequalities are largest in Africa.• Adolescents have a much greater unmet need
for contraception.• For antenatal care, in every region there are pro-rich
coverage patterns.• At the global level, there are important inequalities in
total fertility: ranging from 2.8 children/woman in the richest quintile to 5.4 in the poorest quintile.
• At the global level, the average number of children per urban woman is 3.1, compared with 4.6 among rural women.
• In all regions, fertility and stunting are inversely related to wealth.
Issues of equity received insufficient attention during the era of the MDGs, as these findings starkly and shockingly indicate. Although equity is frequently discussed, it is seldom prioritised in policies and programmes. Post-2015, whatever mechanism for accountability is chosen for women, children, and adolescents, equity must be made a supreme priority. UNICEF has put equity-focused programming at the heart of its recent work on reducing child mortality, to its enormous credit and largely thanks to the personal leadership of its Executive Director, Anthony Lake. As Lake wrote in UNICEF’s analysis of equity in the MDGs, “If development is to be truly sustainable, it must be truly equitable—and seek to reach every child. For children who have equal opportunities will in turn create greater opportunities for their own children and the generations that follow” (16b).
The architecture of accountability for Every Woman, Every Child has led to a strong collaboration between the Partnership for Maternal, Newborn, and Child Health (PMNCH) and the iERG. In three past PMNCH reports, commitments to the Global Strategy have been documented and issues investigated in ways that have been synergistic and complementary to the work of the iERG. In 2015, PMNCH is not producing an annual report. However, we are fortunate that the Partnership has continued tracking financial flows to RMNCH. Here, we present a summary of their latest findings:
• The number of stakeholders committing to women’s and children’s health has increased from 111 in 2010 to 334 in 2015 (Figure 7).
• Since May, 2014, an additional 34 commitment makers made pledges to the Global Strategy—17 of them in support of the Every Newborn Action Plan.
5Achievements and Prospects
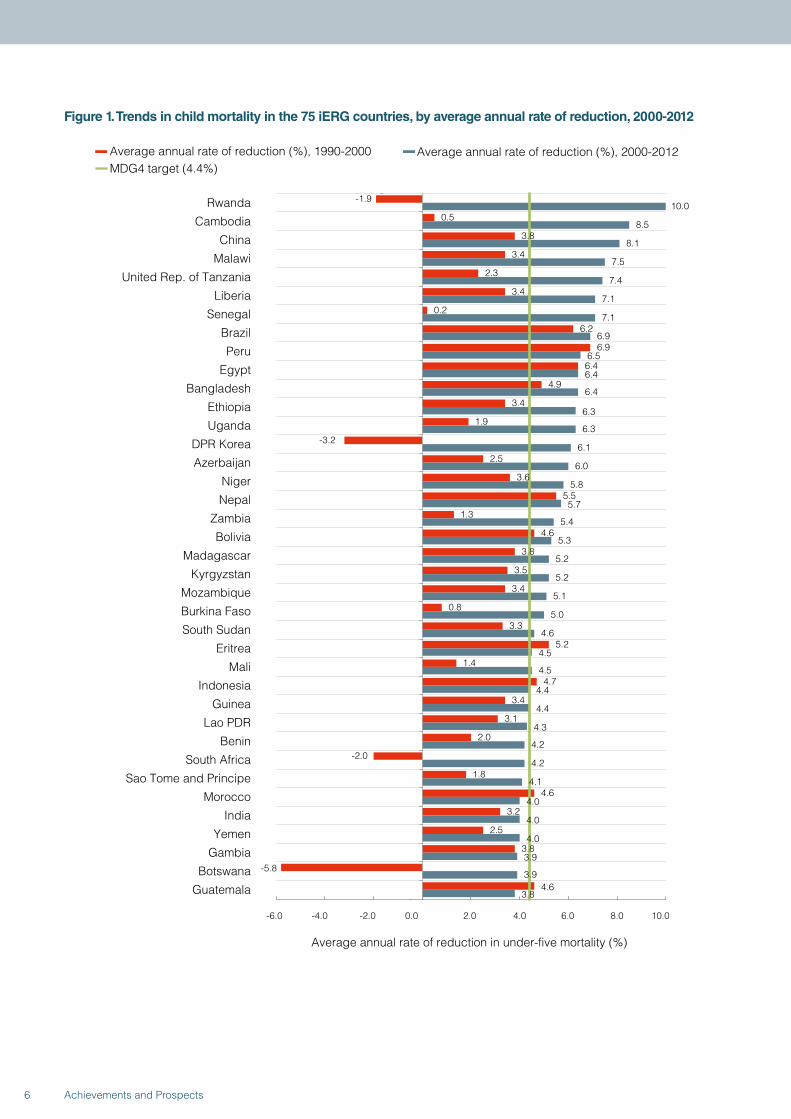
Figure 1. Trends in child mortality in the 75 iERG countries, by average annual rate of reduction, 2000-2012
-1.9
0.5
3.8
3.4
2.3
3.4
0.2
6.2
6.9
6.4
4.9
3.4
1.9
-3.2
2.5
3.6
5.5
1.3
4.6
3.8
3.5
3.4
0.8
3.3
5.2
1.4
4.7
3.4
3.1
2.0
-2.0
1.8
4.6
3.2
2.5
3.8
-5.8
4.6
10.0
8.5
8.1
7.5
7.4
7.1
7.1
6.9
6.5
6.4
6.4
6.3
6.3
6.1
6.0
5.8
5.7
5.4
5.3
5.2
5.2
5.1
5.0
4.6
4.5
4.5
4.4
4.4
4.3
4.2
4.2
4.1
4.0
4.0
4.0
3.9
3.9
3.8
-6.0 -4.0 -2.0 0.0 2.0 4.0 6.0 8.0 10.0
Rwanda
Cambodia
China
Malawi
United Rep. of Tanzania
Liberia
Senegal
Brazil
Peru
Egypt
Bangladesh
Ethiopia
Uganda
DPR Korea
Azerbaijan
Niger
Nepal
Zambia
Bolivia
Madagascar
Kyrgyzstan
Mozambique
Burkina Faso
South Sudan
Eritrea
Mali
Indonesia
Guinea
Lao PDR
Benin
South Africa
Sao Tome and Principe
Morocco
India
Yemen
Gambia
Botswana
Guatemala
Average annual rate of reduction in under-five mortality (%)
Average annual rate of reduction (%), 1990-2000 Average annual rate of reduction (%), 2000-2012MDG4 target (4.4%)
6 Achievements and Prospects
Average annual rate of reduction in under-five mortality (%)
Average annual rate of reduction (%), 1990-2000 Average annual rate of reduction (%), 2000-2012MDG4 target (4.4%)
-1.1
6.0
1.8
1.4
1.2
-1.2
-5.4
3.0
1.4
1.9
2.1
0.9
2.4
3.2
0.7
4.7
2.7
3.7
1.7
0.4
1.0
1.5
2.1
1.7
0.9
2.2
1.6
0.4
1.3
1.0
0.5
-1.7
0.0
0.4
-3.0
-3.2
1.0
3.8
3.7
3.7
3.7
3.5
3.5
3.5
3.4
3.3
3.1
3.0
3.0
2.9
2.7
2.7
2.6
2.6
2.5
2.5
2.5
2.4
2.3
2.2
2.2
2.1
2.0
2.0
2.0
1.9
1.9
1.8
1.7
1.3
1.2
1.1
1.1
0.9
-6.0 -4.0 -2.0 0.0 2.0 4.0 6.0 8.0 10.0
Cameroon
Mexico
Uzbekistan
Tajikistan
Nigeria
Kenya
Swaziland
Myanmar
Turkmenistan
Sudan
Ghana
Burundi
Equatorial Guinea
Haiti
Gabon
Viet Nam
Afghanistan
Philippines
Guinea-Bissau
Côte d'Ivoire
Djibouti
Mauritania
Pakistan
Iraq
Sierra Leone
Comoros
Togo
Central African Republic
Papua New Guinea
Chad
Angola
Congo
DRC
Somalia
Lesotho
Zimbabwe
Solomon Islands
The goal for MDG4 was for countries to achieve a 4.4% average annual rate of reduction (AAR) in child mortality. In most iERG countries, the AAR for child mortality was faster in the years after 2000. However, in 10 countries, the AAR for child mortality was faster during the period from 1990-2000 compared to 2000-2012.
Source: UN Inter-agency Group for Child Mortality Estimation, 2013. Figure adapted from “Fulfilling the Health Agenda for Women and Children: The 2014 Report,” Countdown to 2015.
7Achievements and Prospects
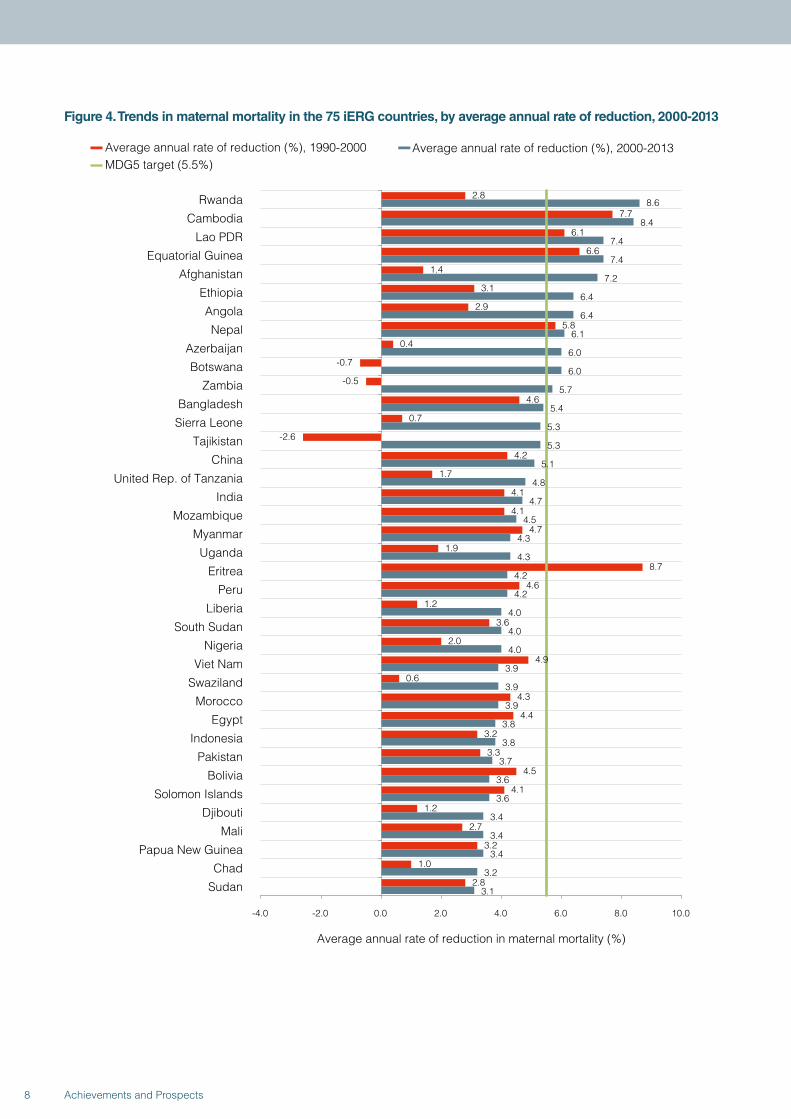
Figure 4. Trends in maternal mortality in the 75 iERG countries, by average annual rate of reduction, 2000-2013
2.8
7.7
6.1
6.6
1.4
3.1
2.9
5.8
0.4
-0.7
-0.5
4.6
0.7
-2.6
4.2
1.7
4.1
4.1
4.7
1.9
8.7
4.6
1.2
3.6
2.0
4.9
0.6
4.3
4.4
3.2
3.3
4.5
4.1
1.2
2.7
3.2
1.0
2.8
8.6
8.4
7.4
7.4
7.2
6.4
6.4
6.1
6.0
6.0
5.7
5.4
5.3
5.3
5.1
4.8
4.7
4.5
4.3
4.3
4.2
4.2
4.0
4.0
4.0
3.9
3.9
3.9
3.8
3.8
3.7
3.6
3.6
3.4
3.4
3.4
3.2
3.1
-4.0 -2.0 0.0 2.0 4.0 6.0 8.0 10.0
Rwanda
Cambodia
Lao PDR
Equatorial Guinea
Afghanistan
Ethiopia
Angola
Nepal
Azerbaijan
Botswana
Zambia
Bangladesh
Sierra Leone
Tajikistan
China
United Rep. of Tanzania
India
Mozambique
Myanmar
Uganda
Eritrea
Peru
Liberia
South Sudan
Nigeria
Viet Nam
Swaziland
Morocco
Egypt
Indonesia
Pakistan
Bolivia
Solomon Islands
Djibouti
Mali
Papua New Guinea
Chad
Sudan
Average annual rate of reduction in maternal mortality (%)
Average annual rate of reduction (%), 1990-2000 Average annual rate of reduction (%), 2000-2013MDG5 target (5.5%)
8 Achievements and Prospects
1.0
2.6
1.1
-0.5
2.8
1.1
1.2
2.8
3.7
-2.7
2.0
-1.6
3.1
-3.8
0.8
0.6
2.6
2.7
1.4
2.1
2.2
1.6
-1.8
3.0
0.2
2.6
2.1
-2.1
1.2
-0.4
3.0
3.3
4.8
-0.2
4.1
-1.2
1.0
3.1
3.1
3.0
3.0
3.0
3.0
2.9
2.9
2.8
2.8
2.7
2.7
2.6
2.6
2.5
2.5
2.5
2.4
2.4
2.4
2.3
2.3
2.2
2.2
2.2
2.2
2.2
2.1
1.9
1.8
1.7
1.7
1.3
0.9
0.4
-0.2
-0.5
-4.0 -2.0 0.0 2.0 4.0 6.0 8.0 10.0
Guinea-Bissau
Mauritania
Senegal
DRC
Ghana
Congo
Guinea
Burkina Faso
Malawi
Zimbabwe
Benin
Kenya
Sao Tome and Principe
DPR Korea
Somalia
Lesotho
Comoros
Mexico
Gabon
Burundi
Yemen
Niger
Kyrgyzstan
Uzbekistan
Central African Republic
Haiti
Gambia
Turkmenistan
Togo
Cameroon
Madagascar
Brazil
Guatemala
South Africa
Iraq
Philippines
Côte d'Ivoire
Average annual rate of reduction in maternal mortality (%)
Average annual rate of reduction (%), 1990-2000 Average annual rate of reduction (%), 2000-2013MDG5 target (5.5%)
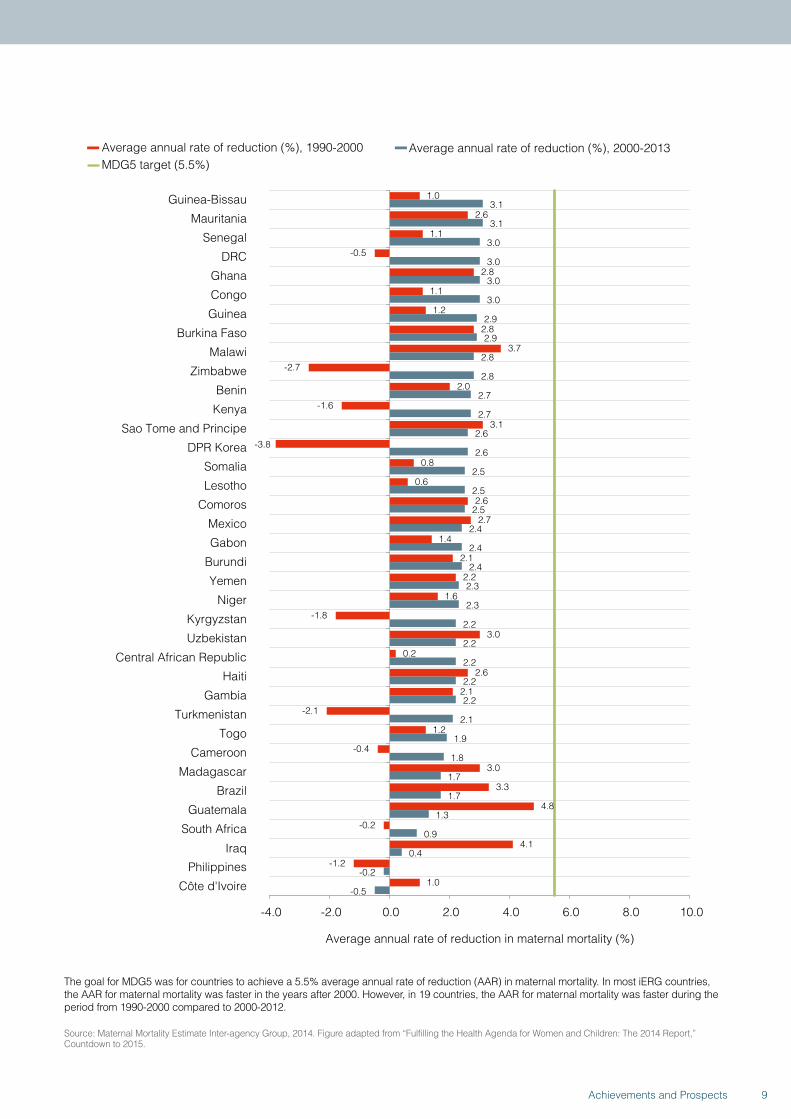
The goal for MDG5 was for countries to achieve a 5.5% average annual rate of reduction (AAR) in maternal mortality. In most iERG countries, the AAR for maternal mortality was faster in the years after 2000. However, in 19 countries, the AAR for maternal mortality was faster during the period from 1990-2000 compared to 2000-2012.
Source: Maternal Mortality Estimate Inter-agency Group, 2014. Figure adapted from “Fulfilling the Health Agenda for Women and Children: The 2014 Report,” Countdown to 2015.
9Achievements and Prospects
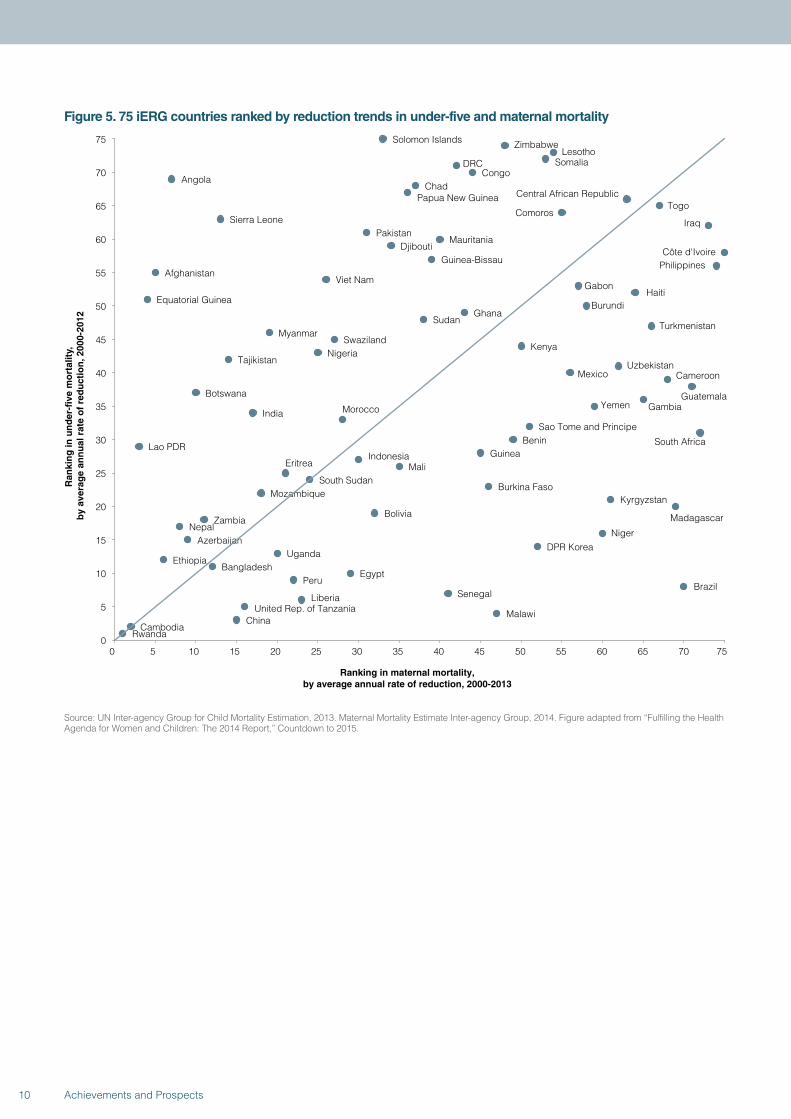
Figure 5. 75 iERG countries ranked by reduction trends in under-five and maternal mortality
RwandaCambodia
ChinaMalawiUnited Rep. of Tanzania
Liberia SenegalBrazil
PeruEgypt
BangladeshEthiopia
UgandaDPR Korea
AzerbaijanNiger
NepalZambia
Bolivia Madagascar
KyrgyzstanMozambique
Burkina FasoSouth Sudan
Eritrea MaliIndonesia Guinea
Lao PDRBenin South Africa
Sao Tome and Principe
MoroccoIndiaYemen Gambia
Botswana Guatemala
CameroonMexicoUzbekistanTajikistan
NigeriaKenya
SwazilandMyanmar
TurkmenistanSudan
GhanaBurundiEquatorial Guinea
HaitiGabon
Viet NamAfghanistan
PhilippinesGuinea-BissauCôte d'IvoireDjibouti
MauritaniaPakistan
IraqSierra LeoneComoros
TogoCentral African RepublicPapua New Guinea
ChadAngola
CongoDRC Somalia
LesothoZimbabweSolomon Islands
0
5
10
15
20
25
30
35
40
45
50
55
60
65
70
75
0 5 10 15 20 25 30 35 40 45 50 55 60 65 70 75
Ran
kin
g in
un
der
-fiv
e m
ort
alit
y,
by
aver
age
ann
ual
rat
e o
f re
du
ctio
n, 2
000-
2012
Ranking in maternal mortality, by average annual rate of reduction, 2000-2013
Source: UN Inter-agency Group for Child Mortality Estimation, 2013. Maternal Mortality Estimate Inter-agency Group, 2014. Figure adapted from “Fulfilling the Health Agenda for Women and Children: The 2014 Report,” Countdown to 2015.
10 Achievements and Prospects
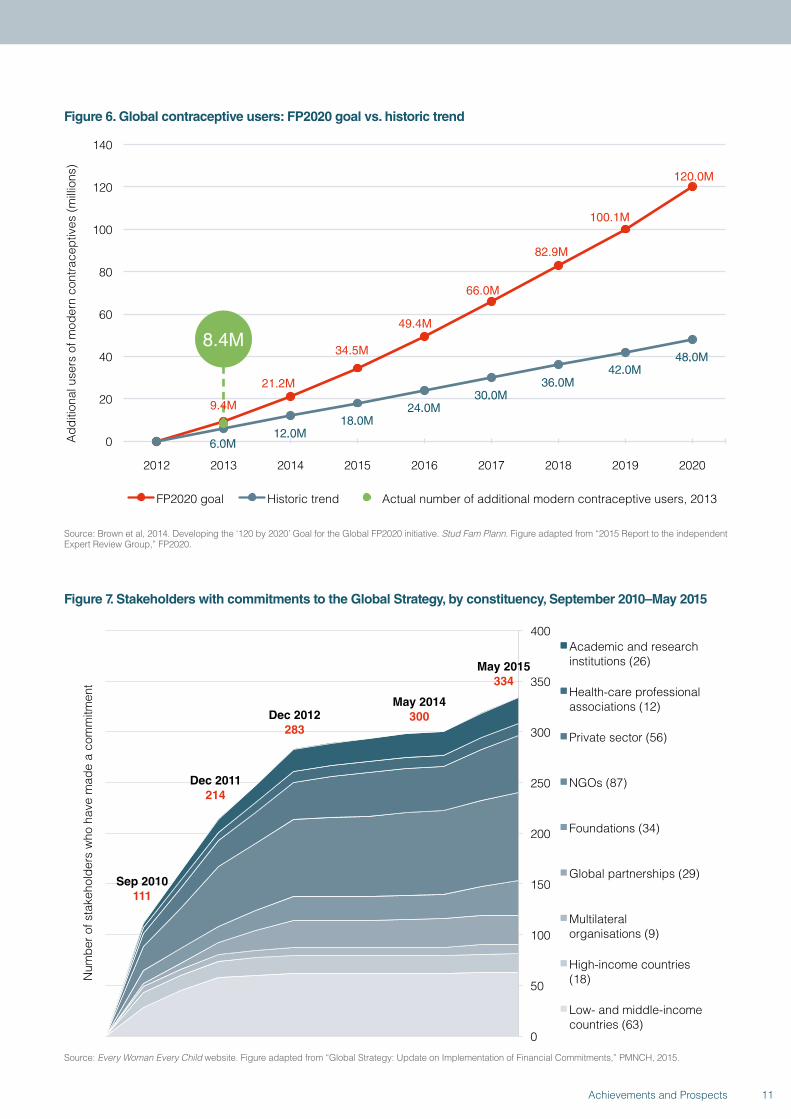
Figure 6. Global contraceptive users: FP2020 goal vs. historic trend
.
6.0M12.0M
18.0M24.0M
30.0M36.0M
42.0M48.0M
0
20
40
60
80
100
120
140
2012 2013 2014 2015 2016 2017 2018 2019 2020
Add
ition
al u
sers
of m
oder
n co
ntra
cept
ives
(mill
ions
)
FP2020 goal Historic trend Actual number of additional modern contraceptive users, 2013
8.4M
9.4M
21.2M
49.4M
34.5M
66.0M
82.9M
120.0M
100.1M
Source: Brown et al, 2014. Developing the ‘120 by 2020’ Goal for the Global FP2020 initiative. Stud Fam Plann. Figure adapted from “2015 Report to the independent Expert Review Group,” FP2020.
Figure 7. Stakeholders with commitments to the Global Strategy, by constituency, September 2010–May 2015
Sep 2010 111
Dec 2011 214
Dec 2012 283
May 2014 300
0
50
100
150
200
250
300
350
400
Num
ber o
f sta
keho
lder
s w
ho h
ave
mad
e a
com
mitm
ent
Academic and research institutions (26)
Health-care professional associations (12)
Private sector (56)
NGOs (87)
Foundations (34)
Global partnerships (29)
Multilateral organisations (9)
High-income countries (18)
Low- and middle-income countries (63)
May 2015 334
Source: Every Woman Every Child website. Figure adapted from “Global Strategy: Update on Implementation of Financial Commitments,” PMNCH, 2015.
11Achievements and Prospects
• Financial commitments to the Global Strategy have reached US$45 billion (once double-counting has been removed); 9 financial commitments have been made since May, 2014.
• As of May, 2015, US$31 billion of the US$45 billion committed has been disbursed (Figures 8 and 9; see main report).
• Annual disbursements for women’s and children’s health have increased substantially since the launch of the Global Strategy: donors disbursed US$11.9 billion for RMNCH in 75 priority countries in 2013, an increase of 25% since 2010; in 2013, RMNCH ODA to these 75 countries grew by 15%, a substantially higher figure than 2011 (0.5%) and 2012 (7.8%) (Figure 10; see main report).
• Previously underfunded areas, such as family planning, have seen steep increases in financial
support—50.5% since the launch of the Global Strategy (from US$452.9 in 2010 to US$681.6 in 2013) (Figure 11; see main report).
• There are persistent geographic inequities in RMNCH funding—DRC and Guinea, for example, continue to receive relatively small amounts of ODA (Figure 12; see main report).
• However, there are signs that for some countries, advocacy around equity may be having an impact—eg, countries with high maternal mortality (such as Sierra Leone, Chad, and Côte d’Ivoire) saw rises in RMNCH support in 2013 after a phase of decline.
• Countries are increasingly demonstrating their commitment to women’s and children’s health—domestic public sector spending on RMNCH increased 115% from 2006 to 2013 for our 75 countries of concern (Figure 13; see main report).
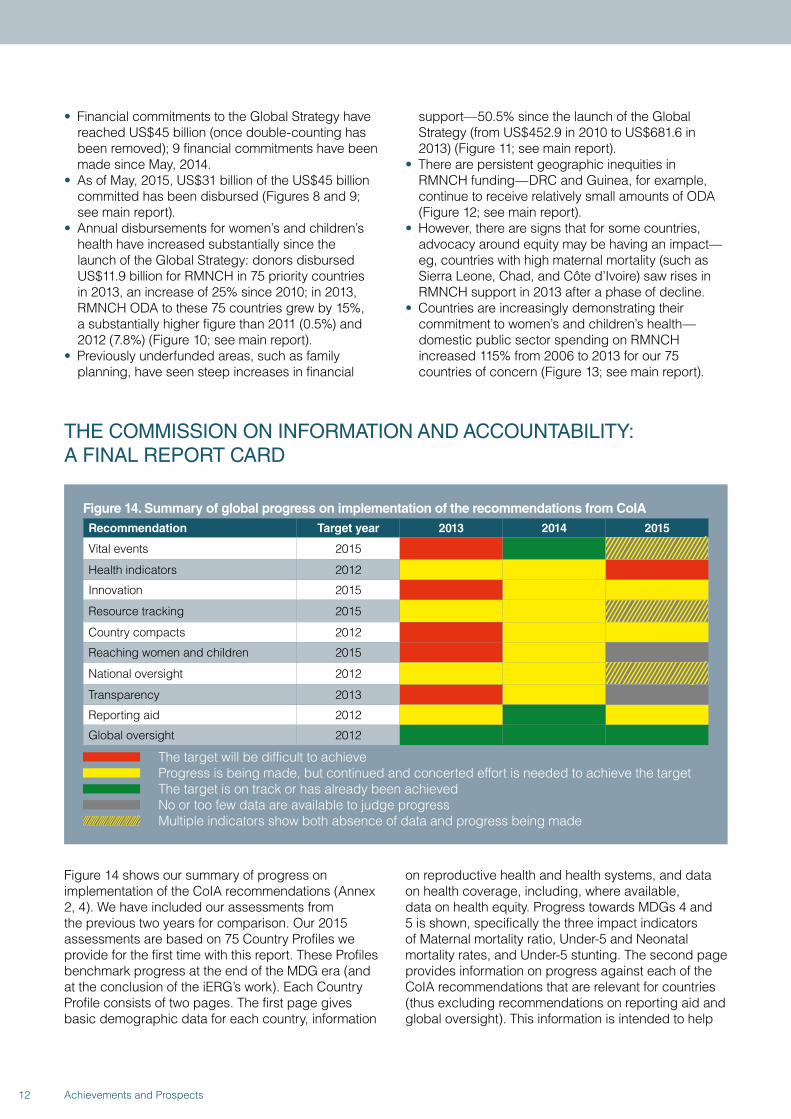
THE COMMISSION ON INFORMATION AND ACCOUNTABILITY: A FINAL REPORT CARD
Figure 14. Summary of global progress on implementation of the recommendations from CoIARecommendation Target year 2013 2014 2015
Vital events 2015
Health indicators 2012
Innovation 2015
Resource tracking 2015
Country compacts 2012
Reaching women and children 2015
National oversight 2012
Transparency 2013
Reporting aid 2012
Global oversight 2012
The target will be difficult to achieve Progress is being made, but continued and concerted effort is needed to achieve the target The target is on track or has already been achieved No or too few data are available to judge progress Multiple indicators show both absence of data and progress being made
Figure 14 shows our summary of progress on implementation of the CoIA recommendations (Annex 2, 4). We have included our assessments from the previous two years for comparison. Our 2015 assessments are based on 75 Country Profiles we provide for the first time with this report. These Profiles benchmark progress at the end of the MDG era (and at the conclusion of the iERG’s work). Each Country Profile consists of two pages. The first page gives basic demographic data for each country, information
on reproductive health and health systems, and data on health coverage, including, where available, data on health equity. Progress towards MDGs 4 and 5 is shown, specifically the three impact indicators of Maternal mortality ratio, Under-5 and Neonatal mortality rates, and Under-5 stunting. The second page provides information on progress against each of the CoIA recommendations that are relevant for countries (thus excluding recommendations on reporting aid and global oversight). This information is intended to help
12 Achievements and Prospects
policymakers and their partners assess progress and prioritise further actions to save women’s and children’s lives. When reading Figure 14, several clarifications and explanations are important.
• We have introduced a new category of descriptor—a grey panel—indicating no or too few data are available to judge progress.
• The introduction of this new category has changed our assessments in 5 CoIA areas—for Reaching Women and Children (percentage of national expenditure used for RMNCH) and for Transparency (a health sector performance report for the preceding year is available in the public domain), we had previously reported that progress was being made. We have now changed that judgement. In both areas, we believe there are insufficient data to draw any reliable conclusions on progress.
• In 3 further categories—Vital Events, Resource Tracking, and National Oversight—we had previously made judgements based on what we believed were available data. However, it is now clearer that in all 3 cases, critical data are missing. Given this partial lack of data, we are marking partial progress with grey colour coding indicating lack of information.
• In 3 categories, based on a fuller appreciation of the available data, we have revised our appraisal downwards compared with 2014—in Vital Events, Health Indicators, and Reporting Aid.
• Overall, we judge that only one CoIA recommendation has been fully delivered—the establishment of the iERG. Progress is being made in 6 CoIA areas. One area demonstrates considerable resistance to progress. And in 5 areas, lack of data is stopping a fuller evaluation.
Leadership globally to implement the CoIA recommendations has fallen especially to the H4+,
a partnership of UN agencies including UNICEF, UNFPA, WHO, the World Bank, UNAIDS, and UN Women. The H4+ leads collectively at the global level, and coordinates technical assistance in countries. Its work is broad, encompassing initiatives such as A Promise Renewed, the Commission on Life-Saving Commodities, the Every Newborn Action Plan, and Every Woman, Every Child. In their submission to the iERG, the H4+ helpfully sets out the obstacles to delivering the aspirations of CoIA. In summary, these obstacles are:
• Coordination: a continuous challenge, especially in countries lacking compacts and health sector reviews.
• Inclusion: of external partner organisations, especially civil society.
• Resource mobilisation: to fund joint work plans.• Monitoring and evaluation: to learn lessons and
document best practices.• Scaling up: to achieve adequate reach and coverage.• Capacity: countries report challenges of being forced
to choose among multiple priorities.• Instability: political shifts and humanitarian crises can
disrupt RMNCH activities.• Human resources: a further capacity challenge,
to implement, provide, and lead RMNCH services.
For the first time, we report the financial and policy commitments of key donors to women’s and children’s health (see page 255). The single page reports total ODA, health, and RMNCH expenditures. It lists major pledges, and reports the latest Aid Transparency Index assessment. The results reported here deserve careful assessment and discussion among all key constituencies involved in women’s and children’s health in order to judge whether partners are living up to their promises.
POST-2015: ACCOUNTABILITY FOR SUSTAINABLE DEVELOPMENTThe place of health in the post-2015 development arena is very different from the place it occupied during the MDG era. Health dominated the MDGs—3 out of 8 goals were health related, based on the notion that poverty was substantially precipitated, driven, and perpetuated by poor health. The poverty-reduction focus of the MDGs put health in pole position in development policy and practice. The era of sustainable development represents a sea change in perspective. The triple helix of sustainable development has economic, social, and environmental strands—health is a part of this framework, but it is not the major part. The SDGs (Panel 1; see main report) cover a far-reaching and daunting range of issues. But, despite this recalibration, the health sector should
not feel disenfranchised. Although health has been decentred from the development conversation, SDG-3 expands the health agenda considerably. In addition to securing the importance of the “unfinished business” of the MDGs—reproductive, maternal, newborn, and child health, together with major infectious diseases—the new health SDG opens up territory on, for example, non-communicable diseases, universal health coverage, the health workforce and financing, and global health risks and security. The universality of the health goal—“Ensure healthy lives and promote wellbeing for all at all ages”—gives a new Global Strategy the best possible opportunity to craft a vision that encompasses a broad range of health and non-health determinants. It makes equity its guiding
13Achievements and Prospects
principle. And it makes health political. Universal Health Coverage cannot be delivered through market mechanisms. It is the responsibility of governments, who must themselves respond to the demand for good quality health services from their electorates. The central importance of the health system for governments means that health becomes a Head of State issue, not simply a subject for the Minister of Health.
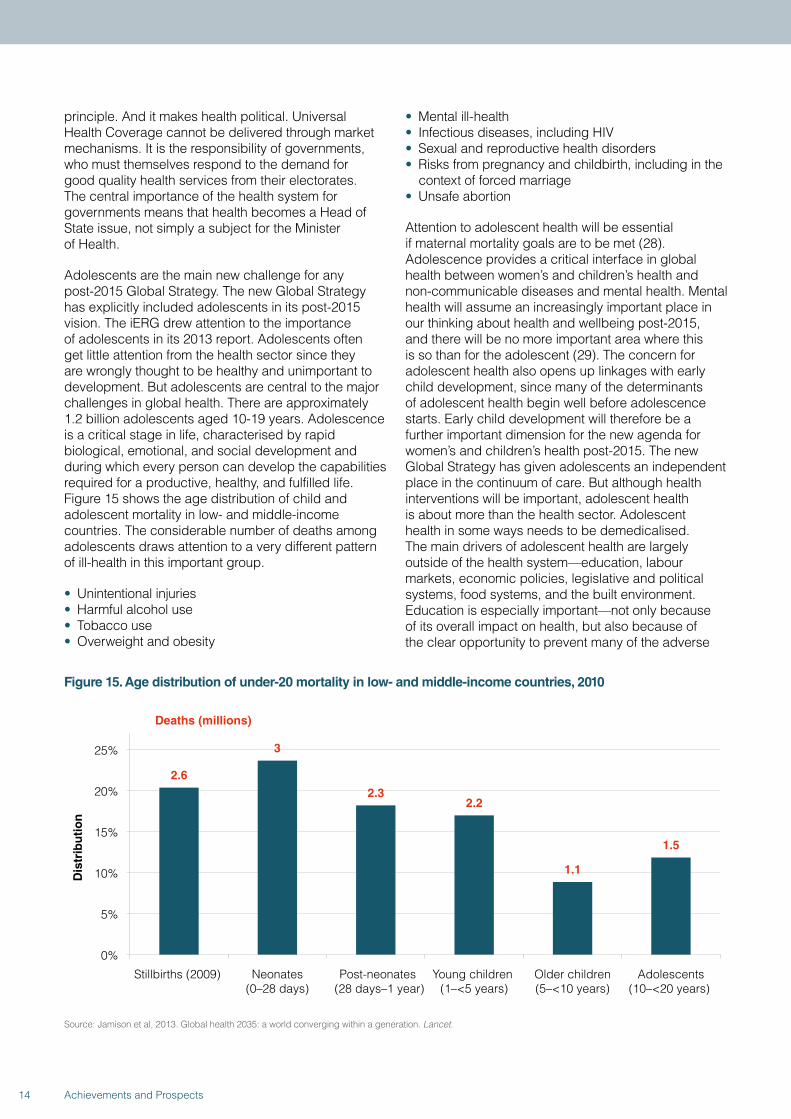
Adolescents are the main new challenge for any post-2015 Global Strategy. The new Global Strategy has explicitly included adolescents in its post-2015 vision. The iERG drew attention to the importance of adolescents in its 2013 report. Adolescents often get little attention from the health sector since they are wrongly thought to be healthy and unimportant to development. But adolescents are central to the major challenges in global health. There are approximately 1.2 billion adolescents aged 10-19 years. Adolescence is a critical stage in life, characterised by rapid biological, emotional, and social development and during which every person can develop the capabilities required for a productive, healthy, and fulfilled life. Figure 15 shows the age distribution of child and adolescent mortality in low- and middle-income countries. The considerable number of deaths among adolescents draws attention to a very different pattern of ill-health in this important group.
• Unintentional injuries• Harmful alcohol use• Tobacco use• Overweight and obesity
• Mental ill-health• Infectious diseases, including HIV• Sexual and reproductive health disorders• Risks from pregnancy and childbirth, including in the
context of forced marriage• Unsafe abortion
Attention to adolescent health will be essential if maternal mortality goals are to be met (28). Adolescence provides a critical interface in global health between women’s and children’s health and non-communicable diseases and mental health. Mental health will assume an increasingly important place in our thinking about health and wellbeing post-2015, and there will be no more important area where this is so than for the adolescent (29). The concern for adolescent health also opens up linkages with early child development, since many of the determinants of adolescent health begin well before adolescence starts. Early child development will therefore be a further important dimension for the new agenda for women’s and children’s health post-2015. The new Global Strategy has given adolescents an independent place in the continuum of care. But although health interventions will be important, adolescent health is about more than the health sector. Adolescent health in some ways needs to be demedicalised. The main drivers of adolescent health are largely outside of the health system—education, labour markets, economic policies, legislative and political systems, food systems, and the built environment. Education is especially important—not only because of its overall impact on health, but also because of the clear opportunity to prevent many of the adverse
Figure 15. Age distribution of under-20 mortality in low- and middle-income countries, 2010
2.6
3
2.3 2.2
1.1
1.5
0%
5%
10%
15%
20%
25%
Stillbirths (2009) Neonates(0–28 days)
Post-neonates (28 days–1 year)
Young children (1–<5 years)
Older children(5–<10 years)
Adolescents(10–<20 years)
Dis
trib
uti
on
Deaths (millions)
Source: Jamison et al, 2013. Global health 2035: a world converging within a generation. Lancet.
14 Achievements and Prospects
effects related to reproductive health through comprehensive sexuality education, about which there is new momentum with countries committing to making it universally accessible. How the SDGs and a new Global Strategy engage with these broader sectors will be one of the greatest challenges for the health community post-2015. We see hopeful signs. The World Bank has prioritised gender equality as a means to reduce poverty and promote prosperity. The Bank sees gender equality as a core development objective in its own right. But there are clouds to consider too. We note concerns that sexual and reproductive health and rights may be deprioritised in the new Global Strategy. We therefore urge those charged with implementing the Global Strategy to make sexual and reproductive health a priority for women and adolescents post-2015.
A further issue that has been even more neglected than adolescent health is stillbirths. A stillbirth is strictly a pregnancy loss after 22 weeks of gestation. The WHO definition is different—WHO defines a stillbirth as the death of a child whose birthweight is at least 1000g or whose gestational age is at least 28 weeks (a third-trimester stillbirth). Little or no funding is dedicated to stillbirth prevention. Yet 2.6 million women each year experience a stillbirth. Most babies who die in the last 3 months of pregnancy should have survived. 1.2 million babies begin labour alive and die before birth—an intrapartum stillbirth. These intrapartum stillbirths are a highly sensitive marker of the quality of care in a health system. The causes of stillbirth are known and they can be mostly addressed through good quality care. It is an entirely reasonable goal to make 2030 the deadline for preventing stillbirths in all settings. Yet stillbirths have remained uncounted in global frameworks for women’s and children’s health. No longer. A new series of papers to be published in The Lancet in 2015 will try to ignite the concern of the global community into this deeply neglected area. New estimates of stillbirth deaths will be reported, together with risk factors and the economic costs of stillbirth. Evidence of what works to prevent stillbirths will be reviewed, and an implementation plan will be designed. The goal will be to offer a roadmap for addressing stillbirths, one that will make a major impact by 2030, the deadline for the SDGs.
There is no single perfect model of global accountability. In our 2014 report, we set out 12 principles for accountability rather than endorse a single approach—legitimacy, independence, framework, terms of reference, reliable data, parsimony, country engagement, review mechanisms, participation, regular reporting, resourcing, and monitoring impact. These principles still seem to us to have merit. For example, although a Progress
Report on the Global Strategy was published in 2015, that report was not independently researched and written, thus weakening its force as a document measuring the impact of Every Woman, Every Child. WHO recognises the importance of independence. In its evidence to the iERG, WHO notes that,
“Independent accountability remains essential for the post-2015 period: There is multi-stakeholder consensus on the need for independent accountability for women’s and children’s health post-2015, and this is a priority in the development of the new Global Strategy for Women’s, Children’s, and Adolescents’ Health.”
The model for independent global accountability should include the following key elements:
• A framework definition of independent accountability: Monitoring, Review, Act
• Legitimacy established through a UN agency governing body or related political process
• Full administrative and technical resourcing • Clear roles and responsibilities for reporting among,
and working with, partners• Indicators that measure impact and that are sensitive
to change, disaggregated for equity considerations and aligned with related global processes (eg, SDGs)
• Emphasis on donor as well as country accountability • Attention to implementation of the findings
and recommendations from the independent accountability mechanism
• Host the administration of the independent accountability mechanism within an existing entity engaged in delivering the Global Strategy, but ensure the independence of the accountability research and writing process
• Establish a reporting line between the independent accountability mechanism and the UN Secretary-General, through the Director-General of WHO
• Ensure that accountability reports and recommendations are presented in high-level fora with sufficient time and engagement to allow debate and discussion
• Link global and national accountability mechanisms
The iERG’s proposal for independent accountability for a renewed Global Strategy is reproduced in Annex 6. All parties in the discussion recognise and accept the importance of an Independent Advisory Panel to replace the iERG. The disagreement relates to who has primary responsibility for producing the independent assessment of the Global Strategy’s progress—should it be, for example, the Independent Advisory Panel itself, with technical and administrative support from PMNCH or should it be PMNCH, with advisory input from the Independent Advisory Panel. We prefer the first option: we see a critically important role for PMNCH, but we see their comparative advantage as one of technical
15Achievements and Prospects
and logistical support, an important gap in the current accountability arrangements of which the iERG is a part.
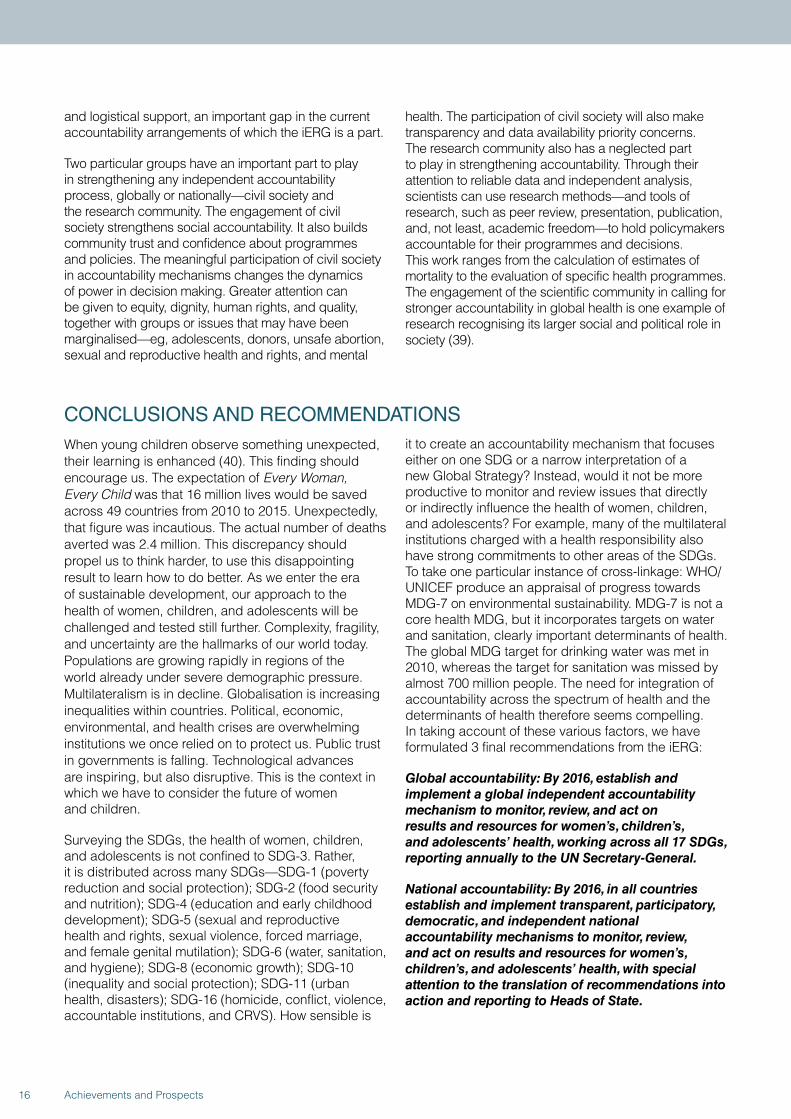
Two particular groups have an important part to play in strengthening any independent accountability process, globally or nationally—civil society and the research community. The engagement of civil society strengthens social accountability. It also builds community trust and confidence about programmes and policies. The meaningful participation of civil society in accountability mechanisms changes the dynamics of power in decision making. Greater attention can be given to equity, dignity, human rights, and quality, together with groups or issues that may have been marginalised—eg, adolescents, donors, unsafe abortion, sexual and reproductive health and rights, and mental
health. The participation of civil society will also make transparency and data availability priority concerns. The research community also has a neglected part to play in strengthening accountability. Through their attention to reliable data and independent analysis, scientists can use research methods—and tools of research, such as peer review, presentation, publication, and, not least, academic freedom—to hold policymakers accountable for their programmes and decisions. This work ranges from the calculation of estimates of mortality to the evaluation of specific health programmes. The engagement of the scientific community in calling for stronger accountability in global health is one example of research recognising its larger social and political role in society (39).
CONCLUSIONS AND RECOMMENDATIONSWhen young children observe something unexpected, their learning is enhanced (40). This finding should encourage us. The expectation of Every Woman, Every Child was that 16 million lives would be saved across 49 countries from 2010 to 2015. Unexpectedly, that figure was incautious. The actual number of deaths averted was 2.4 million. This discrepancy should propel us to think harder, to use this disappointing result to learn how to do better. As we enter the era of sustainable development, our approach to the health of women, children, and adolescents will be challenged and tested still further. Complexity, fragility, and uncertainty are the hallmarks of our world today. Populations are growing rapidly in regions of the world already under severe demographic pressure. Multilateralism is in decline. Globalisation is increasing inequalities within countries. Political, economic, environmental, and health crises are overwhelming institutions we once relied on to protect us. Public trust in governments is falling. Technological advances are inspiring, but also disruptive. This is the context in which we have to consider the future of women and children.
Surveying the SDGs, the health of women, children, and adolescents is not confined to SDG-3. Rather, it is distributed across many SDGs—SDG-1 (poverty reduction and social protection); SDG-2 (food security and nutrition); SDG-4 (education and early childhood development); SDG-5 (sexual and reproductive health and rights, sexual violence, forced marriage, and female genital mutilation); SDG-6 (water, sanitation, and hygiene); SDG-8 (economic growth); SDG-10 (inequality and social protection); SDG-11 (urban health, disasters); SDG-16 (homicide, conflict, violence, accountable institutions, and CRVS). How sensible is
it to create an accountability mechanism that focuses either on one SDG or a narrow interpretation of a new Global Strategy? Instead, would it not be more productive to monitor and review issues that directly or indirectly influence the health of women, children, and adolescents? For example, many of the multilateral institutions charged with a health responsibility also have strong commitments to other areas of the SDGs. To take one particular instance of cross-linkage: WHO/UNICEF produce an appraisal of progress towards MDG-7 on environmental sustainability. MDG-7 is not a core health MDG, but it incorporates targets on water and sanitation, clearly important determinants of health. The global MDG target for drinking water was met in 2010, whereas the target for sanitation was missed by almost 700 million people. The need for integration of accountability across the spectrum of health and the determinants of health therefore seems compelling. In taking account of these various factors, we have formulated 3 final recommendations from the iERG:
Global accountability: By 2016, establish and implement a global independent accountability mechanism to monitor, review, and act on results and resources for women’s, children’s, and adolescents’ health, working across all 17 SDGs, reporting annually to the UN Secretary-General.
National accountability: By 2016, in all countries establish and implement transparent, participatory, democratic, and independent national accountability mechanisms to monitor, review, and act on results and resources for women’s, children’s, and adolescents’ health, with special attention to the translation of recommendations into action and reporting to Heads of State.
16 Achievements and Prospects
Accountability for sustainability: In 2017, convene a global ministerial summit to report on progress towards the goals both of the new Global Strategy for Women’s, Children’s, and Adolescents’ Health and the SDGs relevant to women, children, and adolescents; and to report on how national accountability informs and strengthens global accountability.
We believe that implementation of these recommendations could do much to create the conditions for one of the most remarkable successes global health is likely to see during the SDG era. The global community is developing ambitious targets for reduction in child and maternal mortality for the SDG period. Different studies and different agencies have put forward different goals, but all are ambitious. As we discuss in the main report, one goal is a two-thirds reduction in both maternal and child mortality rates over the 20-year period 2010-30 (24). The iERG commissioned the same team that derived the “40 by 30” target to project how many deaths would be averted globally, relative to a 2015 baseline, if the goals from their Lancet paper were to be met. Applying the methodology of that paper, but adjusting the base year to 2015, 34 million child deaths and about 1.5 million maternal deaths would be averted globally in the SDG period. These numbers assume that the world will meet its ambitious goals. The iERG believes that this striking outcome is both technically and financially feasible for the world to meet. But the question remains as to whether it is politically feasible too. See Panel 9 for a fuller description of these estimations.
In concluding our work, we ourselves need to be accountable to the Every Woman, Every Child movement, and most importantly, to the women, children, and adolescents who are the subject of our concern. Two questions demand answers:
Since the launch of the work of the Commission on Information and Accountability and iERG, do countries and partners have better information to track results and resources?
Do those countries and partners have stronger and more sustainable systems of accountability, nationally and globally?
On the first question, we believe we have shown (Figure 14) that progress has been achieved in several critical areas—notably, acceleration of CRVS strengthening, innovation, agreement of country compacts, and awareness and advocacy for global and national accountability. In other areas, there are simply too little data to make confident judgements either way (on resource tracking,
reaching women and children, and transparency). And in a few domains, we have been disappointed by lack of progress—eg, on the uptake and use of indicators to monitor change, and on the energy and commitment given to addressing inequalities (41). But on the second question, we are even more cautious. Globally, the iERG concludes its work in 2015. Although accountability is much discussed and partners seem committed to the principles of accountability, the precise arrangements for creating a sustainable mechanism to deliver independent global accountability for women’s, children’s, and adolescents’ health are unclear. We are concerned that the gains made in establishing independent accountability as a central part of the Global Strategy and SDG process post-2015 are at risk. In countries, although there has been considerable discussion of, and advocacy for, accountability, the evidence that resilient processes for monitoring, reviewing, and acting are in place is not available. There are documented examples of successful country accountability mechanisms (42). We believe that countries have an extraordinary opportunity to make accountability the foundation for their accelerating development.
As we complete our term of office, we have looked back over the past 4 years to reflect on the lessons learned from the idea and practice of independent accountability.
• Independent accountability can be done and delivered, despite often challenging limitations of information and resources.
• Although global accountability was strengthened with the advent of an iERG, the connection with country accountability was weak. Indeed, our country level activity was the least developed part of our work. The country visits we undertook in 2014 were an important step in the right direction, one that we hope will be repeated and developed in future years. These visits allowed much more comprehensive national assessments of progress. But country visits by the iERG cannot substitute for strengthened national capacities for independent accountability. Such country accountability systems should be more formally linked to whatever global mechanism is put in place.
• The independent accountability mechanism needs to be supported in developing stronger relationships with country development partners. One possible solution is to designate a national accountability representative within each country WHO team whose responsibility is to survey and shepherd progress on CoIA recommendations.
• Accountability must be accompanied by tangible actions and remedies at global and national levels for its full value to be realised. The link between the
17Achievements and Prospects
sensory inputs of independent accountability and the effector outputs of action must be strengthened.
• Between its global and country concerns, independent accountability can also operate regionally. It would have been helpful if the iERG had been able to take fuller advantage of regional health institutions (eg, with the Regional Offices of WHO).
• The iERG was constantly aware of the value of the independence it was granted by CoIA. That independence is partly guaranteed from the broad array and diversity of its members in age, professional background, philosophy, expertise, and geography. The complementarities of backgrounds and skills within the iERG membership were a major advantage to its work. The independence we were given enabled us to commission reports and case studies to illustrate critical points of concern.
• We learned that to make the most of the evidence we received, we should not only measure and report on progress in our monitoring role, but also develop policy proposals for action and remedy.
• We were repeatedly made aware that for our recommendations to have maximum impact, our reports had to be channelled to the highest reaches of global decision-making. Although we sought more formal presentation and discussion of our annual reports at key global meetings, we were disappointed with the progress we made in this regard.
• The hosting, resourcing, and autonomy of the mechanism for independent accountability are critical to its success. The secretariat function of the iERG is a vital part of its work. We believe that the technical capacity of this secretariat should be strengthened in future iterations of independent accountability.
18 Achievements and Prospects
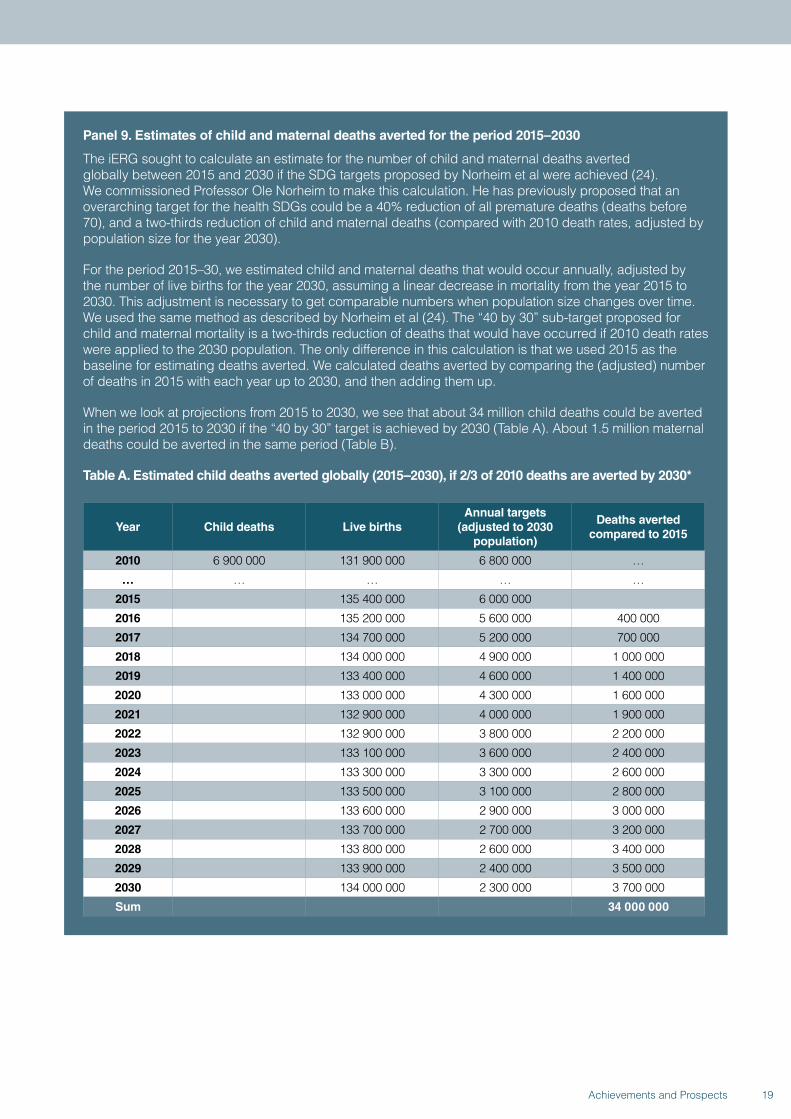
Panel 9. Estimates of child and maternal deaths averted for the period 2015–2030
The iERG sought to calculate an estimate for the number of child and maternal deaths averted globally between 2015 and 2030 if the SDG targets proposed by Norheim et al were achieved (24). We commissioned Professor Ole Norheim to make this calculation. He has previously proposed that an overarching target for the health SDGs could be a 40% reduction of all premature deaths (deaths before 70), and a two-thirds reduction of child and maternal deaths (compared with 2010 death rates, adjusted by population size for the year 2030).
For the period 2015–30, we estimated child and maternal deaths that would occur annually, adjusted by the number of live births for the year 2030, assuming a linear decrease in mortality from the year 2015 to 2030. This adjustment is necessary to get comparable numbers when population size changes over time. We used the same method as described by Norheim et al (24). The “40 by 30” sub-target proposed for child and maternal mortality is a two-thirds reduction of deaths that would have occurred if 2010 death rates were applied to the 2030 population. The only difference in this calculation is that we used 2015 as the baseline for estimating deaths averted. We calculated deaths averted by comparing the (adjusted) number of deaths in 2015 with each year up to 2030, and then adding them up.
When we look at projections from 2015 to 2030, we see that about 34 million child deaths could be averted in the period 2015 to 2030 if the “40 by 30” target is achieved by 2030 (Table A). About 1.5 million maternal deaths could be averted in the same period (Table B).
Table A. Estimated child deaths averted globally (2015–2030), if 2/3 of 2010 deaths are averted by 2030*
Year Child deaths Live birthsAnnual targets
(adjusted to 2030 population)
Deaths averted compared to 2015
2010 6 900 000 131 900 000 6 800 000 …
… … … … …
2015 135 400 000 6 000 000
2016 135 200 000 5 600 000 400 000
2017 134 700 000 5 200 000 700 000
2018 134 000 000 4 900 000 1 000 000
2019 133 400 000 4 600 000 1 400 000
2020 133 000 000 4 300 000 1 600 000
2021 132 900 000 4 000 000 1 900 000
2022 132 900 000 3 800 000 2 200 000
2023 133 100 000 3 600 000 2 400 000
2024 133 300 000 3 300 000 2 600 000
2025 133 500 000 3 100 000 2 800 000
2026 133 600 000 2 900 000 3 000 000
2027 133 700 000 2 700 000 3 200 000
2028 133 800 000 2 600 000 3 400 000
2029 133 900 000 2 400 000 3 500 000
2030 134 000 000 2 300 000 3 700 000
Sum 34 000 000
19Achievements and Prospects
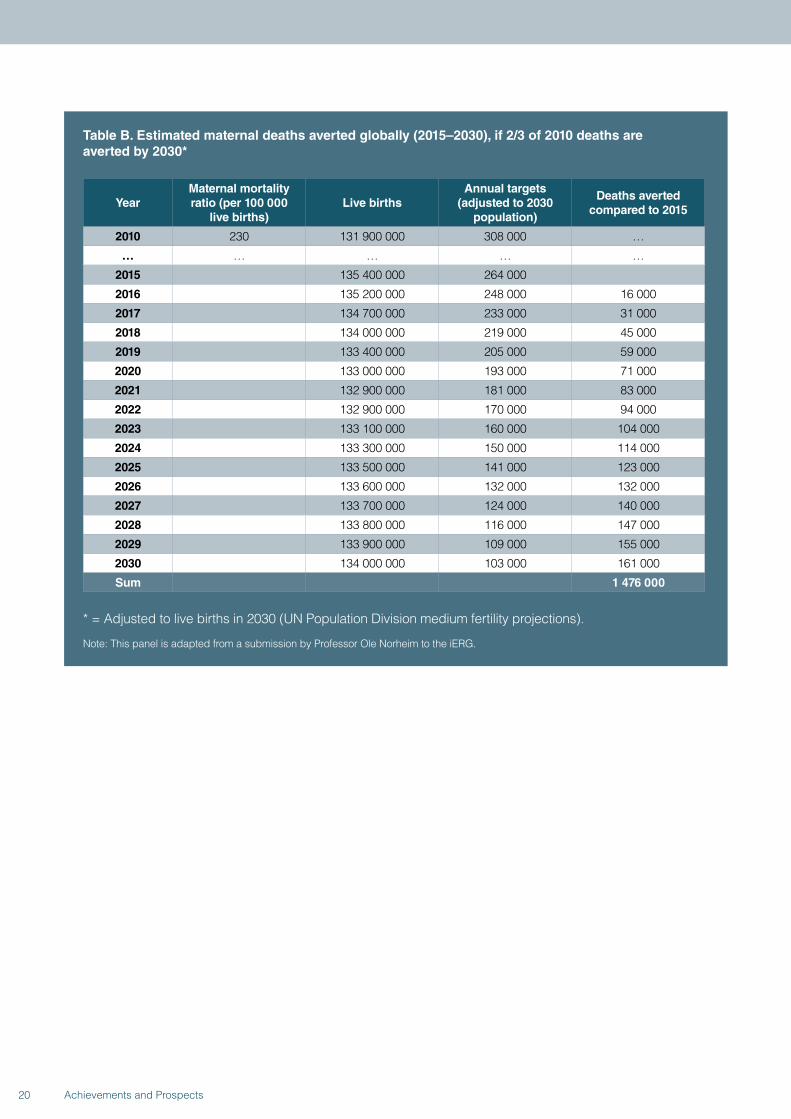
Table B. Estimated maternal deaths averted globally (2015–2030), if 2/3 of 2010 deaths are averted by 2030*
YearMaternal mortality ratio (per 100 000
live births)Live births
Annual targets(adjusted to 2030
population)
Deaths averted compared to 2015
2010 230 131 900 000 308 000 …
… … … … …
2015 135 400 000 264 000
2016 135 200 000 248 000 16 000
2017 134 700 000 233 000 31 000
2018 134 000 000 219 000 45 000
2019 133 400 000 205 000 59 000
2020 133 000 000 193 000 71 000
2021 132 900 000 181 000 83 000
2022 132 900 000 170 000 94 000
2023 133 100 000 160 000 104 000
2024 133 300 000 150 000 114 000
2025 133 500 000 141 000 123 000
2026 133 600 000 132 000 132 000
2027 133 700 000 124 000 140 000
2028 133 800 000 116 000 147 000
2029 133 900 000 109 000 155 000
2030 134 000 000 103 000 161 000
Sum 1 476 000
* = Adjusted to live births in 2030 (UN Population Division medium fertility projections).
Note: This panel is adapted from a submission by Professor Ole Norheim to the iERG.
20 Achievements and Prospects
1. INTRODUCTION
Fatima died this afternoon. She was 25 years old and about to give birth to her first child. She was brought to the hospital in the early hours of the morning. At home, she had suffered several seizures and did not regain consciousness. When she came to the hospital, only three midwives and one junior doctor were present for the night shift, looking after about 30 patients in the maternity ward. Many women shared their beds with one, or even two, other women. Fatima was seen by one of the health workers and diagnosed with eclampsia. It was also noticed that her baby was dead. She was put on the “eclampsia protocol.” Hours went by without her being checked again, in the very busy ward. She fell unconscious, alone, with no way to make it known to those around her that she needed their attention and help. When she was discovered by another junior doctor around midday, she was bleeding profusely and underwent an emergency Caesarean section. She was not yet ready to deliver vaginally but the bleeding was too serious to wait. The bleeding stopped after surgery but Fatima did not wake up. She showed signs of a cerebral bleed, but no bed was available in the Intensive Care Unit. She passed away in the late afternoon. That evening, the family arrived to collect her body and that of her baby. They paid for the suture materials and did not ask questions.
Following high school, Magutsa was trained as an Assistant Officer in Human Resources Management. She got a job in Nairobi where her fiancé, Amuchuku, worked and soon after, they were married. By 2009, Magutsa and Amuchuku were the happy parents of two children—a son, Amos, aged 5, and a daughter, Elima, aged 3. Magutsa kept up with the children’s immunisation schedule and all the advice she received at the clinic. When the children got colds and coughs, she was assured that these symptoms were nothing to worry about unless they continued for a long time. Sure enough, the episodes would soon pass. Unlike the villages in which they had grown up, where malaria was endemic, there was no malaria in Nairobi, and this made them happy. Whenever the family went to the village, they bought anti-malarials from the clinic. Magutsa and Amuchuku believed their children would grow into healthy adults. Then came the sudden death of Amuchuku’s father. With their children, they hurriedly took the bus to the upcountry village, where they would stay for two weeks. On the way, Magutsa realised that she had not bought anti-malarials from the clinic. They agreed to buy them in the town nearest their home. But upon reaching their village, the usual desperation and grief that comes with death took over. They were not reminded of the medicine until Elima’s body began burning on the seventh night after their arrival. Soon, Amos too had a temperature. By dawn of the next day, heavy rain had begun and no vehicles entered the road where Amuchuku and Magutsa
waited. Not even bicycles or motorcycles dared to pass. They considered walking to the hospital in town, twenty miles away, but knew that they were unlikely to make it. They would have to try again tomorrow. But by the next morning, Elima was dead. Amuchuku and Magutsa could hardly breathe. How could life go on without Elima? What would they do with her belongings? What would they say to her play group? What were they going to do with Amos, whose distress seemed even greater than their own? They thought they were all going to die, as preparations were made to bury Elima next to her grandfather. What if there had been a community health worker in their village with anti-malarial supplies? What if they had left the children in Nairobi with the house help? What if...what if? They had gone to their village with two children. If they were lucky, they would be going back with one. What was life about if you could lose your children like this?
In Luque, Paraguay, a 10-year-old girl shared a rented room with her two siblings, her mother, and her stepfather. When she began to complain of stomach aches and swelling, her mother brought her to the local hospital, fearing she may have a tumour. In fact, the child was 21 weeks pregnant, after repeated sexual abuse at the hands of her stepfather. Over a year earlier, her mother had reported the suspected abuse to authorities, who failed to take any action. Now, when her mother appealed to the hospital to allow her to have an abortion, the request was denied. Instead, her mother spent weeks in jail, accused of complicity in the abuse, while the 10-year-old girl lived in a shelter. In Paraguay, a country with strong Catholic influences, abortions are allowed only when the life of the pregnant woman is at risk. Medical experts from around the world, including the World Health Organization, have presented evidence that pregnancy at her age is four times more life-threatening than an adult pregnancy, with risk of haemorrhage, anemia, eclampsia, and damage to her reproductive system. Moreover, the repercussions to her mental health, as she carries out an unwanted pregnancy, have been called “tantamount to torture.” And still, Paraguayan Health Minister Antonio Barrios claims that the 34 kg child faces no risk to her health, and the ministry has “already completely ruled out abortion.” The anonymous young girl was violated by her stepfather, ignored by authorities in a position to intervene, and finally abandoned to carry out the sentence that her abuse invoked. Her voice has been repeatedly omitted and both health and dignity overlooked, as she falls victim to the political and religious frictions plaguing her country. In the absence of government protection, civil society has responded on the young girl’s behalf, with petitions and marches that have prompted a national debate. Can civil society give
22 Achievements and Prospects
voice to those forsaken by their protectors, if not for this child, then for the millions like her worldwide? Soon after her 11th birthday, she will give birth to her first child. Still, we cannot hear her.
At the beginning of December, 2013, Emile Ouamouno was a happy little 2-year-old boy, born to his mother Sia and father Etienne. They lived in the forest village of Meliandou, near Guinea’s borders with Sierra Leone and Liberia. Though they lived two hours away from the nearest hospital, there was a clinic in the village, and Emile’s parents worked hard to get him and his sister immunised, as well as access to insecticide-treated nets where and when possible. Emile was not allowed to play in the forest. He and his three-year-old sister loved listening to the radio, dancing and playing near their house under a large tree, which was a roosting place to hundreds of free-tail fruit bats. His mother was eight months pregnant with their next sibling, and his parents planned to have the baby delivered by the midwife at the local clinic. Sometimes women could not make it to the health facility, and a traditional birth attendant stepped in. On December 2, 2013, Emile developed a very high fever and vomiting; his parents suspected malaria. He had bad bloody diarrhoea, which they had never seen before, and his grandmother, Koumba Ouamouno, could not explain it. Within four days, Emile died. Three-year-old Philomena was next to fall ill. Both Sia and Koumba nursed her, treating her with the normal malaria medicine from the clinic. Their efforts failed, and before the New Year, Emile’s sister was dead. Both Sia and Koumba, mother and grandmother, followed the traditional funeral rites, just as they had with Emile, washing her small body carefully and kissing her farewell. When Sia became sick, the midwife got involved, but on the January 11, 2014, both Sia and her unborn baby died. Etienne was grief-stricken. Barely six weeks earlier, he had been an expectant father with a happy wife and two young children. Now he was a childless widower. The pain when he lost his mother to the same affliction left him numb. News later reached him that the midwife had also died. Meliandou was ground zero for the first Ebola (Zaire) virus disease outbreak in West Africa, and his precious Emile was patient zero. It was too late for his family to be rescued from the nightmare.
March 1992: a busy late morning in the postnatal ward of one of the largest maternity clinics in Africa. Women were talking, laughing, and packing to go home with their newborn babies, wrapped in colourful khangas. Over ninety women had given birth in the past 24 hours, and two mothers were still in intensive care. Six babies had died: three were very preterm births, one had a congenital birth defect, and two were stillbirths. Many mothers had already left the facility.
A few were waiting for their husbands or families to pay the hospital bills and take them home. One young woman was sitting alone in a corner, without a baby, crying silently while she covered her face and turned away from the crowd around her. She had given birth to a stillborn male baby, term, birthweight 3.1 kg. She was a G5P3A2—gravida 5, para 3, abortion 2. In plain language, this was her fifth pregnancy—she had delivered 3 times and had 2 miscarriages, but the 3 term deliveries had all ended in stillborn babies. One of the midwives explained that the young lady was waiting for her husband, but she was afraid he would not show up because of the third stillbirth. A second nurse joined with a prescription and told the patient that she should leave now and buy some iron tablets. The youngest nurse asked her colleague: “Why is she crying? She did not even know this baby. How can you cry for a person you don’t know?” “Indeed, no idea,” said the midwife, glancing at the medical file. “But she has no children alive yet; they all died and the husband might send her back to her family. What can he do with a woman who does not deliver?” “Oh, in that case I understand her grief,” said the first nurse, and both of them now looked at her with compassion. All too often, dead babies are not counted and do not count.
After years of talking, teaching, praising, criticising, and learning, a clinic in Zanzibar still finds each day that women have been delayed in labour for 6, 8, 10, or more hours. This is true for women with both low and high risks of complications in childbirth, including the risk of rupturing the uterus with an almost certain death of the baby and a high risk of losing the uterus or even the mother’s own life. Why does this distressing situation resist change? The young intern doctors who report these delays each and every day gave their answer in four points, which resonated with everyone the department. These points reflect all there is to say at the global level too. The only difference between the experiences in the clinic and the discussions that take place globally is that the mothers who enter the clinic have faces and stories, their suffering unbearable when they stand before you. The four points put forward by the interns were: we need more health workers; we need more consumables; we need to communicate much better; and we need accountability.
In Afghanistan, it became clear that a war against the Taliban, like any war, could not be won with weapons alone. It was important to win the trust of the people, to win their hearts and minds. Thus the military, diplomats, and development workers began a dialogue with the people—for example, in Uruzgan province—to find out their most pressing needs. It was immediately obvious that there was an urgent
23Achievements and Prospects
1. Introduction
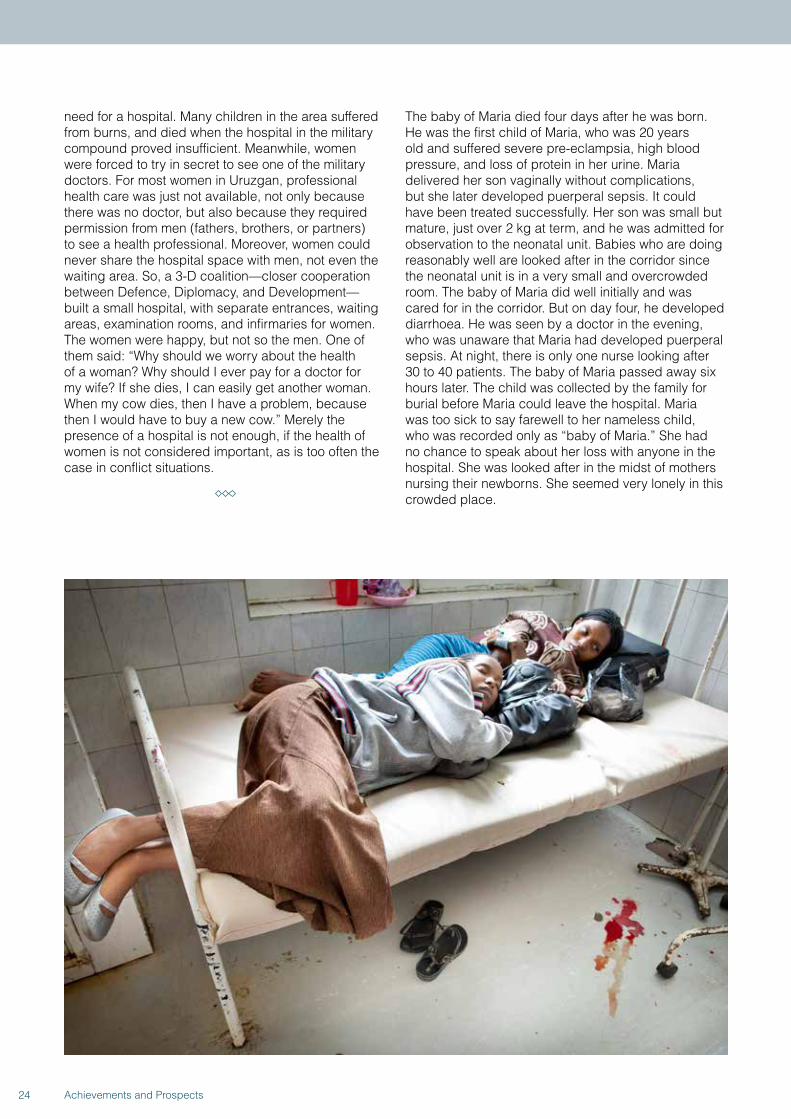
need for a hospital. Many children in the area suffered from burns, and died when the hospital in the military compound proved insufficient. Meanwhile, women were forced to try in secret to see one of the military doctors. For most women in Uruzgan, professional health care was just not available, not only because there was no doctor, but also because they required permission from men (fathers, brothers, or partners) to see a health professional. Moreover, women could never share the hospital space with men, not even the waiting area. So, a 3-D coalition—closer cooperation between Defence, Diplomacy, and Development—built a small hospital, with separate entrances, waiting areas, examination rooms, and infirmaries for women. The women were happy, but not so the men. One of them said: “Why should we worry about the health of a woman? Why should I ever pay for a doctor for my wife? If she dies, I can easily get another woman. When my cow dies, then I have a problem, because then I would have to buy a new cow.” Merely the presence of a hospital is not enough, if the health of women is not considered important, as is too often the case in conflict situations.
The baby of Maria died four days after he was born. He was the first child of Maria, who was 20 years old and suffered severe pre-eclampsia, high blood pressure, and loss of protein in her urine. Maria delivered her son vaginally without complications, but she later developed puerperal sepsis. It could have been treated successfully. Her son was small but mature, just over 2 kg at term, and he was admitted for observation to the neonatal unit. Babies who are doing reasonably well are looked after in the corridor since the neonatal unit is in a very small and overcrowded room. The baby of Maria did well initially and was cared for in the corridor. But on day four, he developed diarrhoea. He was seen by a doctor in the evening, who was unaware that Maria had developed puerperal sepsis. At night, there is only one nurse looking after 30 to 40 patients. The baby of Maria passed away six hours later. The child was collected by the family for burial before Maria could leave the hospital. Maria was too sick to say farewell to her nameless child, who was recorded only as “baby of Maria.” She had no chance to speak about her loss with anyone in the hospital. She was looked after in the midst of mothers nursing their newborns. She seemed very lonely in this crowded place.
24 Achievements and Prospects
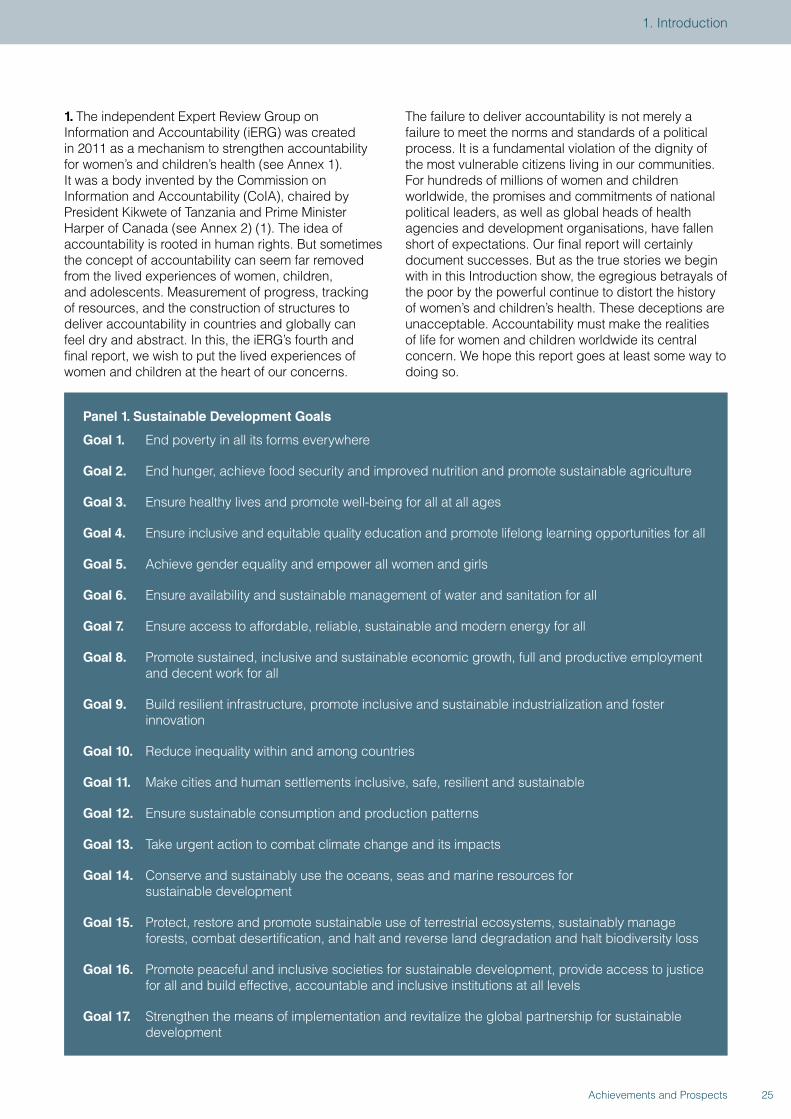
1. The independent Expert Review Group on Information and Accountability (iERG) was created in 2011 as a mechanism to strengthen accountability for women’s and children’s health (see Annex 1). It was a body invented by the Commission on Information and Accountability (CoIA), chaired by President Kikwete of Tanzania and Prime Minister Harper of Canada (see Annex 2) (1). The idea of accountability is rooted in human rights. But sometimes the concept of accountability can seem far removed from the lived experiences of women, children, and adolescents. Measurement of progress, tracking of resources, and the construction of structures to deliver accountability in countries and globally can feel dry and abstract. In this, the iERG’s fourth and final report, we wish to put the lived experiences of women and children at the heart of our concerns.
The failure to deliver accountability is not merely a failure to meet the norms and standards of a political process. It is a fundamental violation of the dignity of the most vulnerable citizens living in our communities. For hundreds of millions of women and children worldwide, the promises and commitments of national political leaders, as well as global heads of health agencies and development organisations, have fallen short of expectations. Our final report will certainly document successes. But as the true stories we begin with in this Introduction show, the egregious betrayals of the poor by the powerful continue to distort the history of women’s and children’s health. These deceptions are unacceptable. Accountability must make the realities of life for women and children worldwide its central concern. We hope this report goes at least some way to doing so.
Panel 1. Sustainable Development Goals
Goal 1. End poverty in all its forms everywhere
Goal 2. End hunger, achieve food security and improved nutrition and promote sustainable agriculture
Goal 3. Ensure healthy lives and promote well-being for all at all ages
Goal 4. Ensure inclusive and equitable quality education and promote lifelong learning opportunities for all
Goal 5. Achieve gender equality and empower all women and girls
Goal 6. Ensure availability and sustainable management of water and sanitation for all
Goal 7. Ensure access to affordable, reliable, sustainable and modern energy for all
Goal 8. Promote sustained, inclusive and sustainable economic growth, full and productive employment and decent work for all
Goal 9. Build resilient infrastructure, promote inclusive and sustainable industrialization and foster innovation
Goal 10. Reduce inequality within and among countries
Goal 11. Make cities and human settlements inclusive, safe, resilient and sustainable
Goal 12. Ensure sustainable consumption and production patterns
Goal 13. Take urgent action to combat climate change and its impacts
Goal 14. Conserve and sustainably use the oceans, seas and marine resources for sustainable development
Goal 15. Protect, restore and promote sustainable use of terrestrial ecosystems, sustainably manage forests, combat desertification, and halt and reverse land degradation and halt biodiversity loss
Goal 16. Promote peaceful and inclusive societies for sustainable development, provide access to justice for all and build effective, accountable and inclusive institutions at all levels
Goal 17. Strengthen the means of implementation and revitalize the global partnership for sustainable development
25Achievements and Prospects
1. Introduction
2. 2015 has been a year of reflection. The UN Secretary-General’s signature health initiative, Every Woman, Every Child, was launched in 2010 (2). It has become one of the fastest growing movements in global health, attracting over 400 commitments by 300 partners, together with US$60 billion of financing (3). Ban Ki-moon was right to say this year that, “The world is currently reducing under-5 and maternal deaths faster than at any time in history.” In 49 priority countries targeted by Every Woman, Every Child, achievements have been historic. 870 000 new health workers. A 49% increase in oral rehydration therapy for treating diarrhoeal disease. A 25% increase in skilled birth attendance. Progress has accelerated, and the Secretary-General’s Global Strategy for Women’s and Children’s Health has made a crucial contribution to this acceleration.
3. But there is always a reckoning. As much as the global community should admire the achievements of the Global Strategy, it left substantial room for improvement. In 2010, a commitment was made, one that should not be forgotten (2):
“In the 49 countries of the world with the lowest income, progress would be incredible. Between 2011 and 2015, we could prevent the deaths of more than 15 million children under 5, including more than 3 million newborns. We could prevent...about 570 000 women from dying from complications relating to pregnancy and childbirth.”
This headline promise was turned into an advocacy campaign for the Global Strategy: “Saving 16 million lives by 2015.” But in the Progress Report on the Global Strategy, published earlier this year, the true figure was revealed—2.4 million deaths averted since 2010 (3). This substantial difference between what was promised and what was delivered is hard to comprehend. There are at least two possible explanations. First, that the Global Strategy failed. Second, that the calculation of 16 million deaths was exaggerated or an error. If the former explanation is true, the global community needs to conduct a careful autopsy on what went wrong and why. If the latter explanation is correct, how did the full technical capacity of WHO and partner agencies make such a mistake? It is not good enough, as the Progress Report does, to gloss over this discrepancy in numbers by saying that the Global Strategy has delivered “substantial gains.”
4. 2015 has also been a year of transition. Ban Ki-moon has called the process leading to the post-2015 Sustainable Development Goals (SDGs), “The Road to Dignity” (4). 17 SDGs have been agreed upon, and health is one of those Goals (SDG-3) (Panels 1 and 2). Women’s and children’s health is embedded within that Goal. In parallel, a new Global Strategy has been
drafted to meet the challenge of a more inclusive and complex era (5). Agreement about the SDGs and the elements of a new Global Strategy does not mean that the approach to women and children is “business as usual.” There are already several critical differences in the approach and attitudes to women and children.
5. First, the scope of the women’s and children’s health movement has expanded to include adolescents and stillbirths. Adolescents make up over 20% of national populations. Most adolescents are concentrated in low- and middle-income settings. Adolescents matter in and of themselves, but also because their futures are very much determined by the events that take place during this time of change from child to adult. Including adolescents within the scope of Every Woman, Every Child changes the agenda of action considerably. In addition to maternal deaths—the second most frequent cause of mortality in 15-19-year-old women globally (after HIV/AIDS)—the global community and countries will now need to give more prominence to issues such as violence against women and girls, self-harm, the effects of war and conflict, and road traffic injuries.
6. Second, the place of women in our understanding of health is also changing. 2015 is the twentieth anniversary of the Beijing Declaration and Platform for Action. In March, 2015, the Commission on the Status of Women met to review progress since 1995 and to look ahead to opportunities for achieving gender equality in the post-2015 development agenda. Five priorities were identified: transforming discriminatory social norms and gender stereotypes; transforming the economy to achieve gender equality and sustainable development; ensuring full and equal participation of women in decision-making; increasing investments in gender equality; and strengthening accountability for gender equality. But these priorities were articulated on a background of slow and uneven progress, with major gaps and obstacles for women and girls in all countries. The position of women and girls in societies worldwide is often precarious. As the political declaration emerging from the March meeting noted, “no country has fully achieved equality and empowerment for women and girls [and] significant levels of inequality between women and men and girls and boys persist globally.” The broader social and political determinants of health for women and children will be a higher priority post-2015.
7. Third, there is renewed global and country commitment to taking data seriously. This commitment was expressed most forcefully in A World That Counts, which proposed a vision for a data revolution for sustainable development. The process of putting that vision in place began in June, 2015 in Washington, DC, at a conference led by USAID, WHO, and the World
26 Achievements and Prospects
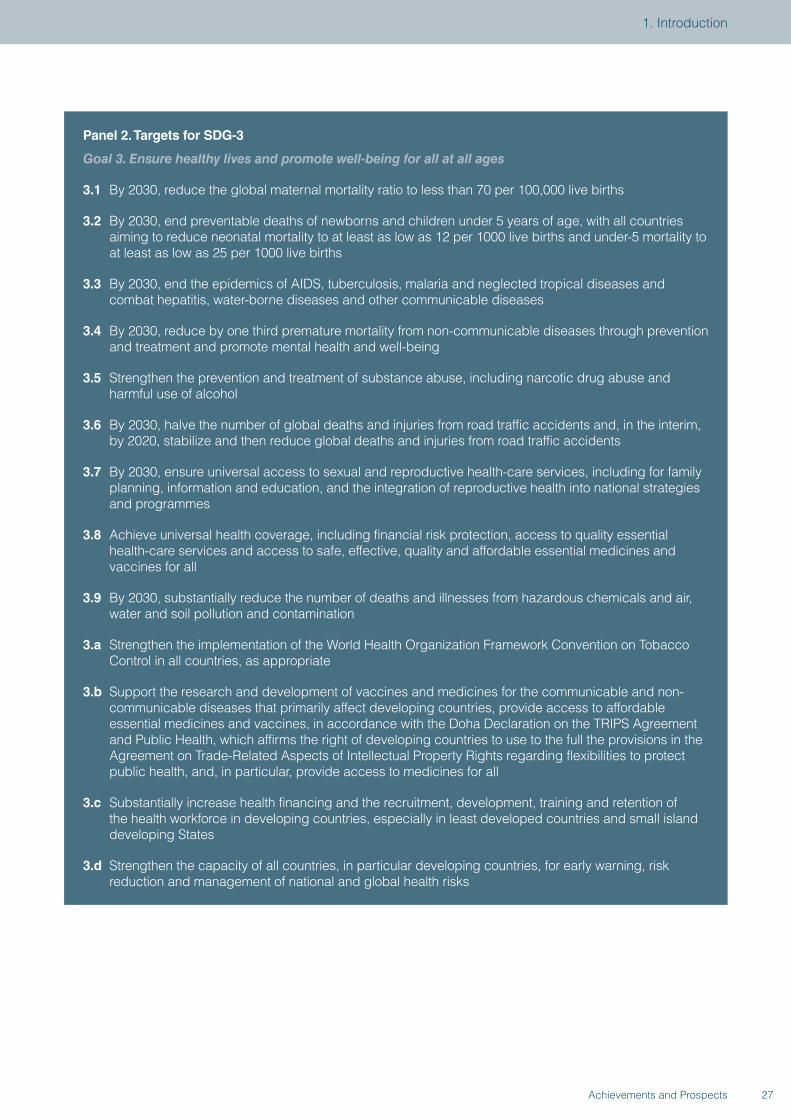
Panel 2. Targets for SDG-3
Goal 3. Ensure healthy lives and promote well-being for all at all ages
3.1 By 2030, reduce the global maternal mortality ratio to less than 70 per 100,000 live births
3.2 By 2030, end preventable deaths of newborns and children under 5 years of age, with all countries aiming to reduce neonatal mortality to at least as low as 12 per 1000 live births and under-5 mortality to at least as low as 25 per 1000 live births
3.3 By 2030, end the epidemics of AIDS, tuberculosis, malaria and neglected tropical diseases and combat hepatitis, water-borne diseases and other communicable diseases
3.4 By 2030, reduce by one third premature mortality from non-communicable diseases through prevention and treatment and promote mental health and well-being
3.5 Strengthen the prevention and treatment of substance abuse, including narcotic drug abuse and harmful use of alcohol
3.6 By 2030, halve the number of global deaths and injuries from road traffic accidents and, in the interim, by 2020, stabilize and then reduce global deaths and injuries from road traffic accidents
3.7 By 2030, ensure universal access to sexual and reproductive health-care services, including for family planning, information and education, and the integration of reproductive health into national strategies and programmes
3.8 Achieve universal health coverage, including financial risk protection, access to quality essential health-care services and access to safe, effective, quality and affordable essential medicines and vaccines for all
3.9 By 2030, substantially reduce the number of deaths and illnesses from hazardous chemicals and air, water and soil pollution and contamination
3.a Strengthen the implementation of the World Health Organization Framework Convention on Tobacco Control in all countries, as appropriate
3.b Support the research and development of vaccines and medicines for the communicable and non-communicable diseases that primarily affect developing countries, provide access to affordable essential medicines and vaccines, in accordance with the Doha Declaration on the TRIPS Agreement and Public Health, which affirms the right of developing countries to use to the full the provisions in the Agreement on Trade-Related Aspects of Intellectual Property Rights regarding flexibilities to protect public health, and, in particular, provide access to medicines for all
3.c Substantially increase health financing and the recruitment, development, training and retention of the health workforce in developing countries, especially in least developed countries and small island developing States
3.d Strengthen the capacity of all countries, in particular developing countries, for early warning, risk reduction and management of national and global health risks
27Achievements and Prospects
1. Introduction
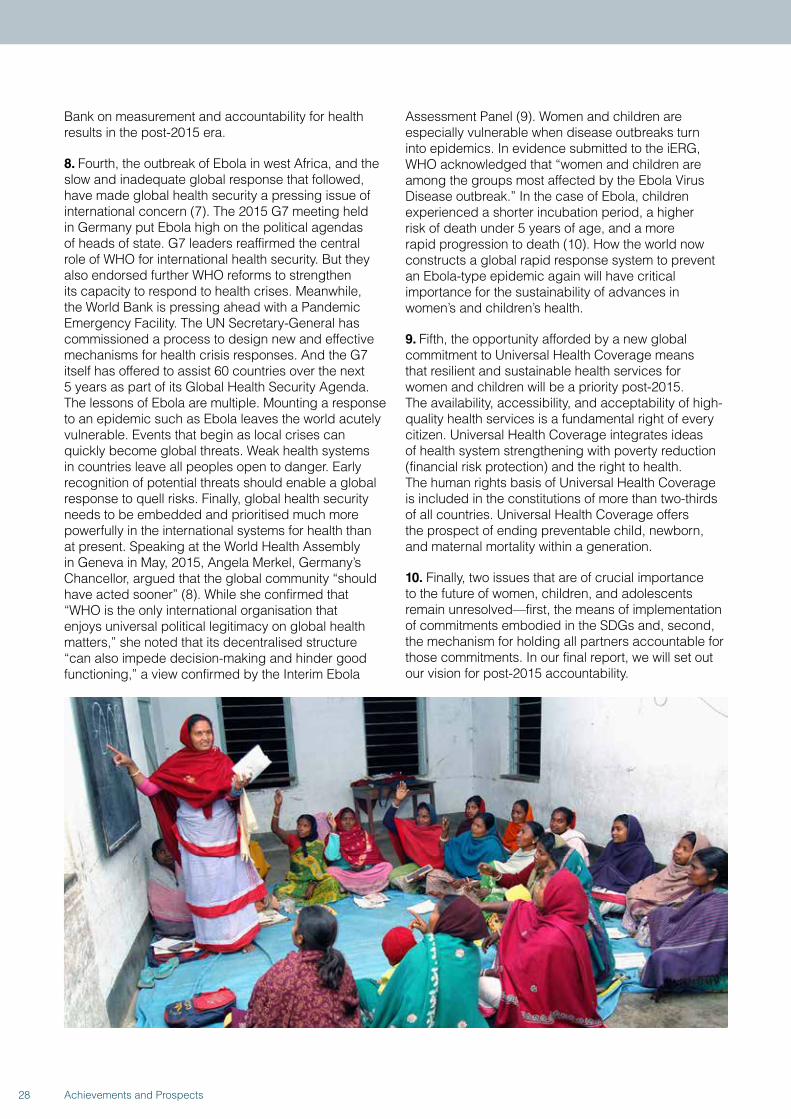
Bank on measurement and accountability for health results in the post-2015 era.
8. Fourth, the outbreak of Ebola in west Africa, and the slow and inadequate global response that followed, have made global health security a pressing issue of international concern (7). The 2015 G7 meeting held in Germany put Ebola high on the political agendas of heads of state. G7 leaders reaffirmed the central role of WHO for international health security. But they also endorsed further WHO reforms to strengthen its capacity to respond to health crises. Meanwhile, the World Bank is pressing ahead with a Pandemic Emergency Facility. The UN Secretary-General has commissioned a process to design new and effective mechanisms for health crisis responses. And the G7 itself has offered to assist 60 countries over the next 5 years as part of its Global Health Security Agenda. The lessons of Ebola are multiple. Mounting a response to an epidemic such as Ebola leaves the world acutely vulnerable. Events that begin as local crises can quickly become global threats. Weak health systems in countries leave all peoples open to danger. Early recognition of potential threats should enable a global response to quell risks. Finally, global health security needs to be embedded and prioritised much more powerfully in the international systems for health than at present. Speaking at the World Health Assembly in Geneva in May, 2015, Angela Merkel, Germany’s Chancellor, argued that the global community “should have acted sooner” (8). While she confirmed that “WHO is the only international organisation that enjoys universal political legitimacy on global health matters,” she noted that its decentralised structure “can also impede decision-making and hinder good functioning,” a view confirmed by the Interim Ebola
Assessment Panel (9). Women and children are especially vulnerable when disease outbreaks turn into epidemics. In evidence submitted to the iERG, WHO acknowledged that “women and children are among the groups most affected by the Ebola Virus Disease outbreak.” In the case of Ebola, children experienced a shorter incubation period, a higher risk of death under 5 years of age, and a more rapid progression to death (10). How the world now constructs a global rapid response system to prevent an Ebola-type epidemic again will have critical importance for the sustainability of advances in women’s and children’s health.
9. Fifth, the opportunity afforded by a new global commitment to Universal Health Coverage means that resilient and sustainable health services for women and children will be a priority post-2015. The availability, accessibility, and acceptability of high-quality health services is a fundamental right of every citizen. Universal Health Coverage integrates ideas of health system strengthening with poverty reduction (financial risk protection) and the right to health. The human rights basis of Universal Health Coverage is included in the constitutions of more than two-thirds of all countries. Universal Health Coverage offers the prospect of ending preventable child, newborn, and maternal mortality within a generation.
10. Finally, two issues that are of crucial importance to the future of women, children, and adolescents remain unresolved—first, the means of implementation of commitments embodied in the SDGs and, second, the mechanism for holding all partners accountable for those commitments. In our final report, we will set out our vision for post-2015 accountability.
28 Achievements and Prospects
Political decisions and their impact on India’s Family Planning Programme
In keeping with its commitments towards the ratified International Conference on Population and Development (ICPD) Programme of Action, India adopted the target-free approach in family planning in 1996. This meant that family planning uptake would be guided by the needs of the population and decided by clients through informed choice. In 2012, in response to the London Summit on Family Planning, India also decided to reposition its Family Planning Programme: it is now an integral component of the reproductive, maternal, newborn, child, and adolescent health (RMNCH+A) strategy, which was launched in 2013 and reasserts a target-free approach (1). The strategy emphasises addressing the unmet need for contraception by introducing newer contraceptives and distributing them through Accredited Social Health Activists (ASHAs), who are trained female community-based health workers.
Despite these policy and programmatic changes, there has been insufficient political commitment to put in place the management tools necessary for their implementation on the ground. In reality, several issues remain, of which three have particularly deleterious effects on the quality of family planning services and on women’s ability to exercise their reproductive rights (2).
Continuing emphasis on targets. Although India is officially supposed to be in the “target-free” era, the expected levels of achievement (ELAs), set by the state and district health authorities on the basis of past performance, determine what the peripheral health workers are expected to achieve. Lower-level health workers are reported to have been sanctioned punitively when these ELAs are not met, by threats, and sometimes by the withholding of salaries and increments.
Continuing reliance on camp-based sterilisation services. Sterilisation is still the most common form of contraception in India: in 2008, 34% of currently married women aged 15–44 years were sterilised (3). Sterilisations are usually performed in camps, where the quality of services has been much criticised.
Incentives for sterilisations. Indian states offer inducements for sterilisations.
The tragic deaths of 16 young women and the critical condition of several others after tubectomies at a sterilisation camp in Bilaspur, Chhattisgarh,
in November, 2014, highlighted the effects of India’s weak political commitment to implement changes in its Family Planning Programme. A total of 83 women were operated upon within one and a half hours by one team, flouting quality standards set by the national government. A fact-finding enquiry reported widespread violations of the standard protocols for performing laparoscopic sterilisation, and of the guidelines set by the Ministry of Health and Family Welfare for sterilisation in camp settings (4). These included violations in the selection of the camp site, the number of procedures performed, the equipment and number of instruments used, and the screening and care of the women. The camp was situated in a non-functional health facility and compromised the basic standards of cleanliness and care both during and after surgical procedures. Although the laparoscopic surgeon was competent, the support staff seemed to be untrained, with no knowledge of nationally required quality standards and procedures. Basic infection prevention practices were also missing.
The report also analysed the national government’s expenditure on the Family Planning Programme for 2013–2014, and found that 85% of the total expenditure was on female sterilisation and only 15% on birth spacing methods. Of the 3389.1 million (US$52.94 million) spent on female sterilisation, 144.2 million ($2.25 million) was spent on the camps and 3244.9 million ($50.69 million) on compensation and incentives.
The amount spent on compensation and incentives was 2.5 times higher than the untied grant given to primary health centres to improve infrastructure and quality of care. This disproportionate spending is ironic because desired fertility in India is now low. The continued use of incentives not only constitutes a threat to the exercise of rights, but is also an antiquated practice based on the fear of population growth and the erroneous perception that perceived population growth is due to wanted fertility and needs to be curbed by incentives. In fact, such growth as now exists is due to the population momentum and the unmet need for contraceptives, and not to wanted fertility. Incentives for sterilisation are a waste of money that could be more usefully spent on improving the quality of services.
The Government of India needs to adhere to the commitments set out in the ICPD Programme of Action and to its own policies
29Achievements and Prospects
1. Introduction
and strategy documents. The issues listed above must be addressed in a phased manner and with commensurate budgetary provisions. The recommendations contained in the WHO guidelines “Ensuring human rights in the provision of contraceptive information and services: Guidance and recommendations” are aimed at
policy makers and programme managers and must be followed (5). Civil society organisations in India must continue to monitor the policies and programmes and the provision of contraceptive services and information, and must hold the government accountable for carrying out its commitments.
References
1. Ministry of Health and Family Welfare. A strategic approach to reproductive, maternal, newborn, child and adolescent health (RMNCH+A) in India. New Delhi: Government of India, 2013. http://rmncha.in/upload/Content/101.pdf (accessed Jun 5, 2015).
2. Das A, Uppal L. Family planning in India: a need to review our current approaches. A Briefing Paper. New Delhi: National Coalition Against Two Child Norm & Coercive Population Policies. www.2cnpop.net/uploads/1/0/2/1/10215849/briefing_paper_-ii__24-12-12_e-copy.pdf (accessed Jun 5, 2015).
3. Ministry of Health and Family Welfare, Government of India. District Level Household and Facility Survey 2007–08.
Mumbai: International Institute for Population Sciences, 2010.
4. Muttreja P, Banerjee A, Apte K, Sri S. Robbed of choice and dignity: Indian women dead after mass sterilisation. Situational assessment of sterilisation camps in Bilaspur District, Chhattisgarh. Report by a multi-organizational team (Population Foundation of India, Family Planning Association of India, Parivar Seva Sansthan, and Common Health), 2014. http://www.wunrn.com/pdf/robbed.pdf (accessed Jun 5, 2015).
5. WHO. Ensuring human rights in the provision of contraceptive information and services: guidance and recommendations. Geneva: World Health Organization, 2014.
30 Achievements and Prospects
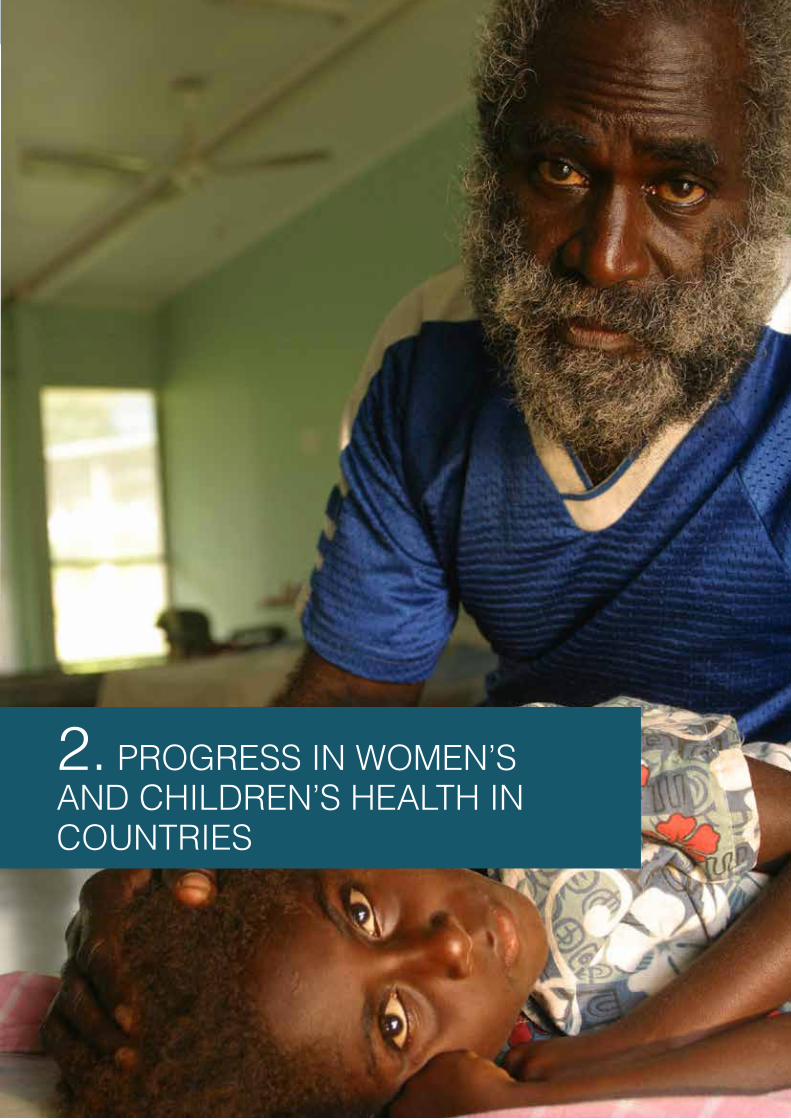
2. PROGRESS IN WOMEN’S AND CHILDREN’S HEALTH IN COUNTRIES
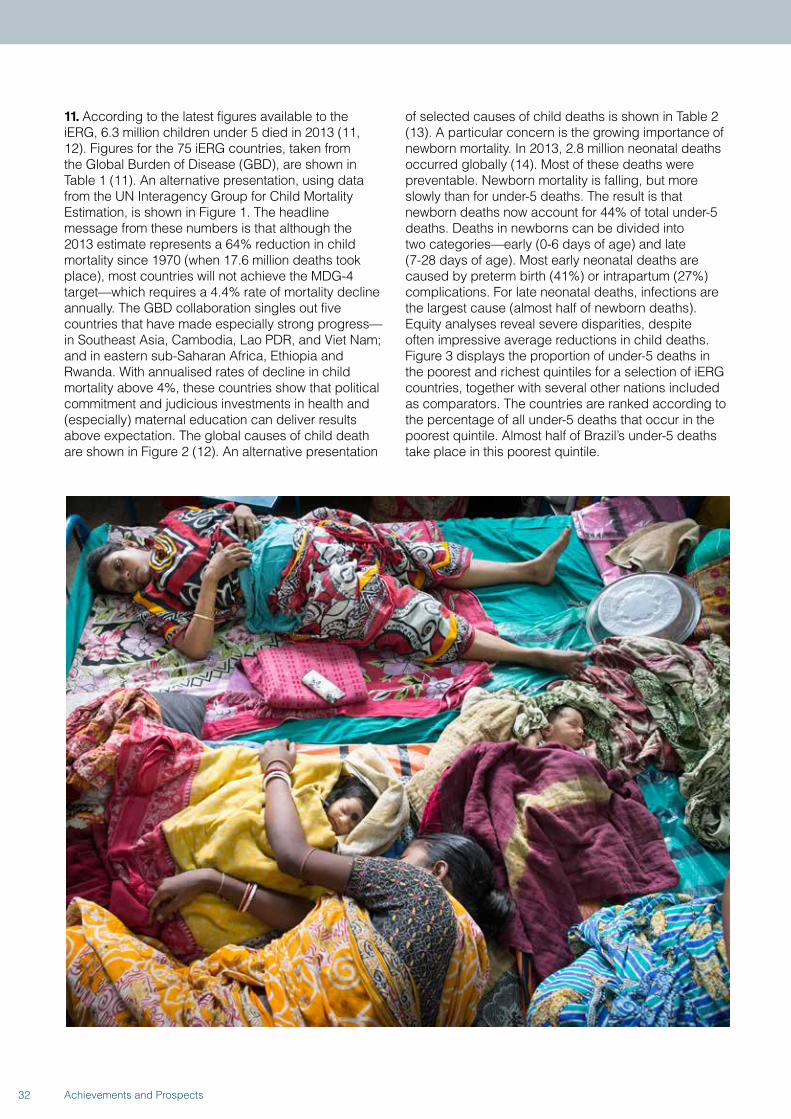
11. According to the latest figures available to the iERG, 6.3 million children under 5 died in 2013 (11, 12). Figures for the 75 iERG countries, taken from the Global Burden of Disease (GBD), are shown in Table 1 (11). An alternative presentation, using data from the UN Interagency Group for Child Mortality Estimation, is shown in Figure 1. The headline message from these numbers is that although the 2013 estimate represents a 64% reduction in child mortality since 1970 (when 17.6 million deaths took place), most countries will not achieve the MDG-4 target—which requires a 4.4% rate of mortality decline annually. The GBD collaboration singles out five countries that have made especially strong progress—in Southeast Asia, Cambodia, Lao PDR, and Viet Nam; and in eastern sub-Saharan Africa, Ethiopia and Rwanda. With annualised rates of decline in child mortality above 4%, these countries show that political commitment and judicious investments in health and (especially) maternal education can deliver results above expectation. The global causes of child death are shown in Figure 2 (12). An alternative presentation
of selected causes of child deaths is shown in Table 2 (13). A particular concern is the growing importance of newborn mortality. In 2013, 2.8 million neonatal deaths occurred globally (14). Most of these deaths were preventable. Newborn mortality is falling, but more slowly than for under-5 deaths. The result is that newborn deaths now account for 44% of total under-5 deaths. Deaths in newborns can be divided into two categories—early (0-6 days of age) and late (7-28 days of age). Most early neonatal deaths are caused by preterm birth (41%) or intrapartum (27%) complications. For late neonatal deaths, infections are the largest cause (almost half of newborn deaths). Equity analyses reveal severe disparities, despite often impressive average reductions in child deaths. Figure 3 displays the proportion of under-5 deaths in the poorest and richest quintiles for a selection of iERG countries, together with several other nations included as comparators. The countries are ranked according to the percentage of all under-5 deaths that occur in the poorest quintile. Almost half of Brazil’s under-5 deaths take place in this poorest quintile.
32 Achievements and Prospects
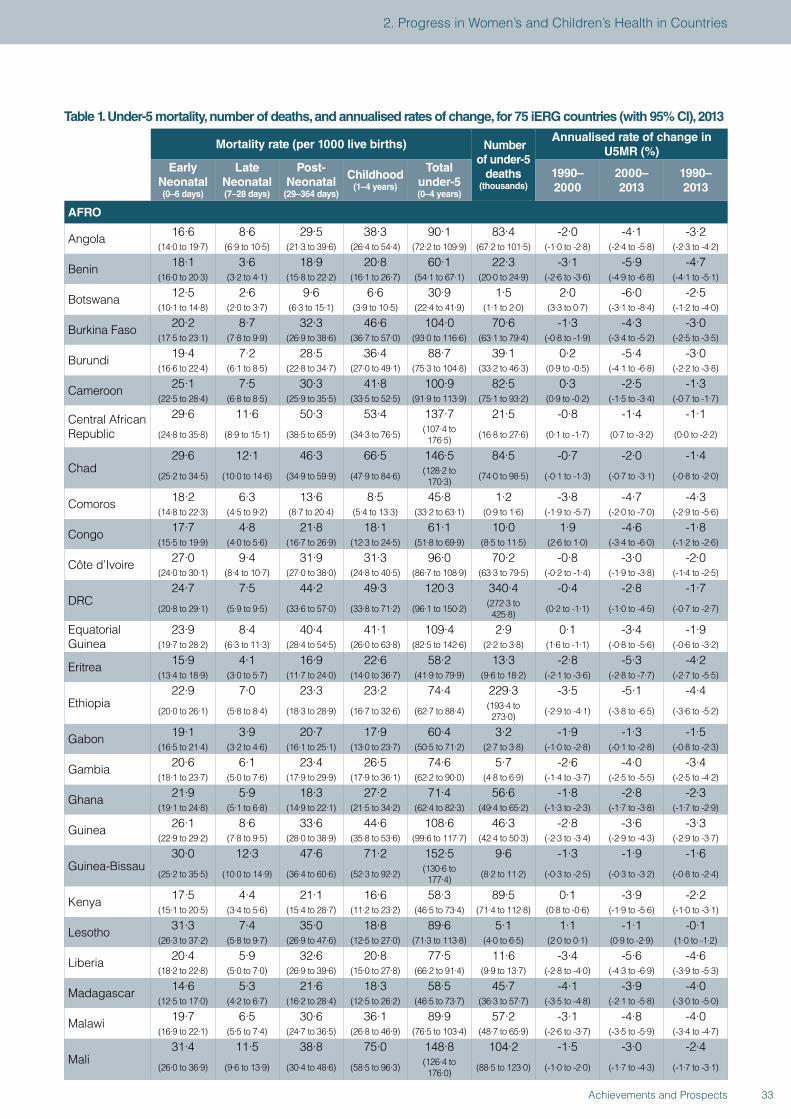
Table 1. Under-5 mortality, number of deaths, and annualised rates of change, for 75 iERG countries (with 95% CI), 2013
Mortality rate (per 1000 live births) Number of under-5
deaths (thousands)
Annualised rate of change in U5MR (%)
Early Neonatal (0–6 days)
Late Neonatal (7–28 days)
Post-Neonatal
(29–364 days)
Childhood (1–4 years)
Total under-5 (0–4 years)
1990–2000
2000–2013
1990–2013
AFRO
Angola 16·6 8·6 29·5 38·3 90·1 83·4 -2·0 -4·1 -3·2(14·0 to 19·7) (6·9 to 10·5) (21·3 to 39·6) (26·4 to 54·4) (72·2 to 109·9) (67·2 to 101·5) (-1·0 to -2·8) (-2·4 to -5·8) (-2·3 to -4·2)
Benin 18·1 3·6 18·9 20·8 60·1 22·3 -3·1 -5·9 -4·7(16·0 to 20·3) (3·2 to 4·1) (15·8 to 22·2) (16·1 to 26·7) (54·1 to 67·1) (20·0 to 24·9) (-2·6 to -3·6) (-4·9 to -6·8) (-4·1 to -5·1)
Botswana 12·5 2·6 9·6 6·6 30·9 1·5 2·0 -6·0 -2·5(10·1 to 14·8) (2·0 to 3·7) (6·3 to 15·1) (3·9 to 10·5) (22·4 to 41·9) (1·1 to 2·0) (3·3 to 0·7) (-3·1 to -8·4) (-1·2 to -4·0)
Burkina Faso 20·2 8·7 32·3 46·6 104·0 70·6 -1·3 -4·3 -3·0(17·5 to 23·1) (7·8 to 9·9) (26·9 to 38·6) (36·7 to 57·0) (93·0 to 116·6) (63·1 to 79·4) (-0·8 to -1·9) (-3·4 to -5·2) (-2·5 to -3·5)
Burundi 19·4 7·2 28·5 36·4 88·7 39·1 0·2 -5·4 -3·0(16·6 to 22·4) (6·1 to 8·5) (22·8 to 34·7) (27·0 to 49·1) (75·3 to 104·8) (33·2 to 46·3) (0·9 to -0·5) (-4·1 to -6·8) (-2·2 to -3·8)
Cameroon 25·1 7·5 30·3 41·8 100·9 82·5 0·3 -2·5 -1·3(22·5 to 28·4) (6·8 to 8·5) (25·9 to 35·5) (33·5 to 52·5) (91·9 to 113·9) (75·1 to 93·2) (0·9 to -0·2) (-1·5 to -3·4) (-0·7 to -1·7)
Central African Republic
29·6 11·6 50·3 53·4 137·7 21·5 -0·8 -1·4 -1·1
(24·8 to 35·8) (8·9 to 15·1) (38·5 to 65·9) (34·3 to 76·5) (107·4 to 176·5) (16·8 to 27·6) (0·1 to -1·7) (0·7 to -3·2) (0·0 to -2·2)
Chad29·6 12·1 46·3 66·5 146·5 84·5 -0·7 -2·0 -1·4
(25·2 to 34·5) (10·0 to 14·6) (34·9 to 59·9) (47·9 to 84·6) (128·2 to 170·3) (74·0 to 98·5) (-0·1 to -1·3) (-0·7 to -3·1) (-0·8 to -2·0)
Comoros 18·2 6·3 13·6 8·5 45·8 1·2 -3·8 -4·7 -4·3(14·8 to 22·3) (4·5 to 9·2) (8·7 to 20·4) (5·4 to 13·3) (33·2 to 63·1) (0·9 to 1·6) (-1·9 to -5·7) (-2·0 to -7·0) (-2·9 to -5·6)
Congo 17·7 4·8 21·8 18·1 61·1 10·0 1·9 -4·6 -1·8(15·5 to 19·9) (4·0 to 5·6) (16·7 to 26·9) (12·3 to 24·5) (51·8 to 69·9) (8·5 to 11·5) (2·6 to 1·0) (-3·4 to -6·0) (-1·2 to -2·6)
Côte d’Ivoire 27·0 9·4 31·9 31·3 96·0 70·2 -0·8 -3·0 -2·0(24·0 to 30·1) (8·4 to 10·7) (27·0 to 38·0) (24·8 to 40·5) (86·7 to 108·9) (63·3 to 79·5) (-0·2 to -1·4) (-1·9 to -3·8) (-1·4 to -2·5)
DRC24·7 7·5 44·2 49·3 120·3 340·4 -0·4 -2·8 -1·7
(20·8 to 29·1) (5·9 to 9·5) (33·6 to 57·0) (33·8 to 71·2) (96·1 to 150·2) (272·3 to 425·8) (0·2 to -1·1) (-1·0 to -4·5) (-0·7 to -2·7)
Equatorial Guinea
23·9 8·4 40·4 41·1 109·4 2·9 0·1 -3·4 -1·9(19·7 to 28·2) (6·3 to 11·3) (28·4 to 54·5) (26·0 to 63·8) (82·5 to 142·6) (2·2 to 3·8) (1·6 to -1·1) (-0·8 to -5·6) (-0·6 to -3·2)
Eritrea 15·9 4·1 16·9 22·6 58·2 13·3 -2·8 -5·3 -4·2(13·4 to 18·9) (3·0 to 5·7) (11·7 to 24·0) (14·0 to 36·7) (41·9 to 79·9) (9·6 to 18·2) (-2·1 to -3·6) (-2·8 to -7·7) (-2·7 to -5·5)
Ethiopia22·9 7·0 23·3 23·2 74·4 229·3 -3·5 -5·1 -4·4
(20·0 to 26·1) (5·8 to 8·4) (18·3 to 28·9) (16·7 to 32·6) (62·7 to 88·4) (193·4 to 273·0) (-2·9 to -4·1) (-3·8 to -6·5) (-3·6 to -5·2)
Gabon 19·1 3·9 20·7 17·9 60·4 3·2 -1·9 -1·3 -1·5(16·5 to 21·4) (3·2 to 4·6) (16·1 to 25·1) (13·0 to 23·7) (50·5 to 71·2) (2·7 to 3·8) (-1·0 to -2·8) (-0·1 to -2·8) (-0·8 to -2·3)
Gambia 20·6 6·1 23·4 26·5 74·6 5·7 -2·6 -4·0 -3·4(18·1 to 23·7) (5·0 to 7·6) (17·9 to 29·9) (17·9 to 36·1) (62·2 to 90·0) (4·8 to 6·9) (-1·4 to -3·7) (-2·5 to -5·5) (-2·5 to -4·2)
Ghana 21·9 5·9 18·3 27·2 71·4 56·6 -1·8 -2·8 -2·3(19·1 to 24·8) (5·1 to 6·8) (14·9 to 22·1) (21·5 to 34·2) (62·4 to 82·3) (49·4 to 65·2) (-1·3 to -2·3) (-1·7 to -3·8) (-1·7 to -2·9)
Guinea 26·1 8·6 33·6 44·6 108·6 46·3 -2·8 -3·6 -3·3(22·9 to 29·2) (7·8 to 9·5) (28·0 to 38·9) (35·8 to 53·6) (99·6 to 117·7) (42·4 to 50·3) (-2·3 to -3·4) (-2·9 to -4·3) (-2·9 to -3·7)
Guinea-Bissau30·0 12·3 47·6 71·2 152·5 9·6 -1·3 -1·9 -1·6
(25·2 to 35·5) (10·0 to 14·9) (36·4 to 60·6) (52·3 to 92·2) (130·6 to 177·4) (8·2 to 11·2) (-0·3 to -2·5) (-0·3 to -3·2) (-0·8 to -2·4)
Kenya 17·5 4·4 21·1 16·6 58·3 89·5 0·1 -3·9 -2·2(15·1 to 20·5) (3·4 to 5·6) (15·4 to 28·7) (11·2 to 23·2) (46·5 to 73·4) (71·4 to 112·8) (0·8 to -0·6) (-1·9 to -5·6) (-1·0 to -3·1)
Lesotho 31·3 7·4 35·0 18·8 89·6 5·1 1·1 -1·1 -0·1(26·3 to 37·2) (5·8 to 9·7) (26·9 to 47·6) (12·5 to 27·0) (71·3 to 113·8) (4·0 to 6·5) (2·0 to 0·1) (0·9 to -2·9) (1·0 to -1·2)
Liberia 20·4 5·9 32·6 20·8 77·5 11·6 -3·4 -5·6 -4·6(18·2 to 22·8) (5·0 to 7·0) (26·9 to 39·6) (15·0 to 27·8) (66·2 to 91·4) (9·9 to 13·7) (-2·8 to -4·0) (-4·3 to -6·9) (-3·9 to -5·3)
Madagascar 14·6 5·3 21·6 18·3 58·5 45·7 -4·1 -3·9 -4·0(12·5 to 17·0) (4·2 to 6·7) (16·2 to 28·4) (12·5 to 26·2) (46·5 to 73·7) (36·3 to 57·7) (-3·5 to -4·8) (-2·1 to -5·8) (-3·0 to -5·0)
Malawi 19·7 6·5 30·6 36·1 89·9 57·2 -3·1 -4·8 -4·0(16·9 to 22·1) (5·5 to 7·4) (24·7 to 36·5) (26·8 to 46·9) (76·5 to 103·4) (48·7 to 65·9) (-2·6 to -3·7) (-3·5 to -5·9) (-3·4 to -4·7)
Mali31·4 11·5 38·8 75·0 148·8 104·2 -1·5 -3·0 -2·4
(26·0 to 36·9) (9·6 to 13·9) (30·4 to 48·6) (58·5 to 96·3) (126·4 to 176·0) (88·5 to 123·0) (-1·0 to -2·0) (-1·7 to -4·3) (-1·7 to -3·1)
33Achievements and Prospects
2. Progress in Women’s and Children’s Health in Countries
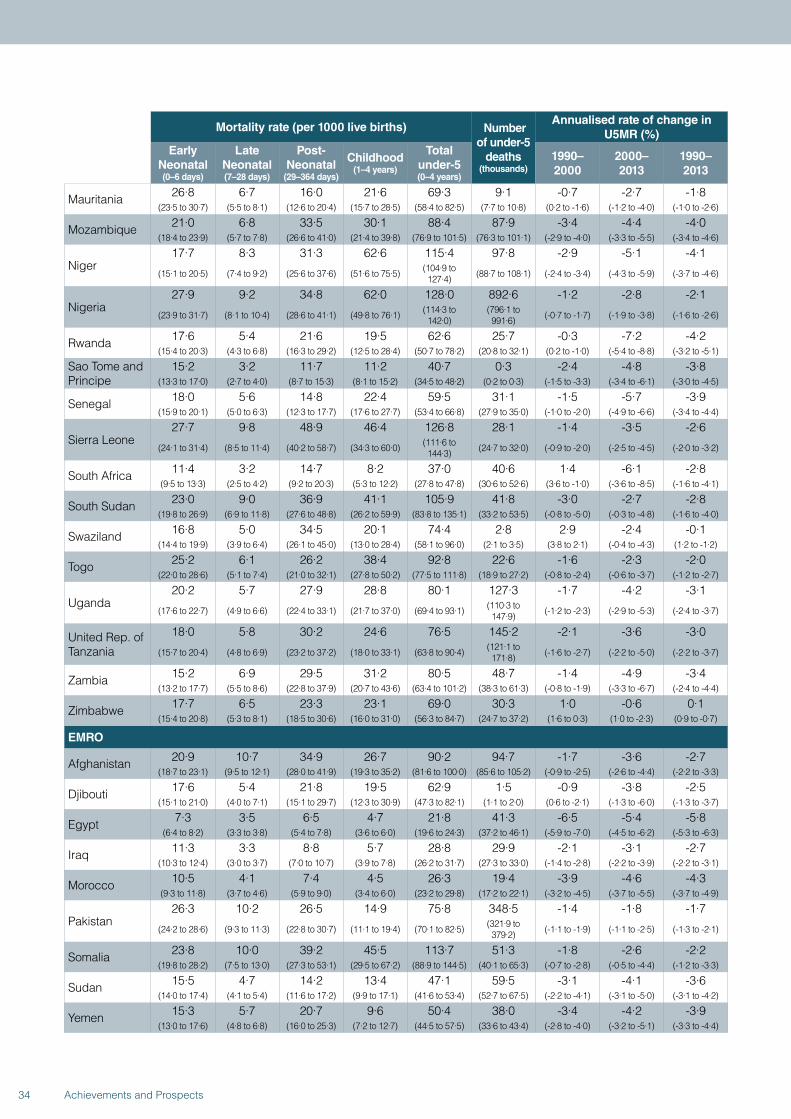
Mortality rate (per 1000 live births) Number of under-5
deaths (thousands)
Annualised rate of change in U5MR (%)
Early Neonatal (0–6 days)
Late Neonatal (7–28 days)
Post-Neonatal
(29–364 days)
Childhood (1–4 years)
Total under-5 (0–4 years)
1990–2000
2000–2013
1990–2013
Mauritania 26·8 6·7 16·0 21·6 69·3 9·1 -0·7 -2·7 -1·8(23·5 to 30·7) (5·5 to 8·1) (12·6 to 20·4) (15·7 to 28·5) (58·4 to 82·5) (7·7 to 10·8) (0·2 to -1·6) (-1·2 to -4·0) (-1·0 to -2·6)
Mozambique 21·0 6·8 33·5 30·1 88·4 87·9 -3·4 -4·4 -4·0(18·4 to 23·9) (5·7 to 7·8) (26·6 to 41·0) (21·4 to 39·8) (76·9 to 101·5) (76·3 to 101·1) (-2·9 to -4·0) (-3·3 to -5·5) (-3·4 to -4·6)
Niger17·7 8·3 31·3 62·6 115·4 97·8 -2·9 -5·1 -4·1
(15·1 to 20·5) (7·4 to 9·2) (25·6 to 37·6) (51·6 to 75·5) (104·9 to 127·4) (88·7 to 108·1) (-2·4 to -3·4) (-4·3 to -5·9) (-3·7 to -4·6)
Nigeria27·9 9·2 34·8 62·0 128·0 892·6 -1·2 -2·8 -2·1
(23·9 to 31·7) (8·1 to 10·4) (28·6 to 41·1) (49·8 to 76·1) (114·3 to 142·0)
(796·1 to 991·6) (-0·7 to -1·7) (-1·9 to -3·8) (-1·6 to -2·6)
Rwanda 17·6 5·4 21·6 19·5 62·6 25·7 -0·3 -7·2 -4·2(15·4 to 20·3) (4·3 to 6·8) (16·3 to 29·2) (12·5 to 28·4) (50·7 to 78·2) (20·8 to 32·1) (0·2 to -1·0) (-5·4 to -8·8) (-3·2 to -5·1)
Sao Tome and Principe
15·2 3·2 11·7 11·2 40·7 0·3 -2·4 -4·8 -3·8(13·3 to 17·0) (2·7 to 4·0) (8·7 to 15·3) (8·1 to 15·2) (34·5 to 48·2) (0·2 to 0·3) (-1·5 to -3·3) (-3·4 to -6·1) (-3·0 to -4·5)
Senegal 18·0 5·6 14·8 22·4 59·5 31·1 -1·5 -5·7 -3·9(15·9 to 20·1) (5·0 to 6·3) (12·3 to 17·7) (17·6 to 27·7) (53·4 to 66·8) (27·9 to 35·0) (-1·0 to -2·0) (-4·9 to -6·6) (-3·4 to -4·4)
Sierra Leone27·7 9·8 48·9 46·4 126·8 28·1 -1·4 -3·5 -2·6
(24·1 to 31·4) (8·5 to 11·4) (40·2 to 58·7) (34·3 to 60·0) (111·6 to 144·3) (24·7 to 32·0) (-0·9 to -2·0) (-2·5 to -4·5) (-2·0 to -3·2)
South Africa 11·4 3·2 14·7 8·2 37·0 40·6 1·4 -6·1 -2·8(9·5 to 13·3) (2·5 to 4·2) (9·2 to 20·3) (5·3 to 12·2) (27·8 to 47·8) (30·6 to 52·6) (3·6 to -1·0) (-3·6 to -8·5) (-1·6 to -4·1)
South Sudan 23·0 9·0 36·9 41·1 105·9 41·8 -3·0 -2·7 -2·8(19·8 to 26·9) (6·9 to 11·8) (27·6 to 48·8) (26·2 to 59·9) (83·8 to 135·1) (33·2 to 53·5) (-0·8 to -5·0) (-0·3 to -4·8) (-1·6 to -4·0)
Swaziland 16·8 5·0 34·5 20·1 74·4 2·8 2·9 -2·4 -0·1(14·4 to 19·9) (3·9 to 6·4) (26·1 to 45·0) (13·0 to 28·4) (58·1 to 96·0) (2·1 to 3·5) (3·8 to 2·1) (-0·4 to -4·3) (1·2 to -1·2)
Togo 25·2 6·1 26·2 38·4 92·8 22·6 -1·6 -2·3 -2·0(22·0 to 28·6) (5·1 to 7·4) (21·0 to 32·1) (27·8 to 50·2) (77·5 to 111·8) (18·9 to 27·2) (-0·8 to -2·4) (-0·6 to -3·7) (-1·2 to -2·7)
Uganda20·2 5·7 27·9 28·8 80·1 127·3 -1·7 -4·2 -3·1
(17·6 to 22·7) (4·9 to 6·6) (22·4 to 33·1) (21·7 to 37·0) (69·4 to 93·1) (110·3 to 147·9) (-1·2 to -2·3) (-2·9 to -5·3) (-2·4 to -3·7)
United Rep. of Tanzania
18·0 5·8 30·2 24·6 76·5 145·2 -2·1 -3·6 -3·0
(15·7 to 20·4) (4·8 to 6·9) (23·2 to 37·2) (18·0 to 33·1) (63·8 to 90·4) (121·1 to 171·8) (-1·6 to -2·7) (-2·2 to -5·0) (-2·2 to -3·7)
Zambia 15·2 6·9 29·5 31·2 80·5 48·7 -1·4 -4·9 -3·4(13·2 to 17·7) (5·5 to 8·6) (22·8 to 37·9) (20·7 to 43·6) (63·4 to 101·2) (38·3 to 61·3) (-0·8 to -1·9) (-3·3 to -6·7) (-2·4 to -4·4)
Zimbabwe 17·7 6·5 23·3 23·1 69·0 30·3 1·0 -0·6 0·1(15·4 to 20·8) (5·3 to 8·1) (18·5 to 30·6) (16·0 to 31·0) (56·3 to 84·7) (24·7 to 37·2) (1·6 to 0·3) (1·0 to -2·3) (0·9 to -0·7)
EMRO
Afghanistan 20·9 10·7 34·9 26·7 90·2 94·7 -1·7 -3·6 -2·7(18·7 to 23·1) (9·5 to 12·1) (28·0 to 41·9) (19·3 to 35·2) (81·6 to 100·0) (85·6 to 105·2) (-0·9 to -2·5) (-2·6 to -4·4) (-2·2 to -3·3)
Djibouti 17·6 5·4 21·8 19·5 62·9 1·5 -0·9 -3·8 -2·5(15·1 to 21·0) (4·0 to 7·1) (15·1 to 29·7) (12·3 to 30·9) (47·3 to 82·1) (1·1 to 2·0) (0·6 to -2·1) (-1·3 to -6·0) (-1·3 to -3·7)
Egypt 7·3 3·5 6·5 4·7 21·8 41·3 -6·5 -5·4 -5·8(6·4 to 8·2) (3·3 to 3·8) (5·4 to 7·8) (3·6 to 6·0) (19·6 to 24·3) (37·2 to 46·1) (-5·9 to -7·0) (-4·5 to -6·2) (-5·3 to -6·3)
Iraq 11·3 3·3 8·8 5·7 28·8 29·9 -2·1 -3·1 -2·7(10·3 to 12·4) (3·0 to 3·7) (7·0 to 10·7) (3·9 to 7·8) (26·2 to 31·7) (27·3 to 33·0) (-1·4 to -2·8) (-2·2 to -3·9) (-2·2 to -3·1)
Morocco 10·5 4·1 7·4 4·5 26·3 19·4 -3·9 -4·6 -4·3(9·3 to 11·8) (3·7 to 4·6) (5·9 to 9·0) (3·4 to 6·0) (23·2 to 29·8) (17·2 to 22·1) (-3·2 to -4·5) (-3·7 to -5·5) (-3·7 to -4·9)
Pakistan26·3 10·2 26·5 14·9 75·8 348·5 -1·4 -1·8 -1·7
(24·2 to 28·6) (9·3 to 11·3) (22·8 to 30·7) (11·1 to 19·4) (70·1 to 82·5) (321·9 to 379·2) (-1·1 to -1·9) (-1·1 to -2·5) (-1·3 to -2·1)
Somalia 23·8 10·0 39·2 45·5 113·7 51·3 -1·8 -2·6 -2·2(19·8 to 28·2) (7·5 to 13·0) (27·3 to 53·1) (29·5 to 67·2) (88·9 to 144·5) (40·1 to 65·3) (-0·7 to -2·8) (-0·5 to -4·4) (-1·2 to -3·3)
Sudan 15·5 4·7 14·2 13·4 47·1 59·5 -3·1 -4·1 -3·6(14·0 to 17·4) (4·1 to 5·4) (11·6 to 17·2) (9·9 to 17·1) (41·6 to 53·4) (52·7 to 67·5) (-2·2 to -4·1) (-3·1 to -5·0) (-3·1 to -4·2)
Yemen 15·3 5·7 20·7 9·6 50·4 38·0 -3·4 -4·2 -3·9(13·0 to 17·6) (4·8 to 6·8) (16·0 to 25·3) (7·2 to 12·7) (44·5 to 57·5) (33·6 to 43·4) (-2·8 to -4·0) (-3·2 to -5·1) (-3·3 to -4·4)
34 Achievements and Prospects
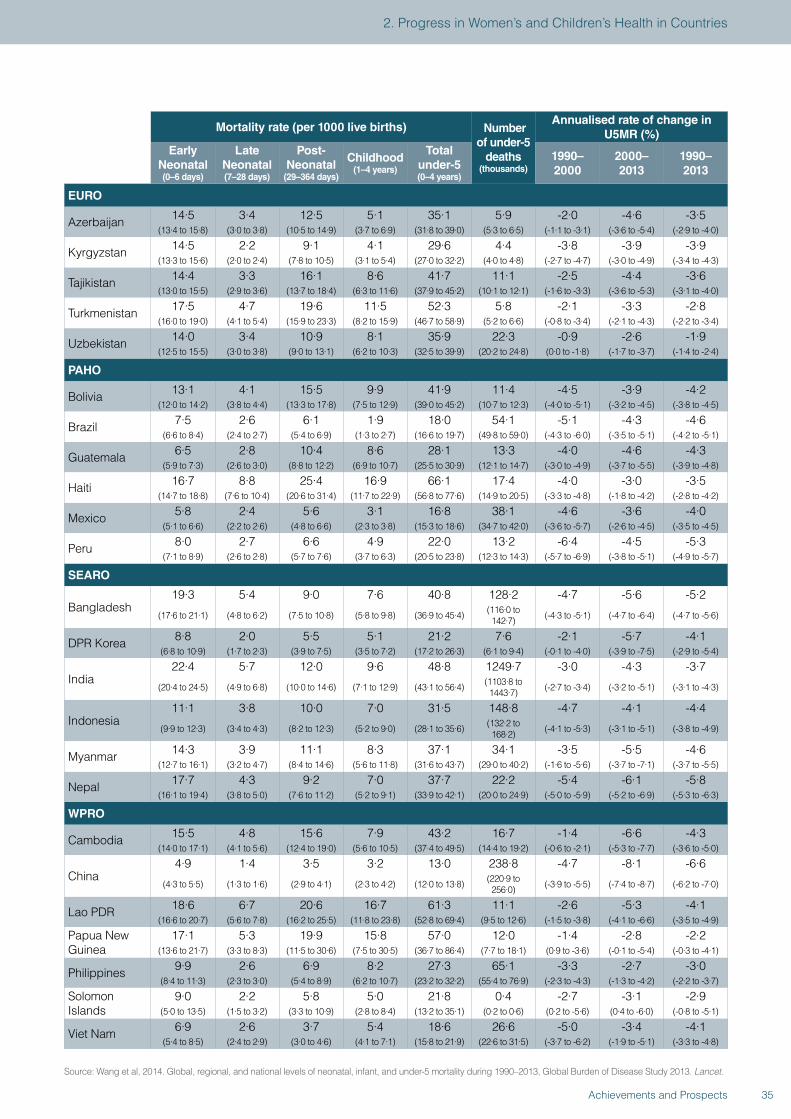
Mortality rate (per 1000 live births) Number of under-5
deaths (thousands)
Annualised rate of change in U5MR (%)
Early Neonatal (0–6 days)
Late Neonatal (7–28 days)
Post-Neonatal
(29–364 days)
Childhood (1–4 years)
Total under-5 (0–4 years)
1990–2000
2000–2013
1990–2013
EURO
Azerbaijan 14·5 3·4 12·5 5·1 35·1 5·9 -2·0 -4·6 -3·5(13·4 to 15·8) (3·0 to 3·8) (10·5 to 14·9) (3·7 to 6·9) (31·8 to 39·0) (5·3 to 6·5) (-1·1 to -3·1) (-3·6 to -5·4) (-2·9 to -4·0)
Kyrgyzstan 14·5 2·2 9·1 4·1 29·6 4·4 -3·8 -3·9 -3·9(13·3 to 15·6) (2·0 to 2·4) (7·8 to 10·5) (3·1 to 5·4) (27·0 to 32·2) (4·0 to 4·8) (-2·7 to -4·7) (-3·0 to -4·9) (-3·4 to -4·3)
Tajikistan 14·4 3·3 16·1 8·6 41·7 11·1 -2·5 -4·4 -3·6(13·0 to 15·5) (2·9 to 3·6) (13·7 to 18·4) (6·3 to 11·6) (37·9 to 45·2) (10·1 to 12·1) (-1·6 to -3·3) (-3·6 to -5·3) (-3·1 to -4·0)
Turkmenistan 17·5 4·7 19·6 11·5 52·3 5·8 -2·1 -3·3 -2·8(16·0 to 19·0) (4·1 to 5·4) (15·9 to 23·3) (8·2 to 15·9) (46·7 to 58·9) (5·2 to 6·6) (-0·8 to -3·4) (-2·1 to -4·3) (-2·2 to -3·4)
Uzbekistan 14·0 3·4 10·9 8·1 35·9 22·3 -0·9 -2·6 -1·9(12·5 to 15·5) (3·0 to 3·8) (9·0 to 13·1) (6·2 to 10·3) (32·5 to 39·9) (20·2 to 24·8) (0·0 to -1·8) (-1·7 to -3·7) (-1·4 to -2·4)
PAHO
Bolivia 13·1 4·1 15·5 9·9 41·9 11·4 -4·5 -3·9 -4·2(12·0 to 14·2) (3·8 to 4·4) (13·3 to 17·8) (7·5 to 12·9) (39·0 to 45·2) (10·7 to 12·3) (-4·0 to -5·1) (-3·2 to -4·5) (-3·8 to -4·5)
Brazil 7·5 2·6 6·1 1·9 18·0 54·1 -5·1 -4·3 -4·6(6·6 to 8·4) (2·4 to 2·7) (5·4 to 6·9) (1·3 to 2·7) (16·6 to 19·7) (49·8 to 59·0) (-4·3 to -6·0) (-3·5 to -5·1) (-4·2 to -5·1)
Guatemala 6·5 2·8 10·4 8·6 28·1 13·3 -4·0 -4·6 -4·3(5·9 to 7·3) (2·6 to 3·0) (8·8 to 12·2) (6·9 to 10·7) (25·5 to 30·9) (12·1 to 14·7) (-3·0 to -4·9) (-3·7 to -5·5) (-3·9 to -4·8)
Haiti 16·7 8·8 25·4 16·9 66·1 17·4 -4·0 -3·0 -3·5(14·7 to 18·8) (7·6 to 10·4) (20·6 to 31·4) (11·7 to 22·9) (56·8 to 77·6) (14·9 to 20·5) (-3·3 to -4·8) (-1·8 to -4·2) (-2·8 to -4·2)
Mexico 5·8 2·4 5·6 3·1 16·8 38·1 -4·6 -3·6 -4·0(5·1 to 6·6) (2·2 to 2·6) (4·8 to 6·6) (2·3 to 3·8) (15·3 to 18·6) (34·7 to 42·0) (-3·6 to -5·7) (-2·6 to -4·5) (-3·5 to -4·5)
Peru 8·0 2·7 6·6 4·9 22·0 13·2 -6·4 -4·5 -5·3(7·1 to 8·9) (2·6 to 2·8) (5·7 to 7·6) (3·7 to 6·3) (20·5 to 23·8) (12·3 to 14·3) (-5·7 to -6·9) (-3·8 to -5·1) (-4·9 to -5·7)
SEARO
Bangladesh19·3 5·4 9·0 7·6 40·8 128·2 -4·7 -5·6 -5·2
(17·6 to 21·1) (4·8 to 6·2) (7·5 to 10·8) (5·8 to 9·8) (36·9 to 45·4) (116·0 to 142·7) (-4·3 to -5·1) (-4·7 to -6·4) (-4·7 to -5·6)
DPR Korea 8·8 2·0 5·5 5·1 21·2 7·6 -2·1 -5·7 -4·1(6·8 to 10·9) (1·7 to 2·3) (3·9 to 7·5) (3·5 to 7·2) (17·2 to 26·3) (6·1 to 9·4) (-0·1 to -4·0) (-3·9 to -7·5) (-2·9 to -5·4)
India22·4 5·7 12·0 9·6 48·8 1249·7 -3·0 -4·3 -3·7
(20·4 to 24·5) (4·9 to 6·8) (10·0 to 14·6) (7·1 to 12·9) (43·1 to 56·4) (1103·8 to 1443·7) (-2·7 to -3·4) (-3·2 to -5·1) (-3·1 to -4·3)
Indonesia11·1 3·8 10·0 7·0 31·5 148·8 -4·7 -4·1 -4·4
(9·9 to 12·3) (3·4 to 4·3) (8·2 to 12·3) (5·2 to 9·0) (28·1 to 35·6) (132·2 to 168·2) (-4·1 to -5·3) (-3·1 to -5·1) (-3·8 to -4·9)
Myanmar 14·3 3·9 11·1 8·3 37·1 34·1 -3·5 -5·5 -4·6(12·7 to 16·1) (3·2 to 4·7) (8·4 to 14·6) (5·6 to 11·8) (31·6 to 43·7) (29·0 to 40·2) (-1·6 to -5·6) (-3·7 to -7·1) (-3·7 to -5·5)
Nepal 17·7 4·3 9·2 7·0 37·7 22·2 -5·4 -6·1 -5·8(16·1 to 19·4) (3·8 to 5·0) (7·6 to 11·2) (5·2 to 9·1) (33·9 to 42·1) (20·0 to 24·9) (-5·0 to -5·9) (-5·2 to -6·9) (-5·3 to -6·3)
WPRO
Cambodia 15·5 4·8 15·6 7·9 43·2 16·7 -1·4 -6·6 -4·3(14·0 to 17·1) (4·1 to 5·6) (12·4 to 19·0) (5·6 to 10·5) (37·4 to 49·5) (14·4 to 19·2) (-0·6 to -2·1) (-5·3 to -7·7) (-3·6 to -5·0)
China4·9 1·4 3·5 3·2 13·0 238·8 -4·7 -8·1 -6·6
(4·3 to 5·5) (1·3 to 1·6) (2·9 to 4·1) (2·3 to 4·2) (12·0 to 13·8) (220·9 to 256·0) (-3·9 to -5·5) (-7·4 to -8·7) (-6·2 to -7·0)
Lao PDR 18·6 6·7 20·6 16·7 61·3 11·1 -2·6 -5·3 -4·1(16·6 to 20·7) (5·6 to 7·8) (16·2 to 25·5) (11·8 to 23·8) (52·8 to 69·4) (9·5 to 12·6) (-1·5 to -3·8) (-4·1 to -6·6) (-3·5 to -4·9)
Papua New Guinea
17·1 5·3 19·9 15·8 57·0 12·0 -1·4 -2·8 -2·2(13·6 to 21·7) (3·3 to 8·3) (11·5 to 30·6) (7·5 to 30·5) (36·7 to 86·4) (7·7 to 18·1) (0·9 to -3·6) (-0·1 to -5·4) (-0·3 to -4·1)
Philippines 9·9 2·6 6·9 8·2 27·3 65·1 -3·3 -2·7 -3·0(8·4 to 11·3) (2·3 to 3·0) (5·4 to 8·9) (6·2 to 10·7) (23·2 to 32·2) (55·4 to 76·9) (-2·3 to -4·3) (-1·3 to -4·2) (-2·2 to -3·7)
Solomon Islands
9·0 2·2 5·8 5·0 21·8 0·4 -2·7 -3·1 -2·9(5·0 to 13·5) (1·5 to 3·2) (3·3 to 10·9) (2·8 to 8·4) (13·2 to 35·1) (0·2 to 0·6) (0·2 to -5·6) (0·4 to -6·0) (-0·8 to -5·1)
Viet Nam 6·9 2·6 3·7 5·4 18·6 26·6 -5·0 -3·4 -4·1(5·4 to 8·5) (2·4 to 2·9) (3·0 to 4·6) (4·1 to 7·1) (15·8 to 21·9) (22·6 to 31·5) (-3·7 to -6·2) (-1·9 to -5·1) (-3·3 to -4·8)
Source: Wang et al, 2014. Global, regional, and national levels of neonatal, infant, and under-5 mortality during 1990–2013, Global Burden of Disease Study 2013. Lancet.
35Achievements and Prospects
2. Progress in Women’s and Children’s Health in Countries

Figure 1. Trends in child mortality in the 75 iERG countries, by average annual rate of reduction, 2000-2012
-1.9
0.5
3.8
3.4
2.3
3.4
0.2
6.2
6.9
6.4
4.9
3.4
1.9
-3.2
2.5
3.6
5.5
1.3
4.6
3.8
3.5
3.4
0.8
3.3
5.2
1.4
4.7
3.4
3.1
2.0
-2.0
1.8
4.6
3.2
2.5
3.8
-5.8
4.6
10.0
8.5
8.1
7.5
7.4
7.1
7.1
6.9
6.5
6.4
6.4
6.3
6.3
6.1
6.0
5.8
5.7
5.4
5.3
5.2
5.2
5.1
5.0
4.6
4.5
4.5
4.4
4.4
4.3
4.2
4.2
4.1
4.0
4.0
4.0
3.9
3.9
3.8
-6.0 -4.0 -2.0 0.0 2.0 4.0 6.0 8.0 10.0
Rwanda
Cambodia
China
Malawi
United Rep. of Tanzania
Liberia
Senegal
Brazil
Peru
Egypt
Bangladesh
Ethiopia
Uganda
DPR Korea
Azerbaijan
Niger
Nepal
Zambia
Bolivia
Madagascar
Kyrgyzstan
Mozambique
Burkina Faso
South Sudan
Eritrea
Mali
Indonesia
Guinea
Lao PDR
Benin
South Africa
Sao Tome and Principe
Morocco
India
Yemen
Gambia
Botswana
Guatemala
Average annual rate of reduction in under-five mortality (%)
Average annual rate of reduction (%), 1990-2000 Average annual rate of reduction (%), 2000-2012MDG4 target (4.4%)
36 Achievements and Prospects
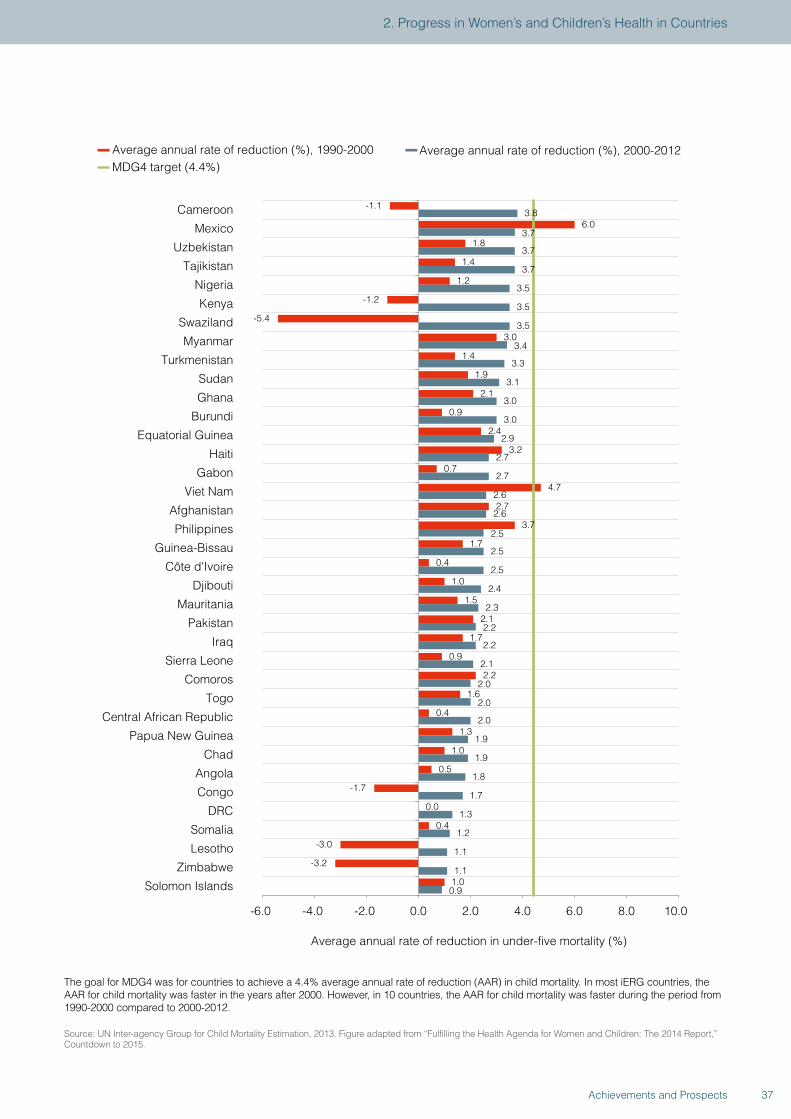
Average annual rate of reduction in under-five mortality (%)
Average annual rate of reduction (%), 1990-2000 Average annual rate of reduction (%), 2000-2012MDG4 target (4.4%)
-1.1
6.0
1.8
1.4
1.2
-1.2
-5.4
3.0
1.4
1.9
2.1
0.9
2.4
3.2
0.7
4.7
2.7
3.7
1.7
0.4
1.0
1.5
2.1
1.7
0.9
2.2
1.6
0.4
1.3
1.0
0.5
-1.7
0.0
0.4
-3.0
-3.2
1.0
3.8
3.7
3.7
3.7
3.5
3.5
3.5
3.4
3.3
3.1
3.0
3.0
2.9
2.7
2.7
2.6
2.6
2.5
2.5
2.5
2.4
2.3
2.2
2.2
2.1
2.0
2.0
2.0
1.9
1.9
1.8
1.7
1.3
1.2
1.1
1.1
0.9
-6.0 -4.0 -2.0 0.0 2.0 4.0 6.0 8.0 10.0
Cameroon
Mexico
Uzbekistan
Tajikistan
Nigeria
Kenya
Swaziland
Myanmar
Turkmenistan
Sudan
Ghana
Burundi
Equatorial Guinea
Haiti
Gabon
Viet Nam
Afghanistan
Philippines
Guinea-Bissau
Côte d'Ivoire
Djibouti
Mauritania
Pakistan
Iraq
Sierra Leone
Comoros
Togo
Central African Republic
Papua New Guinea
Chad
Angola
Congo
DRC
Somalia
Lesotho
Zimbabwe
Solomon Islands
The goal for MDG4 was for countries to achieve a 4.4% average annual rate of reduction (AAR) in child mortality. In most iERG countries, the AAR for child mortality was faster in the years after 2000. However, in 10 countries, the AAR for child mortality was faster during the period from 1990-2000 compared to 2000-2012.
Source: UN Inter-agency Group for Child Mortality Estimation, 2013. Figure adapted from “Fulfilling the Health Agenda for Women and Children: The 2014 Report,” Countdown to 2015.
37Achievements and Prospects
2. Progress in Women’s and Children’s Health in Countries
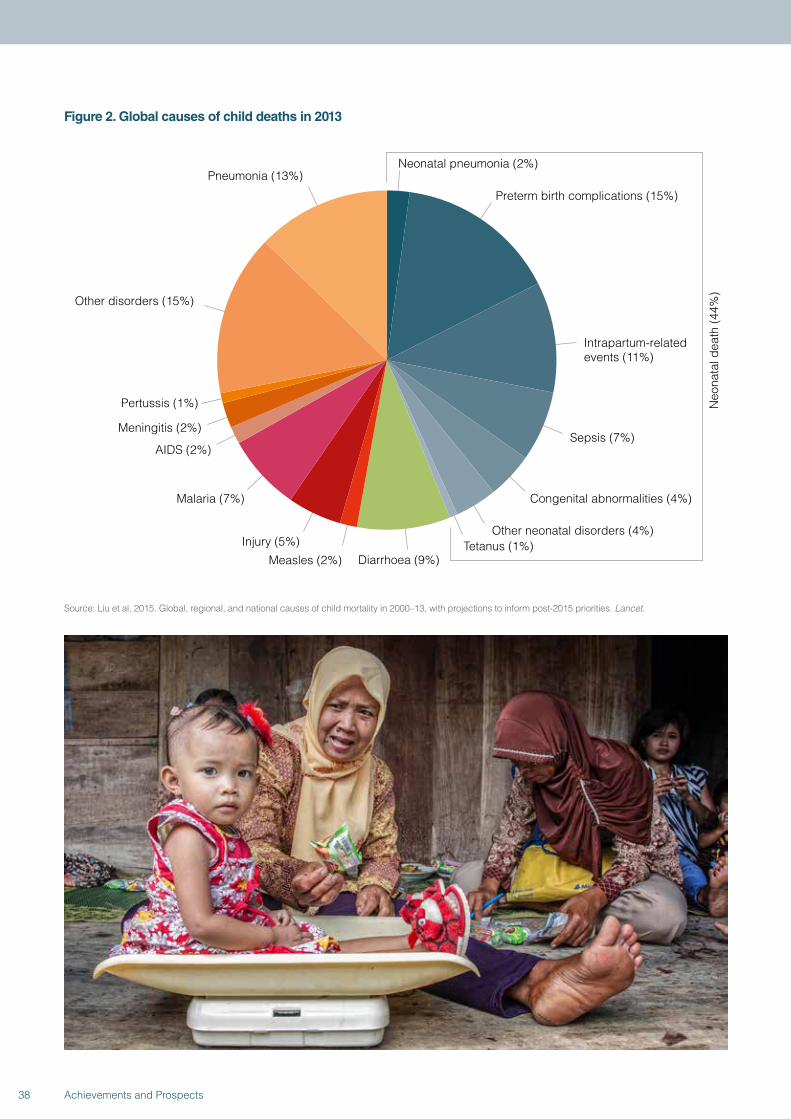
Figure 2. Global causes of child deaths in 2013
Neonatal pneumonia (2%)
Preterm birth complications (15%)
Intrapartum-related events (11%)
Sepsis (7%)
Congenital abnormalities (4%)
Other neonatal disorders (4%)
Diarrhoea (9%) Measles (2%)
Injury (5%)
Malaria (7%)
AIDS (2%)
Meningitis (2%)
Pertussis (1%)
Other disorders (15%)
Pneumonia (13%)
Tetanus (1%)
Neo
nata
l dea
th (4
4%)
Source: Liu et al, 2015. Global, regional, and national causes of child mortality in 2000–13, with projections to inform post-2015 priorities. Lancet.
38 Achievements and Prospects
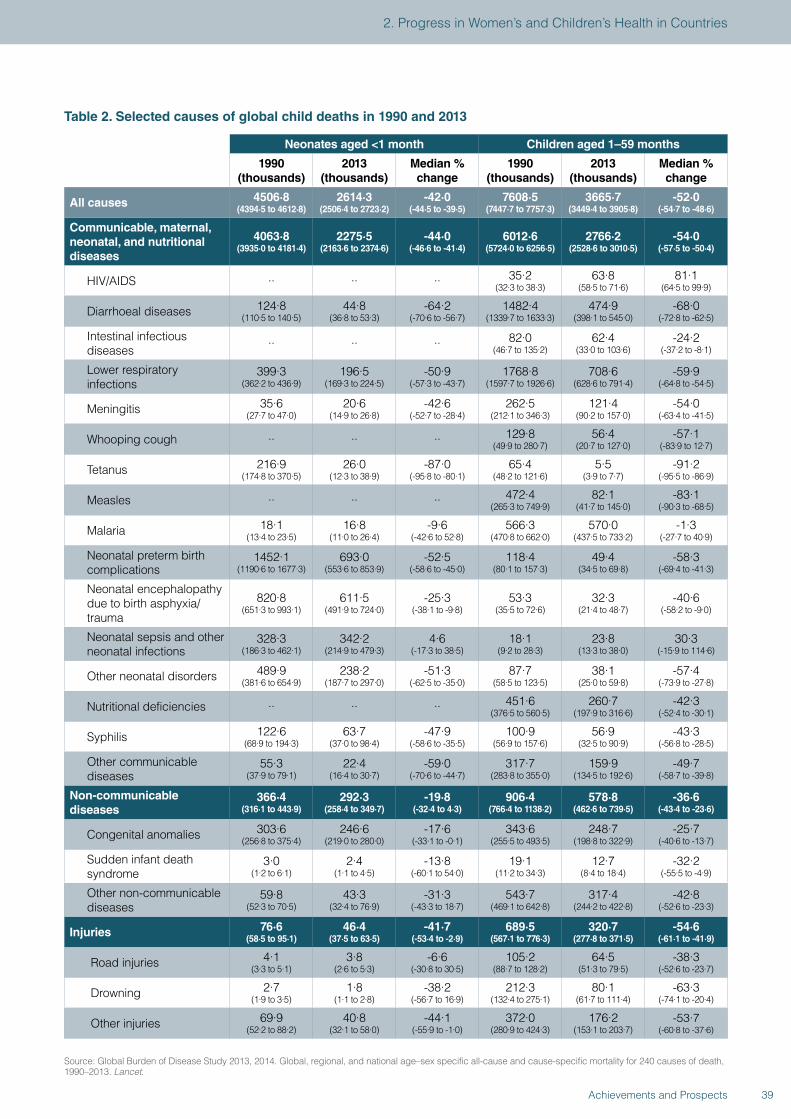
Table 2. Selected causes of global child deaths in 1990 and 2013
Neonates aged <1 month Children aged 1–59 months
1990 (thousands)
2013 (thousands)
Median % change
1990 (thousands)
2013 (thousands)
Median % change
All causes 4506·8 (4394·5 to 4612·8)
2614·3 (2506·4 to 2723·2)
-42·0 (-44·5 to -39·5)
7608·5 (7447·7 to 7757·3)
3665·7 (3449·4 to 3905·8)
-52·0 (-54·7 to -48·6)
Communicable, maternal, neonatal, and nutritional diseases
4063·8 (3935·0 to 4181·4)
2275·5 (2163·6 to 2374·6)
-44·0 (-46·6 to -41·4)
6012·6 (5724·0 to 6256·5)
2766·2 (2528·6 to 3010·5)
-54·0 (-57·5 to -50·4)
HIV/AIDS ·· ·· ·· 35·2 (32·3 to 38·3)
63·8 (58·5 to 71·6)
81·1 (64·5 to 99·9)
Diarrhoeal diseases 124·8 (110·5 to 140·5)
44·8 (36·8 to 53·3)
-64·2 (-70·6 to -56·7)
1482·4 (1339·7 to 1633·3)
474·9 (398·1 to 545·0)
-68·0 (-72·8 to -62·5)
Intestinal infectious diseases ·· ·· ·· 82·0
(46·7 to 135·2)62·4
(33·0 to 103·6)-24·2
(-37·2 to -8·1)
Lower respiratory infections
399·3 (362·2 to 436·9)
196·5 (169·3 to 224·5)
-50·9 (-57·3 to -43·7)
1768·8 (1597·7 to 1926·6)
708·6 (628·6 to 791·4)
-59·9 (-64·8 to -54·5)
Meningitis 35·6 (27·7 to 47·0)
20·6 (14·9 to 26·8)
-42·6 (-52·7 to -28·4)
262·5 (212·1 to 346·3)
121·4 (90·2 to 157·0)
-54·0 (-63·4 to -41·5)
Whooping cough ·· ·· ·· 129·8 (49·9 to 280·7)
56·4 (20·7 to 127·0)
-57·1 (-83·9 to 12·7)
Tetanus 216·9 (174·8 to 370·5)
26·0 (12·3 to 38·9)
-87·0 (-95·8 to -80·1)
65·4 (48·2 to 121·6)
5·5 (3·9 to 7·7)
-91·2 (-95·5 to -86·9)
Measles ·· ·· ·· 472·4 (265·3 to 749·9)
82·1 (41·7 to 145·0)
-83·1 (-90·3 to -68·5)
Malaria 18·1 (13·4 to 23·5)
16·8 (11·0 to 26·4)
-9·6 (-42·6 to 52·8)
566·3 (470·8 to 662·0)
570·0 (437·5 to 733·2)
-1·3 (-27·7 to 40·9)
Neonatal preterm birth complications
1452·1 (1190·6 to 1677·3)
693·0 (553·6 to 853·9)
-52·5 (-58·6 to -45·0)
118·4 (80·1 to 157·3)
49·4 (34·5 to 69·8)
-58·3 (-69·4 to -41·3)
Neonatal encephalopathy due to birth asphyxia/trauma
820·8 (651·3 to 993·1)
611·5 (491·9 to 724·0)
-25·3 (-38·1 to -9·8)
53·3 (35·5 to 72·6)
32·3 (21·4 to 48·7)
-40·6 (-58·2 to -9·0)
Neonatal sepsis and other neonatal infections
328·3 (186·3 to 462·1)
342·2 (214·9 to 479·3)
4·6 (-17·3 to 38·5)
18·1 (9·2 to 28·3)
23·8 (13·3 to 38·0)
30·3 (-15·9 to 114·6)
Other neonatal disorders 489·9 (381·6 to 654·9)
238·2 (187·7 to 297·0)
-51·3 (-62·5 to -35·0)
87·7 (58·5 to 123·5)
38·1 (25·0 to 59·8)
-57·4 (-73·9 to -27·8)
Nutritional deficiencies ·· ·· ·· 451·6 (376·5 to 560·5)
260·7 (197·9 to 316·6)
-42·3 (-52·4 to -30·1)
Syphilis 122·6 (68·9 to 194·3)
63·7 (37·0 to 98·4)
-47·9 (-58·6 to -35·5)
100·9 (56·9 to 157·6)
56·9 (32·5 to 90·9)
-43·3 (-56·8 to -28·5)
Other communicable diseases
55·3 (37·9 to 79·1)
22·4 (16·4 to 30·7)
-59·0 (-70·6 to -44·7)
317·7 (283·8 to 355·0)
159·9 (134·5 to 192·6)
-49·7 (-58·7 to -39·8)
Non-communicable diseases
366·4 (316·1 to 443·9)
292·3 (258·4 to 349·7)
-19·8 (-32·4 to 4·3)
906·4 (766·4 to 1138·2)
578·8 (462·6 to 739·5)
-36·6 (-43·4 to -23·6)
Congenital anomalies 303·6 (256·8 to 375·4)
246·6 (219·0 to 280·0)
-17·6 (-33·1 to -0·1)
343·6 (255·5 to 493·5)
248·7 (198·8 to 322·9)
-25·7 (-40·6 to -13·7)
Sudden infant death syndrome
3·0 (1·2 to 6·1)
2·4 (1·1 to 4·5)
-13·8 (-60·1 to 54·0)
19·1 (11·2 to 34·3)
12·7 (8·4 to 18·4)
-32·2 (-55·5 to -4·9)
Other non-communicable diseases
59·8 (52·3 to 70·5)
43·3 (32·4 to 76·9)
-31·3 (-43·3 to 18·7)
543·7 (469·1 to 642·8)
317·4 (244·2 to 422·8)
-42·8 (-52·6 to -23·3)
Injuries 76·6 (58·5 to 95·1)
46·4 (37·5 to 63·5)
-41·7 (-53·4 to -2·9)
689·5 (567·1 to 776·3)
320·7 (277·8 to 371·5)
-54·6 (-61·1 to -41·9)
Road injuries 4·1 (3·3 to 5·1)
3·8 (2·6 to 5·3)
-6·6 (-30·8 to 30·5)
105·2 (88·7 to 128·2)
64·5 (51·3 to 79·5)
-38·3 (-52·6 to -23·7)
Drowning 2·7 (1·9 to 3·5)
1·8 (1·1 to 2·8)
-38·2 (-56·7 to 16·9)
212·3 (132·4 to 275·1)
80·1 (61·7 to 111·4)
-63·3 (-74·1 to -20·4)
Other injuries 69·9 (52·2 to 88·2)
40·8 (32·1 to 58·0)
-44·1 (-55·9 to -1·0)
372·0 (280·9 to 424·3)
176·2 (153·1 to 203·7)
-53·7 (-60·8 to -37·6)
Source: Global Burden of Disease Study 2013, 2014. Global, regional, and national age–sex specific all-cause and cause-specific mortality for 240 causes of death, 1990–2013. Lancet.
39Achievements and Prospects
2. Progress in Women’s and Children’s Health in Countries
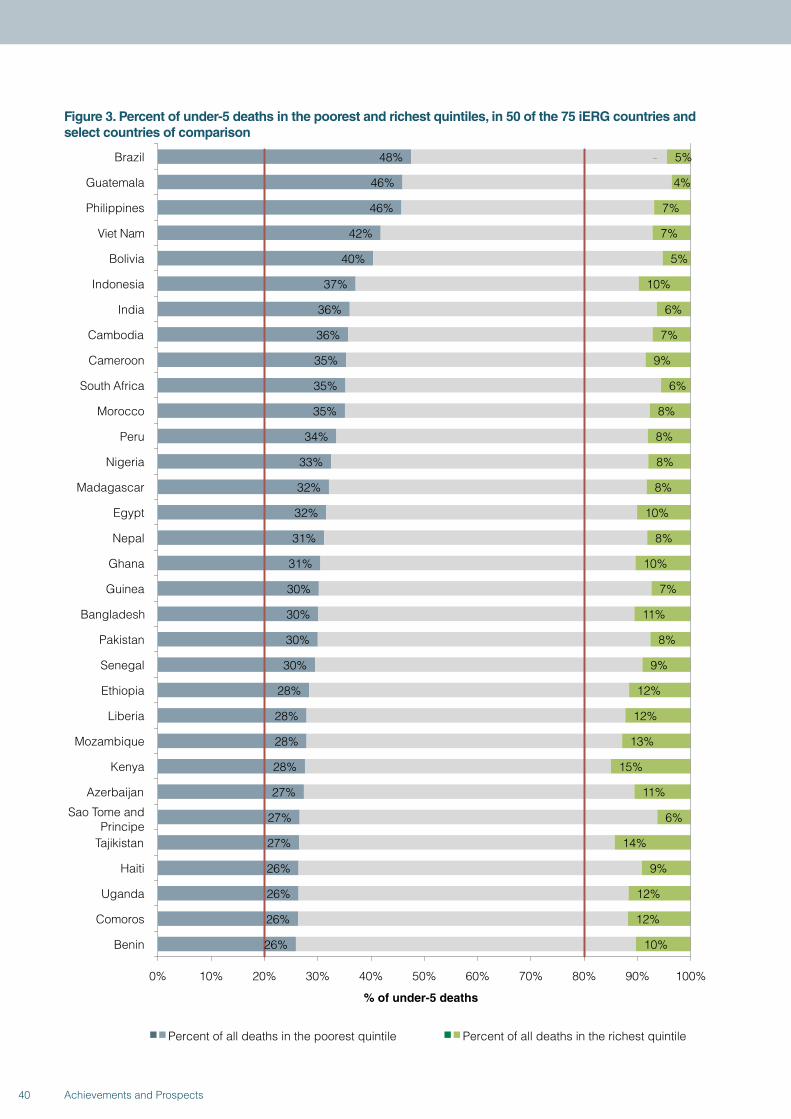
Figure 3. Percent of under-5 deaths in the poorest and richest quintiles, in 50 of the 75 iERG countries and select countries of comparison
48%
46%
46%
42%
40%
37%
36%
36%
35%
35%
35%
34%
33%
32%
32%
31%
31%
30%
30%
30%
30%
28%
28%
28%
28%
27%
27%
27%
26%
26%
26%
26%
5%
4%
7%
7%
5%
10%
6%
7%
9%
6%
8%
8%
8%
8%
10%
8%
10%
7%
11%
8%
9%
12%
12%
13%
15%
11%
6%
14%
9%
12%
12%
10%
0% 10% 20% 30% 40% 50% 60% 70% 80% 90% 100%
Brazil
Guatemala
Philippines
Viet Nam
Bolivia
Indonesia
India
Cambodia
Cameroon
South Africa
Morocco
Peru
Nigeria
Madagascar
Egypt
Nepal
Ghana
Guinea
Bangladesh
Pakistan
Senegal
Ethiopia
Liberia
Mozambique
Kenya
Azerbaijan
Sao Tome and Principe
Tajikistan
Haiti
Uganda
Comoros
Benin
% of under-5 deaths
Percent of all deaths in the poorest quintile Percent of all deaths in the richest quintile
40 Achievements and Prospects
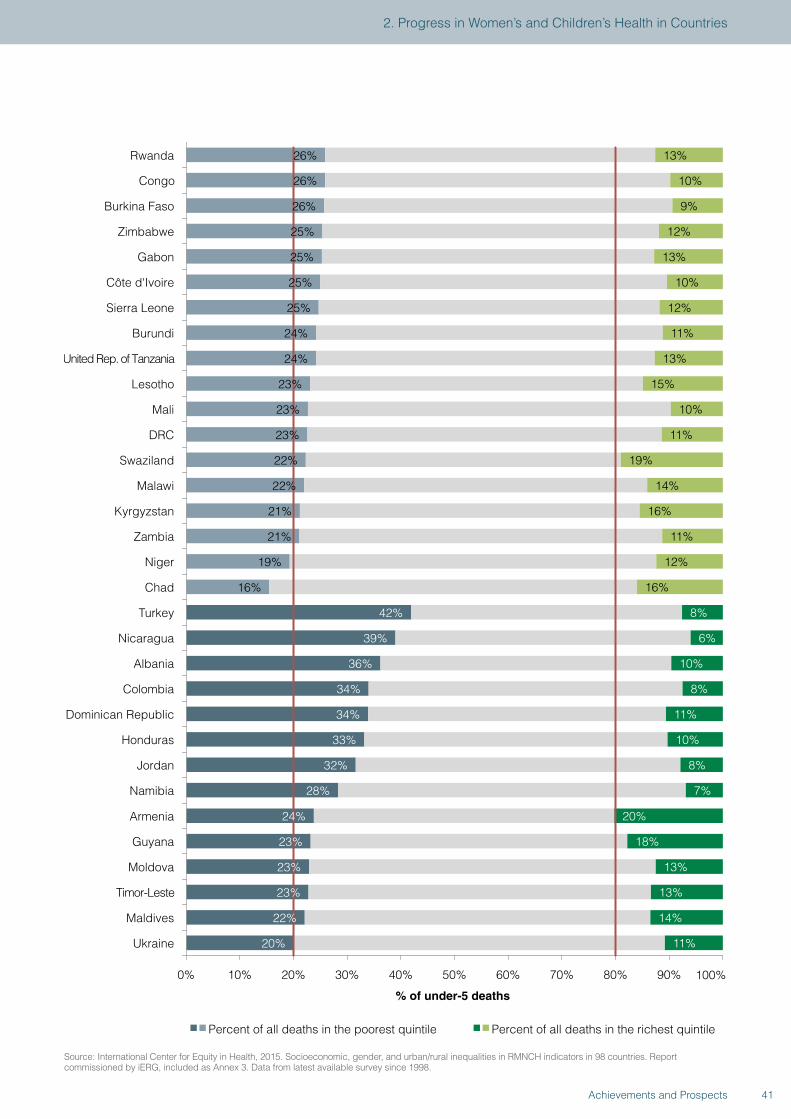
10% Congo
26%
26%
25%
25%
25%
25%
24%
24%
23%
23%
23%
22%
22%
21%
21%
19%
16%
42%
39%
36%
34%
34%
33%
32%
28%
24%
23%
23%
23%
22%
20%
13%
9%
12%
13%
10%
12%
11%
13%
15%
10%
11%
19%
14%
16%
11%
12%
16%
8%
6%
10%
8%
11%
10%
8%
7%
20%
18%
13%
13%
14%
11%
0% 10% 20% 30% 40% 50% 60% 70% 80% 90% 100%
Rwanda
Burkina Faso
Zimbabwe
Gabon
Côte d'Ivoire
Sierra Leone
Burundi
United Rep. of Tanzania
Lesotho
Mali
DRC
Swaziland
Malawi
Kyrgyzstan
Zambia
Niger
Chad
Turkey
Nicaragua
Albania
Colombia
Dominican Republic
Honduras
Jordan
Namibia
Armenia
Guyana
Moldova
Timor-Leste
Maldives
Ukraine
% of under-5 deaths
Percent of all deaths in the poorest quintile Percent of all deaths in the richest quintile
26%
Source: International Center for Equity in Health, 2015. Socioeconomic, gender, and urban/rural inequalities in RMNCH indicators in 98 countries. Report commissioned by iERG, included as Annex 3. Data from latest available survey since 1998.
41Achievements and Prospects
2. Progress in Women’s and Children’s Health in Countries
12. For maternal mortality (MDG-5a), the GBD study has reported estimates for 2013: 292 982 deaths, compared with 376 034 deaths in 1990 (15). Table 3 shows their maternal mortality data for the 75 iERG countries of concern. Figure 4 shows data from the Maternal Mortality Estimate Interagency Group, with trends in maternal mortality in the 75 iERG countries. These data are divided by average annual rate of reduction for two periods: 1990-2000 and 2000-2013. Although not universally consistent, one can see many examples of acceleration in reductions in maternal mortality (in 56 countries, although with 19 nations showing decadal decelerations in progress). Figure 5 shows countries ranked by reduction trends in under-5 and maternal mortality, from best to worst. Countries that rank highly on both measures fall into the lower left of the diagram. If rankings on under-5 and maternal mortality were highly correlated, the points in the figure would cluster along the 45 degree line, which they quite evidently do not. The fact that they are as scattered as they are suggests that very different policies and influences may be affecting success in these two domains.
Much has been said about China’s one-child policy, and concerns raised about human rights. China’s response to critics has been to defend its achievements in social and economic development and the important role of its population policy therein. China has now entered a new phase of below-replacement fertility which may be hard to reverse. Some social and demographic impacts of the one-child policy will have long lasting societal consequences—notably the sex ratio at birth in favor of males and the high dependency ratio of the elderly to working age population—possibly undermining China’s economic competitiveness. Other negative effects are also ongoing, including new forms of discrimination against women and girls. The widening economic and social disparities lead to urban and rural poverty and concomitant health problems, environmental pollution, rapid urbanization, and changing youth sexual behavior and reproductive attitudes. This last point means a new threat of sexually transmitted infectious diseases such as HIV/AIDS.
China: Impressive efforts to improve maternal and child health
With one of the most successful stories of improvements to maternal and child health, China has made impressive strides in reducing its under-5 mortality rate (U5MR) and maternal mortality ratio (MMR) in the past 25 years. U5MR declined from 59 per 1000 live births in 1990 to 13 per 1000 in 2013 (1). In fact, by all accounts, China achieved the MDG-4 target of reducing U5MR by two-thirds from its 1990 level well before 2015 (1-3). A similar reduction in MMR has also been observed, with a decrease from 141.7 per 100 000 live births to 17.2 per 100 000 in the same period (4). Improvements in U5MR and MMR have accelerated since the 1995 passage of the Law of the People’s Republic of China on the Maternal and Infant Health Care.
Studies have pointed to the importance of social policy, public health policy, and investment in the public health sector in reducing U5MR and MMR. The specific policies and programmes implemented by the Chinese government, aimed at increasing investment in mothers and children, have played a key part in China’s success. Its compulsory nine-year education policy has helped to improve the average maternal education level from 5.8 years in 1990 to 9.2 years in 2013 (5). There are important links between maternal education and maternal and child health (5,6). For example, higher maternal education level alone
accounted for 15.3% of the reduction in under-5 deaths from 1990 to 2013 (1).
Even after controlling for improvements in income and education, a significant proportion of counties in China have shown a faster decline in U5MR than was to be expected given their level of socioeconomic development, which suggests that a greater part was played by public health policy and intervention programmes (7). Many effective interventions to reduce maternal and under-5 mortality have been carried out since the early 2000s. The “Reducing Maternal Mortality and Eliminate Neonatal Tetanus” programme, introduced in 2000, had been implemented in over 2200 counties by 2012, especially in economically backward regions of China (8). In close collaboration with international agencies (including WHO, UNICEF, UNFPA, and the World Bank), many other interventions have been implemented at the sub-national and national levels in the past two decades, including: baby-friendly hospitals; free services to improve children’s physical and mental health; conditional cash transfers to women giving birth in hospitals; strengthening maternal, child and reproductive health services at the grassroots level; treating acute respiratory infection in children; and improving essential health services in poor rural areas (9).
42 Achievements and Prospects
However, substantial health disparities still remain within China. For example, a recent study shows U5MR in 2012 ranged from 3.3 per 1000 live births in Huangpu District of Shanghai to 104.4 per 1000 in Zamtang County of Sichuan (7). This regional heterogeneity, and similar disparities by urbanicity and income level, means that in order to achieve further reductions in U5MR and MMR, much larger investments are required from governments at all levels, together with continued efforts by policy makers to direct resources to regions that are lagging behind. Local governments have played a pivotal part in improving maternal and child health in the recent past, but the decentralised financing of public health programmes has had a negative impact on many interventions at the local level (10). A more coordinated financing strategy, emphasising the roles of both central and provincial governments, is needed to minimise the gap between sub-national regions within China, as well as the gap between China and high-income countries.
Indeed, the Chinese government is taking significant steps to further improve the health of its population. In 2009, the then Ministry of Health (now the National Health and Family Planning Commission) announced a comprehensive reform of the health system, in recognition of the inequality and inefficiency of health services in China. While the impact of those reforms, especially the establishment and expansion of the New Rural Cooperative Medical Scheme, remains to be seen, they are likely to help further reduce maternal and child mortality in China, given their emphasis on providing essential public health services.
In summary, while China has made significance progress in improving maternal and child health, disparities remain among regions, between urban and rural areas, and by income level. To minimise these gaps and further improve the well-being of mothers and children, both society and government need to make a concerted effort to ensure that maternal and child health remains one of the country’s top public health priorities.
References
1. Wang H, Liddell CA, Coates MM, et al. Global, regional, and national levels of neonatal, infant, and under-5 mortality during 1990–2013: a systematic analysis for the Global Burden of Disease Study 2013. Lancet 2014; 384: 957–79.
2. UNICEF. Levels and trends in child mortality report 2014. Estimates developed by the UN Inter-agency Group for Child Mortality Estimation. New York: United Nations Children’s Fund, 2014.
3. Rudan I, Chan KY, Zhang JSF, et al. Causes of deaths in children younger than 5 years in China in 2008. Lancet 2010; 375: 1083–89.
4. Kassebaum NJ, Bertozzi-Villa A, Coggeshall MS, et al. Global, regional, and national levels and causes of maternal mortality during 1990–2013: a systematic analysis for the Global Burden of Disease Study 2013. Lancet 2014; 384: 980–1004.
5. Gakidou E, Cowling K, Lozano R, Murray CJ. Increased educational attainment and its effect on child mortality in 175 countries between 1970 and 2009: a systematic analysis. Lancet 2010; 376: 959–74.
6. Veneman AM. Education is key to reducing child mortality: the link between maternal health and education. UN Chronical 2007; 44: 58–59.
7. Wang Y, Li X, Zhou M, Luo S, et al. Child mortality in 2851 Chinese counties, 1996–2012: Rapid progress but remaining inequality. Lancet 2015 (in press).
8. Liang J, Li X, Dai L, et al. The changes in maternal mortality in 1000 counties in mid-western China by a government-initiated intervention. PLoS ONE 2012; 7: e37458.
9. UNICEF, WHO, UNFPA. Joint review of the maternal and child survival strategies in China. Beijing: Ministry of Health of the People’s Republic of China, United Nations Children’s Fund, World Health Organization, and United Nations Population Fund, 2006.
10. Brixi H, Mu Y, Targa B, Hipgrave D. Equity and public governance in health system reform: challenges and opportunities for China. Washington, DC: World Bank, 2011. http://elibrary.worldbank.org/doi/book/10.1596/1813-9450-5530 (accessed Feb 5, 2015).
43Achievements and Prospects
2. Progress in Women’s and Children’s Health in Countries

Figure 4. Trends in maternal mortality in the 75 iERG countries, by average annual rate of reduction, 2000-2013
2.8
7.7
6.1
6.6
1.4
3.1
2.9
5.8
0.4
-0.7
-0.5
4.6
0.7
-2.6
4.2
1.7
4.1
4.1
4.7
1.9
8.7
4.6
1.2
3.6
2.0
4.9
0.6
4.3
4.4
3.2
3.3
4.5
4.1
1.2
2.7
3.2
1.0
2.8
8.6
8.4
7.4
7.4
7.2
6.4
6.4
6.1
6.0
6.0
5.7
5.4
5.3
5.3
5.1
4.8
4.7
4.5
4.3
4.3
4.2
4.2
4.0
4.0
4.0
3.9
3.9
3.9
3.8
3.8
3.7
3.6
3.6
3.4
3.4
3.4
3.2
3.1
-4.0 -2.0 0.0 2.0 4.0 6.0 8.0 10.0
Rwanda
Cambodia
Lao PDR
Equatorial Guinea
Afghanistan
Ethiopia
Angola
Nepal
Azerbaijan
Botswana
Zambia
Bangladesh
Sierra Leone
Tajikistan
China
United Rep. of Tanzania
India
Mozambique
Myanmar
Uganda
Eritrea
Peru
Liberia
South Sudan
Nigeria
Viet Nam
Swaziland
Morocco
Egypt
Indonesia
Pakistan
Bolivia
Solomon Islands
Djibouti
Mali
Papua New Guinea
Chad
Sudan
Average annual rate of reduction in maternal mortality (%)
Average annual rate of reduction (%), 1990-2000 Average annual rate of reduction (%), 2000-2013MDG5 target (5.5%)
44 Achievements and Prospects
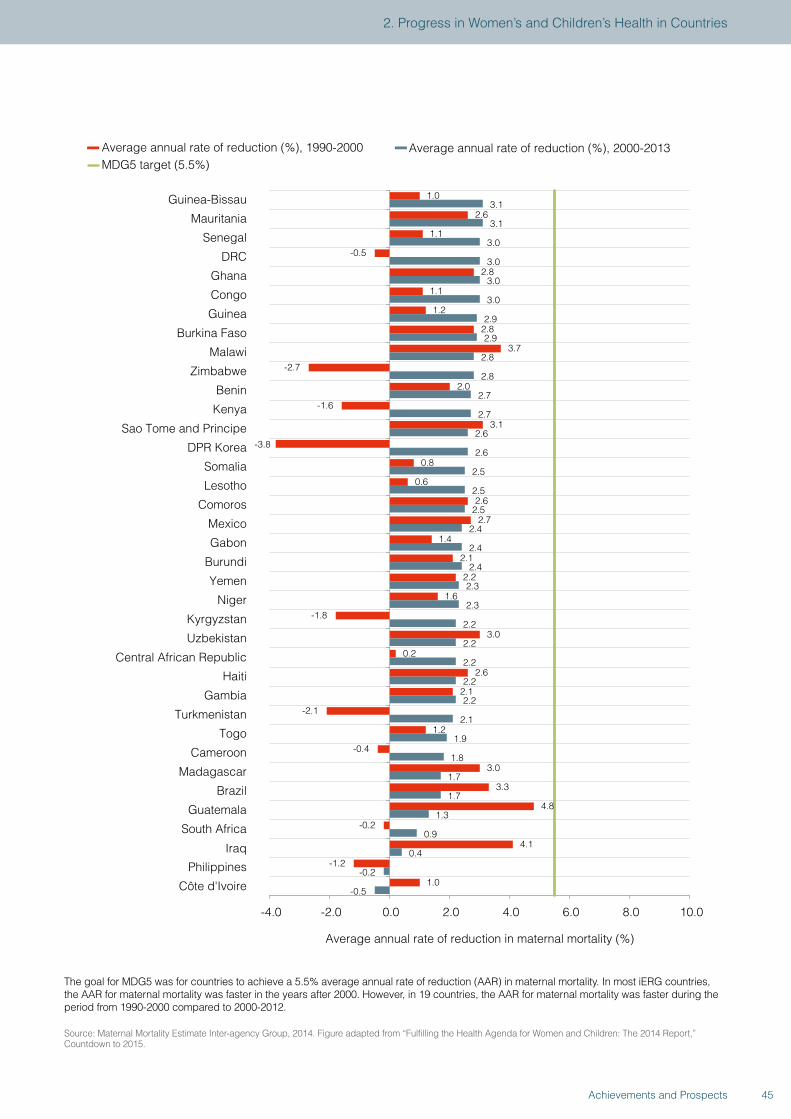
1.0
2.6
1.1
-0.5
2.8
1.1
1.2
2.8
3.7
-2.7
2.0
-1.6
3.1
-3.8
0.8
0.6
2.6
2.7
1.4
2.1
2.2
1.6
-1.8
3.0
0.2
2.6
2.1
-2.1
1.2
-0.4
3.0
3.3
4.8
-0.2
4.1
-1.2
1.0
3.1
3.1
3.0
3.0
3.0
3.0
2.9
2.9
2.8
2.8
2.7
2.7
2.6
2.6
2.5
2.5
2.5
2.4
2.4
2.4
2.3
2.3
2.2
2.2
2.2
2.2
2.2
2.1
1.9
1.8
1.7
1.7
1.3
0.9
0.4
-0.2
-0.5
-4.0 -2.0 0.0 2.0 4.0 6.0 8.0 10.0
Guinea-Bissau
Mauritania
Senegal
DRC
Ghana
Congo
Guinea
Burkina Faso
Malawi
Zimbabwe
Benin
Kenya
Sao Tome and Principe
DPR Korea
Somalia
Lesotho
Comoros
Mexico
Gabon
Burundi
Yemen
Niger
Kyrgyzstan
Uzbekistan
Central African Republic
Haiti
Gambia
Turkmenistan
Togo
Cameroon
Madagascar
Brazil
Guatemala
South Africa
Iraq
Philippines
Côte d'Ivoire
Average annual rate of reduction in maternal mortality (%)
Average annual rate of reduction (%), 1990-2000 Average annual rate of reduction (%), 2000-2013MDG5 target (5.5%)
The goal for MDG5 was for countries to achieve a 5.5% average annual rate of reduction (AAR) in maternal mortality. In most iERG countries, the AAR for maternal mortality was faster in the years after 2000. However, in 19 countries, the AAR for maternal mortality was faster during the period from 1990-2000 compared to 2000-2012.
Source: Maternal Mortality Estimate Inter-agency Group, 2014. Figure adapted from “Fulfilling the Health Agenda for Women and Children: The 2014 Report,” Countdown to 2015.
45Achievements and Prospects
2. Progress in Women’s and Children’s Health in Countries
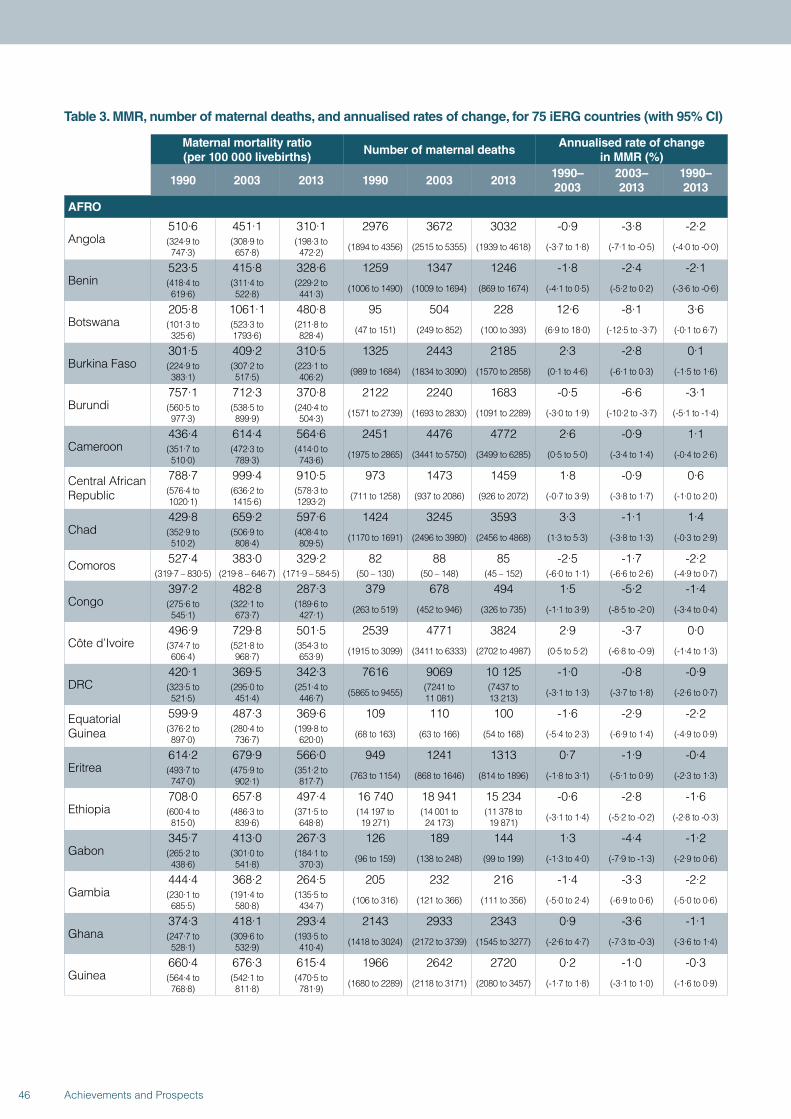
Table 3. MMR, number of maternal deaths, and annualised rates of change, for 75 iERG countries (with 95% CI)
Maternal mortality ratio (per 100 000 livebirths)
Number of maternal deathsAnnualised rate of change
in MMR (%)
1990 2003 2013 1990 2003 20131990–2003
2003–2013
1990–2013
AFRO
Angola510·6 451·1 310·1 2976 3672 3032 -0·9 -3·8 -2·2(324·9 to 747·3)
(308·9 to 657·8)
(198·3 to 472·2) (1894 to 4356) (2515 to 5355) (1939 to 4618) (-3·7 to 1·8) (-7·1 to -0·5) (-4·0 to -0·0)
Benin523·5 415·8 328·6 1259 1347 1246 -1·8 -2·4 -2·1(418·4 to 619·6)
(311·4 to 522·8)
(229·2 to 441·3) (1006 to 1490) (1009 to 1694) (869 to 1674) (-4·1 to 0·5) (-5·2 to 0·2) (-3·6 to -0·6)
Botswana205·8 1061·1 480·8 95 504 228 12·6 -8·1 3·6(101·3 to 325·6)
(523·3 to 1793·6)
(211·8 to 828·4) (47 to 151) (249 to 852) (100 to 393) (6·9 to 18·0) (-12·5 to -3·7) (-0·1 to 6·7)
Burkina Faso301·5 409·2 310·5 1325 2443 2185 2·3 -2·8 0·1(224·9 to 383·1)
(307·2 to 517·5)
(223·1 to 406·2) (989 to 1684) (1834 to 3090) (1570 to 2858) (0·1 to 4·6) (-6·1 to 0·3) (-1·5 to 1·6)
Burundi757·1 712·3 370·8 2122 2240 1683 -0·5 -6·6 -3·1(560·5 to 977·3)
(538·5 to 899·9)
(240·4 to 504·3) (1571 to 2739) (1693 to 2830) (1091 to 2289) (-3·0 to 1·9) (-10·2 to -3·7) (-5·1 to -1·4)
Cameroon436·4 614·4 564·6 2451 4476 4772 2·6 -0·9 1·1(351·7 to 510·0)
(472·3 to 789·3)
(414·0 to 743·6) (1975 to 2865) (3441 to 5750) (3499 to 6285) (0·5 to 5·0) (-3·4 to 1·4) (-0·4 to 2·6)
Central African Republic
788·7 999·4 910·5 973 1473 1459 1·8 -0·9 0·6(576·4 to 1020·1)
(636·2 to 1415·6)
(578·3 to 1293·2) (711 to 1258) (937 to 2086) (926 to 2072) (-0·7 to 3·9) (-3·8 to 1·7) (-1·0 to 2·0)
Chad429·8 659·2 597·6 1424 3245 3593 3·3 -1·1 1·4(352·9 to 510·2)
(506·9 to 808·4)
(408·4 to 809·5) (1170 to 1691) (2496 to 3980) (2456 to 4868) (1·3 to 5·3) (-3·8 to 1·3) (-0·3 to 2·9)
Comoros 527·4 383·0 329·2 82 88 85 -2·5 -1·7 -2·2(319·7 – 830·5) (219·8 – 646·7) (171·9 – 584·5) (50 – 130) (50 – 148) (45 – 152) (-6·0 to 1·1) (-6·6 to 2·6) (-4·9 to 0·7)
Congo397·2 482·8 287·3 379 678 494 1·5 -5·2 -1·4(275·6 to 545·1)
(322·1 to 673·7)
(189·6 to 427·1) (263 to 519) (452 to 946) (326 to 735) (-1·1 to 3·9) (-8·5 to -2·0) (-3·4 to 0·4)
Côte d’Ivoire496·9 729·8 501·5 2539 4771 3824 2·9 -3·7 0·0(374·7 to 606·4)
(521·8 to 968·7)
(354·3 to 653·9) (1915 to 3099) (3411 to 6333) (2702 to 4987) (0·5 to 5·2) (-6·8 to -0·9) (-1·4 to 1·3)
DRC420·1 369·5 342·3 7616 9069 10 125 -1·0 -0·8 -0·9(323·5 to 521·5)
(295·0 to 451·4)
(251·4 to 446·7) (5865 to 9455) (7241 to
11 081)(7437 to 13 213) (-3·1 to 1·3) (-3·7 to 1·8) (-2·6 to 0·7)
Equatorial Guinea
599·9 487·3 369·6 109 110 100 -1·6 -2·9 -2·2(376·2 to 897·0)
(280·4 to 736·7)
(199·8 to 620·0) (68 to 163) (63 to 166) (54 to 168) (-5·4 to 2·3) (-6·9 to 1·4) (-4·9 to 0·9)
Eritrea614·2 679·9 566·0 949 1241 1313 0·7 -1·9 -0·4(493·7 to 747·0)
(475·9 to 902·1)
(351·2 to 817·7) (763 to 1154) (868 to 1646) (814 to 1896) (-1·8 to 3·1) (-5·1 to 0·9) (-2·3 to 1·3)
Ethiopia708·0 657·8 497·4 16 740 18 941 15 234 -0·6 -2·8 -1·6(600·4 to 815·0)
(486·3 to 839·6)
(371·5 to 648·8)
(14 197 to 19 271)
(14 001 to 24 173)
(11 378 to 19 871) (-3·1 to 1·4) (-5·2 to -0·2) (-2·8 to -0·3)
Gabon345·7 413·0 267·3 126 189 144 1·3 -4·4 -1·2(265·2 to 438·6)
(301·0 to 541·8)
(184·1 to 370·3) (96 to 159) (138 to 248) (99 to 199) (-1·3 to 4·0) (-7·9 to -1·3) (-2·9 to 0·6)
Gambia444·4 368·2 264·5 205 232 216 -1·4 -3·3 -2·2(230·1 to 685·5)
(191·4 to 580·8)
(135·5 to 434·7) (106 to 316) (121 to 366) (111 to 356) (-5·0 to 2·4) (-6·9 to 0·6) (-5·0 to 0·6)
Ghana374·3 418·1 293·4 2143 2933 2343 0·9 -3·6 -1·1(247·7 to 528·1)
(309·6 to 532·9)
(193·5 to 410·4) (1418 to 3024) (2172 to 3739) (1545 to 3277) (-2·6 to 4·7) (-7·3 to -0·3) (-3·6 to 1·4)
Guinea660·4 676·3 615·4 1966 2642 2720 0·2 -1·0 -0·3(564·4 to 768·8)
(542·1 to 811·8)
(470·5 to 781·9) (1680 to 2289) (2118 to 3171) (2080 to 3457) (-1·7 to 1·8) (-3·1 to 1·0) (-1·6 to 0·9)
46 Achievements and Prospects
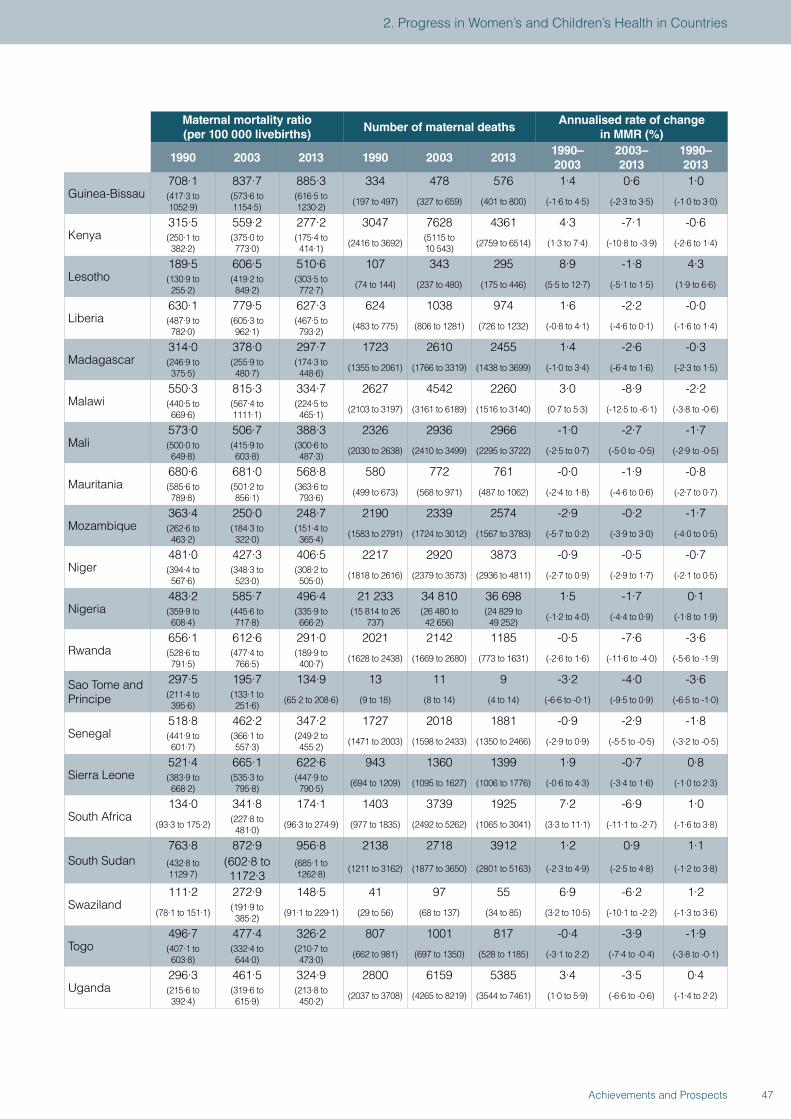
Maternal mortality ratio (per 100 000 livebirths)
Number of maternal deathsAnnualised rate of change
in MMR (%)
1990 2003 2013 1990 2003 20131990–2003
2003–2013
1990–2013
Guinea-Bissau708·1 837·7 885·3 334 478 576 1·4 0·6 1·0(417·3 to 1052·9)
(573·6 to 1154·5)
(616·5 to 1230·2) (197 to 497) (327 to 659) (401 to 800) (-1·6 to 4·5) (-2·3 to 3·5) (-1·0 to 3·0)
Kenya315·5 559·2 277·2 3047 7628 4361 4·3 -7·1 -0·6(250·1 to 382·2)
(375·0 to 773·0)
(175·4 to 414·1) (2416 to 3692) (5115 to
10 543) (2759 to 6514) (1·3 to 7·4) (-10·8 to -3·9) (-2·6 to 1·4)
Lesotho189·5 606·5 510·6 107 343 295 8·9 -1·8 4·3(130·9 to 255·2)
(419·2 to 849·2)
(303·5 to 772·7) (74 to 144) (237 to 480) (175 to 446) (5·5 to 12·7) (-5·1 to 1·5) (1·9 to 6·6)
Liberia630·1 779·5 627·3 624 1038 974 1·6 -2·2 -0·0(487·9 to 782·0)
(605·3 to 962·1)
(467·5 to 793·2) (483 to 775) (806 to 1281) (726 to 1232) (-0·8 to 4·1) (-4·6 to 0·1) (-1·6 to 1·4)
Madagascar314·0 378·0 297·7 1723 2610 2455 1·4 -2·6 -0·3(246·9 to 375·5)
(255·9 to 480·7)
(174·3 to 448·6) (1355 to 2061) (1766 to 3319) (1438 to 3699) (-1·0 to 3·4) (-6·4 to 1·6) (-2·3 to 1·5)
Malawi550·3 815·3 334·7 2627 4542 2260 3·0 -8·9 -2·2(440·5 to 669·6)
(567·4 to 1111·1)
(224·5 to 465·1) (2103 to 3197) (3161 to 6189) (1516 to 3140) (0·7 to 5·3) (-12·5 to -6·1) (-3·8 to -0·6)
Mali573·0 506·7 388·3 2326 2936 2966 -1·0 -2·7 -1·7(500·0 to 649·8)
(415·9 to 603·8)
(300·6 to 487·3) (2030 to 2638) (2410 to 3499) (2295 to 3722) (-2·5 to 0·7) (-5·0 to -0·5) (-2·9 to -0·5)
Mauritania680·6 681·0 568·8 580 772 761 -0·0 -1·9 -0·8(585·6 to 789·8)
(501·2 to 856·1)
(363·6 to 793·6) (499 to 673) (568 to 971) (487 to 1062) (-2·4 to 1·8) (-4·6 to 0·6) (-2·7 to 0·7)
Mozambique363·4 250·0 248·7 2190 2339 2574 -2·9 -0·2 -1·7(262·6 to 463·2)
(184·3 to 322·0)
(151·4 to 365·4) (1583 to 2791) (1724 to 3012) (1567 to 3783) (-5·7 to 0·2) (-3·9 to 3·0) (-4·0 to 0·5)
Niger481·0 427·3 406·5 2217 2920 3873 -0·9 -0·5 -0·7(394·4 to 567·6)
(348·3 to 523·0)
(308·2 to 505·0) (1818 to 2616) (2379 to 3573) (2936 to 4811) (-2·7 to 0·9) (-2·9 to 1·7) (-2·1 to 0·5)
Nigeria483·2 585·7 496·4 21 233 34 810 36 698 1·5 -1·7 0·1(359·9 to 608·4)
(445·6 to 717·8)
(335·9 to 666·2)
(15 814 to 26 737)
(26 480 to 42 656)
(24 829 to 49 252) (-1·2 to 4·0) (-4·4 to 0·9) (-1·8 to 1·9)
Rwanda656·1 612·6 291·0 2021 2142 1185 -0·5 -7·6 -3·6(528·6 to 791·5)
(477·4 to 766·5)
(189·9 to 400·7) (1628 to 2438) (1669 to 2680) (773 to 1631) (-2·6 to 1·6) (-11·6 to -4·0) (-5·6 to -1·9)
Sao Tome and Principe
297·5 195·7 134·9 13 11 9 -3·2 -4·0 -3·6(211·4 to 395·6)
(133·1 to 251·6) (65·2 to 208·6) (9 to 18) (8 to 14) (4 to 14) (-6·6 to -0·1) (-9·5 to 0·9) (-6·5 to -1·0)
Senegal518·8 462·2 347·2 1727 2018 1881 -0·9 -2·9 -1·8(441·9 to 601·7)
(366·1 to 557·3)
(249·2 to 455·2) (1471 to 2003) (1598 to 2433) (1350 to 2466) (-2·9 to 0·9) (-5·5 to -0·5) (-3·2 to -0·5)
Sierra Leone521·4 665·1 622·6 943 1360 1399 1·9 -0·7 0·8(383·9 to 668·2)
(535·3 to 795·8)
(447·9 to 790·5) (694 to 1209) (1095 to 1627) (1006 to 1776) (-0·6 to 4·3) (-3·4 to 1·6) (-1·0 to 2·3)
South Africa134·0 341·8 174·1 1403 3739 1925 7·2 -6·9 1·0
(93·3 to 175·2) (227·8 to 481·0) (96·3 to 274·9) (977 to 1835) (2492 to 5262) (1065 to 3041) (3·3 to 11·1) (-11·1 to -2·7) (-1·6 to 3·8)
South Sudan763·8 872·9 956·8 2138 2718 3912 1·2 0·9 1·1(432·8 to 1129·7)
(602·8 to 1172·3
(685·1 to 1262·8) (1211 to 3162) (1877 to 3650) (2801 to 5163) (-2·3 to 4·9) (-2·5 to 4·8) (-1·2 to 3·8)
Swaziland111·2 272·9 148·5 41 97 55 6·9 -6·2 1·2
(78·1 to 151·1) (191·9 to 385·2) (91·1 to 229·1) (29 to 56) (68 to 137) (34 to 85) (3·2 to 10·5) (-10·1 to -2·2) (-1·3 to 3·6)
Togo496·7 477·4 326·2 807 1001 817 -0·4 -3·9 -1·9(407·1 to 603·8)
(332·4 to 644·0)
(210·7 to 473·0) (662 to 981) (697 to 1350) (528 to 1185) (-3·1 to 2·2) (-7·4 to -0·4) (-3·8 to -0·1)
Uganda296·3 461·5 324·9 2800 6159 5385 3·4 -3·5 0·4(215·6 to 392·4)
(319·6 to 615·9)
(213·8 to 450·2) (2037 to 3708) (4265 to 8219) (3544 to 7461) (1·0 to 5·9) (-6·6 to -0·6) (-1·4 to 2·2)
47Achievements and Prospects
2. Progress in Women’s and Children’s Health in Countries
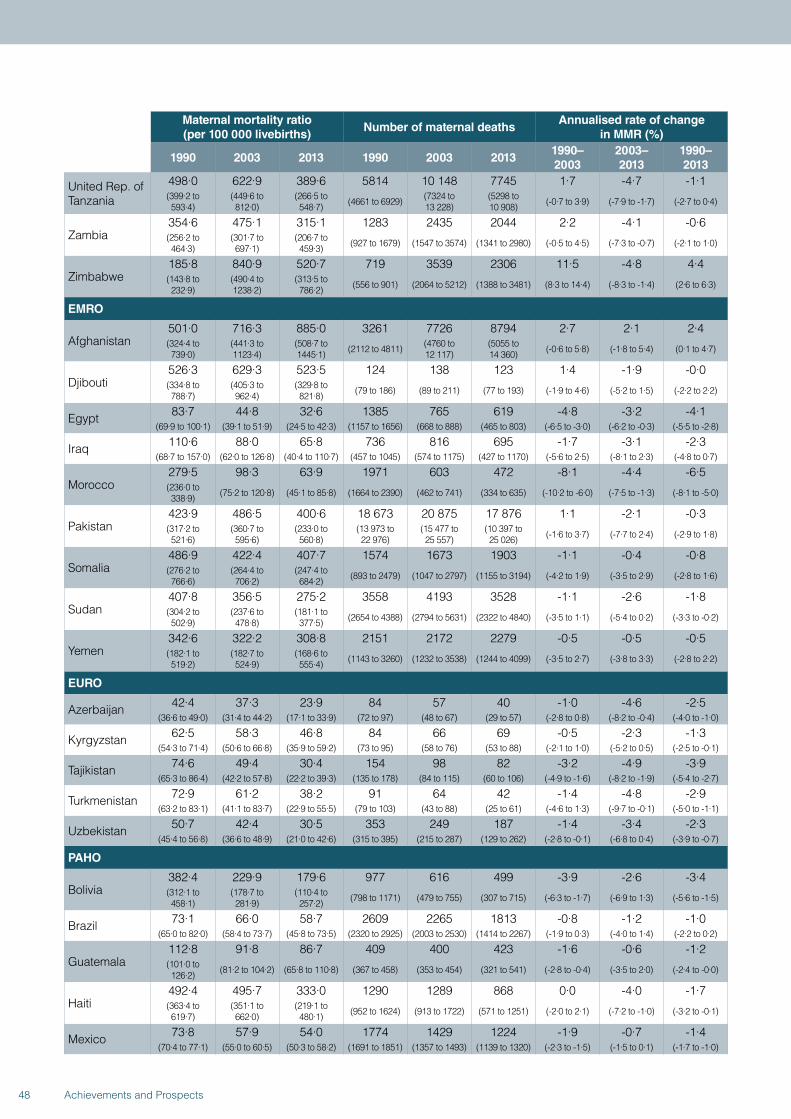
Maternal mortality ratio (per 100 000 livebirths)
Number of maternal deathsAnnualised rate of change
in MMR (%)
1990 2003 2013 1990 2003 20131990–2003
2003–2013
1990–2013
United Rep. of Tanzania
498·0 622·9 389·6 5814 10 148 7745 1·7 -4·7 -1·1(399·2 to 593·4)
(449·6 to 812·0)
(266·5 to 548·7) (4661 to 6929) (7324 to
13 228)(5298 to 10 908) (-0·7 to 3·9) (-7·9 to -1·7) (-2·7 to 0·4)
Zambia354·6 475·1 315·1 1283 2435 2044 2·2 -4·1 -0·6(256·2 to 464·3)
(301·7 to 697·1)
(206·7 to 459·3) (927 to 1679) (1547 to 3574) (1341 to 2980) (-0·5 to 4·5) (-7·3 to -0·7) (-2·1 to 1·0)
Zimbabwe185·8 840·9 520·7 719 3539 2306 11·5 -4·8 4·4(143·8 to 232·9)
(490·4 to 1238·2)
(313·5 to 786·2) (556 to 901) (2064 to 5212) (1388 to 3481) (8·3 to 14·4) (-8·3 to -1·4) (2·6 to 6·3)
EMRO
Afghanistan501·0 716·3 885·0 3261 7726 8794 2·7 2·1 2·4(324·4 to 739·0)
(441·3 to 1123·4)
(508·7 to 1445·1) (2112 to 4811) (4760 to
12 117)(5055 to 14 360) (-0·6 to 5·8) (-1·8 to 5·4) (0·1 to 4·7)
Djibouti526·3 629·3 523·5 124 138 123 1·4 -1·9 -0·0(334·8 to 788·7)
(405·3 to 962·4)
(329·8 to 821·8) (79 to 186) (89 to 211) (77 to 193) (-1·9 to 4·6) (-5·2 to 1·5) (-2·2 to 2·2)
Egypt 83·7 44·8 32·6 1385 765 619 -4·8 -3·2 -4·1(69·9 to 100·1) (39·1 to 51·9) (24·5 to 42·3) (1157 to 1656) (668 to 888) (465 to 803) (-6·5 to -3·0) (-6·2 to -0·3) (-5·5 to -2·8)
Iraq 110·6 88·0 65·8 736 816 695 -1·7 -3·1 -2·3(68·7 to 157·0) (62·0 to 126·8) (40·4 to 110·7) (457 to 1045) (574 to 1175) (427 to 1170) (-5·6 to 2·5) (-8·1 to 2·3) (-4·8 to 0·7)
Morocco279·5 98·3 63·9 1971 603 472 -8·1 -4·4 -6·5(236·0 to 338·9) (75·2 to 120·8) (45·1 to 85·8) (1664 to 2390) (462 to 741) (334 to 635) (-10·2 to -6·0) (-7·5 to -1·3) (-8·1 to -5·0)
Pakistan423·9 486·5 400·6 18 673 20 875 17 876 1·1 -2·1 -0·3(317·2 to 521·6)
(360·7 to 595·6)
(233·0 to 560·8)
(13 973 to 22 976)
(15 477 to 25 557)
(10 397 to 25 026) (-1·6 to 3·7) (-7·7 to 2·4) (-2·9 to 1·8)
Somalia486·9 422·4 407·7 1574 1673 1903 -1·1 -0·4 -0·8(276·2 to 766·6)
(264·4 to 706·2)
(247·4 to 684·2) (893 to 2479) (1047 to 2797) (1155 to 3194) (-4·2 to 1·9) (-3·5 to 2·9) (-2·8 to 1·6)
Sudan407·8 356·5 275·2 3558 4193 3528 -1·1 -2·6 -1·8(304·2 to 502·9)
(237·6 to 478·8)
(181·1 to 377·5) (2654 to 4388) (2794 to 5631) (2322 to 4840) (-3·5 to 1·1) (-5·4 to 0·2) (-3·3 to -0·2)
Yemen342·6 322·2 308·8 2151 2172 2279 -0·5 -0·5 -0·5(182·1 to 519·2)
(182·7 to 524·9)
(168·6 to 555·4) (1143 to 3260) (1232 to 3538) (1244 to 4099) (-3·5 to 2·7) (-3·8 to 3·3) (-2·8 to 2·2)
EURO
Azerbaijan 42·4 37·3 23·9 84 57 40 -1·0 -4·6 -2·5(36·6 to 49·0) (31·4 to 44·2) (17·1 to 33·9) (72 to 97) (48 to 67) (29 to 57) (-2·8 to 0·8) (-8·2 to -0·4) (-4·0 to -1·0)
Kyrgyzstan 62·5 58·3 46·8 84 66 69 -0·5 -2·3 -1·3(54·3 to 71·4) (50·6 to 66·8) (35·9 to 59·2) (73 to 95) (58 to 76) (53 to 88) (-2·1 to 1·0) (-5·2 to 0·5) (-2·5 to -0·1)
Tajikistan 74·6 49·4 30·4 154 98 82 -3·2 -4·9 -3·9(65·3 to 86·4) (42·2 to 57·8) (22·2 to 39·3) (135 to 178) (84 to 115) (60 to 106) (-4·9 to -1·6) (-8·2 to -1·9) (-5·4 to -2·7)
Turkmenistan 72·9 61·2 38·2 91 64 42 -1·4 -4·8 -2·9(63·2 to 83·1) (41·1 to 83·7) (22·9 to 55·5) (79 to 103) (43 to 88) (25 to 61) (-4·6 to 1·3) (-9·7 to -0·1) (-5·0 to -1·1)
Uzbekistan 50·7 42·4 30·5 353 249 187 -1·4 -3·4 -2·3(45·4 to 56·8) (36·6 to 48·9) (21·0 to 42·6) (315 to 395) (215 to 287) (129 to 262) (-2·8 to -0·1) (-6·8 to 0·4) (-3·9 to -0·7)
PAHO
Bolivia382·4 229·9 179·6 977 616 499 -3·9 -2·6 -3·4(312·1 to 458·1)
(178·7 to 281·9)
(110·4 to 257·2) (798 to 1171) (479 to 755) (307 to 715) (-6·3 to -1·7) (-6·9 to 1·3) (-5·6 to -1·5)
Brazil 73·1 66·0 58·7 2609 2265 1813 -0·8 -1·2 -1·0(65·0 to 82·0) (58·4 to 73·7) (45·8 to 73·5) (2320 to 2925) (2003 to 2530) (1414 to 2267) (-1·9 to 0·3) (-4·0 to 1·4) (-2·2 to 0·2)
Guatemala112·8 91·8 86·7 409 400 423 -1·6 -0·6 -1·2(101·0 to 126·2) (81·2 to 104·2) (65·8 to 110·8) (367 to 458) (353 to 454) (321 to 541) (-2·8 to -0·4) (-3·5 to 2·0) (-2·4 to -0·0)
Haiti492·4 495·7 333·0 1290 1289 868 0·0 -4·0 -1·7(363·4 to 619·7)
(351·1 to 662·0)
(219·1 to 480·1) (952 to 1624) (913 to 1722) (571 to 1251) (-2·0 to 2·1) (-7·2 to -1·0) (-3·2 to -0·1)
Mexico 73·8 57·9 54·0 1774 1429 1224 -1·9 -0·7 -1·4(70·4 to 77·1) (55·0 to 60·5) (50·3 to 58·2) (1691 to 1851) (1357 to 1493) (1139 to 1320) (-2·3 to -1·5) (-1·5 to 0·1) (-1·7 to -1·0)
48 Achievements and Prospects
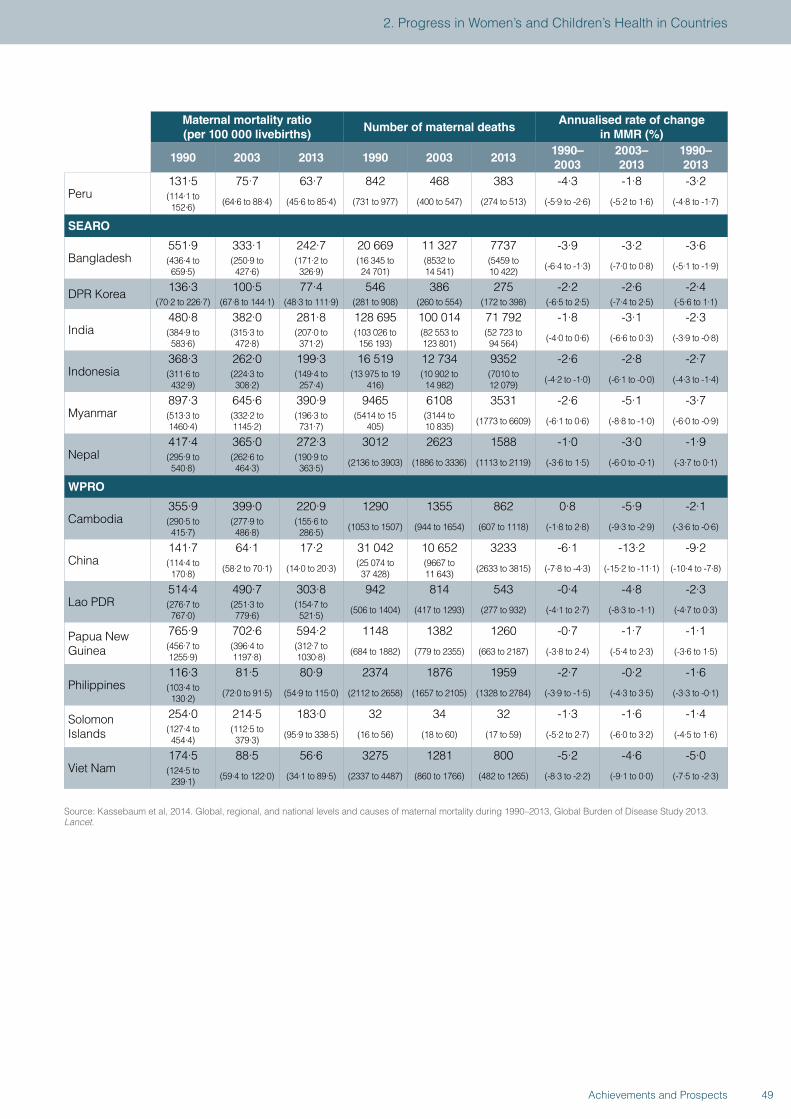
Maternal mortality ratio (per 100 000 livebirths)
Number of maternal deathsAnnualised rate of change
in MMR (%)
1990 2003 2013 1990 2003 20131990–2003
2003–2013
1990–2013
Peru131·5 75·7 63·7 842 468 383 -4·3 -1·8 -3·2(114·1 to 152·6) (64·6 to 88·4) (45·6 to 85·4) (731 to 977) (400 to 547) (274 to 513) (-5·9 to -2·6) (-5·2 to 1·6) (-4·8 to -1·7)
SEARO
Bangladesh551·9 333·1 242·7 20 669 11 327 7737 -3·9 -3·2 -3·6(436·4 to 659·5)
(250·9 to 427·6)
(171·2 to 326·9)
(16 345 to 24 701)
(8532 to 14 541)
(5459 to 10 422) (-6·4 to -1·3) (-7·0 to 0·8) (-5·1 to -1·9)
DPR Korea 136·3 100·5 77·4 546 386 275 -2·2 -2·6 -2·4(70·2 to 226·7) (67·8 to 144·1) (48·3 to 111·9) (281 to 908) (260 to 554) (172 to 398) (-6·5 to 2·5) (-7·4 to 2·5) (-5·6 to 1·1)
India480·8 382·0 281·8 128 695 100 014 71 792 -1·8 -3·1 -2·3(384·9 to 583·6)
(315·3 to 472·8)
(207·0 to 371·2)
(103 026 to 156 193)
(82 553 to 123 801)
(52 723 to 94 564) (-4·0 to 0·6) (-6·6 to 0·3) (-3·9 to -0·8)
Indonesia368·3 262·0 199·3 16 519 12 734 9352 -2·6 -2·8 -2·7(311·6 to 432·9)
(224·3 to 308·2)
(149·4 to 257·4)
(13 975 to 19 416)
(10 902 to 14 982)
(7010 to 12 079) (-4·2 to -1·0) (-6·1 to -0·0) (-4·3 to -1·4)
Myanmar897·3 645·6 390·9 9465 6108 3531 -2·6 -5·1 -3·7(513·3 to 1460·4)
(332·2 to 1145·2)
(196·3 to 731·7)
(5414 to 15 405)
(3144 to 10 835) (1773 to 6609) (-6·1 to 0·6) (-8·8 to -1·0) (-6·0 to -0·9)
Nepal417·4 365·0 272·3 3012 2623 1588 -1·0 -3·0 -1·9(295·9 to 540·8)
(262·6 to 464·3)
(190·9 to 363·5) (2136 to 3903) (1886 to 3336) (1113 to 2119) (-3·6 to 1·5) (-6·0 to -0·1) (-3·7 to 0·1)
WPRO
Cambodia355·9 399·0 220·9 1290 1355 862 0·8 -5·9 -2·1(290·5 to 415·7)
(277·9 to 486·8)
(155·6 to 286·5) (1053 to 1507) (944 to 1654) (607 to 1118) (-1·8 to 2·8) (-9·3 to -2·9) (-3·6 to -0·6)
China141·7 64·1 17·2 31 042 10 652 3233 -6·1 -13·2 -9·2(114·4 to 170·8) (58·2 to 70·1) (14·0 to 20·3) (25 074 to
37 428)(9667 to 11 643) (2633 to 3815) (-7·8 to -4·3) (-15·2 to -11·1) (-10·4 to -7·8)
Lao PDR514·4 490·7 303·8 942 814 543 -0·4 -4·8 -2·3(276·7 to 767·0)
(251·3 to 779·6)
(154·7 to 521·5) (506 to 1404) (417 to 1293) (277 to 932) (-4·1 to 2·7) (-8·3 to -1·1) (-4·7 to 0·3)
Papua New Guinea
765·9 702·6 594·2 1148 1382 1260 -0·7 -1·7 -1·1(456·7 to 1255·9)
(396·4 to 1197·8)
(312·7 to 1030·8) (684 to 1882) (779 to 2355) (663 to 2187) (-3·8 to 2·4) (-5·4 to 2·3) (-3·6 to 1·5)
Philippines116·3 81·5 80·9 2374 1876 1959 -2·7 -0·2 -1·6(103·4 to 130·2) (72·0 to 91·5) (54·9 to 115·0) (2112 to 2658) (1657 to 2105) (1328 to 2784) (-3·9 to -1·5) (-4·3 to 3·5) (-3·3 to -0·1)
Solomon Islands
254·0 214·5 183·0 32 34 32 -1·3 -1·6 -1·4(127·4 to 454·4)
(112·5 to 379·3) (95·9 to 338·5) (16 to 56) (18 to 60) (17 to 59) (-5·2 to 2·7) (-6·0 to 3·2) (-4·5 to 1·6)
Viet Nam174·5 88·5 56·6 3275 1281 800 -5·2 -4·6 -5·0(124·5 to 239·1) (59·4 to 122·0) (34·1 to 89·5) (2337 to 4487) (860 to 1766) (482 to 1265) (-8·3 to -2·2) (-9·1 to 0·0) (-7·5 to -2·3)
Source: Kassebaum et al, 2014. Global, regional, and national levels and causes of maternal mortality during 1990–2013, Global Burden of Disease Study 2013. Lancet.
49Achievements and Prospects
2. Progress in Women’s and Children’s Health in Countries
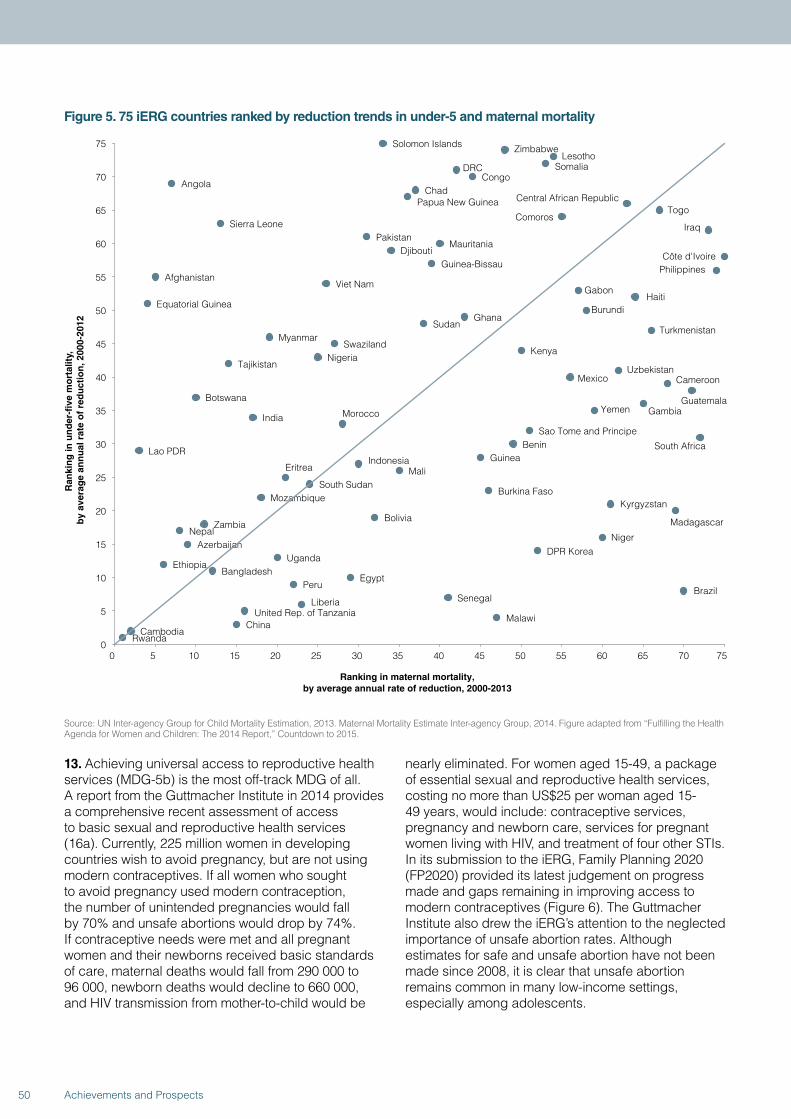
Figure 5. 75 iERG countries ranked by reduction trends in under-5 and maternal mortality
RwandaCambodia
ChinaMalawiUnited Rep. of Tanzania
Liberia SenegalBrazil
PeruEgypt
BangladeshEthiopia
UgandaDPR Korea
AzerbaijanNiger
NepalZambia
Bolivia Madagascar
KyrgyzstanMozambique
Burkina FasoSouth Sudan
Eritrea MaliIndonesia Guinea
Lao PDRBenin South Africa
Sao Tome and Principe
MoroccoIndiaYemen Gambia
Botswana Guatemala
CameroonMexicoUzbekistanTajikistan
NigeriaKenya
SwazilandMyanmar
TurkmenistanSudan
GhanaBurundiEquatorial Guinea
HaitiGabon
Viet NamAfghanistan
PhilippinesGuinea-BissauCôte d'IvoireDjibouti
MauritaniaPakistan
IraqSierra LeoneComoros
TogoCentral African RepublicPapua New Guinea
ChadAngola
CongoDRC Somalia
LesothoZimbabweSolomon Islands
0
5
10
15
20
25
30
35
40
45
50
55
60
65
70
75
0 5 10 15 20 25 30 35 40 45 50 55 60 65 70 75
Ran
kin
g in
un
der
-fiv
e m
ort
alit
y,
by
aver
age
ann
ual
rat
e o
f re
du
ctio
n, 2
000-
2012
Ranking in maternal mortality, by average annual rate of reduction, 2000-2013
Source: UN Inter-agency Group for Child Mortality Estimation, 2013. Maternal Mortality Estimate Inter-agency Group, 2014. Figure adapted from “Fulfilling the Health Agenda for Women and Children: The 2014 Report,” Countdown to 2015.
13. Achieving universal access to reproductive health services (MDG-5b) is the most off-track MDG of all. A report from the Guttmacher Institute in 2014 provides a comprehensive recent assessment of access to basic sexual and reproductive health services (16a). Currently, 225 million women in developing countries wish to avoid pregnancy, but are not using modern contraceptives. If all women who sought to avoid pregnancy used modern contraception, the number of unintended pregnancies would fall by 70% and unsafe abortions would drop by 74%. If contraceptive needs were met and all pregnant women and their newborns received basic standards of care, maternal deaths would fall from 290 000 to 96 000, newborn deaths would decline to 660 000, and HIV transmission from mother-to-child would be
nearly eliminated. For women aged 15-49, a package of essential sexual and reproductive health services, costing no more than US$25 per woman aged 15-49 years, would include: contraceptive services, pregnancy and newborn care, services for pregnant women living with HIV, and treatment of four other STIs. In its submission to the iERG, Family Planning 2020 (FP2020) provided its latest judgement on progress made and gaps remaining in improving access to modern contraceptives (Figure 6). The Guttmacher Institute also drew the iERG’s attention to the neglected importance of unsafe abortion rates. Although estimates for safe and unsafe abortion have not been made since 2008, it is clear that unsafe abortion remains common in many low-income settings, especially among adolescents.
50 Achievements and Prospects
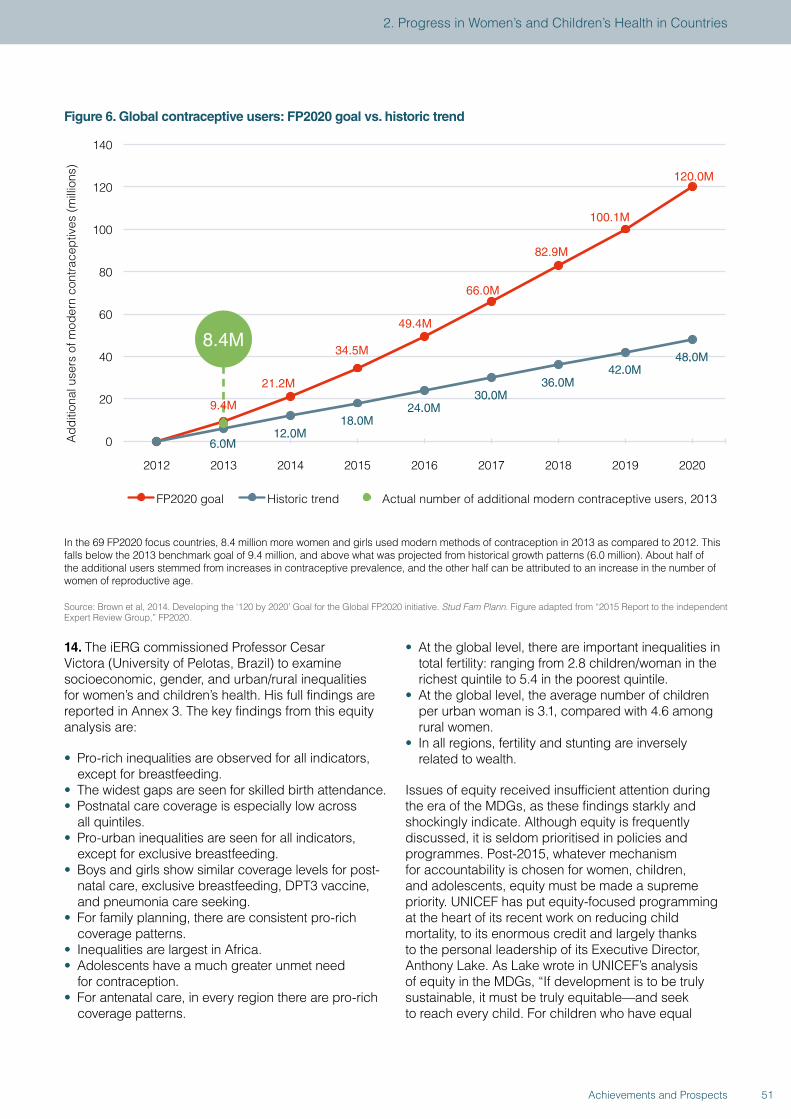
Figure 6. Global contraceptive users: FP2020 goal vs. historic trend
.
6.0M12.0M
18.0M24.0M
30.0M36.0M
42.0M48.0M
0
20
40
60
80
100
120
140
2012 2013 2014 2015 2016 2017 2018 2019 2020
Add
ition
al u
sers
of m
oder
n co
ntra
cept
ives
(mill
ions
)
FP2020 goal Historic trend Actual number of additional modern contraceptive users, 2013
8.4M
9.4M
21.2M
49.4M
34.5M
66.0M
82.9M
120.0M
100.1M
In the 69 FP2020 focus countries, 8.4 million more women and girls used modern methods of contraception in 2013 as compared to 2012. This falls below the 2013 benchmark goal of 9.4 million, and above what was projected from historical growth patterns (6.0 million). About half of the additional users stemmed from increases in contraceptive prevalence, and the other half can be attributed to an increase in the number of women of reproductive age.
Source: Brown et al, 2014. Developing the ‘120 by 2020’ Goal for the Global FP2020 initiative. Stud Fam Plann. Figure adapted from “2015 Report to the independent Expert Review Group,” FP2020.
14. The iERG commissioned Professor Cesar Victora (University of Pelotas, Brazil) to examine socioeconomic, gender, and urban/rural inequalities for women’s and children’s health. His full findings are reported in Annex 3. The key findings from this equity analysis are:
• Pro-rich inequalities are observed for all indicators, except for breastfeeding.
• The widest gaps are seen for skilled birth attendance.• Postnatal care coverage is especially low across
all quintiles.• Pro-urban inequalities are seen for all indicators,
except for exclusive breastfeeding.• Boys and girls show similar coverage levels for post-
natal care, exclusive breastfeeding, DPT3 vaccine, and pneumonia care seeking.
• For family planning, there are consistent pro-rich coverage patterns.
• Inequalities are largest in Africa.• Adolescents have a much greater unmet need
for contraception.• For antenatal care, in every region there are pro-rich
coverage patterns.
• At the global level, there are important inequalities in total fertility: ranging from 2.8 children/woman in the richest quintile to 5.4 in the poorest quintile.
• At the global level, the average number of children per urban woman is 3.1, compared with 4.6 among rural women.
• In all regions, fertility and stunting are inversely related to wealth.
Issues of equity received insufficient attention during the era of the MDGs, as these findings starkly and shockingly indicate. Although equity is frequently discussed, it is seldom prioritised in policies and programmes. Post-2015, whatever mechanism for accountability is chosen for women, children, and adolescents, equity must be made a supreme priority. UNICEF has put equity-focused programming at the heart of its recent work on reducing child mortality, to its enormous credit and largely thanks to the personal leadership of its Executive Director, Anthony Lake. As Lake wrote in UNICEF’s analysis of equity in the MDGs, “If development is to be truly sustainable, it must be truly equitable—and seek to reach every child. For children who have equal
51Achievements and Prospects
2. Progress in Women’s and Children’s Health in Countries
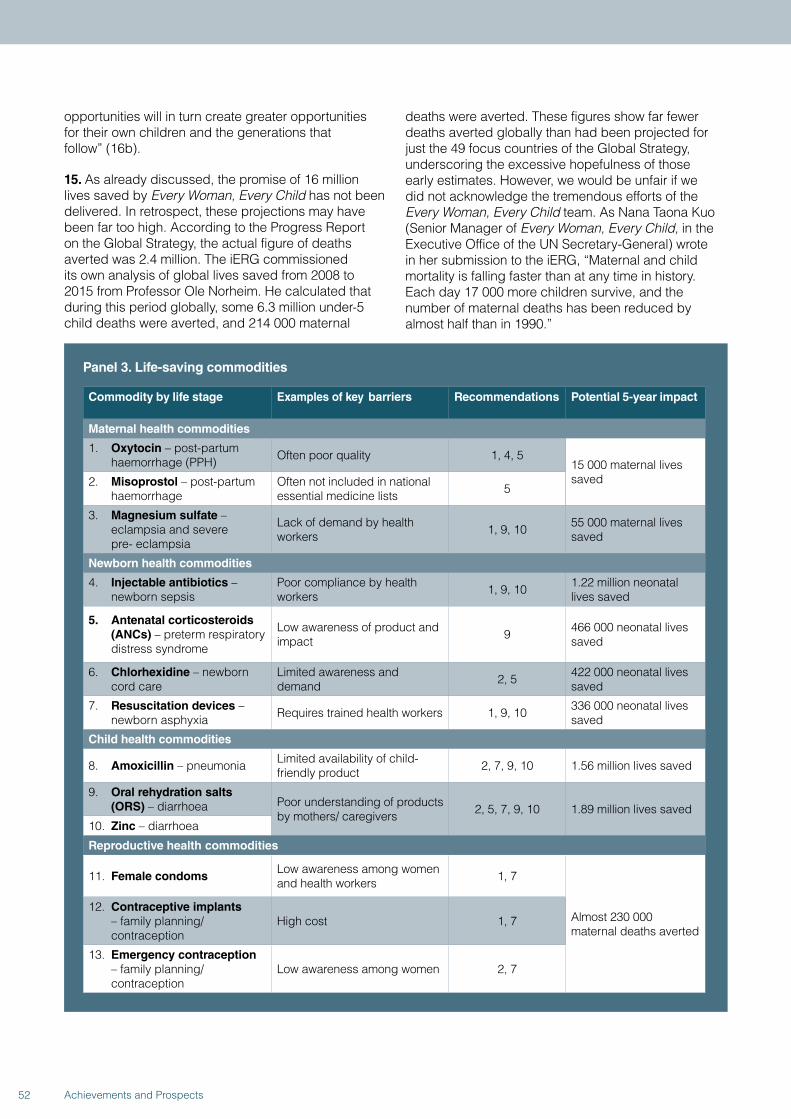
opportunities will in turn create greater opportunities for their own children and the generations that follow” (16b).
15. As already discussed, the promise of 16 million lives saved by Every Woman, Every Child has not been delivered. In retrospect, these projections may have been far too high. According to the Progress Report on the Global Strategy, the actual figure of deaths averted was 2.4 million. The iERG commissioned its own analysis of global lives saved from 2008 to 2015 from Professor Ole Norheim. He calculated that during this period globally, some 6.3 million under-5 child deaths were averted, and 214 000 maternal
deaths were averted. These figures show far fewer deaths averted globally than had been projected for just the 49 focus countries of the Global Strategy, underscoring the excessive hopefulness of those early estimates. However, we would be unfair if we did not acknowledge the tremendous efforts of the Every Woman, Every Child team. As Nana Taona Kuo (Senior Manager of Every Woman, Every Child, in the Executive Office of the UN Secretary-General) wrote in her submission to the iERG, “Maternal and child mortality is falling faster than at any time in history. Each day 17 000 more children survive, and the number of maternal deaths has been reduced by almost half than in 1990.”
Panel 3. Life-saving commodities
Commodity by life stage Examples of key barriers Recommendations Potential 5-year impact
Maternal health commodities
1. Oxytocin – post-partum haemorrhage (PPH) Often poor quality 1, 4, 5
15 000 maternal lives saved2. Misoprostol – post-partum
haemorrhageOften not included in national essential medicine lists 5
3. Magnesium sulfate – eclampsia and severe pre- eclampsia
Lack of demand by health workers 1, 9, 10 55 000 maternal lives
saved
Newborn health commodities
4. Injectable antibiotics – newborn sepsis
Poor compliance by health workers 1, 9, 10 1.22 million neonatal
lives saved
5. Antenatal corticosteroids (ANCs) – preterm respiratory distress syndrome
Low awareness of product and impact 9 466 000 neonatal lives
saved
6. Chlorhexidine – newborn cord care
Limited awareness and demand 2, 5 422 000 neonatal lives
saved
7. Resuscitation devices – newborn asphyxia Requires trained health workers 1, 9, 10 336 000 neonatal lives
saved
Child health commodities
8. Amoxicillin – pneumonia Limited availability of child- friendly product 2, 7, 9, 10 1.56 million lives saved
9. Oral rehydration salts (ORS) – diarrhoea Poor understanding of products
by mothers/ caregivers 2, 5, 7, 9, 10 1.89 million lives saved10. Zinc – diarrhoea
Reproductive health commodities
11. Female condomsLow awareness among women and health workers 1, 7
Almost 230 000 maternal deaths averted
12. Contraceptive implants – family planning/ contraception
High cost 1, 7
13. Emergency contraception – family planning/ contraception
Low awareness among women 2, 7
52 Achievements and Prospects
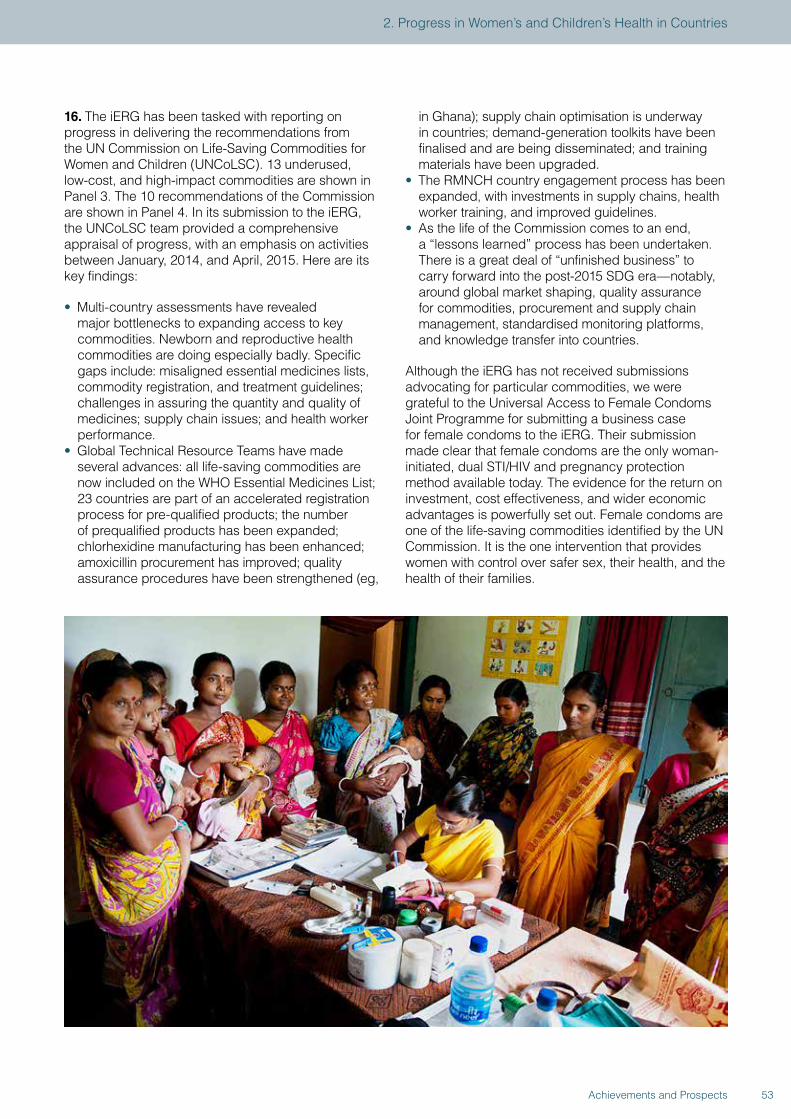
16. The iERG has been tasked with reporting on progress in delivering the recommendations from the UN Commission on Life-Saving Commodities for Women and Children (UNCoLSC). 13 underused, low-cost, and high-impact commodities are shown in Panel 3. The 10 recommendations of the Commission are shown in Panel 4. In its submission to the iERG, the UNCoLSC team provided a comprehensive appraisal of progress, with an emphasis on activities between January, 2014, and April, 2015. Here are its key findings:
• Multi-country assessments have revealed major bottlenecks to expanding access to key commodities. Newborn and reproductive health commodities are doing especially badly. Specific gaps include: misaligned essential medicines lists, commodity registration, and treatment guidelines; challenges in assuring the quantity and quality of medicines; supply chain issues; and health worker performance.
• Global Technical Resource Teams have made several advances: all life-saving commodities are now included on the WHO Essential Medicines List; 23 countries are part of an accelerated registration process for pre-qualified products; the number of prequalified products has been expanded; chlorhexidine manufacturing has been enhanced; amoxicillin procurement has improved; quality assurance procedures have been strengthened (eg,
in Ghana); supply chain optimisation is underway in countries; demand-generation toolkits have been finalised and are being disseminated; and training materials have been upgraded.
• The RMNCH country engagement process has been expanded, with investments in supply chains, health worker training, and improved guidelines.
• As the life of the Commission comes to an end, a “lessons learned” process has been undertaken. There is a great deal of “unfinished business” to carry forward into the post-2015 SDG era—notably, around global market shaping, quality assurance for commodities, procurement and supply chain management, standardised monitoring platforms, and knowledge transfer into countries.
Although the iERG has not received submissions advocating for particular commodities, we were grateful to the Universal Access to Female Condoms Joint Programme for submitting a business case for female condoms to the iERG. Their submission made clear that female condoms are the only woman-initiated, dual STI/HIV and pregnancy protection method available today. The evidence for the return on investment, cost effectiveness, and wider economic advantages is powerfully set out. Female condoms are one of the life-saving commodities identified by the UN Commission. It is the one intervention that provides women with control over safer sex, their health, and the health of their families.
53Achievements and Prospects
2. Progress in Women’s and Children’s Health in Countries
Panel 4. Recommendations of the UN Commission on Life-Saving Commodities for Women’s and Children’s Health
Improved markets:1. Shaping global markets: By 2013, effective global mechanisms such as pooled procurement and
aggregated demand are in place to increase the availability of quality, life-saving commodities at an optimal price and volume.
2. Shaping local delivery markets: By 2014, local health providers and private sector actors in all Every Woman Every Child countries are incentivized to increase production, distribution, and appropriate promotion of the 13 commodities.
3. Innovative financing: By the end of 2013, innovative, results-based financing is in place to rapidly increase access to the 13 commodities by those most in need and foster innovations.
4. Quality strengthening: By 2015, at least three manufacturers per commodity are manufacturing and marketing quality-certified and affordable products.
5. Regulatory efficiency: By 2015, all Every Woman Every Child countries have standardized and streamlined their registration requirements and assessment processes for the 13 live-saving commodities with support from stringent regulatory authorities, the WHO, and regional collaboration.
Improved national delivery:6. Supply and awareness: By 2015, all Every Woman Every Child countries have improved the supply of
life-saving commodities and build on information and communication technology (ICT) best practices for making these improvements.
7. Demand and utilization: By 2014, all Every Woman Every Child countries in conjunction with the private sector and civil society have developed plans to implement at scale appropriate interventions to increase demand for and utilization of health services and products, particularly among under-served populations.
8. Reaching women and children: By 2014, all Every Woman Every Child countries are addressing financial barriers to ensure the poorest members of society have access to the life-saving commodities.
9. Performance and accountability: By the end of 2013, all Every Woman Every Child countries have proven mechanisms such as checklists in place to ensure that health-care providers are knowledgeable about the latest national guidelines.
Improved integration of private sector and consumer needs:10. Product innovation: By 2014, research and development for improved life-saving commodities has
been prioritised, funded, and commenced.
54 Achievements and Prospects
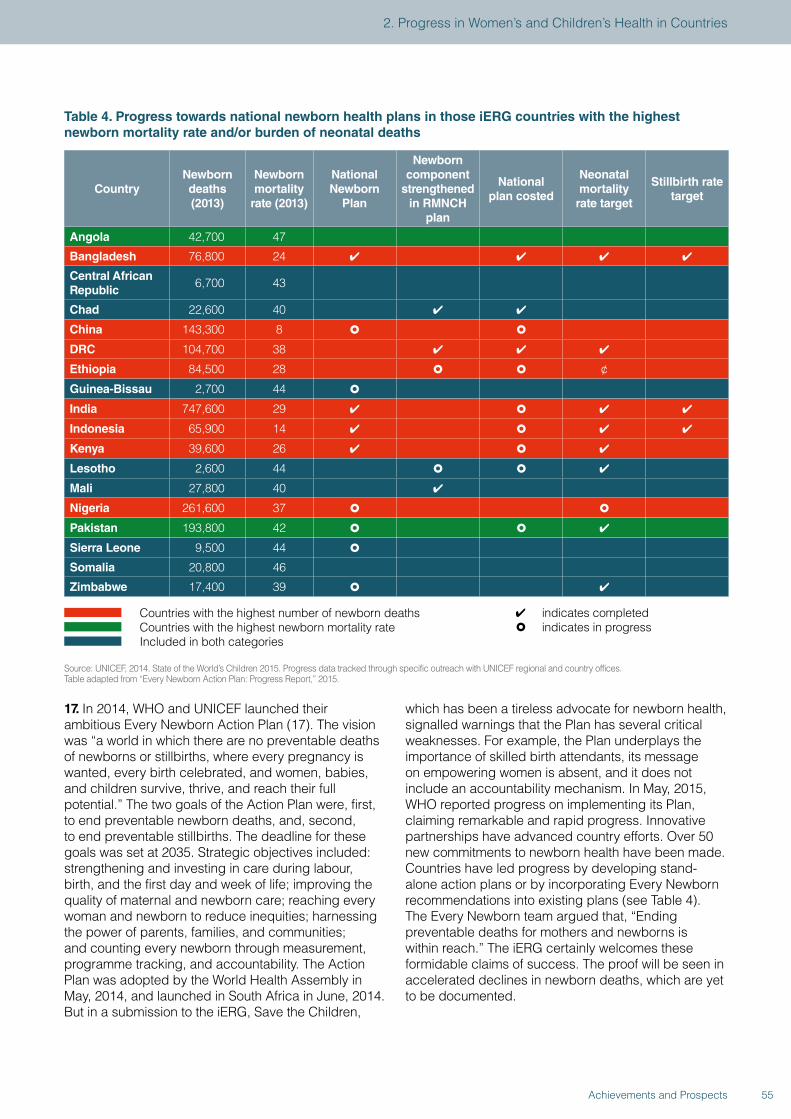
Table 4. Progress towards national newborn health plans in those iERG countries with the highest newborn mortality rate and/or burden of neonatal deaths
CountryNewborn deaths (2013)
Newborn mortality
rate (2013)
National Newborn
Plan
Newborn component
strengthened in RMNCH
plan
National plan costed
Neonatal mortality
rate target
Stillbirth rate target
Angola 42,700 47
Bangladesh 76,800 24 ✔ ✔ ✔ ✔
Central African Republic
6,700 43
Chad 22,600 40 ✔ ✔
China 143,300 8 � �
DRC 104,700 38 ✔ ✔ ✔
Ethiopia 84,500 28 � � ¢
Guinea-Bissau 2,700 44 �
India 747,600 29 ✔ � ✔ ✔
Indonesia 65,900 14 ✔ � ✔ ✔
Kenya 39,600 26 ✔ � ✔
Lesotho 2,600 44 � � ✔
Mali 27,800 40 ✔
Nigeria 261,600 37 � �
Pakistan 193,800 42 � � ✔
Sierra Leone 9,500 44 �
Somalia 20,800 46
Zimbabwe 17,400 39 � ✔
Countries with the highest number of newborn deaths Countries with the highest newborn mortality rate Included in both categories
✔ indicates completed� indicates in progress
Source: UNICEF, 2014. State of the World’s Children 2015. Progress data tracked through specific outreach with UNICEF regional and country offices.Table adapted from “Every Newborn Action Plan: Progress Report,” 2015.
17. In 2014, WHO and UNICEF launched their ambitious Every Newborn Action Plan (17). The vision was “a world in which there are no preventable deaths of newborns or stillbirths, where every pregnancy is wanted, every birth celebrated, and women, babies, and children survive, thrive, and reach their full potential.” The two goals of the Action Plan were, first, to end preventable newborn deaths, and, second, to end preventable stillbirths. The deadline for these goals was set at 2035. Strategic objectives included: strengthening and investing in care during labour, birth, and the first day and week of life; improving the quality of maternal and newborn care; reaching every woman and newborn to reduce inequities; harnessing the power of parents, families, and communities; and counting every newborn through measurement, programme tracking, and accountability. The Action Plan was adopted by the World Health Assembly in May, 2014, and launched in South Africa in June, 2014. But in a submission to the iERG, Save the Children,
which has been a tireless advocate for newborn health, signalled warnings that the Plan has several critical weaknesses. For example, the Plan underplays the importance of skilled birth attendants, its message on empowering women is absent, and it does not include an accountability mechanism. In May, 2015, WHO reported progress on implementing its Plan, claiming remarkable and rapid progress. Innovative partnerships have advanced country efforts. Over 50 new commitments to newborn health have been made. Countries have led progress by developing stand-alone action plans or by incorporating Every Newborn recommendations into existing plans (see Table 4). The Every Newborn team argued that, “Ending preventable deaths for mothers and newborns is within reach.” The iERG certainly welcomes these formidable claims of success. The proof will be seen in accelerated declines in newborn deaths, which are yet to be documented.
55Achievements and Prospects
2. Progress in Women’s and Children’s Health in Countries
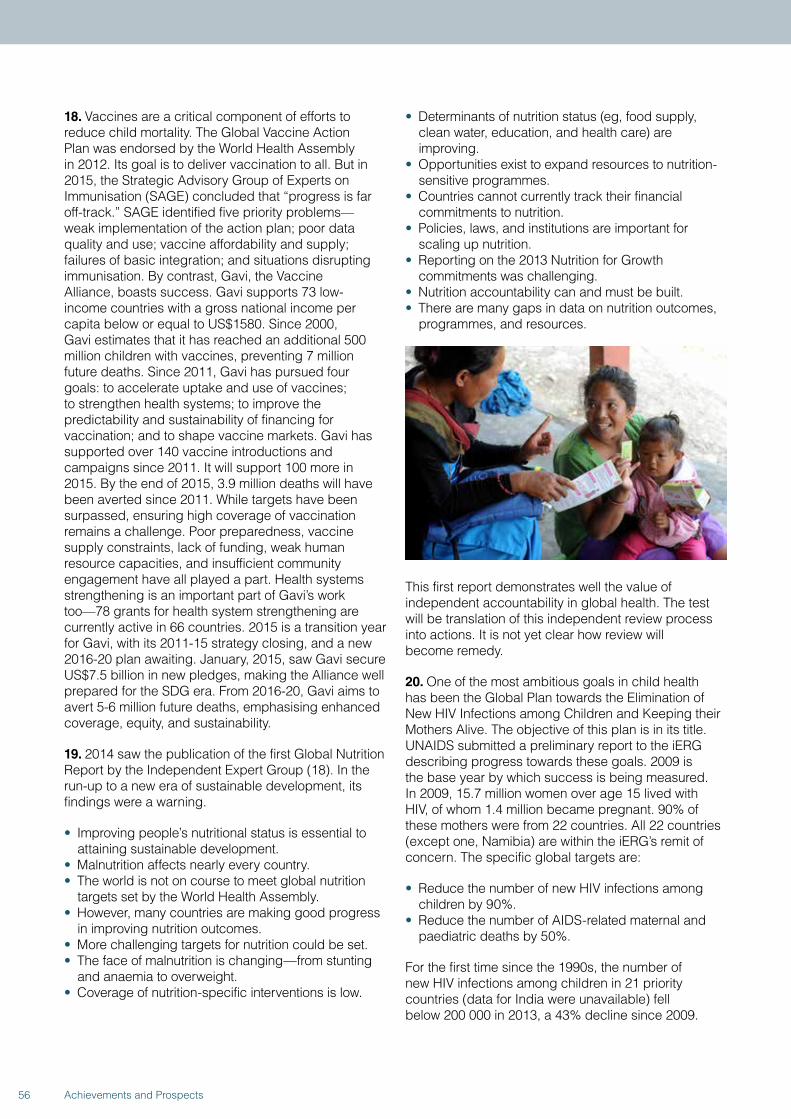
18. Vaccines are a critical component of efforts to reduce child mortality. The Global Vaccine Action Plan was endorsed by the World Health Assembly in 2012. Its goal is to deliver vaccination to all. But in 2015, the Strategic Advisory Group of Experts on Immunisation (SAGE) concluded that “progress is far off-track.” SAGE identified five priority problems—weak implementation of the action plan; poor data quality and use; vaccine affordability and supply; failures of basic integration; and situations disrupting immunisation. By contrast, Gavi, the Vaccine Alliance, boasts success. Gavi supports 73 low-income countries with a gross national income per capita below or equal to US$1580. Since 2000, Gavi estimates that it has reached an additional 500 million children with vaccines, preventing 7 million future deaths. Since 2011, Gavi has pursued four goals: to accelerate uptake and use of vaccines; to strengthen health systems; to improve the predictability and sustainability of financing for vaccination; and to shape vaccine markets. Gavi has supported over 140 vaccine introductions and campaigns since 2011. It will support 100 more in 2015. By the end of 2015, 3.9 million deaths will have been averted since 2011. While targets have been surpassed, ensuring high coverage of vaccination remains a challenge. Poor preparedness, vaccine supply constraints, lack of funding, weak human resource capacities, and insufficient community engagement have all played a part. Health systems strengthening is an important part of Gavi’s work too—78 grants for health system strengthening are currently active in 66 countries. 2015 is a transition year for Gavi, with its 2011-15 strategy closing, and a new 2016-20 plan awaiting. January, 2015, saw Gavi secure US$7.5 billion in new pledges, making the Alliance well prepared for the SDG era. From 2016-20, Gavi aims to avert 5-6 million future deaths, emphasising enhanced coverage, equity, and sustainability.
19. 2014 saw the publication of the first Global Nutrition Report by the Independent Expert Group (18). In the run-up to a new era of sustainable development, its findings were a warning.
• Improving people’s nutritional status is essential to attaining sustainable development.
• Malnutrition affects nearly every country.• The world is not on course to meet global nutrition
targets set by the World Health Assembly.• However, many countries are making good progress
in improving nutrition outcomes.• More challenging targets for nutrition could be set.• The face of malnutrition is changing—from stunting
and anaemia to overweight.• Coverage of nutrition-specific interventions is low.
• Determinants of nutrition status (eg, food supply, clean water, education, and health care) are improving.
• Opportunities exist to expand resources to nutrition-sensitive programmes.
• Countries cannot currently track their financial commitments to nutrition.
• Policies, laws, and institutions are important for scaling up nutrition.
• Reporting on the 2013 Nutrition for Growth commitments was challenging.
• Nutrition accountability can and must be built.• There are many gaps in data on nutrition outcomes,
programmes, and resources.
This first report demonstrates well the value of independent accountability in global health. The test will be translation of this independent review process into actions. It is not yet clear how review will become remedy.
20. One of the most ambitious goals in child health has been the Global Plan towards the Elimination of New HIV Infections among Children and Keeping their Mothers Alive. The objective of this plan is in its title. UNAIDS submitted a preliminary report to the iERG describing progress towards these goals. 2009 is the base year by which success is being measured. In 2009, 15.7 million women over age 15 lived with HIV, of whom 1.4 million became pregnant. 90% of these mothers were from 22 countries. All 22 countries (except one, Namibia) are within the iERG’s remit of concern. The specific global targets are:
• Reduce the number of new HIV infections among children by 90%.
• Reduce the number of AIDS-related maternal and paediatric deaths by 50%.
For the first time since the 1990s, the number of new HIV infections among children in 21 priority countries (data for India were unavailable) fell below 200 000 in 2013, a 43% decline since 2009.
56 Achievements and Prospects
In 2013, 8 countries had reduced new HIV infections among children by over 50%—Botswana, Ethiopia, Ghana, Malawi, Mozambique, Namibia, South Africa, and Zimbabwe. Since then, progress seems to have stalled in Botswana, South Africa, Tanzania, Uganda, and Zimbabwe; and it has reversed in Chad, Ghana, Lesotho, and Zambia. Gains therefore seem to be fragile. In 2009, the mother-to-child transmission rate (including through breastfeeding) was 26% in 21 Global Plan countries (again, excluding India). By 2013, that rate had fallen to 16%. The main risk is now concentrated on breastfeeding. Botswana is the one country that seems to have reached the Plan’s milestone of a transmission rate below 2%. In terms of treating children, the main bottleneck is diagnosis. Only 6 countries provide early infant diagnosis to more than 50% of children exposed to HIV. And only Botswana has achieved universal access (defined as 80% coverage). Other priority countries are doing much worse. Cameroon, Chad, Côte d’Ivoire, DRC, and Ethiopia provide treatment to less than 10% of their children living with HIV. Clearly, there is considerable unfinished business relating to mother-to-child transmission of HIV to take into the SDG era.
21. In our previous 3 annual surveys of women’s and children’s health, we have used carefully selected case studies to illustrate key points of concern to us—eg, civil society accountability in Nigeria, donor accountability at the World Bank, or quality of care in Brazil. This year is no exception. We were especially inspired by the University of Oslo Commission on Political Determinants of Health. As such, we selected 3 case studies of reproductive health (India, Philippines, DRC) where political determinants of health played an important part. Reproductive health is especially influenced by political factors because of ideological resistance to evidence-based solutions. The case studies we have chosen for our 2015 report are India’s failing policies in family planning, with horrific consequences for women who endure grave dangers in sterilisation camps; DRC’s long history of sexual violence and the government’s first steps to address this pervasive societal atrocity; the gradual easing of the Catholic Church’s oppressive effects in the Philippines regarding access to reproductive health services; China’s impressive gains in maternal and child health, but with deeply ingrained sub-national disparities; and Argentina’s successful conditional cash transfer programmes, which now need much greater coordination. The message from these case studies, 29 in total since we began our work, is that whatever the global generalisations we are encouraging in our recommendations, accountability begins and ends for women and children in countries.
22. The architecture of accountability for Every Woman, Every Child has led to a strong collaboration between the Partnership for Maternal, Newborn, and Child Health (PMNCH) and the iERG. In three past PMNCH reports, commitments to the Global Strategy have been documented and issues investigated in ways that have been synergistic and complementary to the work of the iERG. In 2015, PMNCH is not producing an annual report. However, we are fortunate that the Partnership has continued tracking financial flows to RMNCH. Here, we present a summary of their latest findings:
• The number of stakeholders committing to women’s and children’s health has increased from 111 in 2010 to 334 in 2015 (Figure 7).
• Since May, 2014, an additional 34 commitment makers made pledges to the Global Strategy—17 of them in support of the Every Newborn Action Plan.
• Financial commitments to the Global Strategy have reached US$45 billion (once double-counting has been removed); 9 financial commitments have been made since May, 2014.
• As of May, 2015, US$31 billion of the US$45 billion committed has been disbursed (Figures 8 and 9).
• Annual disbursements for women’s and children’s health have increased substantially since the launch of the Global Strategy: donors disbursed US$11.9 billion for RMNCH in 75 priority countries in 2013, an increase of 25% since 2010; in 2013, RMNCH ODA to these 75 countries grew by 15%, a substantially higher figure than 2011 (0.5%) and 2012 (7.8%) (Figure 10).
• Previously underfunded areas, such as family planning, have seen steep increases in financial support—50.5% since the launch of the Global Strategy (from US$452.9 in 2010 to US$681.6 in 2013) (Figure 11).
• There are persistent geographic inequities in RMNCH funding—DRC and Guinea, for example, continue to receive relatively small amounts of ODA (Figure 12).
• However, there are signs that for some countries, advocacy around equity may be having an impact—eg, countries with high maternal mortality (such as Sierra Leone, Chad, and Côte d’Ivoire) saw rises in RMNCH support in 2013 after a phase of decline.
• Countries are increasingly demonstrating their commitment to women’s and children’s health—domestic public sector spending on RMNCH increased 115% from 2006 to 2013 for our 75 countries of concern (Figure 13).
57Achievements and Prospects
2. Progress in Women’s and Children’s Health in Countries
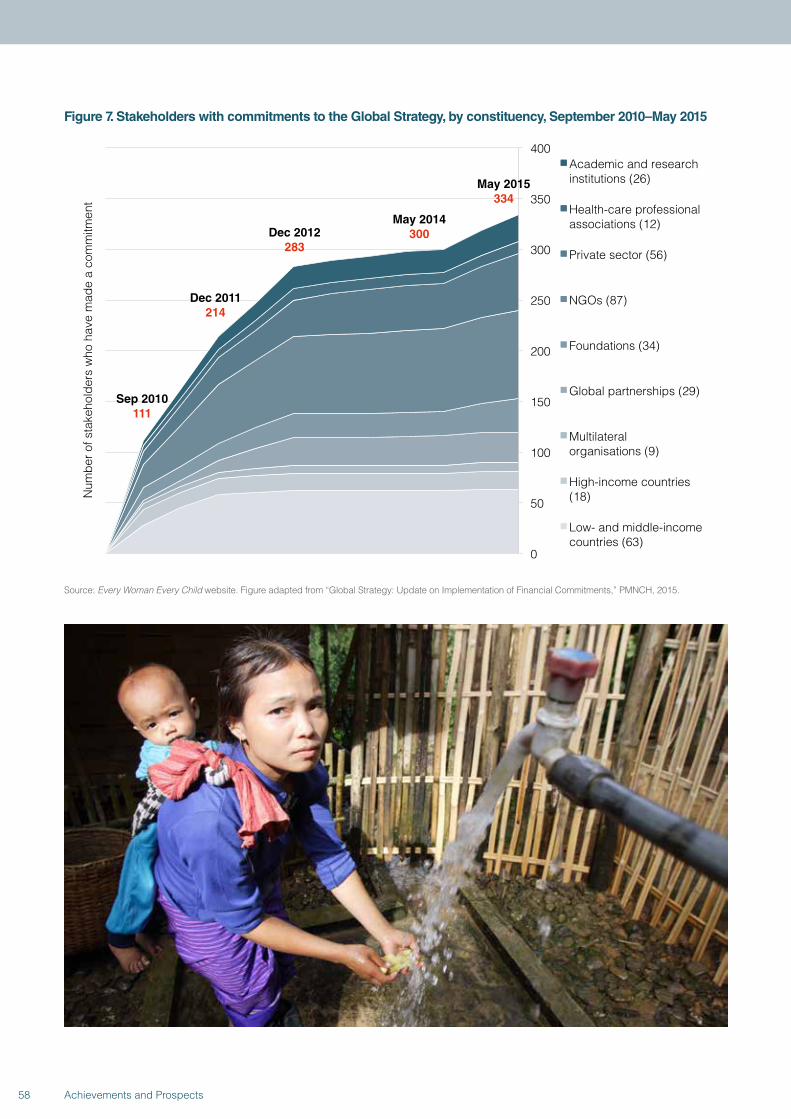
Figure 7. Stakeholders with commitments to the Global Strategy, by constituency, September 2010–May 2015
Sep 2010 111
Dec 2011 214
Dec 2012 283
May 2014 300
0
50
100
150
200
250
300
350
400
Num
ber o
f sta
keho
lder
s w
ho h
ave
mad
e a
com
mitm
ent
Academic and research institutions (26)
Health-care professional associations (12)
Private sector (56)
NGOs (87)
Foundations (34)
Global partnerships (29)
Multilateral organisations (9)
High-income countries (18)
Low- and middle-income countries (63)
May 2015 334
Source: Every Woman Every Child website. Figure adapted from “Global Strategy: Update on Implementation of Financial Commitments,” PMNCH, 2015.
58 Achievements and Prospects
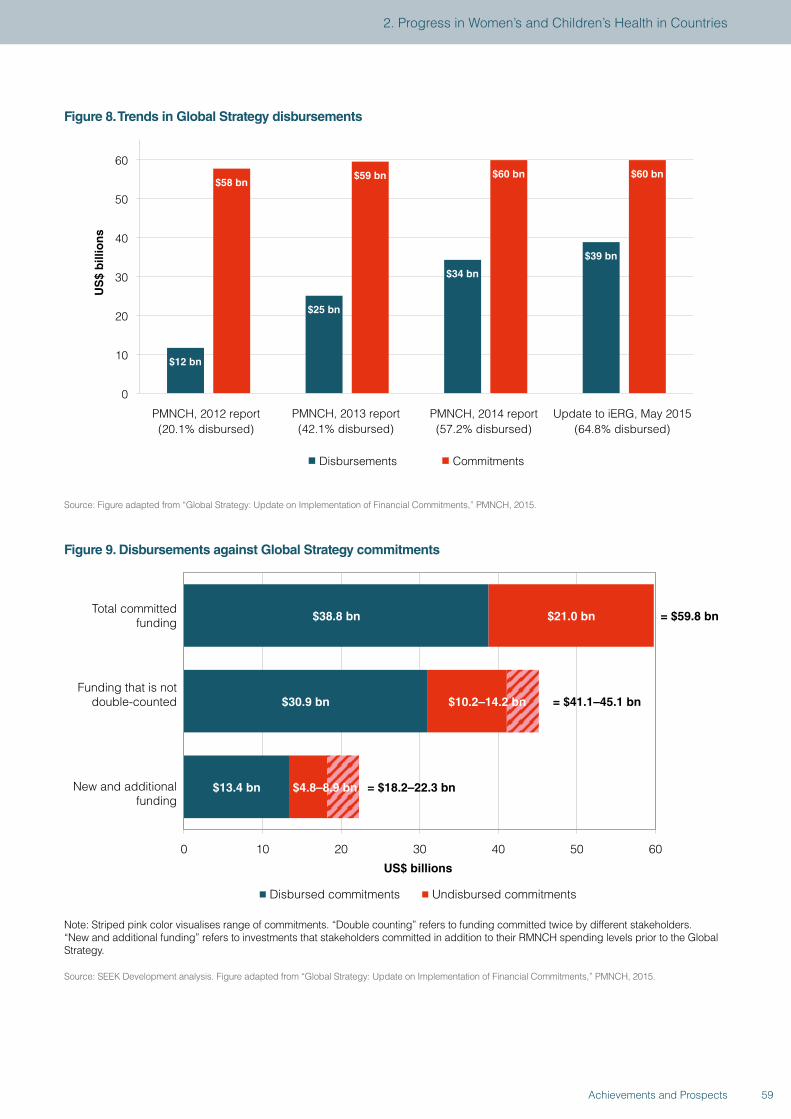
Figure 8. Trends in Global Strategy disbursements
$12 bn
$25 bn
$34 bn
$39 bn
$58 bn $59 bn $60 bn $60 bn
0
10
20
30
40
50
60
PMNCH, 2012 report (20.1% disbursed)
PMNCH, 2013 report (42.1% disbursed)
PMNCH, 2014 report (57.2% disbursed)
Update to iERG, May 2015 (64.8% disbursed)
Disbursements Commitments
US
$ b
illio
ns
Source: Figure adapted from “Global Strategy: Update on Implementation of Financial Commitments,” PMNCH, 2015.
Figure 9. Disbursements against Global Strategy commitments
$38.8 bn
$30.9 bn
$13.4 bn
$21.0 bn
= $59.8 bn
= $41.1–45.1 bn
= $18.2–22.3 bn
0 10 20 30 40 50 60
Total committed funding
Funding that is not double-counted
New and additional funding
US$ billions
Disbursed commitments Undisbursed commitments
$10.2–14.2 bn
$4.8–8.9 bn
Note: Striped pink color visualises range of commitments. “Double counting” refers to funding committed twice by different stakeholders. “New and additional funding” refers to investments that stakeholders committed in addition to their RMNCH spending levels prior to the Global Strategy.
Source: SEEK Development analysis. Figure adapted from “Global Strategy: Update on Implementation of Financial Commitments,” PMNCH, 2015.
59Achievements and Prospects
2. Progress in Women’s and Children’s Health in Countries
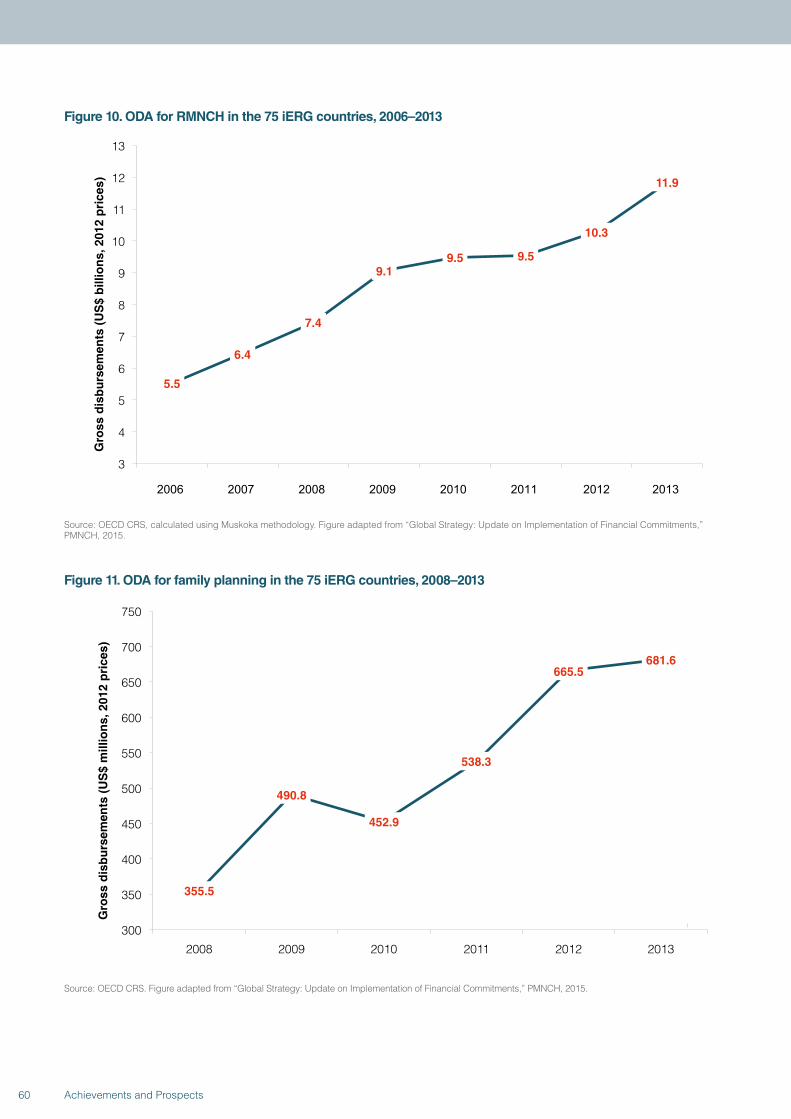
Figure 10. ODA for RMNCH in the 75 iERG countries, 2006–2013
5.5
6.4
7.4
9.1 9.5 9.5
10.3
11.9
3
4
5
6
7
8
9
10
11
12
13
Gro
ss d
isb
urs
emen
ts (
US
$ b
illio
ns,
201
2 p
rice
s)
2006 2007 2008 2009 2010 2011 2012 2013
Source: OECD CRS, calculated using Muskoka methodology. Figure adapted from “Global Strategy: Update on Implementation of Financial Commitments,” PMNCH, 2015.
Figure 11. ODA for family planning in the 75 iERG countries, 2008–2013
355.5
490.8
452.9
538.3
665.5 681.6
300
350
400
450
500
550
600
650
700
750
2008 2009 2010 2011 2012 2013
Gro
ss d
isb
urs
emen
ts (
US
$ m
illio
ns,
201
2 p
rice
s)
Source: OECD CRS. Figure adapted from “Global Strategy: Update on Implementation of Financial Commitments,” PMNCH, 2015.
60 Achievements and Prospects
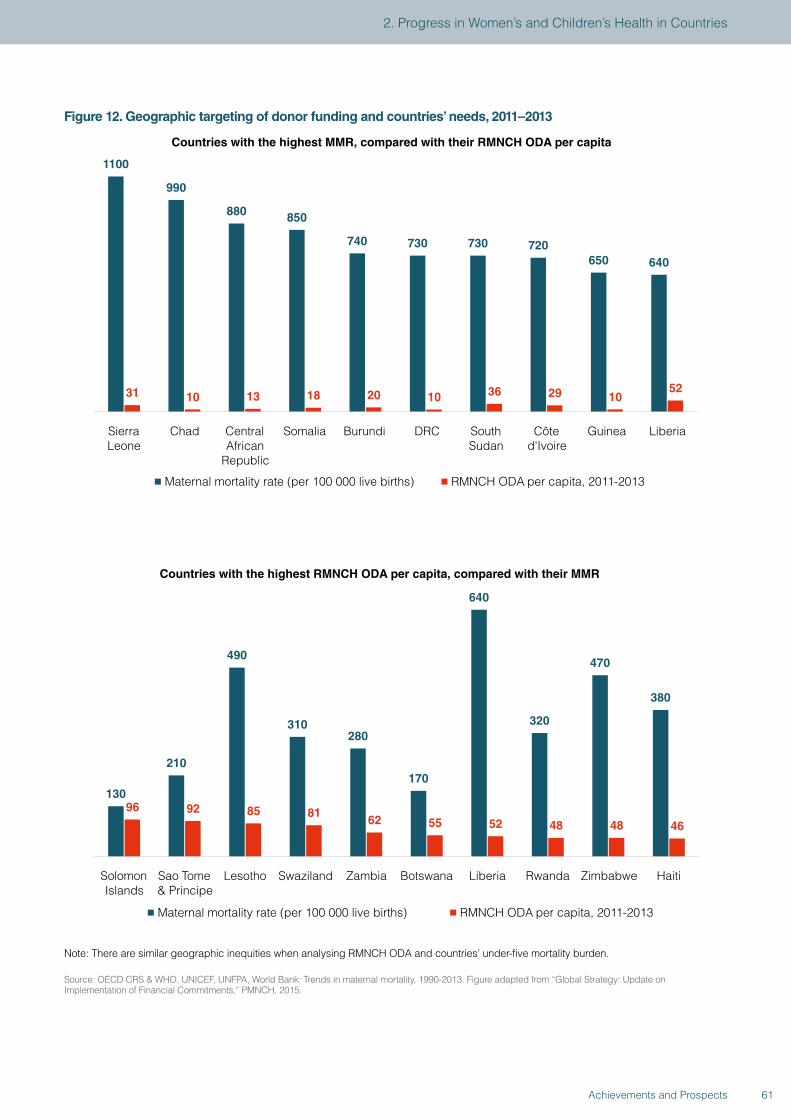
Figure 12. Geographic targeting of donor funding and countries’ needs, 2011–2013
1100
990
880 850
740 730 730 720 650 640
31 10 13 18 20 10 36 29 10 52
Sierra Leone
Chad Central African
Republic
Somalia Burundi DRC
South Sudan
Côte d'Ivoire
Guinea Liberia
Countries with the highest MMR, compared with their RMNCH ODA per capita
Maternal mortality rate (per 100 000 live births) RMNCH ODA per capita, 2011-2013
130
210
490
310 280
170
640
320
470
380
96 92 85 81 62 55 52 48 48 46
Solomon Islands
Sao Tome & Principe
Lesotho Swaziland Zambia Botswana Liberia Rwanda Zimbabwe Haiti
Countries with the highest RMNCH ODA per capita, compared with their MMR
Maternal mortality rate (per 100 000 live births) RMNCH ODA per capita, 2011-2013
Note: There are similar geographic inequities when analysing RMNCH ODA and countries’ under-five mortality burden.
Source: OECD CRS & WHO, UNICEF, UNFPA, World Bank: Trends in maternal mortality, 1990-2013. Figure adapted from “Global Strategy: Update on Implementation of Financial Commitments,” PMNCH, 2015.
61Achievements and Prospects
2. Progress in Women’s and Children’s Health in Countries
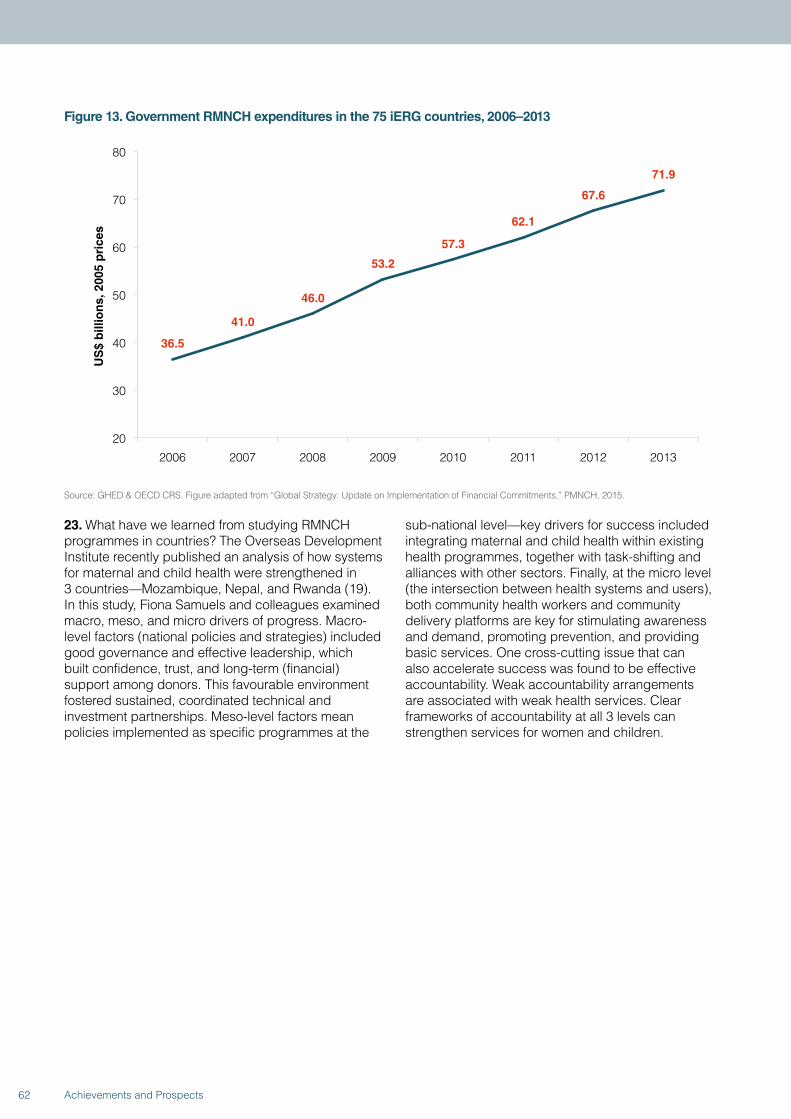
Figure 13. Government RMNCH expenditures in the 75 iERG countries, 2006–2013
36.5
41.0
46.0
53.2
57.3
62.1
67.6
71.9
20
30
40
50
60
70
80
2006 2007 2008 2009 2010 2011 2012 2013
US
$ b
illio
ns,
200
5 p
rice
s
Source: GHED & OECD CRS. Figure adapted from “Global Strategy: Update on Implementation of Financial Commitments,” PMNCH, 2015.
23. What have we learned from studying RMNCH programmes in countries? The Overseas Development Institute recently published an analysis of how systems for maternal and child health were strengthened in 3 countries—Mozambique, Nepal, and Rwanda (19). In this study, Fiona Samuels and colleagues examined macro, meso, and micro drivers of progress. Macro-level factors (national policies and strategies) included good governance and effective leadership, which built confidence, trust, and long-term (financial) support among donors. This favourable environment fostered sustained, coordinated technical and investment partnerships. Meso-level factors mean policies implemented as specific programmes at the
sub-national level—key drivers for success included integrating maternal and child health within existing health programmes, together with task-shifting and alliances with other sectors. Finally, at the micro level (the intersection between health systems and users), both community health workers and community delivery platforms are key for stimulating awareness and demand, promoting prevention, and providing basic services. One cross-cutting issue that can also accelerate success was found to be effective accountability. Weak accountability arrangements are associated with weak health services. Clear frameworks of accountability at all 3 levels can strengthen services for women and children.
62 Achievements and Prospects
3. THE COMMISSION ON INFORMATION AND ACCOUNTABILITY: A FINAL REPORT CARD
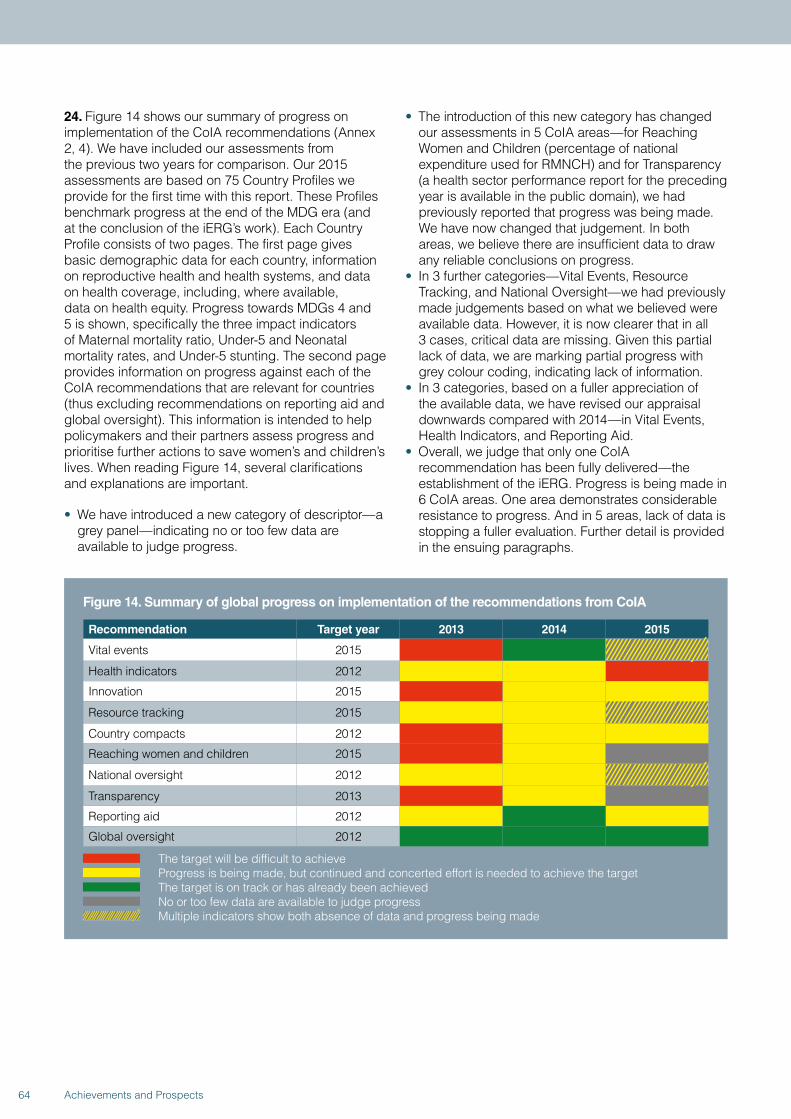
24. Figure 14 shows our summary of progress on implementation of the CoIA recommendations (Annex 2, 4). We have included our assessments from the previous two years for comparison. Our 2015 assessments are based on 75 Country Profiles we provide for the first time with this report. These Profiles benchmark progress at the end of the MDG era (and at the conclusion of the iERG’s work). Each Country Profile consists of two pages. The first page gives basic demographic data for each country, information on reproductive health and health systems, and data on health coverage, including, where available, data on health equity. Progress towards MDGs 4 and 5 is shown, specifically the three impact indicators of Maternal mortality ratio, Under-5 and Neonatal mortality rates, and Under-5 stunting. The second page provides information on progress against each of the CoIA recommendations that are relevant for countries (thus excluding recommendations on reporting aid and global oversight). This information is intended to help policymakers and their partners assess progress and prioritise further actions to save women’s and children’s lives. When reading Figure 14, several clarifications and explanations are important.
• We have introduced a new category of descriptor—a grey panel—indicating no or too few data are available to judge progress.
• The introduction of this new category has changed our assessments in 5 CoIA areas—for Reaching Women and Children (percentage of national expenditure used for RMNCH) and for Transparency (a health sector performance report for the preceding year is available in the public domain), we had previously reported that progress was being made. We have now changed that judgement. In both areas, we believe there are insufficient data to draw any reliable conclusions on progress.
• In 3 further categories—Vital Events, Resource Tracking, and National Oversight—we had previously made judgements based on what we believed were available data. However, it is now clearer that in all 3 cases, critical data are missing. Given this partial lack of data, we are marking partial progress with grey colour coding, indicating lack of information.
• In 3 categories, based on a fuller appreciation of the available data, we have revised our appraisal downwards compared with 2014—in Vital Events, Health Indicators, and Reporting Aid.
• Overall, we judge that only one CoIA recommendation has been fully delivered—the establishment of the iERG. Progress is being made in 6 CoIA areas. One area demonstrates considerable resistance to progress. And in 5 areas, lack of data is stopping a fuller evaluation. Further detail is provided in the ensuing paragraphs.
Figure 14. Summary of global progress on implementation of the recommendations from CoIA
Recommendation Target year 2013 2014 2015
Vital events 2015
Health indicators 2012
Innovation 2015
Resource tracking 2015
Country compacts 2012
Reaching women and children 2015
National oversight 2012
Transparency 2013
Reporting aid 2012
Global oversight 2012
The target will be difficult to achieve Progress is being made, but continued and concerted effort is needed to achieve the target The target is on track or has already been achieved No or too few data are available to judge progress Multiple indicators show both absence of data and progress being made
64 Achievements and Prospects
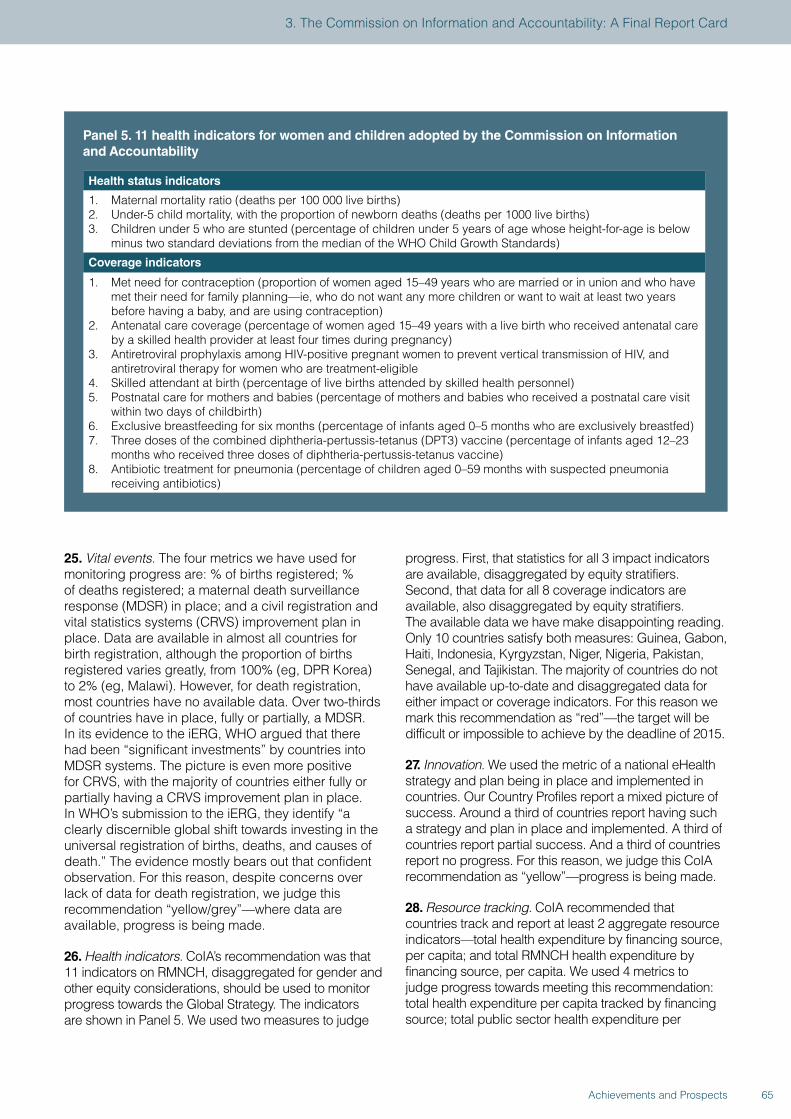
25. Vital events. The four metrics we have used for monitoring progress are: % of births registered; % of deaths registered; a maternal death surveillance response (MDSR) in place; and a civil registration and vital statistics systems (CRVS) improvement plan in place. Data are available in almost all countries for birth registration, although the proportion of births registered varies greatly, from 100% (eg, DPR Korea) to 2% (eg, Malawi). However, for death registration, most countries have no available data. Over two-thirds of countries have in place, fully or partially, a MDSR. In its evidence to the iERG, WHO argued that there had been “significant investments” by countries into MDSR systems. The picture is even more positive for CRVS, with the majority of countries either fully or partially having a CRVS improvement plan in place. In WHO’s submission to the iERG, they identify “a clearly discernible global shift towards investing in the universal registration of births, deaths, and causes of death.” The evidence mostly bears out that confident observation. For this reason, despite concerns over lack of data for death registration, we judge this recommendation “yellow/grey”—where data are available, progress is being made.
26. Health indicators. CoIA’s recommendation was that 11 indicators on RMNCH, disaggregated for gender and other equity considerations, should be used to monitor progress towards the Global Strategy. The indicators are shown in Panel 5. We used two measures to judge
progress. First, that statistics for all 3 impact indicators are available, disaggregated by equity stratifiers. Second, that data for all 8 coverage indicators are available, also disaggregated by equity stratifiers. The available data we have make disappointing reading. Only 10 countries satisfy both measures: Guinea, Gabon, Haiti, Indonesia, Kyrgyzstan, Niger, Nigeria, Pakistan, Senegal, and Tajikistan. The majority of countries do not have available up-to-date and disaggregated data for either impact or coverage indicators. For this reason we mark this recommendation as “red”—the target will be difficult or impossible to achieve by the deadline of 2015.
27. Innovation. We used the metric of a national eHealth strategy and plan being in place and implemented in countries. Our Country Profiles report a mixed picture of success. Around a third of countries report having such a strategy and plan in place and implemented. A third of countries report partial success. And a third of countries report no progress. For this reason, we judge this CoIA recommendation as “yellow”—progress is being made.
28. Resource tracking. CoIA recommended that countries track and report at least 2 aggregate resource indicators—total health expenditure by financing source, per capita; and total RMNCH health expenditure by financing source, per capita. We used 4 metrics to judge progress towards meeting this recommendation: total health expenditure per capita tracked by financing source; total public sector health expenditure per
Panel 5. 11 health indicators for women and children adopted by the Commission on Information and Accountability
Health status indicators
1. Maternal mortality ratio (deaths per 100 000 live births)2. Under-5 child mortality, with the proportion of newborn deaths (deaths per 1000 live births)3. Children under 5 who are stunted (percentage of children under 5 years of age whose height-for-age is below
minus two standard deviations from the median of the WHO Child Growth Standards)
Coverage indicators
1. Met need for contraception (proportion of women aged 15–49 years who are married or in union and who have met their need for family planning—ie, who do not want any more children or want to wait at least two years before having a baby, and are using contraception)
2. Antenatal care coverage (percentage of women aged 15–49 years with a live birth who received antenatal care by a skilled health provider at least four times during pregnancy)
3. Antiretroviral prophylaxis among HIV-positive pregnant women to prevent vertical transmission of HIV, and antiretroviral therapy for women who are treatment-eligible
4. Skilled attendant at birth (percentage of live births attended by skilled health personnel) 5. Postnatal care for mothers and babies (percentage of mothers and babies who received a postnatal care visit
within two days of childbirth) 6. Exclusive breastfeeding for six months (percentage of infants aged 0–5 months who are exclusively breastfed) 7. Three doses of the combined diphtheria-pertussis-tetanus (DPT3) vaccine (percentage of infants aged 12–23
months who received three doses of diphtheria-pertussis-tetanus vaccine) 8. Antibiotic treatment for pneumonia (percentage of children aged 0–59 months with suspected pneumonia
receiving antibiotics)
65Achievements and Prospects
3. The Commission on Information and Accountability: A Final Report Card
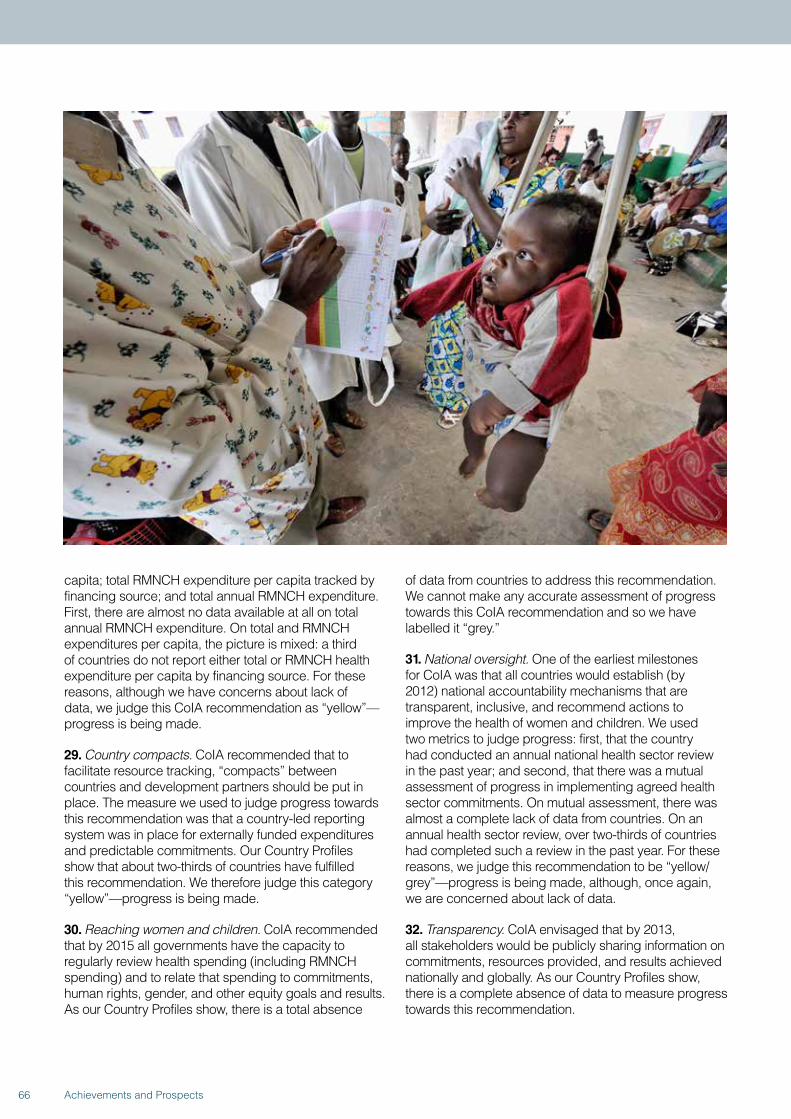
capita; total RMNCH expenditure per capita tracked by financing source; and total annual RMNCH expenditure. First, there are almost no data available at all on total annual RMNCH expenditure. On total and RMNCH expenditures per capita, the picture is mixed: a third of countries do not report either total or RMNCH health expenditure per capita by financing source. For these reasons, although we have concerns about lack of data, we judge this CoIA recommendation as “yellow”—progress is being made.
29. Country compacts. CoIA recommended that to facilitate resource tracking, “compacts” between countries and development partners should be put in place. The measure we used to judge progress towards this recommendation was that a country-led reporting system was in place for externally funded expenditures and predictable commitments. Our Country Profiles show that about two-thirds of countries have fulfilled this recommendation. We therefore judge this category “yellow”—progress is being made.
30. Reaching women and children. CoIA recommended that by 2015 all governments have the capacity to regularly review health spending (including RMNCH spending) and to relate that spending to commitments, human rights, gender, and other equity goals and results. As our Country Profiles show, there is a total absence
of data from countries to address this recommendation. We cannot make any accurate assessment of progress towards this CoIA recommendation and so we have labelled it “grey.”
31. National oversight. One of the earliest milestones for CoIA was that all countries would establish (by 2012) national accountability mechanisms that are transparent, inclusive, and recommend actions to improve the health of women and children. We used two metrics to judge progress: first, that the country had conducted an annual national health sector review in the past year; and second, that there was a mutual assessment of progress in implementing agreed health sector commitments. On mutual assessment, there was almost a complete lack of data from countries. On an annual health sector review, over two-thirds of countries had completed such a review in the past year. For these reasons, we judge this recommendation to be “yellow/grey”—progress is being made, although, once again, we are concerned about lack of data.
32. Transparency. CoIA envisaged that by 2013, all stakeholders would be publicly sharing information on commitments, resources provided, and results achieved nationally and globally. As our Country Profiles show, there is a complete absence of data to measure progress towards this recommendation.
66 Achievements and Prospects
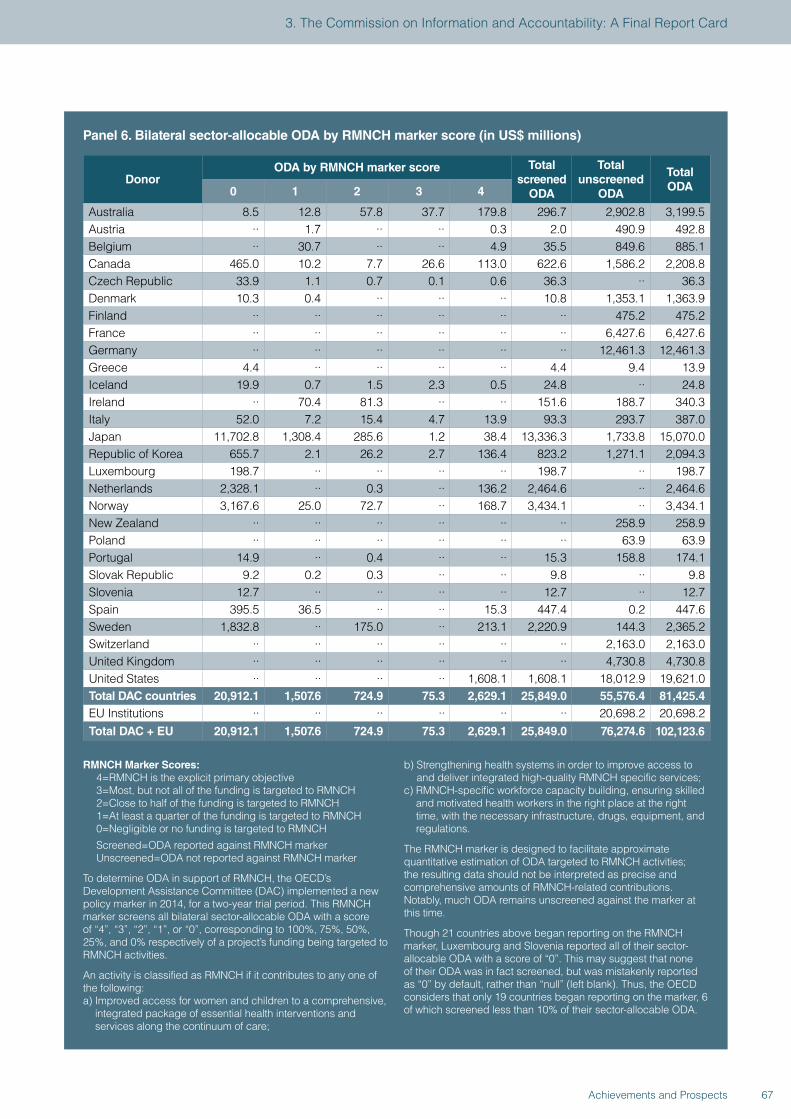
Panel 6. Bilateral sector-allocable ODA by RMNCH marker score (in US$ millions)
DonorODA by RMNCH marker score Total
screened ODA
Total unscreened
ODA
Total ODA0 1 2 3 4
Australia 8.5 12.8 57.8 37.7 179.8 296.7 2,902.8 3,199.5 Austria ·· 1.7 ·· ·· 0.3 2.0 490.9 492.8 Belgium ·· 30.7 ·· ·· 4.9 35.5 849.6 885.1 Canada 465.0 10.2 7.7 26.6 113.0 622.6 1,586.2 2,208.8 Czech Republic 33.9 1.1 0.7 0.1 0.6 36.3 ·· 36.3 Denmark 10.3 0.4 ·· ·· ·· 10.8 1,353.1 1,363.9 Finland ·· ·· ·· ·· ·· ·· 475.2 475.2 France ·· ·· ·· ·· ·· ·· 6,427.6 6,427.6 Germany ·· ·· ·· ·· ·· ·· 12,461.3 12,461.3 Greece 4.4 ·· ·· ·· ·· 4.4 9.4 13.9 Iceland 19.9 0.7 1.5 2.3 0.5 24.8 ·· 24.8 Ireland ·· 70.4 81.3 ·· ·· 151.6 188.7 340.3 Italy 52.0 7.2 15.4 4.7 13.9 93.3 293.7 387.0 Japan 11,702.8 1,308.4 285.6 1.2 38.4 13,336.3 1,733.8 15,070.0 Republic of Korea 655.7 2.1 26.2 2.7 136.4 823.2 1,271.1 2,094.3 Luxembourg 198.7 ·· ·· ·· ·· 198.7 ·· 198.7 Netherlands 2,328.1 ·· 0.3 ·· 136.2 2,464.6 ·· 2,464.6 Norway 3,167.6 25.0 72.7 ·· 168.7 3,434.1 ·· 3,434.1 New Zealand ·· ·· ·· ·· ·· ·· 258.9 258.9 Poland ·· ·· ·· ·· ·· ·· 63.9 63.9 Portugal 14.9 ·· 0.4 ·· ·· 15.3 158.8 174.1 Slovak Republic 9.2 0.2 0.3 ·· ·· 9.8 ·· 9.8 Slovenia 12.7 ·· ·· ·· ·· 12.7 ·· 12.7 Spain 395.5 36.5 ·· ·· 15.3 447.4 0.2 447.6 Sweden 1,832.8 ·· 175.0 ·· 213.1 2,220.9 144.3 2,365.2 Switzerland ·· ·· ·· ·· ·· ·· 2,163.0 2,163.0 United Kingdom ·· ·· ·· ·· ·· ·· 4,730.8 4,730.8 United States ·· ·· ·· ·· 1,608.1 1,608.1 18,012.9 19,621.0 Total DAC countries 20,912.1 1,507.6 724.9 75.3 2,629.1 25,849.0 55,576.4 81,425.4 EU Institutions ·· ·· ·· ·· ·· ·· 20,698.2 20,698.2 Total DAC + EU 20,912.1 1,507.6 724.9 75.3 2,629.1 25,849.0 76,274.6 102,123.6
RMNCH Marker Scores:4=RMNCH is the explicit primary objective3=Most, but not all of the funding is targeted to RMNCH2=Close to half of the funding is targeted to RMNCH1=At least a quarter of the funding is targeted to RMNCH0=Negligible or no funding is targeted to RMNCH
Screened=ODA reported against RMNCH markerUnscreened=ODA not reported against RMNCH marker
To determine ODA in support of RMNCH, the OECD’s Development Assistance Committee (DAC) implemented a new policy marker in 2014, for a two-year trial period. This RMNCH marker screens all bilateral sector-allocable ODA with a score of “4”, “3”, “2”, “1”, or “0”, corresponding to 100%, 75%, 50%, 25%, and 0% respectively of a project’s funding being targeted to RMNCH activities.
An activity is classified as RMNCH if it contributes to any one of the following:a) Improved access for women and children to a comprehensive,
integrated package of essential health interventions and services along the continuum of care;
b) Strengthening health systems in order to improve access to and deliver integrated high-quality RMNCH specific services;
c) RMNCH-specific workforce capacity building, ensuring skilled and motivated health workers in the right place at the right time, with the necessary infrastructure, drugs, equipment, and regulations.
The RMNCH marker is designed to facilitate approximate quantitative estimation of ODA targeted to RMNCH activities; the resulting data should not be interpreted as precise and comprehensive amounts of RMNCH-related contributions. Notably, much ODA remains unscreened against the marker at this time.
Though 21 countries above began reporting on the RMNCH marker, Luxembourg and Slovenia reported all of their sector-allocable ODA with a score of “0”. This may suggest that none of their ODA was in fact screened, but was mistakenly reported as “0” by default, rather than “null” (left blank). Thus, the OECD considers that only 19 countries began reporting on the marker, 6 of which screened less than 10% of their sector-allocable ODA.
67Achievements and Prospects
3. The Commission on Information and Accountability: A Final Report Card
33. Reporting aid for women’s and children’s health. CoIA wanted OECD-DAC to improve the Creditor Reporting System (CRS) so that it could capture all RMNCH spending by development partners. The Development Advisory Committee (DAC) has 29 members who each year report aid flows, together with 17 non-DAC countries, multilateral organisations, and the Gates Foundation. The CRS is the recognised source of comprehensive data for aid-recipient countries. Panel 6 sets out the first data from CoIA’s request to capture data on RMNCH support. This work will be monitored and evaluated over a two-year trial period. It has been emphasised to the iERG that we should be cautious when interpreting these numbers. The reported data are incomplete since this was the first year of reporting on a test basis. Many donors had not yet implemented the marker in their systems. Concerning the 21 donors in the panel, two (Luxembourg and Slovenia) reported all of their sector-allocable ODA with a score of “0,” which likely suggests they did not screen their aid and reported “0” by default instead of “null.” Therefore, 19 countries began reporting on the marker, 6 of which screened less than 10% of their sector-allocable aid. The main message of these early and preliminary data is that a marker is now in place to identify activities targeting RMNCH, but more donors need to begin screening their aid in order to get an idea of how much is going to RMNCH.
34. Global oversight. This CoIA recommendation concerned the creation of a time-limited iERG to report regularly on results and resources related to the Global Strategy and on progress in implementing CoIA’s recommendations. This 2015 report will be our final review of progress towards the CoIA goals, together with the achievements of Every Woman, Every Child and the Commission on Life-Saving Commodities. We note here that in its evidence to the iERG, WHO wrote that, “Independent accountability remains essential for the post-2015 period.” They continued: “There is multi-stakeholder consensus on the need for independent accountability for women’s and children’s health post-2015, and this is a priority in the development of the new Global Strategy for Women’s, Children’s, and Adolescents’ Health.”
35. Leadership globally to implement the CoIA recommendations has fallen especially to the H4+, a partnership of UN agencies including UNICEF, UNFPA, WHO, the World Bank, UNAIDS, and UN Women. The H4+ leads collectively at the global level, and coordinates technical assistance in countries. Its work is broad, encompassing initiatives such as A Promise Renewed, the Commission on Life-Saving Commodities, the Every Newborn Action Plan, and Every Woman, Every Child. In their submission to the iERG, the H4+ helpfully sets out the obstacles to
delivering the aspirations of CoIA. In summary, these obstacles are:
• Coordination: a continuous challenge, especially in countries lacking compacts and health sector reviews.
• Inclusion: of external partner organisations, especially civil society.
• Resource mobilisation: to fund joint work plans.• Monitoring and evaluation: to learn lessons and
document best practices.• Scaling up: to achieve adequate reach and coverage.• Capacity: countries report challenges of being forced
to choose among multiple priorities.• Instability: political shifts and humanitarian crises can
disrupt RMNCH activities.• Human resources: a further capacity challenge,
to implement, provide, and lead RMNCH services.
36. One of the most important positive effects of the CoIA process has been the culture of transparency and accountability it has fostered among partners. The iERG has been a fortunate beneficiary of this effect. We now receive submissions from a wide variety of partners to the Global Strategy, detailing their experiences, successes, and challenges (see Annex 5). Although these are self-reports and not independently verified, they have enriched the culture of accountability enormously.
37. In its evidence to the iERG, The Global Fund to Fight AIDS, Tuberculosis, and Malaria reported how disease-specific investments have improved health for women and children, and helped to strengthen health systems. The Fund also described how innovative financing partnerships in countries are advancing its work still further. The New Funding Model adopted by the Global Fund has offered new opportunities to strengthen its commitment to women and children. The Global Fund is already an important contributor to women’s and children’s health. For example, in 2010, the Fund contributed about 12% of ODA for maternal, newborn, and child health programmes for 74 priority countries. Following the Fund’s replenishment in 2013, around 8.6% of total allocations have been for RMNCAH interventions. Countries have been encouraged to link their AIDS, TB, and malaria programmes to RMNCAH. Examples include: 1.4 million long-lasting insecticidal nets for pregnant women and children in Indonesia; and investments in community health nurses to provide maternal and child health services in Afghanistan. Partnerships with the World Bank, UNICEF, UNFPA, and the Global Financing Facility leverage the part played by the Global Fund still further. As the Fund plans its new 2017-21 strategy, the contribution it can make to RMNCAH is one of the “key components being considered.”
68 Achievements and Prospects
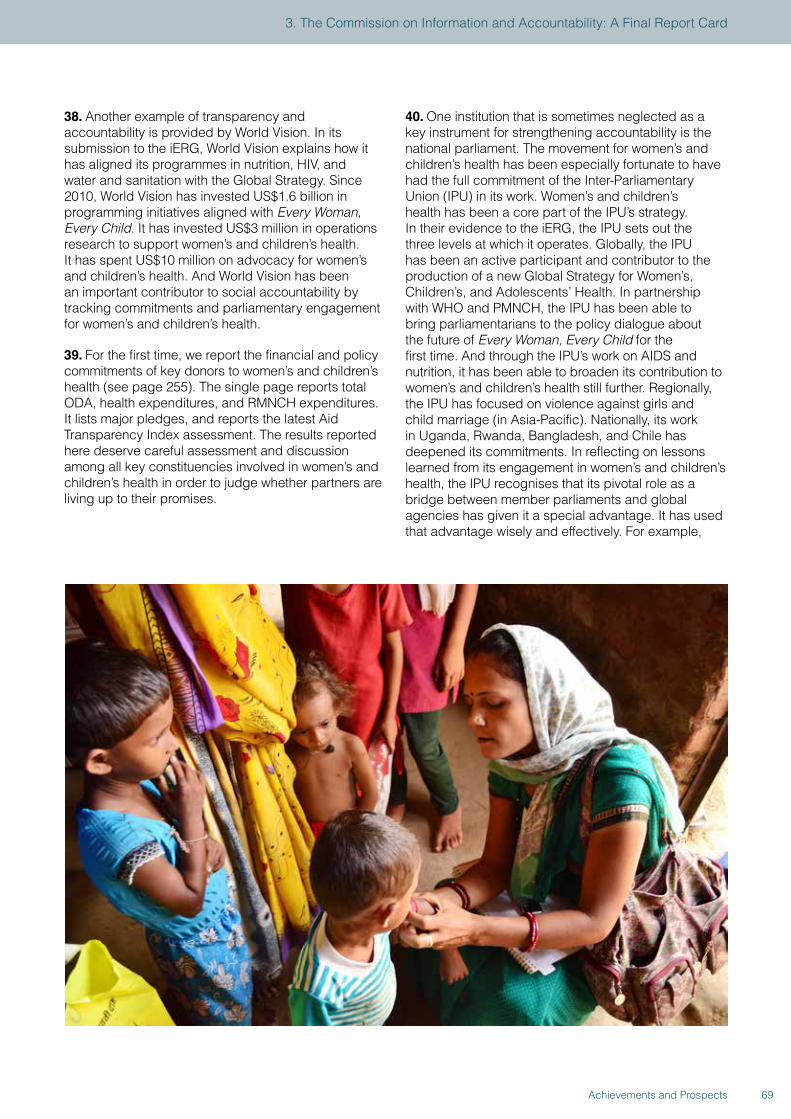
38. Another example of transparency and accountability is provided by World Vision. In its submission to the iERG, World Vision explains how it has aligned its programmes in nutrition, HIV, and water and sanitation with the Global Strategy. Since 2010, World Vision has invested US$1.6 billion in programming initiatives aligned with Every Woman, Every Child. It has invested US$3 million in operations research to support women’s and children’s health. It has spent US$10 million on advocacy for women’s and children’s health. And World Vision has been an important contributor to social accountability by tracking commitments and parliamentary engagement for women’s and children’s health.
39. For the first time, we report the financial and policy commitments of key donors to women’s and children’s health (see page 255). The single page reports total ODA, health expenditures, and RMNCH expenditures. It lists major pledges, and reports the latest Aid Transparency Index assessment. The results reported here deserve careful assessment and discussion among all key constituencies involved in women’s and children’s health in order to judge whether partners are living up to their promises.
40. One institution that is sometimes neglected as a key instrument for strengthening accountability is the national parliament. The movement for women’s and children’s health has been especially fortunate to have had the full commitment of the Inter-Parliamentary Union (IPU) in its work. Women’s and children’s health has been a core part of the IPU’s strategy. In their evidence to the iERG, the IPU sets out the three levels at which it operates. Globally, the IPU has been an active participant and contributor to the production of a new Global Strategy for Women’s, Children’s, and Adolescents’ Health. In partnership with WHO and PMNCH, the IPU has been able to bring parliamentarians to the policy dialogue about the future of Every Woman, Every Child for the first time. And through the IPU’s work on AIDS and nutrition, it has been able to broaden its contribution to women’s and children’s health still further. Regionally, the IPU has focused on violence against girls and child marriage (in Asia-Pacific). Nationally, its work in Uganda, Rwanda, Bangladesh, and Chile has deepened its commitments. In reflecting on lessons learned from its engagement in women’s and children’s health, the IPU recognises that its pivotal role as a bridge between member parliaments and global agencies has given it a special advantage. It has used that advantage wisely and effectively. For example,
69Achievements and Prospects
3. The Commission on Information and Accountability: A Final Report Card
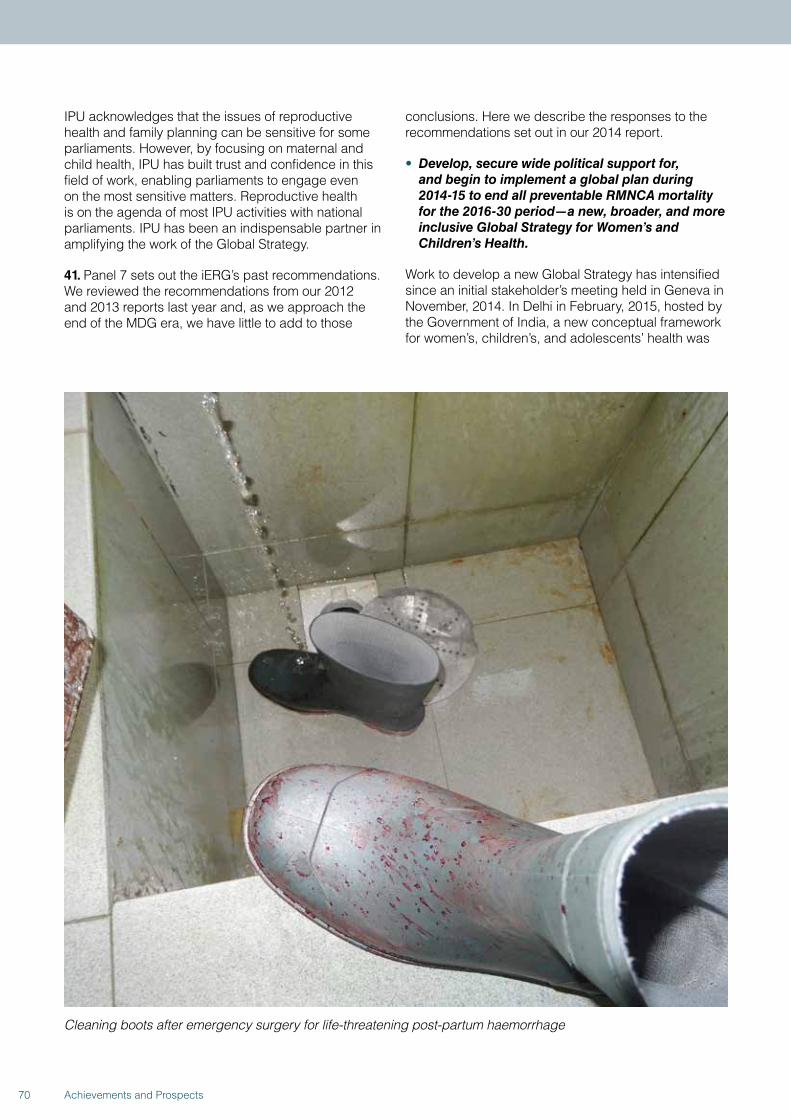
IPU acknowledges that the issues of reproductive health and family planning can be sensitive for some parliaments. However, by focusing on maternal and child health, IPU has built trust and confidence in this field of work, enabling parliaments to engage even on the most sensitive matters. Reproductive health is on the agenda of most IPU activities with national parliaments. IPU has been an indispensable partner in amplifying the work of the Global Strategy.
41. Panel 7 sets out the iERG’s past recommendations. We reviewed the recommendations from our 2012 and 2013 reports last year and, as we approach the end of the MDG era, we have little to add to those
conclusions. Here we describe the responses to the recommendations set out in our 2014 report.
• Develop, secure wide political support for, and begin to implement a global plan during 2014-15 to end all preventable RMNCA mortality for the 2016-30 period—a new, broader, and more inclusive Global Strategy for Women’s and Children’s Health.
Work to develop a new Global Strategy has intensified since an initial stakeholder’s meeting held in Geneva in November, 2014. In Delhi in February, 2015, hosted by the Government of India, a new conceptual framework for women’s, children’s, and adolescents’ health was
Cleaning boots after emergency surgery for life-threatening post-partum haemorrhage
70 Achievements and Prospects
presented at a further stakeholders’ consultation, and drafting of the new strategy was initiated. The new Global Strategy has been driven by strong country ownership, high-level political support, coordinated multi-stakeholder action, and it is closely aligned with the SDGs. A parallel 5-year implementing plan is being developed alongside the strategy. The draft—with its three pillars of survive, thrive, and transform—was refined during a series of high-level and working meetings, together with extensive consultations, throughout 2015. It will be launched in September, 2015, alongside the SDGs. The vision for the new Global Strategy will be discussed further in the next chapter of this report.
• In 2015, create a results-based financing facility to support and sustain this new Global Strategy.
A Global Financing Facility (GFF) in support of Every Woman, Every Child has been designed to meet this objective. It was announced in September, 2014, and its aim is to accelerate efforts to end preventable maternal, newborn, child, and adolescent deaths. The business plan for the GFF was published in May, 2015 (20). The Facility aims to encourage greater domestic spending on women’s and children’s health and attract greater external financing. Its focus will be on family planning, nutrition, health information systems, and adolescents. The work of the GFF will be complemented by a multi-donor GFF Trust Fund, located at the World Bank. 63 of 75 iERG countries will be eligible to receive GFF Trust Fund financing. The precise details of how the GFF will work remain unclear. Will the GFF be offering new money, or will it be simply repurposing existing World Bank assistance? And the Facility has not been universally welcomed (21). Norway has been one of the leading countries advocating for the GFF. But its neighbour, Sweden, argues that the GFF “is a bad idea and we are not planning to fund it.” They see the GFF as contributing to greater fragmentation in global health. And Sweden is not comfortable about the leading part played by the World Bank in the GFF. Our view is that more discussion and consultation is needed to clarify the part to be played by the GFF.
• Between now and 2016, convene a Special Session of the UN General Assembly, led by the Secretary-General, to accelerate international collective action for women’s and children’s health—to align and harmonise the actions of partners, to promote leadership and stewardship, to ensure provision of global public goods, to manage externalities, and to provide direct country assistance.
The iERG approached the Chair of the UN General Assembly (UNGA), which is Denmark for 2015-16.
We were advised that no such Special Session could take place in 2016. There are already two Special Sessions planned, and there is no space for a third. The idea of a mechanism to deliver greater alignment and harmonisation was deemed interesting and useful, but there were questions about whether the UNGA was the best place to do so.
• In 2015, establish a Global Commission on the Health and Human Rights of Women and Children to propose ways to protect, augment, and sustain their health and wellbeing.
The iERG wrote to the Director-General of WHO, Dr Margaret Chan, and the UN High Commissioner for Human Rights, Dr Zeid Ra’ad Al Hussein, to propose such a Commission. Dr Chan replied, welcoming our proposal for greater collaboration between WHO and the Office of the High Commissioner for Human Rights. But she stopped short of endorsing the idea of a Commission. Dr Al Hussein responded with support for a human rights based approach to women’s and children’s health. But he too stopped short of supporting a Commission. At present, we do not see any enthusiasm among partners for a Commission to bring the health and human rights communities together to accelerate progress for women’s and children’s health. We are disappointed by this outcome, which we see as a missed opportunity. We are unsure how to interpret the signal that leaders from the health and human rights communities do not wish to work more closely together.
• From 2015 onwards, hold a civil-society led World Health Forum adjacent to the World Health Assembly to strengthen political accountability for women’s and children’s health.
During the May, 2015 World Health Assembly, the White Ribbon Alliance held the first ever Global Dialogue between Citizens and Governments (22). This Dialogue, supported by the Governments of Bangladesh and Sweden, was the first formal civil society forum held on site at the World Health Assembly to improve accountability for women’s and children’s health. We hope that it signalled an important cultural and political shift within the World Health Assembly.
• In 2015, establish and fully resource a new Independent Expert Review Group to monitor, review, and propose actions to accelerate global and country progress towards improved women’s and children’s health during the period of the Sustainable Development Goals.
The mechanism of accountability for a new Global Strategy is uncertain. The iERG has submitted its own proposal (see Annex 6).
71Achievements and Prospects
3. The Commission on Information and Accountability: A Final Report Card
Panel 7. Recommendations from the iERG, 2012-2014
iERG 2012 Recommendations1. Strengthen the global governance framework
for women’s and children’s health.
2. Devise a global investment framework for women’s and children’s health.
3. Set clearer country-specific strategic priorities for implementing the Global Strategy and test innovative mechanisms for delivering those priorities.
4. Accelerate the uptake and evaluation of eHealth and mHealth technologies.
5. Strengthen human rights tools and frameworks to achieve better health and accountability for women and children.
6. Expand the commitment and capacity to evaluate initiatives for women’s and children’s health.
iERG 2013 Recommendations1. Strengthen country accountability:
Ministers of Health, together with partners, must demonstrably prioritise and evaluate country-led, inclusive, transparent, and participatory national oversight mechanisms to advance women’s and children’s health.
2. Demand global accountability for women and children: Advocate for and win an independent accountability mechanism to monitor, review, and continuously improve actions to deliver the post-2015 sustainable development agenda.
3. Take adolescents seriously: Include an adolescent indicator in all monitoring mechanisms for women’s and children’s health, and meaningfully involve young people on
all policymaking bodies affecting women and children.
4. Prioritise quality to reinforce the value of a human-rights-based approach to women’s and children’s health: Make the quality of care the route to equity and dignity for women and children.
5. Make health professionals count: Deliver an expanded and skilled health workforce, especially in sub-Saharan Africa, which serves women and children with measurable impact.
6. Launch a new movement for better data: Make universal and effective Civil Registration and Vital Statistics systems a post-2015 development target.
iERG 2014 Recommendations1. Develop, secure wide political support for,
and begin to implement a global plan during 2014–15 to end all preventable reproductive, maternal, newborn, child, and adolescent mortality for the 2016–30 period—a new, broader, and more inclusive Global Strategy for Women’s and Children’s Health.
2. In 2015, create a results‐based financing facility to support and sustain this new Global Strategy.
3. Between now and 2016, convene a Special Session of the UN General Assembly, led by the Secretary‐General, to accelerate international collective action for women’s and children’s health—to align and harmonise the actions of partners, to promote leadership and stewardship, to ensure provision of global public goods, to manage externalities, and to provide direct country assistance.
4. In 2015, establish a Global Commission on the Health and Human Rights of Women and Children to propose ways to protect, augment, and sustain their health and wellbeing.
5. From 2015 onwards, hold a civil-society-led World Health Forum adjacent to the World Health Assembly to strengthen political accountability for women’s and children’s health.
6. In 2015, establish and fully resource a new Independent Expert Review Group to monitor, review, and propose actions to accelerate global and country progress towards improved women’s and children’s health during the period of the Sustainable Development Goals.
72 Achievements and Prospects
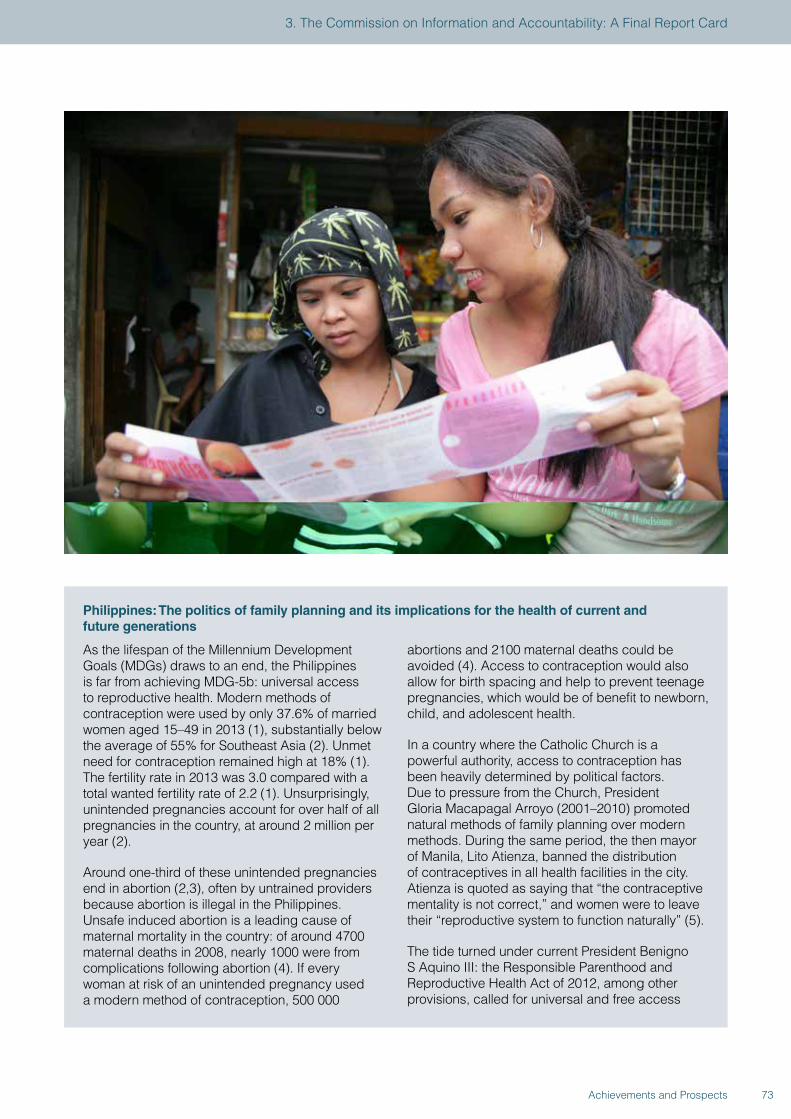
Philippines: The politics of family planning and its implications for the health of current and future generations
As the lifespan of the Millennium Development Goals (MDGs) draws to an end, the Philippines is far from achieving MDG-5b: universal access to reproductive health. Modern methods of contraception were used by only 37.6% of married women aged 15–49 in 2013 (1), substantially below the average of 55% for Southeast Asia (2). Unmet need for contraception remained high at 18% (1). The fertility rate in 2013 was 3.0 compared with a total wanted fertility rate of 2.2 (1). Unsurprisingly, unintended pregnancies account for over half of all pregnancies in the country, at around 2 million per year (2).
Around one-third of these unintended pregnancies end in abortion (2,3), often by untrained providers because abortion is illegal in the Philippines. Unsafe induced abortion is a leading cause of maternal mortality in the country: of around 4700 maternal deaths in 2008, nearly 1000 were from complications following abortion (4). If every woman at risk of an unintended pregnancy used a modern method of contraception, 500 000
abortions and 2100 maternal deaths could be avoided (4). Access to contraception would also allow for birth spacing and help to prevent teenage pregnancies, which would be of benefit to newborn, child, and adolescent health.
In a country where the Catholic Church is a powerful authority, access to contraception has been heavily determined by political factors. Due to pressure from the Church, President Gloria Macapagal Arroyo (2001–2010) promoted natural methods of family planning over modern methods. During the same period, the then mayor of Manila, Lito Atienza, banned the distribution of contraceptives in all health facilities in the city. Atienza is quoted as saying that “the contraceptive mentality is not correct,” and women were to leave their “reproductive system to function naturally” (5).
The tide turned under current President Benigno S Aquino III: the Responsible Parenthood and Reproductive Health Act of 2012, among other provisions, called for universal and free access
73Achievements and Prospects
3. The Commission on Information and Accountability: A Final Report Card
to family planning methods in public facilities, the inclusion of sexual and reproductive health education in school curricula, and women’s right to the prevention and management of abortion and its complications. The bill was supported by WHO and other development partners. Although the law came into force in December, 2012, staunch opposition, primarily from Catholic groups, led the Supreme Court to halt its implementation in March, 2013 (6). A year later, in April, 2014, the Court upheld the constitutionality of the statute, but removed three of its major provisions. Health-care providers may now deny services based on their personal or religious beliefs in non-emergency situations; women require spousal consent to access reproductive health services in non-life-threatening situations; and minors including those who have been pregnant or had a miscarriage require parental consent to receive such services.
Although the adoption of the law is an important milestone for reproductive health services in the Philippines, only time will reveal its impact on the health of women and families. Several actions need to be taken to promote and sustain access to and use of family planning methods, all of which require an enabling political environment:
• debunking myths and misconceptions relating to family planning methods;
• ensuring the availability of long-term methods of contraception, particularly for the poor;
• reviewing the functionality of commodity procurement and distribution systems to ensure that these are effective;
• advocacy with local authorities and groups who oppose family planning initiatives;
• advocacy to allow unrestricted access to family planning services for adolescents; and
• reviewing the adoption of the Reproductive Health Act by lower levels of government.
References
1. Philippine Statistics Authority and ICF International. Philippines National Demographic and Health Survey 2013. Manila and Rockville, MD: Philippine Statistics Authority and ICF International, 2014. https://dhsprogram.com/pubs/pdf/FR294/FR294.pdf (accessed Mar 12, 2015).
2. Guttmacher Institute. Fact Sheet: Unintended pregnancy and unsafe abortion in the Philippines, New York: Guttmacher Institute, 2013. http://www.guttmacher.org/pubs/FB-UPUAP.html (accessed Mar 9, 2015).
3. Singh S, Juarez F, Cabigon J, et al. Unintended pregnancy and induced abortion in the Philippines: causes and consequences. New York: Guttmacher Institute, 2006. www.guttmacher.org/pubs/2006/08/08/PhilippinesUPIA.pdf (accessed Mar 9, 2015).
4. Guttmacher Institute and Likhaan Center for Women’s Health. In Brief: Facts on barriers to contraceptive use in the Philippines. New York: Guttmacher Institute, 2010. www.guttmacher.org/pubs/FB-contraceptives-philippines.pdf (accessed Mar 9, 2015).
5. Narang S. Philippines embraces free birth control despite opposition from Catholic Church. Globalpost. January 22, 2015. http://www.globalpost.com/dispatch/news/regions/asia-pacific/philippines/150121/philippines-reproductive-health-law-free-contraception (accessed Mar 9, 2015).
6. Centre for Reproductive Rights. Philippine Supreme Court upholds historic Reproductive Health Law. Press release, April 8, 2014. http://www.reproductiverights.org/press-room/Philippine-Supreme-Court-Upholds-Historic-Reproductive-Health-Law%20 (accessed Mar 9, 2015).
74 Achievements and Prospects
4. POST-2015: ACCOUNTABILITY FOR SUSTAINABLE DEVELOPMENT
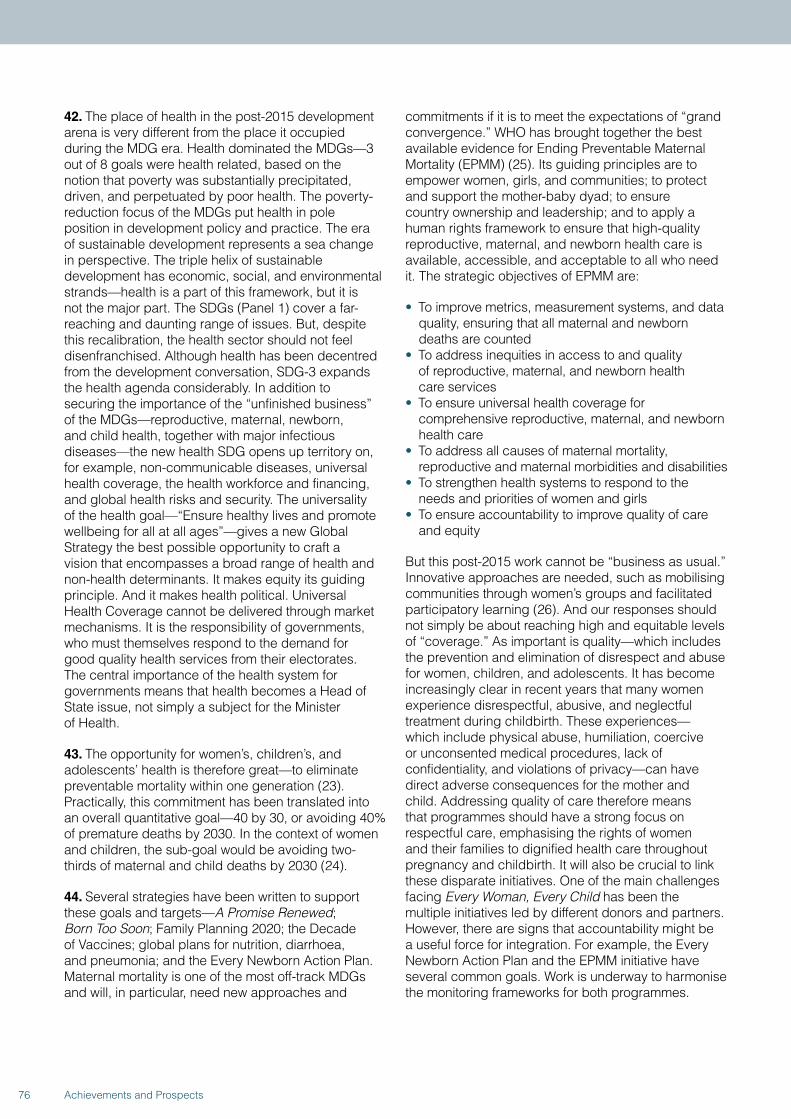
42. The place of health in the post-2015 development arena is very different from the place it occupied during the MDG era. Health dominated the MDGs—3 out of 8 goals were health related, based on the notion that poverty was substantially precipitated, driven, and perpetuated by poor health. The poverty-reduction focus of the MDGs put health in pole position in development policy and practice. The era of sustainable development represents a sea change in perspective. The triple helix of sustainable development has economic, social, and environmental strands—health is a part of this framework, but it is not the major part. The SDGs (Panel 1) cover a far-reaching and daunting range of issues. But, despite this recalibration, the health sector should not feel disenfranchised. Although health has been decentred from the development conversation, SDG-3 expands the health agenda considerably. In addition to securing the importance of the “unfinished business” of the MDGs—reproductive, maternal, newborn, and child health, together with major infectious diseases—the new health SDG opens up territory on, for example, non-communicable diseases, universal health coverage, the health workforce and financing, and global health risks and security. The universality of the health goal—“Ensure healthy lives and promote wellbeing for all at all ages”—gives a new Global Strategy the best possible opportunity to craft a vision that encompasses a broad range of health and non-health determinants. It makes equity its guiding principle. And it makes health political. Universal Health Coverage cannot be delivered through market mechanisms. It is the responsibility of governments, who must themselves respond to the demand for good quality health services from their electorates. The central importance of the health system for governments means that health becomes a Head of State issue, not simply a subject for the Minister of Health.
43. The opportunity for women’s, children’s, and adolescents’ health is therefore great—to eliminate preventable mortality within one generation (23). Practically, this commitment has been translated into an overall quantitative goal—40 by 30, or avoiding 40% of premature deaths by 2030. In the context of women and children, the sub-goal would be avoiding two-thirds of maternal and child deaths by 2030 (24).
44. Several strategies have been written to support these goals and targets—A Promise Renewed; Born Too Soon; Family Planning 2020; the Decade of Vaccines; global plans for nutrition, diarrhoea, and pneumonia; and the Every Newborn Action Plan. Maternal mortality is one of the most off-track MDGs and will, in particular, need new approaches and
commitments if it is to meet the expectations of “grand convergence.” WHO has brought together the best available evidence for Ending Preventable Maternal Mortality (EPMM) (25). Its guiding principles are to empower women, girls, and communities; to protect and support the mother-baby dyad; to ensure country ownership and leadership; and to apply a human rights framework to ensure that high-quality reproductive, maternal, and newborn health care is available, accessible, and acceptable to all who need it. The strategic objectives of EPMM are:
• To improve metrics, measurement systems, and data quality, ensuring that all maternal and newborn deaths are counted
• To address inequities in access to and quality of reproductive, maternal, and newborn health care services
• To ensure universal health coverage for comprehensive reproductive, maternal, and newborn health care
• To address all causes of maternal mortality, reproductive and maternal morbidities and disabilities
• To strengthen health systems to respond to the needs and priorities of women and girls
• To ensure accountability to improve quality of care and equity
But this post-2015 work cannot be “business as usual.” Innovative approaches are needed, such as mobilising communities through women’s groups and facilitated participatory learning (26). And our responses should not simply be about reaching high and equitable levels of “coverage.” As important is quality—which includes the prevention and elimination of disrespect and abuse for women, children, and adolescents. It has become increasingly clear in recent years that many women experience disrespectful, abusive, and neglectful treatment during childbirth. These experiences—which include physical abuse, humiliation, coercive or unconsented medical procedures, lack of confidentiality, and violations of privacy—can have direct adverse consequences for the mother and child. Addressing quality of care therefore means that programmes should have a strong focus on respectful care, emphasising the rights of women and their families to dignified health care throughout pregnancy and childbirth. It will also be crucial to link these disparate initiatives. One of the main challenges facing Every Woman, Every Child has been the multiple initiatives led by different donors and partners. However, there are signs that accountability might be a useful force for integration. For example, the Every Newborn Action Plan and the EPMM initiative have several common goals. Work is underway to harmonise the monitoring frameworks for both programmes.
76 Achievements and Prospects
77Achievements and Prospects
4. Post-2015: Accountability for Sustainable Development
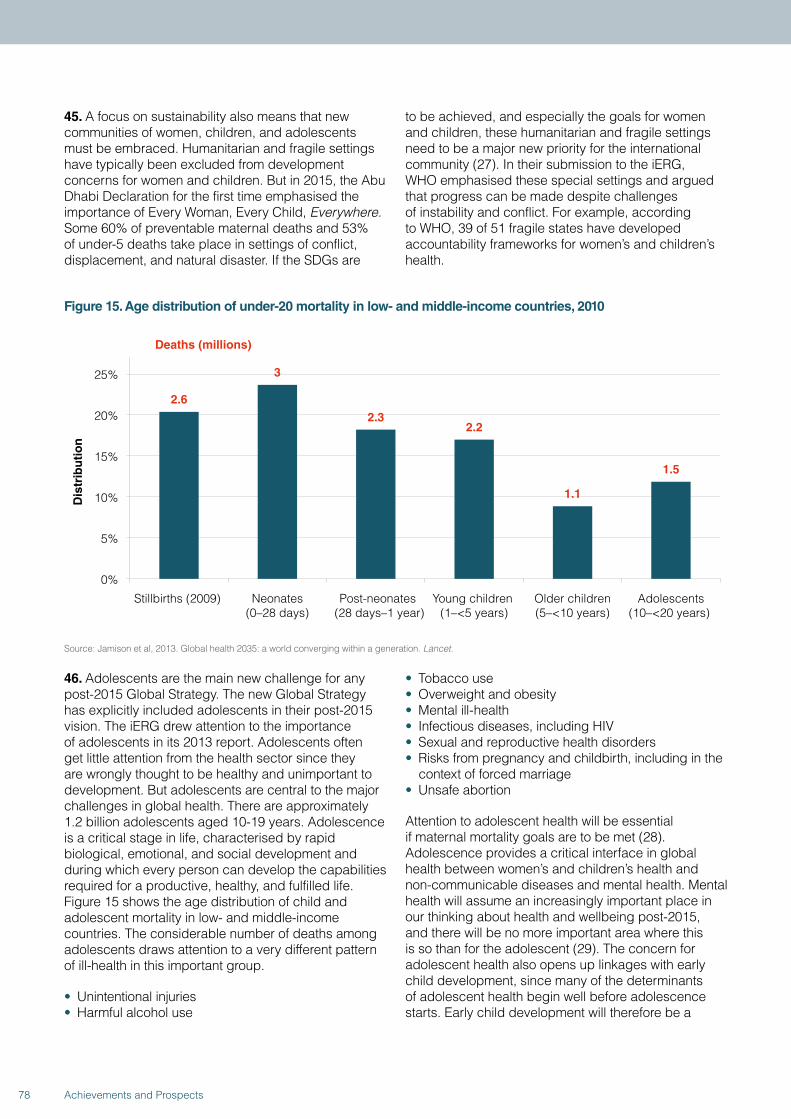
45. A focus on sustainability also means that new communities of women, children, and adolescents must be embraced. Humanitarian and fragile settings have typically been excluded from development concerns for women and children. But in 2015, the Abu Dhabi Declaration for the first time emphasised the importance of Every Woman, Every Child, Everywhere. Some 60% of preventable maternal deaths and 53% of under-5 deaths take place in settings of conflict, displacement, and natural disaster. If the SDGs are
to be achieved, and especially the goals for women and children, these humanitarian and fragile settings need to be a major new priority for the international community (27). In their submission to the iERG, WHO emphasised these special settings and argued that progress can be made despite challenges of instability and conflict. For example, according to WHO, 39 of 51 fragile states have developed accountability frameworks for women’s and children’s health.
Figure 15. Age distribution of under-20 mortality in low- and middle-income countries, 2010
2.6
3
2.3 2.2
1.1
1.5
0%
5%
10%
15%
20%
25%
Stillbirths (2009) Neonates(0–28 days)
Post-neonates (28 days–1 year)
Young children (1–<5 years)
Older children(5–<10 years)
Adolescents(10–<20 years)
Dis
trib
uti
on
Deaths (millions)
Source: Jamison et al, 2013. Global health 2035: a world converging within a generation. Lancet.
46. Adolescents are the main new challenge for any post-2015 Global Strategy. The new Global Strategy has explicitly included adolescents in their post-2015 vision. The iERG drew attention to the importance of adolescents in its 2013 report. Adolescents often get little attention from the health sector since they are wrongly thought to be healthy and unimportant to development. But adolescents are central to the major challenges in global health. There are approximately 1.2 billion adolescents aged 10-19 years. Adolescence is a critical stage in life, characterised by rapid biological, emotional, and social development and during which every person can develop the capabilities required for a productive, healthy, and fulfilled life. Figure 15 shows the age distribution of child and adolescent mortality in low- and middle-income countries. The considerable number of deaths among adolescents draws attention to a very different pattern of ill-health in this important group.
• Unintentional injuries• Harmful alcohol use
• Tobacco use• Overweight and obesity• Mental ill-health• Infectious diseases, including HIV• Sexual and reproductive health disorders• Risks from pregnancy and childbirth, including in the
context of forced marriage• Unsafe abortion
Attention to adolescent health will be essential if maternal mortality goals are to be met (28). Adolescence provides a critical interface in global health between women’s and children’s health and non-communicable diseases and mental health. Mental health will assume an increasingly important place in our thinking about health and wellbeing post-2015, and there will be no more important area where this is so than for the adolescent (29). The concern for adolescent health also opens up linkages with early child development, since many of the determinants of adolescent health begin well before adolescence starts. Early child development will therefore be a
78 Achievements and Prospects
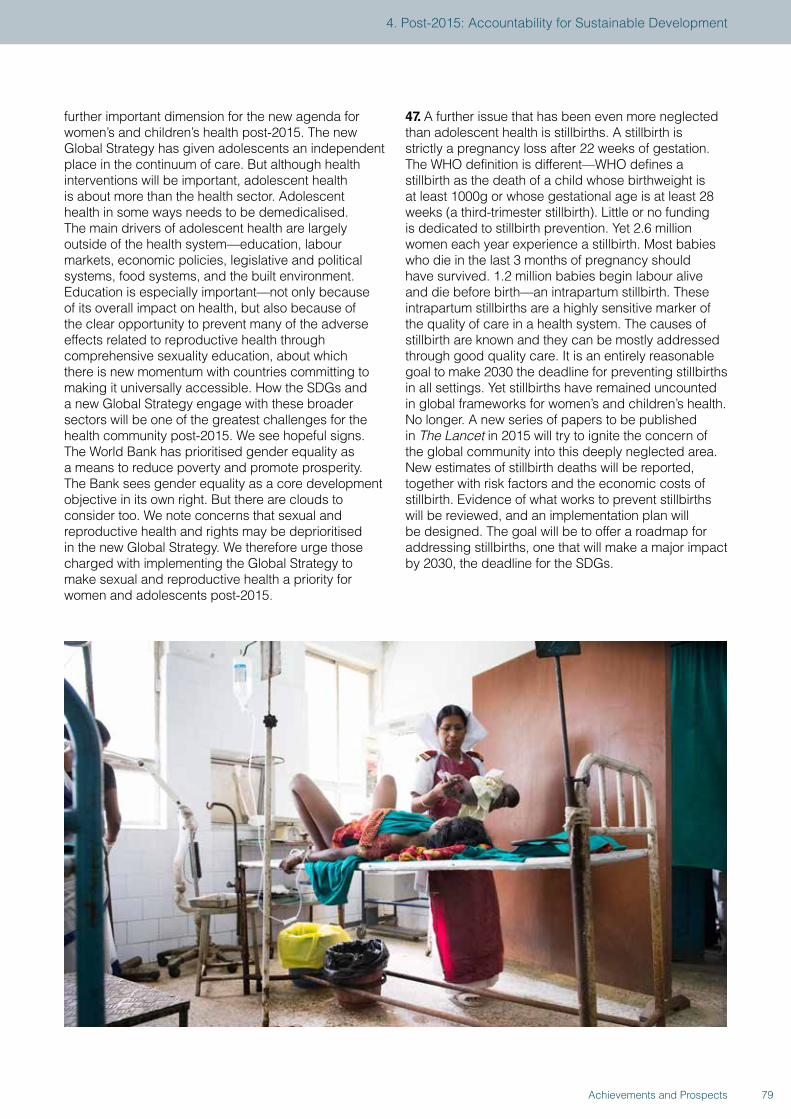
further important dimension for the new agenda for women’s and children’s health post-2015. The new Global Strategy has given adolescents an independent place in the continuum of care. But although health interventions will be important, adolescent health is about more than the health sector. Adolescent health in some ways needs to be demedicalised. The main drivers of adolescent health are largely outside of the health system—education, labour markets, economic policies, legislative and political systems, food systems, and the built environment. Education is especially important—not only because of its overall impact on health, but also because of the clear opportunity to prevent many of the adverse effects related to reproductive health through comprehensive sexuality education, about which there is new momentum with countries committing to making it universally accessible. How the SDGs and a new Global Strategy engage with these broader sectors will be one of the greatest challenges for the health community post-2015. We see hopeful signs. The World Bank has prioritised gender equality as a means to reduce poverty and promote prosperity. The Bank sees gender equality as a core development objective in its own right. But there are clouds to consider too. We note concerns that sexual and reproductive health and rights may be deprioritised in the new Global Strategy. We therefore urge those charged with implementing the Global Strategy to make sexual and reproductive health a priority for women and adolescents post-2015.
47. A further issue that has been even more neglected than adolescent health is stillbirths. A stillbirth is strictly a pregnancy loss after 22 weeks of gestation. The WHO definition is different—WHO defines a stillbirth as the death of a child whose birthweight is at least 1000g or whose gestational age is at least 28 weeks (a third-trimester stillbirth). Little or no funding is dedicated to stillbirth prevention. Yet 2.6 million women each year experience a stillbirth. Most babies who die in the last 3 months of pregnancy should have survived. 1.2 million babies begin labour alive and die before birth—an intrapartum stillbirth. These intrapartum stillbirths are a highly sensitive marker of the quality of care in a health system. The causes of stillbirth are known and they can be mostly addressed through good quality care. It is an entirely reasonable goal to make 2030 the deadline for preventing stillbirths in all settings. Yet stillbirths have remained uncounted in global frameworks for women’s and children’s health. No longer. A new series of papers to be published in The Lancet in 2015 will try to ignite the concern of the global community into this deeply neglected area. New estimates of stillbirth deaths will be reported, together with risk factors and the economic costs of stillbirth. Evidence of what works to prevent stillbirths will be reviewed, and an implementation plan will be designed. The goal will be to offer a roadmap for addressing stillbirths, one that will make a major impact by 2030, the deadline for the SDGs.
79Achievements and Prospects
4. Post-2015: Accountability for Sustainable Development
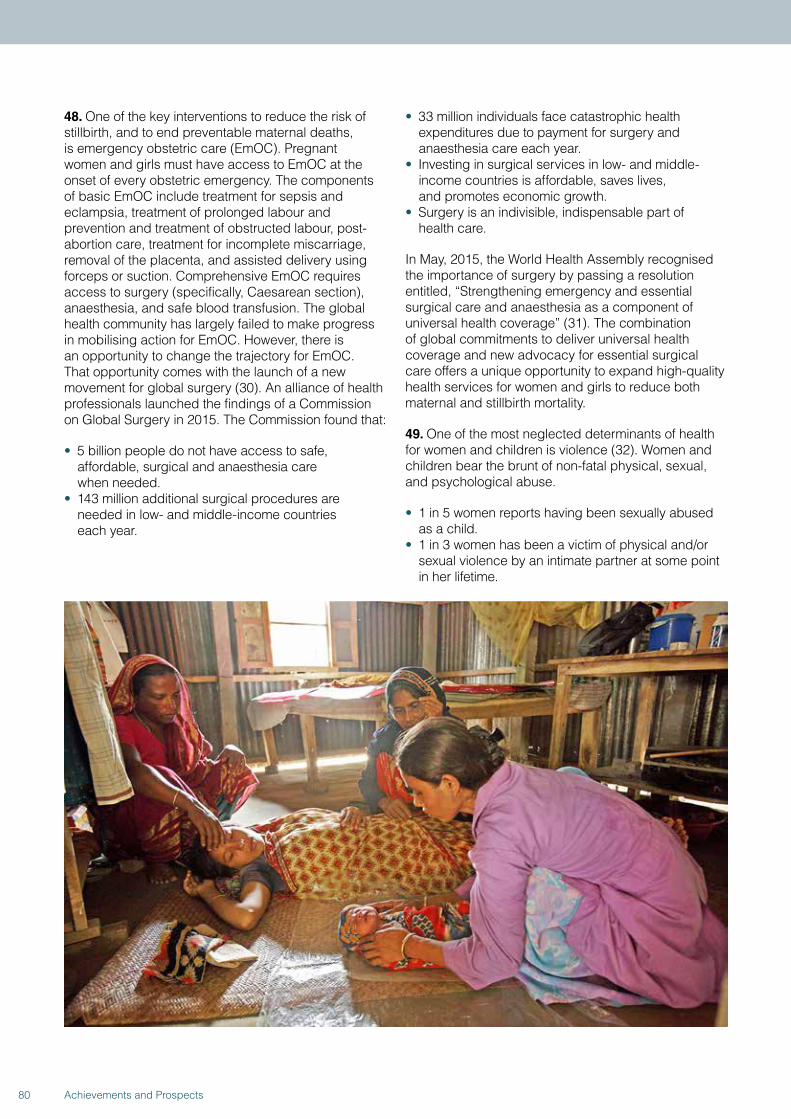
48. One of the key interventions to reduce the risk of stillbirth, and to end preventable maternal deaths, is emergency obstetric care (EmOC). Pregnant women and girls must have access to EmOC at the onset of every obstetric emergency. The components of basic EmOC include treatment for sepsis and eclampsia, treatment of prolonged labour and prevention and treatment of obstructed labour, post-abortion care, treatment for incomplete miscarriage, removal of the placenta, and assisted delivery using forceps or suction. Comprehensive EmOC requires access to surgery (specifically, Caesarean section), anaesthesia, and safe blood transfusion. The global health community has largely failed to make progress in mobilising action for EmOC. However, there is an opportunity to change the trajectory for EmOC. That opportunity comes with the launch of a new movement for global surgery (30). An alliance of health professionals launched the findings of a Commission on Global Surgery in 2015. The Commission found that:
• 5 billion people do not have access to safe, affordable, surgical and anaesthesia care when needed.
• 143 million additional surgical procedures are needed in low- and middle-income countries each year.
• 33 million individuals face catastrophic health expenditures due to payment for surgery and anaesthesia care each year.
• Investing in surgical services in low- and middle-income countries is affordable, saves lives, and promotes economic growth.
• Surgery is an indivisible, indispensable part of health care.
In May, 2015, the World Health Assembly recognised the importance of surgery by passing a resolution entitled, “Strengthening emergency and essential surgical care and anaesthesia as a component of universal health coverage” (31). The combination of global commitments to deliver universal health coverage and new advocacy for essential surgical care offers a unique opportunity to expand high-quality health services for women and girls to reduce both maternal and stillbirth mortality.
49. One of the most neglected determinants of health for women and children is violence (32). Women and children bear the brunt of non-fatal physical, sexual, and psychological abuse.
• 1 in 5 women reports having been sexually abused as a child.
• 1 in 3 women has been a victim of physical and/or sexual violence by an intimate partner at some point in her lifetime.
80 Achievements and Prospects
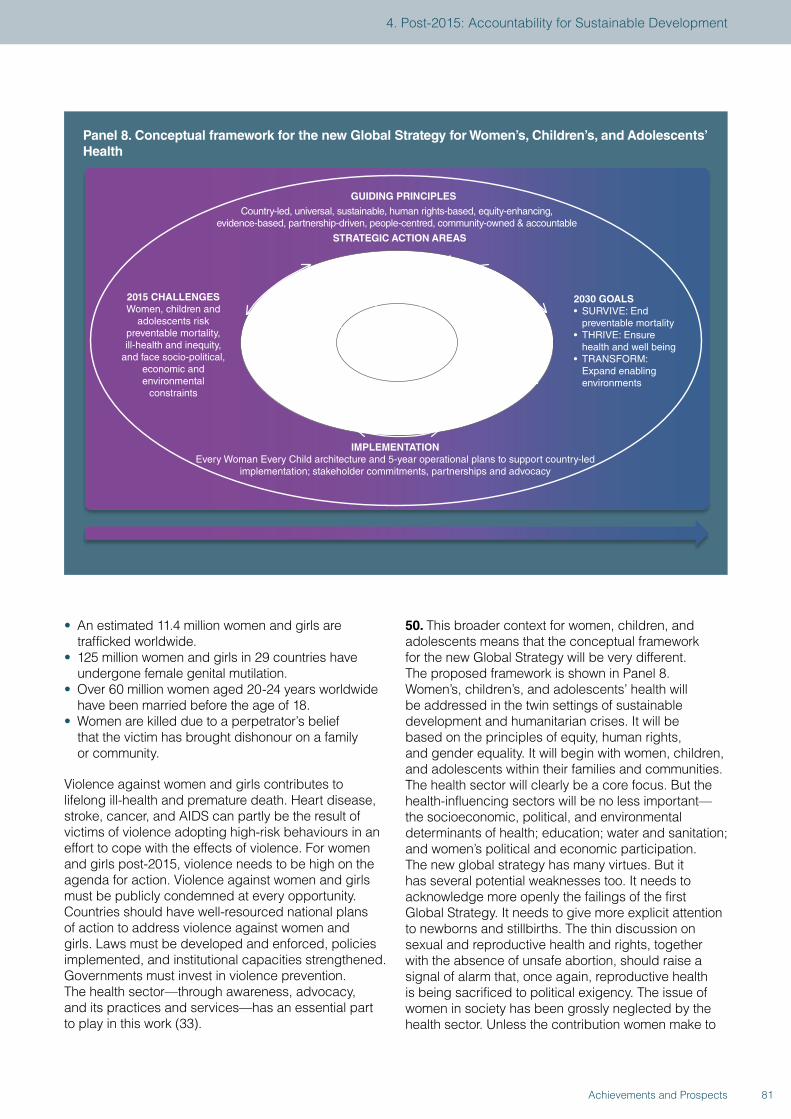
• An estimated 11.4 million women and girls are trafficked worldwide.
• 125 million women and girls in 29 countries have undergone female genital mutilation.
• Over 60 million women aged 20-24 years worldwide have been married before the age of 18.
• Women are killed due to a perpetrator’s belief that the victim has brought dishonour on a family or community.
Violence against women and girls contributes to lifelong ill-health and premature death. Heart disease, stroke, cancer, and AIDS can partly be the result of victims of violence adopting high-risk behaviours in an effort to cope with the effects of violence. For women and girls post-2015, violence needs to be high on the agenda for action. Violence against women and girls must be publicly condemned at every opportunity. Countries should have well-resourced national plans of action to address violence against women and girls. Laws must be developed and enforced, policies implemented, and institutional capacities strengthened. Governments must invest in violence prevention. The health sector—through awareness, advocacy, and its practices and services—has an essential part to play in this work (33).
50. This broader context for women, children, and adolescents means that the conceptual framework for the new Global Strategy will be very different. The proposed framework is shown in Panel 8. Women’s, children’s, and adolescents’ health will be addressed in the twin settings of sustainable development and humanitarian crises. It will be based on the principles of equity, human rights, and gender equality. It will begin with women, children, and adolescents within their families and communities. The health sector will clearly be a core focus. But the health-influencing sectors will be no less important—the socioeconomic, political, and environmental determinants of health; education; water and sanitation; and women’s political and economic participation. The new global strategy has many virtues. But it has several potential weaknesses too. It needs to acknowledge more openly the failings of the first Global Strategy. It needs to give more explicit attention to newborns and stillbirths. The thin discussion on sexual and reproductive health and rights, together with the absence of unsafe abortion, should raise a signal of alarm that, once again, reproductive health is being sacrificed to political exigency. The issue of women in society has been grossly neglected by the health sector. Unless the contribution women make to
Panel 8. Conceptual framework for the new Global Strategy for Women’s, Children’s, and Adolescents’ Health
2015 CHALLENGESWomen, children and
adolescents risk preventable mortality, ill-health and inequity,
and face socio-political, economic and environmental
constraints
2030 GOALS• SURVIVE: End preventable mortality• THRIVE: Ensure health and well being• TRANSFORM: Expand enabling environments
GUIDING PRINCIPLES
WOMEN, CHILDREN AND
ADOLESCENTS - INDIVIDUAL
POTENTIALS
IMPLEMENTATIONEvery Woman Every Child architecture and 5-year operational plans to support country-led
implementation; stakeholder commitments, partnerships and advocacy
Country-led, universal, sustainable, human rights-based, equity-enhancing, evidence-based, partnership-driven, people-centred, community-owned & accountable
STRATEGIC ACTION AREAS
COUNTRYLEADERSHIP
CROSS-SECTORALCOLLABORATION
COMMUNITYENGAGEMENTHUMANITARIAN
ACTION
HEALTH SYSTEMSRESILIENT
ACCOUNTABILITY
RESEARCH AND INNOVATION
FINANCING FOR HEALTH
81Achievements and Prospects
4. Post-2015: Accountability for Sustainable Development
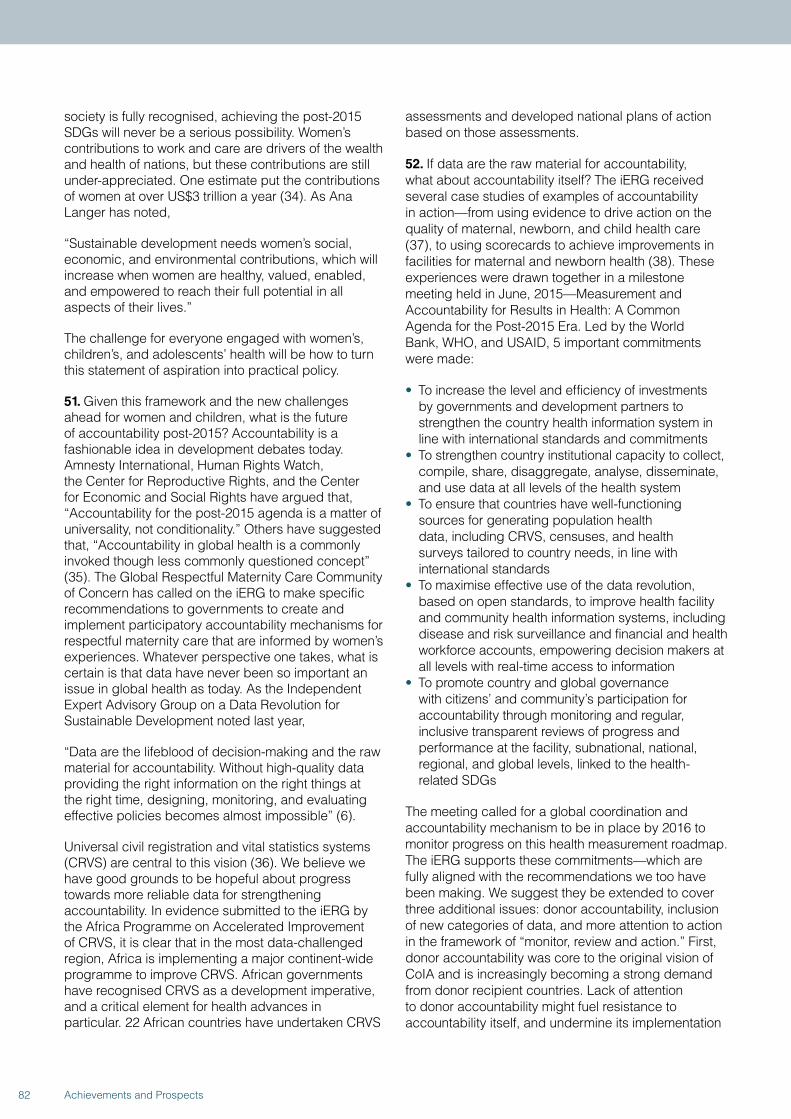
society is fully recognised, achieving the post-2015 SDGs will never be a serious possibility. Women’s contributions to work and care are drivers of the wealth and health of nations, but these contributions are still under-appreciated. One estimate put the contributions of women at over US$3 trillion a year (34). As Ana Langer has noted,
“Sustainable development needs women’s social, economic, and environmental contributions, which will increase when women are healthy, valued, enabled, and empowered to reach their full potential in all aspects of their lives.”
The challenge for everyone engaged with women’s, children’s, and adolescents’ health will be how to turn this statement of aspiration into practical policy.
51. Given this framework and the new challenges ahead for women and children, what is the future of accountability post-2015? Accountability is a fashionable idea in development debates today. Amnesty International, Human Rights Watch, the Center for Reproductive Rights, and the Center for Economic and Social Rights have argued that, “Accountability for the post-2015 agenda is a matter of universality, not conditionality.” Others have suggested that, “Accountability in global health is a commonly invoked though less commonly questioned concept” (35). The Global Respectful Maternity Care Community of Concern has called on the iERG to make specific recommendations to governments to create and implement participatory accountability mechanisms for respectful maternity care that are informed by women’s experiences. Whatever perspective one takes, what is certain is that data have never been so important an issue in global health as today. As the Independent Expert Advisory Group on a Data Revolution for Sustainable Development noted last year,
“Data are the lifeblood of decision-making and the raw material for accountability. Without high-quality data providing the right information on the right things at the right time, designing, monitoring, and evaluating effective policies becomes almost impossible” (6).
Universal civil registration and vital statistics systems (CRVS) are central to this vision (36). We believe we have good grounds to be hopeful about progress towards more reliable data for strengthening accountability. In evidence submitted to the iERG by the Africa Programme on Accelerated Improvement of CRVS, it is clear that in the most data-challenged region, Africa is implementing a major continent-wide programme to improve CRVS. African governments have recognised CRVS as a development imperative, and a critical element for health advances in particular. 22 African countries have undertaken CRVS
assessments and developed national plans of action based on those assessments.
52. If data are the raw material for accountability, what about accountability itself? The iERG received several case studies of examples of accountability in action—from using evidence to drive action on the quality of maternal, newborn, and child health care (37), to using scorecards to achieve improvements in facilities for maternal and newborn health (38). These experiences were drawn together in a milestone meeting held in June, 2015—Measurement and Accountability for Results in Health: A Common Agenda for the Post-2015 Era. Led by the World Bank, WHO, and USAID, 5 important commitments were made:
• To increase the level and efficiency of investments by governments and development partners to strengthen the country health information system in line with international standards and commitments
• To strengthen country institutional capacity to collect, compile, share, disaggregate, analyse, disseminate, and use data at all levels of the health system
• To ensure that countries have well-functioning sources for generating population health data, including CRVS, censuses, and health surveys tailored to country needs, in line with international standards
• To maximise effective use of the data revolution, based on open standards, to improve health facility and community health information systems, including disease and risk surveillance and financial and health workforce accounts, empowering decision makers at all levels with real-time access to information
• To promote country and global governance with citizens’ and community’s participation for accountability through monitoring and regular, inclusive transparent reviews of progress and performance at the facility, subnational, national, regional, and global levels, linked to the health-related SDGs
The meeting called for a global coordination and accountability mechanism to be in place by 2016 to monitor progress on this health measurement roadmap. The iERG supports these commitments—which are fully aligned with the recommendations we too have been making. We suggest they be extended to cover three additional issues: donor accountability, inclusion of new categories of data, and more attention to action in the framework of “monitor, review and action.” First, donor accountability was core to the original vision of CoIA and is increasingly becoming a strong demand from donor recipient countries. Lack of attention to donor accountability might fuel resistance to accountability itself, and undermine its implementation
82 Achievements and Prospects
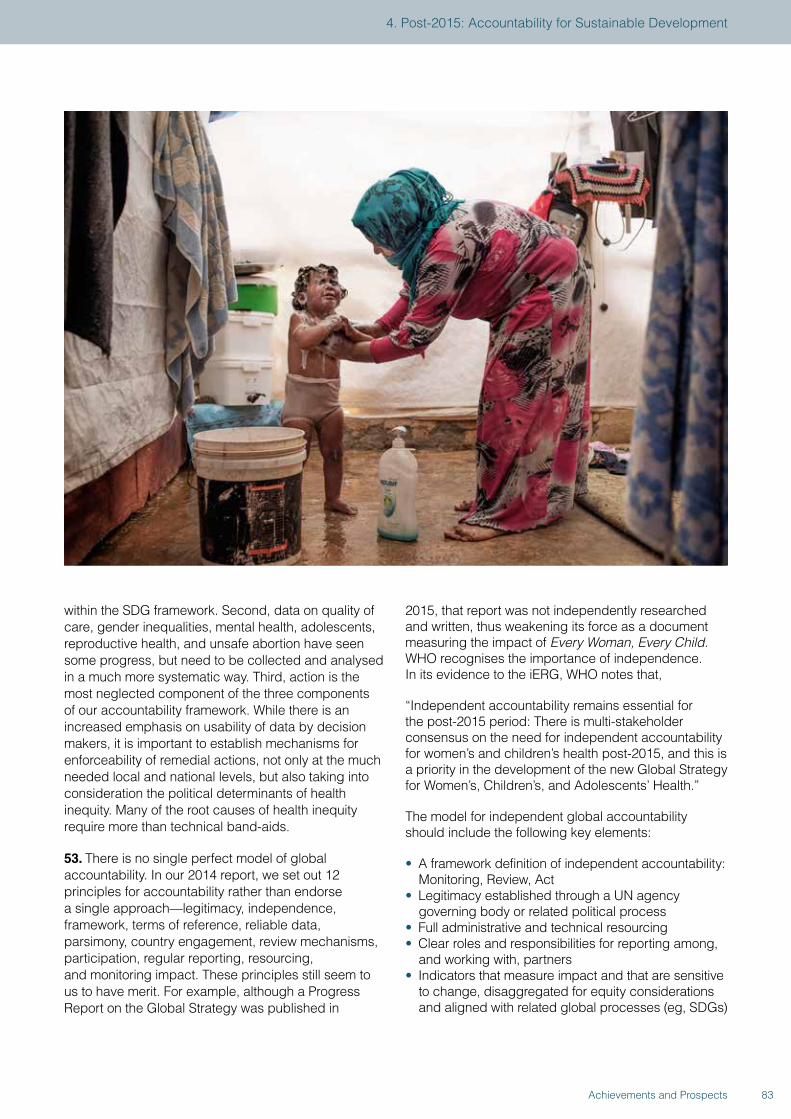
within the SDG framework. Second, data on quality of care, gender inequalities, mental health, adolescents, reproductive health, and unsafe abortion have seen some progress, but need to be collected and analysed in a much more systematic way. Third, action is the most neglected component of the three components of our accountability framework. While there is an increased emphasis on usability of data by decision makers, it is important to establish mechanisms for enforceability of remedial actions, not only at the much needed local and national levels, but also taking into consideration the political determinants of health inequity. Many of the root causes of health inequity require more than technical band-aids.
53. There is no single perfect model of global accountability. In our 2014 report, we set out 12 principles for accountability rather than endorse a single approach—legitimacy, independence, framework, terms of reference, reliable data, parsimony, country engagement, review mechanisms, participation, regular reporting, resourcing, and monitoring impact. These principles still seem to us to have merit. For example, although a Progress Report on the Global Strategy was published in
2015, that report was not independently researched and written, thus weakening its force as a document measuring the impact of Every Woman, Every Child. WHO recognises the importance of independence. In its evidence to the iERG, WHO notes that,
“Independent accountability remains essential for the post-2015 period: There is multi-stakeholder consensus on the need for independent accountability for women’s and children’s health post-2015, and this is a priority in the development of the new Global Strategy for Women’s, Children’s, and Adolescents’ Health.”
The model for independent global accountability should include the following key elements:
• A framework definition of independent accountability: Monitoring, Review, Act
• Legitimacy established through a UN agency governing body or related political process
• Full administrative and technical resourcing • Clear roles and responsibilities for reporting among,
and working with, partners• Indicators that measure impact and that are sensitive
to change, disaggregated for equity considerations and aligned with related global processes (eg, SDGs)
83Achievements and Prospects
4. Post-2015: Accountability for Sustainable Development
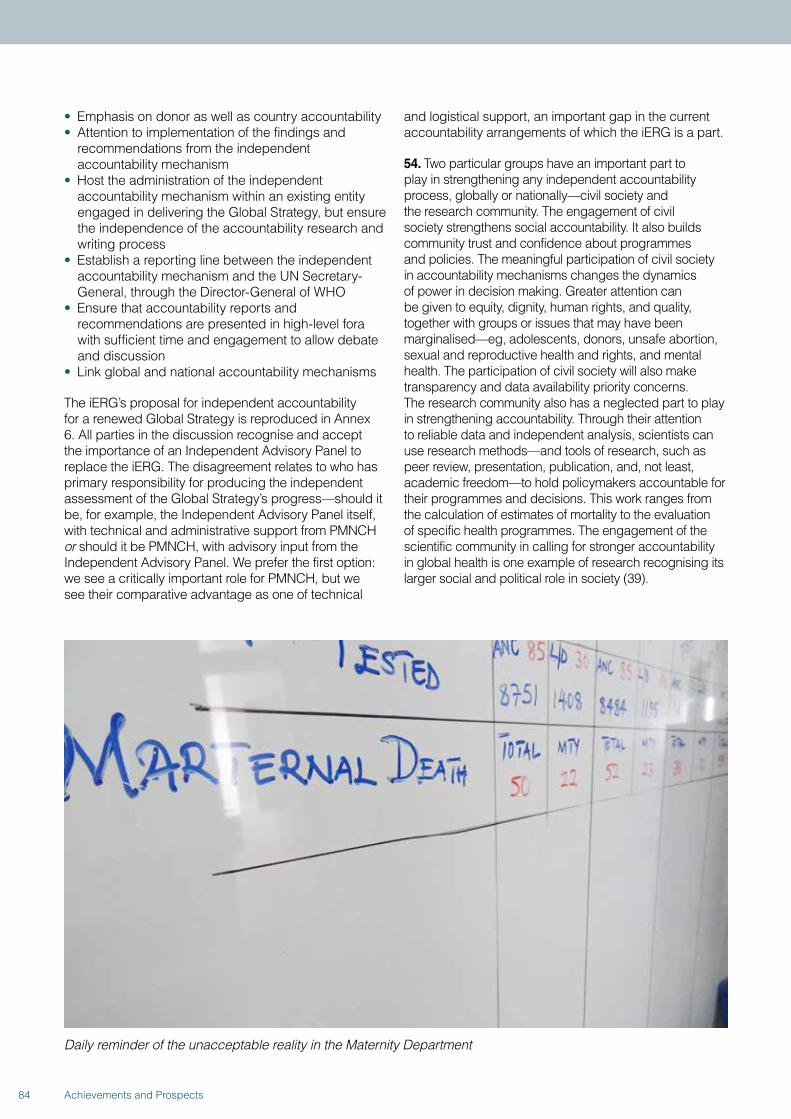
• Emphasis on donor as well as country accountability • Attention to implementation of the findings and
recommendations from the independent accountability mechanism
• Host the administration of the independent accountability mechanism within an existing entity engaged in delivering the Global Strategy, but ensure the independence of the accountability research and writing process
• Establish a reporting line between the independent accountability mechanism and the UN Secretary-General, through the Director-General of WHO
• Ensure that accountability reports and recommendations are presented in high-level fora with sufficient time and engagement to allow debate and discussion
• Link global and national accountability mechanisms
The iERG’s proposal for independent accountability for a renewed Global Strategy is reproduced in Annex 6. All parties in the discussion recognise and accept the importance of an Independent Advisory Panel to replace the iERG. The disagreement relates to who has primary responsibility for producing the independent assessment of the Global Strategy’s progress—should it be, for example, the Independent Advisory Panel itself, with technical and administrative support from PMNCH or should it be PMNCH, with advisory input from the Independent Advisory Panel. We prefer the first option: we see a critically important role for PMNCH, but we see their comparative advantage as one of technical
and logistical support, an important gap in the current accountability arrangements of which the iERG is a part.
54. Two particular groups have an important part to play in strengthening any independent accountability process, globally or nationally—civil society and the research community. The engagement of civil society strengthens social accountability. It also builds community trust and confidence about programmes and policies. The meaningful participation of civil society in accountability mechanisms changes the dynamics of power in decision making. Greater attention can be given to equity, dignity, human rights, and quality, together with groups or issues that may have been marginalised—eg, adolescents, donors, unsafe abortion, sexual and reproductive health and rights, and mental health. The participation of civil society will also make transparency and data availability priority concerns. The research community also has a neglected part to play in strengthening accountability. Through their attention to reliable data and independent analysis, scientists can use research methods—and tools of research, such as peer review, presentation, publication, and, not least, academic freedom—to hold policymakers accountable for their programmes and decisions. This work ranges from the calculation of estimates of mortality to the evaluation of specific health programmes. The engagement of the scientific community in calling for stronger accountability in global health is one example of research recognising its larger social and political role in society (39).
Daily reminder of the unacceptable reality in the Maternity Department
84 Achievements and Prospects
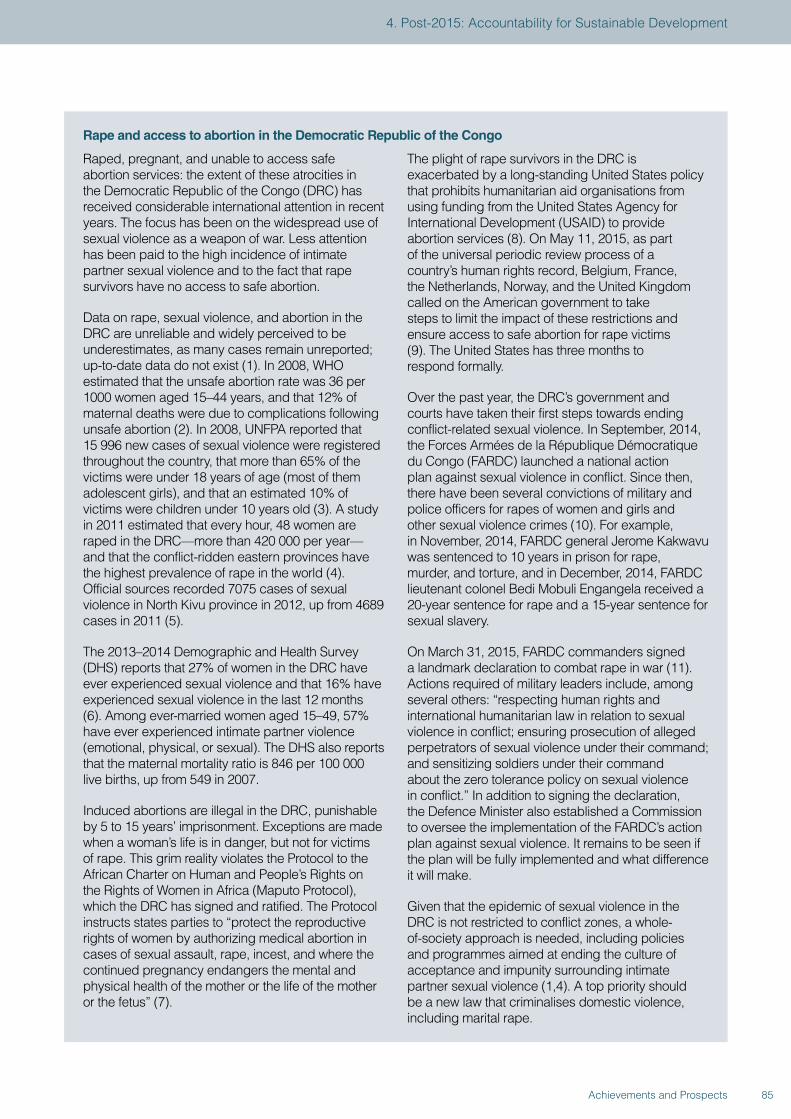
Rape and access to abortion in the Democratic Republic of the Congo
Raped, pregnant, and unable to access safe abortion services: the extent of these atrocities in the Democratic Republic of the Congo (DRC) has received considerable international attention in recent years. The focus has been on the widespread use of sexual violence as a weapon of war. Less attention has been paid to the high incidence of intimate partner sexual violence and to the fact that rape survivors have no access to safe abortion.
Data on rape, sexual violence, and abortion in the DRC are unreliable and widely perceived to be underestimates, as many cases remain unreported; up-to-date data do not exist (1). In 2008, WHO estimated that the unsafe abortion rate was 36 per 1000 women aged 15–44 years, and that 12% of maternal deaths were due to complications following unsafe abortion (2). In 2008, UNFPA reported that 15 996 new cases of sexual violence were registered throughout the country, that more than 65% of the victims were under 18 years of age (most of them adolescent girls), and that an estimated 10% of victims were children under 10 years old (3). A study in 2011 estimated that every hour, 48 women are raped in the DRC—more than 420 000 per year—and that the conflict-ridden eastern provinces have the highest prevalence of rape in the world (4). Official sources recorded 7075 cases of sexual violence in North Kivu province in 2012, up from 4689 cases in 2011 (5).
The 2013–2014 Demographic and Health Survey (DHS) reports that 27% of women in the DRC have ever experienced sexual violence and that 16% have experienced sexual violence in the last 12 months (6). Among ever-married women aged 15–49, 57% have ever experienced intimate partner violence (emotional, physical, or sexual). The DHS also reports that the maternal mortality ratio is 846 per 100 000 live births, up from 549 in 2007.
Induced abortions are illegal in the DRC, punishable by 5 to 15 years’ imprisonment. Exceptions are made when a woman’s life is in danger, but not for victims of rape. This grim reality violates the Protocol to the African Charter on Human and People’s Rights on the Rights of Women in Africa (Maputo Protocol), which the DRC has signed and ratified. The Protocol instructs states parties to “protect the reproductive rights of women by authorizing medical abortion in cases of sexual assault, rape, incest, and where the continued pregnancy endangers the mental and physical health of the mother or the life of the mother or the fetus” (7).
The plight of rape survivors in the DRC is exacerbated by a long-standing United States policy that prohibits humanitarian aid organisations from using funding from the United States Agency for International Development (USAID) to provide abortion services (8). On May 11, 2015, as part of the universal periodic review process of a country’s human rights record, Belgium, France, the Netherlands, Norway, and the United Kingdom called on the American government to take steps to limit the impact of these restrictions and ensure access to safe abortion for rape victims (9). The United States has three months to respond formally.
Over the past year, the DRC’s government and courts have taken their first steps towards ending conflict-related sexual violence. In September, 2014, the Forces Armées de la République Démocratique du Congo (FARDC) launched a national action plan against sexual violence in conflict. Since then, there have been several convictions of military and police officers for rapes of women and girls and other sexual violence crimes (10). For example, in November, 2014, FARDC general Jerome Kakwavu was sentenced to 10 years in prison for rape, murder, and torture, and in December, 2014, FARDC lieutenant colonel Bedi Mobuli Engangela received a 20-year sentence for rape and a 15-year sentence for sexual slavery.
On March 31, 2015, FARDC commanders signed a landmark declaration to combat rape in war (11). Actions required of military leaders include, among several others: “respecting human rights and international humanitarian law in relation to sexual violence in conflict; ensuring prosecution of alleged perpetrators of sexual violence under their command; and sensitizing soldiers under their command about the zero tolerance policy on sexual violence in conflict.” In addition to signing the declaration, the Defence Minister also established a Commission to oversee the implementation of the FARDC’s action plan against sexual violence. It remains to be seen if the plan will be fully implemented and what difference it will make.
Given that the epidemic of sexual violence in the DRC is not restricted to conflict zones, a whole-of-society approach is needed, including policies and programmes aimed at ending the culture of acceptance and impunity surrounding intimate partner sexual violence (1,4). A top priority should be a new law that criminalises domestic violence, including marital rape.
85Achievements and Prospects
4. Post-2015: Accountability for Sustainable Development
In addition, in accordance with international human rights law and humanitarian law (including the Geneva Conventions), the government of the DRC has a legal obligation to ensure that all survivors of rape have equal and effective access to accountability mechanisms, reparations, and non-discriminatory counselling and medical care (1,4,12). This means that the Penal Code must be amended to
allow rape victims access to legal and safe abortion and post-abortion care.
Changing the trajectory of sexual violence in the DRC will require a wide range of national and international actions. National legal reforms to prevent sexual violence and ensure both justice and medical care for victims are a necessary first step.
References
1. Anon. Safe abortion in emergencies: Democratic Republic of Congo. RAISE Policy Brief, June 2014. New York: Columbia University Mailman School of Public Health, 2014.
2. WHO. Safe and unsafe induced abortion. Global and regional levels in 2008, and trends during 1995–2008. Information sheet. Geneva: World Health Organization, 2012. http://bit.ly/1hcyndI (accessed Jun 9, 2015).
3. UNFPA. Figures on sexual violence reported in the DRC in 2008. New York: United Nations Population Fund, 2009.
4. Peterman A, Palermo T, Bredenkamp C. Estimates and determinants of sexual violence against women in the Democratic Republic of the Congo. Am J Public Health 2011; 101: 1060–67.
5. United Nations High Commissioner for Refugees. Sexual violence on the rise in DRC’s North Kivu, Briefing Notes, Jul 30, 2013. http://www.unhcr.org/51f79a649.html (accessed Jun 9, 2015).
6. MPSMRM, MSP, ICF International. Democratic Republic of Congo Demographic and Health Survey 2013-14: Key Findings. Rockville, MD: Ministère du Plan et Suivi de la Mise en œuvre de la Révolution de la Modernité, Ministère de la Santé Publique, and ICF International, 2014. http://dhsprogram.com/pubs/pdf/SR218/SR218.e.pdf (accessed Jun 9, 2015).
7. African Commission on Human and Peoples’ Rights. Protocol to the African Charter on Human and People’s Rights on the Rights of Women in Africa. http://www.achpr.org/instruments/women-protocol (accessed Jun 9, 2015).
8. Barot S. Abortion restrictions in U.S. foreign aid: the history and harms of the Helms Amendment.
Guttmacher Policy Review 2013; 16. http://bit.ly/1nxs75c (accessed Jun 9, 2015).
9. Global Justice Center. UN Human Rights Council challenges US abortion ban on humanitarian assistance, press release, May 11, 2015. http://globaljusticecenter.net/index.php/news-and-events/news1/press-releases/633-un-human-rights-council-challenges-us-abortion-ban-on-humanitarian-assistance (accessed Jun 9, 2015).
10. Bangura ZH. Recent convictions of military and police officials in DRC send clear message that impunity for sexual violence in conflict will not be tolerated. Statement by the United Nations Special Representative of the Secretary-General on Sexual Violence in Conflict, Dec 16, 2014. http://www.un.org/sexualviolenceinconflict/press-release/recent-convictions-of-military-and-police-officials-in-drc-send-clear-message-that-impunity-for-sexual-violence-in-conflict-will-not-be-tolerated/ (accessed Jun 9, 2015).
11. Bangura ZH. DRC: Military pledge marks milestone on road to ending conflict-related sexual violence. Statement by the United Nations Special Representative of the Secretary-General on Sexual Violence in Conflict, Mar 31, 2015. http://www.un.org/sexualviolenceinconflict/press-release/drc-military-pledge-marks-milestone-on-road-to-ending-conflict-related-sexual-violence/ (accessed Jun 9, 2015).
12. OMCT, SFVS. Report on violence against women in North and South Kivu, in the Democratic Republic of Congo. Alternative report for the Committee on the elimination of all forms of discrimination against women, 55th session, July 8–26, 2013. Geneva: World Organisation against Torture and Women’s Synergy for Victims of Sexual Violence, 2013. www.omct.org/files/2013/07/22310/cedaw_report_drc_final_eng.pdf (accessed Jun 9, 2015).
5. CONCLUSIONS AND RECOMMENDATIONS
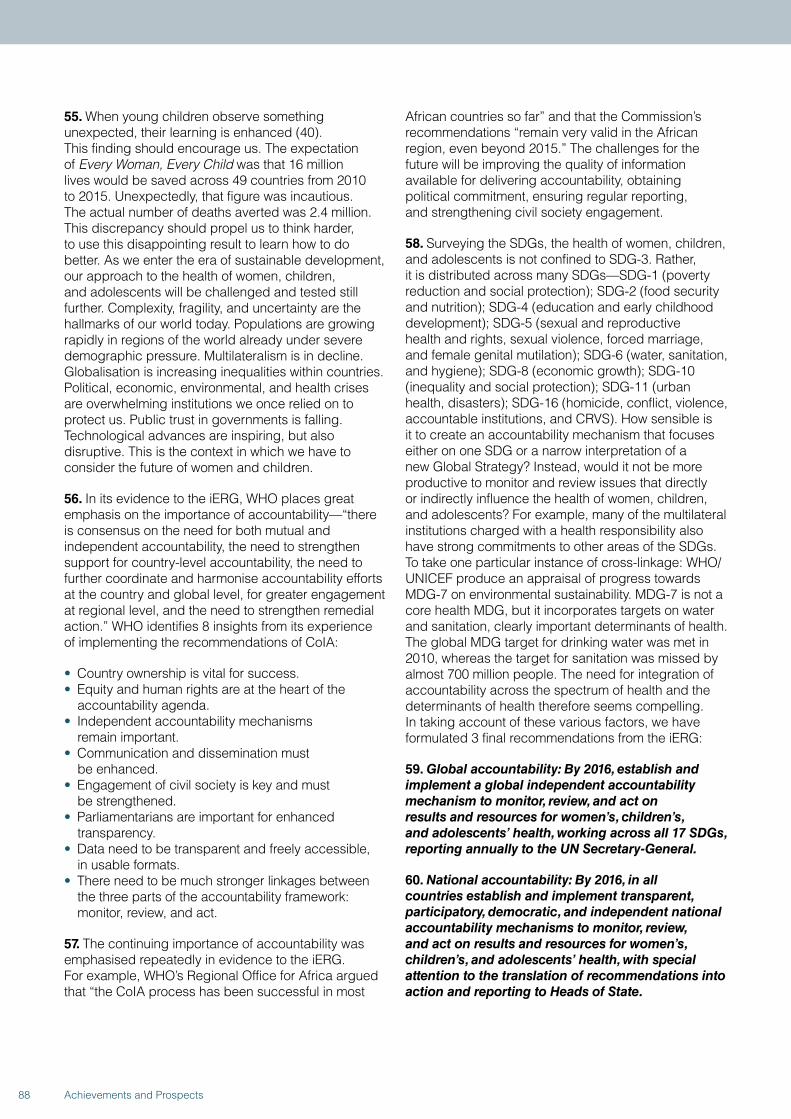
55. When young children observe something unexpected, their learning is enhanced (40). This finding should encourage us. The expectation of Every Woman, Every Child was that 16 million lives would be saved across 49 countries from 2010 to 2015. Unexpectedly, that figure was incautious. The actual number of deaths averted was 2.4 million. This discrepancy should propel us to think harder, to use this disappointing result to learn how to do better. As we enter the era of sustainable development, our approach to the health of women, children, and adolescents will be challenged and tested still further. Complexity, fragility, and uncertainty are the hallmarks of our world today. Populations are growing rapidly in regions of the world already under severe demographic pressure. Multilateralism is in decline. Globalisation is increasing inequalities within countries. Political, economic, environmental, and health crises are overwhelming institutions we once relied on to protect us. Public trust in governments is falling. Technological advances are inspiring, but also disruptive. This is the context in which we have to consider the future of women and children.
56. In its evidence to the iERG, WHO places great emphasis on the importance of accountability—“there is consensus on the need for both mutual and independent accountability, the need to strengthen support for country-level accountability, the need to further coordinate and harmonise accountability efforts at the country and global level, for greater engagement at regional level, and the need to strengthen remedial action.” WHO identifies 8 insights from its experience of implementing the recommendations of CoIA:
• Country ownership is vital for success.• Equity and human rights are at the heart of the
accountability agenda.• Independent accountability mechanisms
remain important.• Communication and dissemination must
be enhanced.• Engagement of civil society is key and must
be strengthened.• Parliamentarians are important for enhanced
transparency.• Data need to be transparent and freely accessible,
in usable formats.• There need to be much stronger linkages between
the three parts of the accountability framework: monitor, review, and act.
57. The continuing importance of accountability was emphasised repeatedly in evidence to the iERG. For example, WHO’s Regional Office for Africa argued that “the CoIA process has been successful in most
African countries so far” and that the Commission’s recommendations “remain very valid in the African region, even beyond 2015.” The challenges for the future will be improving the quality of information available for delivering accountability, obtaining political commitment, ensuring regular reporting, and strengthening civil society engagement.
58. Surveying the SDGs, the health of women, children, and adolescents is not confined to SDG-3. Rather, it is distributed across many SDGs—SDG-1 (poverty reduction and social protection); SDG-2 (food security and nutrition); SDG-4 (education and early childhood development); SDG-5 (sexual and reproductive health and rights, sexual violence, forced marriage, and female genital mutilation); SDG-6 (water, sanitation, and hygiene); SDG-8 (economic growth); SDG-10 (inequality and social protection); SDG-11 (urban health, disasters); SDG-16 (homicide, conflict, violence, accountable institutions, and CRVS). How sensible is it to create an accountability mechanism that focuses either on one SDG or a narrow interpretation of a new Global Strategy? Instead, would it not be more productive to monitor and review issues that directly or indirectly influence the health of women, children, and adolescents? For example, many of the multilateral institutions charged with a health responsibility also have strong commitments to other areas of the SDGs. To take one particular instance of cross-linkage: WHO/UNICEF produce an appraisal of progress towards MDG-7 on environmental sustainability. MDG-7 is not a core health MDG, but it incorporates targets on water and sanitation, clearly important determinants of health. The global MDG target for drinking water was met in 2010, whereas the target for sanitation was missed by almost 700 million people. The need for integration of accountability across the spectrum of health and the determinants of health therefore seems compelling. In taking account of these various factors, we have formulated 3 final recommendations from the iERG:
59. Global accountability: By 2016, establish and implement a global independent accountability mechanism to monitor, review, and act on results and resources for women’s, children’s, and adolescents’ health, working across all 17 SDGs, reporting annually to the UN Secretary-General.
60. National accountability: By 2016, in all countries establish and implement transparent, participatory, democratic, and independent national accountability mechanisms to monitor, review, and act on results and resources for women’s, children’s, and adolescents’ health, with special attention to the translation of recommendations into action and reporting to Heads of State.
88 Achievements and Prospects
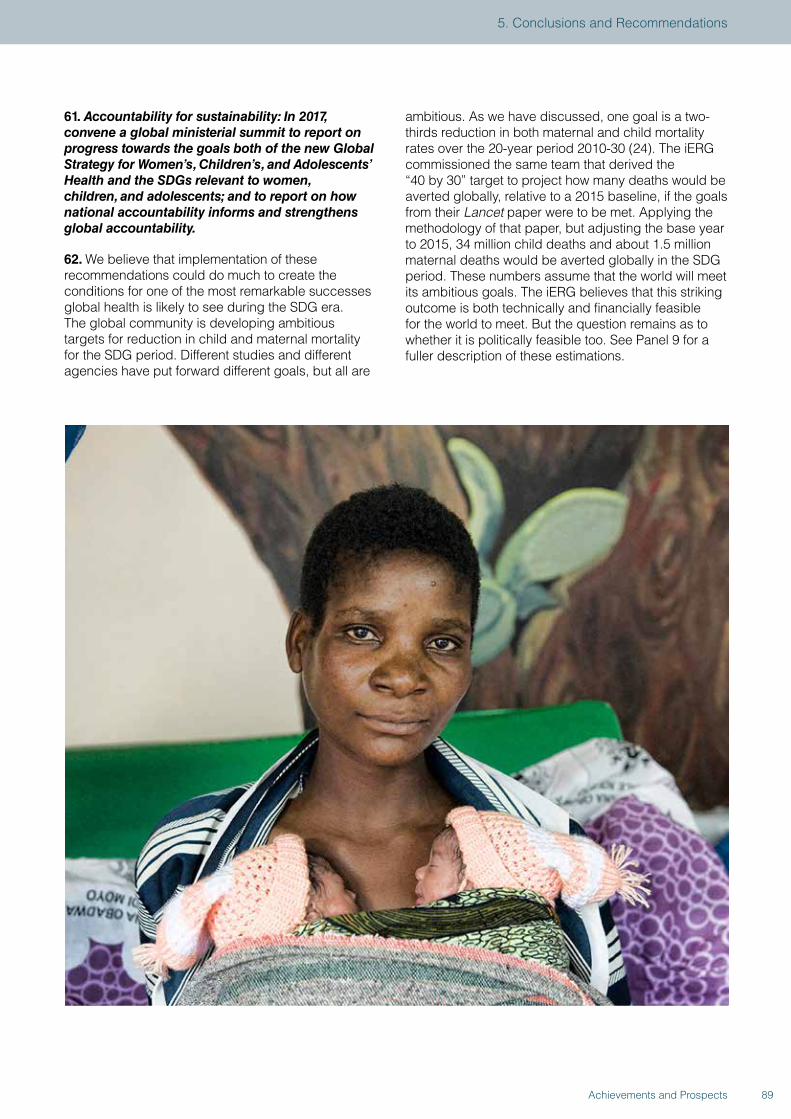
61. Accountability for sustainability: In 2017, convene a global ministerial summit to report on progress towards the goals both of the new Global Strategy for Women’s, Children’s, and Adolescents’ Health and the SDGs relevant to women, children, and adolescents; and to report on how national accountability informs and strengthens global accountability.
62. We believe that implementation of these recommendations could do much to create the conditions for one of the most remarkable successes global health is likely to see during the SDG era. The global community is developing ambitious targets for reduction in child and maternal mortality for the SDG period. Different studies and different agencies have put forward different goals, but all are
ambitious. As we have discussed, one goal is a two-thirds reduction in both maternal and child mortality rates over the 20-year period 2010-30 (24). The iERG commissioned the same team that derived the “40 by 30” target to project how many deaths would be averted globally, relative to a 2015 baseline, if the goals from their Lancet paper were to be met. Applying the methodology of that paper, but adjusting the base year to 2015, 34 million child deaths and about 1.5 million maternal deaths would be averted globally in the SDG period. These numbers assume that the world will meet its ambitious goals. The iERG believes that this striking outcome is both technically and financially feasible for the world to meet. But the question remains as to whether it is politically feasible too. See Panel 9 for a fuller description of these estimations.
89Achievements and Prospects
5. Conclusions and Recommendations
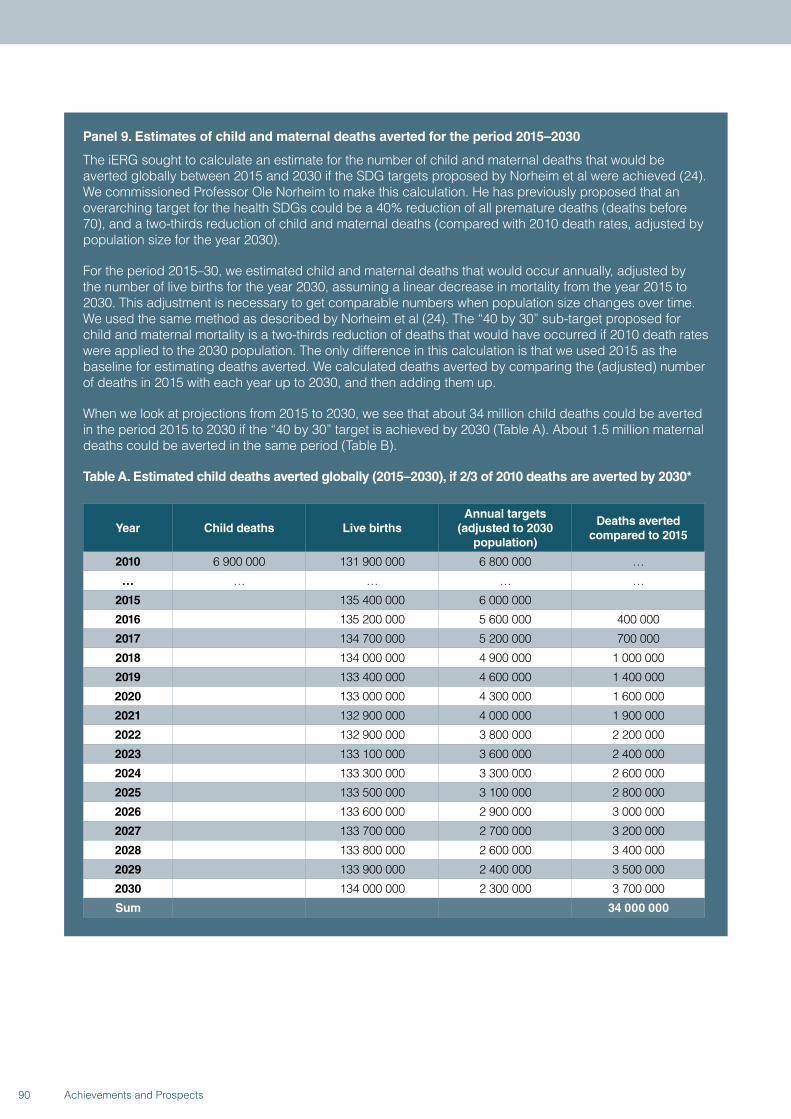
Panel 9. Estimates of child and maternal deaths averted for the period 2015–2030
The iERG sought to calculate an estimate for the number of child and maternal deaths that would be averted globally between 2015 and 2030 if the SDG targets proposed by Norheim et al were achieved (24). We commissioned Professor Ole Norheim to make this calculation. He has previously proposed that an overarching target for the health SDGs could be a 40% reduction of all premature deaths (deaths before 70), and a two-thirds reduction of child and maternal deaths (compared with 2010 death rates, adjusted by population size for the year 2030).
For the period 2015–30, we estimated child and maternal deaths that would occur annually, adjusted by the number of live births for the year 2030, assuming a linear decrease in mortality from the year 2015 to 2030. This adjustment is necessary to get comparable numbers when population size changes over time. We used the same method as described by Norheim et al (24). The “40 by 30” sub-target proposed for child and maternal mortality is a two-thirds reduction of deaths that would have occurred if 2010 death rates were applied to the 2030 population. The only difference in this calculation is that we used 2015 as the baseline for estimating deaths averted. We calculated deaths averted by comparing the (adjusted) number of deaths in 2015 with each year up to 2030, and then adding them up.
When we look at projections from 2015 to 2030, we see that about 34 million child deaths could be averted in the period 2015 to 2030 if the “40 by 30” target is achieved by 2030 (Table A). About 1.5 million maternal deaths could be averted in the same period (Table B).
Table A. Estimated child deaths averted globally (2015–2030), if 2/3 of 2010 deaths are averted by 2030*
Year Child deaths Live birthsAnnual targets
(adjusted to 2030 population)
Deaths averted compared to 2015
2010 6 900 000 131 900 000 6 800 000 …
… … … … …
2015 135 400 000 6 000 000
2016 135 200 000 5 600 000 400 000
2017 134 700 000 5 200 000 700 000
2018 134 000 000 4 900 000 1 000 000
2019 133 400 000 4 600 000 1 400 000
2020 133 000 000 4 300 000 1 600 000
2021 132 900 000 4 000 000 1 900 000
2022 132 900 000 3 800 000 2 200 000
2023 133 100 000 3 600 000 2 400 000
2024 133 300 000 3 300 000 2 600 000
2025 133 500 000 3 100 000 2 800 000
2026 133 600 000 2 900 000 3 000 000
2027 133 700 000 2 700 000 3 200 000
2028 133 800 000 2 600 000 3 400 000
2029 133 900 000 2 400 000 3 500 000
2030 134 000 000 2 300 000 3 700 000
Sum 34 000 000
90 Achievements and Prospects
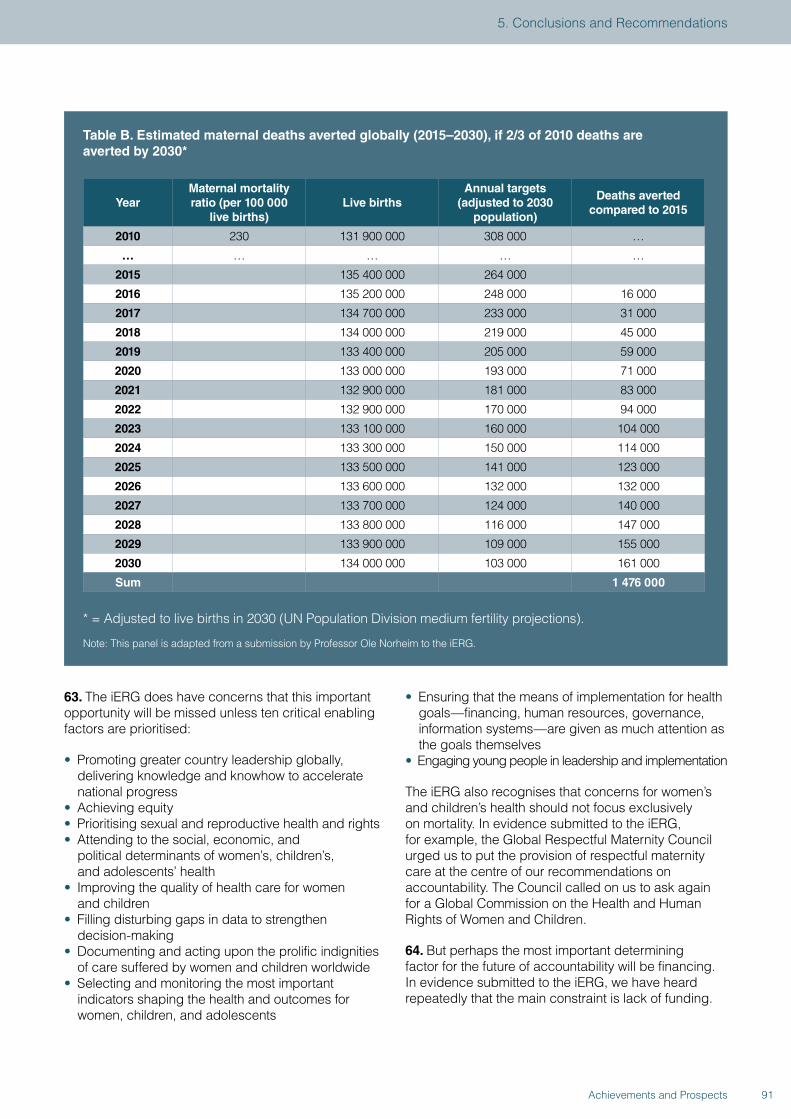
Table B. Estimated maternal deaths averted globally (2015–2030), if 2/3 of 2010 deaths are averted by 2030*
YearMaternal mortality ratio (per 100 000
live births)Live births
Annual targets(adjusted to 2030
population)
Deaths averted compared to 2015
2010 230 131 900 000 308 000 …
… … … … …
2015 135 400 000 264 000
2016 135 200 000 248 000 16 000
2017 134 700 000 233 000 31 000
2018 134 000 000 219 000 45 000
2019 133 400 000 205 000 59 000
2020 133 000 000 193 000 71 000
2021 132 900 000 181 000 83 000
2022 132 900 000 170 000 94 000
2023 133 100 000 160 000 104 000
2024 133 300 000 150 000 114 000
2025 133 500 000 141 000 123 000
2026 133 600 000 132 000 132 000
2027 133 700 000 124 000 140 000
2028 133 800 000 116 000 147 000
2029 133 900 000 109 000 155 000
2030 134 000 000 103 000 161 000
Sum 1 476 000
* = Adjusted to live births in 2030 (UN Population Division medium fertility projections).
Note: This panel is adapted from a submission by Professor Ole Norheim to the iERG.
63. The iERG does have concerns that this important opportunity will be missed unless ten critical enabling factors are prioritised:
• Promoting greater country leadership globally, delivering knowledge and knowhow to accelerate national progress
• Achieving equity • Prioritising sexual and reproductive health and rights• Attending to the social, economic, and
political determinants of women’s, children’s, and adolescents’ health
• Improving the quality of health care for women and children
• Filling disturbing gaps in data to strengthen decision-making
• Documenting and acting upon the prolific indignities of care suffered by women and children worldwide
• Selecting and monitoring the most important indicators shaping the health and outcomes for women, children, and adolescents
• Ensuring that the means of implementation for health goals—financing, human resources, governance, information systems—are given as much attention as the goals themselves
• Engaging young people in leadership and implementation
The iERG also recognises that concerns for women’s and children’s health should not focus exclusively on mortality. In evidence submitted to the iERG, for example, the Global Respectful Maternity Council urged us to put the provision of respectful maternity care at the centre of our recommendations on accountability. The Council called on us to ask again for a Global Commission on the Health and Human Rights of Women and Children.
64. But perhaps the most important determining factor for the future of accountability will be financing. In evidence submitted to the iERG, we have heard repeatedly that the main constraint is lack of funding.
91Achievements and Prospects
5. Conclusions and Recommendations
Here, for example, is the Africa Programme on Accelerated Improvement of CRVS:
“The core challenge faced by the regional programme is the lack of systematic funding...The funding for the programme, largely sourced from development partners, has been inadequate and ad hoc in nature. The unpredictability of resources has affected the smooth implementation of the programme...Although the bulk of the funding for the plans will come from Governments, some countries will require catalytic funds to kick-start implementation. The availability of such funding has critical implications for the success of the regional initiative.”
Their point is well made. Countries recognise that in the future, resources for improving women’s, children’s, and adolescents’ health, and resources for strengthening accountability too, will be mobilised domestically. But countries still need critical externally sourced investments to support their own programmes for development. The funding gap does not only affect countries. International agencies are hit too. For example, in evidence submitted to the iERG by WHO’s Western Pacific Region, a key remaining challenge was limited financial resources: “Development partners have limited financial resources for RMNCAH programmes...This has hindered the scale and scope of technical support that can be provided to implement CoIA and CoLSC recommendations.”
65. One of the most heralded meetings of 2015 was the Third Financing for Development conference (FFD3), held in Ethiopia in July, 2015. The Addis Ababa Action Agenda that followed was called historic and ground-breaking by some observers. But our view is that FFD3 was a serious disappointment for health, and surprisingly vague on the promises made for women and children specifically. First, on health. Of 134 paragraphs in the final outcome document, only one was dedicated to health—where no explicit commitments were offered. WHO’s role was reaffirmed. The Global Fund and Gavi were urged to take health systems more seriously. And the Framework Convention on Tobacco Control was supported. There was an additional note about the value of research into vaccines. But overall, FFD3 was empty of substantive content. The language of bureaucracy and compromise strangled any possibility of an inspiring vision to deliver the SDGs. Instead, there were only imprecise calls for more domestic resource mobilisation, greater contributions from the private sector and philanthropy, and stronger trade. On women and children, the centrepiece in Addis was the launch of the Global Financing Facility. The iERG supports
all efforts to expand the funding envelope for women and children. But there was surprise and confusion when Jim Kim, President of the World Bank, reported that US$12 billion had been mobilised to support new financing for women and children, when the actual figure of known pledges was US$1 billion—a good beginning, but only incremental, and certainly not transformative, financing. The impact of the Global Financing Facility remains uncertain. We wish the Facility well, but we are not yet convinced it has the broad support or resources to be successful.
66. In concluding our work, we ourselves need to be accountable to the Every Woman, Every Child movement, and most importantly, to the women, children, and adolescents who are the subject of our concern. Two questions demand answers:
Since the launch of the work of the Commission on Information and Accountability and iERG, do countries and partners have better information to track results and resources?
Do those countries and partners have stronger and more sustainable systems of accountability, nationally and globally?
On the first question, we believe we have shown (Figure 14) that progress has been achieved in several critical areas—notably, acceleration of CRVS strengthening, innovation, agreement of country compacts, and awareness and advocacy for global and national accountability. In other areas, there are simply too little data to make confident judgements either way (on resource tracking, reaching women and children, and transparency). And in a few domains, we have been disappointed by lack of progress—eg, on the uptake and use of indicators to monitor change, and on the energy and commitment given to addressing inequalities (41). But on the second question, we are even more cautious. Globally, the iERG concludes its work in 2015. Although accountability is much discussed and partners seem committed to the principles of accountability, the precise arrangements for creating a sustainable mechanism to deliver independent global accountability for women’s, children’s, and adolescents’ health are unclear. We are concerned that the gains made in establishing independent accountability as a central part of the Global Strategy and SDG process post-2015 are at risk. In countries, although there has been considerable discussion of, and advocacy for, accountability, the evidence that resilient processes for monitoring, reviewing, and acting are in place is not available. There are documented examples of successful country accountability mechanisms
92 Achievements and Prospects
(42). We believe that countries have an extraordinary opportunity to make accountability the foundation for their accelerating development.
67. As we complete our term of office, we have looked back over the past 4 years to reflect on the lessons learned from the idea and practice of independent accountability.
• Independent accountability can be done and delivered, despite often challenging limitations of information and resources.
• Although global accountability was strengthened with the advent of an iERG, the connection with country accountability was weak. Indeed, our country level activity was the least developed part of our work. The country visits we undertook in 2014 were an important step in the right direction, one that we hope will be repeated and developed in future years. These visits allowed much more comprehensive national assessments of progress. But country visits by the iERG cannot substitute for strengthened national capacities for independent accountability. Such country accountability systems should be more formally linked to whatever global mechanism is put in place.
• The independent accountability mechanism needs to be supported in developing stronger relationships with country development partners. One possible solution is to designate a national accountability representative within each country WHO team whose responsibility is to survey and shepherd progress on CoIA recommendations.
• Accountability must be accompanied by tangible actions and remedies at global and national levels for its full value to be realised. The link between the sensory inputs of independent accountability and the effector outputs of action must be strengthened.
• Between its global and country concerns, independent accountability can also operate regionally. It would have been helpful if the iERG had been able to take fuller advantage of regional health institutions (eg, with the Regional Offices of WHO).
• The iERG was constantly aware of the value of the independence it was granted by CoIA. That independence is partly guaranteed from the broad array and diversity of its members in age, professional background, philosophy, expertise, and geography. The complementarities of backgrounds and skills within the iERG membership were a major advantage to its work. The independence we were given enabled us to commission reports and case studies to illustrate critical points of concern.
• We learned that to make the most of the evidence we received, we should not only measure and report on progress in our monitoring role, but also develop policy proposals for action and remedy.
• We were repeatedly made aware that for our recommendations to have maximum impact, our reports had to be channelled to the highest reaches of global decision-making. Although we sought more formal presentation and discussion of our annual reports at key global meetings, we were disappointed with the progress we made in this regard.
• The hosting, resourcing, and autonomy of the mechanism for independent accountability are critical to its success. The secretariat function of the iERG is a vital part of its work. We believe that the technical capacity of this secretariat should be strengthened in future iterations of independent accountability.
68. We began our report with the stories of, among others, Fatima, Elima, Emile, and Maria. Each story told a truth about the lives of women and children in the world today. The death of a newborn baby. Health in a conflict zone. A stillbirth. Sexual violence. A preventable maternal death. The victims of Ebola. The death of a child. The indignities inflicted by a failing health system. Amid the charts, research papers, reports, evidence, numbers, estimates, projections, assessments, and scorecards we have reviewed and interpreted, it is these stories we wish to conclude with—the lived experiences of women and children everywhere. These stories and experiences should provoke not only shock, compassion, and outrage, but also commitment, action, and results.
93Achievements and Prospects
5. Conclusions and Recommendations
Argentina: Conditional cash transfer programmes and their impact on women’s and children’s health and gender roles
Since the 2001 economic downturn, the Argentinian government’s increased focus on conditional cash transfer (CCT) programmes has played an important part in expanding the provision of social protection and welfare to Argentina’s most vulnerable women and children.
The Universal Child Allowance programme (Asignación Universal por Hijo; AUH) was launched in 2009 for children under the age of 18 whose parents or guardians were either unemployed or working in the informal economy, thereby expanding the reach of benefits provided under the social insurance system to the disproportionately poorer population. By focusing on the intended beneficiaries, AUH differs from other CCT programmes in Latin America, which have historically focused on poverty alleviation. AUH provides cash benefits, conditional on children receiving routine health check-ups, including vaccinations, and on their school attendance. It covers around 3.5 million children and 1.9 million households, representing 29% of all children and 15% of all households in Argentina (1,2).
A simulation exercise in 2009 to assess the impact of AUH’s implementation calculated that poverty was reduced by 21.9%, extreme poverty by 42.3%, and inequality by 20% (2). Impacts are of course difficult to attribute to AUH alone, since the government has other programmes aimed at improving women’s and children’s health and welfare. However, a study from the National Scientific and Technical Research Council (CONICET) states that AUH has reduced extreme poverty by up to 70% and poverty by 13–32%, calling it the “most successful social policy measure of the last 50 years” (3).
In terms of education, the programme created incentives for individuals to change their behaviour. Since its introduction, attendance by both primary and secondary school students has increased and the school drop-out rate has fallen. The Ministry of Education reported a 51% increase in student enrolment from the programme’s inception to May, 2010, and a 15% increase in attendance. School directors have attributed these improvements to AUH (4).
CCT programmes have also been reported to foster a sense of empowerment among women (5).
Women from poor households, many of whom are socially subservient and uneducated, are instead perceived as “co-responsible and active” partners working to address the poverty of their households (6). Argentina’s social inclusion programmes, such as Plan Jefas, have in the past provided women with opportunities to enter the active labour market through participation in community projects, allowing them greater avenues for self-development, unlike the traditional human development approach of other CCT programmes in the region, which focused primarily on attainment of children’s educational and health outcomes.
However, it has been noted that CCT programmes have also unintentionally reinforced patterns of gender segmentation, perpetuating poor skill growth and inhibiting low-income women workers from graduating to formal work (6). While CCT programmes such as Plan Familias and Seguro later emerged to address these gaps, by providing more targeted assistance to vulnerable populations of poor women and the elderly, the focus eventually narrowed to address child poverty alone, culminating in the launch of the AUH in 2009.
Thus, while Argentina has achieved modest success in improving health and education for children and adolescents as a result of AUH (4), it has had less success in improving gender imbalances and giving women opportunities to escape traditional gender roles and low-skilled jobs (7).
Going forward, and learning from successful designs of CCT programmes in the past, a future direction for AUH and CCT programmes in general could be to reincorporate a focus on training and skill development for women, and to make direct payments only to women (instead of the current system in which both men and women can receive cash), fostering empowerment especially for women in unstable unions (8). Similarly, adopting a more multidimensional and psychological vision of poverty that utilises CCTs as “an extension of women’s individual responsibilities in managing household poverty with no collective component” (as in Chile’s Puente programme) may produce a more equitable adjustment of gender roles in their approach to reducing poverty (9).
Additionally, better coordination and integration with other social welfare programmes and the National
94 Achievements and Prospects
Social Security Programme (Obras Sociales) will help address concerns about AUH’s long-term sustainability and cost-effectiveness. Some steps are already being taken in this direction, such as the creation of a unified electronic database of beneficiaries to improve targeting and tracking (10) and especially to address documentation and newborn registration problems. This database will also enable the measurement of health outcomes and more accurate estimates of the overall impact of AUH (albeit in coordination with other welfare programmes).
Other innovations are helping to address delays in the uptake of benefits among eligible households and across age groups. For example, making benefits conditional on enrolment in Programa Sumar (previously Plan Nacer) has
improved uptake among the infant age group, and adolescents aged 10–18 are now being engaged through activities such as karate classes that promote a healthy lifestyle (11).
Finally, AUH further highlights the need to ensure the availability of health centres and educational establishments in the beneficiaries’ local neighbourhoods, and places a crucial emphasis on the quality of services provided. While supply-side programmes like Plan Nacer have had more success in this regard (12), and provide better services in line with their results-based financing frameworks, AUH is still essential in order to motivate demand-side behaviour more directly. In the future, these programmes should be more closely coordinated in order to achieve the best possible results.
References
1. Observatorio de la Seguridad Social. La Asignación Universal por Hijo para protección social. In: La inclusión social como transformación: políticas públicas para todos. Buenos Aires: Administración Nacional de la Seguridad Social, 2012.
2. Roca E. Extension of the universal family allowance: the Universal Child Allowance, Argentina. In: Sharing innovative experiences: successful social protection floor experiences; 18: 25–42. New York: United Nations Development Programme, 2011. http://www.ilo.org/wcmsp5/groups/public/---ed_protect/---soc_sec/documents/publication/wcms_secsoc_20840.pdf (accessed Jun 8, 2015).
3. Agis E, Cañete C, Panigo D. El impacto de la Asignación Universal por Hijo en Argentina. Buenos Aires: CENDA, SID, PROFOPE, CEIL-PIETTE, 2010. http://fundses.org.ar/archi/programas/Estudios_sobre_Impacto_Asignacion_Universal_Pobreza_Indigencia_America/AUH_en_Argentina.pdf (accessed Jun 8, 2015).
4. Pierri G, Assaad R. The impact of Argentina’s universal child allowance cash transfer program on children’s educational outcomes. Working Paper, 2014. http://www.academia.edu/9610283/The_Impact_of_Argentina_s_Universal_Child_Allowance_Cash_Transfer_Program_on_Children_s_Educational_Outcomes (accessed Jun 8, 2015).
5. Fernald L, Gertler P, Neufeld L. Role of cash in conditional cash transfer programmes for child health, growth and development: analysis of Mexico’s Oportunidades. Lancet 2008; 371: 828–37.
6. Tabbush C. Gender, citizenship and new approaches to poverty relief: conditional cash transfer programmes in Argentina. In: Razavi S (Ed). The gendered impacts of liberalization: towards “embedded liberalism” (487–535). Oxon: Routledge, 2009. http://www.unrisd.org/80256B3C005BCCF9/search/1197DAC65C4D2216C12575370039DB30?OpenDocument (accessed Jun 8, 2015).
7. Rodriguez E. Gender aspect of social policy in Argentina: the case of money transfer policy. Paper presented at the 6th International Conference: Engendering Macroeconomics and International Economics. Salt Lake City: University of Utah, 2005.
8. Rabinovich L, Diepeveen S. The design of conditional cash transfers: experiences from Argentina’s Universal Child Allowance. CESR-Schaeffer Working Paper No. 2014-006. Los Angeles: University of Southern California, 2014.
9. Arriagada I, Mathivet C. Los programas de alivio a la pobreza puente y oportunidades. Una mirada desde los actores. Serie Políticas Sociales No. 134 (LC/L.2740-P/E). Santiago
95Achievements and Prospects
5. Conclusions and Recommendations
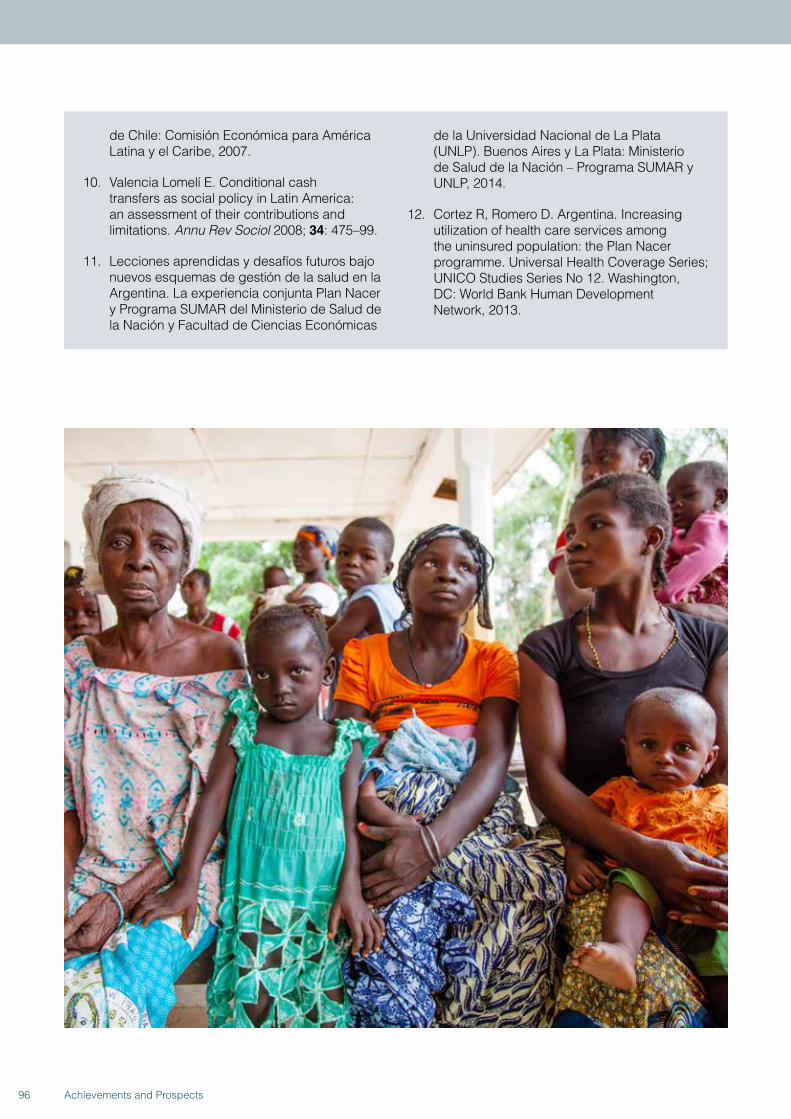
de Chile: Comisión Económica para América Latina y el Caribe, 2007.
10. Valencia Lomelí E. Conditional cash transfers as social policy in Latin America: an assessment of their contributions and limitations. Annu Rev Sociol 2008; 34: 475–99.
11. Lecciones aprendidas y desafíos futuros bajo nuevos esquemas de gestión de la salud en la Argentina. La experiencia conjunta Plan Nacer y Programa SUMAR del Ministerio de Salud de la Nación y Facultad de Ciencias Económicas
de la Universidad Nacional de La Plata (UNLP). Buenos Aires y La Plata: Ministerio de Salud de la Nación – Programa SUMAR y UNLP, 2014.
12. Cortez R, Romero D. Argentina. Increasing utilization of health care services among the uninsured population: the Plan Nacer programme. Universal Health Coverage Series; UNICO Studies Series No 12. Washington, DC: World Bank Human Development Network, 2013.
96 Achievements and Prospects
REFERENCES
1. Commission on Information and Accountability for Women’s and Children’s Health. Keeping Promises, Measuring Results. Geneva: World Health Organization, 2011.
2. United Nations Secretary-General. Global Strategy for Women’s and Children’s Health. The Partnership for Maternal, Newborn and Child Health, 2010. http://www.who.int/pmnch/topics/maternal/20100914_gswch_en.pdf?ua=1 (accessed Jun 18, 2015).
3. Every Woman Every Child. Saving Lives, Protecting Futures: Progress Report on the Global Strategy for Women’s and Children’s Health 2010–2015. 2015. http://everywomaneverychild.org/images/EWEC_Progress_Report_FINAL_3.pdf (accessed Jun 18, 2015).
4. United Nations Secretary-General. The road to dignity by 2030: ending poverty, transforming all lives and protecting the planet. Synthesis report of the Secretary-General on the post-2015 sustainable development agenda. Dec 26, 2014. New York: United Nations General Assembly, 2014.
5. Every Woman Every Child. Global Strategy for Women’s, Children’s and Adolescents’ Health. 2015 (forthcoming).
6. Independent Expert Advisory Group on a Data Revolution for Sustainable Development. A World That Counts: Mobilising The Data Revolution for Sustainable Development. 2014. http://www.undatarevolution.org/report/ (accessed Jun 18, 2015).
7. Heymann DL, Chen L, Takemi K, et al. Global health security: the wider lessons from the west African Ebola virus disease epidemic. Lancet 2015; 385: 1884–1901.
8. Merkel A. Statement at the 68th World Health Assembly. May 18, 2015. Geneva. http://www.who.int/mediacentre/events/2015/wha68/merkel-speech-wha68.pdf?ua=1 (accessed Jun 18, 2015).
9. Ebola Interim Assessment Panel. Report of the Ebola Interim Assessment Panel. 2015. http://www.who.int/csr/resources/publications/ebola/report-by-panel.pdf?ua=1 (accessed Jul 16, 2015).
10. WHO Ebola Response Team. Ebola virus disease among children in West Africa. N Engl J Med 2015; 372: 1274–77.
11. Wang H, Liddell CA, Coates MM, et al. Global, regional, and national levels of neonatal, infant, and under-5 mortality during 1990–2013: a systematic analysis for the Global Burden of Disease Study 2013. Lancet 2014; 384: 957–79.
12. Liu L, Oza S, Hogan D, et al. Global, regional, and national causes of child mortality in 2000–13, with projections to inform post-2015 priorities: an updated systematic analysis. Lancet 2015; published online Sep 30. http://dx.doi.org/10.1016/S0140-6736(14)61698-6 (accessed Jun 18, 2015).
13. GBD 2013 Mortality and Cause of Death Collaborators. Global, regional, and national age–sex specific all-cause and cause-specific mortality for 240 causes of death, 1990–2013: a systematic analysis for the Global Burden of Disease Study 2013. Lancet 2015; 385: 117–71.
14. Oza S, Lawn JE, Hogan DR, Mathers C, Cousens SN. Neonatal cause-of-death estimates for the early and late neonatal periods for 194 countries: 2000–2013. Bull World Health Organ 2015; 93: 19–28.
15. Kassebaum NJ, Bertozzi-Villa A, Coggeshall MS, et al. Global, regional, and national levels and causes of maternal mortality during 1990–2013: a systematic analysis for the Global Burden of Disease Study 2013. Lancet 2014; 384: 980–1004.
16a. Singh S, Darroch JE, Ashford LS. Adding it up: the costs and benefits of investing in sexual and reproductive health 2014. New York, NY: Guttmacher Institute, 2014.
16b. Unicef. Progress for children beyond averages: learning from the MDGs (No. 11). New York, NY: United Nations Children’s Fund, 2015.
17. WHO. Every newborn: an action plan to end preventable deaths. Geneva: World Health Organization, 2014.
18. Independent Expert Group. Global nutrition report 2014: actions and accountability to accelerate the world’s progress on nutrition. Washington, DC: International Food Policy Research Institute, 2014.
97Achievements and Prospects
5. Conclusions and Recommendations
19. Samuels F, Amaya AB, Rodríguez Pose R, Balabanova D. Pathways to progress: a multi-level approach to strengthening health systems. Overseas Development Institute, 2014. http://www.odi.org/publications/9096-pathways-progress-multi-level-approach-strengthening-health-systems (accessed Jun 18, 2015).
20. Global Financing Facility. Business Plan for the Global Financing Facility in support of Every Woman Every Child. 2015. http://www.worldbank.org/content/dam/Worldbank/document/HDN/Health/Business-Plan-for-the-GFF-final.pdf (accessed Jun 18, 2015).
21. Usher AD. Nordic countries divided over Global Financing Facility. Lancet 2015; 385: 2239–40.
22. Horton R. Offline: An irreversible change in global health governance. Lancet 2015; 385: 2136.
23. Jamison DT, Summers LH, Alleyne G, et al. Global Health 2035: a world converging within a generation. Lancet 2013; 382: 1898–1955.
24. Norheim OF, Jha P, Admasu K, et al. Avoiding 40% of the premature deaths in each country, 2010–30: review of national mortality trends to help quantify the UN Sustainable Development Goal for health. Lancet 2015; 385: 238–52.
25. WHO. Strategies toward ending preventable maternal mortality (EPMM). Geneva: World Health Organization, 2015.
26. WHO. WHO recommendations on health promotion interventions for maternal and newborn health. Geneva: World Health Organization, 2015.
27. Zeid S, Bustreo F, Barakat MT, Maurer P, Gilmore K. For every woman, every child, everywhere: a universal agenda for the health of women, children, and adolescents. Lancet 2015; 385: 1919–20.
28. Vogel JP, Pileggi-Castro C, Chandra-Mouli V, et al. Millennium Development Goal 5 and adolescents: looking back, moving forward. Arch Dis Child 2015; 100 (suppl 1): s45–47.
29. Votruba N, Eaton J, Prince M, Thornicroft G. The importance of global mental health for the Sustainable Development Goals. J Ment Health 2014; 23: 283–86.
30. Meara JG, Leather AJM, Hagander L, et al. Global Surgery 2030: evidence and solutions for achieving health, welfare, and economic development. Lancet 2015; published online April 27. http://dx.doi.org/10.1016/S0140-6736(15)60160-X.
31. 68th World Health Assembly. Strengthening emergency and essential surgical care and anaesthesia as a component of universal health coverage. World Health Assembly, 2015. Resolution 68.15. http://apps.who.int/gb/ebwha/pdf_files/WHA68/A68_R15-en.pdf (accessed Jun 18, 2015).
32. WHO. Global status report on violence prevention 2014. Geneva: World Health Organization, 2014.
33. García-Moreno C, Zimmerman C, Morris-Gehring A, et al. Addressing violence against women: a call to action. Lancet 2014; published online Nov 20. http://dx.doi.org/10.1016/S0140-6736(14)61830-4.
34. Langer A, Meleis A, Knaul FM, et al. Women and health: the key for sustainable development. Lancet 2015; published online June 5. http://dx.doi.org/10.1016/S0140-6736(15)60497-4.
35. Bruen C, Brugha R, Kangeni A, Wafula F. A concept in flux: questioning accountability in the context of global health cooperation. Globalization and Health 2014; 10: 73.
36. AbouZahr C, de Savigny D, Mikkelsen L, Setel PW, Lozano R, Lopez AD. Towards universal civil registration and vital statistics systems: the time is now. Lancet 2015; published online May 10. http://dx.doi.org/10.1016/S0140-6736(15)60170-2.
37. Hulton L, Matthews Z, Martin-Hilber A, et al. Using evidence to drive action: a “revolution in accountability” to implement quality care for better maternal and newborn health in Africa. Int J Gynaecol Obstet 2014; 127: 96–101.
38. Yilla M, Nam SL, Adeyemo A, Kargbo SA. Using scorecards to achieve facility improvements for maternal and newborn health. Int J Gynaecol Obstet 2014; 127: 108–12.
39. Swinburn B, Kraak V, Rutter H, et al. Strengthening of accountability systems to create healthy food environments and reduce global obesity. Lancet 2015; 385: 2534–45.
40. Stahl AE, Feigenson L. Observing the unexpected enhances infants’ learning and exploration. Science 2015; 348: 91–94.
41. WHO. State of inequality: reproductive, maternal, newborn and child health. Geneva: World Health Organization, 2015.
42. Garba AM, Bandali S. The Nigeria Independent Accountability Mechanism for maternal, newborn, and child health. Int J Gynaecol Obstet 2014; 127: 113–16.
98 Achievements and Prospects

ACKNOWLEDGEMENTS
The iERG owes special thanks to a great many friends and colleagues. In particular, we wish to thank Marie-Paule Kieny, Flavia Bustreo, and Marleen Temmerman. We are extremely grateful to all those who have contributed to our report: Lale Say, Jessie Schutt-Aine, Bernadette Daelmans, Geir Lie, Rajat Khosla, Cesar Victora, Ole Norheim, Sara Fewer, Elizabeth Mason, Tim Shorten, Frédéric Bescond, Ipsita Parida, Haidong Wang, Joanne McManus, Renu Khanna, Howard Sobel, and Patrick Gerland. We thank all those
individuals and organisations who submitted evidence to the iERG. Without their enthusiastic collaboration with, and support for, independent accountability, we could not have completed our work over the past 4 years. Finally, the iERG thanks our dedicated secretariat without whom this final report would never have been possible: Ramesh Shademani, Natasha Shapovalova, Alex Gaina, Alexandra Rosado Miguel, Nupur Mital, and Nadia Day.
99Achievements and Prospects

100 Achievements and Prospects
COUNTRY PROFILES
101Achievements and Prospects
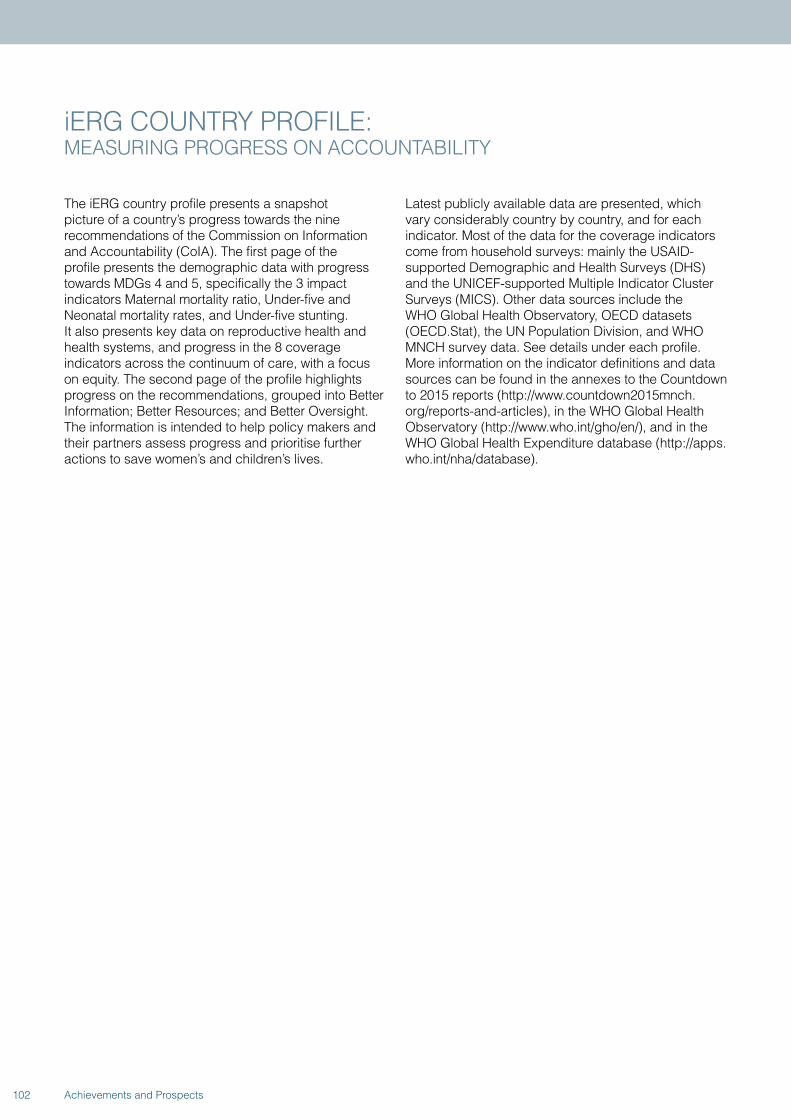
iERG COUNTRY PROFILE: MEASURING PROGRESS ON ACCOUNTABILITY
The iERG country profile presents a snapshot picture of a country’s progress towards the nine recommendations of the Commission on Information and Accountability (CoIA). The first page of the profile presents the demographic data with progress towards MDGs 4 and 5, specifically the 3 impact indicators Maternal mortality ratio, Under-five and Neonatal mortality rates, and Under-five stunting. It also presents key data on reproductive health and health systems, and progress in the 8 coverage indicators across the continuum of care, with a focus on equity. The second page of the profile highlights progress on the recommendations, grouped into Better Information; Better Resources; and Better Oversight. The information is intended to help policy makers and their partners assess progress and prioritise further actions to save women’s and children’s lives.
Latest publicly available data are presented, which vary considerably country by country, and for each indicator. Most of the data for the coverage indicators come from household surveys: mainly the USAID-supported Demographic and Health Surveys (DHS) and the UNICEF-supported Multiple Indicator Cluster Surveys (MICS). Other data sources include the WHO Global Health Observatory, OECD datasets (OECD.Stat), the UN Population Division, and WHO MNCH survey data. See details under each profile. More information on the indicator definitions and data sources can be found in the annexes to the Countdown to 2015 reports (http://www.countdown2015mnch.org/reports-and-articles), in the WHO Global Health Observatory (http://www.who.int/gho/en/), and in the WHO Global Health Expenditure database (http://apps.who.int/nha/database).
102 Achievements and Prospects
Profiles are presented for the 75 iERG countries with high burden of maternal and/or child mortality, including the 49 lowest-income countries covered by the Global Strategy for Women’s and Children’s Health.
AfghanistanAngolaAzerbaijanBangladeshBenin Bolivia (Plurinational State of)Botswana BrazilBurkina Faso BurundiCambodia Cameroon Central African RepublicChadChinaComorosCongoCongo, Democratic Republic of theCôte d’IvoireDjiboutiEgyptEquatorial GuineaEritreaEthiopiaGabonGambiaGhanaGuatemalaGuineaGuinea-BissauHaitiIndiaIndonesiaIraqKenyaKorea, Democratic People’s Republic ofKyrgyzstanLao People’s Democratic Republic
LesothoLiberiaMadagascarMalawiMaliMauritaniaMexicoMoroccoMozambiqueMyanmarNepalNigerNigeriaPakistanPapua New GuineaPeruPhilippinesRwandaSao Tome and PrincipeSenegalSierra LeoneSolomon IslandsSomaliaSouth AfricaSouth SudanSudanSwazilandTajikistanTanzania, United Republic ofTogoTurkmenistanUgandaUzbekistanViet NamYemenZambiaZimbabwe
103Achievements and Prospects
Country Profiles
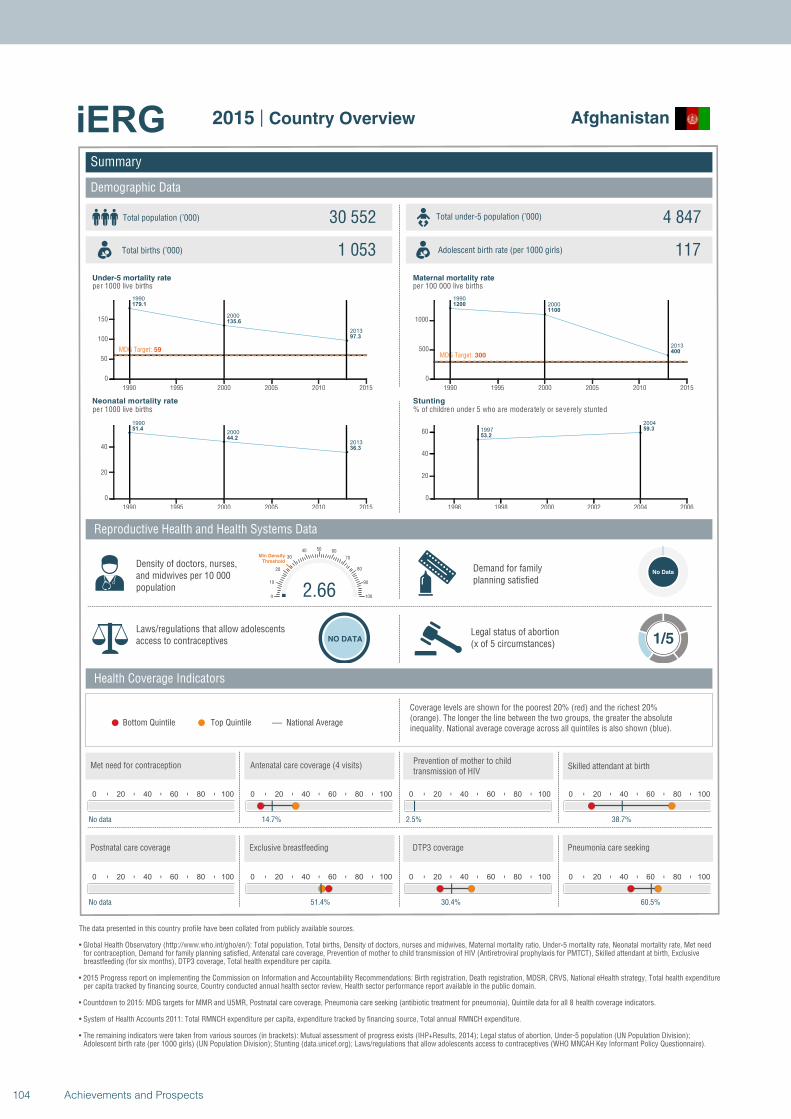
1990
2000
2013
179.1
135.6
97.3
MDG Target: 59
1990 1995 2000 2005 2010 2015
0
50
100
150
1990
2000
2013
51.4
44.2
36.3
1990 1995 2000 2005 2010 2015
0
20
40
1990
2000
2013
1200
1100
400MDG Target: 300
1990 1995 2000 2005 2010 2015
0
500
1000
1997
2004
53.2
59.3
1996 1998 2000 2002 2004 2006
0
20
40
60
Summary
Demographic Data
Afghanistan
Total population (’000) Total under-5 population (’000)30 552 4 847
1 053 117
Reproductive Health and Health Systems Data
Health Coverage Indicators
Demand for familyplanning satisfied
No Data
Laws/regulations that allow adolescents access to contraceptives NO DATA
Legal status of abortion(x of 5 circumstances) 1/5
National AverageBottom Quintile Top Quintile
per 1000 live births per 100 000 live births
per 1000 live births % of children under 5 who are moderately or severely stunted
0 20 40 60 80 100
No data
0 20 40 60 80 100
14.7%
0 20 40 60 80 100
2.5%
2.660
10
20
30
40 50 60
70
80
90
100
Min Density Threshold
0 20 40 60 80 100
38.7%
0 20 40 60 80 100
No data
0 20 40 60 80 100
51.4%
0 20 40 60 80 100
30.4%
0 20 40 60 80 100
60.5%
Total births (’000) Adolescent birth rate (per 1000 girls)
Coverage levels are shown for the poorest 20% (red) and the richest 20% (orange). The longer the line between the two groups, the greater the absolute inequality. National average coverage across all quintiles is also shown (blue).
Density of doctors, nurses, and midwives per 10 000 population
Postnatal care coverage Exclusive breastfeeding DTP3 coverage Pneumonia care seeking
Met need for contraception Antenatal care coverage (4 visits)Prevention of mother to child transmission of HIV
Skilled attendant at birth
Under-5 mortality rate Maternal mortality rate
Neonatal mortality rate Stunting
The data presented in this country profile have been collated from publicly available sources.
• Global Health Observatory (http://www.who.int/gho/en/): Total population, Total births, Density of doctors, nurses and midwives, Maternal mortality ratio, Under-5 mortality rate, Neonatal mortality rate, Met need for contraception, Demand for family planning satisfied, Antenatal care coverage, Prevention of mother to child transmission of HIV (Antiretroviral prophylaxis for PMTCT), Skilled attendant at birth, Exclusive breastfeeding (for six months), DTP3 coverage, Total health expenditure per capita.
• 2015 Progress report on implementing the Commission on Information and Accountability Recommendations: Birth registration, Death registration, MDSR, CRVS, National eHealth strategy, Total health expenditureper capita tracked by financing source, Country conducted annual health sector review, Health sector performance report available in the public domain.
• Countdown to 2015: MDG targets for MMR and U5MR, Postnatal care coverage, Pneumonia care seeking (antibiotic treatment for pneumonia), Quintile data for all 8 health coverage indicators.
• System of Health Accounts 2011: Total RMNCH expenditure per capita, expenditure tracked by financing source, Total annual RMNCH expenditure.
• The remaining indicators were taken from various sources (in brackets): Mutual assessment of progress exists (IHP+Results, 2014); Legal status of abortion, Under-5 population (UN Population Division);Adolescent birth rate (per 1000 girls) (UN Population Division); Stunting (data.unicef.org); Laws/regulations that allow adolescents access to contraceptives (WHO MNCAH Key Informant Policy Questionnaire).
2015 | Country Overview
104 Achievements and Prospects
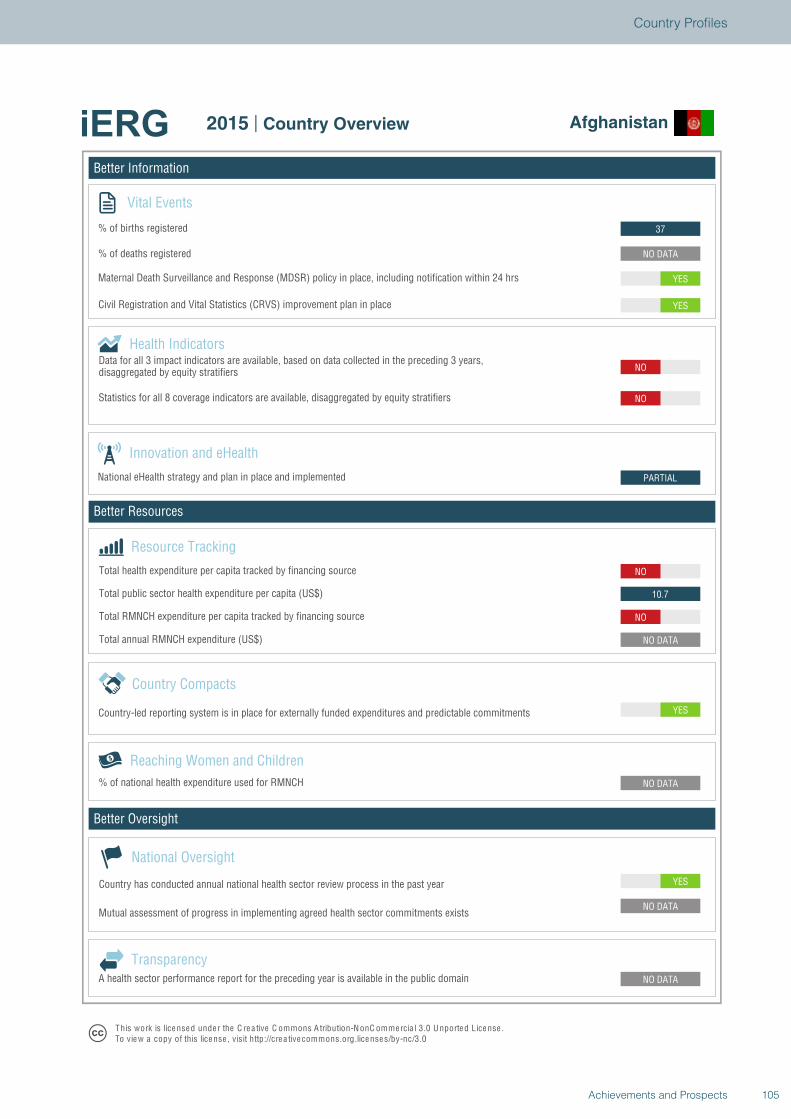
Better Information
Better Resources
Better Oversight
Afghanistan
Vital Events
% of births registered
% of deaths registered
Innovation and eHealth
National eHealth strategy and plan in place and implemented
Health Indicators
Statistics for all 8 coverage indicators are available, disaggregated by equity stratifiers
Reaching Women and Children
Country Compacts
Country-led reporting system is in place for externally funded expenditures and predictable commitments
Resource Tracking
Total RMNCH expenditure per capita tracked by financing source
Total annual RMNCH expenditure (US$)
Total health expenditure per capita tracked by financing source
% of national health expenditure used for RMNCH
YES
NO DATA
NO DATA
NO DATA
YES
NO DATA
NO
10.7
NO
PARTIAL
NO
NO
YES
YES
NO DATA
37
National Oversight
Mutual assessment of progress in implementing agreed health sector commitments exists
Country has conducted annual national health sector review process in the past year
TransparencyA health sector performance report for the preceding year is available in the public domain
T his work is lice nse d unde r the C re a tive C ommons A tribution-N onC ommercia l 3.0 U nported License .To view a copy of this license , visit http://cre a tive commons.org.licenses/by-nc/3.0
2015 | Country Overview Afghanistan
Total public sector health expenditure per capita (US$)
Maternal Death Surveillance and Response (MDSR) policy in place, including notification within 24 hrs
Civil Registration and Vital Statistics (CRVS) improvement plan in place
Data for all 3 impact indicators are available, based on data collected in the preceding 3 years,disaggregated by equity stratifiers
105Achievements and Prospects
Country Profiles
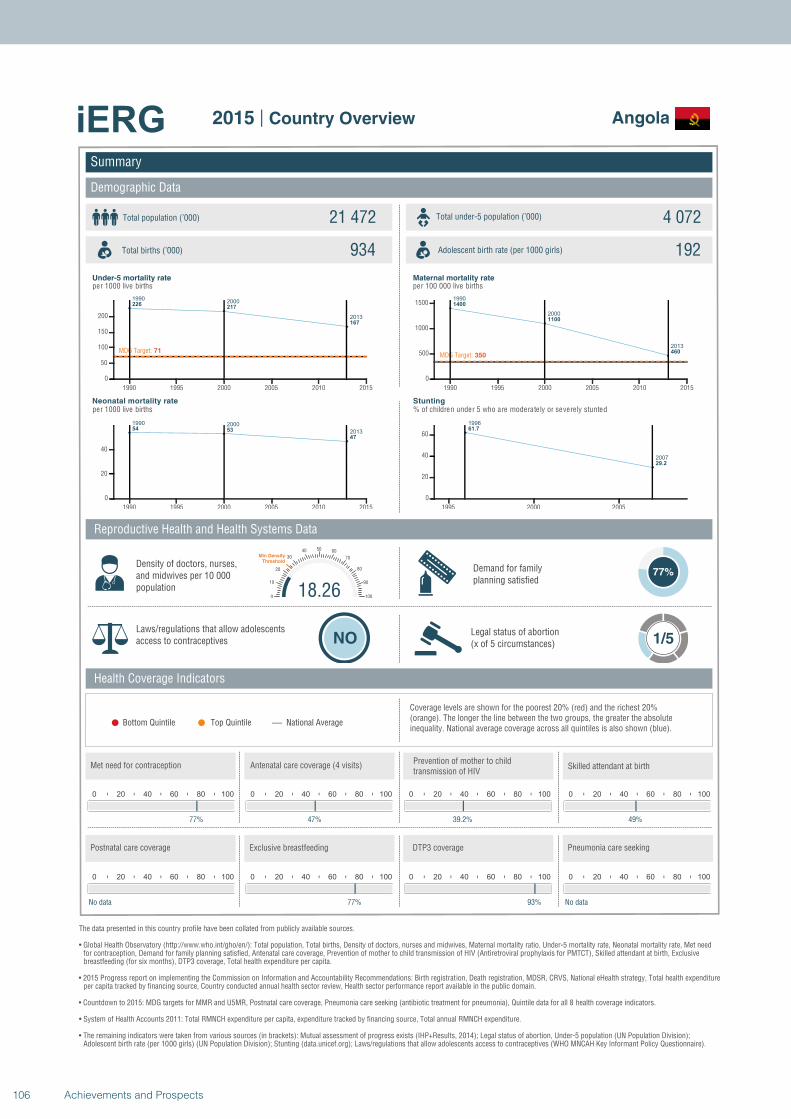
19902000
2013
226217
167
MDG Target: 71
1990 1995 2000 2005 2010 2015
0
50
100
150
200
1990 2000
201354 53
47
1990 1995 2000 2005 2010 2015
0
20
40
1990
2000
2013
1400
1100
460MDG Target: 350
1990 1995 2000 2005 2010 2015
0
500
1000
1500
1996
2007
61.7
29.2
1995 2000 2005
0
20
40
60
Summary
Demographic Data
Angola
Total population (’000) Total under-5 population (’000)21 472 4 072
934 192
Reproductive Health and Health Systems Data
Health Coverage Indicators
Demand for familyplanning satisfied
77%
Laws/regulations that allow adolescents access to contraceptives NO
Legal status of abortion(x of 5 circumstances) 1/5
National AverageBottom Quintile Top Quintile
per 1000 live births per 100 000 live births
per 1000 live births % of children under 5 who are moderately or severely stunted
0 20 40 60 80 100
77%
0 20 40 60 80 100
47%
0 20 40 60 80 100
39.2%
18.260
10
20
30
40 50 60
70
80
90
100
Min Density Threshold
0 20 40 60 80 100
49%
0 20 40 60 80 100
No data
0 20 40 60 80 100
77%
0 20 40 60 80 100
93%
0 20 40 60 80 100
No data
Total births (’000) Adolescent birth rate (per 1000 girls)
Coverage levels are shown for the poorest 20% (red) and the richest 20% (orange). The longer the line between the two groups, the greater the absolute inequality. National average coverage across all quintiles is also shown (blue).
Density of doctors, nurses, and midwives per 10 000 population
Postnatal care coverage Exclusive breastfeeding DTP3 coverage Pneumonia care seeking
Met need for contraception Antenatal care coverage (4 visits)Prevention of mother to child transmission of HIV
Skilled attendant at birth
Under-5 mortality rate Maternal mortality rate
Neonatal mortality rate Stunting
The data presented in this country profile have been collated from publicly available sources.
• Global Health Observatory (http://www.who.int/gho/en/): Total population, Total births, Density of doctors, nurses and midwives, Maternal mortality ratio, Under-5 mortality rate, Neonatal mortality rate, Met need for contraception, Demand for family planning satisfied, Antenatal care coverage, Prevention of mother to child transmission of HIV (Antiretroviral prophylaxis for PMTCT), Skilled attendant at birth, Exclusive breastfeeding (for six months), DTP3 coverage, Total health expenditure per capita.
• 2015 Progress report on implementing the Commission on Information and Accountability Recommendations: Birth registration, Death registration, MDSR, CRVS, National eHealth strategy, Total health expenditureper capita tracked by financing source, Country conducted annual health sector review, Health sector performance report available in the public domain.
• Countdown to 2015: MDG targets for MMR and U5MR, Postnatal care coverage, Pneumonia care seeking (antibiotic treatment for pneumonia), Quintile data for all 8 health coverage indicators.
• System of Health Accounts 2011: Total RMNCH expenditure per capita, expenditure tracked by financing source, Total annual RMNCH expenditure.
• The remaining indicators were taken from various sources (in brackets): Mutual assessment of progress exists (IHP+Results, 2014); Legal status of abortion, Under-5 population (UN Population Division);Adolescent birth rate (per 1000 girls) (UN Population Division); Stunting (data.unicef.org); Laws/regulations that allow adolescents access to contraceptives (WHO MNCAH Key Informant Policy Questionnaire).
2015 | Country Overview
106 Achievements and Prospects
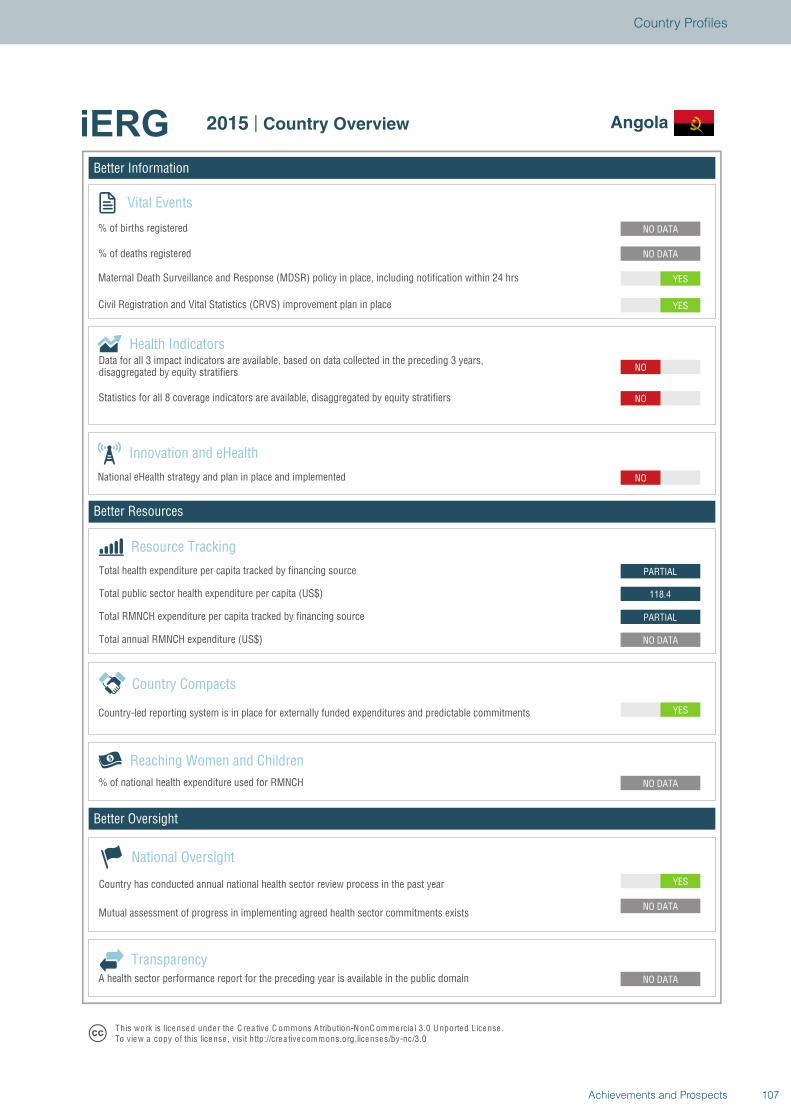
Better Information
Better Resources
Better Oversight
Angola
Vital Events
% of births registered
% of deaths registered
Innovation and eHealth
National eHealth strategy and plan in place and implemented
Health Indicators
Statistics for all 8 coverage indicators are available, disaggregated by equity stratifiers
Reaching Women and Children
Country Compacts
Country-led reporting system is in place for externally funded expenditures and predictable commitments
Resource Tracking
Total RMNCH expenditure per capita tracked by financing source
Total annual RMNCH expenditure (US$)
Total health expenditure per capita tracked by financing source
% of national health expenditure used for RMNCH
YES
NO DATA
NO DATA
NO DATA
YES
NO DATA
PARTIAL
118.4
PARTIAL
NO
NO
NO
YES
YES
NO DATA
NO DATA
National Oversight
Mutual assessment of progress in implementing agreed health sector commitments exists
Country has conducted annual national health sector review process in the past year
TransparencyA health sector performance report for the preceding year is available in the public domain
T his work is lice nse d unde r the C re a tive C ommons A tribution-N onC ommercia l 3.0 U nported License .To view a copy of this license , visit http://cre a tive commons.org.licenses/by-nc/3.0
2015 | Country Overview Angola
Total public sector health expenditure per capita (US$)
Maternal Death Surveillance and Response (MDSR) policy in place, including notification within 24 hrs
Civil Registration and Vital Statistics (CRVS) improvement plan in place
Data for all 3 impact indicators are available, based on data collected in the preceding 3 years,disaggregated by equity stratifiers
107Achievements and Prospects
Country Profiles
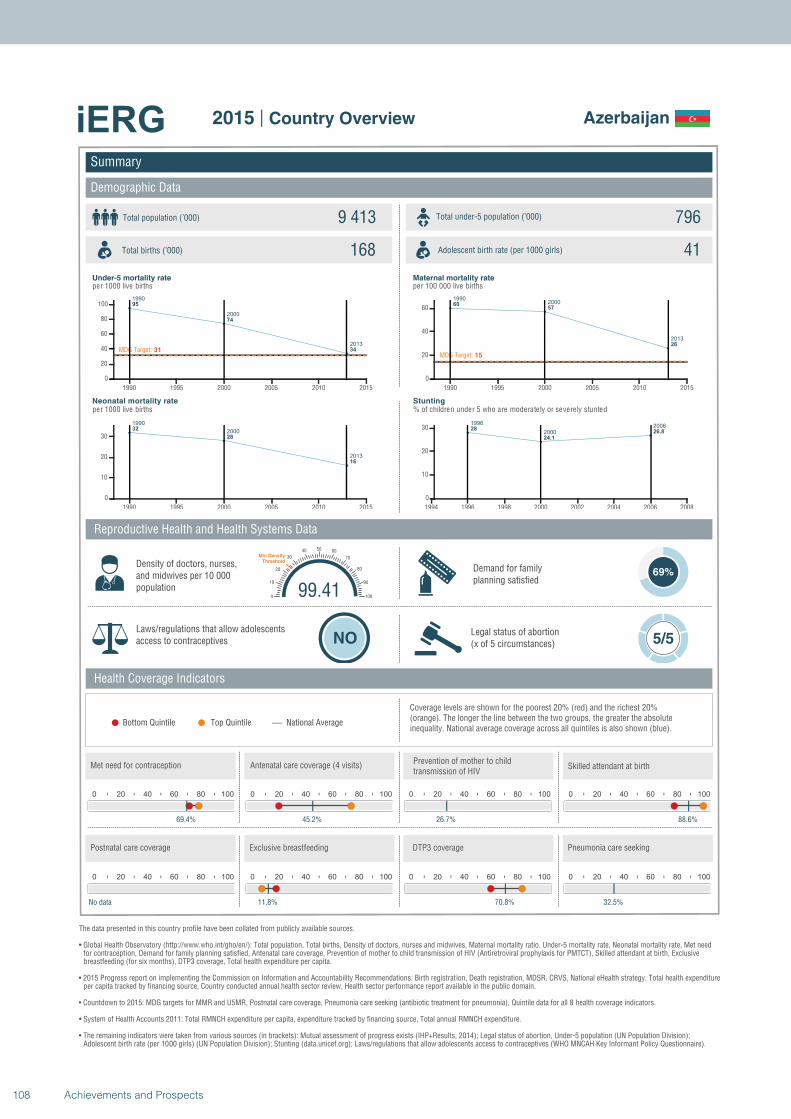
1990
2000
2013
95
74
34MDG Target: 31
1990 1995 2000 2005 2010 2015
0
20
40
60
80
100
1990
2000
2013
32
28
16
1990 1995 2000 2005 2010 2015
0
10
20
30
19902000
2013
6057
26
MDG Target: 15
1990 1995 2000 2005 2010 2015
0
20
40
60
1996
2000
200628
24.1
26.8
1994 1996 1998 2000 2002 2004 2006 2008
0
10
20
30
Summary
Demographic Data
Azerbaijan
Total population (’000) Total under-5 population (’000)9 413 796
168 41
Reproductive Health and Health Systems Data
Health Coverage Indicators
Demand for familyplanning satisfied
69%
Laws/regulations that allow adolescents access to contraceptives NO
Legal status of abortion(x of 5 circumstances) 5/5
National AverageBottom Quintile Top Quintile
per 1000 live births per 100 000 live births
per 1000 live births % of children under 5 who are moderately or severely stunted
0 20 40 60 80 100
69.4%
0 20 40 60 80 100
45.2%
0 20 40 60 80 100
26.7%
99.410
10
20
30
40 50 60
70
80
90
100
Min Density Threshold
0 20 40 60 80 100
88.6%
0 20 40 60 80 100
No data
0 20 40 60 80 100
11.8%
0 20 40 60 80 100
70.8%
0 20 40 60 80 100
32.5%
Total births (’000) Adolescent birth rate (per 1000 girls)
Coverage levels are shown for the poorest 20% (red) and the richest 20% (orange). The longer the line between the two groups, the greater the absolute inequality. National average coverage across all quintiles is also shown (blue).
Density of doctors, nurses, and midwives per 10 000 population
Postnatal care coverage Exclusive breastfeeding DTP3 coverage Pneumonia care seeking
Met need for contraception Antenatal care coverage (4 visits)Prevention of mother to child transmission of HIV
Skilled attendant at birth
Under-5 mortality rate Maternal mortality rate
Neonatal mortality rate Stunting
The data presented in this country profile have been collated from publicly available sources.
• Global Health Observatory (http://www.who.int/gho/en/): Total population, Total births, Density of doctors, nurses and midwives, Maternal mortality ratio, Under-5 mortality rate, Neonatal mortality rate, Met need for contraception, Demand for family planning satisfied, Antenatal care coverage, Prevention of mother to child transmission of HIV (Antiretroviral prophylaxis for PMTCT), Skilled attendant at birth, Exclusive breastfeeding (for six months), DTP3 coverage, Total health expenditure per capita.
• 2015 Progress report on implementing the Commission on Information and Accountability Recommendations: Birth registration, Death registration, MDSR, CRVS, National eHealth strategy, Total health expenditureper capita tracked by financing source, Country conducted annual health sector review, Health sector performance report available in the public domain.
• Countdown to 2015: MDG targets for MMR and U5MR, Postnatal care coverage, Pneumonia care seeking (antibiotic treatment for pneumonia), Quintile data for all 8 health coverage indicators.
• System of Health Accounts 2011: Total RMNCH expenditure per capita, expenditure tracked by financing source, Total annual RMNCH expenditure.
• The remaining indicators were taken from various sources (in brackets): Mutual assessment of progress exists (IHP+Results, 2014); Legal status of abortion, Under-5 population (UN Population Division);Adolescent birth rate (per 1000 girls) (UN Population Division); Stunting (data.unicef.org); Laws/regulations that allow adolescents access to contraceptives (WHO MNCAH Key Informant Policy Questionnaire).
2015 | Country Overview
108 Achievements and Prospects
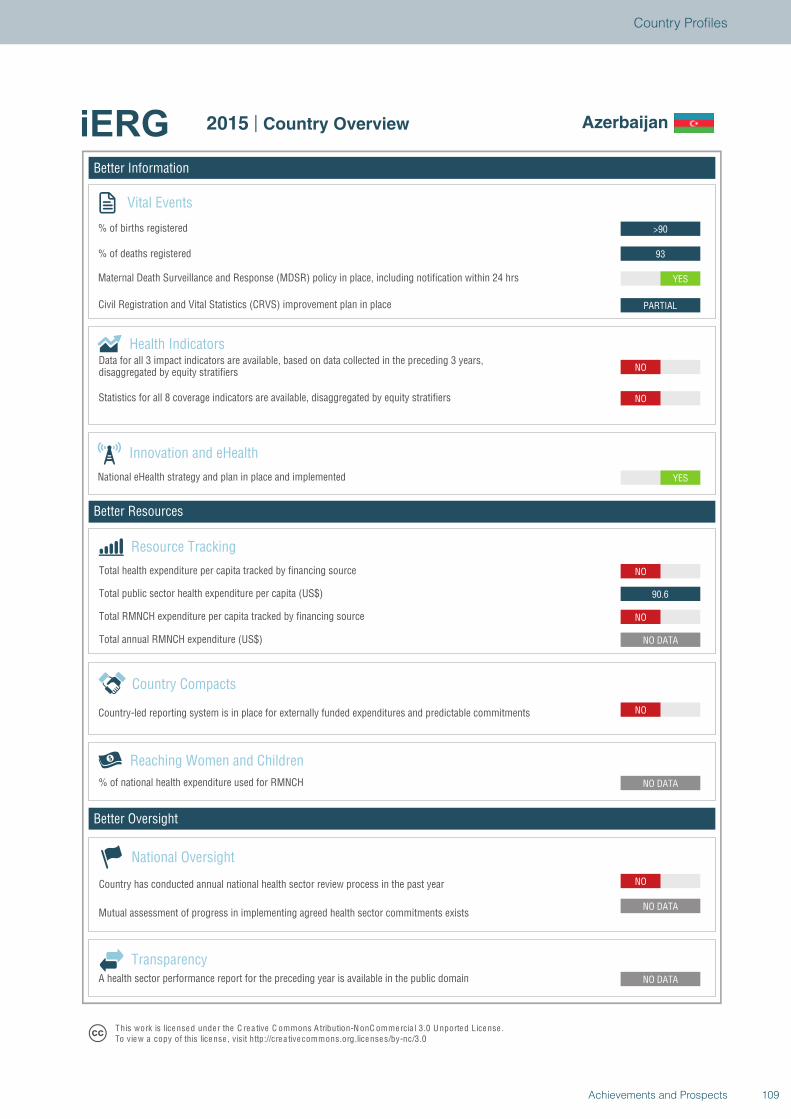
Better Information
Better Resources
Better Oversight
Azerbaijan
Vital Events
% of births registered
% of deaths registered
Innovation and eHealth
National eHealth strategy and plan in place and implemented
Health Indicators
Statistics for all 8 coverage indicators are available, disaggregated by equity stratifiers
Reaching Women and Children
Country Compacts
Country-led reporting system is in place for externally funded expenditures and predictable commitments
Resource Tracking
Total RMNCH expenditure per capita tracked by financing source
Total annual RMNCH expenditure (US$)
Total health expenditure per capita tracked by financing source
% of national health expenditure used for RMNCH
NO
NO DATA
NO DATA
NO DATA
NO
NO DATA
NO
90.6
NO
YES
NO
NO
PARTIAL
YES
93
>90
National Oversight
Mutual assessment of progress in implementing agreed health sector commitments exists
Country has conducted annual national health sector review process in the past year
TransparencyA health sector performance report for the preceding year is available in the public domain
T his work is lice nse d unde r the C re a tive C ommons A tribution-N onC ommercia l 3.0 U nported License .To view a copy of this license , visit http://cre a tive commons.org.licenses/by-nc/3.0
2015 | Country Overview Azerbaijan
Total public sector health expenditure per capita (US$)
Maternal Death Surveillance and Response (MDSR) policy in place, including notification within 24 hrs
Civil Registration and Vital Statistics (CRVS) improvement plan in place
Data for all 3 impact indicators are available, based on data collected in the preceding 3 years,disaggregated by equity stratifiers
109Achievements and Prospects
Country Profiles
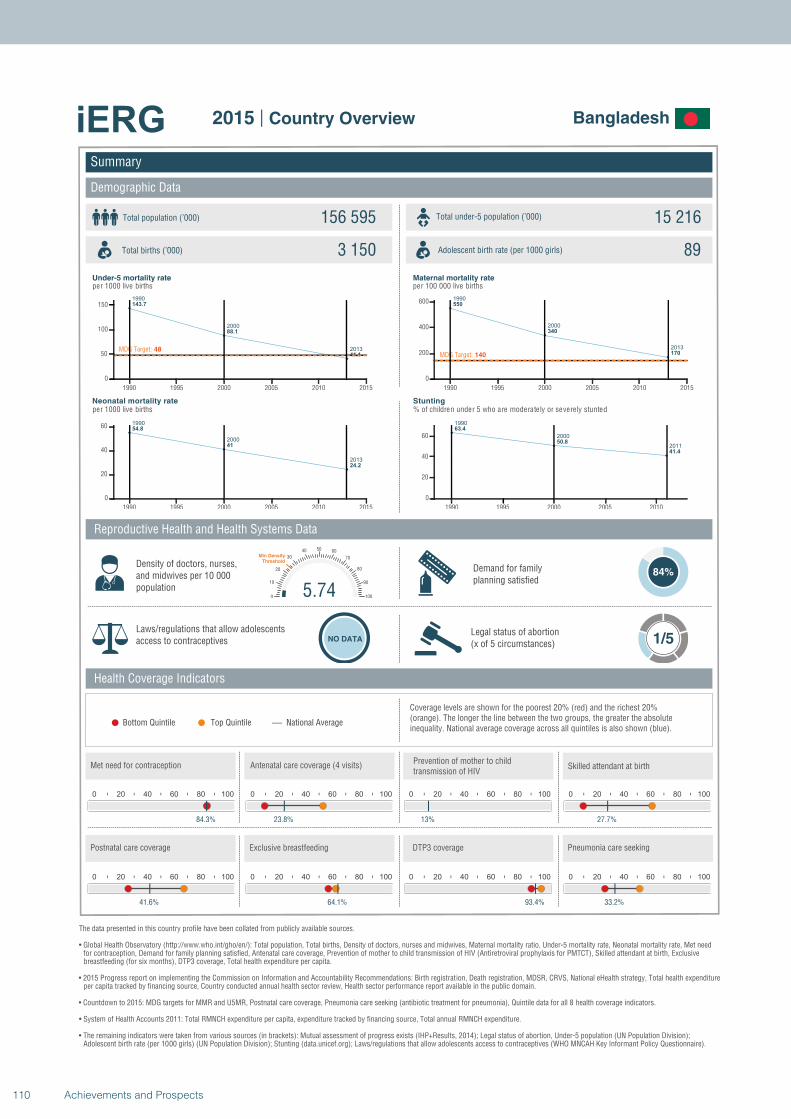
1990
2000
2013
143.7
88.1
41.1MDG Target: 48
1990 1995 2000 2005 2010 2015
0
50
100
150
1990
2000
2013
54.8
41
24.2
1990 1995 2000 2005 2010 2015
0
20
40
60
1990
2000
2013
550
340
170MDG Target: 140
1990 1995 2000 2005 2010 2015
0
200
400
600
1990
2000
2011
63.4
50.8
41.4
1990 1995 2000 2005 2010
0
20
40
60
Summary
Demographic Data
Bangladesh
Total population (’000) Total under-5 population (’000)156 595 15 216
3 150 89
Reproductive Health and Health Systems Data
Health Coverage Indicators
Demand for familyplanning satisfied
84%
Laws/regulations that allow adolescents access to contraceptives NO DATA
Legal status of abortion(x of 5 circumstances) 1/5
National AverageBottom Quintile Top Quintile
per 1000 live births per 100 000 live births
per 1000 live births % of children under 5 who are moderately or severely stunted
0 20 40 60 80 100
84.3%
0 20 40 60 80 100
23.8%
0 20 40 60 80 100
13%
5.740
10
20
30
40 50 60
70
80
90
100
Min Density Threshold
0 20 40 60 80 100
27.7%
0 20 40 60 80 100
41.6%
0 20 40 60 80 100
64.1%
0 20 40 60 80 100
93.4%
0 20 40 60 80 100
33.2%
Total births (’000) Adolescent birth rate (per 1000 girls)
Coverage levels are shown for the poorest 20% (red) and the richest 20% (orange). The longer the line between the two groups, the greater the absolute inequality. National average coverage across all quintiles is also shown (blue).
Density of doctors, nurses, and midwives per 10 000 population
Postnatal care coverage Exclusive breastfeeding DTP3 coverage Pneumonia care seeking
Met need for contraception Antenatal care coverage (4 visits)Prevention of mother to child transmission of HIV
Skilled attendant at birth
Under-5 mortality rate Maternal mortality rate
Neonatal mortality rate Stunting
The data presented in this country profile have been collated from publicly available sources.
• Global Health Observatory (http://www.who.int/gho/en/): Total population, Total births, Density of doctors, nurses and midwives, Maternal mortality ratio, Under-5 mortality rate, Neonatal mortality rate, Met need for contraception, Demand for family planning satisfied, Antenatal care coverage, Prevention of mother to child transmission of HIV (Antiretroviral prophylaxis for PMTCT), Skilled attendant at birth, Exclusive breastfeeding (for six months), DTP3 coverage, Total health expenditure per capita.
• 2015 Progress report on implementing the Commission on Information and Accountability Recommendations: Birth registration, Death registration, MDSR, CRVS, National eHealth strategy, Total health expenditureper capita tracked by financing source, Country conducted annual health sector review, Health sector performance report available in the public domain.
• Countdown to 2015: MDG targets for MMR and U5MR, Postnatal care coverage, Pneumonia care seeking (antibiotic treatment for pneumonia), Quintile data for all 8 health coverage indicators.
• System of Health Accounts 2011: Total RMNCH expenditure per capita, expenditure tracked by financing source, Total annual RMNCH expenditure.
• The remaining indicators were taken from various sources (in brackets): Mutual assessment of progress exists (IHP+Results, 2014); Legal status of abortion, Under-5 population (UN Population Division);Adolescent birth rate (per 1000 girls) (UN Population Division); Stunting (data.unicef.org); Laws/regulations that allow adolescents access to contraceptives (WHO MNCAH Key Informant Policy Questionnaire).
2015 | Country Overview
110 Achievements and Prospects
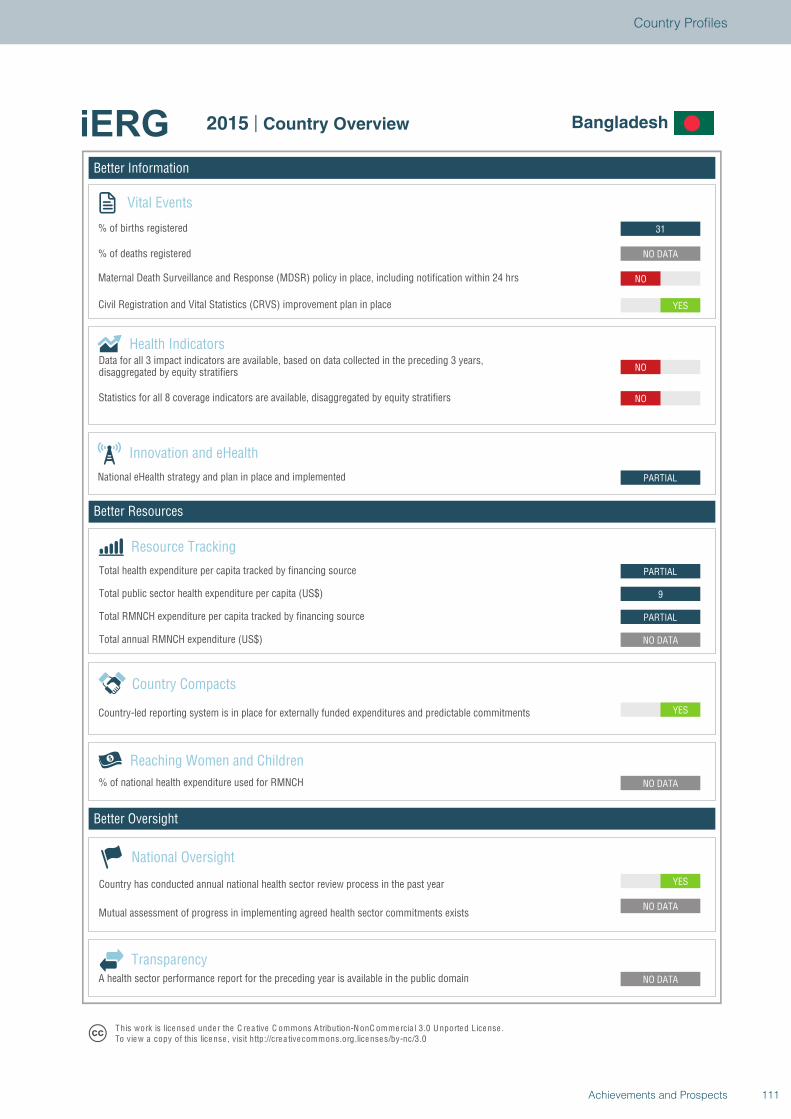
Better Information
Better Resources
Better Oversight
Bangladesh
Vital Events
% of births registered
% of deaths registered
Innovation and eHealth
National eHealth strategy and plan in place and implemented
Health Indicators
Statistics for all 8 coverage indicators are available, disaggregated by equity stratifiers
Reaching Women and Children
Country Compacts
Country-led reporting system is in place for externally funded expenditures and predictable commitments
Resource Tracking
Total RMNCH expenditure per capita tracked by financing source
Total annual RMNCH expenditure (US$)
Total health expenditure per capita tracked by financing source
% of national health expenditure used for RMNCH
YES
NO DATA
NO DATA
NO DATA
YES
NO DATA
PARTIAL
9
PARTIAL
PARTIAL
NO
NO
YES
NO
NO DATA
31
National Oversight
Mutual assessment of progress in implementing agreed health sector commitments exists
Country has conducted annual national health sector review process in the past year
TransparencyA health sector performance report for the preceding year is available in the public domain
T his work is lice nse d unde r the C re a tive C ommons A tribution-N onC ommercia l 3.0 U nported License .To view a copy of this license , visit http://cre a tive commons.org.licenses/by-nc/3.0
2015 | Country Overview Bangladesh
Total public sector health expenditure per capita (US$)
Maternal Death Surveillance and Response (MDSR) policy in place, including notification within 24 hrs
Civil Registration and Vital Statistics (CRVS) improvement plan in place
Data for all 3 impact indicators are available, based on data collected in the preceding 3 years,disaggregated by equity stratifiers
111Achievements and Prospects
Country Profiles
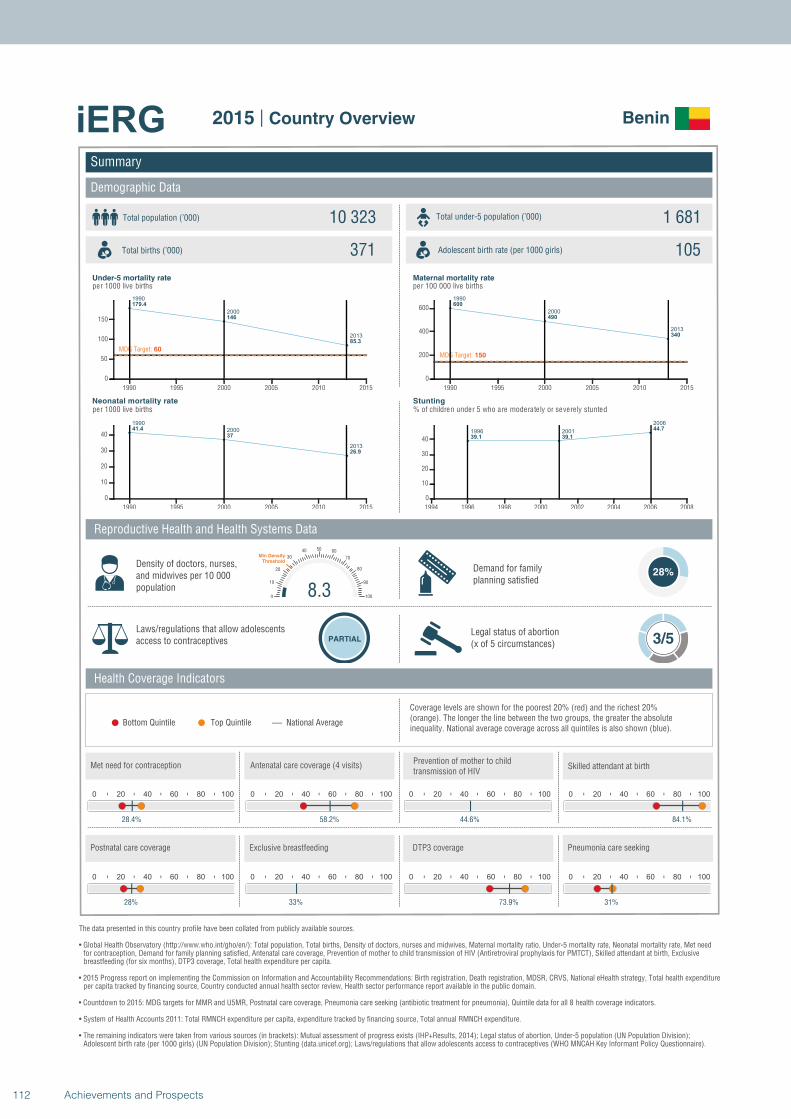
1990
2000
2013
179.4
146
85.3
MDG Target: 60
1990 1995 2000 2005 2010 2015
0
50
100
150
1990
2000
2013
41.4
37
26.9
1990 1995 2000 2005 2010 2015
0
10
20
30
40
1990
2000
2013
600
490
340
MDG Target: 150
1990 1995 2000 2005 2010 2015
0
200
400
600
1996 2001
2006
39.1 39.1
44.7
1994 1996 1998 2000 2002 2004 2006 2008
0
10
20
30
40
Summary
Demographic Data
Benin
Total population (’000) Total under-5 population (’000)10 323 1 681
371 105
Reproductive Health and Health Systems Data
Health Coverage Indicators
Demand for familyplanning satisfied
28%
Laws/regulations that allow adolescents access to contraceptives PARTIAL
Legal status of abortion(x of 5 circumstances) 3/5
National AverageBottom Quintile Top Quintile
per 1000 live births per 100 000 live births
per 1000 live births % of children under 5 who are moderately or severely stunted
0 20 40 60 80 100
28.4%
0 20 40 60 80 100
58.2%
0 20 40 60 80 100
44.6%
8.30
10
20
30
40 50 60
70
80
90
100
Min Density Threshold
0 20 40 60 80 100
84.1%
0 20 40 60 80 100
28%
0 20 40 60 80 100
33%
0 20 40 60 80 100
73.9%
0 20 40 60 80 100
31%
Total births (’000) Adolescent birth rate (per 1000 girls)
Coverage levels are shown for the poorest 20% (red) and the richest 20% (orange). The longer the line between the two groups, the greater the absolute inequality. National average coverage across all quintiles is also shown (blue).
Density of doctors, nurses, and midwives per 10 000 population
Postnatal care coverage Exclusive breastfeeding DTP3 coverage Pneumonia care seeking
Met need for contraception Antenatal care coverage (4 visits)Prevention of mother to child transmission of HIV
Skilled attendant at birth
Under-5 mortality rate Maternal mortality rate
Neonatal mortality rate Stunting
The data presented in this country profile have been collated from publicly available sources.
• Global Health Observatory (http://www.who.int/gho/en/): Total population, Total births, Density of doctors, nurses and midwives, Maternal mortality ratio, Under-5 mortality rate, Neonatal mortality rate, Met need for contraception, Demand for family planning satisfied, Antenatal care coverage, Prevention of mother to child transmission of HIV (Antiretroviral prophylaxis for PMTCT), Skilled attendant at birth, Exclusive breastfeeding (for six months), DTP3 coverage, Total health expenditure per capita.
• 2015 Progress report on implementing the Commission on Information and Accountability Recommendations: Birth registration, Death registration, MDSR, CRVS, National eHealth strategy, Total health expenditureper capita tracked by financing source, Country conducted annual health sector review, Health sector performance report available in the public domain.
• Countdown to 2015: MDG targets for MMR and U5MR, Postnatal care coverage, Pneumonia care seeking (antibiotic treatment for pneumonia), Quintile data for all 8 health coverage indicators.
• System of Health Accounts 2011: Total RMNCH expenditure per capita, expenditure tracked by financing source, Total annual RMNCH expenditure.
• The remaining indicators were taken from various sources (in brackets): Mutual assessment of progress exists (IHP+Results, 2014); Legal status of abortion, Under-5 population (UN Population Division);Adolescent birth rate (per 1000 girls) (UN Population Division); Stunting (data.unicef.org); Laws/regulations that allow adolescents access to contraceptives (WHO MNCAH Key Informant Policy Questionnaire).
2015 | Country Overview
112 Achievements and Prospects
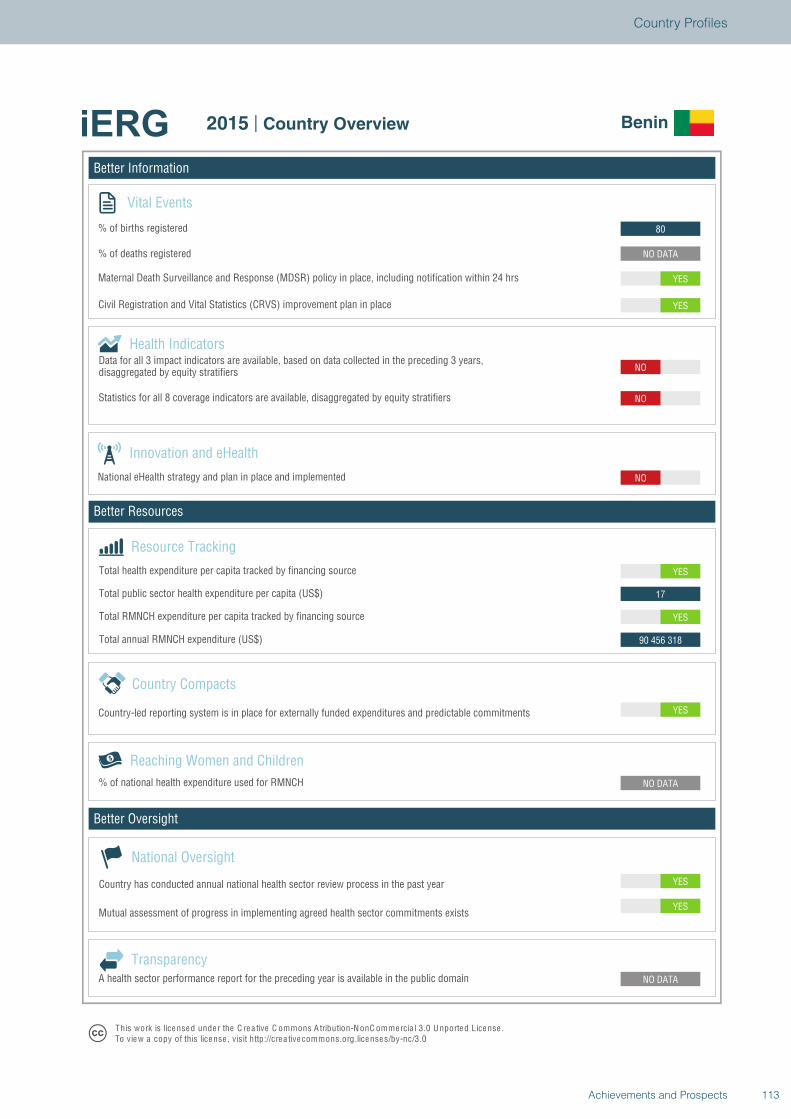
Better Information
Better Resources
Better Oversight
Benin
Vital Events
% of births registered
% of deaths registered
Innovation and eHealth
National eHealth strategy and plan in place and implemented
Health Indicators
Statistics for all 8 coverage indicators are available, disaggregated by equity stratifiers
Reaching Women and Children
Country Compacts
Country-led reporting system is in place for externally funded expenditures and predictable commitments
Resource Tracking
Total RMNCH expenditure per capita tracked by financing source
Total annual RMNCH expenditure (US$)
Total health expenditure per capita tracked by financing source
% of national health expenditure used for RMNCH
YES
YES
NO DATA
NO DATA
YES
90 456 318
YES
17
YES
NO
NO
NO
YES
YES
NO DATA
80
National Oversight
Mutual assessment of progress in implementing agreed health sector commitments exists
Country has conducted annual national health sector review process in the past year
TransparencyA health sector performance report for the preceding year is available in the public domain
T his work is lice nse d unde r the C re a tive C ommons A tribution-N onC ommercia l 3.0 U nported License .To view a copy of this license , visit http://cre a tive commons.org.licenses/by-nc/3.0
2015 | Country Overview Benin
Total public sector health expenditure per capita (US$)
Maternal Death Surveillance and Response (MDSR) policy in place, including notification within 24 hrs
Civil Registration and Vital Statistics (CRVS) improvement plan in place
Data for all 3 impact indicators are available, based on data collected in the preceding 3 years,disaggregated by equity stratifiers
113Achievements and Prospects
Country Profiles
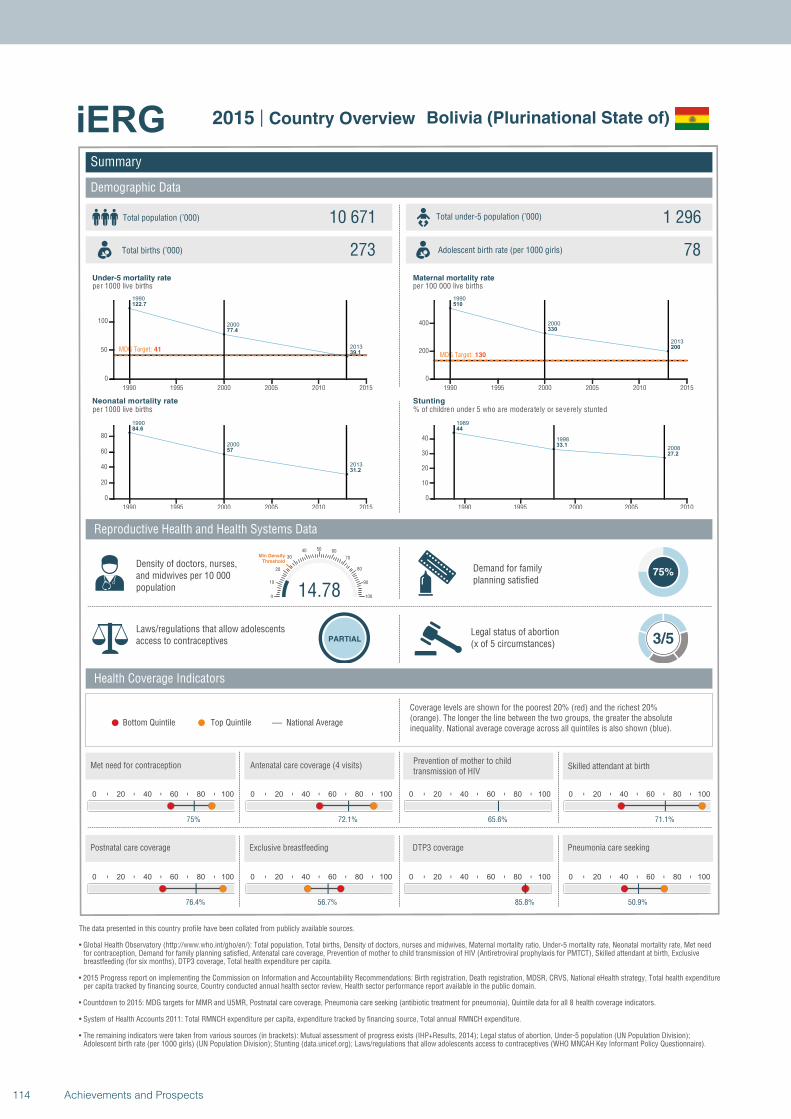
1990
2000
2013
122.7
77.4
39.1MDG Target: 41
1990 1995 2000 2005 2010 2015
0
50
100
1990
2000
2013
84.6
57
31.2
1990 1995 2000 2005 2010 2015
0
20
40
60
80
1990
2000
2013
510
330
200
MDG Target: 130
1990 1995 2000 2005 2010 2015
0
200
400
1989
1998
2008
44
33.1
27.2
1990 1995 2000 2005 2010
0
10
20
30
40
Summary
Demographic Data
Bolivia (Plurinational State of)
Total population (’000) Total under-5 population (’000)10 671 1 296
273 78
Reproductive Health and Health Systems Data
Health Coverage Indicators
Demand for familyplanning satisfied
75%
Laws/regulations that allow adolescents access to contraceptives PARTIAL
Legal status of abortion(x of 5 circumstances) 3/5
National AverageBottom Quintile Top Quintile
per 1000 live births per 100 000 live births
per 1000 live births % of children under 5 who are moderately or severely stunted
0 20 40 60 80 100
75%
0 20 40 60 80 100
72.1%
0 20 40 60 80 100
65.6%
14.780
10
20
30
40 50 60
70
80
90
100
Min Density Threshold
0 20 40 60 80 100
71.1%
0 20 40 60 80 100
76.4%
0 20 40 60 80 100
56.7%
0 20 40 60 80 100
85.8%
0 20 40 60 80 100
50.9%
Total births (’000) Adolescent birth rate (per 1000 girls)
Coverage levels are shown for the poorest 20% (red) and the richest 20% (orange). The longer the line between the two groups, the greater the absolute inequality. National average coverage across all quintiles is also shown (blue).
Density of doctors, nurses, and midwives per 10 000 population
Postnatal care coverage Exclusive breastfeeding DTP3 coverage Pneumonia care seeking
Met need for contraception Antenatal care coverage (4 visits)Prevention of mother to child transmission of HIV
Skilled attendant at birth
Under-5 mortality rate Maternal mortality rate
Neonatal mortality rate Stunting
The data presented in this country profile have been collated from publicly available sources.
• Global Health Observatory (http://www.who.int/gho/en/): Total population, Total births, Density of doctors, nurses and midwives, Maternal mortality ratio, Under-5 mortality rate, Neonatal mortality rate, Met need for contraception, Demand for family planning satisfied, Antenatal care coverage, Prevention of mother to child transmission of HIV (Antiretroviral prophylaxis for PMTCT), Skilled attendant at birth, Exclusive breastfeeding (for six months), DTP3 coverage, Total health expenditure per capita.
• 2015 Progress report on implementing the Commission on Information and Accountability Recommendations: Birth registration, Death registration, MDSR, CRVS, National eHealth strategy, Total health expenditureper capita tracked by financing source, Country conducted annual health sector review, Health sector performance report available in the public domain.
• Countdown to 2015: MDG targets for MMR and U5MR, Postnatal care coverage, Pneumonia care seeking (antibiotic treatment for pneumonia), Quintile data for all 8 health coverage indicators.
• System of Health Accounts 2011: Total RMNCH expenditure per capita, expenditure tracked by financing source, Total annual RMNCH expenditure.
• The remaining indicators were taken from various sources (in brackets): Mutual assessment of progress exists (IHP+Results, 2014); Legal status of abortion, Under-5 population (UN Population Division);Adolescent birth rate (per 1000 girls) (UN Population Division); Stunting (data.unicef.org); Laws/regulations that allow adolescents access to contraceptives (WHO MNCAH Key Informant Policy Questionnaire).
2015 | Country Overview
114 Achievements and Prospects
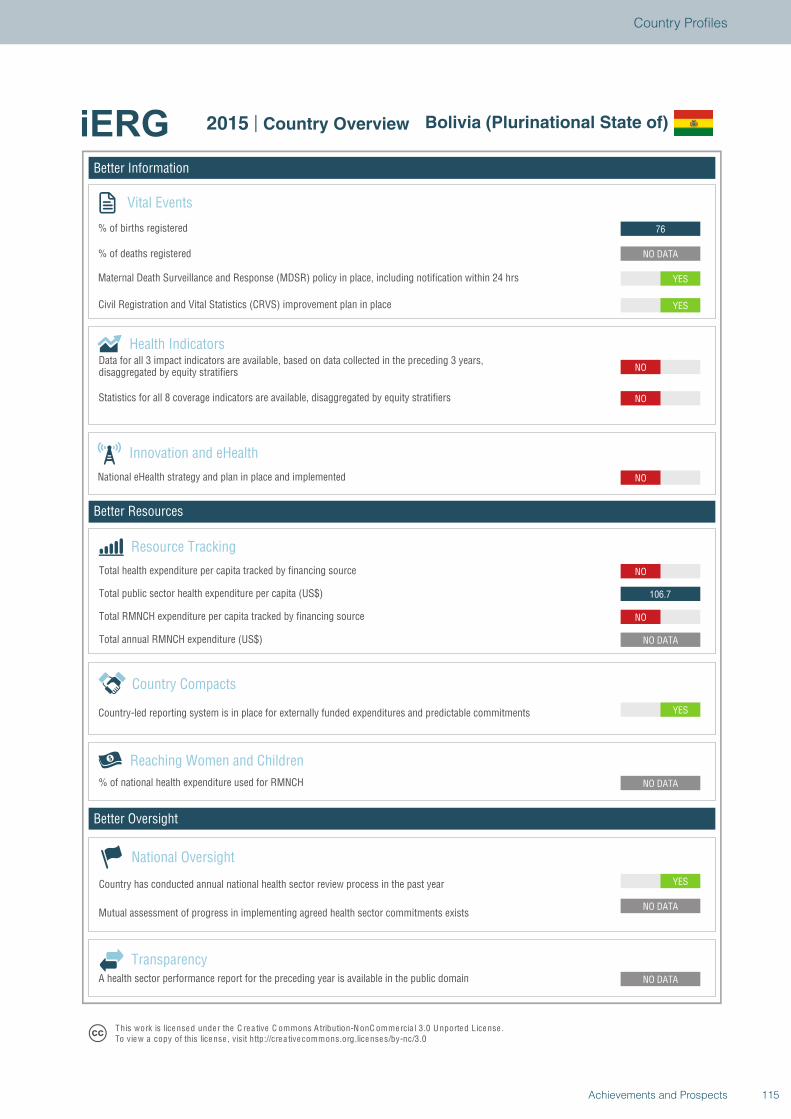
Better Information
Better Resources
Better Oversight
Bolivia (Plurinational State of)
Vital Events
% of births registered
% of deaths registered
Innovation and eHealth
National eHealth strategy and plan in place and implemented
Health Indicators
Statistics for all 8 coverage indicators are available, disaggregated by equity stratifiers
Reaching Women and Children
Country Compacts
Country-led reporting system is in place for externally funded expenditures and predictable commitments
Resource Tracking
Total RMNCH expenditure per capita tracked by financing source
Total annual RMNCH expenditure (US$)
Total health expenditure per capita tracked by financing source
% of national health expenditure used for RMNCH
YES
NO DATA
NO DATA
NO DATA
YES
NO DATA
NO
106.7
NO
NO
NO
NO
YES
YES
NO DATA
76
National Oversight
Mutual assessment of progress in implementing agreed health sector commitments exists
Country has conducted annual national health sector review process in the past year
TransparencyA health sector performance report for the preceding year is available in the public domain
T his work is lice nse d unde r the C re a tive C ommons A tribution-N onC ommercia l 3.0 U nported License .To view a copy of this license , visit http://cre a tive commons.org.licenses/by-nc/3.0
2015 | Country Overview Bolivia (Plurinational State of)
Total public sector health expenditure per capita (US$)
Maternal Death Surveillance and Response (MDSR) policy in place, including notification within 24 hrs
Civil Registration and Vital Statistics (CRVS) improvement plan in place
Data for all 3 impact indicators are available, based on data collected in the preceding 3 years,disaggregated by equity stratifiers
115Achievements and Prospects
Country Profiles
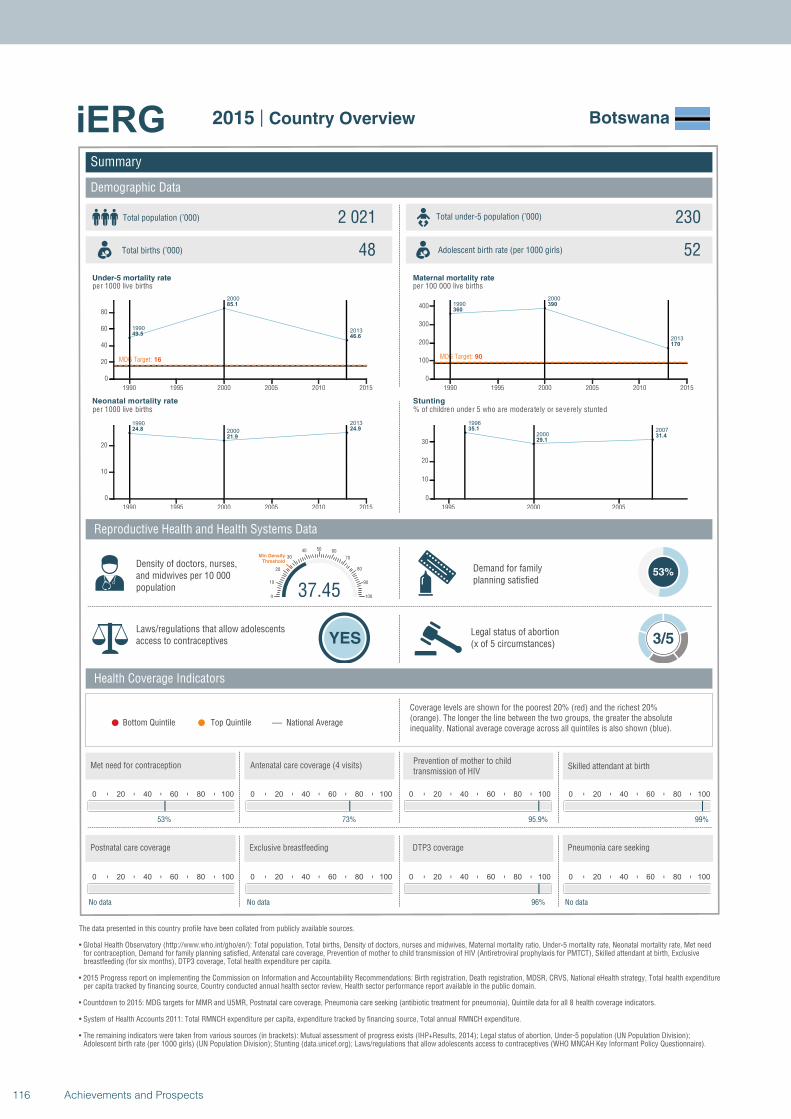
1990
2000
201349.5
85.1
46.6
MDG Target: 16
1990 1995 2000 2005 2010 2015
0
20
40
60
80
1990
2000
2013
24.8
21.9
24.9
1990 1995 2000 2005 2010 2015
0
10
20
1990
2000
2013
360
390
170
MDG Target: 90
1990 1995 2000 2005 2010 2015
0
100
200
300
400
1996
2000200735.1
29.131.4
1995 2000 2005
0
10
20
30
Summary
Demographic Data
Botswana
Total population (’000) Total under-5 population (’000)2 021 230
48 52
Reproductive Health and Health Systems Data
Health Coverage Indicators
Demand for familyplanning satisfied
53%
Laws/regulations that allow adolescents access to contraceptives YES
Legal status of abortion(x of 5 circumstances) 3/5
National AverageBottom Quintile Top Quintile
per 1000 live births per 100 000 live births
per 1000 live births % of children under 5 who are moderately or severely stunted
0 20 40 60 80 100
53%
0 20 40 60 80 100
73%
0 20 40 60 80 100
95.9%
37.450
10
20
30
40 50 60
70
80
90
100
Min Density Threshold
0 20 40 60 80 100
99%
0 20 40 60 80 100
No data
0 20 40 60 80 100
No data
0 20 40 60 80 100
96%
0 20 40 60 80 100
No data
Total births (’000) Adolescent birth rate (per 1000 girls)
Coverage levels are shown for the poorest 20% (red) and the richest 20% (orange). The longer the line between the two groups, the greater the absolute inequality. National average coverage across all quintiles is also shown (blue).
Density of doctors, nurses, and midwives per 10 000 population
Postnatal care coverage Exclusive breastfeeding DTP3 coverage Pneumonia care seeking
Met need for contraception Antenatal care coverage (4 visits)Prevention of mother to child transmission of HIV
Skilled attendant at birth
Under-5 mortality rate Maternal mortality rate
Neonatal mortality rate Stunting
The data presented in this country profile have been collated from publicly available sources.
• Global Health Observatory (http://www.who.int/gho/en/): Total population, Total births, Density of doctors, nurses and midwives, Maternal mortality ratio, Under-5 mortality rate, Neonatal mortality rate, Met need for contraception, Demand for family planning satisfied, Antenatal care coverage, Prevention of mother to child transmission of HIV (Antiretroviral prophylaxis for PMTCT), Skilled attendant at birth, Exclusive breastfeeding (for six months), DTP3 coverage, Total health expenditure per capita.
• 2015 Progress report on implementing the Commission on Information and Accountability Recommendations: Birth registration, Death registration, MDSR, CRVS, National eHealth strategy, Total health expenditureper capita tracked by financing source, Country conducted annual health sector review, Health sector performance report available in the public domain.
• Countdown to 2015: MDG targets for MMR and U5MR, Postnatal care coverage, Pneumonia care seeking (antibiotic treatment for pneumonia), Quintile data for all 8 health coverage indicators.
• System of Health Accounts 2011: Total RMNCH expenditure per capita, expenditure tracked by financing source, Total annual RMNCH expenditure.
• The remaining indicators were taken from various sources (in brackets): Mutual assessment of progress exists (IHP+Results, 2014); Legal status of abortion, Under-5 population (UN Population Division);Adolescent birth rate (per 1000 girls) (UN Population Division); Stunting (data.unicef.org); Laws/regulations that allow adolescents access to contraceptives (WHO MNCAH Key Informant Policy Questionnaire).
2015 | Country Overview
116 Achievements and Prospects
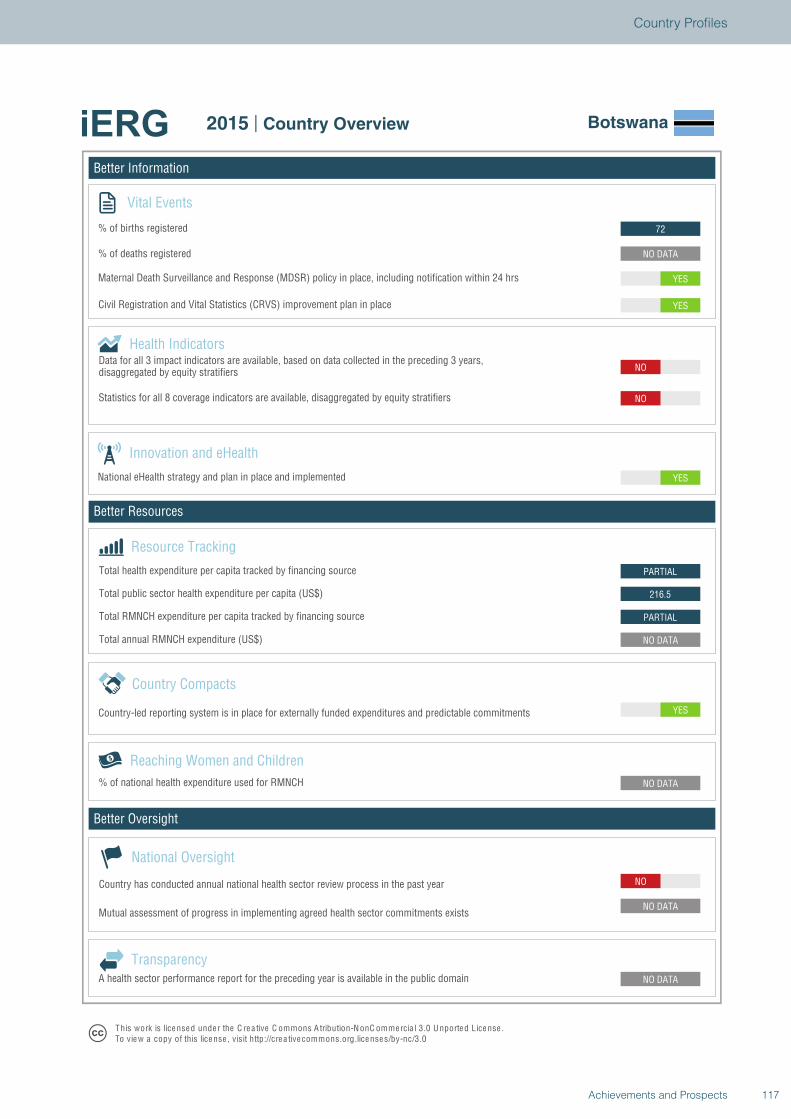
Better Information
Better Resources
Better Oversight
Botswana
Vital Events
% of births registered
% of deaths registered
Innovation and eHealth
National eHealth strategy and plan in place and implemented
Health Indicators
Statistics for all 8 coverage indicators are available, disaggregated by equity stratifiers
Reaching Women and Children
Country Compacts
Country-led reporting system is in place for externally funded expenditures and predictable commitments
Resource Tracking
Total RMNCH expenditure per capita tracked by financing source
Total annual RMNCH expenditure (US$)
Total health expenditure per capita tracked by financing source
% of national health expenditure used for RMNCH
NO
NO DATA
NO DATA
NO DATA
YES
NO DATA
PARTIAL
216.5
PARTIAL
YES
NO
NO
YES
YES
NO DATA
72
National Oversight
Mutual assessment of progress in implementing agreed health sector commitments exists
Country has conducted annual national health sector review process in the past year
TransparencyA health sector performance report for the preceding year is available in the public domain
T his work is lice nse d unde r the C re a tive C ommons A tribution-N onC ommercia l 3.0 U nported License .To view a copy of this license , visit http://cre a tive commons.org.licenses/by-nc/3.0
2015 | Country Overview Botswana
Total public sector health expenditure per capita (US$)
Maternal Death Surveillance and Response (MDSR) policy in place, including notification within 24 hrs
Civil Registration and Vital Statistics (CRVS) improvement plan in place
Data for all 3 impact indicators are available, based on data collected in the preceding 3 years,disaggregated by equity stratifiers
117Achievements and Prospects
Country Profiles
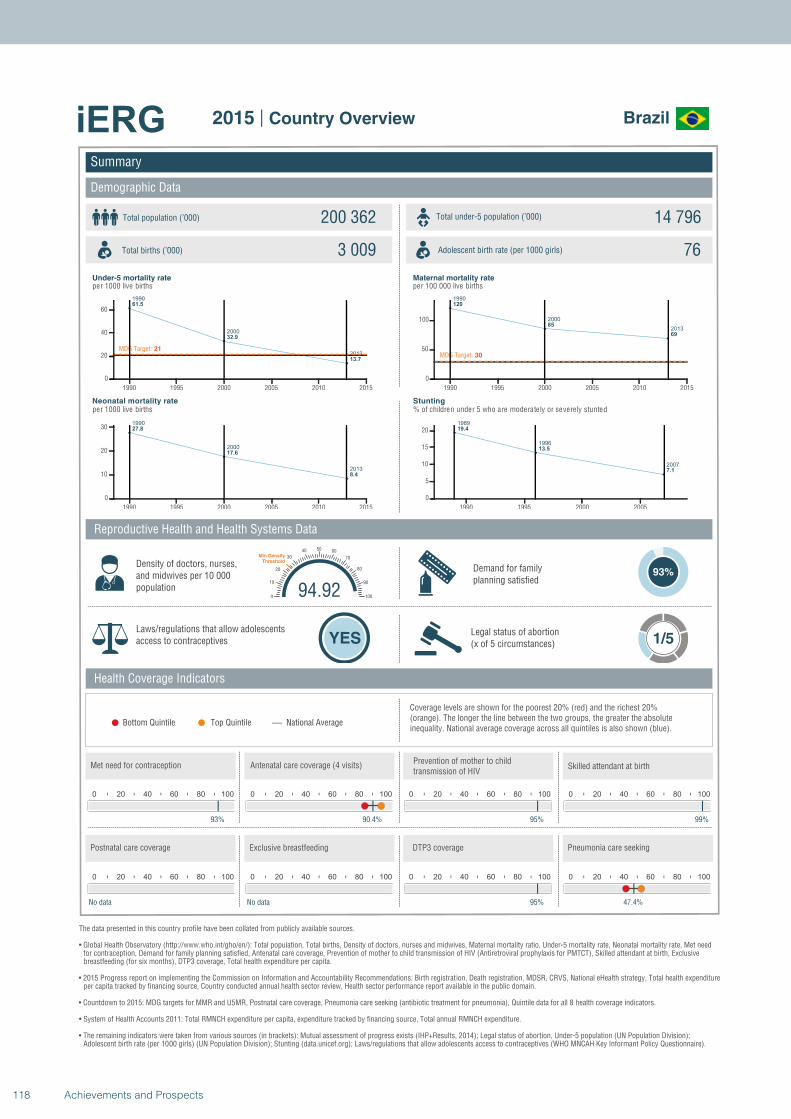
1990
2000
2013
61.5
32.9
13.7
MDG Target: 21
1990 1995 2000 2005 2010 2015
0
20
40
60
1990
2000
2013
27.8
17.6
8.4
1990 1995 2000 2005 2010 2015
0
10
20
30
1990
2000
2013
120
85
69
MDG Target: 30
1990 1995 2000 2005 2010 2015
0
50
100
1989
1996
2007
19.4
13.5
7.1
1990 1995 2000 2005
0
5
10
15
20
Summary
Demographic Data
Brazil
Total population (’000) Total under-5 population (’000)200 362 14 796
3 009 76
Reproductive Health and Health Systems Data
Health Coverage Indicators
Demand for familyplanning satisfied
93%
Laws/regulations that allow adolescents access to contraceptives YES
Legal status of abortion(x of 5 circumstances) 1/5
National AverageBottom Quintile Top Quintile
per 1000 live births per 100 000 live births
per 1000 live births % of children under 5 who are moderately or severely stunted
0 20 40 60 80 100
93%
0 20 40 60 80 100
90.4%
0 20 40 60 80 100
95%
94.920
10
20
30
40 50 60
70
80
90
100
Min Density Threshold
0 20 40 60 80 100
99%
0 20 40 60 80 100
No data
0 20 40 60 80 100
No data
0 20 40 60 80 100
95%
0 20 40 60 80 100
47.4%
Total births (’000) Adolescent birth rate (per 1000 girls)
Coverage levels are shown for the poorest 20% (red) and the richest 20% (orange). The longer the line between the two groups, the greater the absolute inequality. National average coverage across all quintiles is also shown (blue).
Density of doctors, nurses, and midwives per 10 000 population
Postnatal care coverage Exclusive breastfeeding DTP3 coverage Pneumonia care seeking
Met need for contraception Antenatal care coverage (4 visits)Prevention of mother to child transmission of HIV
Skilled attendant at birth
Under-5 mortality rate Maternal mortality rate
Neonatal mortality rate Stunting
The data presented in this country profile have been collated from publicly available sources.
• Global Health Observatory (http://www.who.int/gho/en/): Total population, Total births, Density of doctors, nurses and midwives, Maternal mortality ratio, Under-5 mortality rate, Neonatal mortality rate, Met need for contraception, Demand for family planning satisfied, Antenatal care coverage, Prevention of mother to child transmission of HIV (Antiretroviral prophylaxis for PMTCT), Skilled attendant at birth, Exclusive breastfeeding (for six months), DTP3 coverage, Total health expenditure per capita.
• 2015 Progress report on implementing the Commission on Information and Accountability Recommendations: Birth registration, Death registration, MDSR, CRVS, National eHealth strategy, Total health expenditureper capita tracked by financing source, Country conducted annual health sector review, Health sector performance report available in the public domain.
• Countdown to 2015: MDG targets for MMR and U5MR, Postnatal care coverage, Pneumonia care seeking (antibiotic treatment for pneumonia), Quintile data for all 8 health coverage indicators.
• System of Health Accounts 2011: Total RMNCH expenditure per capita, expenditure tracked by financing source, Total annual RMNCH expenditure.
• The remaining indicators were taken from various sources (in brackets): Mutual assessment of progress exists (IHP+Results, 2014); Legal status of abortion, Under-5 population (UN Population Division);Adolescent birth rate (per 1000 girls) (UN Population Division); Stunting (data.unicef.org); Laws/regulations that allow adolescents access to contraceptives (WHO MNCAH Key Informant Policy Questionnaire).
2015 | Country Overview
118 Achievements and Prospects
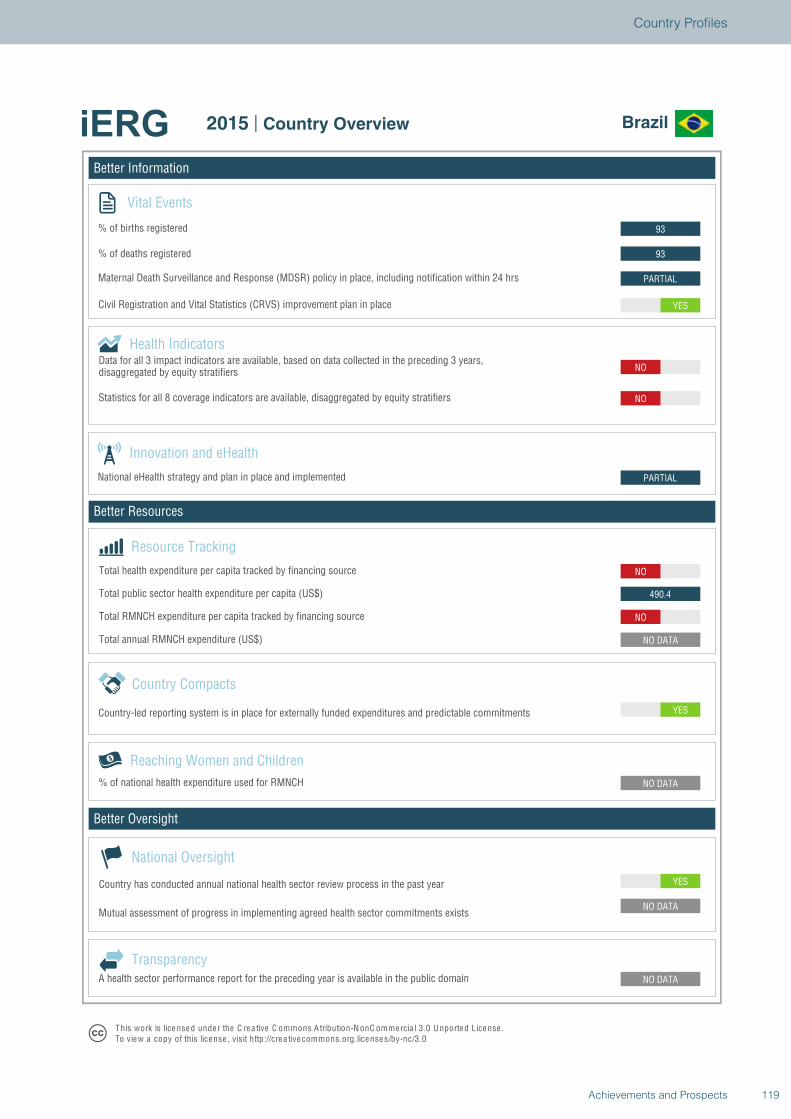
Better Information
Better Resources
Better Oversight
Brazil
Vital Events
% of births registered
% of deaths registered
Innovation and eHealth
National eHealth strategy and plan in place and implemented
Health Indicators
Statistics for all 8 coverage indicators are available, disaggregated by equity stratifiers
Reaching Women and Children
Country Compacts
Country-led reporting system is in place for externally funded expenditures and predictable commitments
Resource Tracking
Total RMNCH expenditure per capita tracked by financing source
Total annual RMNCH expenditure (US$)
Total health expenditure per capita tracked by financing source
% of national health expenditure used for RMNCH
YES
NO DATA
NO DATA
NO DATA
YES
NO DATA
NO
490.4
NO
PARTIAL
NO
NO
YES
PARTIAL
93
93
National Oversight
Mutual assessment of progress in implementing agreed health sector commitments exists
Country has conducted annual national health sector review process in the past year
TransparencyA health sector performance report for the preceding year is available in the public domain
T his work is lice nse d unde r the C re a tive C ommons A tribution-N onC ommercia l 3.0 U nported License .To view a copy of this license , visit http://cre a tive commons.org.licenses/by-nc/3.0
2015 | Country Overview Brazil
Total public sector health expenditure per capita (US$)
Maternal Death Surveillance and Response (MDSR) policy in place, including notification within 24 hrs
Civil Registration and Vital Statistics (CRVS) improvement plan in place
Data for all 3 impact indicators are available, based on data collected in the preceding 3 years,disaggregated by equity stratifiers
119Achievements and Prospects
Country Profiles
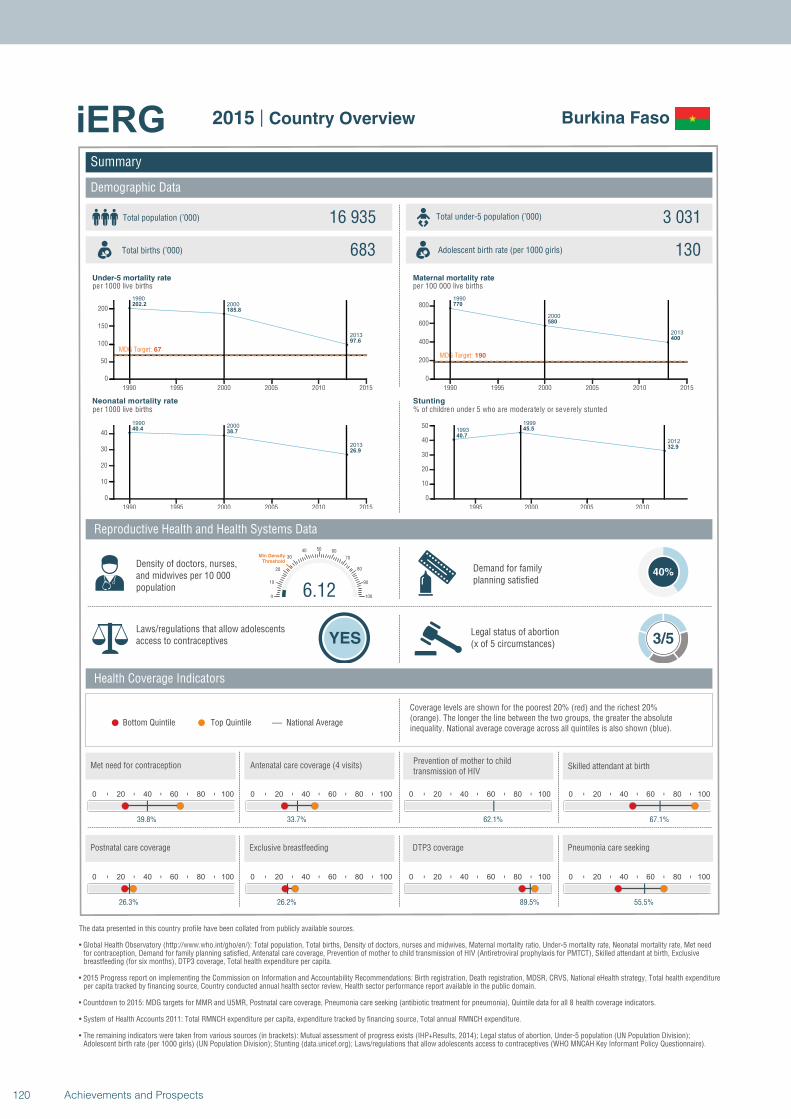
1990
2000
2013
202.2
185.8
97.6
MDG Target: 67
1990 1995 2000 2005 2010 2015
0
50
100
150
200
19902000
2013
40.438.7
26.9
1990 1995 2000 2005 2010 2015
0
10
20
30
40
1990
2000
2013
770
580
400
MDG Target: 190
1990 1995 2000 2005 2010 2015
0
200
400
600
800
1993
1999
2012
40.7
45.5
32.9
1995 2000 2005 2010
0
10
20
30
40
50
Summary
Demographic Data
Burkina Faso
Total population (’000) Total under-5 population (’000)16 935 3 031
683 130
Reproductive Health and Health Systems Data
Health Coverage Indicators
Demand for familyplanning satisfied
40%
Laws/regulations that allow adolescents access to contraceptives YES
Legal status of abortion(x of 5 circumstances) 3/5
National AverageBottom Quintile Top Quintile
per 1000 live births per 100 000 live births
per 1000 live births % of children under 5 who are moderately or severely stunted
0 20 40 60 80 100
39.8%
0 20 40 60 80 100
33.7%
0 20 40 60 80 100
62.1%
6.120
10
20
30
40 50 60
70
80
90
100
Min Density Threshold
0 20 40 60 80 100
67.1%
0 20 40 60 80 100
26.3%
0 20 40 60 80 100
26.2%
0 20 40 60 80 100
89.5%
0 20 40 60 80 100
55.5%
Total births (’000) Adolescent birth rate (per 1000 girls)
Coverage levels are shown for the poorest 20% (red) and the richest 20% (orange). The longer the line between the two groups, the greater the absolute inequality. National average coverage across all quintiles is also shown (blue).
Density of doctors, nurses, and midwives per 10 000 population
Postnatal care coverage Exclusive breastfeeding DTP3 coverage Pneumonia care seeking
Met need for contraception Antenatal care coverage (4 visits)Prevention of mother to child transmission of HIV
Skilled attendant at birth
Under-5 mortality rate Maternal mortality rate
Neonatal mortality rate Stunting
The data presented in this country profile have been collated from publicly available sources.
• Global Health Observatory (http://www.who.int/gho/en/): Total population, Total births, Density of doctors, nurses and midwives, Maternal mortality ratio, Under-5 mortality rate, Neonatal mortality rate, Met need for contraception, Demand for family planning satisfied, Antenatal care coverage, Prevention of mother to child transmission of HIV (Antiretroviral prophylaxis for PMTCT), Skilled attendant at birth, Exclusive breastfeeding (for six months), DTP3 coverage, Total health expenditure per capita.
• 2015 Progress report on implementing the Commission on Information and Accountability Recommendations: Birth registration, Death registration, MDSR, CRVS, National eHealth strategy, Total health expenditureper capita tracked by financing source, Country conducted annual health sector review, Health sector performance report available in the public domain.
• Countdown to 2015: MDG targets for MMR and U5MR, Postnatal care coverage, Pneumonia care seeking (antibiotic treatment for pneumonia), Quintile data for all 8 health coverage indicators.
• System of Health Accounts 2011: Total RMNCH expenditure per capita, expenditure tracked by financing source, Total annual RMNCH expenditure.
• The remaining indicators were taken from various sources (in brackets): Mutual assessment of progress exists (IHP+Results, 2014); Legal status of abortion, Under-5 population (UN Population Division);Adolescent birth rate (per 1000 girls) (UN Population Division); Stunting (data.unicef.org); Laws/regulations that allow adolescents access to contraceptives (WHO MNCAH Key Informant Policy Questionnaire).
2015 | Country Overview
120 Achievements and Prospects
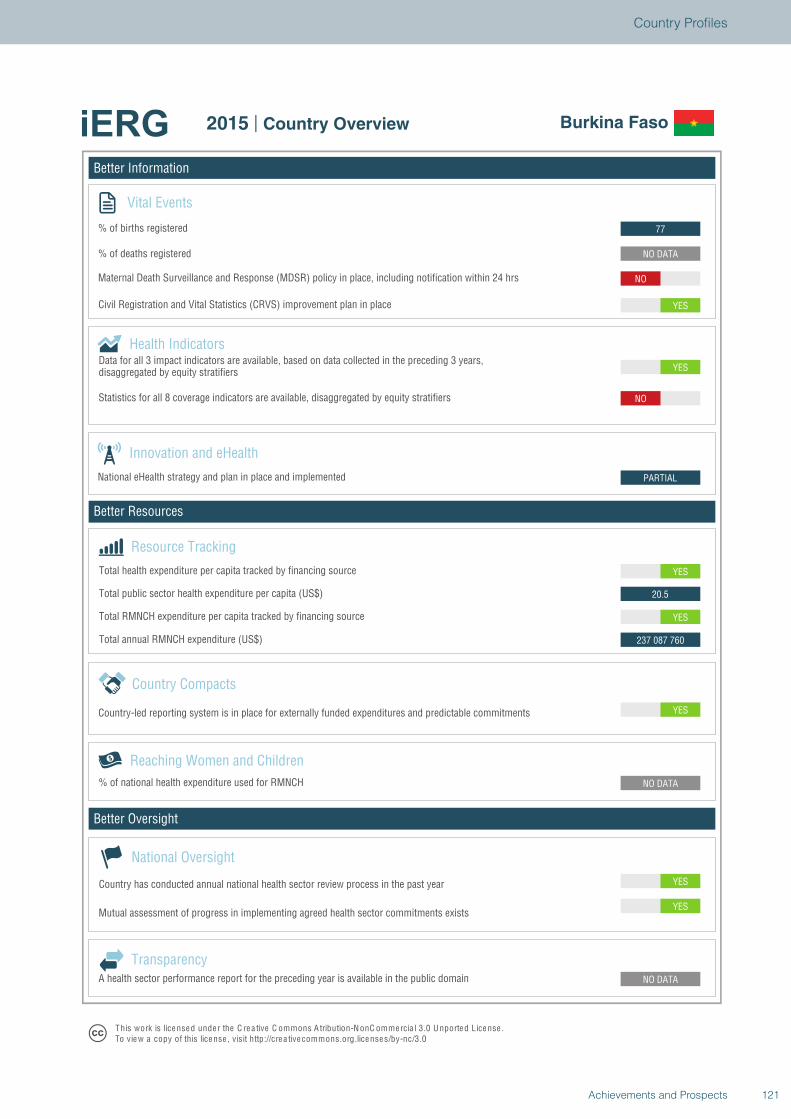
Better Information
Better Resources
Better Oversight
Burkina Faso
Vital Events
% of births registered
% of deaths registered
Innovation and eHealth
National eHealth strategy and plan in place and implemented
Health Indicators
Statistics for all 8 coverage indicators are available, disaggregated by equity stratifiers
Reaching Women and Children
Country Compacts
Country-led reporting system is in place for externally funded expenditures and predictable commitments
Resource Tracking
Total RMNCH expenditure per capita tracked by financing source
Total annual RMNCH expenditure (US$)
Total health expenditure per capita tracked by financing source
% of national health expenditure used for RMNCH
YES
YES
NO DATA
NO DATA
YES
237 087 760
YES
20.5
YES
PARTIAL
YES
NO
YES
NO
NO DATA
77
National Oversight
Mutual assessment of progress in implementing agreed health sector commitments exists
Country has conducted annual national health sector review process in the past year
TransparencyA health sector performance report for the preceding year is available in the public domain
T his work is lice nse d unde r the C re a tive C ommons A tribution-N onC ommercia l 3.0 U nported License .To view a copy of this license , visit http://cre a tive commons.org.licenses/by-nc/3.0
2015 | Country Overview Burkina Faso
Total public sector health expenditure per capita (US$)
Maternal Death Surveillance and Response (MDSR) policy in place, including notification within 24 hrs
Civil Registration and Vital Statistics (CRVS) improvement plan in place
Data for all 3 impact indicators are available, based on data collected in the preceding 3 years,disaggregated by equity stratifiers
121Achievements and Prospects
Country Profiles
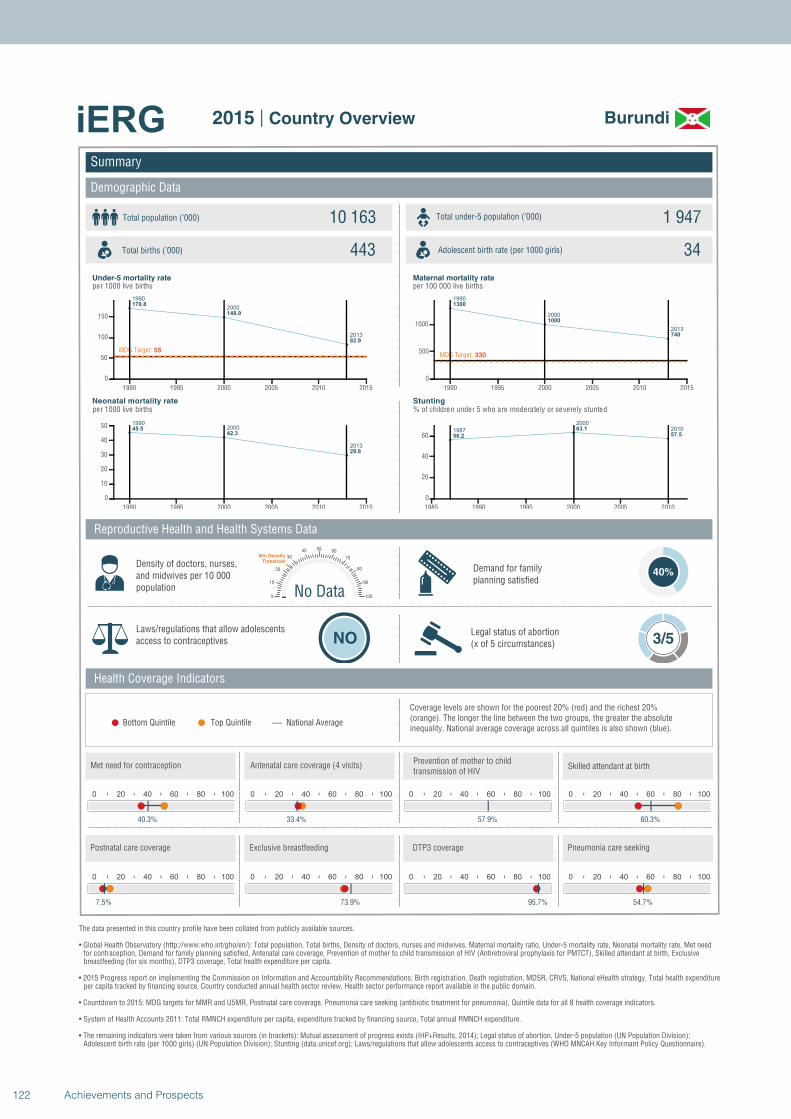
1990
2000
2013
170.8
148.9
82.9
MDG Target: 55
1990 1995 2000 2005 2010 2015
0
50
100
150
19902000
2013
45.542.3
29.8
1990 1995 2000 2005 2010 2015
0
10
20
30
40
50
1990
2000
2013
1300
1000
740
MDG Target: 330
1990 1995 2000 2005 2010 2015
0
500
1000
1987
2000
2010
56.2
63.1
57.5
1985 1990 1995 2000 2005 2010
0
20
40
60
Summary
Demographic Data
Burundi
Total population (’000) Total under-5 population (’000)10 163 1 947
443 34
Reproductive Health and Health Systems Data
Health Coverage Indicators
Demand for familyplanning satisfied
40%
Laws/regulations that allow adolescents access to contraceptives NO
Legal status of abortion(x of 5 circumstances) 3/5
National AverageBottom Quintile Top Quintile
per 1000 live births per 100 000 live births
per 1000 live births % of children under 5 who are moderately or severely stunted
0 20 40 60 80 100
40.3%
0 20 40 60 80 100
33.4%
0 20 40 60 80 100
57.9%
No Data0
10
20
30
40 50 60
70
80
90
100
Min Density Threshold
0 20 40 60 80 100
60.3%
0 20 40 60 80 100
7.5%
0 20 40 60 80 100
73.9%
0 20 40 60 80 100
95.7%
0 20 40 60 80 100
54.7%
Total births (’000) Adolescent birth rate (per 1000 girls)
Coverage levels are shown for the poorest 20% (red) and the richest 20% (orange). The longer the line between the two groups, the greater the absolute inequality. National average coverage across all quintiles is also shown (blue).
Density of doctors, nurses, and midwives per 10 000 population
Postnatal care coverage Exclusive breastfeeding DTP3 coverage Pneumonia care seeking
Met need for contraception Antenatal care coverage (4 visits)Prevention of mother to child transmission of HIV
Skilled attendant at birth
Under-5 mortality rate Maternal mortality rate
Neonatal mortality rate Stunting
The data presented in this country profile have been collated from publicly available sources.
• Global Health Observatory (http://www.who.int/gho/en/): Total population, Total births, Density of doctors, nurses and midwives, Maternal mortality ratio, Under-5 mortality rate, Neonatal mortality rate, Met need for contraception, Demand for family planning satisfied, Antenatal care coverage, Prevention of mother to child transmission of HIV (Antiretroviral prophylaxis for PMTCT), Skilled attendant at birth, Exclusive breastfeeding (for six months), DTP3 coverage, Total health expenditure per capita.
• 2015 Progress report on implementing the Commission on Information and Accountability Recommendations: Birth registration, Death registration, MDSR, CRVS, National eHealth strategy, Total health expenditureper capita tracked by financing source, Country conducted annual health sector review, Health sector performance report available in the public domain.
• Countdown to 2015: MDG targets for MMR and U5MR, Postnatal care coverage, Pneumonia care seeking (antibiotic treatment for pneumonia), Quintile data for all 8 health coverage indicators.
• System of Health Accounts 2011: Total RMNCH expenditure per capita, expenditure tracked by financing source, Total annual RMNCH expenditure.
• The remaining indicators were taken from various sources (in brackets): Mutual assessment of progress exists (IHP+Results, 2014); Legal status of abortion, Under-5 population (UN Population Division);Adolescent birth rate (per 1000 girls) (UN Population Division); Stunting (data.unicef.org); Laws/regulations that allow adolescents access to contraceptives (WHO MNCAH Key Informant Policy Questionnaire).
2015 | Country Overview
122 Achievements and Prospects
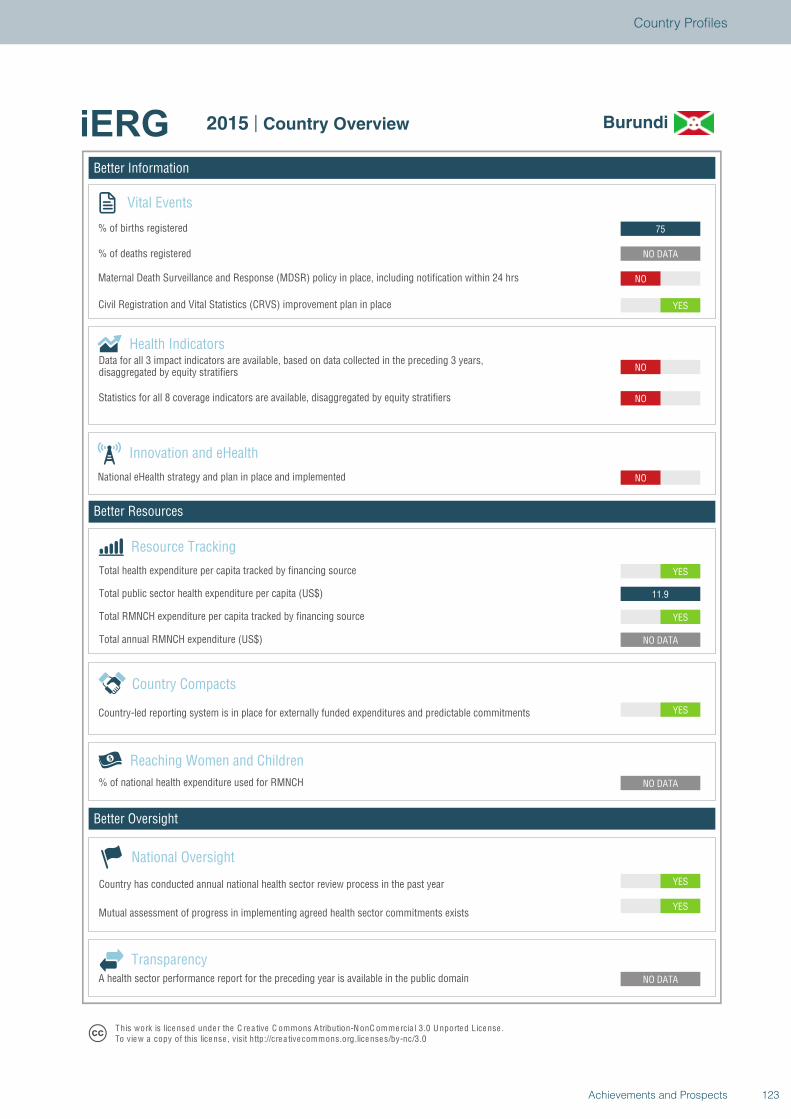
Better Information
Better Resources
Better Oversight
Burundi
Vital Events
% of births registered
% of deaths registered
Innovation and eHealth
National eHealth strategy and plan in place and implemented
Health Indicators
Statistics for all 8 coverage indicators are available, disaggregated by equity stratifiers
Reaching Women and Children
Country Compacts
Country-led reporting system is in place for externally funded expenditures and predictable commitments
Resource Tracking
Total RMNCH expenditure per capita tracked by financing source
Total annual RMNCH expenditure (US$)
Total health expenditure per capita tracked by financing source
% of national health expenditure used for RMNCH
YES
YES
NO DATA
NO DATA
YES
NO DATA
YES
11.9
YES
NO
NO
NO
YES
NO
NO DATA
75
National Oversight
Mutual assessment of progress in implementing agreed health sector commitments exists
Country has conducted annual national health sector review process in the past year
TransparencyA health sector performance report for the preceding year is available in the public domain
T his work is lice nse d unde r the C re a tive C ommons A tribution-N onC ommercia l 3.0 U nported License .To view a copy of this license , visit http://cre a tive commons.org.licenses/by-nc/3.0
2015 | Country Overview Burundi
Total public sector health expenditure per capita (US$)
Maternal Death Surveillance and Response (MDSR) policy in place, including notification within 24 hrs
Civil Registration and Vital Statistics (CRVS) improvement plan in place
Data for all 3 impact indicators are available, based on data collected in the preceding 3 years,disaggregated by equity stratifiers
123Achievements and Prospects
Country Profiles
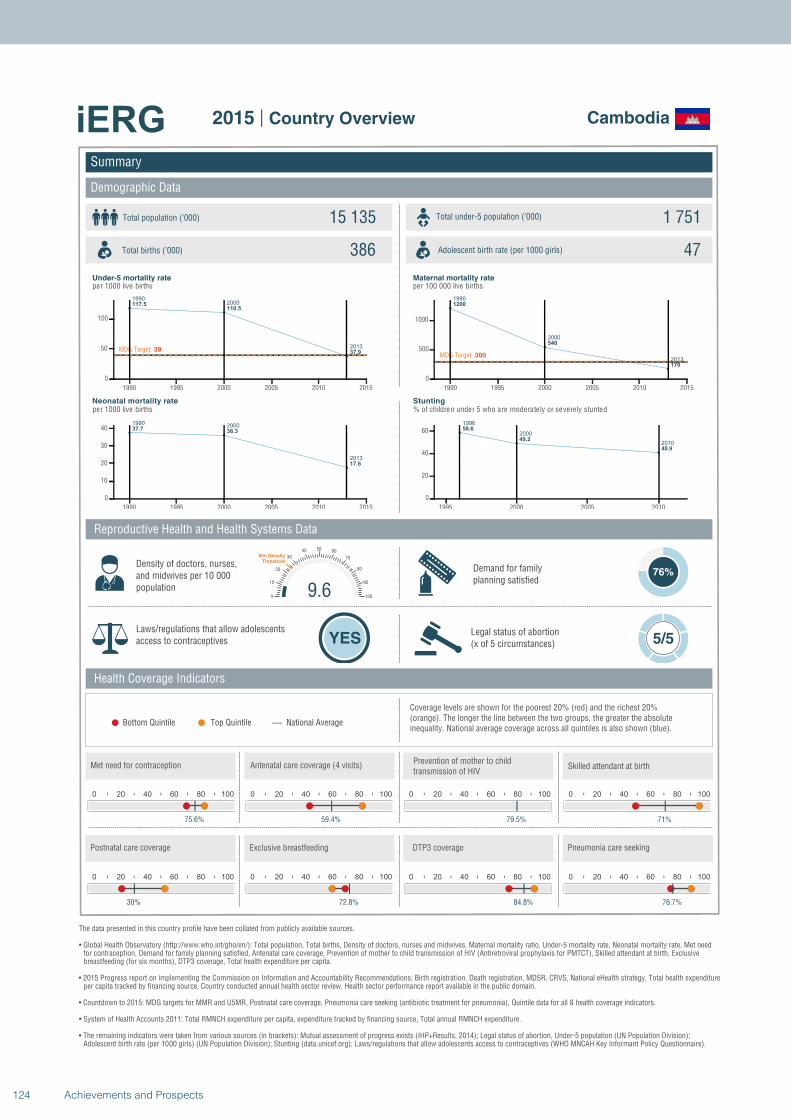
19902000
2013
117.5110.5
37.9MDG Target: 39
1990 1995 2000 2005 2010 2015
0
50
100
19902000
2013
37.736.3
17.6
1990 1995 2000 2005 2010 2015
0
10
20
30
40
1990
2000
2013
1200
540
170
MDG Target: 300
1990 1995 2000 2005 2010 2015
0
500
1000
1996
2000
2010
58.6
49.2
40.9
1995 2000 2005 2010
0
20
40
60
Summary
Demographic Data
Cambodia
Total population (’000) Total under-5 population (’000)15 135 1 751
386 47
Reproductive Health and Health Systems Data
Health Coverage Indicators
Demand for familyplanning satisfied
76%
Laws/regulations that allow adolescents access to contraceptives YES
Legal status of abortion(x of 5 circumstances) 5/5
National AverageBottom Quintile Top Quintile
per 1000 live births per 100 000 live births
per 1000 live births % of children under 5 who are moderately or severely stunted
0 20 40 60 80 100
75.6%
0 20 40 60 80 100
59.4%
0 20 40 60 80 100
79.5%
9.60
10
20
30
40 50 60
70
80
90
100
Min Density Threshold
0 20 40 60 80 100
71%
0 20 40 60 80 100
30%
0 20 40 60 80 100
72.8%
0 20 40 60 80 100
84.8%
0 20 40 60 80 100
76.7%
Total births (’000) Adolescent birth rate (per 1000 girls)
Coverage levels are shown for the poorest 20% (red) and the richest 20% (orange). The longer the line between the two groups, the greater the absolute inequality. National average coverage across all quintiles is also shown (blue).
Density of doctors, nurses, and midwives per 10 000 population
Postnatal care coverage Exclusive breastfeeding DTP3 coverage Pneumonia care seeking
Met need for contraception Antenatal care coverage (4 visits)Prevention of mother to child transmission of HIV
Skilled attendant at birth
Under-5 mortality rate Maternal mortality rate
Neonatal mortality rate Stunting
The data presented in this country profile have been collated from publicly available sources.
• Global Health Observatory (http://www.who.int/gho/en/): Total population, Total births, Density of doctors, nurses and midwives, Maternal mortality ratio, Under-5 mortality rate, Neonatal mortality rate, Met need for contraception, Demand for family planning satisfied, Antenatal care coverage, Prevention of mother to child transmission of HIV (Antiretroviral prophylaxis for PMTCT), Skilled attendant at birth, Exclusive breastfeeding (for six months), DTP3 coverage, Total health expenditure per capita.
• 2015 Progress report on implementing the Commission on Information and Accountability Recommendations: Birth registration, Death registration, MDSR, CRVS, National eHealth strategy, Total health expenditureper capita tracked by financing source, Country conducted annual health sector review, Health sector performance report available in the public domain.
• Countdown to 2015: MDG targets for MMR and U5MR, Postnatal care coverage, Pneumonia care seeking (antibiotic treatment for pneumonia), Quintile data for all 8 health coverage indicators.
• System of Health Accounts 2011: Total RMNCH expenditure per capita, expenditure tracked by financing source, Total annual RMNCH expenditure.
• The remaining indicators were taken from various sources (in brackets): Mutual assessment of progress exists (IHP+Results, 2014); Legal status of abortion, Under-5 population (UN Population Division);Adolescent birth rate (per 1000 girls) (UN Population Division); Stunting (data.unicef.org); Laws/regulations that allow adolescents access to contraceptives (WHO MNCAH Key Informant Policy Questionnaire).
2015 | Country Overview
124 Achievements and Prospects
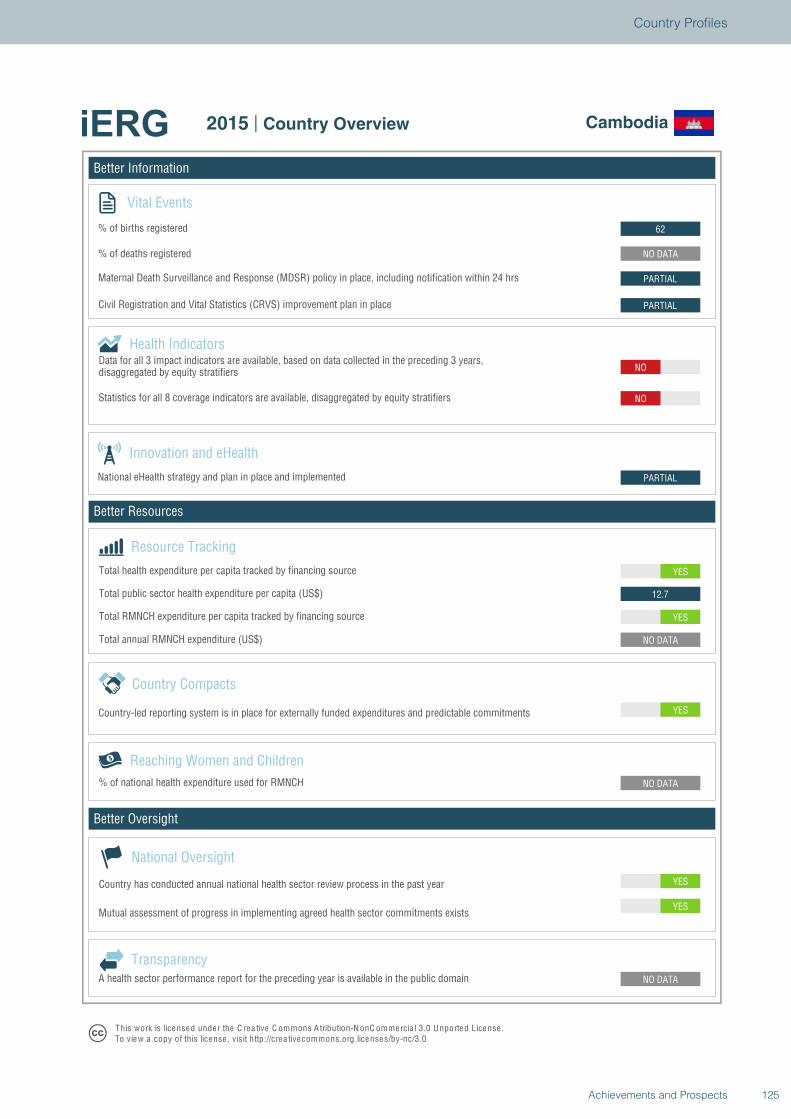
Better Information
Better Resources
Better Oversight
Cambodia
Vital Events
% of births registered
% of deaths registered
Innovation and eHealth
National eHealth strategy and plan in place and implemented
Health Indicators
Statistics for all 8 coverage indicators are available, disaggregated by equity stratifiers
Reaching Women and Children
Country Compacts
Country-led reporting system is in place for externally funded expenditures and predictable commitments
Resource Tracking
Total RMNCH expenditure per capita tracked by financing source
Total annual RMNCH expenditure (US$)
Total health expenditure per capita tracked by financing source
% of national health expenditure used for RMNCH
YES
YES
NO DATA
NO DATA
YES
NO DATA
YES
12.7
YES
PARTIAL
NO
NO
PARTIAL
PARTIAL
NO DATA
62
National Oversight
Mutual assessment of progress in implementing agreed health sector commitments exists
Country has conducted annual national health sector review process in the past year
TransparencyA health sector performance report for the preceding year is available in the public domain
T his work is lice nse d unde r the C re a tive C ommons A tribution-N onC ommercia l 3.0 U nported License .To view a copy of this license , visit http://cre a tive commons.org.licenses/by-nc/3.0
2015 | Country Overview Cambodia
Total public sector health expenditure per capita (US$)
Maternal Death Surveillance and Response (MDSR) policy in place, including notification within 24 hrs
Civil Registration and Vital Statistics (CRVS) improvement plan in place
Data for all 3 impact indicators are available, based on data collected in the preceding 3 years,disaggregated by equity stratifiers
125Achievements and Prospects
Country Profiles

1990
2000
2013
136.4
151.2
94.5
MDG Target: 45
1990 1995 2000 2005 2010 2015
0
50
100
150
19902000
2013
35.236.5
28.2
1990 1995 2000 2005 2010 2015
0
10
20
30
40
1990 2000
2013
720 740
590
MDG Target: 180
1990 1995 2000 2005 2010 2015
0
200
400
600
800
19911998
201136.338.2
32.6
1990 1995 2000 2005 2010
0
10
20
30
40
Summary
Demographic Data
Cameroon
Total population (’000) Total under-5 population (’000)22 254 3 686
820 131
Reproductive Health and Health Systems Data
Health Coverage Indicators
Demand for familyplanning satisfied
50%
Laws/regulations that allow adolescents access to contraceptives NO DATA
Legal status of abortion(x of 5 circumstances) 3/5
National AverageBottom Quintile Top Quintile
per 1000 live births per 100 000 live births
per 1000 live births % of children under 5 who are moderately or severely stunted
0 20 40 60 80 100
49.9%
0 20 40 60 80 100
62.2%
0 20 40 60 80 100
60.6%
5.150
10
20
30
40 50 60
70
80
90
100
Min Density Threshold
0 20 40 60 80 100
63.6%
0 20 40 60 80 100
No data
0 20 40 60 80 100
20.8%
0 20 40 60 80 100
68.8%
0 20 40 60 80 100
29.9%
Total births (’000) Adolescent birth rate (per 1000 girls)
Coverage levels are shown for the poorest 20% (red) and the richest 20% (orange). The longer the line between the two groups, the greater the absolute inequality. National average coverage across all quintiles is also shown (blue).
Density of doctors, nurses, and midwives per 10 000 population
Postnatal care coverage Exclusive breastfeeding DTP3 coverage Pneumonia care seeking
Met need for contraception Antenatal care coverage (4 visits)Prevention of mother to child transmission of HIV
Skilled attendant at birth
Under-5 mortality rate Maternal mortality rate
Neonatal mortality rate Stunting
The data presented in this country profile have been collated from publicly available sources.
• Global Health Observatory (http://www.who.int/gho/en/): Total population, Total births, Density of doctors, nurses and midwives, Maternal mortality ratio, Under-5 mortality rate, Neonatal mortality rate, Met need for contraception, Demand for family planning satisfied, Antenatal care coverage, Prevention of mother to child transmission of HIV (Antiretroviral prophylaxis for PMTCT), Skilled attendant at birth, Exclusive breastfeeding (for six months), DTP3 coverage, Total health expenditure per capita.
• 2015 Progress report on implementing the Commission on Information and Accountability Recommendations: Birth registration, Death registration, MDSR, CRVS, National eHealth strategy, Total health expenditureper capita tracked by financing source, Country conducted annual health sector review, Health sector performance report available in the public domain.
• Countdown to 2015: MDG targets for MMR and U5MR, Postnatal care coverage, Pneumonia care seeking (antibiotic treatment for pneumonia), Quintile data for all 8 health coverage indicators.
• System of Health Accounts 2011: Total RMNCH expenditure per capita, expenditure tracked by financing source, Total annual RMNCH expenditure.
• The remaining indicators were taken from various sources (in brackets): Mutual assessment of progress exists (IHP+Results, 2014); Legal status of abortion, Under-5 population (UN Population Division);Adolescent birth rate (per 1000 girls) (UN Population Division); Stunting (data.unicef.org); Laws/regulations that allow adolescents access to contraceptives (WHO MNCAH Key Informant Policy Questionnaire).
2015 | Country Overview
126 Achievements and Prospects
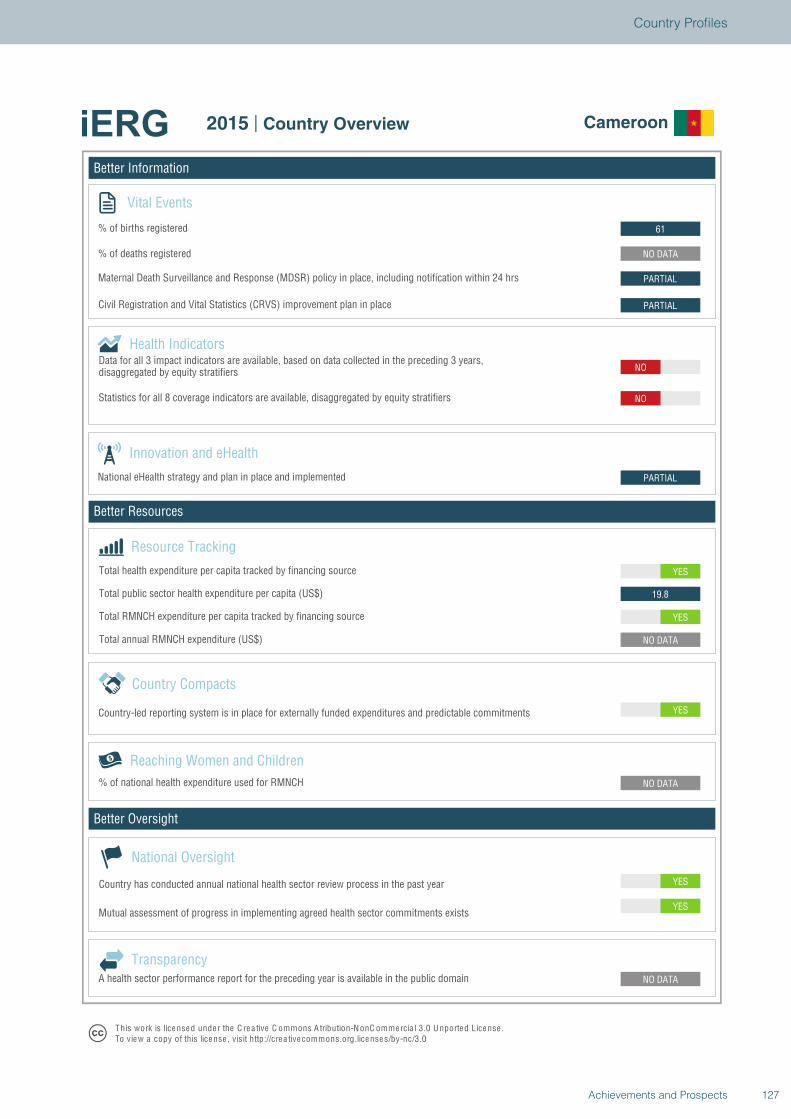
Better Information
Better Resources
Better Oversight
Cameroon
Vital Events
% of births registered
% of deaths registered
Innovation and eHealth
National eHealth strategy and plan in place and implemented
Health Indicators
Statistics for all 8 coverage indicators are available, disaggregated by equity stratifiers
Reaching Women and Children
Country Compacts
Country-led reporting system is in place for externally funded expenditures and predictable commitments
Resource Tracking
Total RMNCH expenditure per capita tracked by financing source
Total annual RMNCH expenditure (US$)
Total health expenditure per capita tracked by financing source
% of national health expenditure used for RMNCH
YES
YES
NO DATA
NO DATA
YES
NO DATA
YES
19.8
YES
PARTIAL
NO
NO
PARTIAL
PARTIAL
NO DATA
61
National Oversight
Mutual assessment of progress in implementing agreed health sector commitments exists
Country has conducted annual national health sector review process in the past year
TransparencyA health sector performance report for the preceding year is available in the public domain
T his work is lice nse d unde r the C re a tive C ommons A tribution-N onC ommercia l 3.0 U nported License .To view a copy of this license , visit http://cre a tive commons.org.licenses/by-nc/3.0
2015 | Country Overview Cameroon
Total public sector health expenditure per capita (US$)
Maternal Death Surveillance and Response (MDSR) policy in place, including notification within 24 hrs
Civil Registration and Vital Statistics (CRVS) improvement plan in place
Data for all 3 impact indicators are available, based on data collected in the preceding 3 years,disaggregated by equity stratifiers
127Achievements and Prospects
Country Profiles
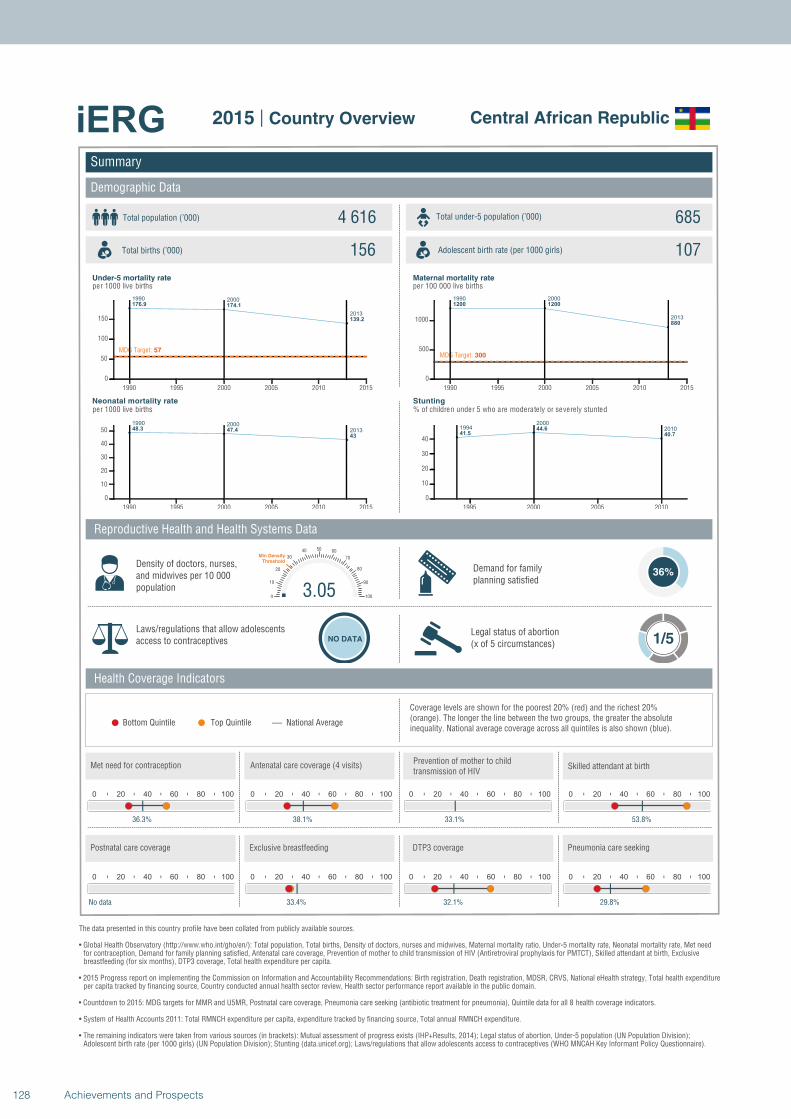
1990 2000
2013
176.9 174.1
139.2
MDG Target: 57
1990 1995 2000 2005 2010 2015
0
50
100
150
1990 2000
201348.3 47.4
43
1990 1995 2000 2005 2010 2015
0
10
20
30
40
50
1990 2000
2013
1200 1200
880
MDG Target: 300
1990 1995 2000 2005 2010 2015
0
500
1000
19942000
201041.5
44.6
40.7
1995 2000 2005 2010
0
10
20
30
40
Summary
Demographic Data
Central African Republic
Total population (’000) Total under-5 population (’000)4 616 685
156 107
Reproductive Health and Health Systems Data
Health Coverage Indicators
Demand for familyplanning satisfied
36%
Laws/regulations that allow adolescents access to contraceptives NO DATA
Legal status of abortion(x of 5 circumstances) 1/5
National AverageBottom Quintile Top Quintile
per 1000 live births per 100 000 live births
per 1000 live births % of children under 5 who are moderately or severely stunted
0 20 40 60 80 100
36.3%
0 20 40 60 80 100
38.1%
0 20 40 60 80 100
33.1%
3.050
10
20
30
40 50 60
70
80
90
100
Min Density Threshold
0 20 40 60 80 100
53.8%
0 20 40 60 80 100
No data
0 20 40 60 80 100
33.4%
0 20 40 60 80 100
32.1%
0 20 40 60 80 100
29.8%
Total births (’000) Adolescent birth rate (per 1000 girls)
Coverage levels are shown for the poorest 20% (red) and the richest 20% (orange). The longer the line between the two groups, the greater the absolute inequality. National average coverage across all quintiles is also shown (blue).
Density of doctors, nurses, and midwives per 10 000 population
Postnatal care coverage Exclusive breastfeeding DTP3 coverage Pneumonia care seeking
Met need for contraception Antenatal care coverage (4 visits)Prevention of mother to child transmission of HIV
Skilled attendant at birth
Under-5 mortality rate Maternal mortality rate
Neonatal mortality rate Stunting
The data presented in this country profile have been collated from publicly available sources.
• Global Health Observatory (http://www.who.int/gho/en/): Total population, Total births, Density of doctors, nurses and midwives, Maternal mortality ratio, Under-5 mortality rate, Neonatal mortality rate, Met need for contraception, Demand for family planning satisfied, Antenatal care coverage, Prevention of mother to child transmission of HIV (Antiretroviral prophylaxis for PMTCT), Skilled attendant at birth, Exclusive breastfeeding (for six months), DTP3 coverage, Total health expenditure per capita.
• 2015 Progress report on implementing the Commission on Information and Accountability Recommendations: Birth registration, Death registration, MDSR, CRVS, National eHealth strategy, Total health expenditureper capita tracked by financing source, Country conducted annual health sector review, Health sector performance report available in the public domain.
• Countdown to 2015: MDG targets for MMR and U5MR, Postnatal care coverage, Pneumonia care seeking (antibiotic treatment for pneumonia), Quintile data for all 8 health coverage indicators.
• System of Health Accounts 2011: Total RMNCH expenditure per capita, expenditure tracked by financing source, Total annual RMNCH expenditure.
• The remaining indicators were taken from various sources (in brackets): Mutual assessment of progress exists (IHP+Results, 2014); Legal status of abortion, Under-5 population (UN Population Division);Adolescent birth rate (per 1000 girls) (UN Population Division); Stunting (data.unicef.org); Laws/regulations that allow adolescents access to contraceptives (WHO MNCAH Key Informant Policy Questionnaire).
2015 | Country Overview
128 Achievements and Prospects
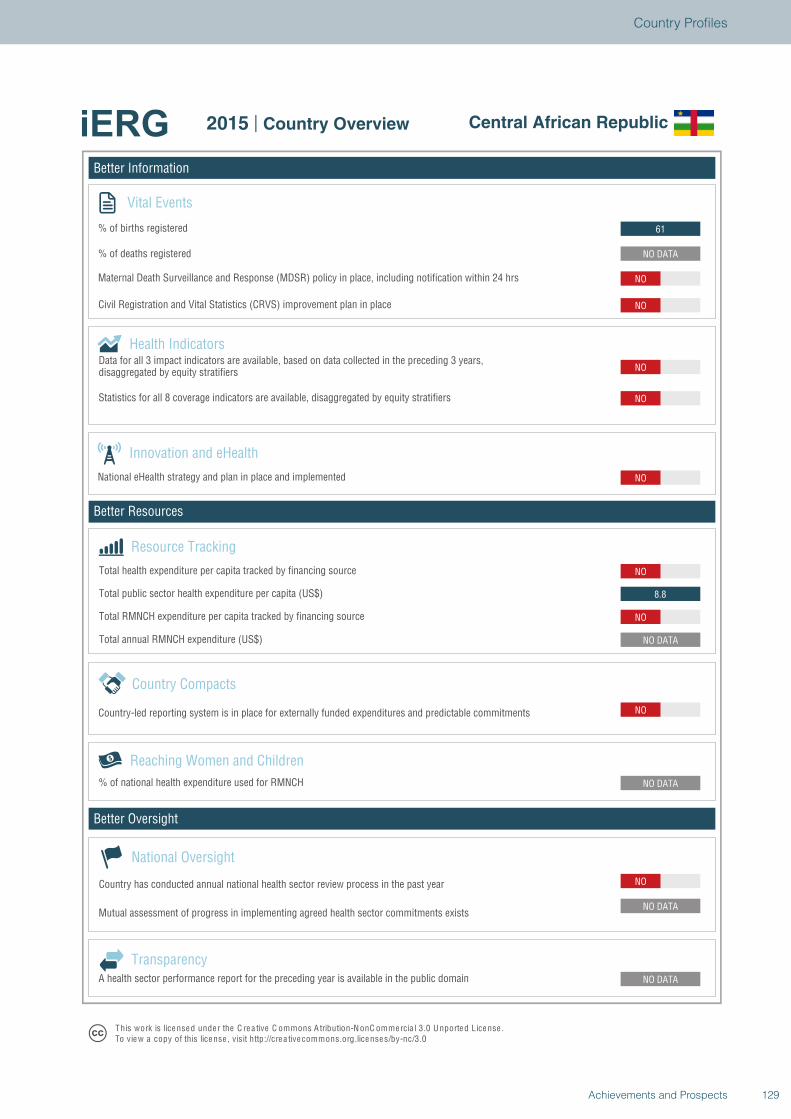
Better Information
Better Resources
Better Oversight
Central African Republic
Vital Events
% of births registered
% of deaths registered
Innovation and eHealth
National eHealth strategy and plan in place and implemented
Health Indicators
Statistics for all 8 coverage indicators are available, disaggregated by equity stratifiers
Reaching Women and Children
Country Compacts
Country-led reporting system is in place for externally funded expenditures and predictable commitments
Resource Tracking
Total RMNCH expenditure per capita tracked by financing source
Total annual RMNCH expenditure (US$)
Total health expenditure per capita tracked by financing source
% of national health expenditure used for RMNCH
NO
NO DATA
NO DATA
NO DATA
NO
NO DATA
NO
8.8
NO
NO
NO
NO
NO
NO
NO DATA
61
National Oversight
Mutual assessment of progress in implementing agreed health sector commitments exists
Country has conducted annual national health sector review process in the past year
TransparencyA health sector performance report for the preceding year is available in the public domain
T his work is lice nse d unde r the C re a tive C ommons A tribution-N onC ommercia l 3.0 U nported License .To view a copy of this license , visit http://cre a tive commons.org.licenses/by-nc/3.0
2015 | Country Overview Central African Republic
Total public sector health expenditure per capita (US$)
Maternal Death Surveillance and Response (MDSR) policy in place, including notification within 24 hrs
Civil Registration and Vital Statistics (CRVS) improvement plan in place
Data for all 3 impact indicators are available, based on data collected in the preceding 3 years,disaggregated by equity stratifiers
129Achievements and Prospects
Country Profiles
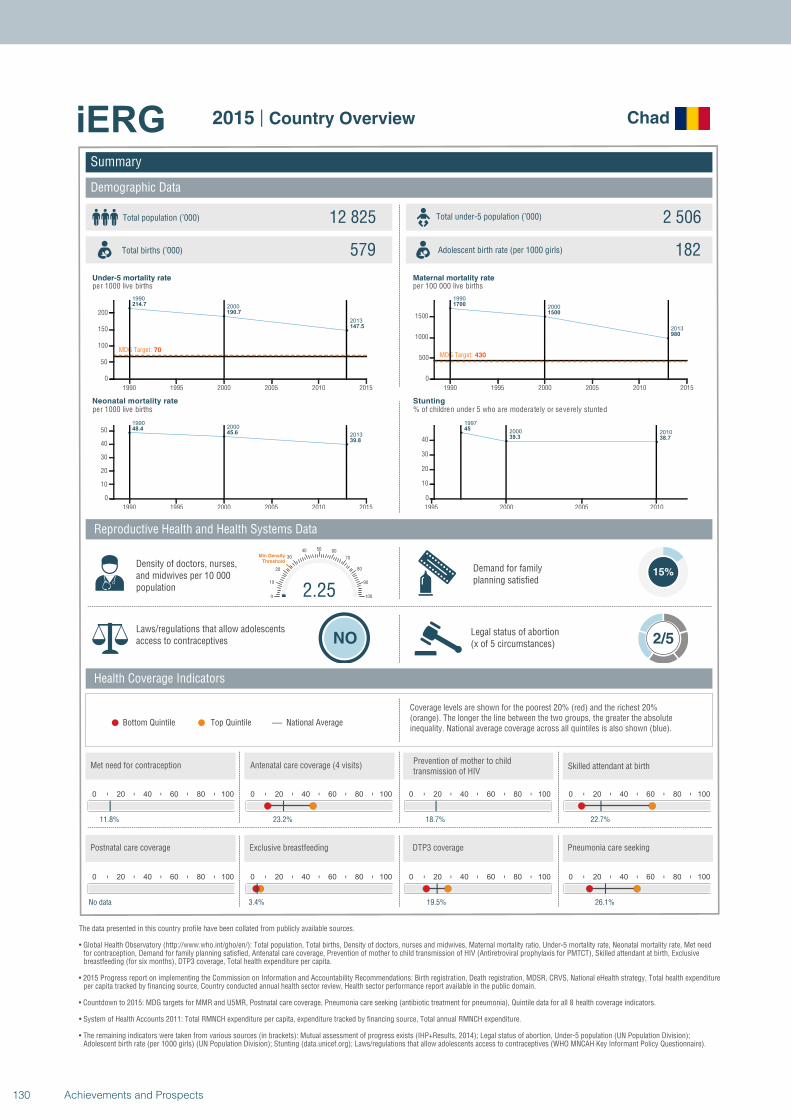
1990
2000
2013
214.7
190.7
147.5
MDG Target: 70
1990 1995 2000 2005 2010 2015
0
50
100
150
200
19902000
2013
48.445.6
39.8
1990 1995 2000 2005 2010 2015
0
10
20
30
40
50
1990
2000
2013
1700
1500
980
MDG Target: 430
1990 1995 2000 2005 2010 2015
0
500
1000
1500
1997
2000 201045
39.3 38.7
1995 2000 2005 2010
0
10
20
30
40
Summary
Demographic Data
Chad
Total population (’000) Total under-5 population (’000)12 825 2 506
579 182
Reproductive Health and Health Systems Data
Health Coverage Indicators
Demand for familyplanning satisfied
15%
Laws/regulations that allow adolescents access to contraceptives NO
Legal status of abortion(x of 5 circumstances) 2/5
National AverageBottom Quintile Top Quintile
per 1000 live births per 100 000 live births
per 1000 live births % of children under 5 who are moderately or severely stunted
0 20 40 60 80 100
11.8%
0 20 40 60 80 100
23.2%
0 20 40 60 80 100
18.7%
2.250
10
20
30
40 50 60
70
80
90
100
Min Density Threshold
0 20 40 60 80 100
22.7%
0 20 40 60 80 100
No data
0 20 40 60 80 100
3.4%
0 20 40 60 80 100
19.5%
0 20 40 60 80 100
26.1%
Total births (’000) Adolescent birth rate (per 1000 girls)
Coverage levels are shown for the poorest 20% (red) and the richest 20% (orange). The longer the line between the two groups, the greater the absolute inequality. National average coverage across all quintiles is also shown (blue).
Density of doctors, nurses, and midwives per 10 000 population
Postnatal care coverage Exclusive breastfeeding DTP3 coverage Pneumonia care seeking
Met need for contraception Antenatal care coverage (4 visits)Prevention of mother to child transmission of HIV
Skilled attendant at birth
Under-5 mortality rate Maternal mortality rate
Neonatal mortality rate Stunting
The data presented in this country profile have been collated from publicly available sources.
• Global Health Observatory (http://www.who.int/gho/en/): Total population, Total births, Density of doctors, nurses and midwives, Maternal mortality ratio, Under-5 mortality rate, Neonatal mortality rate, Met need for contraception, Demand for family planning satisfied, Antenatal care coverage, Prevention of mother to child transmission of HIV (Antiretroviral prophylaxis for PMTCT), Skilled attendant at birth, Exclusive breastfeeding (for six months), DTP3 coverage, Total health expenditure per capita.
• 2015 Progress report on implementing the Commission on Information and Accountability Recommendations: Birth registration, Death registration, MDSR, CRVS, National eHealth strategy, Total health expenditureper capita tracked by financing source, Country conducted annual health sector review, Health sector performance report available in the public domain.
• Countdown to 2015: MDG targets for MMR and U5MR, Postnatal care coverage, Pneumonia care seeking (antibiotic treatment for pneumonia), Quintile data for all 8 health coverage indicators.
• System of Health Accounts 2011: Total RMNCH expenditure per capita, expenditure tracked by financing source, Total annual RMNCH expenditure.
• The remaining indicators were taken from various sources (in brackets): Mutual assessment of progress exists (IHP+Results, 2014); Legal status of abortion, Under-5 population (UN Population Division);Adolescent birth rate (per 1000 girls) (UN Population Division); Stunting (data.unicef.org); Laws/regulations that allow adolescents access to contraceptives (WHO MNCAH Key Informant Policy Questionnaire).
2015 | Country Overview
130 Achievements and Prospects
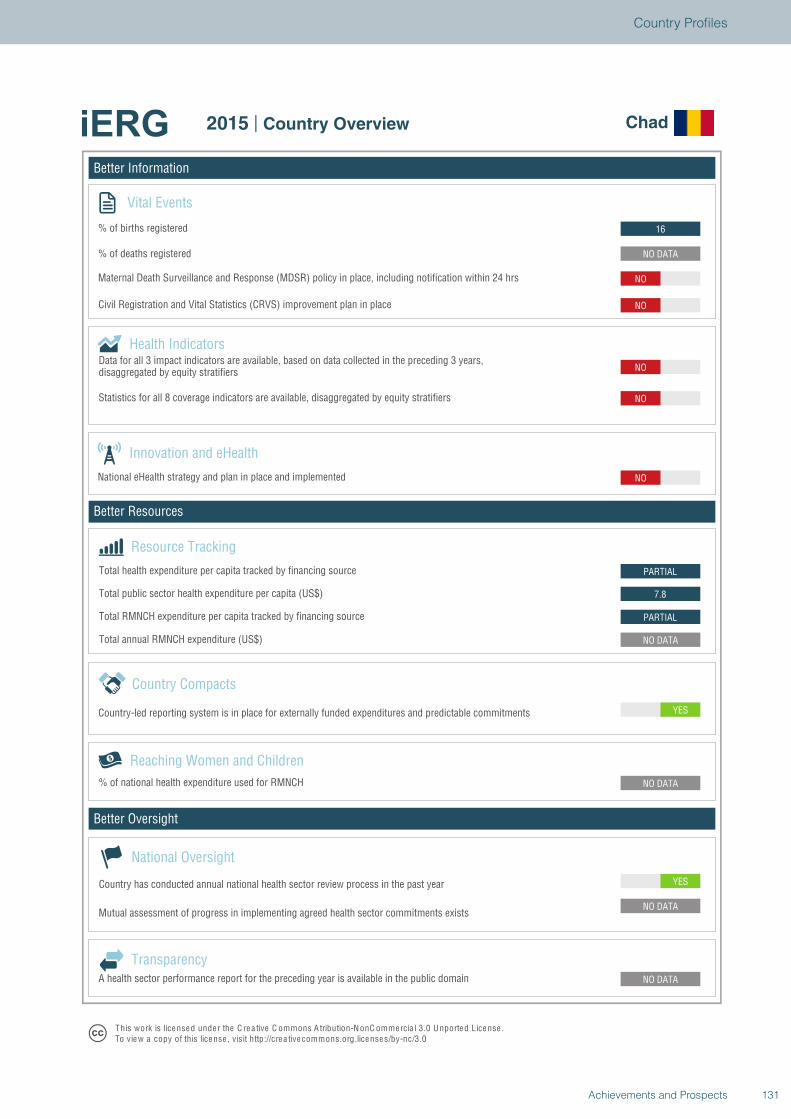
Better Information
Better Resources
Better Oversight
Chad
Vital Events
% of births registered
% of deaths registered
Innovation and eHealth
National eHealth strategy and plan in place and implemented
Health Indicators
Statistics for all 8 coverage indicators are available, disaggregated by equity stratifiers
Reaching Women and Children
Country Compacts
Country-led reporting system is in place for externally funded expenditures and predictable commitments
Resource Tracking
Total RMNCH expenditure per capita tracked by financing source
Total annual RMNCH expenditure (US$)
Total health expenditure per capita tracked by financing source
% of national health expenditure used for RMNCH
YES
NO DATA
NO DATA
NO DATA
YES
NO DATA
PARTIAL
7.8
PARTIAL
NO
NO
NO
NO
NO
NO DATA
16
National Oversight
Mutual assessment of progress in implementing agreed health sector commitments exists
Country has conducted annual national health sector review process in the past year
TransparencyA health sector performance report for the preceding year is available in the public domain
T his work is lice nse d unde r the C re a tive C ommons A tribution-N onC ommercia l 3.0 U nported License .To view a copy of this license , visit http://cre a tive commons.org.licenses/by-nc/3.0
2015 | Country Overview Chad
Total public sector health expenditure per capita (US$)
Maternal Death Surveillance and Response (MDSR) policy in place, including notification within 24 hrs
Civil Registration and Vital Statistics (CRVS) improvement plan in place
Data for all 3 impact indicators are available, based on data collected in the preceding 3 years,disaggregated by equity stratifiers
131Achievements and Prospects
Country Profiles
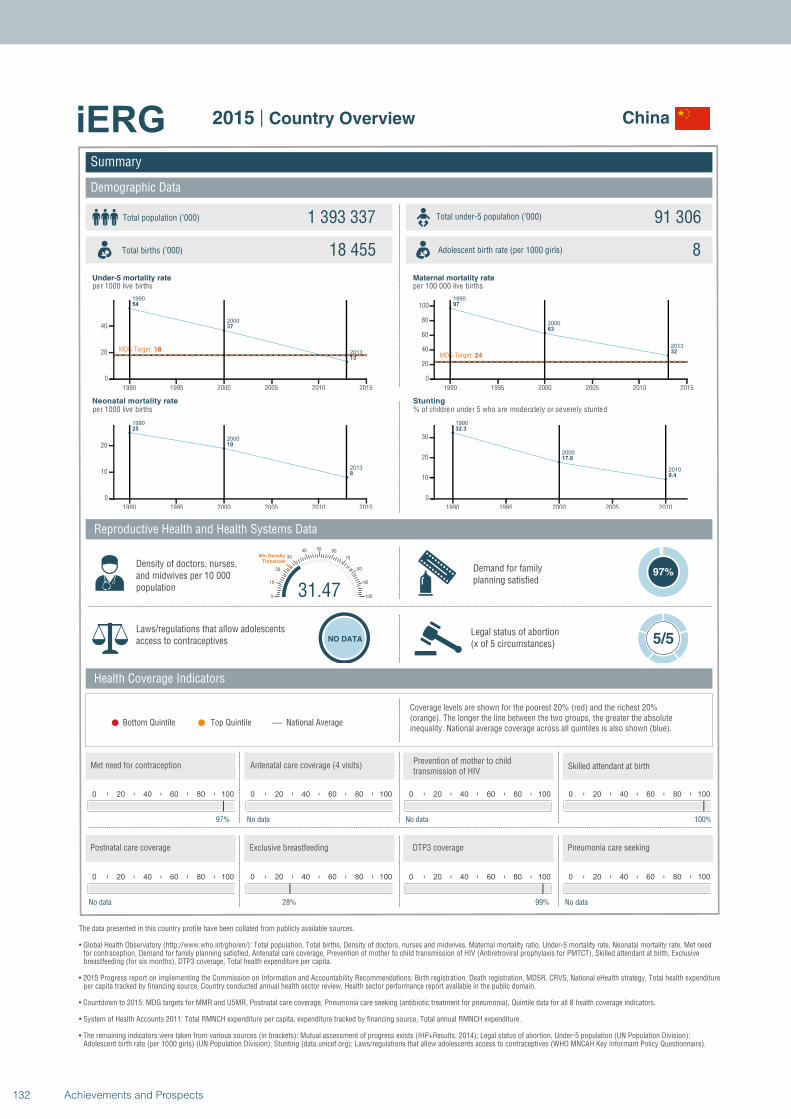
1990
2000
2013
54
37
13
MDG Target: 18
1990 1995 2000 2005 2010 2015
0
20
40
1990
2000
2013
25
19
8
1990 1995 2000 2005 2010 2015
0
10
20
1990
2000
2013
97
63
32MDG Target: 24
1990 1995 2000 2005 2010 2015
0
20
40
60
80
100
1990
2000
2010
32.3
17.8
9.4
1990 1995 2000 2005 2010
0
10
20
30
Summary
Demographic Data
China
Total population (’000) Total under-5 population (’000)1 393 337 91 306
18 455 8
Reproductive Health and Health Systems Data
Health Coverage Indicators
Demand for familyplanning satisfied
97%
Laws/regulations that allow adolescents access to contraceptives NO DATA
Legal status of abortion(x of 5 circumstances) 5/5
National AverageBottom Quintile Top Quintile
per 1000 live births per 100 000 live births
per 1000 live births % of children under 5 who are moderately or severely stunted
0 20 40 60 80 100
97%
0 20 40 60 80 100
No data
0 20 40 60 80 100
No data
31.470
10
20
30
40 50 60
70
80
90
100
Min Density Threshold
0 20 40 60 80 100
100%
0 20 40 60 80 100
No data
0 20 40 60 80 100
28%
0 20 40 60 80 100
99%
0 20 40 60 80 100
No data
Total births (’000) Adolescent birth rate (per 1000 girls)
Coverage levels are shown for the poorest 20% (red) and the richest 20% (orange). The longer the line between the two groups, the greater the absolute inequality. National average coverage across all quintiles is also shown (blue).
Density of doctors, nurses, and midwives per 10 000 population
Postnatal care coverage Exclusive breastfeeding DTP3 coverage Pneumonia care seeking
Met need for contraception Antenatal care coverage (4 visits)Prevention of mother to child transmission of HIV
Skilled attendant at birth
Under-5 mortality rate Maternal mortality rate
Neonatal mortality rate Stunting
The data presented in this country profile have been collated from publicly available sources.
• Global Health Observatory (http://www.who.int/gho/en/): Total population, Total births, Density of doctors, nurses and midwives, Maternal mortality ratio, Under-5 mortality rate, Neonatal mortality rate, Met need for contraception, Demand for family planning satisfied, Antenatal care coverage, Prevention of mother to child transmission of HIV (Antiretroviral prophylaxis for PMTCT), Skilled attendant at birth, Exclusive breastfeeding (for six months), DTP3 coverage, Total health expenditure per capita.
• 2015 Progress report on implementing the Commission on Information and Accountability Recommendations: Birth registration, Death registration, MDSR, CRVS, National eHealth strategy, Total health expenditureper capita tracked by financing source, Country conducted annual health sector review, Health sector performance report available in the public domain.
• Countdown to 2015: MDG targets for MMR and U5MR, Postnatal care coverage, Pneumonia care seeking (antibiotic treatment for pneumonia), Quintile data for all 8 health coverage indicators.
• System of Health Accounts 2011: Total RMNCH expenditure per capita, expenditure tracked by financing source, Total annual RMNCH expenditure.
• The remaining indicators were taken from various sources (in brackets): Mutual assessment of progress exists (IHP+Results, 2014); Legal status of abortion, Under-5 population (UN Population Division);Adolescent birth rate (per 1000 girls) (UN Population Division); Stunting (data.unicef.org); Laws/regulations that allow adolescents access to contraceptives (WHO MNCAH Key Informant Policy Questionnaire).
2015 | Country Overview
132 Achievements and Prospects
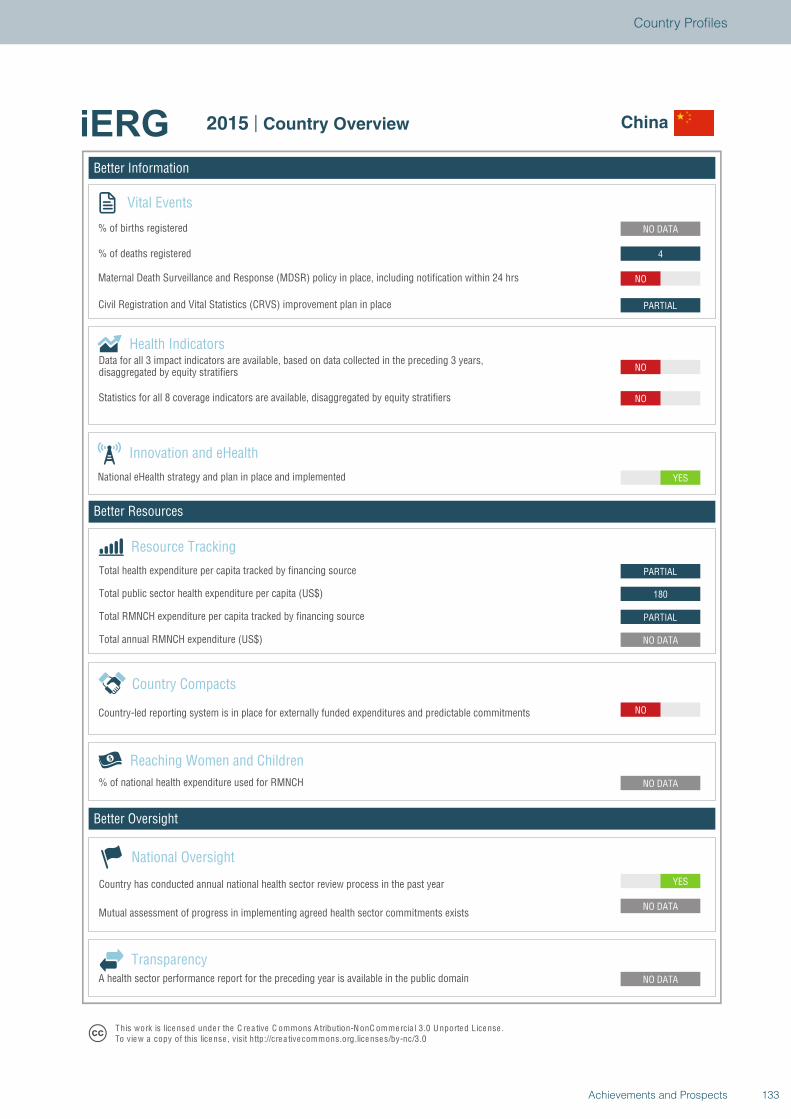
Better Information
Better Resources
Better Oversight
China
Vital Events
% of births registered
% of deaths registered
Innovation and eHealth
National eHealth strategy and plan in place and implemented
Health Indicators
Statistics for all 8 coverage indicators are available, disaggregated by equity stratifiers
Reaching Women and Children
Country Compacts
Country-led reporting system is in place for externally funded expenditures and predictable commitments
Resource Tracking
Total RMNCH expenditure per capita tracked by financing source
Total annual RMNCH expenditure (US$)
Total health expenditure per capita tracked by financing source
% of national health expenditure used for RMNCH
YES
NO DATA
NO DATA
NO DATA
NO
NO DATA
PARTIAL
180
PARTIAL
YES
NO
NO
PARTIAL
NO
4
NO DATA
National Oversight
Mutual assessment of progress in implementing agreed health sector commitments exists
Country has conducted annual national health sector review process in the past year
TransparencyA health sector performance report for the preceding year is available in the public domain
T his work is lice nse d unde r the C re a tive C ommons A tribution-N onC ommercia l 3.0 U nported License .To view a copy of this license , visit http://cre a tive commons.org.licenses/by-nc/3.0
2015 | Country Overview China
Total public sector health expenditure per capita (US$)
Maternal Death Surveillance and Response (MDSR) policy in place, including notification within 24 hrs
Civil Registration and Vital Statistics (CRVS) improvement plan in place
Data for all 3 impact indicators are available, based on data collected in the preceding 3 years,disaggregated by equity stratifiers
133Achievements and Prospects
Country Profiles

1990
2000
2013
125.4
101.3
77.9
MDG Target: 41
1990 1995 2000 2005 2010 2015
0
50
100
1990
2000
2013
41.2
36.3
30.8
1990 1995 2000 2005 2010 2015
0
10
20
30
40
1990
2000
2013
630
480
350
MDG Target: 160
1990 1995 2000 2005 2010 2015
0
200
400
600
1992
2000
201238.5
46.9
32.1
1990 1995 2000 2005 2010
0
10
20
30
40
50
Summary
Demographic Data
Comoros
Total population (’000) Total under-5 population (’000)735 117
26 58
Reproductive Health and Health Systems Data
Health Coverage Indicators
Demand for familyplanning satisfied
37%
Laws/regulations that allow adolescents access to contraceptives NO
Legal status of abortion(x of 5 circumstances) 3/5
National AverageBottom Quintile Top Quintile
per 1000 live births per 100 000 live births
per 1000 live births % of children under 5 who are moderately or severely stunted
0 20 40 60 80 100
37.4%
0 20 40 60 80 100
48.9%
0 20 40 60 80 100
No data
8.90
10
20
30
40 50 60
70
80
90
100
Min Density Threshold
0 20 40 60 80 100
82.2%
0 20 40 60 80 100
13.7%
0 20 40 60 80 100
12%
0 20 40 60 80 100
73.1%
0 20 40 60 80 100
38.1%
Total births (’000) Adolescent birth rate (per 1000 girls)
Coverage levels are shown for the poorest 20% (red) and the richest 20% (orange). The longer the line between the two groups, the greater the absolute inequality. National average coverage across all quintiles is also shown (blue).
Density of doctors, nurses, and midwives per 10 000 population
Postnatal care coverage Exclusive breastfeeding DTP3 coverage Pneumonia care seeking
Met need for contraception Antenatal care coverage (4 visits)Prevention of mother to child transmission of HIV
Skilled attendant at birth
Under-5 mortality rate Maternal mortality rate
Neonatal mortality rate Stunting
The data presented in this country profile have been collated from publicly available sources.
• Global Health Observatory (http://www.who.int/gho/en/): Total population, Total births, Density of doctors, nurses and midwives, Maternal mortality ratio, Under-5 mortality rate, Neonatal mortality rate, Met need for contraception, Demand for family planning satisfied, Antenatal care coverage, Prevention of mother to child transmission of HIV (Antiretroviral prophylaxis for PMTCT), Skilled attendant at birth, Exclusive breastfeeding (for six months), DTP3 coverage, Total health expenditure per capita.
• 2015 Progress report on implementing the Commission on Information and Accountability Recommendations: Birth registration, Death registration, MDSR, CRVS, National eHealth strategy, Total health expenditureper capita tracked by financing source, Country conducted annual health sector review, Health sector performance report available in the public domain.
• Countdown to 2015: MDG targets for MMR and U5MR, Postnatal care coverage, Pneumonia care seeking (antibiotic treatment for pneumonia), Quintile data for all 8 health coverage indicators.
• System of Health Accounts 2011: Total RMNCH expenditure per capita, expenditure tracked by financing source, Total annual RMNCH expenditure.
• The remaining indicators were taken from various sources (in brackets): Mutual assessment of progress exists (IHP+Results, 2014); Legal status of abortion, Under-5 population (UN Population Division);Adolescent birth rate (per 1000 girls) (UN Population Division); Stunting (data.unicef.org); Laws/regulations that allow adolescents access to contraceptives (WHO MNCAH Key Informant Policy Questionnaire).
2015 | Country Overview
134 Achievements and Prospects
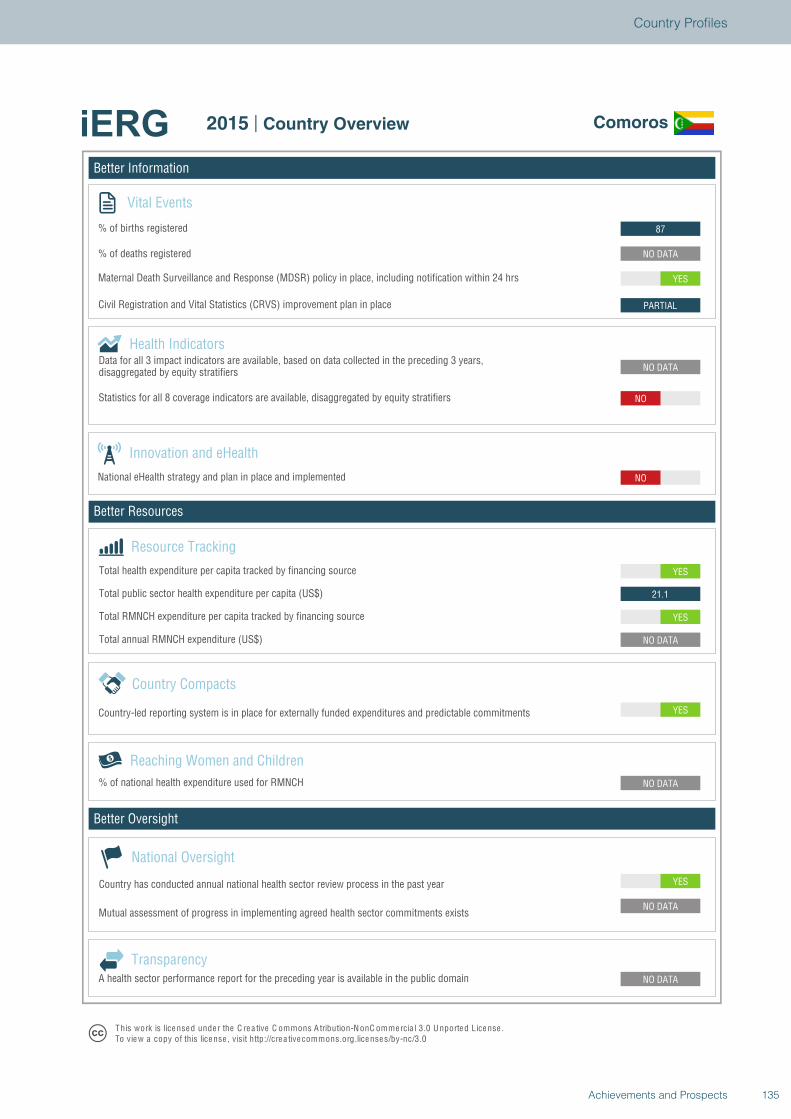
Better Information
Better Resources
Better Oversight
Comoros
Vital Events
% of births registered
% of deaths registered
Innovation and eHealth
National eHealth strategy and plan in place and implemented
Health Indicators
Statistics for all 8 coverage indicators are available, disaggregated by equity stratifiers
Reaching Women and Children
Country Compacts
Country-led reporting system is in place for externally funded expenditures and predictable commitments
Resource Tracking
Total RMNCH expenditure per capita tracked by financing source
Total annual RMNCH expenditure (US$)
Total health expenditure per capita tracked by financing source
% of national health expenditure used for RMNCH
YES
NO DATA
NO DATA
NO DATA
YES
NO DATA
YES
21.1
YES
NO
NO DATA
NO
PARTIAL
YES
NO DATA
87
National Oversight
Mutual assessment of progress in implementing agreed health sector commitments exists
Country has conducted annual national health sector review process in the past year
TransparencyA health sector performance report for the preceding year is available in the public domain
T his work is lice nse d unde r the C re a tive C ommons A tribution-N onC ommercia l 3.0 U nported License .To view a copy of this license , visit http://cre a tive commons.org.licenses/by-nc/3.0
2015 | Country Overview Comoros
Total public sector health expenditure per capita (US$)
Maternal Death Surveillance and Response (MDSR) policy in place, including notification within 24 hrs
Civil Registration and Vital Statistics (CRVS) improvement plan in place
Data for all 3 impact indicators are available, based on data collected in the preceding 3 years,disaggregated by equity stratifiers
135Achievements and Prospects
Country Profiles
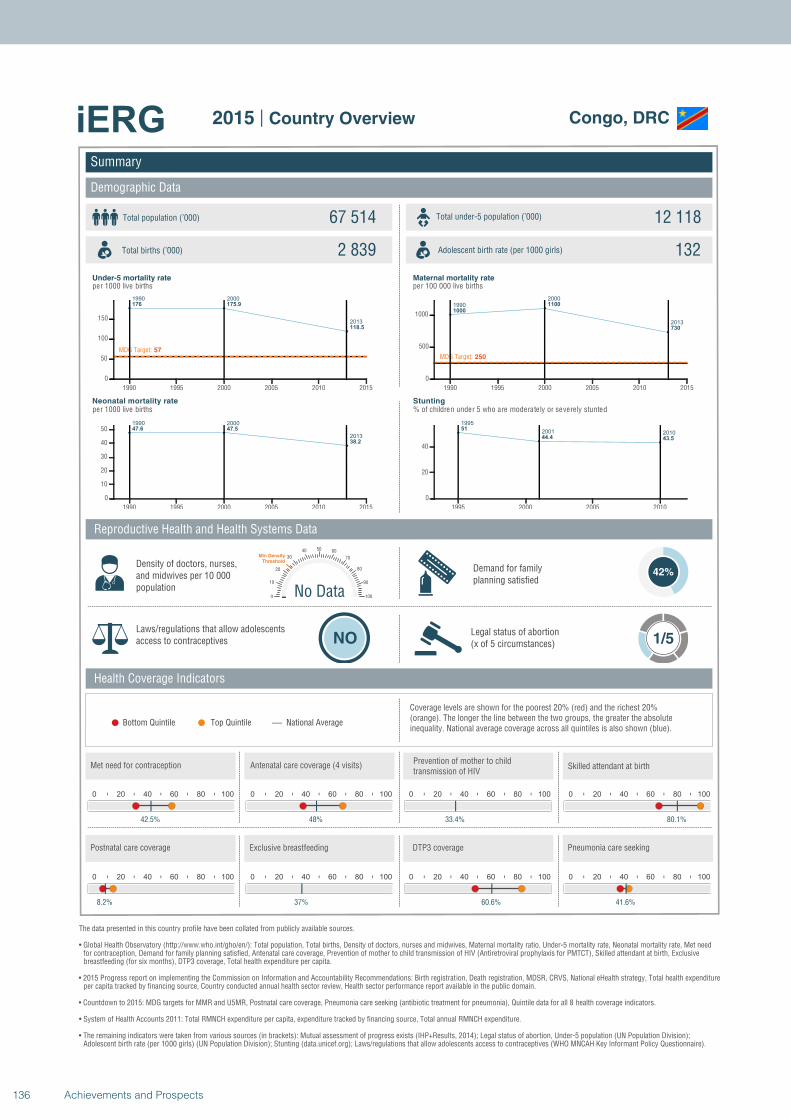
1990 2000
2013
176 175.9
118.5
MDG Target: 57
1990 1995 2000 2005 2010 2015
0
50
100
150
1990 2000
2013
47.6 47.5
38.2
1990 1995 2000 2005 2010 2015
0
10
20
30
40
50
1990
2000
2013
1000
1100
730
MDG Target: 250
1990 1995 2000 2005 2010 2015
0
500
1000
1995
2001 201051
44.4 43.5
1995 2000 2005 2010
0
20
40
Summary
Demographic Data
Congo, DRC
Total population (’000) Total under-5 population (’000)67 514 12 118
2 839 132
Reproductive Health and Health Systems Data
Health Coverage Indicators
Demand for familyplanning satisfied
42%
Laws/regulations that allow adolescents access to contraceptives NO
Legal status of abortion(x of 5 circumstances) 1/5
National AverageBottom Quintile Top Quintile
per 1000 live births per 100 000 live births
per 1000 live births % of children under 5 who are moderately or severely stunted
0 20 40 60 80 100
42.5%
0 20 40 60 80 100
48%
0 20 40 60 80 100
33.4%
No Data0
10
20
30
40 50 60
70
80
90
100
Min Density Threshold
0 20 40 60 80 100
80.1%
0 20 40 60 80 100
8.2%
0 20 40 60 80 100
37%
0 20 40 60 80 100
60.6%
0 20 40 60 80 100
41.6%
Total births (’000) Adolescent birth rate (per 1000 girls)
Coverage levels are shown for the poorest 20% (red) and the richest 20% (orange). The longer the line between the two groups, the greater the absolute inequality. National average coverage across all quintiles is also shown (blue).
Density of doctors, nurses, and midwives per 10 000 population
Postnatal care coverage Exclusive breastfeeding DTP3 coverage Pneumonia care seeking
Met need for contraception Antenatal care coverage (4 visits)Prevention of mother to child transmission of HIV
Skilled attendant at birth
Under-5 mortality rate Maternal mortality rate
Neonatal mortality rate Stunting
The data presented in this country profile have been collated from publicly available sources.
• Global Health Observatory (http://www.who.int/gho/en/): Total population, Total births, Density of doctors, nurses and midwives, Maternal mortality ratio, Under-5 mortality rate, Neonatal mortality rate, Met need for contraception, Demand for family planning satisfied, Antenatal care coverage, Prevention of mother to child transmission of HIV (Antiretroviral prophylaxis for PMTCT), Skilled attendant at birth, Exclusive breastfeeding (for six months), DTP3 coverage, Total health expenditure per capita.
• 2015 Progress report on implementing the Commission on Information and Accountability Recommendations: Birth registration, Death registration, MDSR, CRVS, National eHealth strategy, Total health expenditureper capita tracked by financing source, Country conducted annual health sector review, Health sector performance report available in the public domain.
• Countdown to 2015: MDG targets for MMR and U5MR, Postnatal care coverage, Pneumonia care seeking (antibiotic treatment for pneumonia), Quintile data for all 8 health coverage indicators.
• System of Health Accounts 2011: Total RMNCH expenditure per capita, expenditure tracked by financing source, Total annual RMNCH expenditure.
• The remaining indicators were taken from various sources (in brackets): Mutual assessment of progress exists (IHP+Results, 2014); Legal status of abortion, Under-5 population (UN Population Division);Adolescent birth rate (per 1000 girls) (UN Population Division); Stunting (data.unicef.org); Laws/regulations that allow adolescents access to contraceptives (WHO MNCAH Key Informant Policy Questionnaire).
2015 | Country Overview
136 Achievements and Prospects
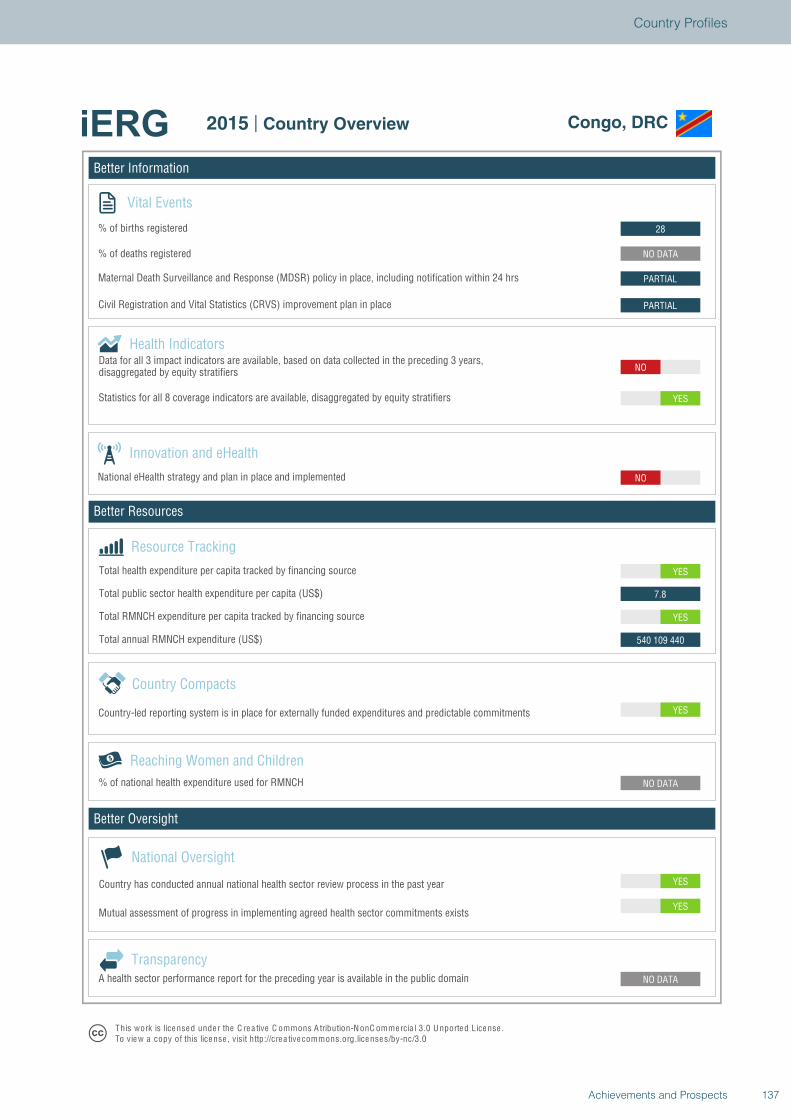
Better Information
Better Resources
Better Oversight
Congo, DRC
Vital Events
% of births registered
% of deaths registered
Innovation and eHealth
National eHealth strategy and plan in place and implemented
Health Indicators
Statistics for all 8 coverage indicators are available, disaggregated by equity stratifiers
Reaching Women and Children
Country Compacts
Country-led reporting system is in place for externally funded expenditures and predictable commitments
Resource Tracking
Total RMNCH expenditure per capita tracked by financing source
Total annual RMNCH expenditure (US$)
Total health expenditure per capita tracked by financing source
% of national health expenditure used for RMNCH
YES
YES
NO DATA
NO DATA
YES
540 109 440
YES
7.8
YES
NO
NO
YES
PARTIAL
PARTIAL
NO DATA
28
National Oversight
Mutual assessment of progress in implementing agreed health sector commitments exists
Country has conducted annual national health sector review process in the past year
TransparencyA health sector performance report for the preceding year is available in the public domain
T his work is lice nse d unde r the C re a tive C ommons A tribution-N onC ommercia l 3.0 U nported License .To view a copy of this license , visit http://cre a tive commons.org.licenses/by-nc/3.0
2015 | Country Overview Congo, DRC
Total public sector health expenditure per capita (US$)
Maternal Death Surveillance and Response (MDSR) policy in place, including notification within 24 hrs
Civil Registration and Vital Statistics (CRVS) improvement plan in place
Data for all 3 impact indicators are available, based on data collected in the preceding 3 years,disaggregated by equity stratifiers
137Achievements and Prospects
Country Profiles
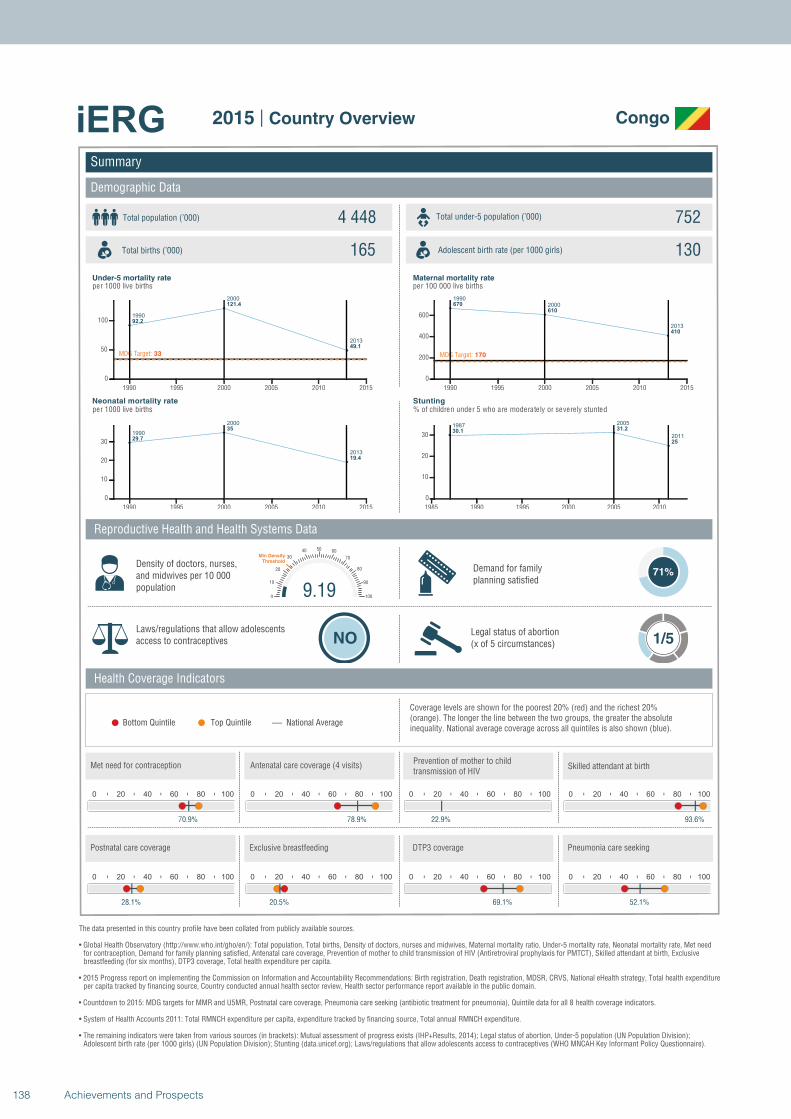
1990
2000
2013
92.2
121.4
49.1
MDG Target: 33
1990 1995 2000 2005 2010 2015
0
50
100
1990
2000
2013
29.7
35
19.4
1990 1995 2000 2005 2010 2015
0
10
20
30
1990
2000
2013
670
610
410
MDG Target: 170
1990 1995 2000 2005 2010 2015
0
200
400
600
19872005
201130.1
31.2
25
1985 1990 1995 2000 2005 2010
0
10
20
30
Summary
Demographic Data
Congo
Total population (’000) Total under-5 population (’000)4 448 752
165 130
Reproductive Health and Health Systems Data
Health Coverage Indicators
Demand for familyplanning satisfied
71%
Laws/regulations that allow adolescents access to contraceptives NO
Legal status of abortion(x of 5 circumstances) 1/5
National AverageBottom Quintile Top Quintile
per 1000 live births per 100 000 live births
per 1000 live births % of children under 5 who are moderately or severely stunted
0 20 40 60 80 100
70.9%
0 20 40 60 80 100
78.9%
0 20 40 60 80 100
22.9%
9.190
10
20
30
40 50 60
70
80
90
100
Min Density Threshold
0 20 40 60 80 100
93.6%
0 20 40 60 80 100
28.1%
0 20 40 60 80 100
20.5%
0 20 40 60 80 100
69.1%
0 20 40 60 80 100
52.1%
Total births (’000) Adolescent birth rate (per 1000 girls)
Coverage levels are shown for the poorest 20% (red) and the richest 20% (orange). The longer the line between the two groups, the greater the absolute inequality. National average coverage across all quintiles is also shown (blue).
Density of doctors, nurses, and midwives per 10 000 population
Postnatal care coverage Exclusive breastfeeding DTP3 coverage Pneumonia care seeking
Met need for contraception Antenatal care coverage (4 visits)Prevention of mother to child transmission of HIV
Skilled attendant at birth
Under-5 mortality rate Maternal mortality rate
Neonatal mortality rate Stunting
The data presented in this country profile have been collated from publicly available sources.
• Global Health Observatory (http://www.who.int/gho/en/): Total population, Total births, Density of doctors, nurses and midwives, Maternal mortality ratio, Under-5 mortality rate, Neonatal mortality rate, Met need for contraception, Demand for family planning satisfied, Antenatal care coverage, Prevention of mother to child transmission of HIV (Antiretroviral prophylaxis for PMTCT), Skilled attendant at birth, Exclusive breastfeeding (for six months), DTP3 coverage, Total health expenditure per capita.
• 2015 Progress report on implementing the Commission on Information and Accountability Recommendations: Birth registration, Death registration, MDSR, CRVS, National eHealth strategy, Total health expenditureper capita tracked by financing source, Country conducted annual health sector review, Health sector performance report available in the public domain.
• Countdown to 2015: MDG targets for MMR and U5MR, Postnatal care coverage, Pneumonia care seeking (antibiotic treatment for pneumonia), Quintile data for all 8 health coverage indicators.
• System of Health Accounts 2011: Total RMNCH expenditure per capita, expenditure tracked by financing source, Total annual RMNCH expenditure.
• The remaining indicators were taken from various sources (in brackets): Mutual assessment of progress exists (IHP+Results, 2014); Legal status of abortion, Under-5 population (UN Population Division);Adolescent birth rate (per 1000 girls) (UN Population Division); Stunting (data.unicef.org); Laws/regulations that allow adolescents access to contraceptives (WHO MNCAH Key Informant Policy Questionnaire).
2015 | Country Overview
138 Achievements and Prospects
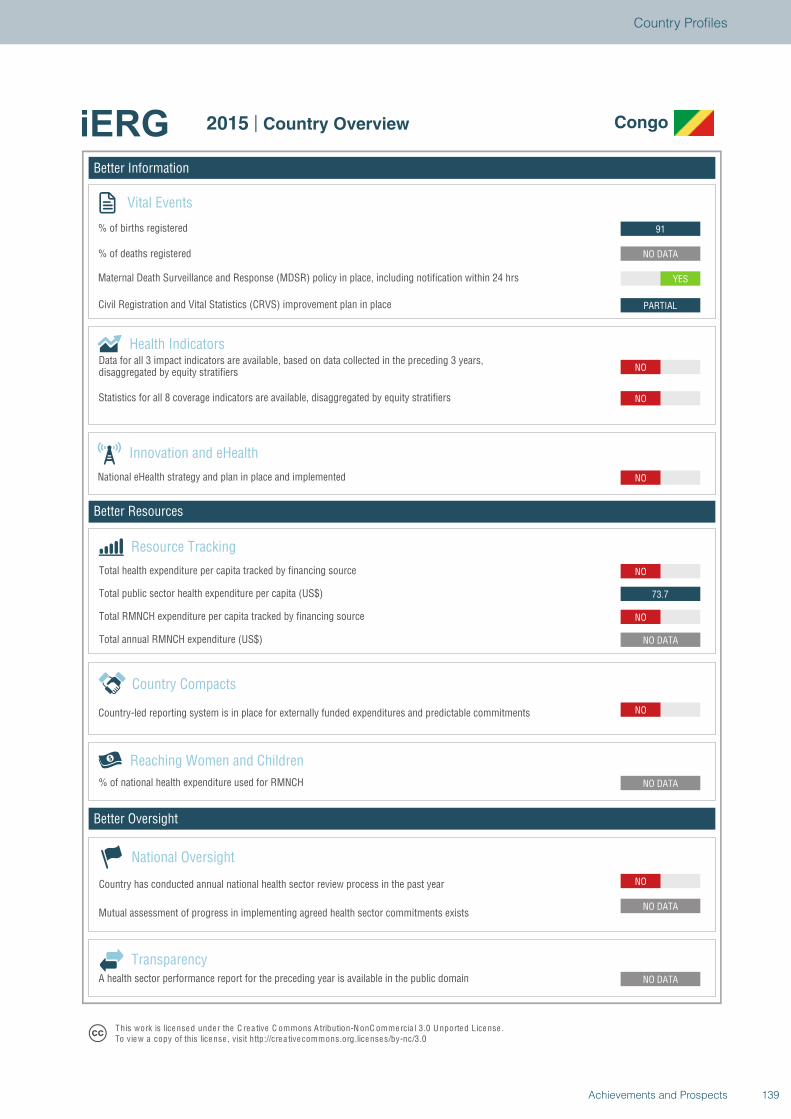
Better Information
Better Resources
Better Oversight
Congo
Vital Events
% of births registered
% of deaths registered
Innovation and eHealth
National eHealth strategy and plan in place and implemented
Health Indicators
Statistics for all 8 coverage indicators are available, disaggregated by equity stratifiers
Reaching Women and Children
Country Compacts
Country-led reporting system is in place for externally funded expenditures and predictable commitments
Resource Tracking
Total RMNCH expenditure per capita tracked by financing source
Total annual RMNCH expenditure (US$)
Total health expenditure per capita tracked by financing source
% of national health expenditure used for RMNCH
NO
NO DATA
NO DATA
NO DATA
NO
NO DATA
NO
73.7
NO
NO
NO
NO
PARTIAL
YES
NO DATA
91
National Oversight
Mutual assessment of progress in implementing agreed health sector commitments exists
Country has conducted annual national health sector review process in the past year
TransparencyA health sector performance report for the preceding year is available in the public domain
T his work is lice nse d unde r the C re a tive C ommons A tribution-N onC ommercia l 3.0 U nported License .To view a copy of this license , visit http://cre a tive commons.org.licenses/by-nc/3.0
2015 | Country Overview Congo
Total public sector health expenditure per capita (US$)
Maternal Death Surveillance and Response (MDSR) policy in place, including notification within 24 hrs
Civil Registration and Vital Statistics (CRVS) improvement plan in place
Data for all 3 impact indicators are available, based on data collected in the preceding 3 years,disaggregated by equity stratifiers
139Achievements and Prospects
Country Profiles
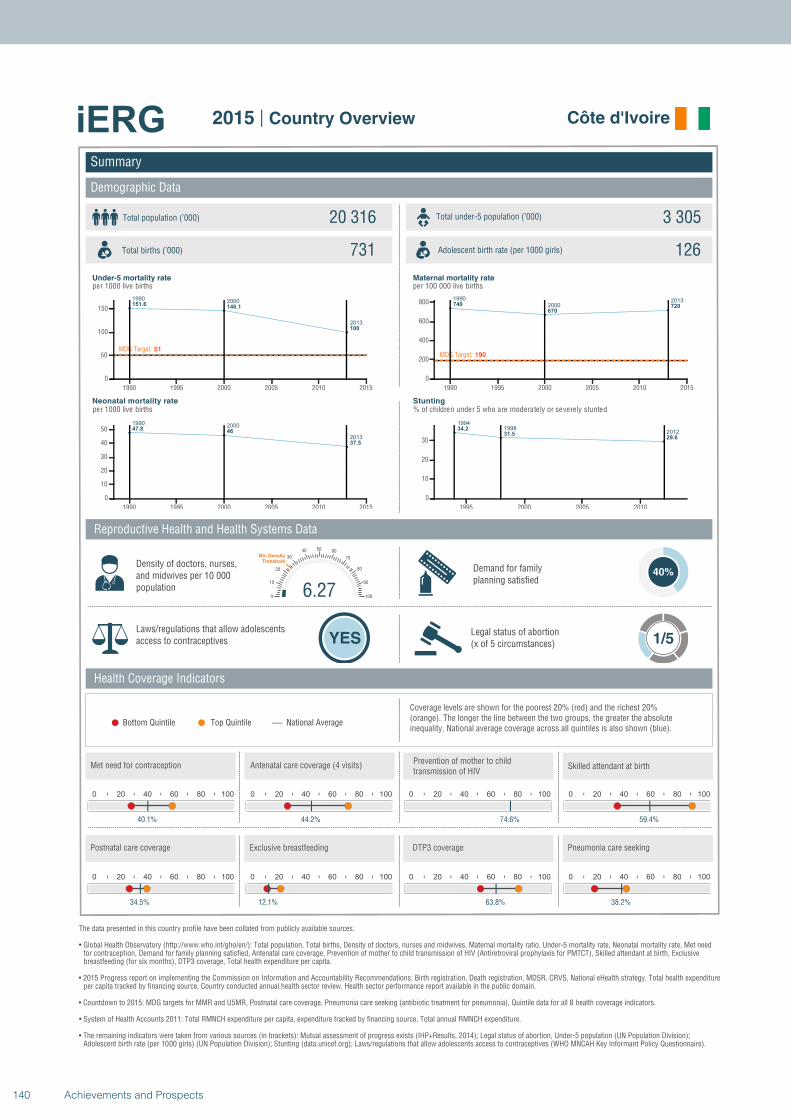
19902000
2013
151.6146.1
100
MDG Target: 51
1990 1995 2000 2005 2010 2015
0
50
100
150
19902000
2013
47.846
37.5
1990 1995 2000 2005 2010 2015
0
10
20
30
40
50
1990
20002013
740
670720
MDG Target: 190
1990 1995 2000 2005 2010 2015
0
200
400
600
800
19941998
201234.2
31.529.6
1995 2000 2005 2010
0
10
20
30
Summary
Demographic Data
Côte d'Ivoire
Total population (’000) Total under-5 population (’000)20 316 3 305
731 126
Reproductive Health and Health Systems Data
Health Coverage Indicators
Demand for familyplanning satisfied
40%
Laws/regulations that allow adolescents access to contraceptives YES
Legal status of abortion(x of 5 circumstances) 1/5
National AverageBottom Quintile Top Quintile
per 1000 live births per 100 000 live births
per 1000 live births % of children under 5 who are moderately or severely stunted
0 20 40 60 80 100
40.1%
0 20 40 60 80 100
44.2%
0 20 40 60 80 100
74.6%
6.270
10
20
30
40 50 60
70
80
90
100
Min Density Threshold
0 20 40 60 80 100
59.4%
0 20 40 60 80 100
34.5%
0 20 40 60 80 100
12.1%
0 20 40 60 80 100
63.8%
0 20 40 60 80 100
38.2%
Total births (’000) Adolescent birth rate (per 1000 girls)
Coverage levels are shown for the poorest 20% (red) and the richest 20% (orange). The longer the line between the two groups, the greater the absolute inequality. National average coverage across all quintiles is also shown (blue).
Density of doctors, nurses, and midwives per 10 000 population
Postnatal care coverage Exclusive breastfeeding DTP3 coverage Pneumonia care seeking
Met need for contraception Antenatal care coverage (4 visits)Prevention of mother to child transmission of HIV
Skilled attendant at birth
Under-5 mortality rate Maternal mortality rate
Neonatal mortality rate Stunting
The data presented in this country profile have been collated from publicly available sources.
• Global Health Observatory (http://www.who.int/gho/en/): Total population, Total births, Density of doctors, nurses and midwives, Maternal mortality ratio, Under-5 mortality rate, Neonatal mortality rate, Met need for contraception, Demand for family planning satisfied, Antenatal care coverage, Prevention of mother to child transmission of HIV (Antiretroviral prophylaxis for PMTCT), Skilled attendant at birth, Exclusive breastfeeding (for six months), DTP3 coverage, Total health expenditure per capita.
• 2015 Progress report on implementing the Commission on Information and Accountability Recommendations: Birth registration, Death registration, MDSR, CRVS, National eHealth strategy, Total health expenditureper capita tracked by financing source, Country conducted annual health sector review, Health sector performance report available in the public domain.
• Countdown to 2015: MDG targets for MMR and U5MR, Postnatal care coverage, Pneumonia care seeking (antibiotic treatment for pneumonia), Quintile data for all 8 health coverage indicators.
• System of Health Accounts 2011: Total RMNCH expenditure per capita, expenditure tracked by financing source, Total annual RMNCH expenditure.
• The remaining indicators were taken from various sources (in brackets): Mutual assessment of progress exists (IHP+Results, 2014); Legal status of abortion, Under-5 population (UN Population Division);Adolescent birth rate (per 1000 girls) (UN Population Division); Stunting (data.unicef.org); Laws/regulations that allow adolescents access to contraceptives (WHO MNCAH Key Informant Policy Questionnaire).
2015 | Country Overview
140 Achievements and Prospects
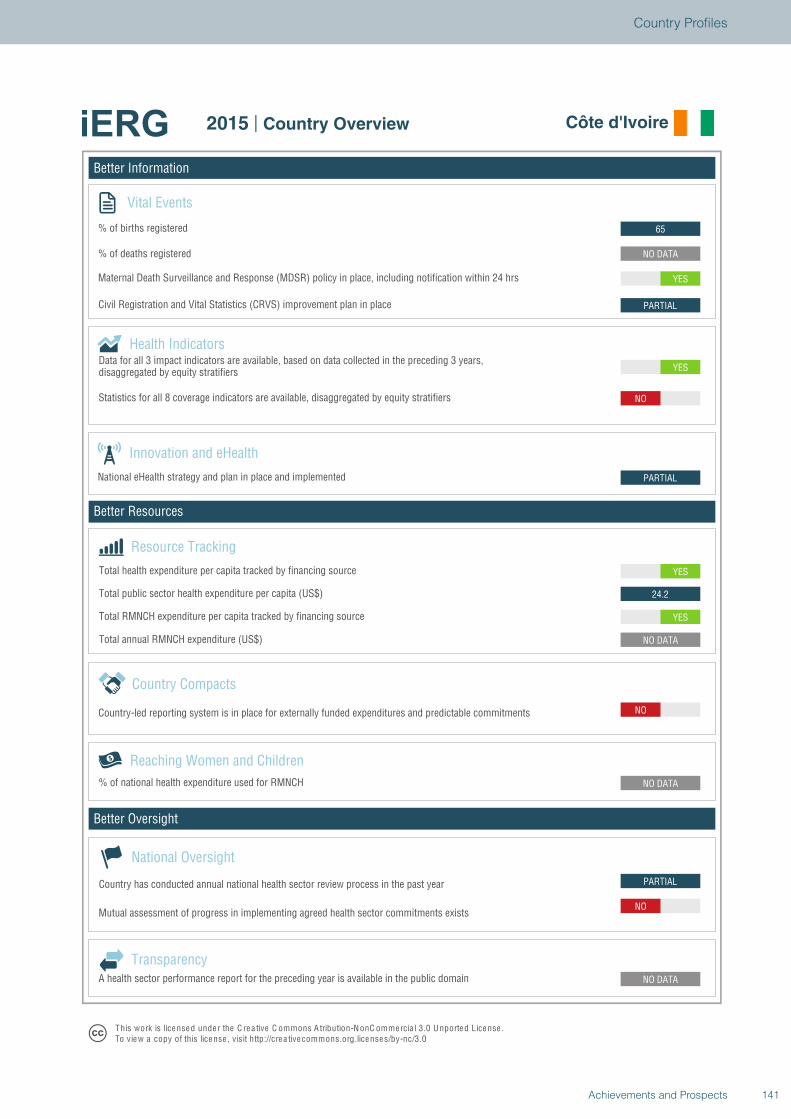
Better Information
Better Resources
Better Oversight
Côte d'Ivoire
Vital Events
% of births registered
% of deaths registered
Innovation and eHealth
National eHealth strategy and plan in place and implemented
Health Indicators
Statistics for all 8 coverage indicators are available, disaggregated by equity stratifiers
Reaching Women and Children
Country Compacts
Country-led reporting system is in place for externally funded expenditures and predictable commitments
Resource Tracking
Total RMNCH expenditure per capita tracked by financing source
Total annual RMNCH expenditure (US$)
Total health expenditure per capita tracked by financing source
% of national health expenditure used for RMNCH
PARTIAL
NO
NO DATA
NO DATA
NO
NO DATA
YES
24.2
YES
PARTIAL
YES
NO
PARTIAL
YES
NO DATA
65
National Oversight
Mutual assessment of progress in implementing agreed health sector commitments exists
Country has conducted annual national health sector review process in the past year
TransparencyA health sector performance report for the preceding year is available in the public domain
T his work is lice nse d unde r the C re a tive C ommons A tribution-N onC ommercia l 3.0 U nported License .To view a copy of this license , visit http://cre a tive commons.org.licenses/by-nc/3.0
2015 | Country Overview Côte d'Ivoire
Total public sector health expenditure per capita (US$)
Maternal Death Surveillance and Response (MDSR) policy in place, including notification within 24 hrs
Civil Registration and Vital Statistics (CRVS) improvement plan in place
Data for all 3 impact indicators are available, based on data collected in the preceding 3 years,disaggregated by equity stratifiers
141Achievements and Prospects
Country Profiles
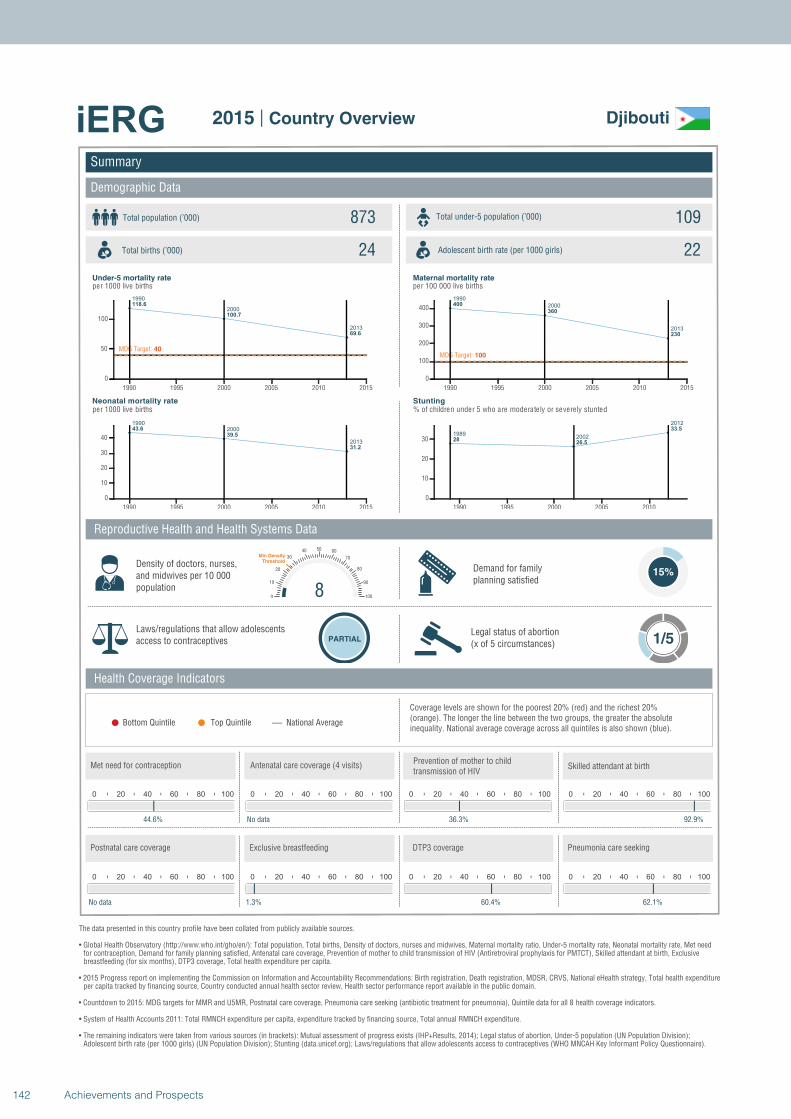
1990
2000
2013
118.6
100.7
69.6
MDG Target: 40
1990 1995 2000 2005 2010 2015
0
50
100
1990
2000
2013
43.6
39.5
31.2
1990 1995 2000 2005 2010 2015
0
10
20
30
40
1990
2000
2013
400
360
230
MDG Target: 100
1990 1995 2000 2005 2010 2015
0
100
200
300
400
19892002
2012
2826.5
33.5
1990 1995 2000 2005 2010
0
10
20
30
Summary
Demographic Data
Djibouti
Total population (’000) Total under-5 population (’000)873 109
24 22
Reproductive Health and Health Systems Data
Health Coverage Indicators
Demand for familyplanning satisfied
15%
Laws/regulations that allow adolescents access to contraceptives PARTIAL
Legal status of abortion(x of 5 circumstances) 1/5
National AverageBottom Quintile Top Quintile
per 1000 live births per 100 000 live births
per 1000 live births % of children under 5 who are moderately or severely stunted
0 20 40 60 80 100
44.6%
0 20 40 60 80 100
No data
0 20 40 60 80 100
36.3%
80
10
20
30
40 50 60
70
80
90
100
Min Density Threshold
0 20 40 60 80 100
92.9%
0 20 40 60 80 100
No data
0 20 40 60 80 100
1.3%
0 20 40 60 80 100
60.4%
0 20 40 60 80 100
62.1%
Total births (’000) Adolescent birth rate (per 1000 girls)
Coverage levels are shown for the poorest 20% (red) and the richest 20% (orange). The longer the line between the two groups, the greater the absolute inequality. National average coverage across all quintiles is also shown (blue).
Density of doctors, nurses, and midwives per 10 000 population
Postnatal care coverage Exclusive breastfeeding DTP3 coverage Pneumonia care seeking
Met need for contraception Antenatal care coverage (4 visits)Prevention of mother to child transmission of HIV
Skilled attendant at birth
Under-5 mortality rate Maternal mortality rate
Neonatal mortality rate Stunting
The data presented in this country profile have been collated from publicly available sources.
• Global Health Observatory (http://www.who.int/gho/en/): Total population, Total births, Density of doctors, nurses and midwives, Maternal mortality ratio, Under-5 mortality rate, Neonatal mortality rate, Met need for contraception, Demand for family planning satisfied, Antenatal care coverage, Prevention of mother to child transmission of HIV (Antiretroviral prophylaxis for PMTCT), Skilled attendant at birth, Exclusive breastfeeding (for six months), DTP3 coverage, Total health expenditure per capita.
• 2015 Progress report on implementing the Commission on Information and Accountability Recommendations: Birth registration, Death registration, MDSR, CRVS, National eHealth strategy, Total health expenditureper capita tracked by financing source, Country conducted annual health sector review, Health sector performance report available in the public domain.
• Countdown to 2015: MDG targets for MMR and U5MR, Postnatal care coverage, Pneumonia care seeking (antibiotic treatment for pneumonia), Quintile data for all 8 health coverage indicators.
• System of Health Accounts 2011: Total RMNCH expenditure per capita, expenditure tracked by financing source, Total annual RMNCH expenditure.
• The remaining indicators were taken from various sources (in brackets): Mutual assessment of progress exists (IHP+Results, 2014); Legal status of abortion, Under-5 population (UN Population Division);Adolescent birth rate (per 1000 girls) (UN Population Division); Stunting (data.unicef.org); Laws/regulations that allow adolescents access to contraceptives (WHO MNCAH Key Informant Policy Questionnaire).
2015 | Country Overview
142 Achievements and Prospects
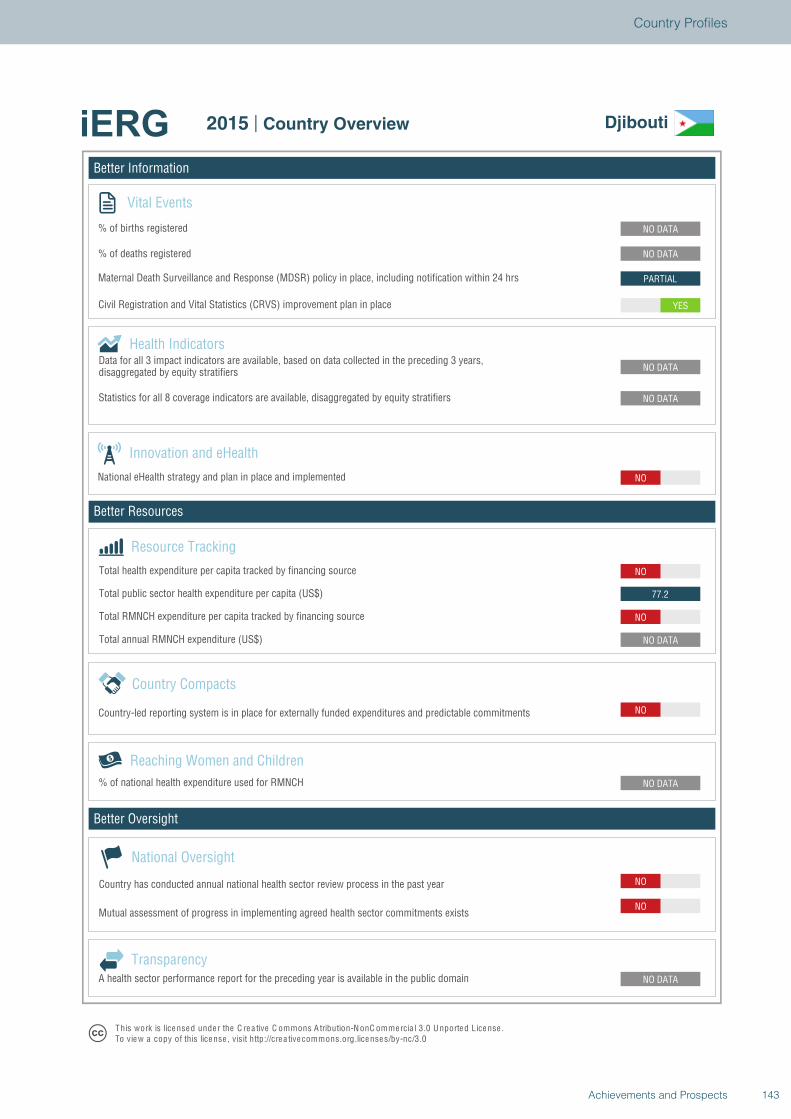
Better Information
Better Resources
Better Oversight
Djibouti
Vital Events
% of births registered
% of deaths registered
Innovation and eHealth
National eHealth strategy and plan in place and implemented
Health Indicators
Statistics for all 8 coverage indicators are available, disaggregated by equity stratifiers
Reaching Women and Children
Country Compacts
Country-led reporting system is in place for externally funded expenditures and predictable commitments
Resource Tracking
Total RMNCH expenditure per capita tracked by financing source
Total annual RMNCH expenditure (US$)
Total health expenditure per capita tracked by financing source
% of national health expenditure used for RMNCH
NO
NO
NO DATA
NO DATA
NO
NO DATA
NO
77.2
NO
NO
NO DATA
NO DATA
YES
PARTIAL
NO DATA
NO DATA
National Oversight
Mutual assessment of progress in implementing agreed health sector commitments exists
Country has conducted annual national health sector review process in the past year
TransparencyA health sector performance report for the preceding year is available in the public domain
T his work is lice nse d unde r the C re a tive C ommons A tribution-N onC ommercia l 3.0 U nported License .To view a copy of this license , visit http://cre a tive commons.org.licenses/by-nc/3.0
2015 | Country Overview Djibouti
Total public sector health expenditure per capita (US$)
Maternal Death Surveillance and Response (MDSR) policy in place, including notification within 24 hrs
Civil Registration and Vital Statistics (CRVS) improvement plan in place
Data for all 3 impact indicators are available, based on data collected in the preceding 3 years,disaggregated by equity stratifiers
143Achievements and Prospects
Country Profiles
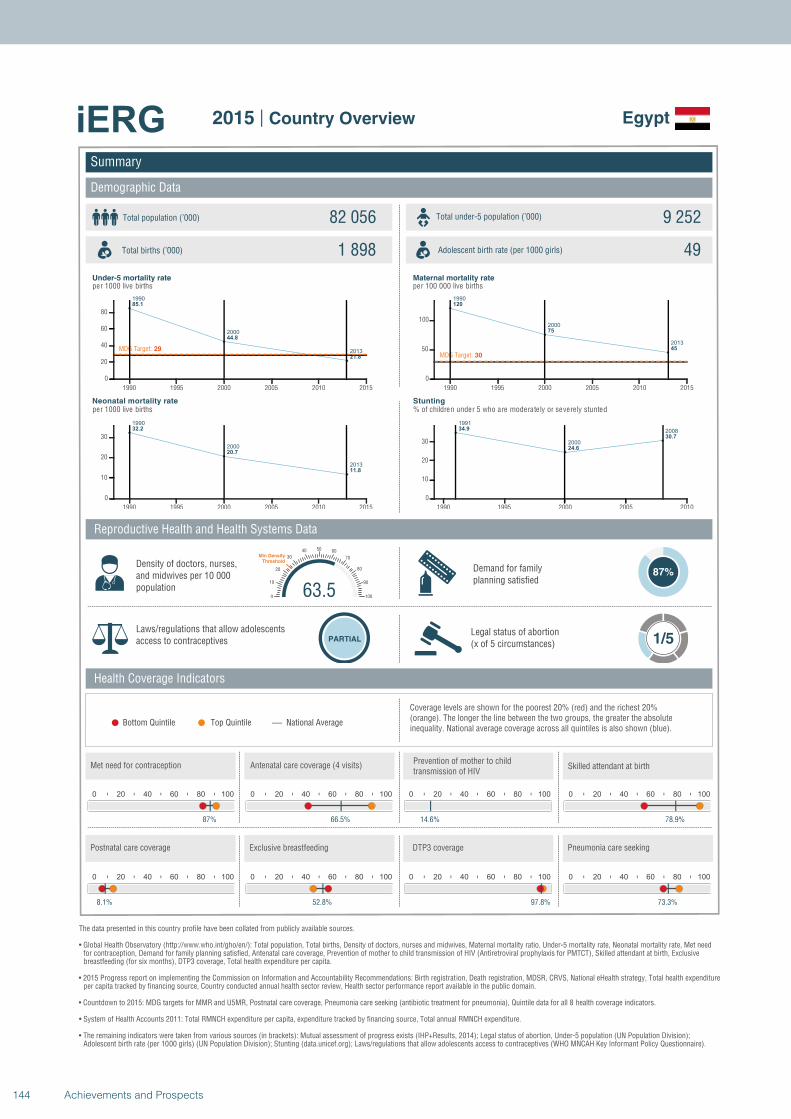
1990
2000
2013
85.1
44.8
21.8
MDG Target: 29
1990 1995 2000 2005 2010 2015
0
20
40
60
80
1990
2000
2013
32.2
20.7
11.8
1990 1995 2000 2005 2010 2015
0
10
20
30
1990
2000
2013
120
75
45
MDG Target: 30
1990 1995 2000 2005 2010 2015
0
50
100
1991
2000
200834.9
24.6
30.7
1990 1995 2000 2005 2010
0
10
20
30
Summary
Demographic Data
Egypt
Total population (’000) Total under-5 population (’000)82 056 9 252
1 898 49
Reproductive Health and Health Systems Data
Health Coverage Indicators
Demand for familyplanning satisfied
87%
Laws/regulations that allow adolescents access to contraceptives PARTIAL
Legal status of abortion(x of 5 circumstances) 1/5
National AverageBottom Quintile Top Quintile
per 1000 live births per 100 000 live births
per 1000 live births % of children under 5 who are moderately or severely stunted
0 20 40 60 80 100
87%
0 20 40 60 80 100
66.5%
0 20 40 60 80 100
14.6%
63.50
10
20
30
40 50 60
70
80
90
100
Min Density Threshold
0 20 40 60 80 100
78.9%
0 20 40 60 80 100
8.1%
0 20 40 60 80 100
52.8%
0 20 40 60 80 100
97.8%
0 20 40 60 80 100
73.3%
Total births (’000) Adolescent birth rate (per 1000 girls)
Coverage levels are shown for the poorest 20% (red) and the richest 20% (orange). The longer the line between the two groups, the greater the absolute inequality. National average coverage across all quintiles is also shown (blue).
Density of doctors, nurses, and midwives per 10 000 population
Postnatal care coverage Exclusive breastfeeding DTP3 coverage Pneumonia care seeking
Met need for contraception Antenatal care coverage (4 visits)Prevention of mother to child transmission of HIV
Skilled attendant at birth
Under-5 mortality rate Maternal mortality rate
Neonatal mortality rate Stunting
The data presented in this country profile have been collated from publicly available sources.
• Global Health Observatory (http://www.who.int/gho/en/): Total population, Total births, Density of doctors, nurses and midwives, Maternal mortality ratio, Under-5 mortality rate, Neonatal mortality rate, Met need for contraception, Demand for family planning satisfied, Antenatal care coverage, Prevention of mother to child transmission of HIV (Antiretroviral prophylaxis for PMTCT), Skilled attendant at birth, Exclusive breastfeeding (for six months), DTP3 coverage, Total health expenditure per capita.
• 2015 Progress report on implementing the Commission on Information and Accountability Recommendations: Birth registration, Death registration, MDSR, CRVS, National eHealth strategy, Total health expenditureper capita tracked by financing source, Country conducted annual health sector review, Health sector performance report available in the public domain.
• Countdown to 2015: MDG targets for MMR and U5MR, Postnatal care coverage, Pneumonia care seeking (antibiotic treatment for pneumonia), Quintile data for all 8 health coverage indicators.
• System of Health Accounts 2011: Total RMNCH expenditure per capita, expenditure tracked by financing source, Total annual RMNCH expenditure.
• The remaining indicators were taken from various sources (in brackets): Mutual assessment of progress exists (IHP+Results, 2014); Legal status of abortion, Under-5 population (UN Population Division);Adolescent birth rate (per 1000 girls) (UN Population Division); Stunting (data.unicef.org); Laws/regulations that allow adolescents access to contraceptives (WHO MNCAH Key Informant Policy Questionnaire).
2015 | Country Overview
144 Achievements and Prospects
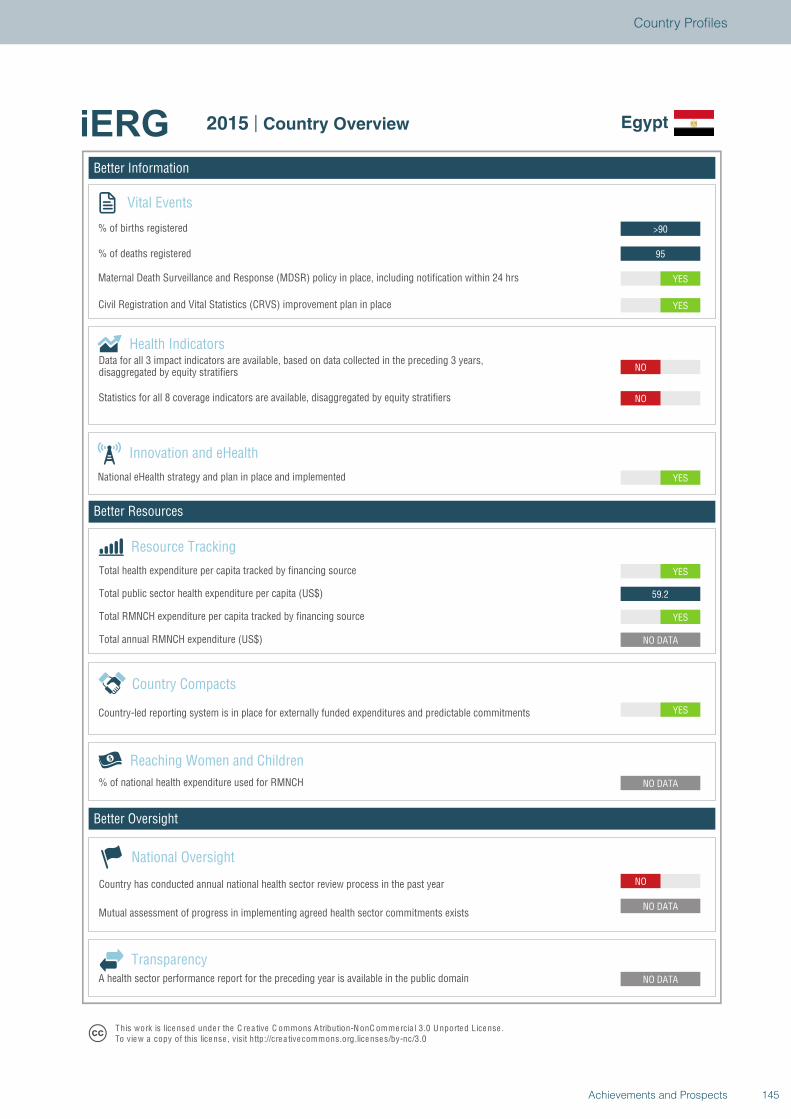
Better Information
Better Resources
Better Oversight
Egypt
Vital Events
% of births registered
% of deaths registered
Innovation and eHealth
National eHealth strategy and plan in place and implemented
Health Indicators
Statistics for all 8 coverage indicators are available, disaggregated by equity stratifiers
Reaching Women and Children
Country Compacts
Country-led reporting system is in place for externally funded expenditures and predictable commitments
Resource Tracking
Total RMNCH expenditure per capita tracked by financing source
Total annual RMNCH expenditure (US$)
Total health expenditure per capita tracked by financing source
% of national health expenditure used for RMNCH
NO
NO DATA
NO DATA
NO DATA
YES
NO DATA
YES
59.2
YES
YES
NO
NO
YES
YES
95
>90
National Oversight
Mutual assessment of progress in implementing agreed health sector commitments exists
Country has conducted annual national health sector review process in the past year
TransparencyA health sector performance report for the preceding year is available in the public domain
T his work is lice nse d unde r the C re a tive C ommons A tribution-N onC ommercia l 3.0 U nported License .To view a copy of this license , visit http://cre a tive commons.org.licenses/by-nc/3.0
2015 | Country Overview Egypt
Total public sector health expenditure per capita (US$)
Maternal Death Surveillance and Response (MDSR) policy in place, including notification within 24 hrs
Civil Registration and Vital Statistics (CRVS) improvement plan in place
Data for all 3 impact indicators are available, based on data collected in the preceding 3 years,disaggregated by equity stratifiers
145Achievements and Prospects
Country Profiles
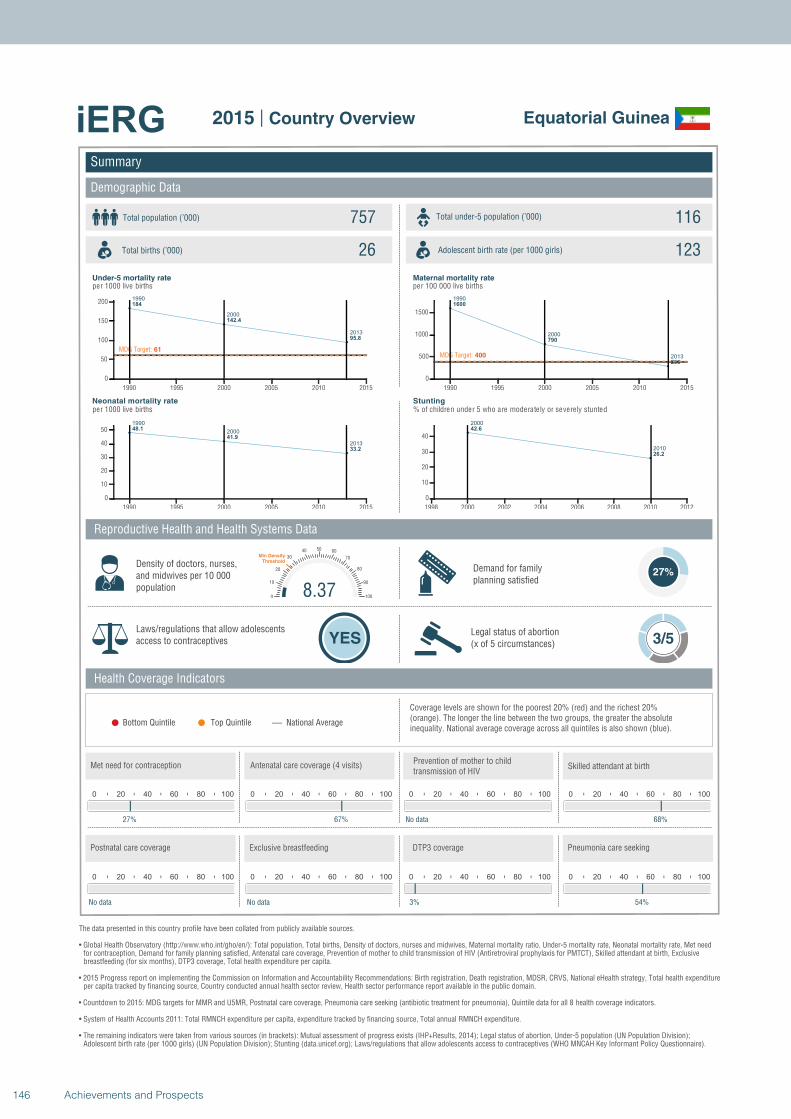
1990
2000
2013
184
142.4
95.8
MDG Target: 61
1990 1995 2000 2005 2010 2015
0
50
100
150
200
1990
2000
2013
48.1
41.9
33.2
1990 1995 2000 2005 2010 2015
0
10
20
30
40
50
1990
2000
2013
1600
790
290
MDG Target: 400
1990 1995 2000 2005 2010 2015
0
500
1000
1500
2000
2010
42.6
26.2
1998 2000 2002 2004 2006 2008 2010 2012
0
10
20
30
40
Summary
Demographic Data
Equatorial Guinea
Total population (’000) Total under-5 population (’000)757 116
26 123
Reproductive Health and Health Systems Data
Health Coverage Indicators
Demand for familyplanning satisfied
27%
Laws/regulations that allow adolescents access to contraceptives YES
Legal status of abortion(x of 5 circumstances) 3/5
National AverageBottom Quintile Top Quintile
per 1000 live births per 100 000 live births
per 1000 live births % of children under 5 who are moderately or severely stunted
0 20 40 60 80 100
27%
0 20 40 60 80 100
67%
0 20 40 60 80 100
No data
8.370
10
20
30
40 50 60
70
80
90
100
Min Density Threshold
0 20 40 60 80 100
68%
0 20 40 60 80 100
No data
0 20 40 60 80 100
No data
0 20 40 60 80 100
3%
0 20 40 60 80 100
54%
Total births (’000) Adolescent birth rate (per 1000 girls)
Coverage levels are shown for the poorest 20% (red) and the richest 20% (orange). The longer the line between the two groups, the greater the absolute inequality. National average coverage across all quintiles is also shown (blue).
Density of doctors, nurses, and midwives per 10 000 population
Postnatal care coverage Exclusive breastfeeding DTP3 coverage Pneumonia care seeking
Met need for contraception Antenatal care coverage (4 visits)Prevention of mother to child transmission of HIV
Skilled attendant at birth
Under-5 mortality rate Maternal mortality rate
Neonatal mortality rate Stunting
The data presented in this country profile have been collated from publicly available sources.
• Global Health Observatory (http://www.who.int/gho/en/): Total population, Total births, Density of doctors, nurses and midwives, Maternal mortality ratio, Under-5 mortality rate, Neonatal mortality rate, Met need for contraception, Demand for family planning satisfied, Antenatal care coverage, Prevention of mother to child transmission of HIV (Antiretroviral prophylaxis for PMTCT), Skilled attendant at birth, Exclusive breastfeeding (for six months), DTP3 coverage, Total health expenditure per capita.
• 2015 Progress report on implementing the Commission on Information and Accountability Recommendations: Birth registration, Death registration, MDSR, CRVS, National eHealth strategy, Total health expenditureper capita tracked by financing source, Country conducted annual health sector review, Health sector performance report available in the public domain.
• Countdown to 2015: MDG targets for MMR and U5MR, Postnatal care coverage, Pneumonia care seeking (antibiotic treatment for pneumonia), Quintile data for all 8 health coverage indicators.
• System of Health Accounts 2011: Total RMNCH expenditure per capita, expenditure tracked by financing source, Total annual RMNCH expenditure.
• The remaining indicators were taken from various sources (in brackets): Mutual assessment of progress exists (IHP+Results, 2014); Legal status of abortion, Under-5 population (UN Population Division);Adolescent birth rate (per 1000 girls) (UN Population Division); Stunting (data.unicef.org); Laws/regulations that allow adolescents access to contraceptives (WHO MNCAH Key Informant Policy Questionnaire).
2015 | Country Overview
146 Achievements and Prospects
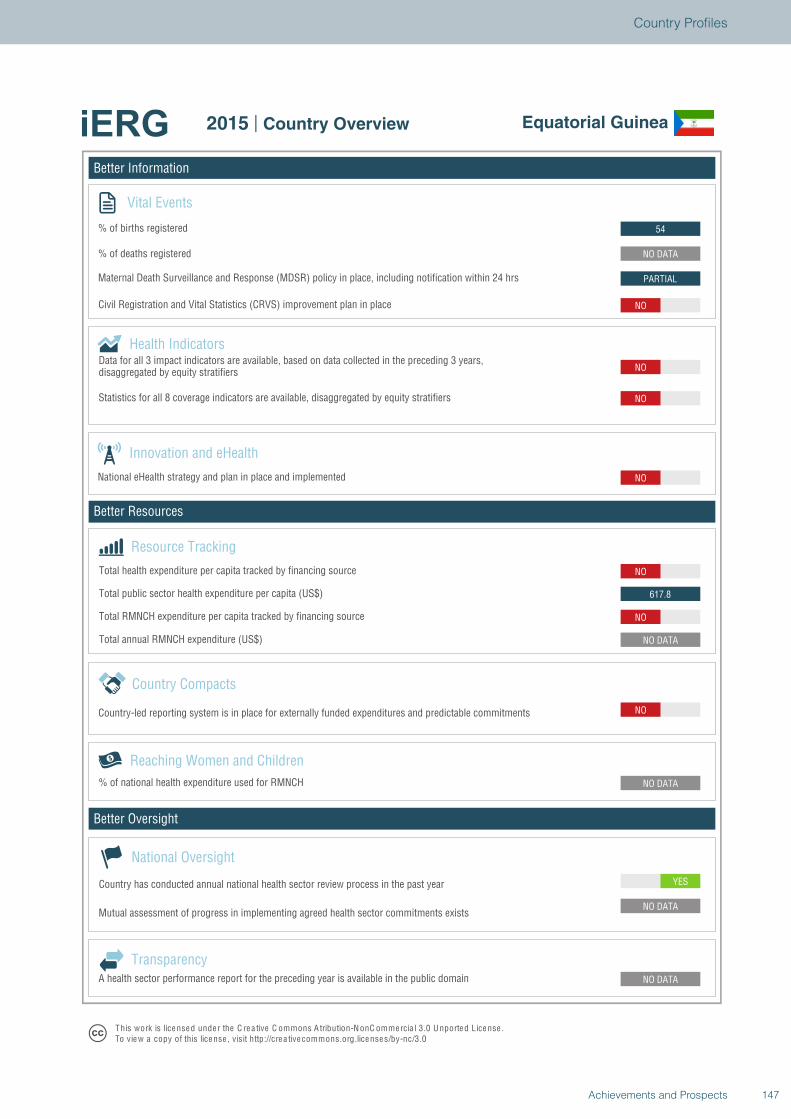
Better Information
Better Resources
Better Oversight
Equatorial Guinea
Vital Events
% of births registered
% of deaths registered
Innovation and eHealth
National eHealth strategy and plan in place and implemented
Health Indicators
Statistics for all 8 coverage indicators are available, disaggregated by equity stratifiers
Reaching Women and Children
Country Compacts
Country-led reporting system is in place for externally funded expenditures and predictable commitments
Resource Tracking
Total RMNCH expenditure per capita tracked by financing source
Total annual RMNCH expenditure (US$)
Total health expenditure per capita tracked by financing source
% of national health expenditure used for RMNCH
YES
NO DATA
NO DATA
NO DATA
NO
NO DATA
NO
617.8
NO
NO
NO
NO
NO
PARTIAL
NO DATA
54
National Oversight
Mutual assessment of progress in implementing agreed health sector commitments exists
Country has conducted annual national health sector review process in the past year
TransparencyA health sector performance report for the preceding year is available in the public domain
T his work is lice nse d unde r the C re a tive C ommons A tribution-N onC ommercia l 3.0 U nported License .To view a copy of this license , visit http://cre a tive commons.org.licenses/by-nc/3.0
2015 | Country Overview Equatorial Guinea
Total public sector health expenditure per capita (US$)
Maternal Death Surveillance and Response (MDSR) policy in place, including notification within 24 hrs
Civil Registration and Vital Statistics (CRVS) improvement plan in place
Data for all 3 impact indicators are available, based on data collected in the preceding 3 years,disaggregated by equity stratifiers
147Achievements and Prospects
Country Profiles
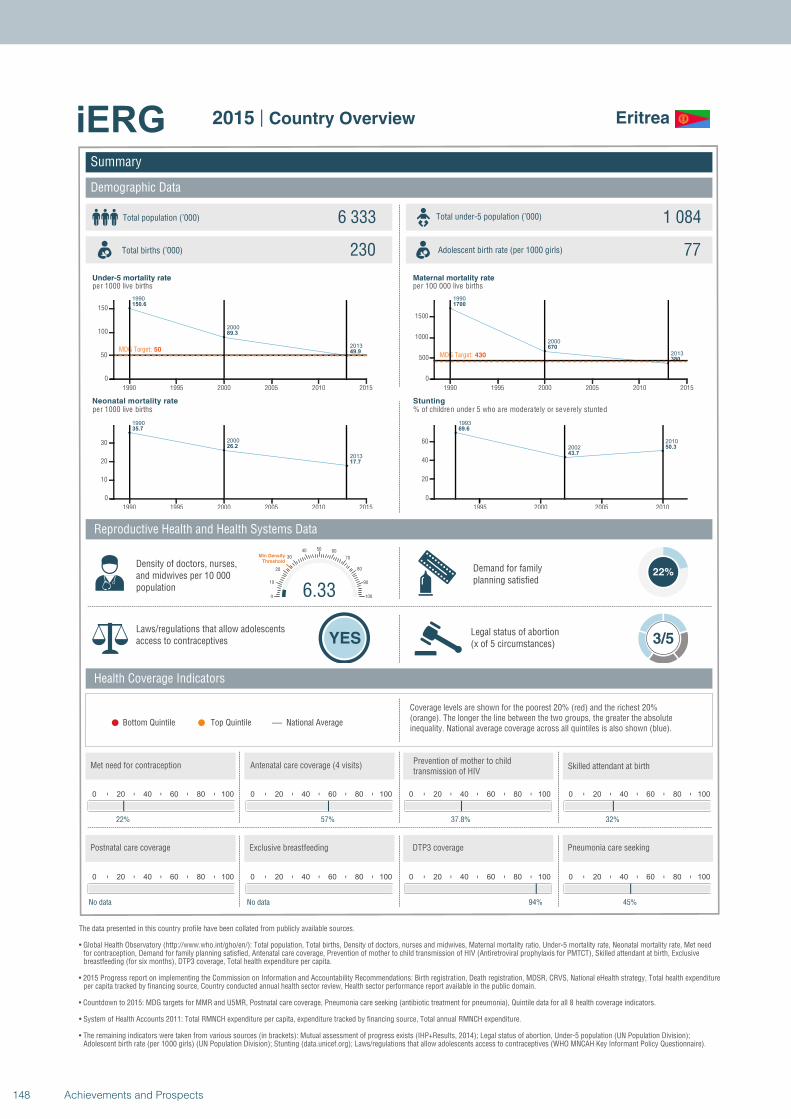
1990
2000
2013
150.6
89.3
49.9MDG Target: 50
1990 1995 2000 2005 2010 2015
0
50
100
150
1990
2000
2013
35.7
26.2
17.7
1990 1995 2000 2005 2010 2015
0
10
20
30
1990
2000
2013
1700
670
380MDG Target: 430
1990 1995 2000 2005 2010 2015
0
500
1000
1500
1993
2002
2010
69.6
43.7
50.3
1995 2000 2005 2010
0
20
40
60
Summary
Demographic Data
Eritrea
Total population (’000) Total under-5 population (’000)6 333 1 084
230 77
Reproductive Health and Health Systems Data
Health Coverage Indicators
Demand for familyplanning satisfied
22%
Laws/regulations that allow adolescents access to contraceptives YES
Legal status of abortion(x of 5 circumstances) 3/5
National AverageBottom Quintile Top Quintile
per 1000 live births per 100 000 live births
per 1000 live births % of children under 5 who are moderately or severely stunted
0 20 40 60 80 100
22%
0 20 40 60 80 100
57%
0 20 40 60 80 100
37.8%
6.330
10
20
30
40 50 60
70
80
90
100
Min Density Threshold
0 20 40 60 80 100
32%
0 20 40 60 80 100
No data
0 20 40 60 80 100
No data
0 20 40 60 80 100
94%
0 20 40 60 80 100
45%
Total births (’000) Adolescent birth rate (per 1000 girls)
Coverage levels are shown for the poorest 20% (red) and the richest 20% (orange). The longer the line between the two groups, the greater the absolute inequality. National average coverage across all quintiles is also shown (blue).
Density of doctors, nurses, and midwives per 10 000 population
Postnatal care coverage Exclusive breastfeeding DTP3 coverage Pneumonia care seeking
Met need for contraception Antenatal care coverage (4 visits)Prevention of mother to child transmission of HIV
Skilled attendant at birth
Under-5 mortality rate Maternal mortality rate
Neonatal mortality rate Stunting
The data presented in this country profile have been collated from publicly available sources.
• Global Health Observatory (http://www.who.int/gho/en/): Total population, Total births, Density of doctors, nurses and midwives, Maternal mortality ratio, Under-5 mortality rate, Neonatal mortality rate, Met need for contraception, Demand for family planning satisfied, Antenatal care coverage, Prevention of mother to child transmission of HIV (Antiretroviral prophylaxis for PMTCT), Skilled attendant at birth, Exclusive breastfeeding (for six months), DTP3 coverage, Total health expenditure per capita.
• 2015 Progress report on implementing the Commission on Information and Accountability Recommendations: Birth registration, Death registration, MDSR, CRVS, National eHealth strategy, Total health expenditureper capita tracked by financing source, Country conducted annual health sector review, Health sector performance report available in the public domain.
• Countdown to 2015: MDG targets for MMR and U5MR, Postnatal care coverage, Pneumonia care seeking (antibiotic treatment for pneumonia), Quintile data for all 8 health coverage indicators.
• System of Health Accounts 2011: Total RMNCH expenditure per capita, expenditure tracked by financing source, Total annual RMNCH expenditure.
• The remaining indicators were taken from various sources (in brackets): Mutual assessment of progress exists (IHP+Results, 2014); Legal status of abortion, Under-5 population (UN Population Division);Adolescent birth rate (per 1000 girls) (UN Population Division); Stunting (data.unicef.org); Laws/regulations that allow adolescents access to contraceptives (WHO MNCAH Key Informant Policy Questionnaire).
2015 | Country Overview
148 Achievements and Prospects
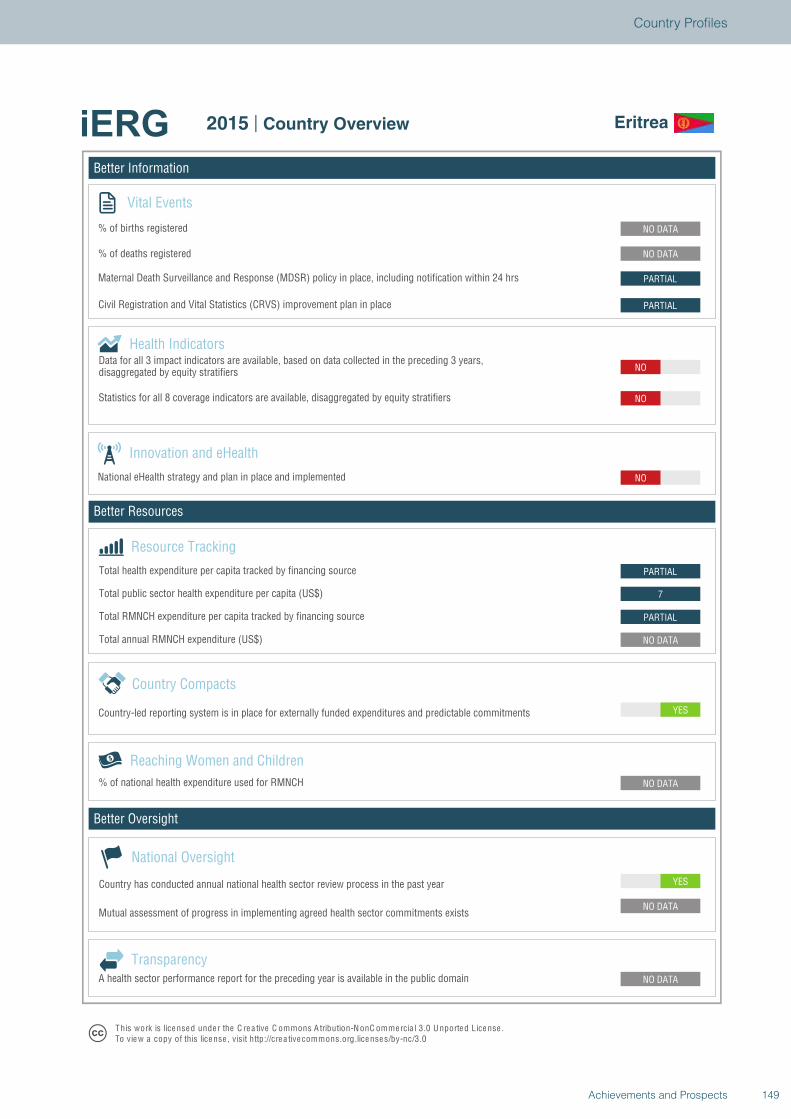
Better Information
Better Resources
Better Oversight
Eritrea
Vital Events
% of births registered
% of deaths registered
Innovation and eHealth
National eHealth strategy and plan in place and implemented
Health Indicators
Statistics for all 8 coverage indicators are available, disaggregated by equity stratifiers
Reaching Women and Children
Country Compacts
Country-led reporting system is in place for externally funded expenditures and predictable commitments
Resource Tracking
Total RMNCH expenditure per capita tracked by financing source
Total annual RMNCH expenditure (US$)
Total health expenditure per capita tracked by financing source
% of national health expenditure used for RMNCH
YES
NO DATA
NO DATA
NO DATA
YES
NO DATA
PARTIAL
7
PARTIAL
NO
NO
NO
PARTIAL
PARTIAL
NO DATA
NO DATA
National Oversight
Mutual assessment of progress in implementing agreed health sector commitments exists
Country has conducted annual national health sector review process in the past year
TransparencyA health sector performance report for the preceding year is available in the public domain
T his work is lice nse d unde r the C re a tive C ommons A tribution-N onC ommercia l 3.0 U nported License .To view a copy of this license , visit http://cre a tive commons.org.licenses/by-nc/3.0
2015 | Country Overview Eritrea
Total public sector health expenditure per capita (US$)
Maternal Death Surveillance and Response (MDSR) policy in place, including notification within 24 hrs
Civil Registration and Vital Statistics (CRVS) improvement plan in place
Data for all 3 impact indicators are available, based on data collected in the preceding 3 years,disaggregated by equity stratifiers
149Achievements and Prospects
Country Profiles
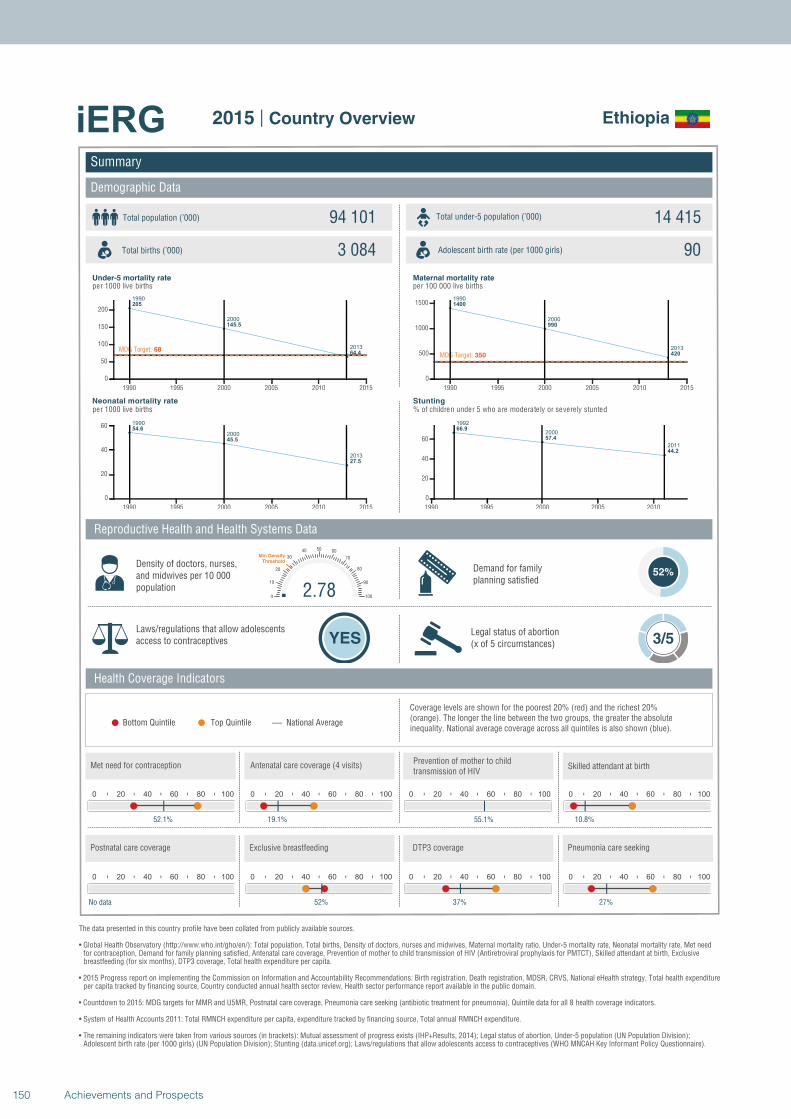
1990
2000
2013
205
145.5
64.4MDG Target: 68
1990 1995 2000 2005 2010 2015
0
50
100
150
200
1990
2000
2013
54.6
45.5
27.5
1990 1995 2000 2005 2010 2015
0
20
40
60
1990
2000
2013
1400
990
420MDG Target: 350
1990 1995 2000 2005 2010 2015
0
500
1000
1500
1992
2000
2011
66.9
57.4
44.2
1990 1995 2000 2005 2010
0
20
40
60
Summary
Demographic Data
Ethiopia
Total population (’000) Total under-5 population (’000)94 101 14 415
3 084 90
Reproductive Health and Health Systems Data
Health Coverage Indicators
Demand for familyplanning satisfied
52%
Laws/regulations that allow adolescents access to contraceptives YES
Legal status of abortion(x of 5 circumstances) 3/5
National AverageBottom Quintile Top Quintile
per 1000 live births per 100 000 live births
per 1000 live births % of children under 5 who are moderately or severely stunted
0 20 40 60 80 100
52.1%
0 20 40 60 80 100
19.1%
0 20 40 60 80 100
55.1%
2.780
10
20
30
40 50 60
70
80
90
100
Min Density Threshold
0 20 40 60 80 100
10.8%
0 20 40 60 80 100
No data
0 20 40 60 80 100
52%
0 20 40 60 80 100
37%
0 20 40 60 80 100
27%
Total births (’000) Adolescent birth rate (per 1000 girls)
Coverage levels are shown for the poorest 20% (red) and the richest 20% (orange). The longer the line between the two groups, the greater the absolute inequality. National average coverage across all quintiles is also shown (blue).
Density of doctors, nurses, and midwives per 10 000 population
Postnatal care coverage Exclusive breastfeeding DTP3 coverage Pneumonia care seeking
Met need for contraception Antenatal care coverage (4 visits)Prevention of mother to child transmission of HIV
Skilled attendant at birth
Under-5 mortality rate Maternal mortality rate
Neonatal mortality rate Stunting
The data presented in this country profile have been collated from publicly available sources.
• Global Health Observatory (http://www.who.int/gho/en/): Total population, Total births, Density of doctors, nurses and midwives, Maternal mortality ratio, Under-5 mortality rate, Neonatal mortality rate, Met need for contraception, Demand for family planning satisfied, Antenatal care coverage, Prevention of mother to child transmission of HIV (Antiretroviral prophylaxis for PMTCT), Skilled attendant at birth, Exclusive breastfeeding (for six months), DTP3 coverage, Total health expenditure per capita.
• 2015 Progress report on implementing the Commission on Information and Accountability Recommendations: Birth registration, Death registration, MDSR, CRVS, National eHealth strategy, Total health expenditureper capita tracked by financing source, Country conducted annual health sector review, Health sector performance report available in the public domain.
• Countdown to 2015: MDG targets for MMR and U5MR, Postnatal care coverage, Pneumonia care seeking (antibiotic treatment for pneumonia), Quintile data for all 8 health coverage indicators.
• System of Health Accounts 2011: Total RMNCH expenditure per capita, expenditure tracked by financing source, Total annual RMNCH expenditure.
• The remaining indicators were taken from various sources (in brackets): Mutual assessment of progress exists (IHP+Results, 2014); Legal status of abortion, Under-5 population (UN Population Division);Adolescent birth rate (per 1000 girls) (UN Population Division); Stunting (data.unicef.org); Laws/regulations that allow adolescents access to contraceptives (WHO MNCAH Key Informant Policy Questionnaire).
2015 | Country Overview
150 Achievements and Prospects
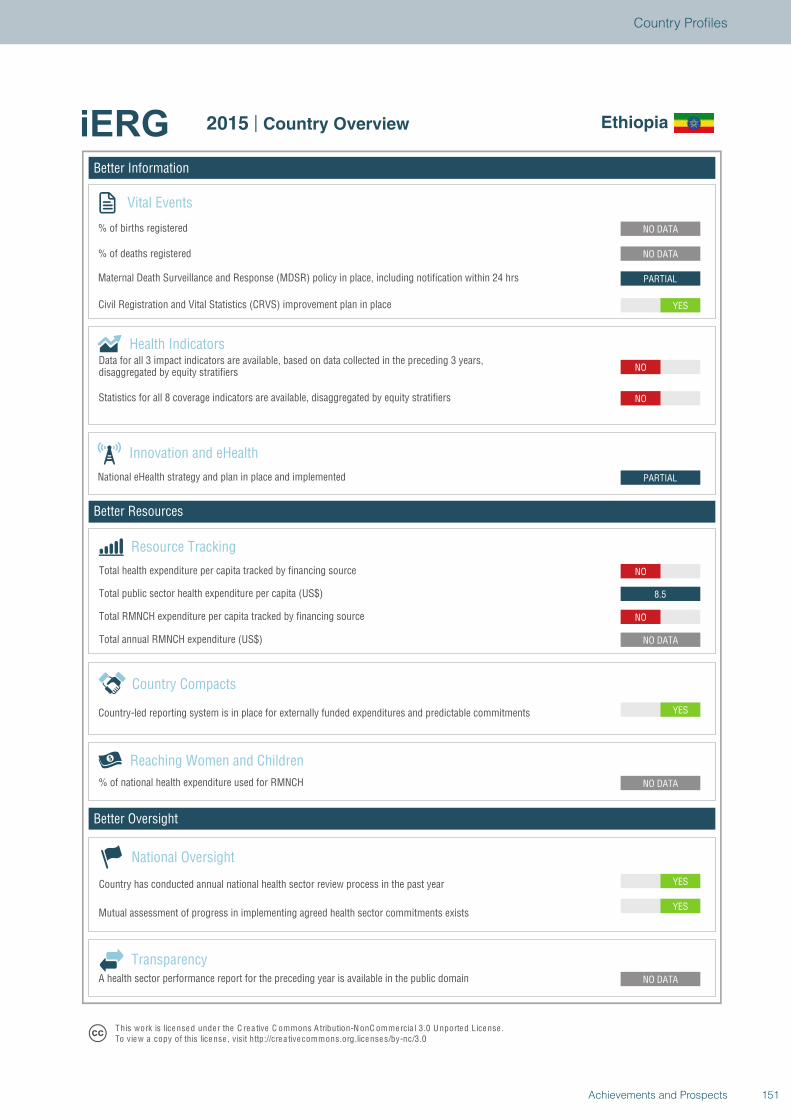
Better Information
Better Resources
Better Oversight
Ethiopia
Vital Events
% of births registered
% of deaths registered
Innovation and eHealth
National eHealth strategy and plan in place and implemented
Health Indicators
Statistics for all 8 coverage indicators are available, disaggregated by equity stratifiers
Reaching Women and Children
Country Compacts
Country-led reporting system is in place for externally funded expenditures and predictable commitments
Resource Tracking
Total RMNCH expenditure per capita tracked by financing source
Total annual RMNCH expenditure (US$)
Total health expenditure per capita tracked by financing source
% of national health expenditure used for RMNCH
YES
YES
NO DATA
NO DATA
YES
NO DATA
NO
8.5
NO
PARTIAL
NO
NO
YES
PARTIAL
NO DATA
NO DATA
National Oversight
Mutual assessment of progress in implementing agreed health sector commitments exists
Country has conducted annual national health sector review process in the past year
TransparencyA health sector performance report for the preceding year is available in the public domain
T his work is lice nse d unde r the C re a tive C ommons A tribution-N onC ommercia l 3.0 U nported License .To view a copy of this license , visit http://cre a tive commons.org.licenses/by-nc/3.0
2015 | Country Overview Ethiopia
Total public sector health expenditure per capita (US$)
Maternal Death Surveillance and Response (MDSR) policy in place, including notification within 24 hrs
Civil Registration and Vital Statistics (CRVS) improvement plan in place
Data for all 3 impact indicators are available, based on data collected in the preceding 3 years,disaggregated by equity stratifiers
151Achievements and Prospects
Country Profiles
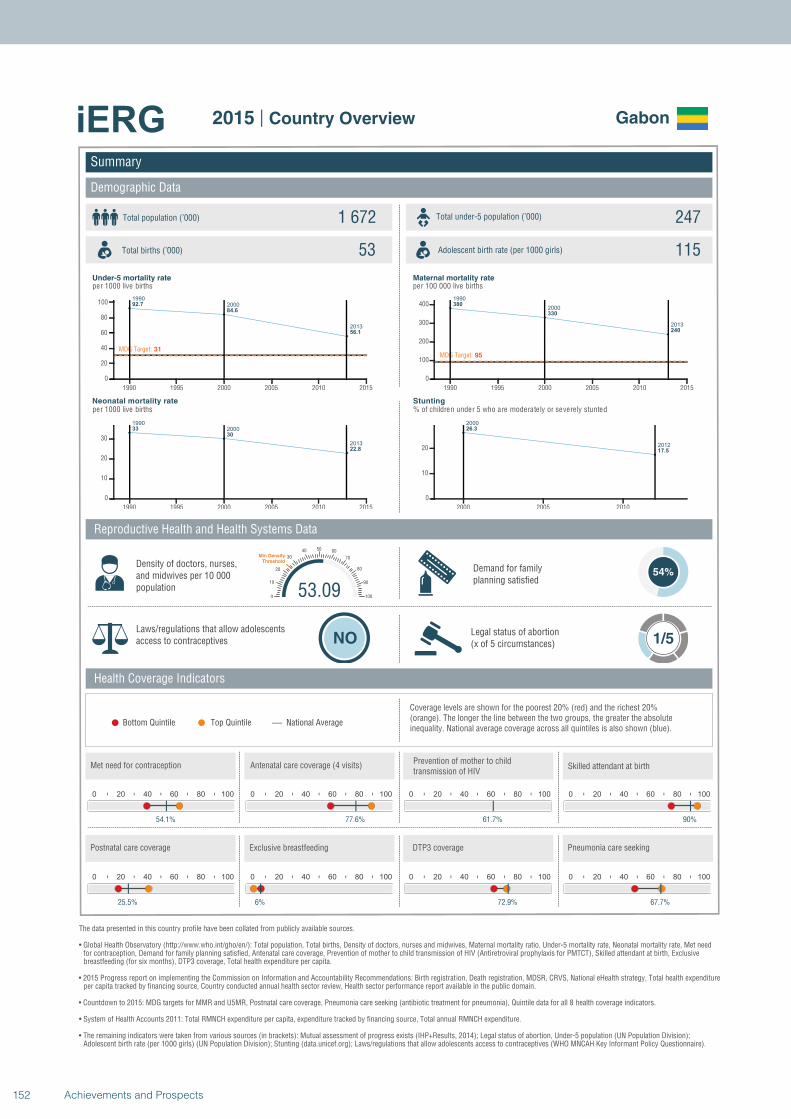
1990
2000
2013
92.7
84.6
56.1
MDG Target: 31
1990 1995 2000 2005 2010 2015
0
20
40
60
80
100
1990
2000
2013
33
30
22.8
1990 1995 2000 2005 2010 2015
0
10
20
30
1990
2000
2013
380
330
240
MDG Target: 95
1990 1995 2000 2005 2010 2015
0
100
200
300
400
2000
2012
26.3
17.5
2000 2005 2010
0
10
20
Summary
Demographic Data
Gabon
Total population (’000) Total under-5 population (’000)1 672 247
53 115
Reproductive Health and Health Systems Data
Health Coverage Indicators
Demand for familyplanning satisfied
54%
Laws/regulations that allow adolescents access to contraceptives NO
Legal status of abortion(x of 5 circumstances) 1/5
National AverageBottom Quintile Top Quintile
per 1000 live births per 100 000 live births
per 1000 live births % of children under 5 who are moderately or severely stunted
0 20 40 60 80 100
54.1%
0 20 40 60 80 100
77.6%
0 20 40 60 80 100
61.7%
53.090
10
20
30
40 50 60
70
80
90
100
Min Density Threshold
0 20 40 60 80 100
90%
0 20 40 60 80 100
25.5%
0 20 40 60 80 100
6%
0 20 40 60 80 100
72.9%
0 20 40 60 80 100
67.7%
Total births (’000) Adolescent birth rate (per 1000 girls)
Coverage levels are shown for the poorest 20% (red) and the richest 20% (orange). The longer the line between the two groups, the greater the absolute inequality. National average coverage across all quintiles is also shown (blue).
Density of doctors, nurses, and midwives per 10 000 population
Postnatal care coverage Exclusive breastfeeding DTP3 coverage Pneumonia care seeking
Met need for contraception Antenatal care coverage (4 visits)Prevention of mother to child transmission of HIV
Skilled attendant at birth
Under-5 mortality rate Maternal mortality rate
Neonatal mortality rate Stunting
The data presented in this country profile have been collated from publicly available sources.
• Global Health Observatory (http://www.who.int/gho/en/): Total population, Total births, Density of doctors, nurses and midwives, Maternal mortality ratio, Under-5 mortality rate, Neonatal mortality rate, Met need for contraception, Demand for family planning satisfied, Antenatal care coverage, Prevention of mother to child transmission of HIV (Antiretroviral prophylaxis for PMTCT), Skilled attendant at birth, Exclusive breastfeeding (for six months), DTP3 coverage, Total health expenditure per capita.
• 2015 Progress report on implementing the Commission on Information and Accountability Recommendations: Birth registration, Death registration, MDSR, CRVS, National eHealth strategy, Total health expenditureper capita tracked by financing source, Country conducted annual health sector review, Health sector performance report available in the public domain.
• Countdown to 2015: MDG targets for MMR and U5MR, Postnatal care coverage, Pneumonia care seeking (antibiotic treatment for pneumonia), Quintile data for all 8 health coverage indicators.
• System of Health Accounts 2011: Total RMNCH expenditure per capita, expenditure tracked by financing source, Total annual RMNCH expenditure.
• The remaining indicators were taken from various sources (in brackets): Mutual assessment of progress exists (IHP+Results, 2014); Legal status of abortion, Under-5 population (UN Population Division);Adolescent birth rate (per 1000 girls) (UN Population Division); Stunting (data.unicef.org); Laws/regulations that allow adolescents access to contraceptives (WHO MNCAH Key Informant Policy Questionnaire).
2015 | Country Overview
152 Achievements and Prospects
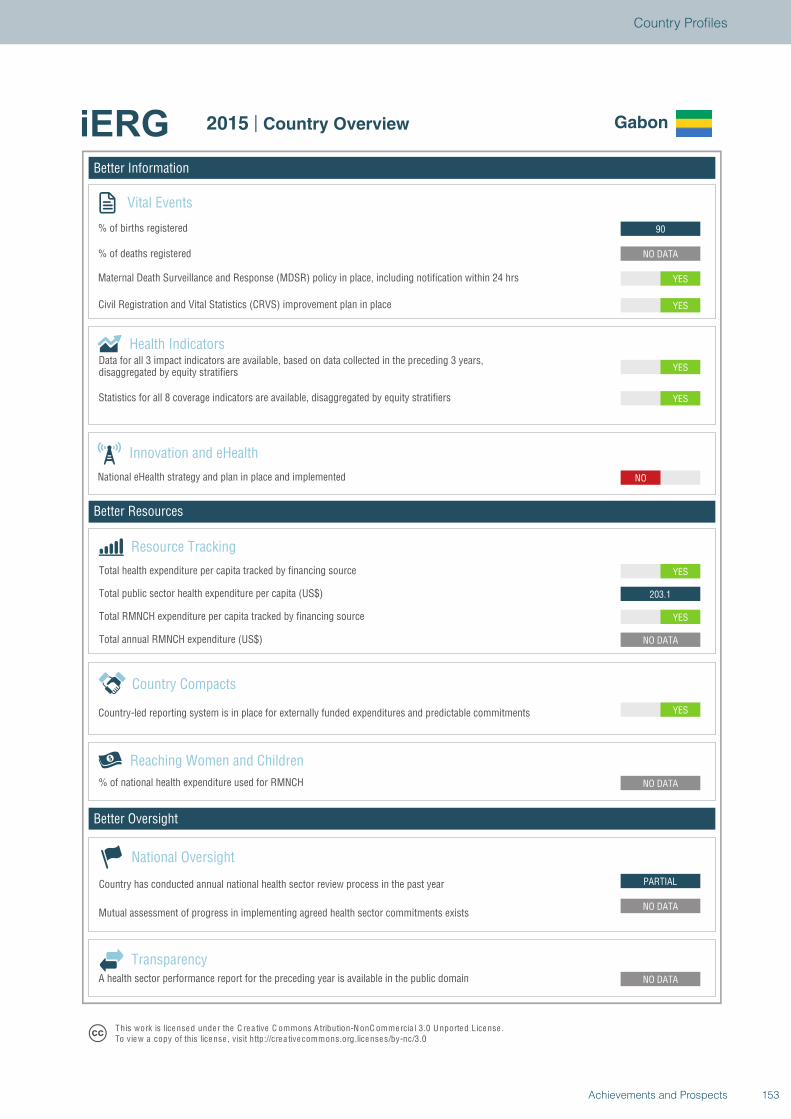
Better Information
Better Resources
Better Oversight
Gabon
Vital Events
% of births registered
% of deaths registered
Innovation and eHealth
National eHealth strategy and plan in place and implemented
Health Indicators
Statistics for all 8 coverage indicators are available, disaggregated by equity stratifiers
Reaching Women and Children
Country Compacts
Country-led reporting system is in place for externally funded expenditures and predictable commitments
Resource Tracking
Total RMNCH expenditure per capita tracked by financing source
Total annual RMNCH expenditure (US$)
Total health expenditure per capita tracked by financing source
% of national health expenditure used for RMNCH
PARTIAL
NO DATA
NO DATA
NO DATA
YES
NO DATA
YES
203.1
YES
NO
YES
YES
YES
YES
NO DATA
90
National Oversight
Mutual assessment of progress in implementing agreed health sector commitments exists
Country has conducted annual national health sector review process in the past year
TransparencyA health sector performance report for the preceding year is available in the public domain
T his work is lice nse d unde r the C re a tive C ommons A tribution-N onC ommercia l 3.0 U nported License .To view a copy of this license , visit http://cre a tive commons.org.licenses/by-nc/3.0
2015 | Country Overview Gabon
Total public sector health expenditure per capita (US$)
Maternal Death Surveillance and Response (MDSR) policy in place, including notification within 24 hrs
Civil Registration and Vital Statistics (CRVS) improvement plan in place
Data for all 3 impact indicators are available, based on data collected in the preceding 3 years,disaggregated by equity stratifiers
153Achievements and Prospects
Country Profiles

1990
2000
2013
169.8
119
73.8
MDG Target: 57
1990 1995 2000 2005 2010 2015
0
50
100
150
1990
2000
2013
46.1
37.8
28.1
1990 1995 2000 2005 2010 2015
0
10
20
30
40
50
1990
2000
2013
710
580
430
MDG Target: 180
1990 1995 2000 2005 2010 2015
0
200
400
600
1996
2000 2010
36.1
24.1 23.4
1995 2000 2005 2010
0
10
20
30
Summary
Demographic Data
Gambia
Total population (’000) Total under-5 population (’000)1 849 349
77 111
Reproductive Health and Health Systems Data
Health Coverage Indicators
Demand for familyplanning satisfied
38%
Laws/regulations that allow adolescents access to contraceptives YES
Legal status of abortion(x of 5 circumstances) 3/5
National AverageBottom Quintile Top Quintile
per 1000 live births per 100 000 live births
per 1000 live births % of children under 5 who are moderately or severely stunted
0 20 40 60 80 100
38%
0 20 40 60 80 100
72%
0 20 40 60 80 100
84.4%
9.720
10
20
30
40 50 60
70
80
90
100
Min Density Threshold
0 20 40 60 80 100
56.8%
0 20 40 60 80 100
No data
0 20 40 60 80 100
40.8%
0 20 40 60 80 100
86.3%
0 20 40 60 80 100
68.9%
Total births (’000) Adolescent birth rate (per 1000 girls)
Coverage levels are shown for the poorest 20% (red) and the richest 20% (orange). The longer the line between the two groups, the greater the absolute inequality. National average coverage across all quintiles is also shown (blue).
Density of doctors, nurses, and midwives per 10 000 population
Postnatal care coverage Exclusive breastfeeding DTP3 coverage Pneumonia care seeking
Met need for contraception Antenatal care coverage (4 visits)Prevention of mother to child transmission of HIV
Skilled attendant at birth
Under-5 mortality rate Maternal mortality rate
Neonatal mortality rate Stunting
The data presented in this country profile have been collated from publicly available sources.
• Global Health Observatory (http://www.who.int/gho/en/): Total population, Total births, Density of doctors, nurses and midwives, Maternal mortality ratio, Under-5 mortality rate, Neonatal mortality rate, Met need for contraception, Demand for family planning satisfied, Antenatal care coverage, Prevention of mother to child transmission of HIV (Antiretroviral prophylaxis for PMTCT), Skilled attendant at birth, Exclusive breastfeeding (for six months), DTP3 coverage, Total health expenditure per capita.
• 2015 Progress report on implementing the Commission on Information and Accountability Recommendations: Birth registration, Death registration, MDSR, CRVS, National eHealth strategy, Total health expenditureper capita tracked by financing source, Country conducted annual health sector review, Health sector performance report available in the public domain.
• Countdown to 2015: MDG targets for MMR and U5MR, Postnatal care coverage, Pneumonia care seeking (antibiotic treatment for pneumonia), Quintile data for all 8 health coverage indicators.
• System of Health Accounts 2011: Total RMNCH expenditure per capita, expenditure tracked by financing source, Total annual RMNCH expenditure.
• The remaining indicators were taken from various sources (in brackets): Mutual assessment of progress exists (IHP+Results, 2014); Legal status of abortion, Under-5 population (UN Population Division);Adolescent birth rate (per 1000 girls) (UN Population Division); Stunting (data.unicef.org); Laws/regulations that allow adolescents access to contraceptives (WHO MNCAH Key Informant Policy Questionnaire).
2015 | Country Overview
154 Achievements and Prospects
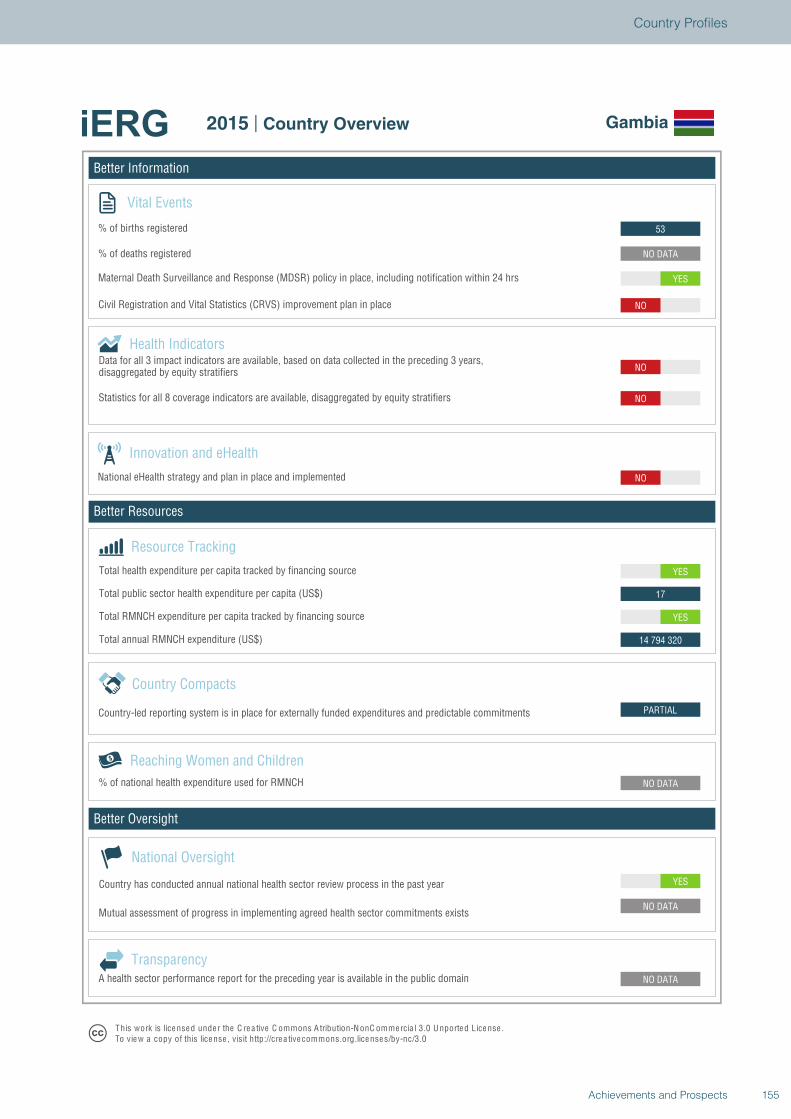
Better Information
Better Resources
Better Oversight
Gambia
Vital Events
% of births registered
% of deaths registered
Innovation and eHealth
National eHealth strategy and plan in place and implemented
Health Indicators
Statistics for all 8 coverage indicators are available, disaggregated by equity stratifiers
Reaching Women and Children
Country Compacts
Country-led reporting system is in place for externally funded expenditures and predictable commitments
Resource Tracking
Total RMNCH expenditure per capita tracked by financing source
Total annual RMNCH expenditure (US$)
Total health expenditure per capita tracked by financing source
% of national health expenditure used for RMNCH
YES
NO DATA
NO DATA
NO DATA
PARTIAL
14 794 320
YES
17
YES
NO
NO
NO
NO
YES
NO DATA
53
National Oversight
Mutual assessment of progress in implementing agreed health sector commitments exists
Country has conducted annual national health sector review process in the past year
TransparencyA health sector performance report for the preceding year is available in the public domain
T his work is lice nse d unde r the C re a tive C ommons A tribution-N onC ommercia l 3.0 U nported License .To view a copy of this license , visit http://cre a tive commons.org.licenses/by-nc/3.0
2015 | Country Overview Gambia
Total public sector health expenditure per capita (US$)
Maternal Death Surveillance and Response (MDSR) policy in place, including notification within 24 hrs
Civil Registration and Vital Statistics (CRVS) improvement plan in place
Data for all 3 impact indicators are available, based on data collected in the preceding 3 years,disaggregated by equity stratifiers
155Achievements and Prospects
Country Profiles

1990
2000
2013
128
101
78
MDG Target: 43
1990 1995 2000 2005 2010 2015
0
50
100
1990
2000
2013
40
34
29
1990 1995 2000 2005 2010 2015
0
10
20
30
40
1990
2000
2013
760
570
380
MDG Target: 190
1990 1995 2000 2005 2010 2015
0
200
400
600
800
1988
1999
2011
42.6
31.3
22.7
1990 1995 2000 2005 2010
0
10
20
30
40
Summary
Demographic Data
Ghana
Total population (’000) Total under-5 population (’000)25 905 3 704
794 68
Reproductive Health and Health Systems Data
Health Coverage Indicators
Demand for familyplanning satisfied
15%
Laws/regulations that allow adolescents access to contraceptives YES
Legal status of abortion(x of 5 circumstances) 3/5
National AverageBottom Quintile Top Quintile
per 1000 live births per 100 000 live births
per 1000 live births % of children under 5 who are moderately or severely stunted
0 20 40 60 80 100
57.3%
0 20 40 60 80 100
86.6%
0 20 40 60 80 100
62.2%
10.220
10
20
30
40 50 60
70
80
90
100
Min Density Threshold
0 20 40 60 80 100
68.4%
0 20 40 60 80 100
15.3%
0 20 40 60 80 100
45%
0 20 40 60 80 100
92.9%
0 20 40 60 80 100
41.3%
Total births (’000) Adolescent birth rate (per 1000 girls)
Coverage levels are shown for the poorest 20% (red) and the richest 20% (orange). The longer the line between the two groups, the greater the absolute inequality. National average coverage across all quintiles is also shown (blue).
Density of doctors, nurses, and midwives per 10 000 population
Postnatal care coverage Exclusive breastfeeding DTP3 coverage Pneumonia care seeking
Met need for contraception Antenatal care coverage (4 visits)Prevention of mother to child transmission of HIV
Skilled attendant at birth
Under-5 mortality rate Maternal mortality rate
Neonatal mortality rate Stunting
The data presented in this country profile have been collated from publicly available sources.
• Global Health Observatory (http://www.who.int/gho/en/): Total population, Total births, Density of doctors, nurses and midwives, Maternal mortality ratio, Under-5 mortality rate, Neonatal mortality rate, Met need for contraception, Demand for family planning satisfied, Antenatal care coverage, Prevention of mother to child transmission of HIV (Antiretroviral prophylaxis for PMTCT), Skilled attendant at birth, Exclusive breastfeeding (for six months), DTP3 coverage, Total health expenditure per capita.
• 2015 Progress report on implementing the Commission on Information and Accountability Recommendations: Birth registration, Death registration, MDSR, CRVS, National eHealth strategy, Total health expenditureper capita tracked by financing source, Country conducted annual health sector review, Health sector performance report available in the public domain.
• Countdown to 2015: MDG targets for MMR and U5MR, Postnatal care coverage, Pneumonia care seeking (antibiotic treatment for pneumonia), Quintile data for all 8 health coverage indicators.
• System of Health Accounts 2011: Total RMNCH expenditure per capita, expenditure tracked by financing source, Total annual RMNCH expenditure.
• The remaining indicators were taken from various sources (in brackets): Mutual assessment of progress exists (IHP+Results, 2014); Legal status of abortion, Under-5 population (UN Population Division);Adolescent birth rate (per 1000 girls) (UN Population Division); Stunting (data.unicef.org); Laws/regulations that allow adolescents access to contraceptives (WHO MNCAH Key Informant Policy Questionnaire).
2015 | Country Overview
156 Achievements and Prospects
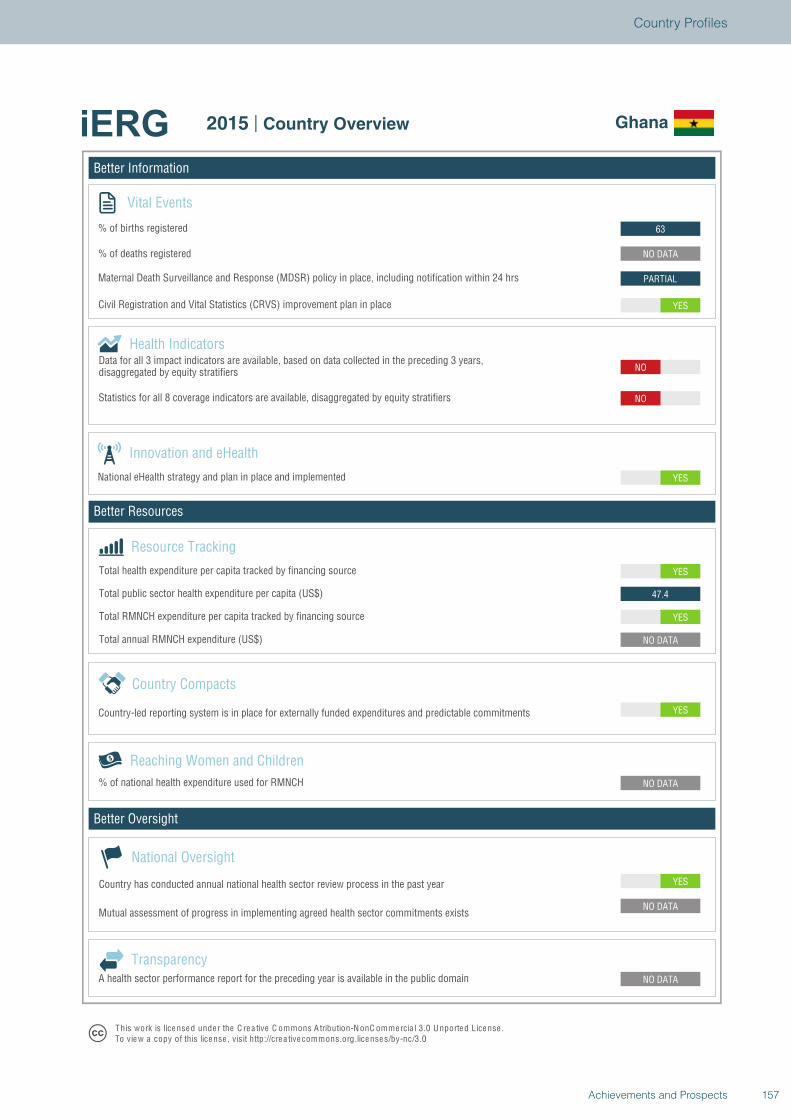
Better Information
Better Resources
Better Oversight
Ghana
Vital Events
% of births registered
% of deaths registered
Innovation and eHealth
National eHealth strategy and plan in place and implemented
Health Indicators
Statistics for all 8 coverage indicators are available, disaggregated by equity stratifiers
Reaching Women and Children
Country Compacts
Country-led reporting system is in place for externally funded expenditures and predictable commitments
Resource Tracking
Total RMNCH expenditure per capita tracked by financing source
Total annual RMNCH expenditure (US$)
Total health expenditure per capita tracked by financing source
% of national health expenditure used for RMNCH
YES
NO DATA
NO DATA
NO DATA
YES
NO DATA
YES
47.4
YES
YES
NO
NO
YES
PARTIAL
NO DATA
63
National Oversight
Mutual assessment of progress in implementing agreed health sector commitments exists
Country has conducted annual national health sector review process in the past year
TransparencyA health sector performance report for the preceding year is available in the public domain
T his work is lice nse d unde r the C re a tive C ommons A tribution-N onC ommercia l 3.0 U nported License .To view a copy of this license , visit http://cre a tive commons.org.licenses/by-nc/3.0
2015 | Country Overview Ghana
Total public sector health expenditure per capita (US$)
Maternal Death Surveillance and Response (MDSR) policy in place, including notification within 24 hrs
Civil Registration and Vital Statistics (CRVS) improvement plan in place
Data for all 3 impact indicators are available, based on data collected in the preceding 3 years,disaggregated by equity stratifiers
157Achievements and Prospects
Country Profiles
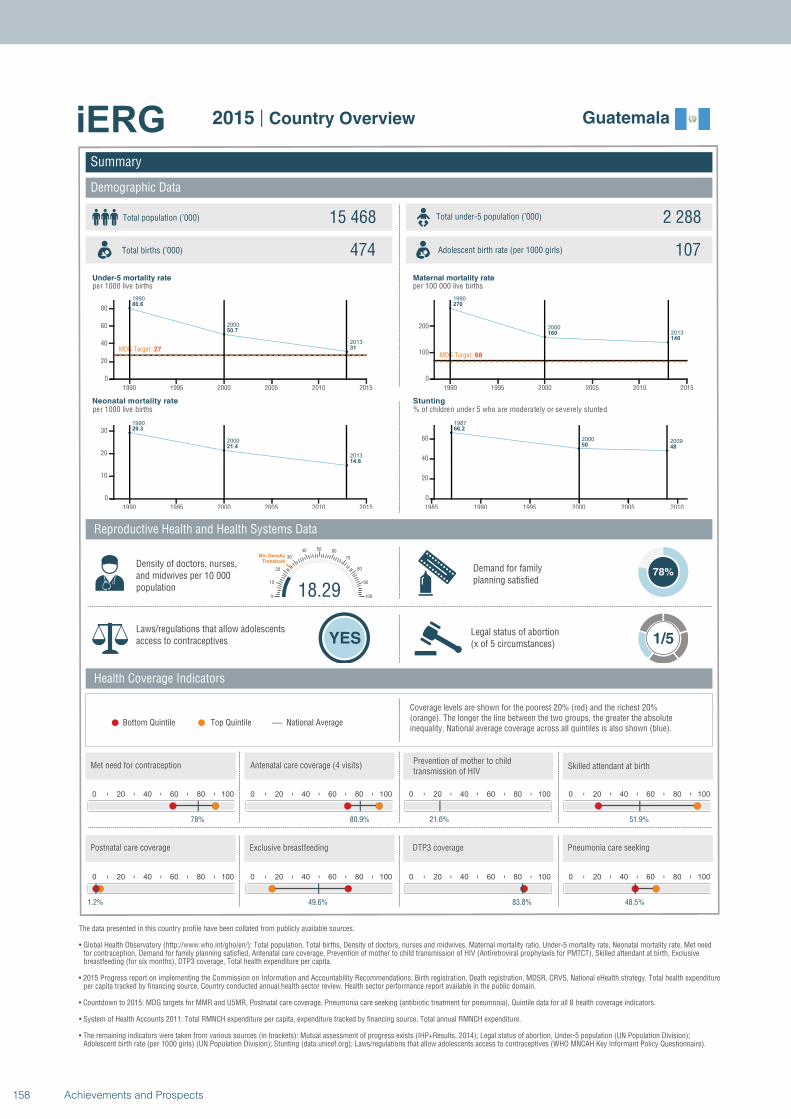
1990
2000
2013
80.6
50.7
31MDG Target: 27
1990 1995 2000 2005 2010 2015
0
20
40
60
80
1990
2000
2013
29.3
21.4
14.8
1990 1995 2000 2005 2010 2015
0
10
20
30
1990
2000
2013
270
160
140
MDG Target: 68
1990 1995 2000 2005 2010 2015
0
100
200
1987
2000 2009
66.2
50 48
1985 1990 1995 2000 2005 2010
0
20
40
60
Summary
Demographic Data
Guatemala
Total population (’000) Total under-5 population (’000)15 468 2 288
474 107
Reproductive Health and Health Systems Data
Health Coverage Indicators
Demand for familyplanning satisfied
78%
Laws/regulations that allow adolescents access to contraceptives YES
Legal status of abortion(x of 5 circumstances) 1/5
National AverageBottom Quintile Top Quintile
per 1000 live births per 100 000 live births
per 1000 live births % of children under 5 who are moderately or severely stunted
0 20 40 60 80 100
78%
0 20 40 60 80 100
80.9%
0 20 40 60 80 100
21.6%
18.290
10
20
30
40 50 60
70
80
90
100
Min Density Threshold
0 20 40 60 80 100
51.9%
0 20 40 60 80 100
1.2%
0 20 40 60 80 100
49.6%
0 20 40 60 80 100
83.8%
0 20 40 60 80 100
48.5%
Total births (’000) Adolescent birth rate (per 1000 girls)
Coverage levels are shown for the poorest 20% (red) and the richest 20% (orange). The longer the line between the two groups, the greater the absolute inequality. National average coverage across all quintiles is also shown (blue).
Density of doctors, nurses, and midwives per 10 000 population
Postnatal care coverage Exclusive breastfeeding DTP3 coverage Pneumonia care seeking
Met need for contraception Antenatal care coverage (4 visits)Prevention of mother to child transmission of HIV
Skilled attendant at birth
Under-5 mortality rate Maternal mortality rate
Neonatal mortality rate Stunting
The data presented in this country profile have been collated from publicly available sources.
• Global Health Observatory (http://www.who.int/gho/en/): Total population, Total births, Density of doctors, nurses and midwives, Maternal mortality ratio, Under-5 mortality rate, Neonatal mortality rate, Met need for contraception, Demand for family planning satisfied, Antenatal care coverage, Prevention of mother to child transmission of HIV (Antiretroviral prophylaxis for PMTCT), Skilled attendant at birth, Exclusive breastfeeding (for six months), DTP3 coverage, Total health expenditure per capita.
• 2015 Progress report on implementing the Commission on Information and Accountability Recommendations: Birth registration, Death registration, MDSR, CRVS, National eHealth strategy, Total health expenditureper capita tracked by financing source, Country conducted annual health sector review, Health sector performance report available in the public domain.
• Countdown to 2015: MDG targets for MMR and U5MR, Postnatal care coverage, Pneumonia care seeking (antibiotic treatment for pneumonia), Quintile data for all 8 health coverage indicators.
• System of Health Accounts 2011: Total RMNCH expenditure per capita, expenditure tracked by financing source, Total annual RMNCH expenditure.
• The remaining indicators were taken from various sources (in brackets): Mutual assessment of progress exists (IHP+Results, 2014); Legal status of abortion, Under-5 population (UN Population Division);Adolescent birth rate (per 1000 girls) (UN Population Division); Stunting (data.unicef.org); Laws/regulations that allow adolescents access to contraceptives (WHO MNCAH Key Informant Policy Questionnaire).
2015 | Country Overview
158 Achievements and Prospects
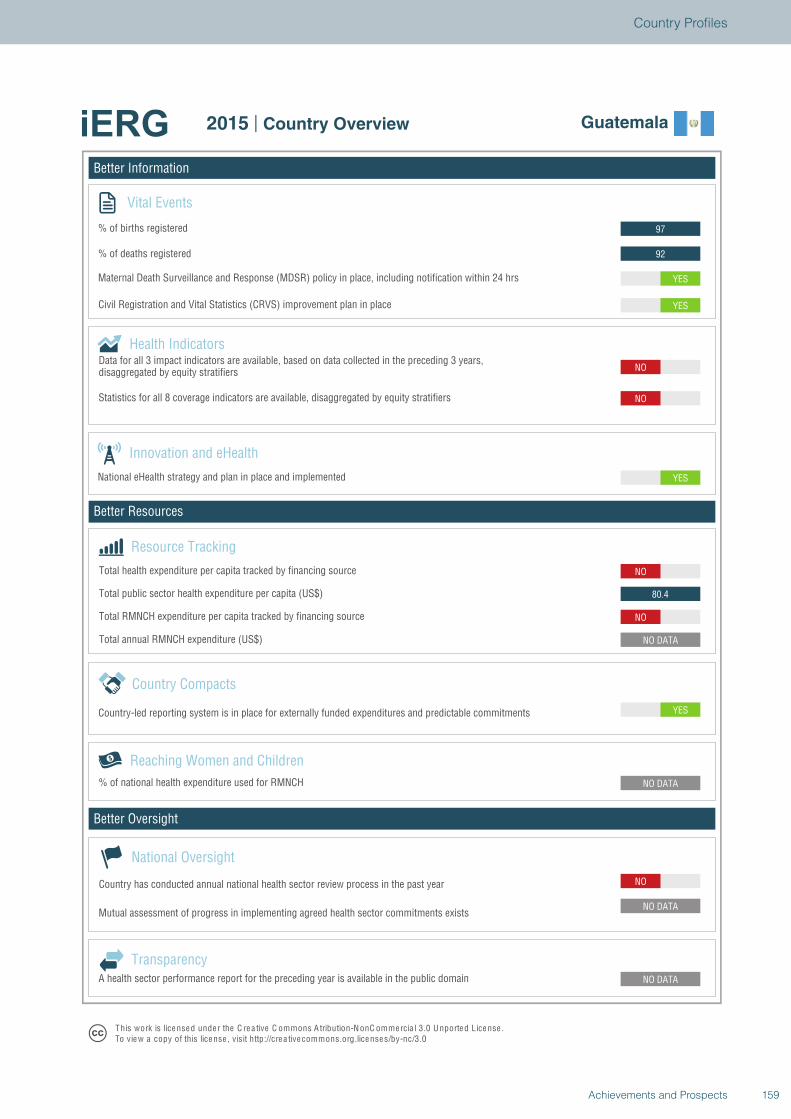
Better Information
Better Resources
Better Oversight
Guatemala
Vital Events
% of births registered
% of deaths registered
Innovation and eHealth
National eHealth strategy and plan in place and implemented
Health Indicators
Statistics for all 8 coverage indicators are available, disaggregated by equity stratifiers
Reaching Women and Children
Country Compacts
Country-led reporting system is in place for externally funded expenditures and predictable commitments
Resource Tracking
Total RMNCH expenditure per capita tracked by financing source
Total annual RMNCH expenditure (US$)
Total health expenditure per capita tracked by financing source
% of national health expenditure used for RMNCH
NO
NO DATA
NO DATA
NO DATA
YES
NO DATA
NO
80.4
NO
YES
NO
NO
YES
YES
92
97
National Oversight
Mutual assessment of progress in implementing agreed health sector commitments exists
Country has conducted annual national health sector review process in the past year
TransparencyA health sector performance report for the preceding year is available in the public domain
T his work is lice nse d unde r the C re a tive C ommons A tribution-N onC ommercia l 3.0 U nported License .To view a copy of this license , visit http://cre a tive commons.org.licenses/by-nc/3.0
2015 | Country Overview Guatemala
Total public sector health expenditure per capita (US$)
Maternal Death Surveillance and Response (MDSR) policy in place, including notification within 24 hrs
Civil Registration and Vital Statistics (CRVS) improvement plan in place
Data for all 3 impact indicators are available, based on data collected in the preceding 3 years,disaggregated by equity stratifiers
159Achievements and Prospects
Country Profiles
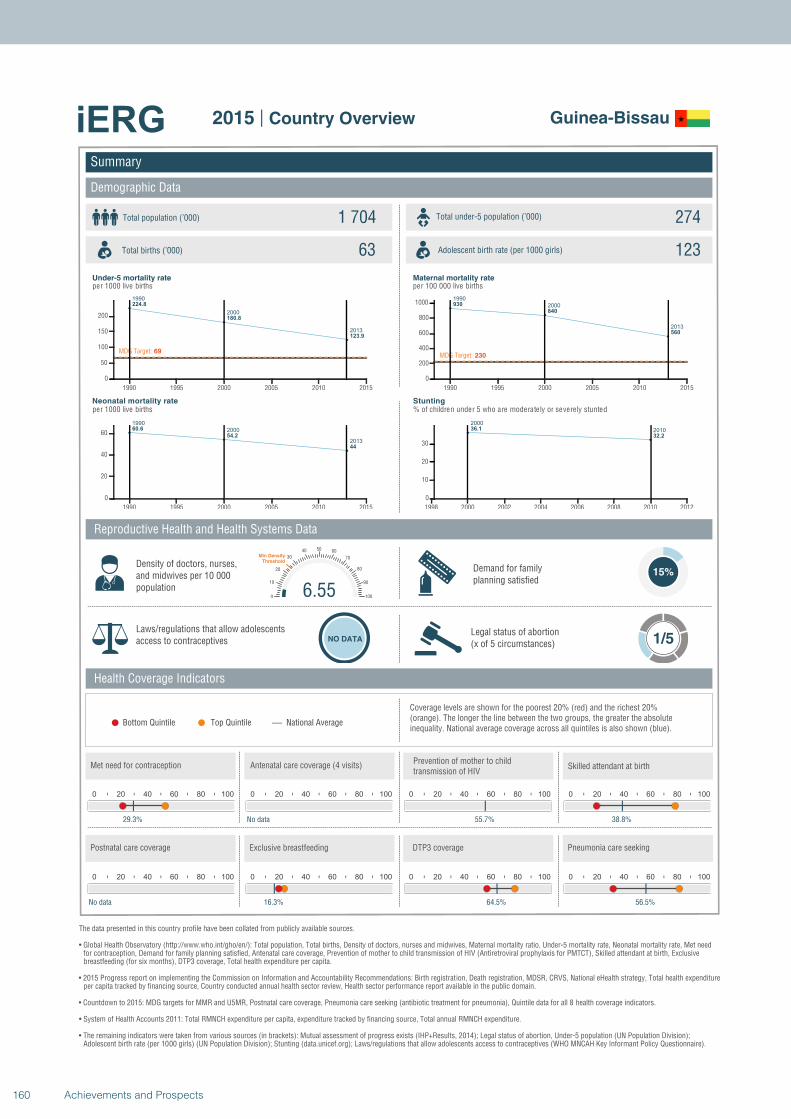
1990
2000
2013
224.8
180.8
123.9
MDG Target: 69
1990 1995 2000 2005 2010 2015
0
50
100
150
200
1990
2000
2013
60.6
54.2
44
1990 1995 2000 2005 2010 2015
0
20
40
60
1990
2000
2013
930
840
560
MDG Target: 230
1990 1995 2000 2005 2010 2015
0
200
400
600
800
1000
2000
201036.1
32.2
1998 2000 2002 2004 2006 2008 2010 2012
0
10
20
30
Summary
Demographic Data
Guinea-Bissau
Total population (’000) Total under-5 population (’000)1 704 274
63 123
Reproductive Health and Health Systems Data
Health Coverage Indicators
Demand for familyplanning satisfied
15%
Laws/regulations that allow adolescents access to contraceptives NO DATA
Legal status of abortion(x of 5 circumstances) 1/5
National AverageBottom Quintile Top Quintile
per 1000 live births per 100 000 live births
per 1000 live births % of children under 5 who are moderately or severely stunted
0 20 40 60 80 100
29.3%
0 20 40 60 80 100
No data
0 20 40 60 80 100
55.7%
6.550
10
20
30
40 50 60
70
80
90
100
Min Density Threshold
0 20 40 60 80 100
38.8%
0 20 40 60 80 100
No data
0 20 40 60 80 100
16.3%
0 20 40 60 80 100
64.5%
0 20 40 60 80 100
56.5%
Total births (’000) Adolescent birth rate (per 1000 girls)
Coverage levels are shown for the poorest 20% (red) and the richest 20% (orange). The longer the line between the two groups, the greater the absolute inequality. National average coverage across all quintiles is also shown (blue).
Density of doctors, nurses, and midwives per 10 000 population
Postnatal care coverage Exclusive breastfeeding DTP3 coverage Pneumonia care seeking
Met need for contraception Antenatal care coverage (4 visits)Prevention of mother to child transmission of HIV
Skilled attendant at birth
Under-5 mortality rate Maternal mortality rate
Neonatal mortality rate Stunting
The data presented in this country profile have been collated from publicly available sources.
• Global Health Observatory (http://www.who.int/gho/en/): Total population, Total births, Density of doctors, nurses and midwives, Maternal mortality ratio, Under-5 mortality rate, Neonatal mortality rate, Met need for contraception, Demand for family planning satisfied, Antenatal care coverage, Prevention of mother to child transmission of HIV (Antiretroviral prophylaxis for PMTCT), Skilled attendant at birth, Exclusive breastfeeding (for six months), DTP3 coverage, Total health expenditure per capita.
• 2015 Progress report on implementing the Commission on Information and Accountability Recommendations: Birth registration, Death registration, MDSR, CRVS, National eHealth strategy, Total health expenditureper capita tracked by financing source, Country conducted annual health sector review, Health sector performance report available in the public domain.
• Countdown to 2015: MDG targets for MMR and U5MR, Postnatal care coverage, Pneumonia care seeking (antibiotic treatment for pneumonia), Quintile data for all 8 health coverage indicators.
• System of Health Accounts 2011: Total RMNCH expenditure per capita, expenditure tracked by financing source, Total annual RMNCH expenditure.
• The remaining indicators were taken from various sources (in brackets): Mutual assessment of progress exists (IHP+Results, 2014); Legal status of abortion, Under-5 population (UN Population Division);Adolescent birth rate (per 1000 girls) (UN Population Division); Stunting (data.unicef.org); Laws/regulations that allow adolescents access to contraceptives (WHO MNCAH Key Informant Policy Questionnaire).
2015 | Country Overview
160 Achievements and Prospects
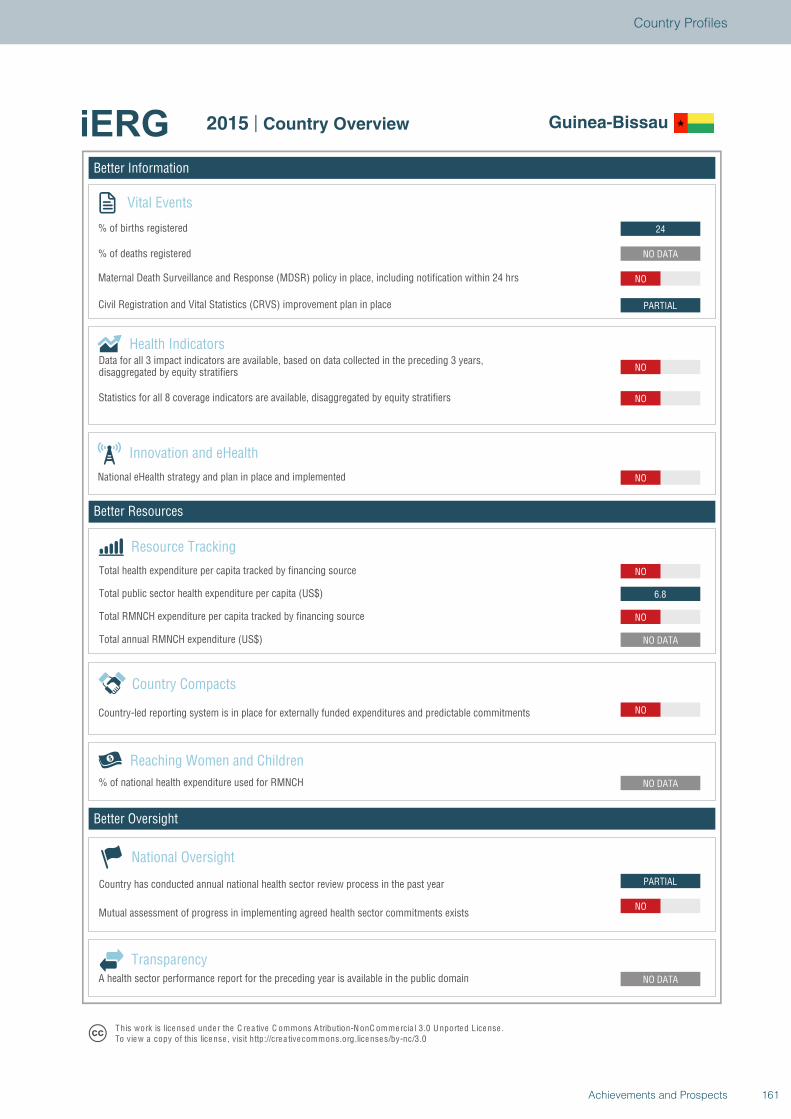
Better Information
Better Resources
Better Oversight
Guinea-Bissau
Vital Events
% of births registered
% of deaths registered
Innovation and eHealth
National eHealth strategy and plan in place and implemented
Health Indicators
Statistics for all 8 coverage indicators are available, disaggregated by equity stratifiers
Reaching Women and Children
Country Compacts
Country-led reporting system is in place for externally funded expenditures and predictable commitments
Resource Tracking
Total RMNCH expenditure per capita tracked by financing source
Total annual RMNCH expenditure (US$)
Total health expenditure per capita tracked by financing source
% of national health expenditure used for RMNCH
PARTIAL
NO
NO DATA
NO DATA
NO
NO DATA
NO
6.8
NO
NO
NO
NO
PARTIAL
NO
NO DATA
24
National Oversight
Mutual assessment of progress in implementing agreed health sector commitments exists
Country has conducted annual national health sector review process in the past year
TransparencyA health sector performance report for the preceding year is available in the public domain
T his work is lice nse d unde r the C re a tive C ommons A tribution-N onC ommercia l 3.0 U nported License .To view a copy of this license , visit http://cre a tive commons.org.licenses/by-nc/3.0
2015 | Country Overview Guinea-Bissau
Total public sector health expenditure per capita (US$)
Maternal Death Surveillance and Response (MDSR) policy in place, including notification within 24 hrs
Civil Registration and Vital Statistics (CRVS) improvement plan in place
Data for all 3 impact indicators are available, based on data collected in the preceding 3 years,disaggregated by equity stratifiers
161Achievements and Prospects
Country Profiles
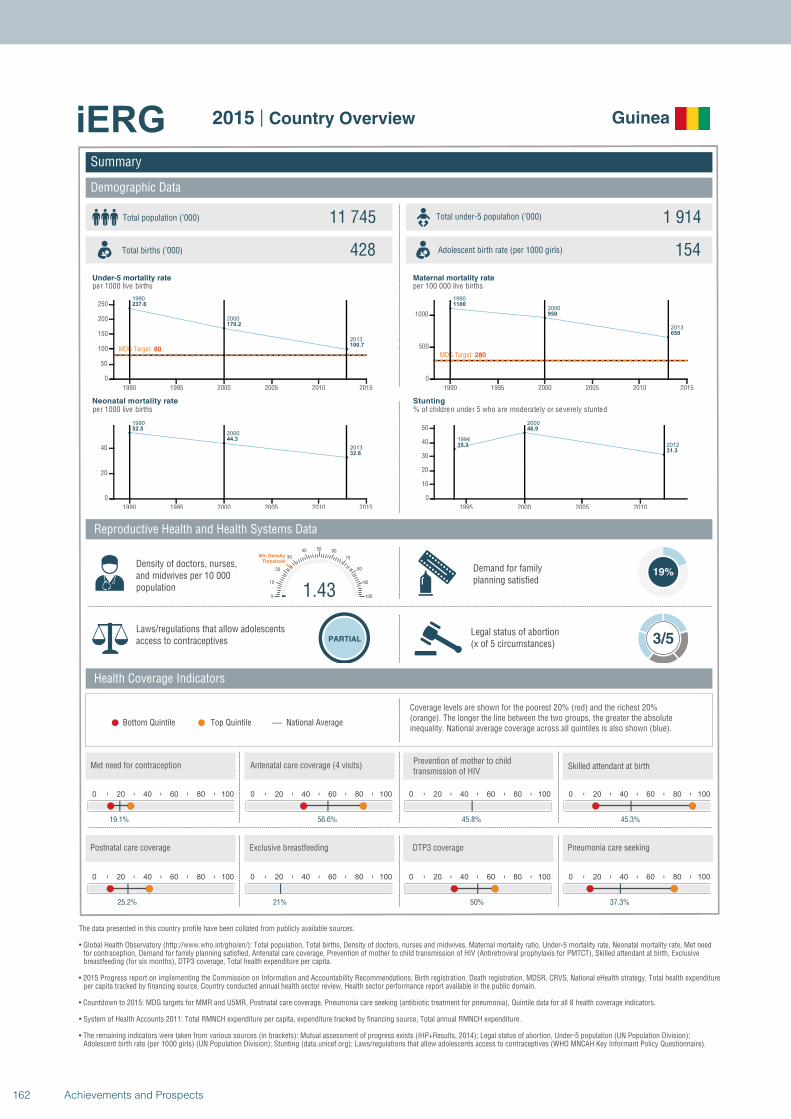
1990
2000
2013
237.6
170.2
100.7MDG Target: 80
1990 1995 2000 2005 2010 2015
0
50
100
150
200
250
1990
2000
2013
52.5
44.3
32.8
1990 1995 2000 2005 2010 2015
0
20
40
1990
2000
2013
1100
950
650
MDG Target: 280
1990 1995 2000 2005 2010 2015
0
500
1000
1994
2000
201235.3
46.9
31.3
1995 2000 2005 2010
0
10
20
30
40
50
Summary
Demographic Data
Guinea
Total population (’000) Total under-5 population (’000)11 745 1 914
428 154
Reproductive Health and Health Systems Data
Health Coverage Indicators
Demand for familyplanning satisfied
19%
Laws/regulations that allow adolescents access to contraceptives PARTIAL
Legal status of abortion(x of 5 circumstances) 3/5
National AverageBottom Quintile Top Quintile
per 1000 live births per 100 000 live births
per 1000 live births % of children under 5 who are moderately or severely stunted
0 20 40 60 80 100
19.1%
0 20 40 60 80 100
56.6%
0 20 40 60 80 100
45.8%
1.430
10
20
30
40 50 60
70
80
90
100
Min Density Threshold
0 20 40 60 80 100
45.3%
0 20 40 60 80 100
25.2%
0 20 40 60 80 100
21%
0 20 40 60 80 100
50%
0 20 40 60 80 100
37.3%
Total births (’000) Adolescent birth rate (per 1000 girls)
Coverage levels are shown for the poorest 20% (red) and the richest 20% (orange). The longer the line between the two groups, the greater the absolute inequality. National average coverage across all quintiles is also shown (blue).
Density of doctors, nurses, and midwives per 10 000 population
Postnatal care coverage Exclusive breastfeeding DTP3 coverage Pneumonia care seeking
Met need for contraception Antenatal care coverage (4 visits)Prevention of mother to child transmission of HIV
Skilled attendant at birth
Under-5 mortality rate Maternal mortality rate
Neonatal mortality rate Stunting
The data presented in this country profile have been collated from publicly available sources.
• Global Health Observatory (http://www.who.int/gho/en/): Total population, Total births, Density of doctors, nurses and midwives, Maternal mortality ratio, Under-5 mortality rate, Neonatal mortality rate, Met need for contraception, Demand for family planning satisfied, Antenatal care coverage, Prevention of mother to child transmission of HIV (Antiretroviral prophylaxis for PMTCT), Skilled attendant at birth, Exclusive breastfeeding (for six months), DTP3 coverage, Total health expenditure per capita.
• 2015 Progress report on implementing the Commission on Information and Accountability Recommendations: Birth registration, Death registration, MDSR, CRVS, National eHealth strategy, Total health expenditureper capita tracked by financing source, Country conducted annual health sector review, Health sector performance report available in the public domain.
• Countdown to 2015: MDG targets for MMR and U5MR, Postnatal care coverage, Pneumonia care seeking (antibiotic treatment for pneumonia), Quintile data for all 8 health coverage indicators.
• System of Health Accounts 2011: Total RMNCH expenditure per capita, expenditure tracked by financing source, Total annual RMNCH expenditure.
• The remaining indicators were taken from various sources (in brackets): Mutual assessment of progress exists (IHP+Results, 2014); Legal status of abortion, Under-5 population (UN Population Division);Adolescent birth rate (per 1000 girls) (UN Population Division); Stunting (data.unicef.org); Laws/regulations that allow adolescents access to contraceptives (WHO MNCAH Key Informant Policy Questionnaire).
2015 | Country Overview
162 Achievements and Prospects
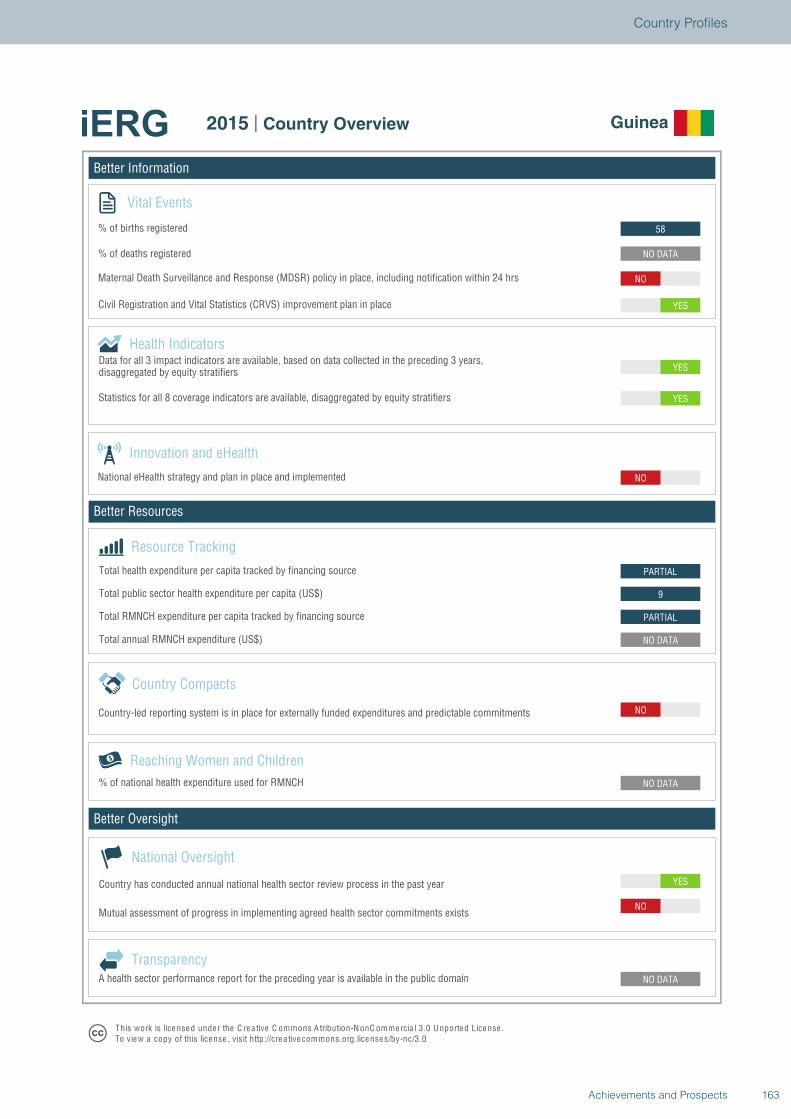
Better Information
Better Resources
Better Oversight
Guinea
Vital Events
% of births registered
% of deaths registered
Innovation and eHealth
National eHealth strategy and plan in place and implemented
Health Indicators
Statistics for all 8 coverage indicators are available, disaggregated by equity stratifiers
Reaching Women and Children
Country Compacts
Country-led reporting system is in place for externally funded expenditures and predictable commitments
Resource Tracking
Total RMNCH expenditure per capita tracked by financing source
Total annual RMNCH expenditure (US$)
Total health expenditure per capita tracked by financing source
% of national health expenditure used for RMNCH
YES
NO
NO DATA
NO DATA
NO
NO DATA
PARTIAL
9
PARTIAL
NO
YES
YES
YES
NO
NO DATA
58
National Oversight
Mutual assessment of progress in implementing agreed health sector commitments exists
Country has conducted annual national health sector review process in the past year
TransparencyA health sector performance report for the preceding year is available in the public domain
T his work is lice nse d unde r the C re a tive C ommons A tribution-N onC ommercia l 3.0 U nported License .To view a copy of this license , visit http://cre a tive commons.org.licenses/by-nc/3.0
2015 | Country Overview Guinea
Total public sector health expenditure per capita (US$)
Maternal Death Surveillance and Response (MDSR) policy in place, including notification within 24 hrs
Civil Registration and Vital Statistics (CRVS) improvement plan in place
Data for all 3 impact indicators are available, based on data collected in the preceding 3 years,disaggregated by equity stratifiers
163Achievements and Prospects
Country Profiles
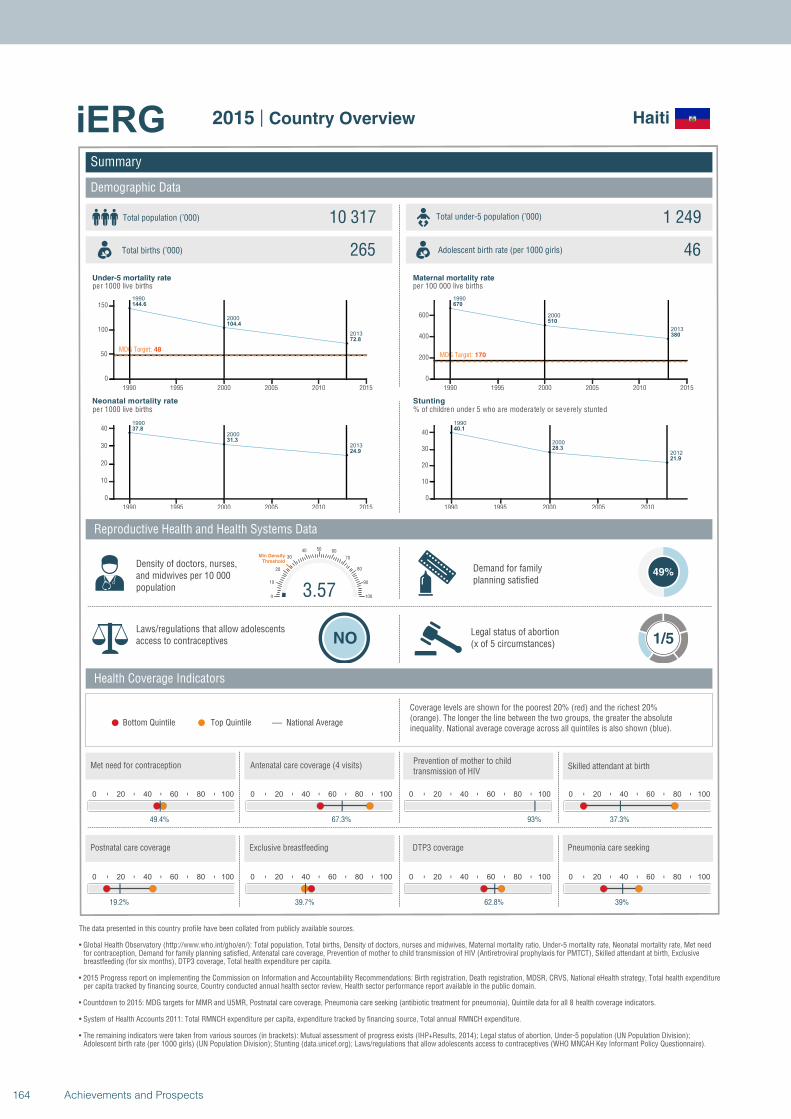
1990
2000
2013
144.6
104.4
72.8
MDG Target: 48
1990 1995 2000 2005 2010 2015
0
50
100
150
1990
2000
2013
37.8
31.3
24.9
1990 1995 2000 2005 2010 2015
0
10
20
30
40
1990
2000
2013
670
510
380
MDG Target: 170
1990 1995 2000 2005 2010 2015
0
200
400
600
1990
2000
2012
40.1
28.3
21.9
1990 1995 2000 2005 2010
0
10
20
30
40
Summary
Demographic Data
Haiti
Total population (’000) Total under-5 population (’000)10 317 1 249
265 46
Reproductive Health and Health Systems Data
Health Coverage Indicators
Demand for familyplanning satisfied
49%
Laws/regulations that allow adolescents access to contraceptives NO
Legal status of abortion(x of 5 circumstances) 1/5
National AverageBottom Quintile Top Quintile
per 1000 live births per 100 000 live births
per 1000 live births % of children under 5 who are moderately or severely stunted
0 20 40 60 80 100
49.4%
0 20 40 60 80 100
67.3%
0 20 40 60 80 100
93%
3.570
10
20
30
40 50 60
70
80
90
100
Min Density Threshold
0 20 40 60 80 100
37.3%
0 20 40 60 80 100
19.2%
0 20 40 60 80 100
39.7%
0 20 40 60 80 100
62.8%
0 20 40 60 80 100
39%
Total births (’000) Adolescent birth rate (per 1000 girls)
Coverage levels are shown for the poorest 20% (red) and the richest 20% (orange). The longer the line between the two groups, the greater the absolute inequality. National average coverage across all quintiles is also shown (blue).
Density of doctors, nurses, and midwives per 10 000 population
Postnatal care coverage Exclusive breastfeeding DTP3 coverage Pneumonia care seeking
Met need for contraception Antenatal care coverage (4 visits)Prevention of mother to child transmission of HIV
Skilled attendant at birth
Under-5 mortality rate Maternal mortality rate
Neonatal mortality rate Stunting
The data presented in this country profile have been collated from publicly available sources.
• Global Health Observatory (http://www.who.int/gho/en/): Total population, Total births, Density of doctors, nurses and midwives, Maternal mortality ratio, Under-5 mortality rate, Neonatal mortality rate, Met need for contraception, Demand for family planning satisfied, Antenatal care coverage, Prevention of mother to child transmission of HIV (Antiretroviral prophylaxis for PMTCT), Skilled attendant at birth, Exclusive breastfeeding (for six months), DTP3 coverage, Total health expenditure per capita.
• 2015 Progress report on implementing the Commission on Information and Accountability Recommendations: Birth registration, Death registration, MDSR, CRVS, National eHealth strategy, Total health expenditureper capita tracked by financing source, Country conducted annual health sector review, Health sector performance report available in the public domain.
• Countdown to 2015: MDG targets for MMR and U5MR, Postnatal care coverage, Pneumonia care seeking (antibiotic treatment for pneumonia), Quintile data for all 8 health coverage indicators.
• System of Health Accounts 2011: Total RMNCH expenditure per capita, expenditure tracked by financing source, Total annual RMNCH expenditure.
• The remaining indicators were taken from various sources (in brackets): Mutual assessment of progress exists (IHP+Results, 2014); Legal status of abortion, Under-5 population (UN Population Division);Adolescent birth rate (per 1000 girls) (UN Population Division); Stunting (data.unicef.org); Laws/regulations that allow adolescents access to contraceptives (WHO MNCAH Key Informant Policy Questionnaire).
2015 | Country Overview
164 Achievements and Prospects
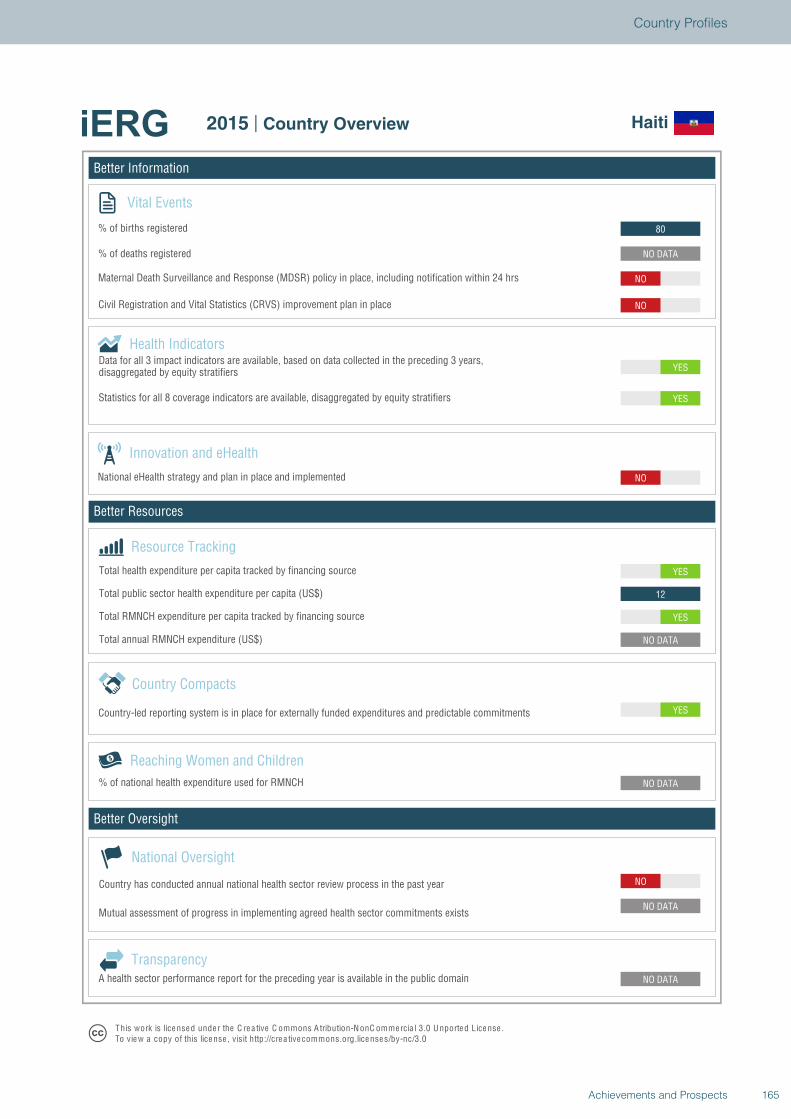
Better Information
Better Resources
Better Oversight
Haiti
Vital Events
% of births registered
% of deaths registered
Innovation and eHealth
National eHealth strategy and plan in place and implemented
Health Indicators
Statistics for all 8 coverage indicators are available, disaggregated by equity stratifiers
Reaching Women and Children
Country Compacts
Country-led reporting system is in place for externally funded expenditures and predictable commitments
Resource Tracking
Total RMNCH expenditure per capita tracked by financing source
Total annual RMNCH expenditure (US$)
Total health expenditure per capita tracked by financing source
% of national health expenditure used for RMNCH
NO
NO DATA
NO DATA
NO DATA
YES
NO DATA
YES
12
YES
NO
YES
YES
NO
NO
NO DATA
80
National Oversight
Mutual assessment of progress in implementing agreed health sector commitments exists
Country has conducted annual national health sector review process in the past year
TransparencyA health sector performance report for the preceding year is available in the public domain
T his work is lice nse d unde r the C re a tive C ommons A tribution-N onC ommercia l 3.0 U nported License .To view a copy of this license , visit http://cre a tive commons.org.licenses/by-nc/3.0
2015 | Country Overview Haiti
Total public sector health expenditure per capita (US$)
Maternal Death Surveillance and Response (MDSR) policy in place, including notification within 24 hrs
Civil Registration and Vital Statistics (CRVS) improvement plan in place
Data for all 3 impact indicators are available, based on data collected in the preceding 3 years,disaggregated by equity stratifiers
165Achievements and Prospects
Country Profiles
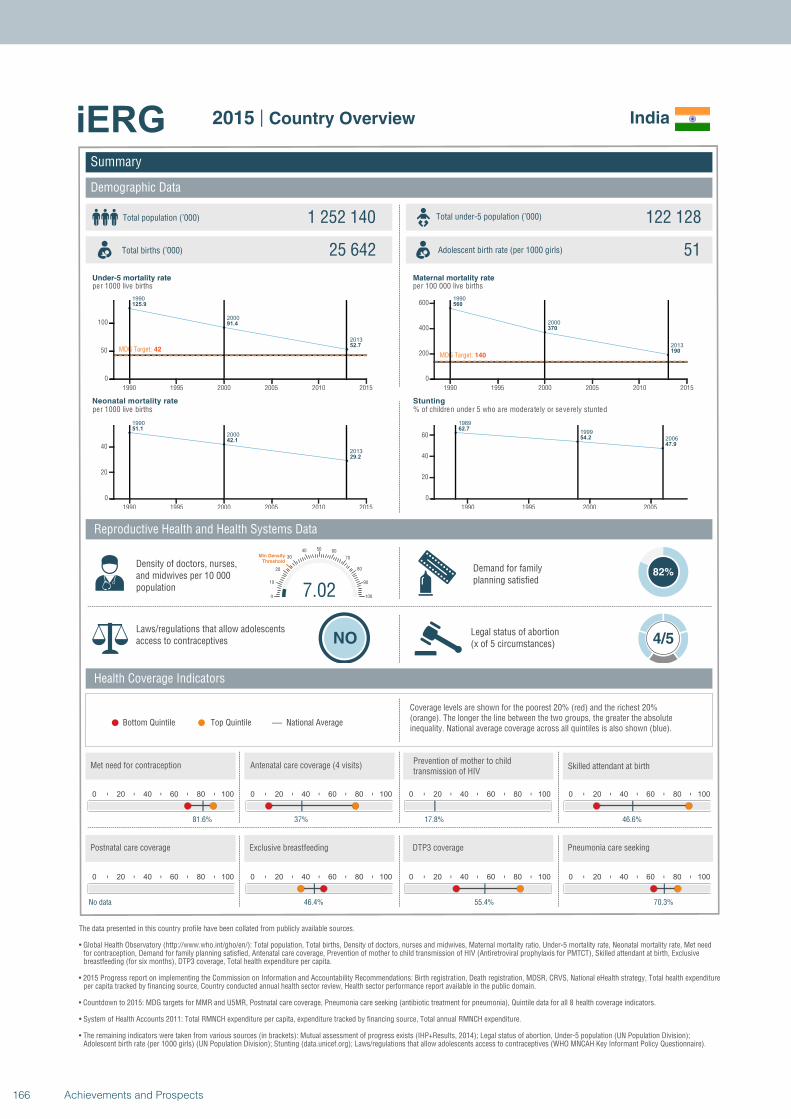
1990
2000
2013
125.9
91.4
52.7MDG Target: 42
1990 1995 2000 2005 2010 2015
0
50
100
1990
2000
2013
51.1
42.1
29.2
1990 1995 2000 2005 2010 2015
0
20
40
1990
2000
2013
560
370
190MDG Target: 140
1990 1995 2000 2005 2010 2015
0
200
400
600
1989
1999
2006
62.7
54.2
47.9
1990 1995 2000 2005
0
20
40
60
Summary
Demographic Data
India
Total population (’000) Total under-5 population (’000)1 252 140 122 128
25 642 51
Reproductive Health and Health Systems Data
Health Coverage Indicators
Demand for familyplanning satisfied
82%
Laws/regulations that allow adolescents access to contraceptives NO
Legal status of abortion(x of 5 circumstances) 4/5
National AverageBottom Quintile Top Quintile
per 1000 live births per 100 000 live births
per 1000 live births % of children under 5 who are moderately or severely stunted
0 20 40 60 80 100
81.6%
0 20 40 60 80 100
37%
0 20 40 60 80 100
17.8%
7.020
10
20
30
40 50 60
70
80
90
100
Min Density Threshold
0 20 40 60 80 100
46.6%
0 20 40 60 80 100
No data
0 20 40 60 80 100
46.4%
0 20 40 60 80 100
55.4%
0 20 40 60 80 100
70.3%
Total births (’000) Adolescent birth rate (per 1000 girls)
Coverage levels are shown for the poorest 20% (red) and the richest 20% (orange). The longer the line between the two groups, the greater the absolute inequality. National average coverage across all quintiles is also shown (blue).
Density of doctors, nurses, and midwives per 10 000 population
Postnatal care coverage Exclusive breastfeeding DTP3 coverage Pneumonia care seeking
Met need for contraception Antenatal care coverage (4 visits)Prevention of mother to child transmission of HIV
Skilled attendant at birth
Under-5 mortality rate Maternal mortality rate
Neonatal mortality rate Stunting
The data presented in this country profile have been collated from publicly available sources.
• Global Health Observatory (http://www.who.int/gho/en/): Total population, Total births, Density of doctors, nurses and midwives, Maternal mortality ratio, Under-5 mortality rate, Neonatal mortality rate, Met need for contraception, Demand for family planning satisfied, Antenatal care coverage, Prevention of mother to child transmission of HIV (Antiretroviral prophylaxis for PMTCT), Skilled attendant at birth, Exclusive breastfeeding (for six months), DTP3 coverage, Total health expenditure per capita.
• 2015 Progress report on implementing the Commission on Information and Accountability Recommendations: Birth registration, Death registration, MDSR, CRVS, National eHealth strategy, Total health expenditureper capita tracked by financing source, Country conducted annual health sector review, Health sector performance report available in the public domain.
• Countdown to 2015: MDG targets for MMR and U5MR, Postnatal care coverage, Pneumonia care seeking (antibiotic treatment for pneumonia), Quintile data for all 8 health coverage indicators.
• System of Health Accounts 2011: Total RMNCH expenditure per capita, expenditure tracked by financing source, Total annual RMNCH expenditure.
• The remaining indicators were taken from various sources (in brackets): Mutual assessment of progress exists (IHP+Results, 2014); Legal status of abortion, Under-5 population (UN Population Division);Adolescent birth rate (per 1000 girls) (UN Population Division); Stunting (data.unicef.org); Laws/regulations that allow adolescents access to contraceptives (WHO MNCAH Key Informant Policy Questionnaire).
2015 | Country Overview
166 Achievements and Prospects
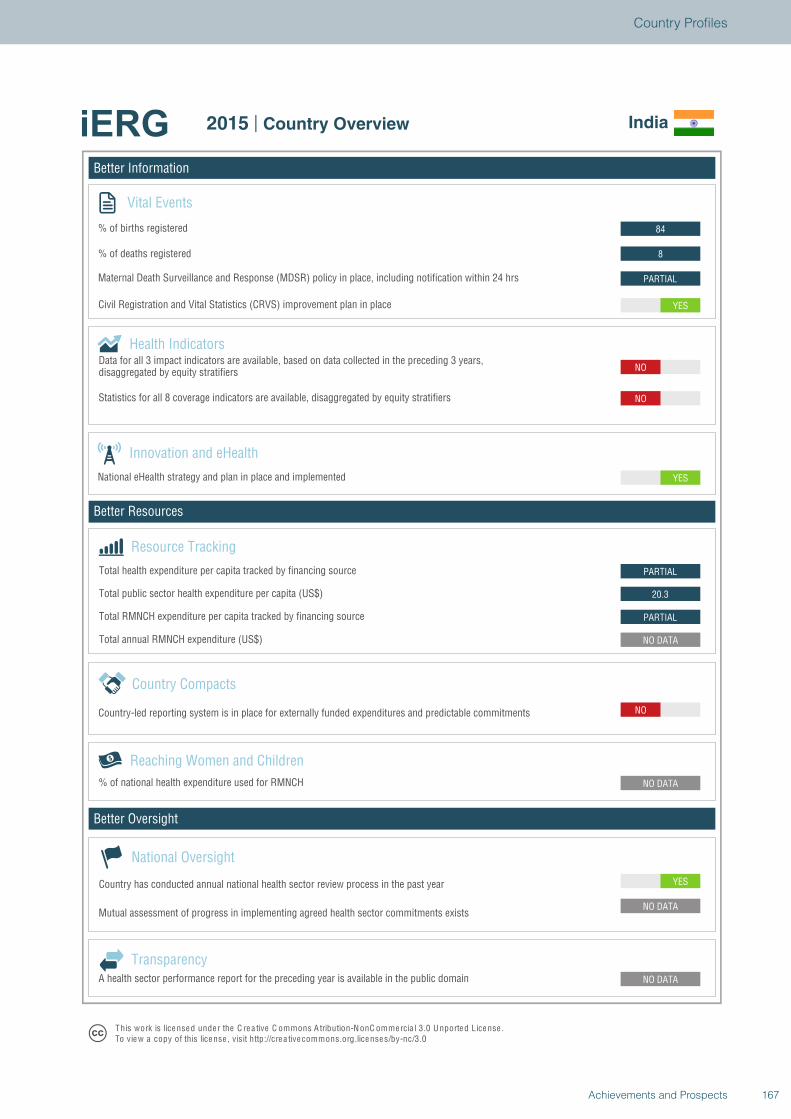
Better Information
Better Resources
Better Oversight
India
Vital Events
% of births registered
% of deaths registered
Innovation and eHealth
National eHealth strategy and plan in place and implemented
Health Indicators
Statistics for all 8 coverage indicators are available, disaggregated by equity stratifiers
Reaching Women and Children
Country Compacts
Country-led reporting system is in place for externally funded expenditures and predictable commitments
Resource Tracking
Total RMNCH expenditure per capita tracked by financing source
Total annual RMNCH expenditure (US$)
Total health expenditure per capita tracked by financing source
% of national health expenditure used for RMNCH
YES
NO DATA
NO DATA
NO DATA
NO
NO DATA
PARTIAL
20.3
PARTIAL
YES
NO
NO
YES
PARTIAL
8
84
National Oversight
Mutual assessment of progress in implementing agreed health sector commitments exists
Country has conducted annual national health sector review process in the past year
TransparencyA health sector performance report for the preceding year is available in the public domain
T his work is lice nse d unde r the C re a tive C ommons A tribution-N onC ommercia l 3.0 U nported License .To view a copy of this license , visit http://cre a tive commons.org.licenses/by-nc/3.0
2015 | Country Overview India
Total public sector health expenditure per capita (US$)
Maternal Death Surveillance and Response (MDSR) policy in place, including notification within 24 hrs
Civil Registration and Vital Statistics (CRVS) improvement plan in place
Data for all 3 impact indicators are available, based on data collected in the preceding 3 years,disaggregated by equity stratifiers
167Achievements and Prospects
Country Profiles
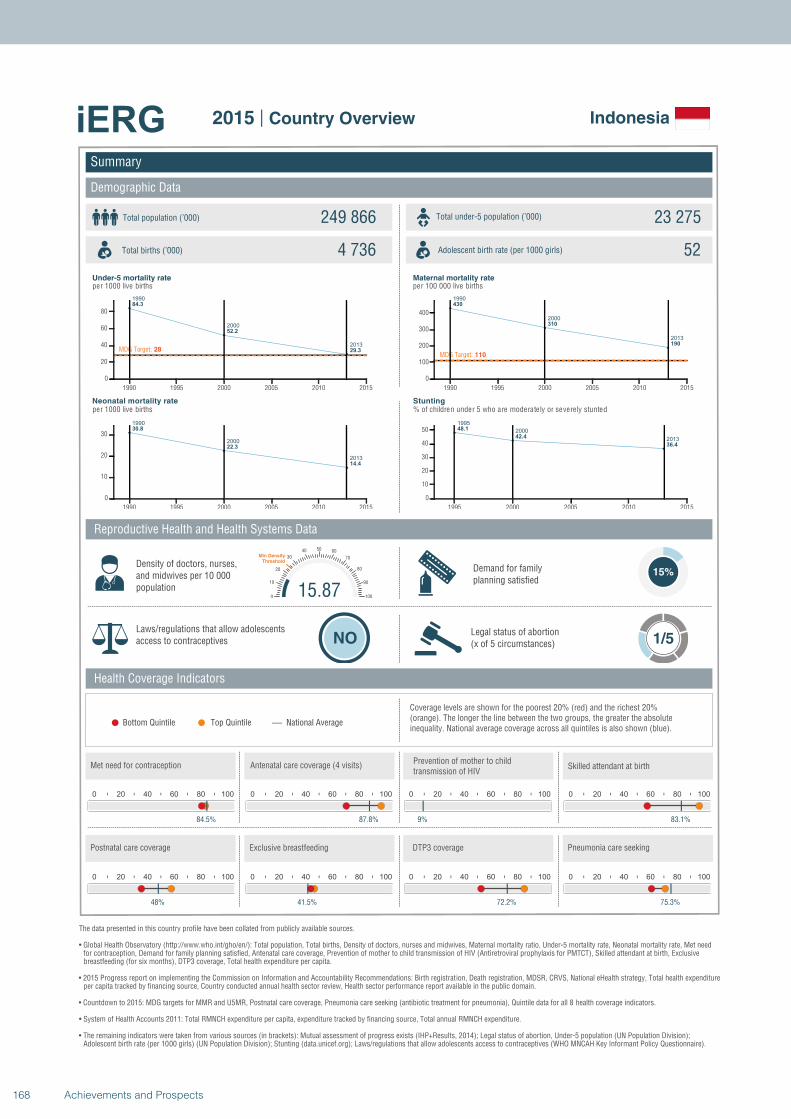
1990
2000
2013
84.3
52.2
29.3MDG Target: 28
1990 1995 2000 2005 2010 2015
0
20
40
60
80
1990
2000
2013
30.8
22.3
14.4
1990 1995 2000 2005 2010 2015
0
10
20
30
1990
2000
2013
430
310
190
MDG Target: 110
1990 1995 2000 2005 2010 2015
0
100
200
300
400
1995
2000
2013
48.1
42.4
36.4
1995 2000 2005 2010 2015
0
10
20
30
40
50
Summary
Demographic Data
Indonesia
Total population (’000) Total under-5 population (’000)249 866 23 275
4 736 52
Reproductive Health and Health Systems Data
Health Coverage Indicators
Demand for familyplanning satisfied
15%
Laws/regulations that allow adolescents access to contraceptives NO
Legal status of abortion(x of 5 circumstances) 1/5
National AverageBottom Quintile Top Quintile
per 1000 live births per 100 000 live births
per 1000 live births % of children under 5 who are moderately or severely stunted
0 20 40 60 80 100
84.5%
0 20 40 60 80 100
87.8%
0 20 40 60 80 100
9%
15.870
10
20
30
40 50 60
70
80
90
100
Min Density Threshold
0 20 40 60 80 100
83.1%
0 20 40 60 80 100
48%
0 20 40 60 80 100
41.5%
0 20 40 60 80 100
72.2%
0 20 40 60 80 100
75.3%
Total births (’000) Adolescent birth rate (per 1000 girls)
Coverage levels are shown for the poorest 20% (red) and the richest 20% (orange). The longer the line between the two groups, the greater the absolute inequality. National average coverage across all quintiles is also shown (blue).
Density of doctors, nurses, and midwives per 10 000 population
Postnatal care coverage Exclusive breastfeeding DTP3 coverage Pneumonia care seeking
Met need for contraception Antenatal care coverage (4 visits)Prevention of mother to child transmission of HIV
Skilled attendant at birth
Under-5 mortality rate Maternal mortality rate
Neonatal mortality rate Stunting
The data presented in this country profile have been collated from publicly available sources.
• Global Health Observatory (http://www.who.int/gho/en/): Total population, Total births, Density of doctors, nurses and midwives, Maternal mortality ratio, Under-5 mortality rate, Neonatal mortality rate, Met need for contraception, Demand for family planning satisfied, Antenatal care coverage, Prevention of mother to child transmission of HIV (Antiretroviral prophylaxis for PMTCT), Skilled attendant at birth, Exclusive breastfeeding (for six months), DTP3 coverage, Total health expenditure per capita.
• 2015 Progress report on implementing the Commission on Information and Accountability Recommendations: Birth registration, Death registration, MDSR, CRVS, National eHealth strategy, Total health expenditureper capita tracked by financing source, Country conducted annual health sector review, Health sector performance report available in the public domain.
• Countdown to 2015: MDG targets for MMR and U5MR, Postnatal care coverage, Pneumonia care seeking (antibiotic treatment for pneumonia), Quintile data for all 8 health coverage indicators.
• System of Health Accounts 2011: Total RMNCH expenditure per capita, expenditure tracked by financing source, Total annual RMNCH expenditure.
• The remaining indicators were taken from various sources (in brackets): Mutual assessment of progress exists (IHP+Results, 2014); Legal status of abortion, Under-5 population (UN Population Division);Adolescent birth rate (per 1000 girls) (UN Population Division); Stunting (data.unicef.org); Laws/regulations that allow adolescents access to contraceptives (WHO MNCAH Key Informant Policy Questionnaire).
2015 | Country Overview
168 Achievements and Prospects
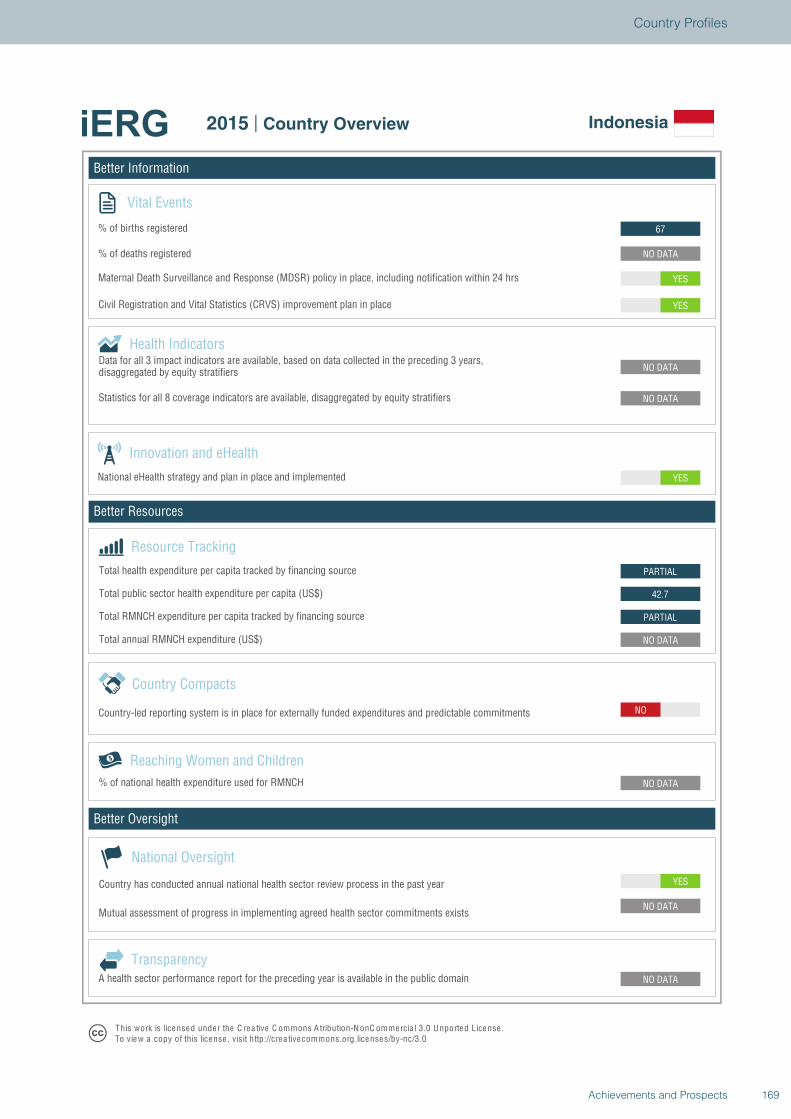
Better Information
Better Resources
Better Oversight
Indonesia
Vital Events
% of births registered
% of deaths registered
Innovation and eHealth
National eHealth strategy and plan in place and implemented
Health Indicators
Statistics for all 8 coverage indicators are available, disaggregated by equity stratifiers
Reaching Women and Children
Country Compacts
Country-led reporting system is in place for externally funded expenditures and predictable commitments
Resource Tracking
Total RMNCH expenditure per capita tracked by financing source
Total annual RMNCH expenditure (US$)
Total health expenditure per capita tracked by financing source
% of national health expenditure used for RMNCH
YES
NO DATA
NO DATA
NO DATA
NO
NO DATA
PARTIAL
42.7
PARTIAL
YES
NO DATA
NO DATA
YES
YES
NO DATA
67
National Oversight
Mutual assessment of progress in implementing agreed health sector commitments exists
Country has conducted annual national health sector review process in the past year
TransparencyA health sector performance report for the preceding year is available in the public domain
T his work is lice nse d unde r the C re a tive C ommons A tribution-N onC ommercia l 3.0 U nported License .To view a copy of this license , visit http://cre a tive commons.org.licenses/by-nc/3.0
2015 | Country Overview Indonesia
Total public sector health expenditure per capita (US$)
Maternal Death Surveillance and Response (MDSR) policy in place, including notification within 24 hrs
Civil Registration and Vital Statistics (CRVS) improvement plan in place
Data for all 3 impact indicators are available, based on data collected in the preceding 3 years,disaggregated by equity stratifiers
169Achievements and Prospects
Country Profiles
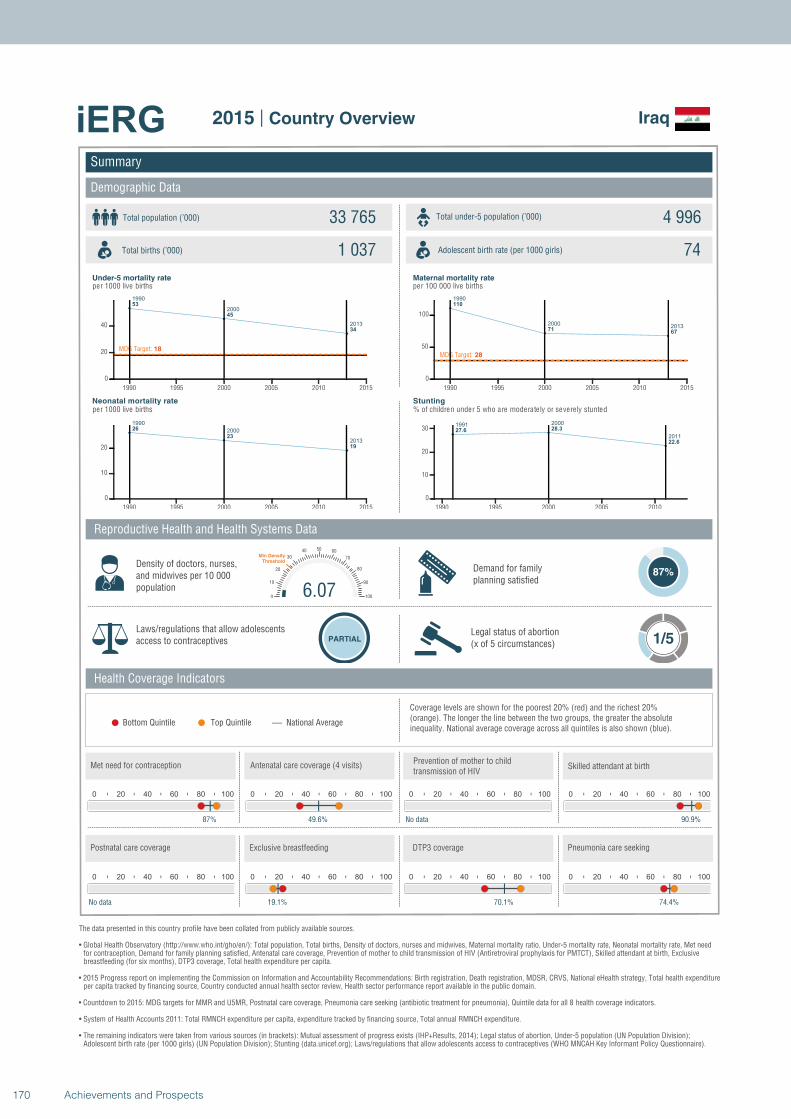
1990
2000
2013
53
45
34
MDG Target: 18
1990 1995 2000 2005 2010 2015
0
20
40
1990
2000
2013
26
23
19
1990 1995 2000 2005 2010 2015
0
10
20
1990
20002013
110
7167
MDG Target: 28
1990 1995 2000 2005 2010 2015
0
50
100
1991 2000
2011
27.6 28.3
22.6
1990 1995 2000 2005 2010
0
10
20
30
Summary
Demographic Data
Iraq
Total population (’000) Total under-5 population (’000)33 765 4 996
1 037 74
Reproductive Health and Health Systems Data
Health Coverage Indicators
Demand for familyplanning satisfied
87%
Laws/regulations that allow adolescents access to contraceptives PARTIAL
Legal status of abortion(x of 5 circumstances) 1/5
National AverageBottom Quintile Top Quintile
per 1000 live births per 100 000 live births
per 1000 live births % of children under 5 who are moderately or severely stunted
0 20 40 60 80 100
87%
0 20 40 60 80 100
49.6%
0 20 40 60 80 100
No data
6.070
10
20
30
40 50 60
70
80
90
100
Min Density Threshold
0 20 40 60 80 100
90.9%
0 20 40 60 80 100
No data
0 20 40 60 80 100
19.1%
0 20 40 60 80 100
70.1%
0 20 40 60 80 100
74.4%
Total births (’000) Adolescent birth rate (per 1000 girls)
Coverage levels are shown for the poorest 20% (red) and the richest 20% (orange). The longer the line between the two groups, the greater the absolute inequality. National average coverage across all quintiles is also shown (blue).
Density of doctors, nurses, and midwives per 10 000 population
Postnatal care coverage Exclusive breastfeeding DTP3 coverage Pneumonia care seeking
Met need for contraception Antenatal care coverage (4 visits)Prevention of mother to child transmission of HIV
Skilled attendant at birth
Under-5 mortality rate Maternal mortality rate
Neonatal mortality rate Stunting
The data presented in this country profile have been collated from publicly available sources.
• Global Health Observatory (http://www.who.int/gho/en/): Total population, Total births, Density of doctors, nurses and midwives, Maternal mortality ratio, Under-5 mortality rate, Neonatal mortality rate, Met need for contraception, Demand for family planning satisfied, Antenatal care coverage, Prevention of mother to child transmission of HIV (Antiretroviral prophylaxis for PMTCT), Skilled attendant at birth, Exclusive breastfeeding (for six months), DTP3 coverage, Total health expenditure per capita.
• 2015 Progress report on implementing the Commission on Information and Accountability Recommendations: Birth registration, Death registration, MDSR, CRVS, National eHealth strategy, Total health expenditureper capita tracked by financing source, Country conducted annual health sector review, Health sector performance report available in the public domain.
• Countdown to 2015: MDG targets for MMR and U5MR, Postnatal care coverage, Pneumonia care seeking (antibiotic treatment for pneumonia), Quintile data for all 8 health coverage indicators.
• System of Health Accounts 2011: Total RMNCH expenditure per capita, expenditure tracked by financing source, Total annual RMNCH expenditure.
• The remaining indicators were taken from various sources (in brackets): Mutual assessment of progress exists (IHP+Results, 2014); Legal status of abortion, Under-5 population (UN Population Division);Adolescent birth rate (per 1000 girls) (UN Population Division); Stunting (data.unicef.org); Laws/regulations that allow adolescents access to contraceptives (WHO MNCAH Key Informant Policy Questionnaire).
2015 | Country Overview
170 Achievements and Prospects
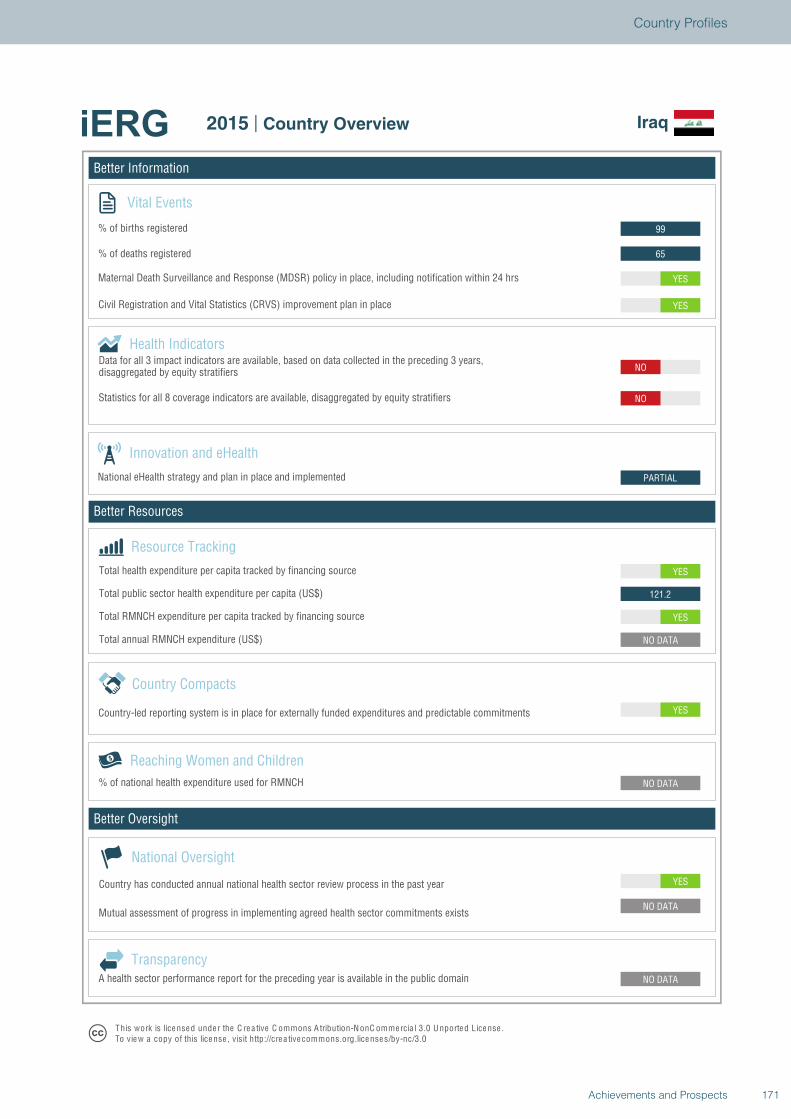
Better Information
Better Resources
Better Oversight
Iraq
Vital Events
% of births registered
% of deaths registered
Innovation and eHealth
National eHealth strategy and plan in place and implemented
Health Indicators
Statistics for all 8 coverage indicators are available, disaggregated by equity stratifiers
Reaching Women and Children
Country Compacts
Country-led reporting system is in place for externally funded expenditures and predictable commitments
Resource Tracking
Total RMNCH expenditure per capita tracked by financing source
Total annual RMNCH expenditure (US$)
Total health expenditure per capita tracked by financing source
% of national health expenditure used for RMNCH
YES
NO DATA
NO DATA
NO DATA
YES
NO DATA
YES
121.2
YES
PARTIAL
NO
NO
YES
YES
65
99
National Oversight
Mutual assessment of progress in implementing agreed health sector commitments exists
Country has conducted annual national health sector review process in the past year
TransparencyA health sector performance report for the preceding year is available in the public domain
T his work is lice nse d unde r the C re a tive C ommons A tribution-N onC ommercia l 3.0 U nported License .To view a copy of this license , visit http://cre a tive commons.org.licenses/by-nc/3.0
2015 | Country Overview Iraq
Total public sector health expenditure per capita (US$)
Maternal Death Surveillance and Response (MDSR) policy in place, including notification within 24 hrs
Civil Registration and Vital Statistics (CRVS) improvement plan in place
Data for all 3 impact indicators are available, based on data collected in the preceding 3 years,disaggregated by equity stratifiers
171Achievements and Prospects
Country Profiles

1990
2000
2013
98.7
110.9
70.7
MDG Target: 33
1990 1995 2000 2005 2010 2015
0
50
100
1990 2000
2013
32.8 32.7
26.3
1990 1995 2000 2005 2010 2015
0
10
20
30
1990
2000
2013
490
570
400
MDG Target: 120
1990 1995 2000 2005 2010 2015
0
200
400
600
1987
2000
200937
41
35.2
1985 1990 1995 2000 2005 2010
0
10
20
30
40
Summary
Demographic Data
Kenya
Total population (’000) Total under-5 population (’000)44 354 7 137
1 535 100
Reproductive Health and Health Systems Data
Health Coverage Indicators
Demand for familyplanning satisfied
64%
Laws/regulations that allow adolescents access to contraceptives YES
Legal status of abortion(x of 5 circumstances) 3/5
National AverageBottom Quintile Top Quintile
per 1000 live births per 100 000 live births
per 1000 live births % of children under 5 who are moderately or severely stunted
0 20 40 60 80 100
64%
0 20 40 60 80 100
47.1%
0 20 40 60 80 100
63.3%
10.610
10
20
30
40 50 60
70
80
90
100
Min Density Threshold
0 20 40 60 80 100
43.8%
0 20 40 60 80 100
No data
0 20 40 60 80 100
31.9%
0 20 40 60 80 100
86.6%
0 20 40 60 80 100
55.9%
Total births (’000) Adolescent birth rate (per 1000 girls)
Coverage levels are shown for the poorest 20% (red) and the richest 20% (orange). The longer the line between the two groups, the greater the absolute inequality. National average coverage across all quintiles is also shown (blue).
Density of doctors, nurses, and midwives per 10 000 population
Postnatal care coverage Exclusive breastfeeding DTP3 coverage Pneumonia care seeking
Met need for contraception Antenatal care coverage (4 visits)Prevention of mother to child transmission of HIV
Skilled attendant at birth
Under-5 mortality rate Maternal mortality rate
Neonatal mortality rate Stunting
The data presented in this country profile have been collated from publicly available sources.
• Global Health Observatory (http://www.who.int/gho/en/): Total population, Total births, Density of doctors, nurses and midwives, Maternal mortality ratio, Under-5 mortality rate, Neonatal mortality rate, Met need for contraception, Demand for family planning satisfied, Antenatal care coverage, Prevention of mother to child transmission of HIV (Antiretroviral prophylaxis for PMTCT), Skilled attendant at birth, Exclusive breastfeeding (for six months), DTP3 coverage, Total health expenditure per capita.
• 2015 Progress report on implementing the Commission on Information and Accountability Recommendations: Birth registration, Death registration, MDSR, CRVS, National eHealth strategy, Total health expenditureper capita tracked by financing source, Country conducted annual health sector review, Health sector performance report available in the public domain.
• Countdown to 2015: MDG targets for MMR and U5MR, Postnatal care coverage, Pneumonia care seeking (antibiotic treatment for pneumonia), Quintile data for all 8 health coverage indicators.
• System of Health Accounts 2011: Total RMNCH expenditure per capita, expenditure tracked by financing source, Total annual RMNCH expenditure.
• The remaining indicators were taken from various sources (in brackets): Mutual assessment of progress exists (IHP+Results, 2014); Legal status of abortion, Under-5 population (UN Population Division);Adolescent birth rate (per 1000 girls) (UN Population Division); Stunting (data.unicef.org); Laws/regulations that allow adolescents access to contraceptives (WHO MNCAH Key Informant Policy Questionnaire).
2015 | Country Overview
172 Achievements and Prospects
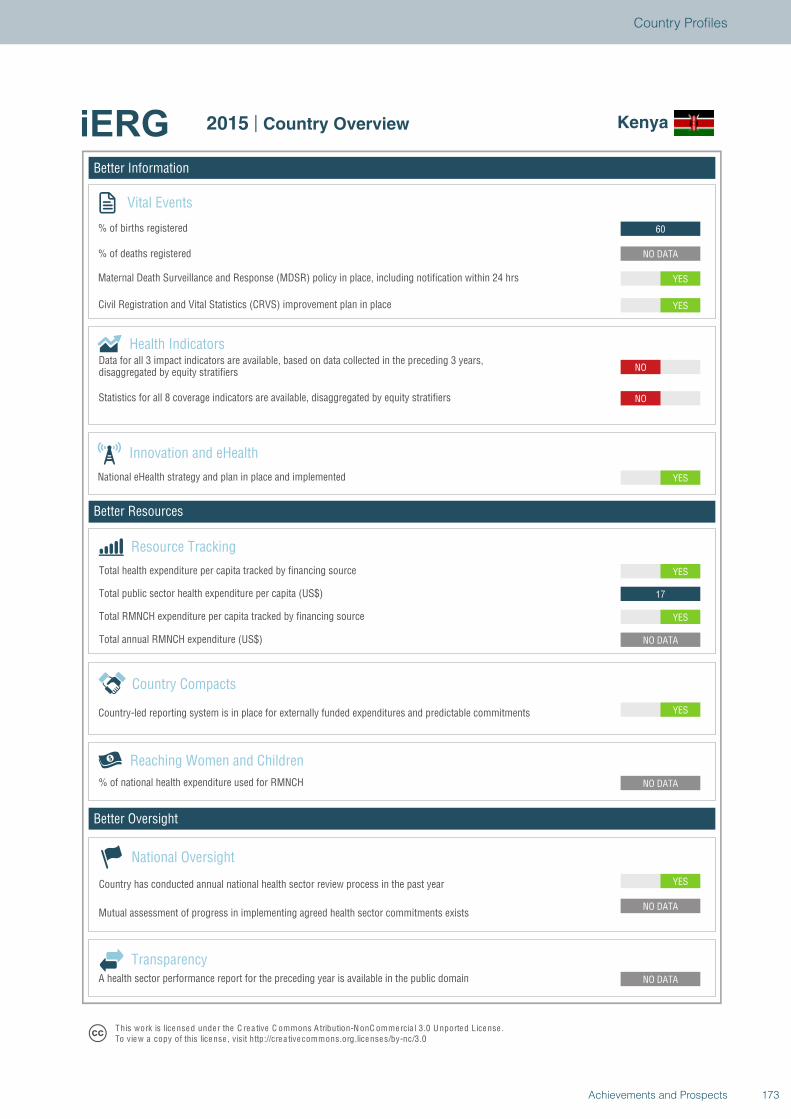
Better Information
Better Resources
Better Oversight
Kenya
Vital Events
% of births registered
% of deaths registered
Innovation and eHealth
National eHealth strategy and plan in place and implemented
Health Indicators
Statistics for all 8 coverage indicators are available, disaggregated by equity stratifiers
Reaching Women and Children
Country Compacts
Country-led reporting system is in place for externally funded expenditures and predictable commitments
Resource Tracking
Total RMNCH expenditure per capita tracked by financing source
Total annual RMNCH expenditure (US$)
Total health expenditure per capita tracked by financing source
% of national health expenditure used for RMNCH
YES
NO DATA
NO DATA
NO DATA
YES
NO DATA
YES
17
YES
YES
NO
NO
YES
YES
NO DATA
60
National Oversight
Mutual assessment of progress in implementing agreed health sector commitments exists
Country has conducted annual national health sector review process in the past year
TransparencyA health sector performance report for the preceding year is available in the public domain
T his work is lice nse d unde r the C re a tive C ommons A tribution-N onC ommercia l 3.0 U nported License .To view a copy of this license , visit http://cre a tive commons.org.licenses/by-nc/3.0
2015 | Country Overview Kenya
Total public sector health expenditure per capita (US$)
Maternal Death Surveillance and Response (MDSR) policy in place, including notification within 24 hrs
Civil Registration and Vital Statistics (CRVS) improvement plan in place
Data for all 3 impact indicators are available, based on data collected in the preceding 3 years,disaggregated by equity stratifiers
173Achievements and Prospects
Country Profiles
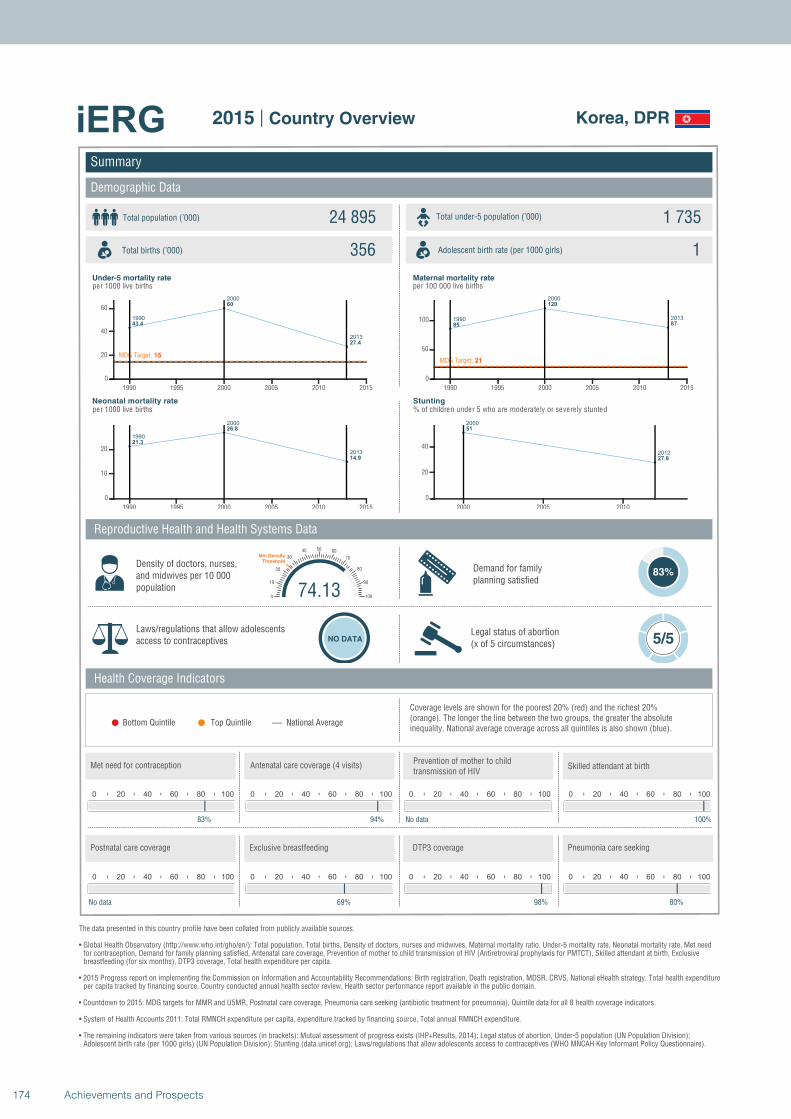
1990
2000
2013
43.4
60
27.4
MDG Target: 15
1990 1995 2000 2005 2010 2015
0
20
40
60
1990
2000
2013
21.3
26.8
14.9
1990 1995 2000 2005 2010 2015
0
10
20
1990
2000
2013
85
120
87
MDG Target: 21
1990 1995 2000 2005 2010 2015
0
50
100
2000
2012
51
27.9
2000 2005 2010
0
20
40
Summary
Demographic Data
Korea, DPR
Total population (’000) Total under-5 population (’000)24 895 1 735
356 1
Reproductive Health and Health Systems Data
Health Coverage Indicators
Demand for familyplanning satisfied
83%
Laws/regulations that allow adolescents access to contraceptives NO DATA
Legal status of abortion(x of 5 circumstances) 5/5
National AverageBottom Quintile Top Quintile
per 1000 live births per 100 000 live births
per 1000 live births % of children under 5 who are moderately or severely stunted
0 20 40 60 80 100
83%
0 20 40 60 80 100
94%
0 20 40 60 80 100
No data
74.130
10
20
30
40 50 60
70
80
90
100
Min Density Threshold
0 20 40 60 80 100
100%
0 20 40 60 80 100
No data
0 20 40 60 80 100
69%
0 20 40 60 80 100
98%
0 20 40 60 80 100
80%
Total births (’000) Adolescent birth rate (per 1000 girls)
Coverage levels are shown for the poorest 20% (red) and the richest 20% (orange). The longer the line between the two groups, the greater the absolute inequality. National average coverage across all quintiles is also shown (blue).
Density of doctors, nurses, and midwives per 10 000 population
Postnatal care coverage Exclusive breastfeeding DTP3 coverage Pneumonia care seeking
Met need for contraception Antenatal care coverage (4 visits)Prevention of mother to child transmission of HIV
Skilled attendant at birth
Under-5 mortality rate Maternal mortality rate
Neonatal mortality rate Stunting
The data presented in this country profile have been collated from publicly available sources.
• Global Health Observatory (http://www.who.int/gho/en/): Total population, Total births, Density of doctors, nurses and midwives, Maternal mortality ratio, Under-5 mortality rate, Neonatal mortality rate, Met need for contraception, Demand for family planning satisfied, Antenatal care coverage, Prevention of mother to child transmission of HIV (Antiretroviral prophylaxis for PMTCT), Skilled attendant at birth, Exclusive breastfeeding (for six months), DTP3 coverage, Total health expenditure per capita.
• 2015 Progress report on implementing the Commission on Information and Accountability Recommendations: Birth registration, Death registration, MDSR, CRVS, National eHealth strategy, Total health expenditureper capita tracked by financing source, Country conducted annual health sector review, Health sector performance report available in the public domain.
• Countdown to 2015: MDG targets for MMR and U5MR, Postnatal care coverage, Pneumonia care seeking (antibiotic treatment for pneumonia), Quintile data for all 8 health coverage indicators.
• System of Health Accounts 2011: Total RMNCH expenditure per capita, expenditure tracked by financing source, Total annual RMNCH expenditure.
• The remaining indicators were taken from various sources (in brackets): Mutual assessment of progress exists (IHP+Results, 2014); Legal status of abortion, Under-5 population (UN Population Division);Adolescent birth rate (per 1000 girls) (UN Population Division); Stunting (data.unicef.org); Laws/regulations that allow adolescents access to contraceptives (WHO MNCAH Key Informant Policy Questionnaire).
2015 | Country Overview
174 Achievements and Prospects
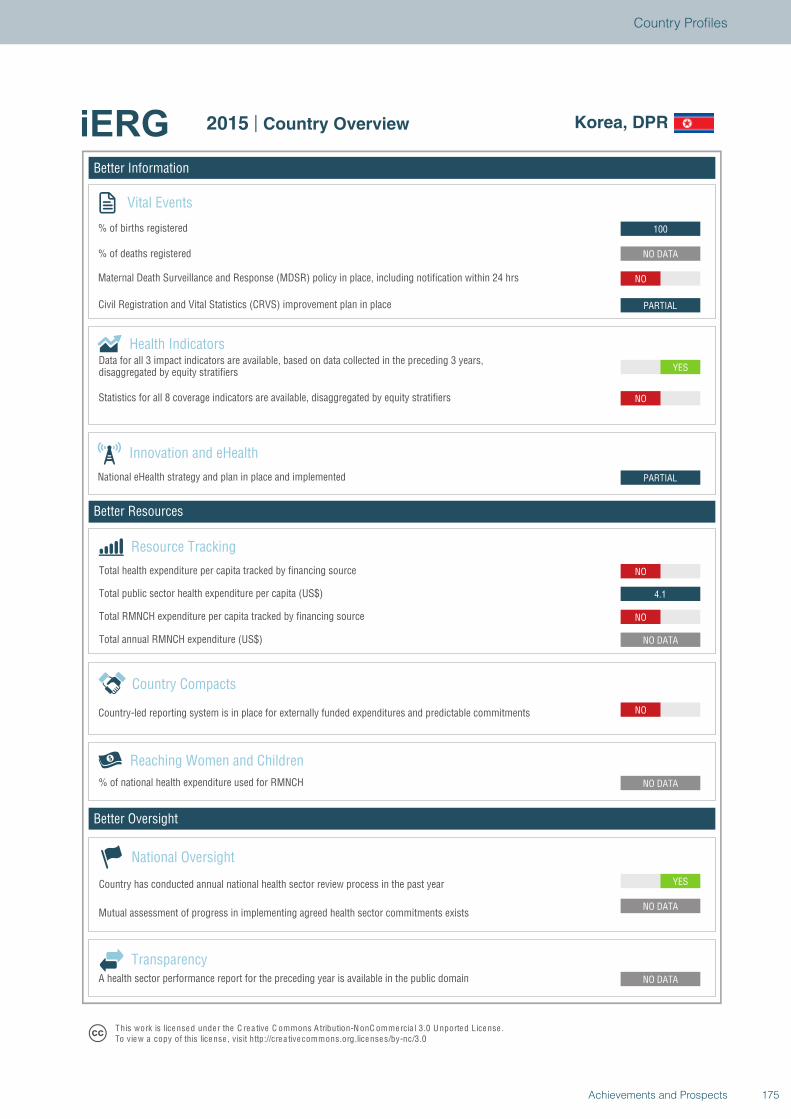
Better Information
Better Resources
Better Oversight
Korea, DPR
Vital Events
% of births registered
% of deaths registered
Innovation and eHealth
National eHealth strategy and plan in place and implemented
Health Indicators
Statistics for all 8 coverage indicators are available, disaggregated by equity stratifiers
Reaching Women and Children
Country Compacts
Country-led reporting system is in place for externally funded expenditures and predictable commitments
Resource Tracking
Total RMNCH expenditure per capita tracked by financing source
Total annual RMNCH expenditure (US$)
Total health expenditure per capita tracked by financing source
% of national health expenditure used for RMNCH
YES
NO DATA
NO DATA
NO DATA
NO
NO DATA
NO
4.1
NO
PARTIAL
YES
NO
PARTIAL
NO
NO DATA
100
National Oversight
Mutual assessment of progress in implementing agreed health sector commitments exists
Country has conducted annual national health sector review process in the past year
TransparencyA health sector performance report for the preceding year is available in the public domain
T his work is lice nse d unde r the C re a tive C ommons A tribution-N onC ommercia l 3.0 U nported License .To view a copy of this license , visit http://cre a tive commons.org.licenses/by-nc/3.0
2015 | Country Overview Korea, DPR
Total public sector health expenditure per capita (US$)
Maternal Death Surveillance and Response (MDSR) policy in place, including notification within 24 hrs
Civil Registration and Vital Statistics (CRVS) improvement plan in place
Data for all 3 impact indicators are available, based on data collected in the preceding 3 years,disaggregated by equity stratifiers
175Achievements and Prospects
Country Profiles
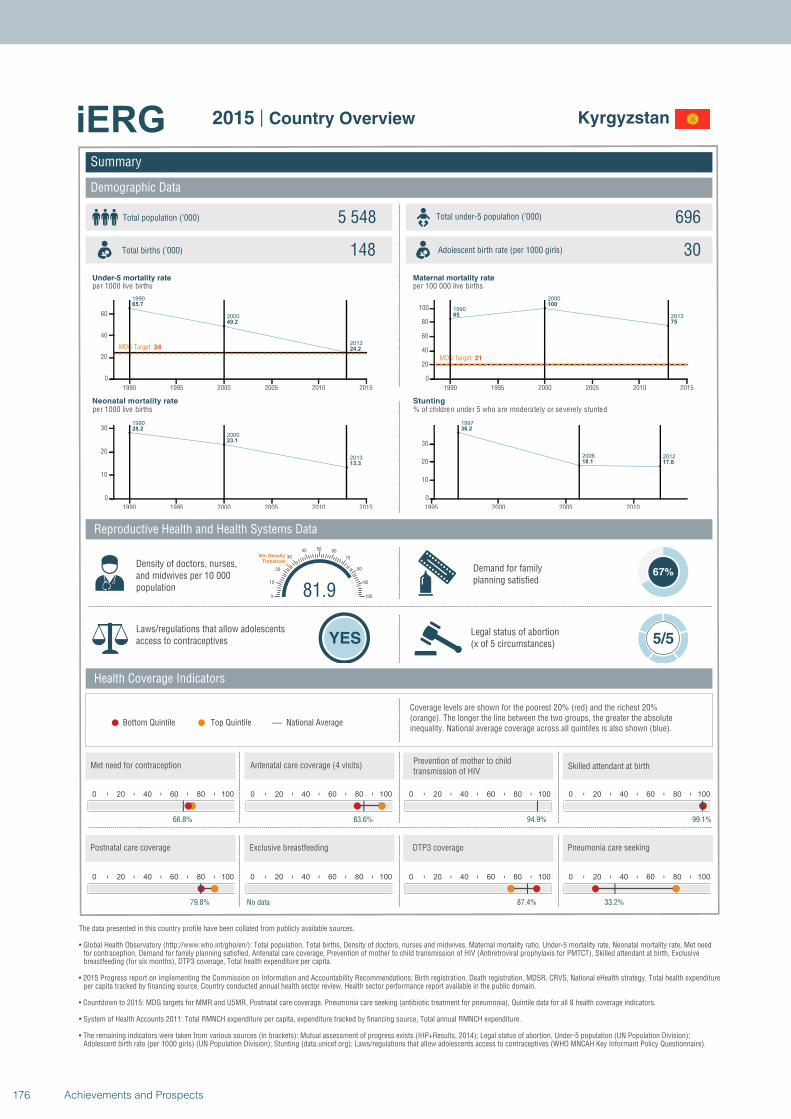
1990
2000
2013
65.7
49.2
24.2MDG Target: 24
1990 1995 2000 2005 2010 2015
0
20
40
60
1990
2000
2013
28.2
23.1
13.3
1990 1995 2000 2005 2010 2015
0
10
20
30
1990
2000
201385
100
75
MDG Target: 21
1990 1995 2000 2005 2010 2015
0
20
40
60
80
100
1997
2006 2012
36.2
18.1 17.8
1995 2000 2005 2010
0
10
20
30
Summary
Demographic Data
Kyrgyzstan
Total population (’000) Total under-5 population (’000)5 548 696
148 30
Reproductive Health and Health Systems Data
Health Coverage Indicators
Demand for familyplanning satisfied
67%
Laws/regulations that allow adolescents access to contraceptives YES
Legal status of abortion(x of 5 circumstances) 5/5
National AverageBottom Quintile Top Quintile
per 1000 live births per 100 000 live births
per 1000 live births % of children under 5 who are moderately or severely stunted
0 20 40 60 80 100
66.8%
0 20 40 60 80 100
83.6%
0 20 40 60 80 100
94.9%
81.90
10
20
30
40 50 60
70
80
90
100
Min Density Threshold
0 20 40 60 80 100
99.1%
0 20 40 60 80 100
79.8%
0 20 40 60 80 100
No data
0 20 40 60 80 100
87.4%
0 20 40 60 80 100
33.2%
Total births (’000) Adolescent birth rate (per 1000 girls)
Coverage levels are shown for the poorest 20% (red) and the richest 20% (orange). The longer the line between the two groups, the greater the absolute inequality. National average coverage across all quintiles is also shown (blue).
Density of doctors, nurses, and midwives per 10 000 population
Postnatal care coverage Exclusive breastfeeding DTP3 coverage Pneumonia care seeking
Met need for contraception Antenatal care coverage (4 visits)Prevention of mother to child transmission of HIV
Skilled attendant at birth
Under-5 mortality rate Maternal mortality rate
Neonatal mortality rate Stunting
The data presented in this country profile have been collated from publicly available sources.
• Global Health Observatory (http://www.who.int/gho/en/): Total population, Total births, Density of doctors, nurses and midwives, Maternal mortality ratio, Under-5 mortality rate, Neonatal mortality rate, Met need for contraception, Demand for family planning satisfied, Antenatal care coverage, Prevention of mother to child transmission of HIV (Antiretroviral prophylaxis for PMTCT), Skilled attendant at birth, Exclusive breastfeeding (for six months), DTP3 coverage, Total health expenditure per capita.
• 2015 Progress report on implementing the Commission on Information and Accountability Recommendations: Birth registration, Death registration, MDSR, CRVS, National eHealth strategy, Total health expenditureper capita tracked by financing source, Country conducted annual health sector review, Health sector performance report available in the public domain.
• Countdown to 2015: MDG targets for MMR and U5MR, Postnatal care coverage, Pneumonia care seeking (antibiotic treatment for pneumonia), Quintile data for all 8 health coverage indicators.
• System of Health Accounts 2011: Total RMNCH expenditure per capita, expenditure tracked by financing source, Total annual RMNCH expenditure.
• The remaining indicators were taken from various sources (in brackets): Mutual assessment of progress exists (IHP+Results, 2014); Legal status of abortion, Under-5 population (UN Population Division);Adolescent birth rate (per 1000 girls) (UN Population Division); Stunting (data.unicef.org); Laws/regulations that allow adolescents access to contraceptives (WHO MNCAH Key Informant Policy Questionnaire).
2015 | Country Overview
176 Achievements and Prospects
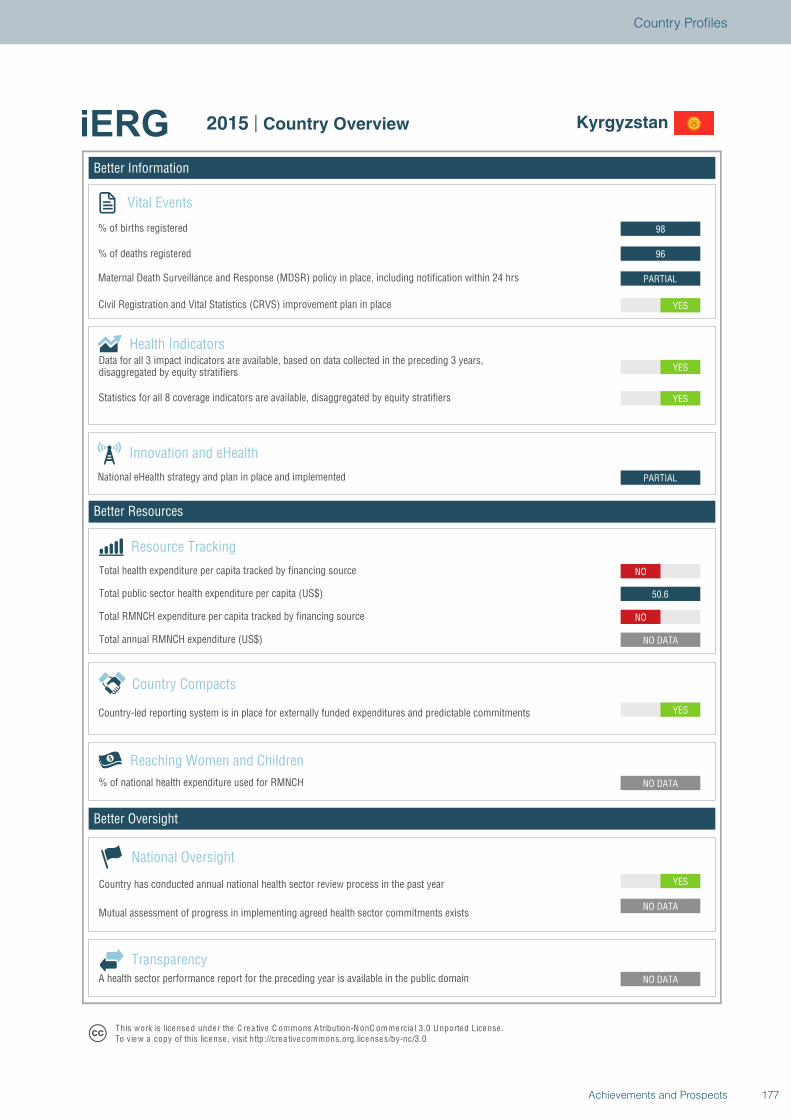
Better Information
Better Resources
Better Oversight
Kyrgyzstan
Vital Events
% of births registered
% of deaths registered
Innovation and eHealth
National eHealth strategy and plan in place and implemented
Health Indicators
Statistics for all 8 coverage indicators are available, disaggregated by equity stratifiers
Reaching Women and Children
Country Compacts
Country-led reporting system is in place for externally funded expenditures and predictable commitments
Resource Tracking
Total RMNCH expenditure per capita tracked by financing source
Total annual RMNCH expenditure (US$)
Total health expenditure per capita tracked by financing source
% of national health expenditure used for RMNCH
YES
NO DATA
NO DATA
NO DATA
YES
NO DATA
NO
50.6
NO
PARTIAL
YES
YES
YES
PARTIAL
96
98
National Oversight
Mutual assessment of progress in implementing agreed health sector commitments exists
Country has conducted annual national health sector review process in the past year
TransparencyA health sector performance report for the preceding year is available in the public domain
T his work is lice nse d unde r the C re a tive C ommons A tribution-N onC ommercia l 3.0 U nported License .To view a copy of this license , visit http://cre a tive commons.org.licenses/by-nc/3.0
2015 | Country Overview Kyrgyzstan
Total public sector health expenditure per capita (US$)
Maternal Death Surveillance and Response (MDSR) policy in place, including notification within 24 hrs
Civil Registration and Vital Statistics (CRVS) improvement plan in place
Data for all 3 impact indicators are available, based on data collected in the preceding 3 years,disaggregated by equity stratifiers
177Achievements and Prospects
Country Profiles
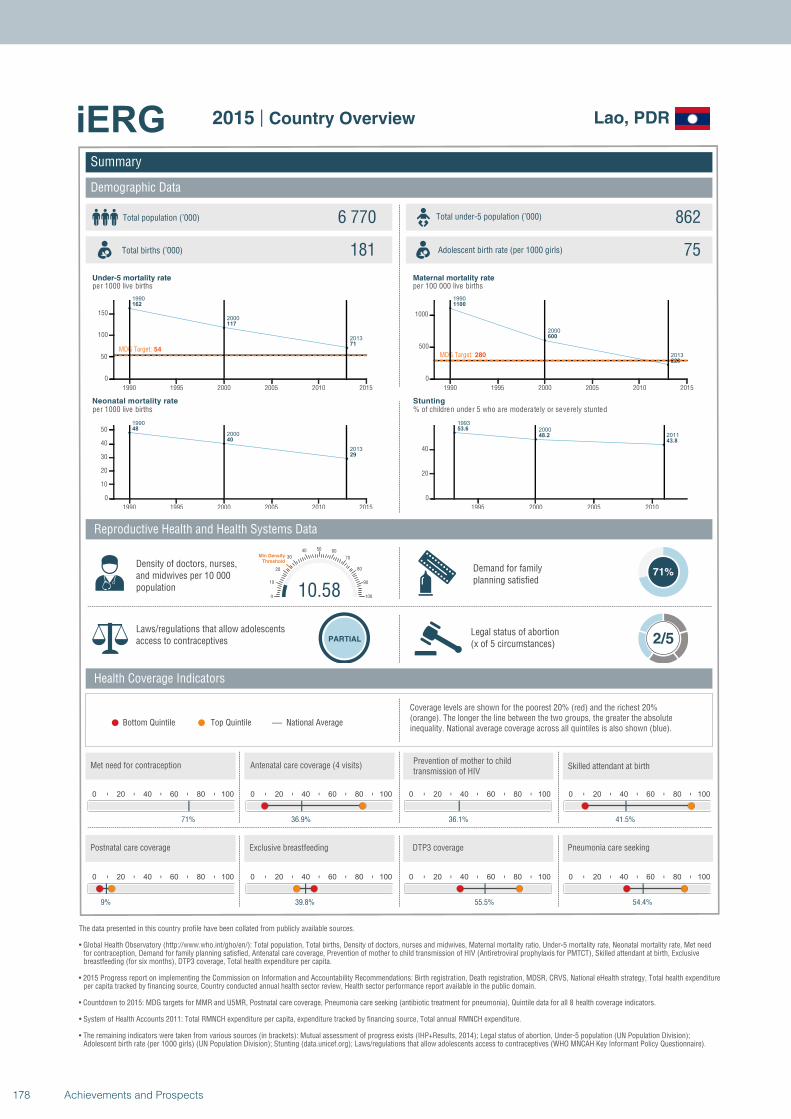
1990
2000
2013
162
117
71
MDG Target: 54
1990 1995 2000 2005 2010 2015
0
50
100
150
1990
2000
2013
48
40
29
1990 1995 2000 2005 2010 2015
0
10
20
30
40
50
1990
2000
2013
1100
600
220
MDG Target: 280
1990 1995 2000 2005 2010 2015
0
500
1000
1993
2000
2011
53.6
48.2
43.8
1995 2000 2005 2010
0
20
40
Summary
Demographic Data
Lao, PDR
Total population (’000) Total under-5 population (’000)6 770 862
181 75
Reproductive Health and Health Systems Data
Health Coverage Indicators
Demand for familyplanning satisfied
71%
Laws/regulations that allow adolescents access to contraceptives PARTIAL
Legal status of abortion(x of 5 circumstances) 2/5
National AverageBottom Quintile Top Quintile
per 1000 live births per 100 000 live births
per 1000 live births % of children under 5 who are moderately or severely stunted
0 20 40 60 80 100
71%
0 20 40 60 80 100
36.9%
0 20 40 60 80 100
36.1%
10.580
10
20
30
40 50 60
70
80
90
100
Min Density Threshold
0 20 40 60 80 100
41.5%
0 20 40 60 80 100
9%
0 20 40 60 80 100
39.8%
0 20 40 60 80 100
55.5%
0 20 40 60 80 100
54.4%
Total births (’000) Adolescent birth rate (per 1000 girls)
Coverage levels are shown for the poorest 20% (red) and the richest 20% (orange). The longer the line between the two groups, the greater the absolute inequality. National average coverage across all quintiles is also shown (blue).
Density of doctors, nurses, and midwives per 10 000 population
Postnatal care coverage Exclusive breastfeeding DTP3 coverage Pneumonia care seeking
Met need for contraception Antenatal care coverage (4 visits)Prevention of mother to child transmission of HIV
Skilled attendant at birth
Under-5 mortality rate Maternal mortality rate
Neonatal mortality rate Stunting
The data presented in this country profile have been collated from publicly available sources.
• Global Health Observatory (http://www.who.int/gho/en/): Total population, Total births, Density of doctors, nurses and midwives, Maternal mortality ratio, Under-5 mortality rate, Neonatal mortality rate, Met need for contraception, Demand for family planning satisfied, Antenatal care coverage, Prevention of mother to child transmission of HIV (Antiretroviral prophylaxis for PMTCT), Skilled attendant at birth, Exclusive breastfeeding (for six months), DTP3 coverage, Total health expenditure per capita.
• 2015 Progress report on implementing the Commission on Information and Accountability Recommendations: Birth registration, Death registration, MDSR, CRVS, National eHealth strategy, Total health expenditureper capita tracked by financing source, Country conducted annual health sector review, Health sector performance report available in the public domain.
• Countdown to 2015: MDG targets for MMR and U5MR, Postnatal care coverage, Pneumonia care seeking (antibiotic treatment for pneumonia), Quintile data for all 8 health coverage indicators.
• System of Health Accounts 2011: Total RMNCH expenditure per capita, expenditure tracked by financing source, Total annual RMNCH expenditure.
• The remaining indicators were taken from various sources (in brackets): Mutual assessment of progress exists (IHP+Results, 2014); Legal status of abortion, Under-5 population (UN Population Division);Adolescent birth rate (per 1000 girls) (UN Population Division); Stunting (data.unicef.org); Laws/regulations that allow adolescents access to contraceptives (WHO MNCAH Key Informant Policy Questionnaire).
2015 | Country Overview
178 Achievements and Prospects
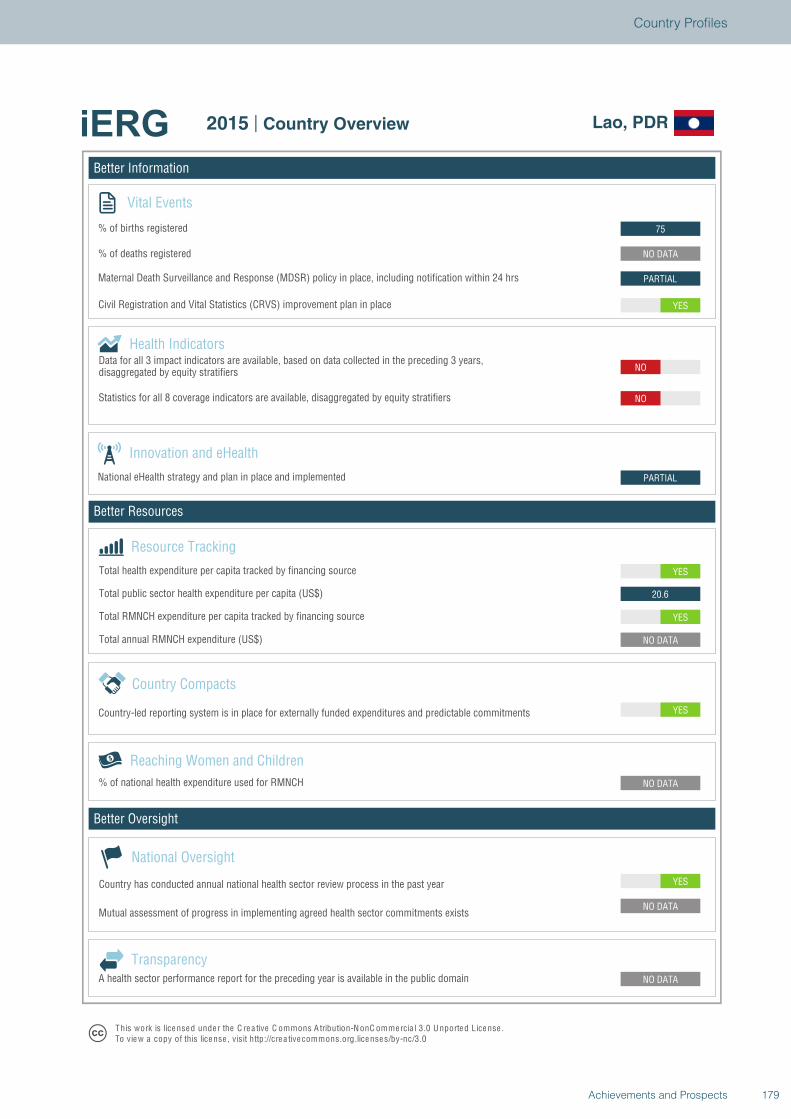
Better Information
Better Resources
Better Oversight
Lao, PDR
Vital Events
% of births registered
% of deaths registered
Innovation and eHealth
National eHealth strategy and plan in place and implemented
Health Indicators
Statistics for all 8 coverage indicators are available, disaggregated by equity stratifiers
Reaching Women and Children
Country Compacts
Country-led reporting system is in place for externally funded expenditures and predictable commitments
Resource Tracking
Total RMNCH expenditure per capita tracked by financing source
Total annual RMNCH expenditure (US$)
Total health expenditure per capita tracked by financing source
% of national health expenditure used for RMNCH
YES
NO DATA
NO DATA
NO DATA
YES
NO DATA
YES
20.6
YES
PARTIAL
NO
NO
YES
PARTIAL
NO DATA
75
National Oversight
Mutual assessment of progress in implementing agreed health sector commitments exists
Country has conducted annual national health sector review process in the past year
TransparencyA health sector performance report for the preceding year is available in the public domain
T his work is lice nse d unde r the C re a tive C ommons A tribution-N onC ommercia l 3.0 U nported License .To view a copy of this license , visit http://cre a tive commons.org.licenses/by-nc/3.0
2015 | Country Overview Lao, PDR
Total public sector health expenditure per capita (US$)
Maternal Death Surveillance and Response (MDSR) policy in place, including notification within 24 hrs
Civil Registration and Vital Statistics (CRVS) improvement plan in place
Data for all 3 impact indicators are available, based on data collected in the preceding 3 years,disaggregated by equity stratifiers
179Achievements and Prospects
Country Profiles
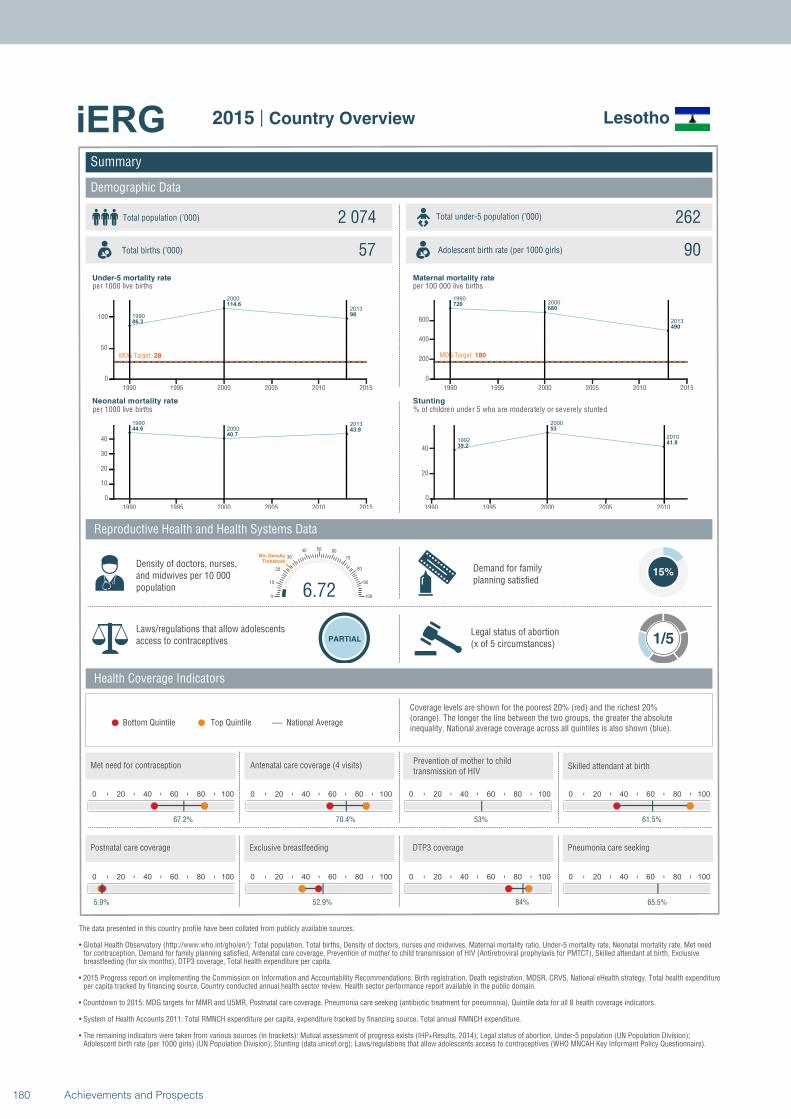
1990
2000
2013
86.3
114.6
98
MDG Target: 28
1990 1995 2000 2005 2010 2015
0
50
100
1990
20002013
44.6
40.743.9
1990 1995 2000 2005 2010 2015
0
10
20
30
40
19902000
2013
720680
490
MDG Target: 180
1990 1995 2000 2005 2010 2015
0
200
400
600
1992
2000
2010
39.2
53
41.8
1990 1995 2000 2005 2010
0
20
40
Summary
Demographic Data
Lesotho
Total population (’000) Total under-5 population (’000)2 074 262
57 90
Reproductive Health and Health Systems Data
Health Coverage Indicators
Demand for familyplanning satisfied
15%
Laws/regulations that allow adolescents access to contraceptives PARTIAL
Legal status of abortion(x of 5 circumstances) 1/5
National AverageBottom Quintile Top Quintile
per 1000 live births per 100 000 live births
per 1000 live births % of children under 5 who are moderately or severely stunted
0 20 40 60 80 100
67.2%
0 20 40 60 80 100
70.4%
0 20 40 60 80 100
53%
6.720
10
20
30
40 50 60
70
80
90
100
Min Density Threshold
0 20 40 60 80 100
61.5%
0 20 40 60 80 100
5.9%
0 20 40 60 80 100
52.9%
0 20 40 60 80 100
84%
0 20 40 60 80 100
65.5%
Total births (’000) Adolescent birth rate (per 1000 girls)
Coverage levels are shown for the poorest 20% (red) and the richest 20% (orange). The longer the line between the two groups, the greater the absolute inequality. National average coverage across all quintiles is also shown (blue).
Density of doctors, nurses, and midwives per 10 000 population
Postnatal care coverage Exclusive breastfeeding DTP3 coverage Pneumonia care seeking
Met need for contraception Antenatal care coverage (4 visits)Prevention of mother to child transmission of HIV
Skilled attendant at birth
Under-5 mortality rate Maternal mortality rate
Neonatal mortality rate Stunting
The data presented in this country profile have been collated from publicly available sources.
• Global Health Observatory (http://www.who.int/gho/en/): Total population, Total births, Density of doctors, nurses and midwives, Maternal mortality ratio, Under-5 mortality rate, Neonatal mortality rate, Met need for contraception, Demand for family planning satisfied, Antenatal care coverage, Prevention of mother to child transmission of HIV (Antiretroviral prophylaxis for PMTCT), Skilled attendant at birth, Exclusive breastfeeding (for six months), DTP3 coverage, Total health expenditure per capita.
• 2015 Progress report on implementing the Commission on Information and Accountability Recommendations: Birth registration, Death registration, MDSR, CRVS, National eHealth strategy, Total health expenditureper capita tracked by financing source, Country conducted annual health sector review, Health sector performance report available in the public domain.
• Countdown to 2015: MDG targets for MMR and U5MR, Postnatal care coverage, Pneumonia care seeking (antibiotic treatment for pneumonia), Quintile data for all 8 health coverage indicators.
• System of Health Accounts 2011: Total RMNCH expenditure per capita, expenditure tracked by financing source, Total annual RMNCH expenditure.
• The remaining indicators were taken from various sources (in brackets): Mutual assessment of progress exists (IHP+Results, 2014); Legal status of abortion, Under-5 population (UN Population Division);Adolescent birth rate (per 1000 girls) (UN Population Division); Stunting (data.unicef.org); Laws/regulations that allow adolescents access to contraceptives (WHO MNCAH Key Informant Policy Questionnaire).
2015 | Country Overview
180 Achievements and Prospects
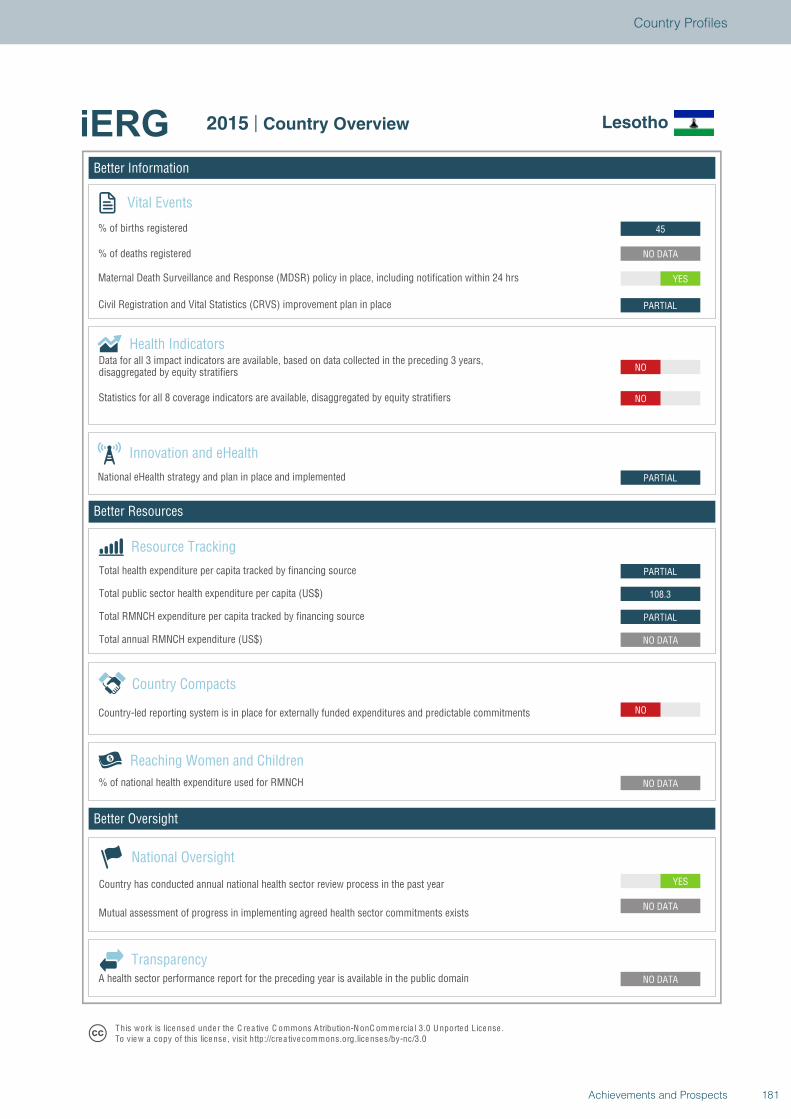
Better Information
Better Resources
Better Oversight
Lesotho
Vital Events
% of births registered
% of deaths registered
Innovation and eHealth
National eHealth strategy and plan in place and implemented
Health Indicators
Statistics for all 8 coverage indicators are available, disaggregated by equity stratifiers
Reaching Women and Children
Country Compacts
Country-led reporting system is in place for externally funded expenditures and predictable commitments
Resource Tracking
Total RMNCH expenditure per capita tracked by financing source
Total annual RMNCH expenditure (US$)
Total health expenditure per capita tracked by financing source
% of national health expenditure used for RMNCH
YES
NO DATA
NO DATA
NO DATA
NO
NO DATA
PARTIAL
108.3
PARTIAL
PARTIAL
NO
NO
PARTIAL
YES
NO DATA
45
National Oversight
Mutual assessment of progress in implementing agreed health sector commitments exists
Country has conducted annual national health sector review process in the past year
TransparencyA health sector performance report for the preceding year is available in the public domain
T his work is lice nse d unde r the C re a tive C ommons A tribution-N onC ommercia l 3.0 U nported License .To view a copy of this license , visit http://cre a tive commons.org.licenses/by-nc/3.0
2015 | Country Overview Lesotho
Total public sector health expenditure per capita (US$)
Maternal Death Surveillance and Response (MDSR) policy in place, including notification within 24 hrs
Civil Registration and Vital Statistics (CRVS) improvement plan in place
Data for all 3 impact indicators are available, based on data collected in the preceding 3 years,disaggregated by equity stratifiers
181Achievements and Prospects
Country Profiles
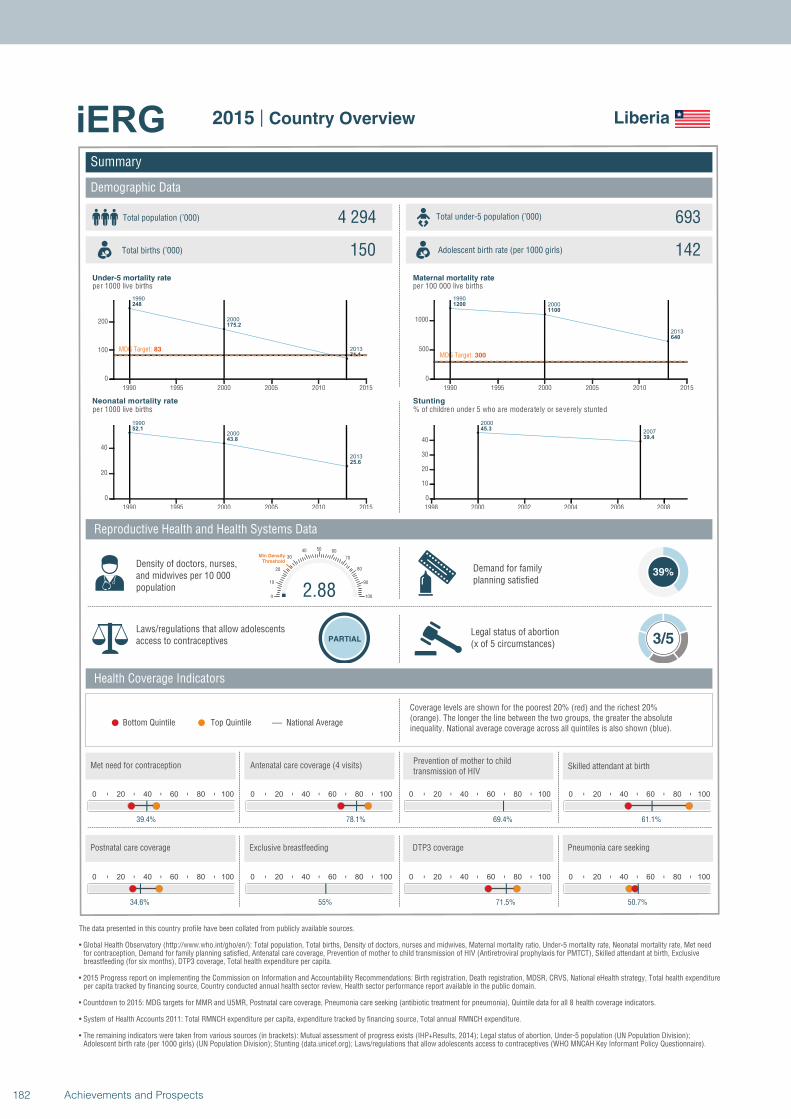
1990
2000
2013
248
175.2
71.1MDG Target: 83
1990 1995 2000 2005 2010 2015
0
100
200
1990
2000
2013
52.1
43.8
25.6
1990 1995 2000 2005 2010 2015
0
20
40
1990
2000
2013
1200
1100
640
MDG Target: 300
1990 1995 2000 2005 2010 2015
0
500
1000
2000
200745.3
39.4
1998 2000 2002 2004 2006 2008
0
10
20
30
40
Summary
Demographic Data
Liberia
Total population (’000) Total under-5 population (’000)4 294 693
150 142
Reproductive Health and Health Systems Data
Health Coverage Indicators
Demand for familyplanning satisfied
39%
Laws/regulations that allow adolescents access to contraceptives PARTIAL
Legal status of abortion(x of 5 circumstances) 3/5
National AverageBottom Quintile Top Quintile
per 1000 live births per 100 000 live births
per 1000 live births % of children under 5 who are moderately or severely stunted
0 20 40 60 80 100
39.4%
0 20 40 60 80 100
78.1%
0 20 40 60 80 100
69.4%
2.880
10
20
30
40 50 60
70
80
90
100
Min Density Threshold
0 20 40 60 80 100
61.1%
0 20 40 60 80 100
34.6%
0 20 40 60 80 100
55%
0 20 40 60 80 100
71.5%
0 20 40 60 80 100
50.7%
Total births (’000) Adolescent birth rate (per 1000 girls)
Coverage levels are shown for the poorest 20% (red) and the richest 20% (orange). The longer the line between the two groups, the greater the absolute inequality. National average coverage across all quintiles is also shown (blue).
Density of doctors, nurses, and midwives per 10 000 population
Postnatal care coverage Exclusive breastfeeding DTP3 coverage Pneumonia care seeking
Met need for contraception Antenatal care coverage (4 visits)Prevention of mother to child transmission of HIV
Skilled attendant at birth
Under-5 mortality rate Maternal mortality rate
Neonatal mortality rate Stunting
The data presented in this country profile have been collated from publicly available sources.
• Global Health Observatory (http://www.who.int/gho/en/): Total population, Total births, Density of doctors, nurses and midwives, Maternal mortality ratio, Under-5 mortality rate, Neonatal mortality rate, Met need for contraception, Demand for family planning satisfied, Antenatal care coverage, Prevention of mother to child transmission of HIV (Antiretroviral prophylaxis for PMTCT), Skilled attendant at birth, Exclusive breastfeeding (for six months), DTP3 coverage, Total health expenditure per capita.
• 2015 Progress report on implementing the Commission on Information and Accountability Recommendations: Birth registration, Death registration, MDSR, CRVS, National eHealth strategy, Total health expenditureper capita tracked by financing source, Country conducted annual health sector review, Health sector performance report available in the public domain.
• Countdown to 2015: MDG targets for MMR and U5MR, Postnatal care coverage, Pneumonia care seeking (antibiotic treatment for pneumonia), Quintile data for all 8 health coverage indicators.
• System of Health Accounts 2011: Total RMNCH expenditure per capita, expenditure tracked by financing source, Total annual RMNCH expenditure.
• The remaining indicators were taken from various sources (in brackets): Mutual assessment of progress exists (IHP+Results, 2014); Legal status of abortion, Under-5 population (UN Population Division);Adolescent birth rate (per 1000 girls) (UN Population Division); Stunting (data.unicef.org); Laws/regulations that allow adolescents access to contraceptives (WHO MNCAH Key Informant Policy Questionnaire).
2015 | Country Overview
182 Achievements and Prospects
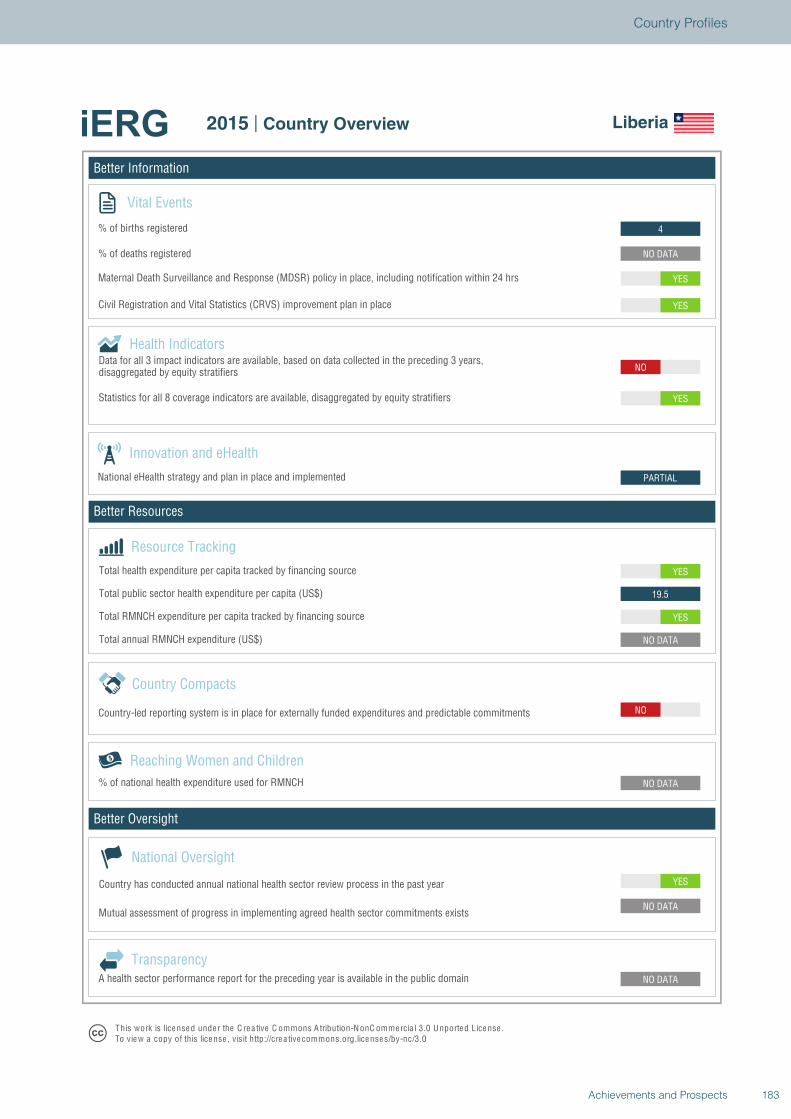
Better Information
Better Resources
Better Oversight
Liberia
Vital Events
% of births registered
% of deaths registered
Innovation and eHealth
National eHealth strategy and plan in place and implemented
Health Indicators
Statistics for all 8 coverage indicators are available, disaggregated by equity stratifiers
Reaching Women and Children
Country Compacts
Country-led reporting system is in place for externally funded expenditures and predictable commitments
Resource Tracking
Total RMNCH expenditure per capita tracked by financing source
Total annual RMNCH expenditure (US$)
Total health expenditure per capita tracked by financing source
% of national health expenditure used for RMNCH
YES
NO DATA
NO DATA
NO DATA
NO
NO DATA
YES
19.5
YES
PARTIAL
NO
YES
YES
YES
NO DATA
4
National Oversight
Mutual assessment of progress in implementing agreed health sector commitments exists
Country has conducted annual national health sector review process in the past year
TransparencyA health sector performance report for the preceding year is available in the public domain
T his work is lice nse d unde r the C re a tive C ommons A tribution-N onC ommercia l 3.0 U nported License .To view a copy of this license , visit http://cre a tive commons.org.licenses/by-nc/3.0
2015 | Country Overview Liberia
Total public sector health expenditure per capita (US$)
Maternal Death Surveillance and Response (MDSR) policy in place, including notification within 24 hrs
Civil Registration and Vital Statistics (CRVS) improvement plan in place
Data for all 3 impact indicators are available, based on data collected in the preceding 3 years,disaggregated by equity stratifiers
183Achievements and Prospects
Country Profiles
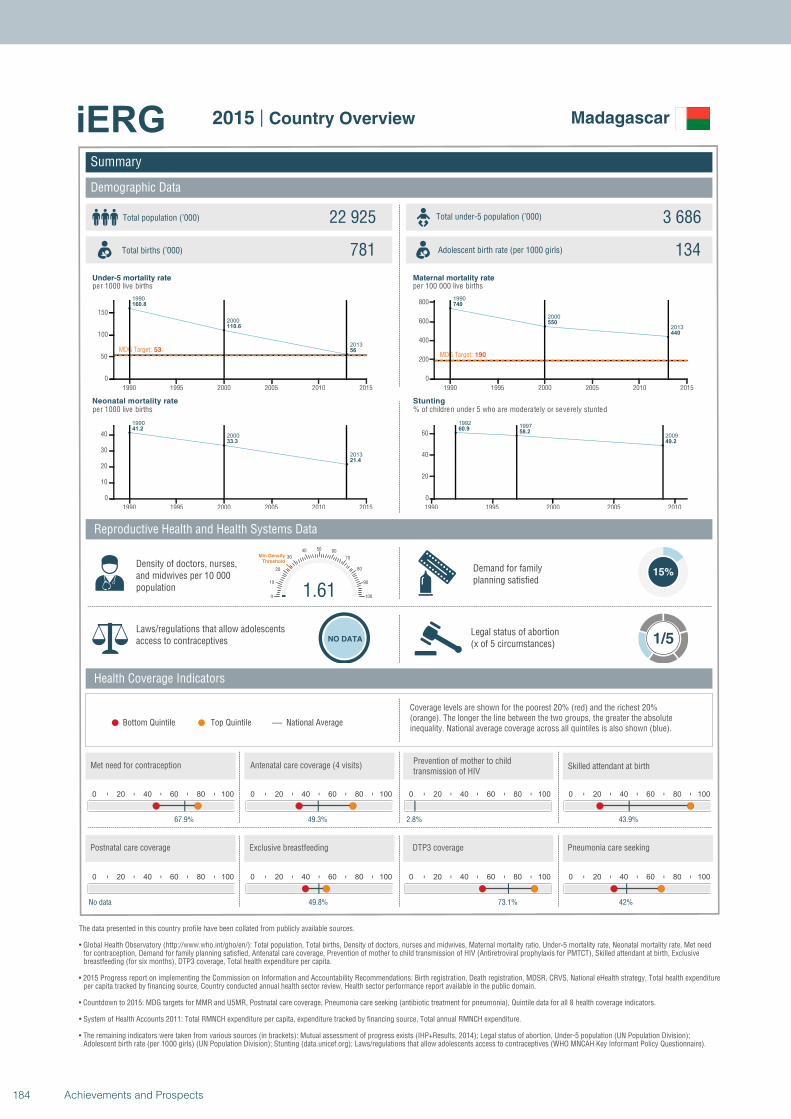
1990
2000
2013
160.8
110.6
56MDG Target: 53
1990 1995 2000 2005 2010 2015
0
50
100
150
1990
2000
2013
41.2
33.3
21.4
1990 1995 2000 2005 2010 2015
0
10
20
30
40
1990
2000
2013
740
550
440
MDG Target: 190
1990 1995 2000 2005 2010 2015
0
200
400
600
800
19921997
2009
60.958.2
49.2
1990 1995 2000 2005 2010
0
20
40
60
Summary
Demographic Data
Madagascar
Total population (’000) Total under-5 population (’000)22 925 3 686
781 134
Reproductive Health and Health Systems Data
Health Coverage Indicators
Demand for familyplanning satisfied
15%
Laws/regulations that allow adolescents access to contraceptives NO DATA
Legal status of abortion(x of 5 circumstances) 1/5
National AverageBottom Quintile Top Quintile
per 1000 live births per 100 000 live births
per 1000 live births % of children under 5 who are moderately or severely stunted
0 20 40 60 80 100
67.9%
0 20 40 60 80 100
49.3%
0 20 40 60 80 100
2.8%
1.610
10
20
30
40 50 60
70
80
90
100
Min Density Threshold
0 20 40 60 80 100
43.9%
0 20 40 60 80 100
No data
0 20 40 60 80 100
49.8%
0 20 40 60 80 100
73.1%
0 20 40 60 80 100
42%
Total births (’000) Adolescent birth rate (per 1000 girls)
Coverage levels are shown for the poorest 20% (red) and the richest 20% (orange). The longer the line between the two groups, the greater the absolute inequality. National average coverage across all quintiles is also shown (blue).
Density of doctors, nurses, and midwives per 10 000 population
Postnatal care coverage Exclusive breastfeeding DTP3 coverage Pneumonia care seeking
Met need for contraception Antenatal care coverage (4 visits)Prevention of mother to child transmission of HIV
Skilled attendant at birth
Under-5 mortality rate Maternal mortality rate
Neonatal mortality rate Stunting
The data presented in this country profile have been collated from publicly available sources.
• Global Health Observatory (http://www.who.int/gho/en/): Total population, Total births, Density of doctors, nurses and midwives, Maternal mortality ratio, Under-5 mortality rate, Neonatal mortality rate, Met need for contraception, Demand for family planning satisfied, Antenatal care coverage, Prevention of mother to child transmission of HIV (Antiretroviral prophylaxis for PMTCT), Skilled attendant at birth, Exclusive breastfeeding (for six months), DTP3 coverage, Total health expenditure per capita.
• 2015 Progress report on implementing the Commission on Information and Accountability Recommendations: Birth registration, Death registration, MDSR, CRVS, National eHealth strategy, Total health expenditureper capita tracked by financing source, Country conducted annual health sector review, Health sector performance report available in the public domain.
• Countdown to 2015: MDG targets for MMR and U5MR, Postnatal care coverage, Pneumonia care seeking (antibiotic treatment for pneumonia), Quintile data for all 8 health coverage indicators.
• System of Health Accounts 2011: Total RMNCH expenditure per capita, expenditure tracked by financing source, Total annual RMNCH expenditure.
• The remaining indicators were taken from various sources (in brackets): Mutual assessment of progress exists (IHP+Results, 2014); Legal status of abortion, Under-5 population (UN Population Division);Adolescent birth rate (per 1000 girls) (UN Population Division); Stunting (data.unicef.org); Laws/regulations that allow adolescents access to contraceptives (WHO MNCAH Key Informant Policy Questionnaire).
2015 | Country Overview
184 Achievements and Prospects
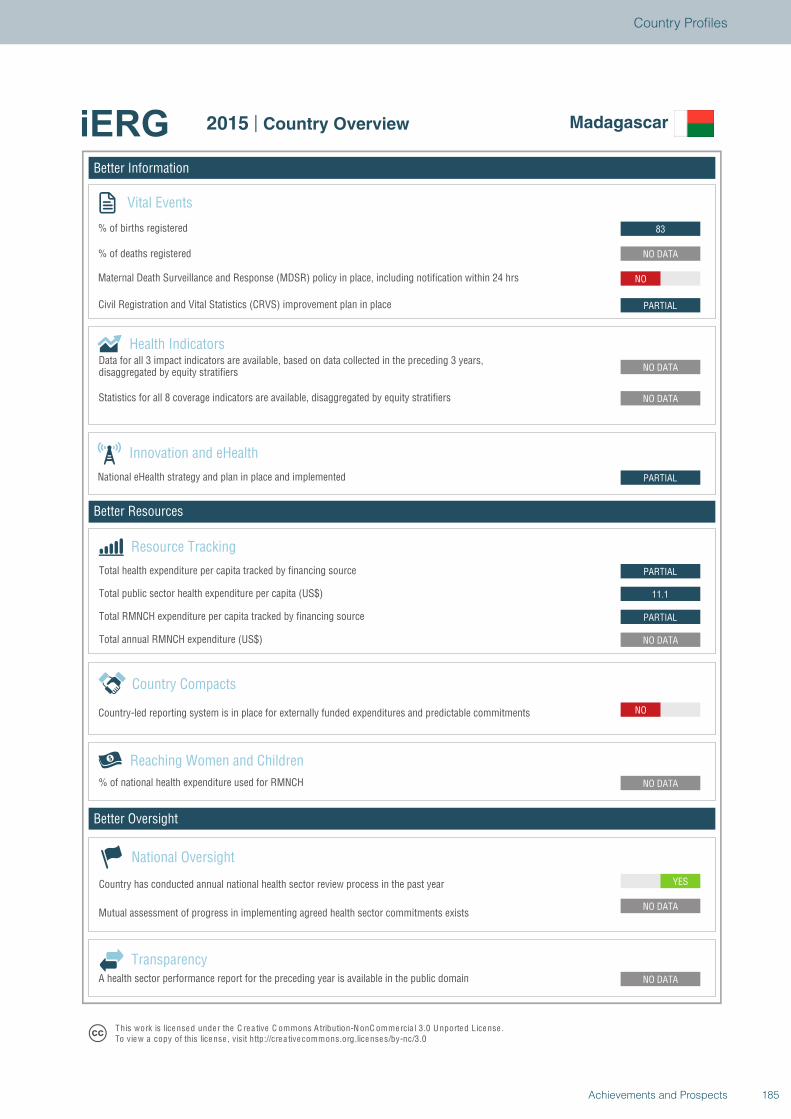
Better Information
Better Resources
Better Oversight
Madagascar
Vital Events
% of births registered
% of deaths registered
Innovation and eHealth
National eHealth strategy and plan in place and implemented
Health Indicators
Statistics for all 8 coverage indicators are available, disaggregated by equity stratifiers
Reaching Women and Children
Country Compacts
Country-led reporting system is in place for externally funded expenditures and predictable commitments
Resource Tracking
Total RMNCH expenditure per capita tracked by financing source
Total annual RMNCH expenditure (US$)
Total health expenditure per capita tracked by financing source
% of national health expenditure used for RMNCH
YES
NO DATA
NO DATA
NO DATA
NO
NO DATA
PARTIAL
11.1
PARTIAL
PARTIAL
NO DATA
NO DATA
PARTIAL
NO
NO DATA
83
National Oversight
Mutual assessment of progress in implementing agreed health sector commitments exists
Country has conducted annual national health sector review process in the past year
TransparencyA health sector performance report for the preceding year is available in the public domain
T his work is lice nse d unde r the C re a tive C ommons A tribution-N onC ommercia l 3.0 U nported License .To view a copy of this license , visit http://cre a tive commons.org.licenses/by-nc/3.0
2015 | Country Overview Madagascar
Total public sector health expenditure per capita (US$)
Maternal Death Surveillance and Response (MDSR) policy in place, including notification within 24 hrs
Civil Registration and Vital Statistics (CRVS) improvement plan in place
Data for all 3 impact indicators are available, based on data collected in the preceding 3 years,disaggregated by equity stratifiers
185Achievements and Prospects
Country Profiles
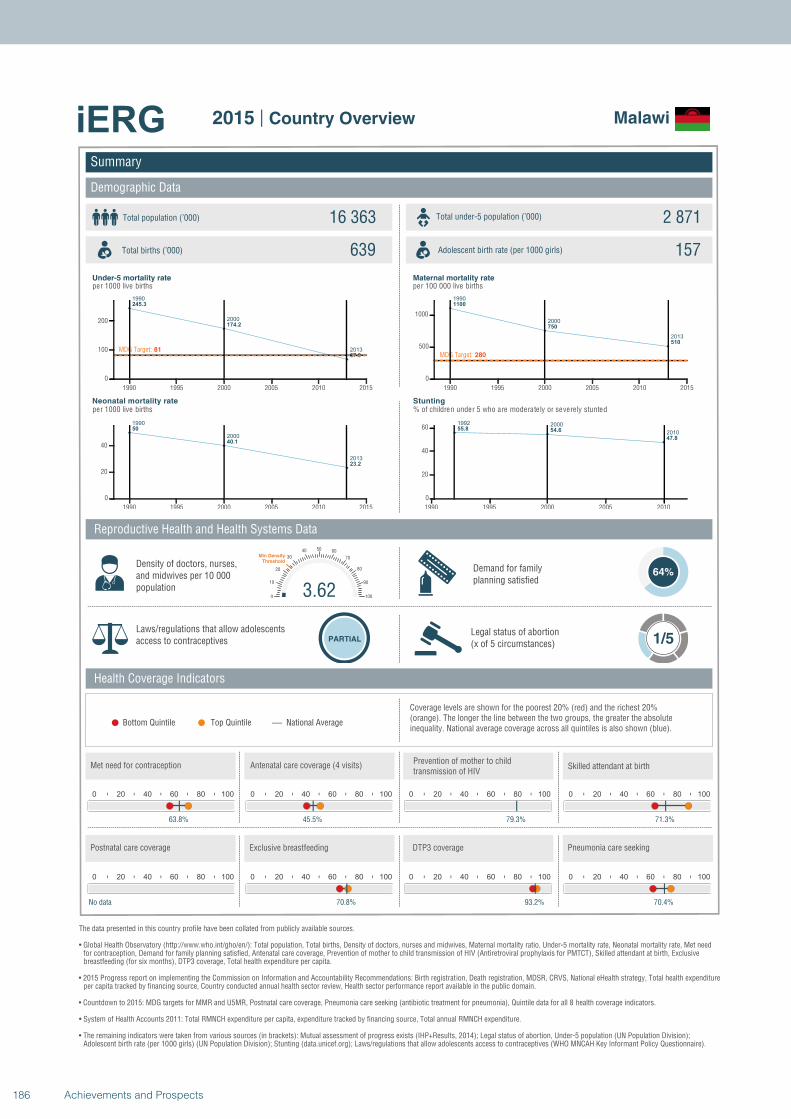
1990
2000
2013
245.3
174.2
67.9
MDG Target: 81
1990 1995 2000 2005 2010 2015
0
100
200
1990
2000
2013
50
40.1
23.2
1990 1995 2000 2005 2010 2015
0
20
40
1990
2000
2013
1100
750
510
MDG Target: 280
1990 1995 2000 2005 2010 2015
0
500
1000
1992 2000
201055.8 54.6
47.8
1990 1995 2000 2005 2010
0
20
40
60
Summary
Demographic Data
Malawi
Total population (’000) Total under-5 population (’000)16 363 2 871
639 157
Reproductive Health and Health Systems Data
Health Coverage Indicators
Demand for familyplanning satisfied
64%
Laws/regulations that allow adolescents access to contraceptives PARTIAL
Legal status of abortion(x of 5 circumstances) 1/5
National AverageBottom Quintile Top Quintile
per 1000 live births per 100 000 live births
per 1000 live births % of children under 5 who are moderately or severely stunted
0 20 40 60 80 100
63.8%
0 20 40 60 80 100
45.5%
0 20 40 60 80 100
79.3%
3.620
10
20
30
40 50 60
70
80
90
100
Min Density Threshold
0 20 40 60 80 100
71.3%
0 20 40 60 80 100
No data
0 20 40 60 80 100
70.8%
0 20 40 60 80 100
93.2%
0 20 40 60 80 100
70.4%
Total births (’000) Adolescent birth rate (per 1000 girls)
Coverage levels are shown for the poorest 20% (red) and the richest 20% (orange). The longer the line between the two groups, the greater the absolute inequality. National average coverage across all quintiles is also shown (blue).
Density of doctors, nurses, and midwives per 10 000 population
Postnatal care coverage Exclusive breastfeeding DTP3 coverage Pneumonia care seeking
Met need for contraception Antenatal care coverage (4 visits)Prevention of mother to child transmission of HIV
Skilled attendant at birth
Under-5 mortality rate Maternal mortality rate
Neonatal mortality rate Stunting
The data presented in this country profile have been collated from publicly available sources.
• Global Health Observatory (http://www.who.int/gho/en/): Total population, Total births, Density of doctors, nurses and midwives, Maternal mortality ratio, Under-5 mortality rate, Neonatal mortality rate, Met need for contraception, Demand for family planning satisfied, Antenatal care coverage, Prevention of mother to child transmission of HIV (Antiretroviral prophylaxis for PMTCT), Skilled attendant at birth, Exclusive breastfeeding (for six months), DTP3 coverage, Total health expenditure per capita.
• 2015 Progress report on implementing the Commission on Information and Accountability Recommendations: Birth registration, Death registration, MDSR, CRVS, National eHealth strategy, Total health expenditureper capita tracked by financing source, Country conducted annual health sector review, Health sector performance report available in the public domain.
• Countdown to 2015: MDG targets for MMR and U5MR, Postnatal care coverage, Pneumonia care seeking (antibiotic treatment for pneumonia), Quintile data for all 8 health coverage indicators.
• System of Health Accounts 2011: Total RMNCH expenditure per capita, expenditure tracked by financing source, Total annual RMNCH expenditure.
• The remaining indicators were taken from various sources (in brackets): Mutual assessment of progress exists (IHP+Results, 2014); Legal status of abortion, Under-5 population (UN Population Division);Adolescent birth rate (per 1000 girls) (UN Population Division); Stunting (data.unicef.org); Laws/regulations that allow adolescents access to contraceptives (WHO MNCAH Key Informant Policy Questionnaire).
2015 | Country Overview
186 Achievements and Prospects
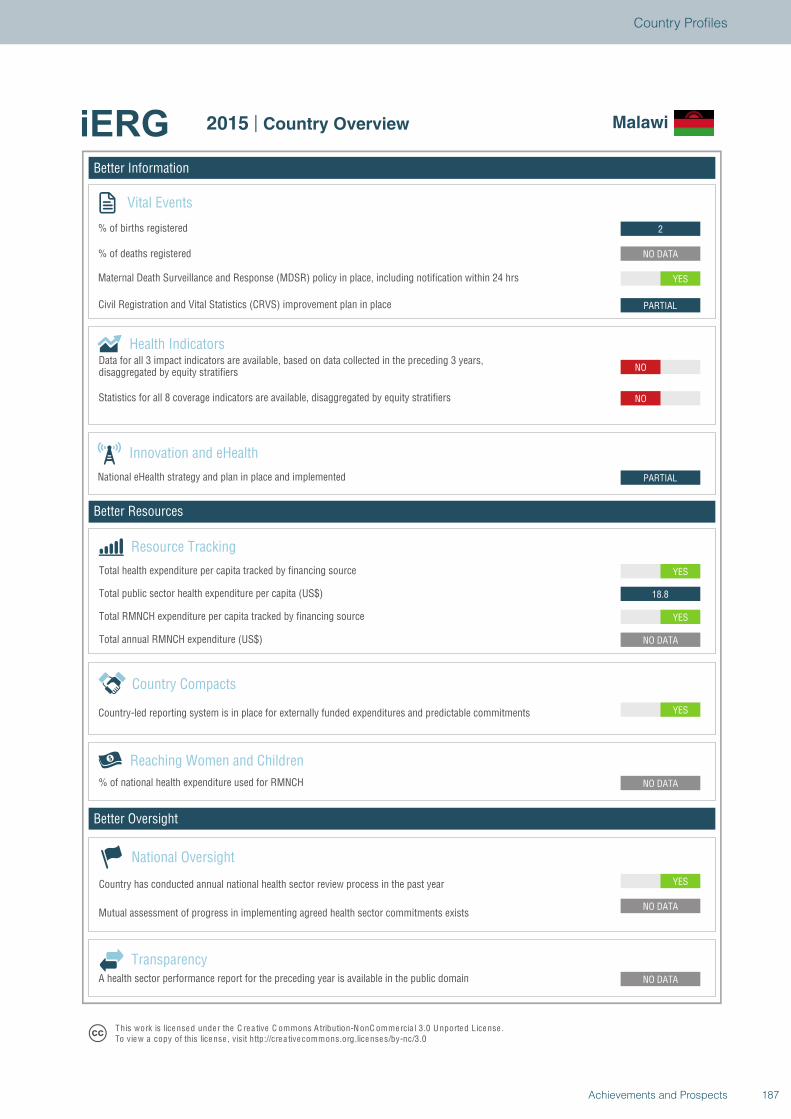
Better Information
Better Resources
Better Oversight
Malawi
Vital Events
% of births registered
% of deaths registered
Innovation and eHealth
National eHealth strategy and plan in place and implemented
Health Indicators
Statistics for all 8 coverage indicators are available, disaggregated by equity stratifiers
Reaching Women and Children
Country Compacts
Country-led reporting system is in place for externally funded expenditures and predictable commitments
Resource Tracking
Total RMNCH expenditure per capita tracked by financing source
Total annual RMNCH expenditure (US$)
Total health expenditure per capita tracked by financing source
% of national health expenditure used for RMNCH
YES
NO DATA
NO DATA
NO DATA
YES
NO DATA
YES
18.8
YES
PARTIAL
NO
NO
PARTIAL
YES
NO DATA
2
National Oversight
Mutual assessment of progress in implementing agreed health sector commitments exists
Country has conducted annual national health sector review process in the past year
TransparencyA health sector performance report for the preceding year is available in the public domain
T his work is lice nse d unde r the C re a tive C ommons A tribution-N onC ommercia l 3.0 U nported License .To view a copy of this license , visit http://cre a tive commons.org.licenses/by-nc/3.0
2015 | Country Overview Malawi
Total public sector health expenditure per capita (US$)
Maternal Death Surveillance and Response (MDSR) policy in place, including notification within 24 hrs
Civil Registration and Vital Statistics (CRVS) improvement plan in place
Data for all 3 impact indicators are available, based on data collected in the preceding 3 years,disaggregated by equity stratifiers
187Achievements and Prospects
Country Profiles
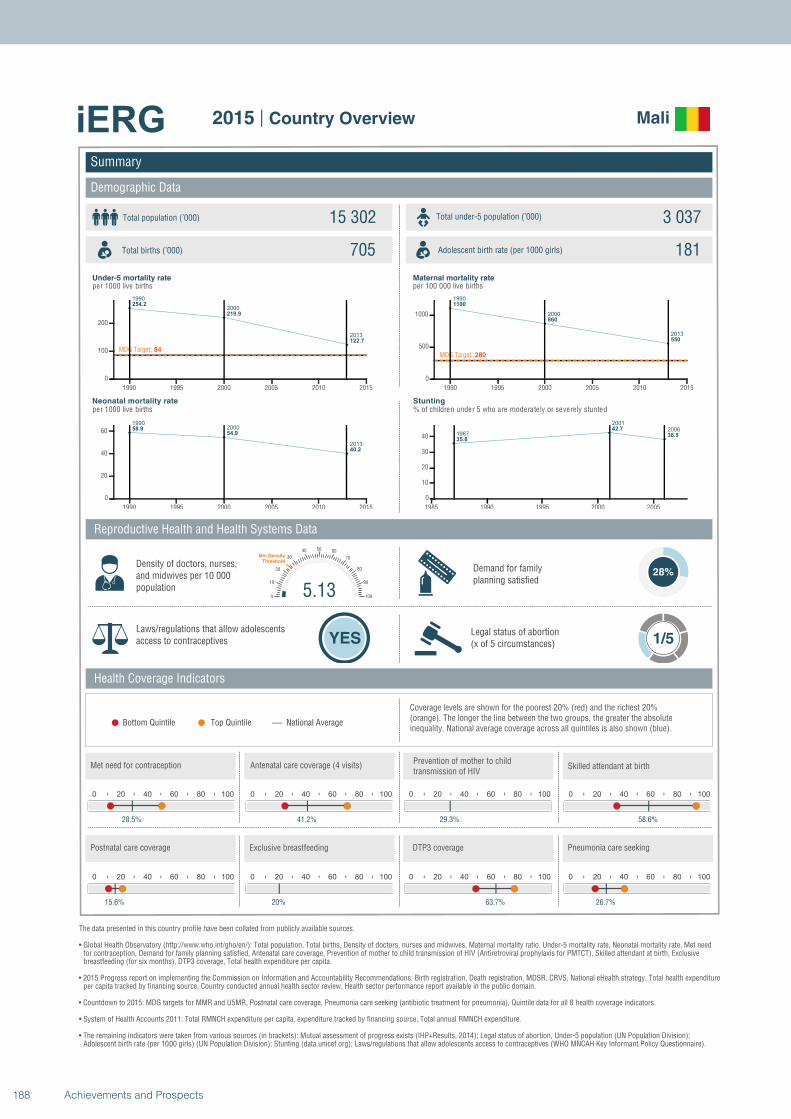
1990
2000
2013
254.2
219.9
122.7
MDG Target: 84
1990 1995 2000 2005 2010 2015
0
100
200
19902000
2013
58.954.9
40.2
1990 1995 2000 2005 2010 2015
0
20
40
60
1990
2000
2013
1100
860
550
MDG Target: 280
1990 1995 2000 2005 2010 2015
0
500
1000
1987
2001
2006
35.8
42.7
38.5
1985 1990 1995 2000 2005
0
10
20
30
40
Summary
Demographic Data
Mali
Total population (’000) Total under-5 population (’000)15 302 3 037
705 181
Reproductive Health and Health Systems Data
Health Coverage Indicators
Demand for familyplanning satisfied
28%
Laws/regulations that allow adolescents access to contraceptives YES
Legal status of abortion(x of 5 circumstances) 1/5
National AverageBottom Quintile Top Quintile
per 1000 live births per 100 000 live births
per 1000 live births % of children under 5 who are moderately or severely stunted
0 20 40 60 80 100
28.5%
0 20 40 60 80 100
41.2%
0 20 40 60 80 100
29.3%
5.130
10
20
30
40 50 60
70
80
90
100
Min Density Threshold
0 20 40 60 80 100
58.6%
0 20 40 60 80 100
15.6%
0 20 40 60 80 100
20%
0 20 40 60 80 100
63.7%
0 20 40 60 80 100
26.7%
Total births (’000) Adolescent birth rate (per 1000 girls)
Coverage levels are shown for the poorest 20% (red) and the richest 20% (orange). The longer the line between the two groups, the greater the absolute inequality. National average coverage across all quintiles is also shown (blue).
Density of doctors, nurses, and midwives per 10 000 population
Postnatal care coverage Exclusive breastfeeding DTP3 coverage Pneumonia care seeking
Met need for contraception Antenatal care coverage (4 visits)Prevention of mother to child transmission of HIV
Skilled attendant at birth
Under-5 mortality rate Maternal mortality rate
Neonatal mortality rate Stunting
The data presented in this country profile have been collated from publicly available sources.
• Global Health Observatory (http://www.who.int/gho/en/): Total population, Total births, Density of doctors, nurses and midwives, Maternal mortality ratio, Under-5 mortality rate, Neonatal mortality rate, Met need for contraception, Demand for family planning satisfied, Antenatal care coverage, Prevention of mother to child transmission of HIV (Antiretroviral prophylaxis for PMTCT), Skilled attendant at birth, Exclusive breastfeeding (for six months), DTP3 coverage, Total health expenditure per capita.
• 2015 Progress report on implementing the Commission on Information and Accountability Recommendations: Birth registration, Death registration, MDSR, CRVS, National eHealth strategy, Total health expenditureper capita tracked by financing source, Country conducted annual health sector review, Health sector performance report available in the public domain.
• Countdown to 2015: MDG targets for MMR and U5MR, Postnatal care coverage, Pneumonia care seeking (antibiotic treatment for pneumonia), Quintile data for all 8 health coverage indicators.
• System of Health Accounts 2011: Total RMNCH expenditure per capita, expenditure tracked by financing source, Total annual RMNCH expenditure.
• The remaining indicators were taken from various sources (in brackets): Mutual assessment of progress exists (IHP+Results, 2014); Legal status of abortion, Under-5 population (UN Population Division);Adolescent birth rate (per 1000 girls) (UN Population Division); Stunting (data.unicef.org); Laws/regulations that allow adolescents access to contraceptives (WHO MNCAH Key Informant Policy Questionnaire).
2015 | Country Overview
188 Achievements and Prospects
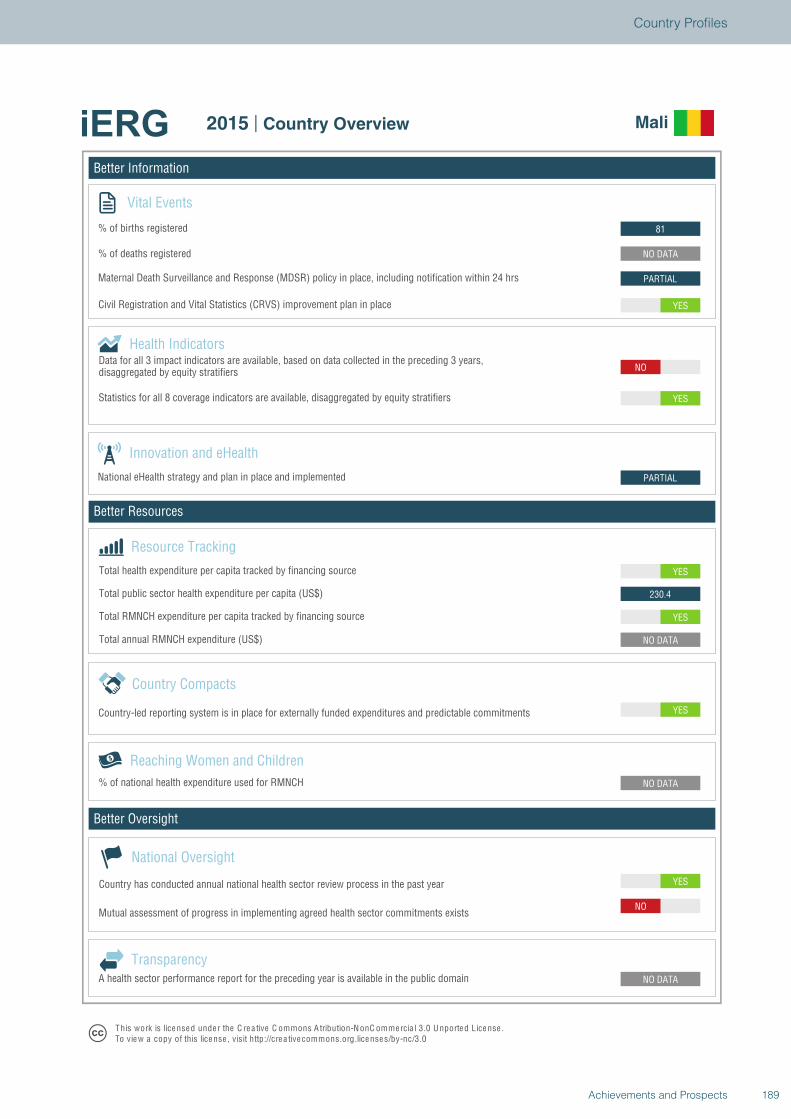
Better Information
Better Resources
Better Oversight
Mali
Vital Events
% of births registered
% of deaths registered
Innovation and eHealth
National eHealth strategy and plan in place and implemented
Health Indicators
Statistics for all 8 coverage indicators are available, disaggregated by equity stratifiers
Reaching Women and Children
Country Compacts
Country-led reporting system is in place for externally funded expenditures and predictable commitments
Resource Tracking
Total RMNCH expenditure per capita tracked by financing source
Total annual RMNCH expenditure (US$)
Total health expenditure per capita tracked by financing source
% of national health expenditure used for RMNCH
YES
NO
NO DATA
NO DATA
YES
NO DATA
YES
230.4
YES
PARTIAL
NO
YES
YES
PARTIAL
NO DATA
81
National Oversight
Mutual assessment of progress in implementing agreed health sector commitments exists
Country has conducted annual national health sector review process in the past year
TransparencyA health sector performance report for the preceding year is available in the public domain
T his work is lice nse d unde r the C re a tive C ommons A tribution-N onC ommercia l 3.0 U nported License .To view a copy of this license , visit http://cre a tive commons.org.licenses/by-nc/3.0
2015 | Country Overview Mali
Total public sector health expenditure per capita (US$)
Maternal Death Surveillance and Response (MDSR) policy in place, including notification within 24 hrs
Civil Registration and Vital Statistics (CRVS) improvement plan in place
Data for all 3 impact indicators are available, based on data collected in the preceding 3 years,disaggregated by equity stratifiers
189Achievements and Prospects
Country Profiles
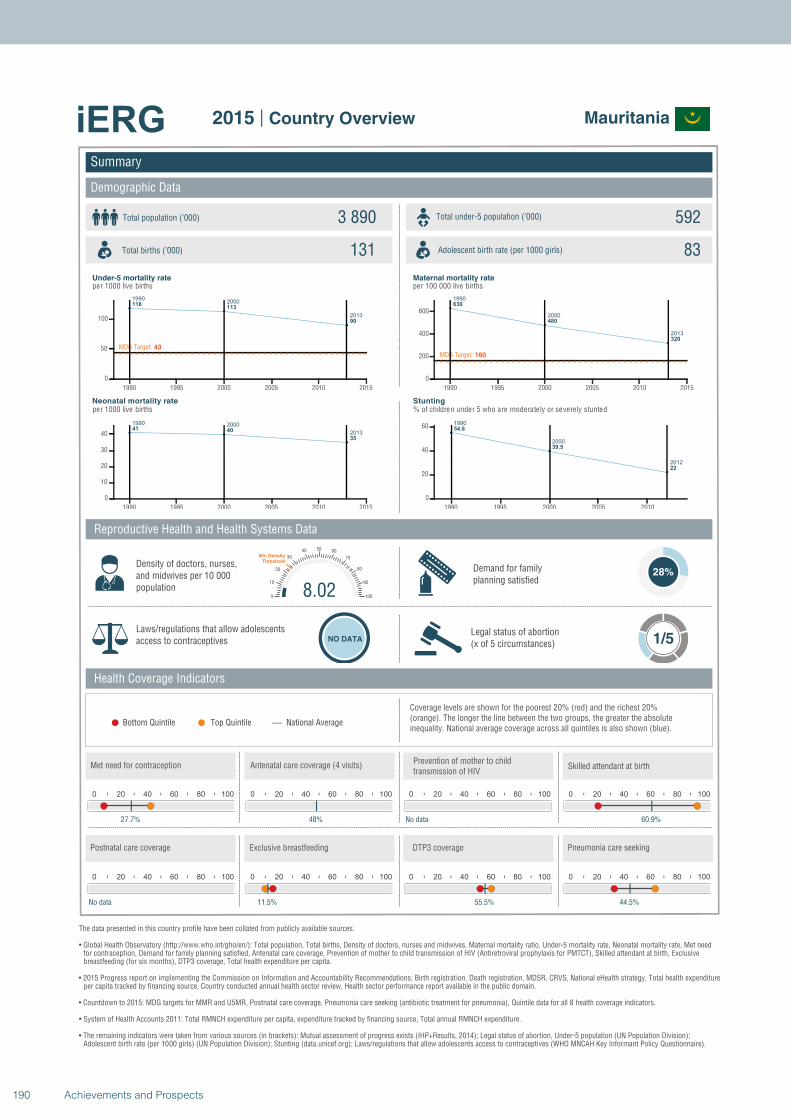
19902000
2013
118113
90
MDG Target: 43
1990 1995 2000 2005 2010 2015
0
50
100
1990 2000
201341 40
35
1990 1995 2000 2005 2010 2015
0
10
20
30
40
1990
2000
2013
630
480
320
MDG Target: 160
1990 1995 2000 2005 2010 2015
0
200
400
600
1990
2000
2012
54.8
39.5
22
1990 1995 2000 2005 2010
0
20
40
60
Summary
Demographic Data
Mauritania
Total population (’000) Total under-5 population (’000)3 890 592
131 83
Reproductive Health and Health Systems Data
Health Coverage Indicators
Demand for familyplanning satisfied
28%
Laws/regulations that allow adolescents access to contraceptives NO DATA
Legal status of abortion(x of 5 circumstances) 1/5
National AverageBottom Quintile Top Quintile
per 1000 live births per 100 000 live births
per 1000 live births % of children under 5 who are moderately or severely stunted
0 20 40 60 80 100
27.7%
0 20 40 60 80 100
48%
0 20 40 60 80 100
No data
8.020
10
20
30
40 50 60
70
80
90
100
Min Density Threshold
0 20 40 60 80 100
60.9%
0 20 40 60 80 100
No data
0 20 40 60 80 100
11.5%
0 20 40 60 80 100
55.5%
0 20 40 60 80 100
44.5%
Total births (’000) Adolescent birth rate (per 1000 girls)
Coverage levels are shown for the poorest 20% (red) and the richest 20% (orange). The longer the line between the two groups, the greater the absolute inequality. National average coverage across all quintiles is also shown (blue).
Density of doctors, nurses, and midwives per 10 000 population
Postnatal care coverage Exclusive breastfeeding DTP3 coverage Pneumonia care seeking
Met need for contraception Antenatal care coverage (4 visits)Prevention of mother to child transmission of HIV
Skilled attendant at birth
Under-5 mortality rate Maternal mortality rate
Neonatal mortality rate Stunting
The data presented in this country profile have been collated from publicly available sources.
• Global Health Observatory (http://www.who.int/gho/en/): Total population, Total births, Density of doctors, nurses and midwives, Maternal mortality ratio, Under-5 mortality rate, Neonatal mortality rate, Met need for contraception, Demand for family planning satisfied, Antenatal care coverage, Prevention of mother to child transmission of HIV (Antiretroviral prophylaxis for PMTCT), Skilled attendant at birth, Exclusive breastfeeding (for six months), DTP3 coverage, Total health expenditure per capita.
• 2015 Progress report on implementing the Commission on Information and Accountability Recommendations: Birth registration, Death registration, MDSR, CRVS, National eHealth strategy, Total health expenditureper capita tracked by financing source, Country conducted annual health sector review, Health sector performance report available in the public domain.
• Countdown to 2015: MDG targets for MMR and U5MR, Postnatal care coverage, Pneumonia care seeking (antibiotic treatment for pneumonia), Quintile data for all 8 health coverage indicators.
• System of Health Accounts 2011: Total RMNCH expenditure per capita, expenditure tracked by financing source, Total annual RMNCH expenditure.
• The remaining indicators were taken from various sources (in brackets): Mutual assessment of progress exists (IHP+Results, 2014); Legal status of abortion, Under-5 population (UN Population Division);Adolescent birth rate (per 1000 girls) (UN Population Division); Stunting (data.unicef.org); Laws/regulations that allow adolescents access to contraceptives (WHO MNCAH Key Informant Policy Questionnaire).
2015 | Country Overview
190 Achievements and Prospects
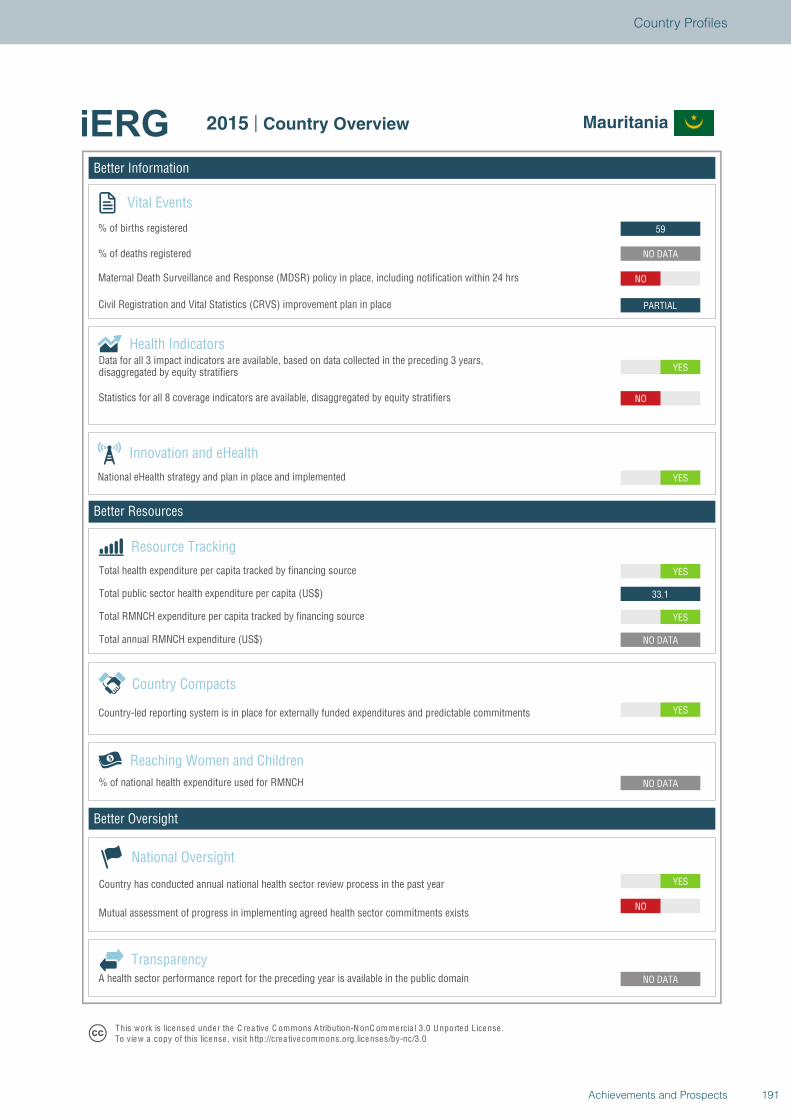
Better Information
Better Resources
Better Oversight
Mauritania
Vital Events
% of births registered
% of deaths registered
Innovation and eHealth
National eHealth strategy and plan in place and implemented
Health Indicators
Statistics for all 8 coverage indicators are available, disaggregated by equity stratifiers
Reaching Women and Children
Country Compacts
Country-led reporting system is in place for externally funded expenditures and predictable commitments
Resource Tracking
Total RMNCH expenditure per capita tracked by financing source
Total annual RMNCH expenditure (US$)
Total health expenditure per capita tracked by financing source
% of national health expenditure used for RMNCH
YES
NO
NO DATA
NO DATA
YES
NO DATA
YES
33.1
YES
YES
YES
NO
PARTIAL
NO
NO DATA
59
National Oversight
Mutual assessment of progress in implementing agreed health sector commitments exists
Country has conducted annual national health sector review process in the past year
TransparencyA health sector performance report for the preceding year is available in the public domain
T his work is lice nse d unde r the C re a tive C ommons A tribution-N onC ommercia l 3.0 U nported License .To view a copy of this license , visit http://cre a tive commons.org.licenses/by-nc/3.0
2015 | Country Overview Mauritania
Total public sector health expenditure per capita (US$)
Maternal Death Surveillance and Response (MDSR) policy in place, including notification within 24 hrs
Civil Registration and Vital Statistics (CRVS) improvement plan in place
Data for all 3 impact indicators are available, based on data collected in the preceding 3 years,disaggregated by equity stratifiers
191Achievements and Prospects
Country Profiles
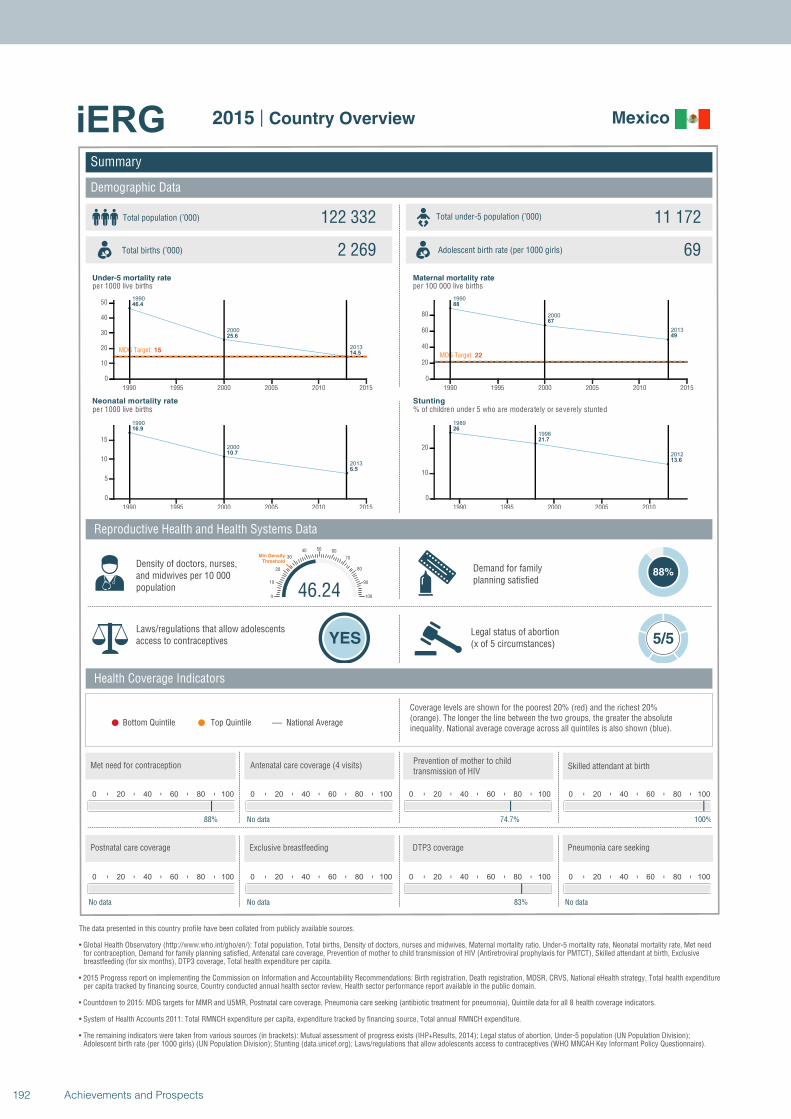
1990
2000
2013
46.4
25.6
14.5MDG Target: 15
1990 1995 2000 2005 2010 2015
0
10
20
30
40
50
1990
2000
2013
16.9
10.7
6.5
1990 1995 2000 2005 2010 2015
0
5
10
15
1990
2000
2013
88
67
49
MDG Target: 22
1990 1995 2000 2005 2010 2015
0
20
40
60
80
1989
1998
2012
26
21.7
13.6
1990 1995 2000 2005 2010
0
10
20
Summary
Demographic Data
Mexico
Total population (’000) Total under-5 population (’000)122 332 11 172
2 269 69
Reproductive Health and Health Systems Data
Health Coverage Indicators
Demand for familyplanning satisfied
88%
Laws/regulations that allow adolescents access to contraceptives YES
Legal status of abortion(x of 5 circumstances) 5/5
National AverageBottom Quintile Top Quintile
per 1000 live births per 100 000 live births
per 1000 live births % of children under 5 who are moderately or severely stunted
0 20 40 60 80 100
88%
0 20 40 60 80 100
No data
0 20 40 60 80 100
74.7%
46.240
10
20
30
40 50 60
70
80
90
100
Min Density Threshold
0 20 40 60 80 100
100%
0 20 40 60 80 100
No data
0 20 40 60 80 100
No data
0 20 40 60 80 100
83%
0 20 40 60 80 100
No data
Total births (’000) Adolescent birth rate (per 1000 girls)
Coverage levels are shown for the poorest 20% (red) and the richest 20% (orange). The longer the line between the two groups, the greater the absolute inequality. National average coverage across all quintiles is also shown (blue).
Density of doctors, nurses, and midwives per 10 000 population
Postnatal care coverage Exclusive breastfeeding DTP3 coverage Pneumonia care seeking
Met need for contraception Antenatal care coverage (4 visits)Prevention of mother to child transmission of HIV
Skilled attendant at birth
Under-5 mortality rate Maternal mortality rate
Neonatal mortality rate Stunting
The data presented in this country profile have been collated from publicly available sources.
• Global Health Observatory (http://www.who.int/gho/en/): Total population, Total births, Density of doctors, nurses and midwives, Maternal mortality ratio, Under-5 mortality rate, Neonatal mortality rate, Met need for contraception, Demand for family planning satisfied, Antenatal care coverage, Prevention of mother to child transmission of HIV (Antiretroviral prophylaxis for PMTCT), Skilled attendant at birth, Exclusive breastfeeding (for six months), DTP3 coverage, Total health expenditure per capita.
• 2015 Progress report on implementing the Commission on Information and Accountability Recommendations: Birth registration, Death registration, MDSR, CRVS, National eHealth strategy, Total health expenditureper capita tracked by financing source, Country conducted annual health sector review, Health sector performance report available in the public domain.
• Countdown to 2015: MDG targets for MMR and U5MR, Postnatal care coverage, Pneumonia care seeking (antibiotic treatment for pneumonia), Quintile data for all 8 health coverage indicators.
• System of Health Accounts 2011: Total RMNCH expenditure per capita, expenditure tracked by financing source, Total annual RMNCH expenditure.
• The remaining indicators were taken from various sources (in brackets): Mutual assessment of progress exists (IHP+Results, 2014); Legal status of abortion, Under-5 population (UN Population Division);Adolescent birth rate (per 1000 girls) (UN Population Division); Stunting (data.unicef.org); Laws/regulations that allow adolescents access to contraceptives (WHO MNCAH Key Informant Policy Questionnaire).
2015 | Country Overview
192 Achievements and Prospects
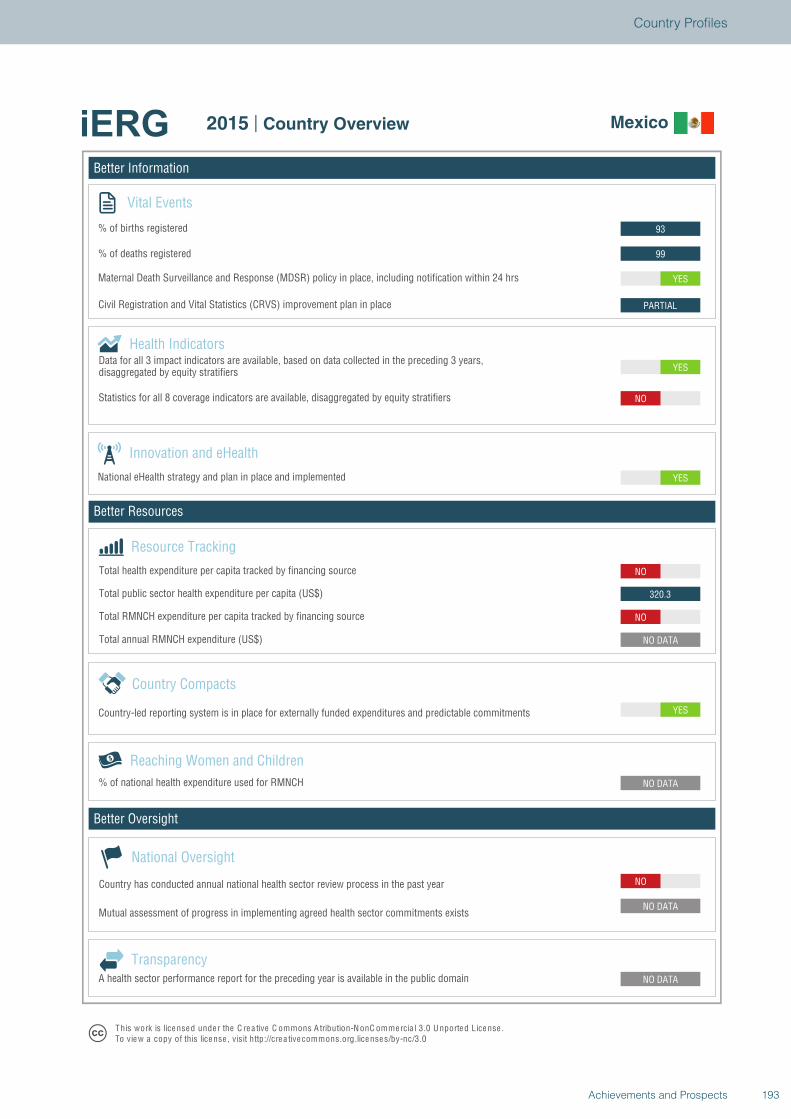
Better Information
Better Resources
Better Oversight
Mexico
Vital Events
% of births registered
% of deaths registered
Innovation and eHealth
National eHealth strategy and plan in place and implemented
Health Indicators
Statistics for all 8 coverage indicators are available, disaggregated by equity stratifiers
Reaching Women and Children
Country Compacts
Country-led reporting system is in place for externally funded expenditures and predictable commitments
Resource Tracking
Total RMNCH expenditure per capita tracked by financing source
Total annual RMNCH expenditure (US$)
Total health expenditure per capita tracked by financing source
% of national health expenditure used for RMNCH
NO
NO DATA
NO DATA
NO DATA
YES
NO DATA
NO
320.3
NO
YES
YES
NO
PARTIAL
YES
99
93
National Oversight
Mutual assessment of progress in implementing agreed health sector commitments exists
Country has conducted annual national health sector review process in the past year
TransparencyA health sector performance report for the preceding year is available in the public domain
T his work is lice nse d unde r the C re a tive C ommons A tribution-N onC ommercia l 3.0 U nported License .To view a copy of this license , visit http://cre a tive commons.org.licenses/by-nc/3.0
2015 | Country Overview Mexico
Total public sector health expenditure per capita (US$)
Maternal Death Surveillance and Response (MDSR) policy in place, including notification within 24 hrs
Civil Registration and Vital Statistics (CRVS) improvement plan in place
Data for all 3 impact indicators are available, based on data collected in the preceding 3 years,disaggregated by equity stratifiers
193Achievements and Prospects
Country Profiles
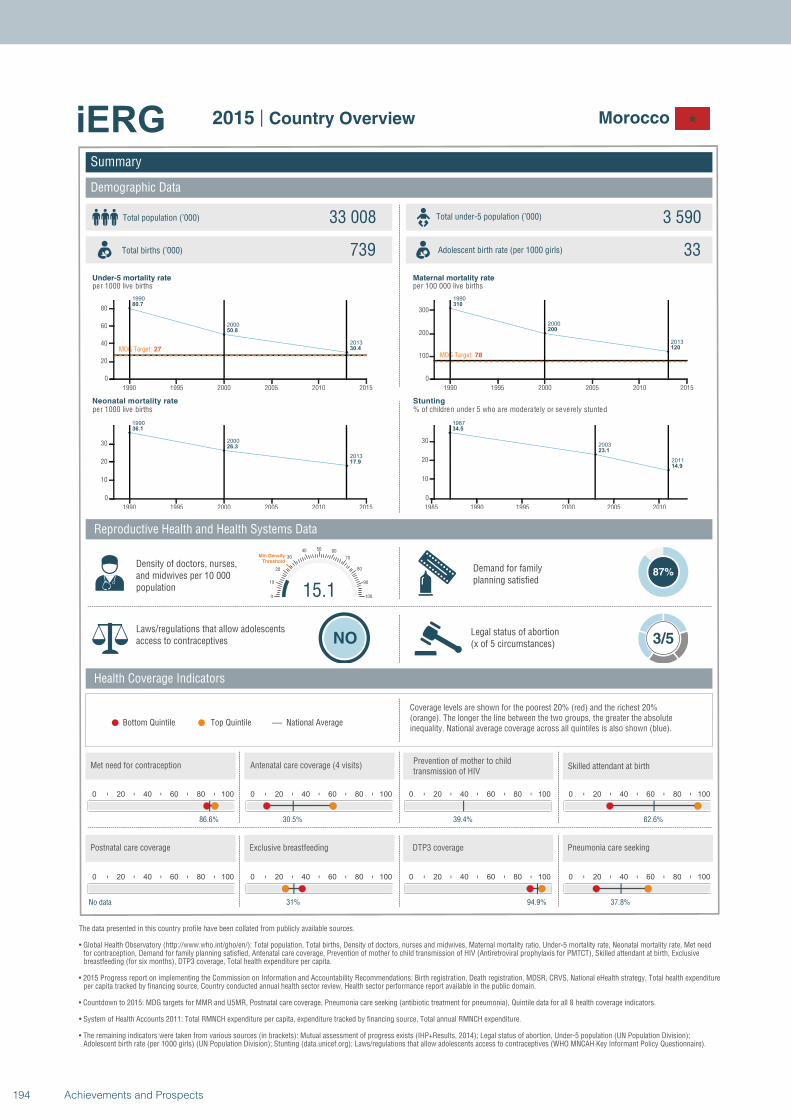
1990
2000
2013
80.7
50.8
30.4MDG Target: 27
1990 1995 2000 2005 2010 2015
0
20
40
60
80
1990
2000
2013
36.1
26.3
17.9
1990 1995 2000 2005 2010 2015
0
10
20
30
1990
2000
2013
310
200
120
MDG Target: 78
1990 1995 2000 2005 2010 2015
0
100
200
300
1987
2003
2011
34.5
23.1
14.9
1985 1990 1995 2000 2005 2010
0
10
20
30
Summary
Demographic Data
Morocco
Total population (’000) Total under-5 population (’000)33 008 3 590
739 33
Reproductive Health and Health Systems Data
Health Coverage Indicators
Demand for familyplanning satisfied
87%
Laws/regulations that allow adolescents access to contraceptives NO
Legal status of abortion(x of 5 circumstances) 3/5
National AverageBottom Quintile Top Quintile
per 1000 live births per 100 000 live births
per 1000 live births % of children under 5 who are moderately or severely stunted
0 20 40 60 80 100
86.6%
0 20 40 60 80 100
30.5%
0 20 40 60 80 100
39.4%
15.10
10
20
30
40 50 60
70
80
90
100
Min Density Threshold
0 20 40 60 80 100
62.6%
0 20 40 60 80 100
No data
0 20 40 60 80 100
31%
0 20 40 60 80 100
94.9%
0 20 40 60 80 100
37.8%
Total births (’000) Adolescent birth rate (per 1000 girls)
Coverage levels are shown for the poorest 20% (red) and the richest 20% (orange). The longer the line between the two groups, the greater the absolute inequality. National average coverage across all quintiles is also shown (blue).
Density of doctors, nurses, and midwives per 10 000 population
Postnatal care coverage Exclusive breastfeeding DTP3 coverage Pneumonia care seeking
Met need for contraception Antenatal care coverage (4 visits)Prevention of mother to child transmission of HIV
Skilled attendant at birth
Under-5 mortality rate Maternal mortality rate
Neonatal mortality rate Stunting
The data presented in this country profile have been collated from publicly available sources.
• Global Health Observatory (http://www.who.int/gho/en/): Total population, Total births, Density of doctors, nurses and midwives, Maternal mortality ratio, Under-5 mortality rate, Neonatal mortality rate, Met need for contraception, Demand for family planning satisfied, Antenatal care coverage, Prevention of mother to child transmission of HIV (Antiretroviral prophylaxis for PMTCT), Skilled attendant at birth, Exclusive breastfeeding (for six months), DTP3 coverage, Total health expenditure per capita.
• 2015 Progress report on implementing the Commission on Information and Accountability Recommendations: Birth registration, Death registration, MDSR, CRVS, National eHealth strategy, Total health expenditureper capita tracked by financing source, Country conducted annual health sector review, Health sector performance report available in the public domain.
• Countdown to 2015: MDG targets for MMR and U5MR, Postnatal care coverage, Pneumonia care seeking (antibiotic treatment for pneumonia), Quintile data for all 8 health coverage indicators.
• System of Health Accounts 2011: Total RMNCH expenditure per capita, expenditure tracked by financing source, Total annual RMNCH expenditure.
• The remaining indicators were taken from various sources (in brackets): Mutual assessment of progress exists (IHP+Results, 2014); Legal status of abortion, Under-5 population (UN Population Division);Adolescent birth rate (per 1000 girls) (UN Population Division); Stunting (data.unicef.org); Laws/regulations that allow adolescents access to contraceptives (WHO MNCAH Key Informant Policy Questionnaire).
2015 | Country Overview
194 Achievements and Prospects
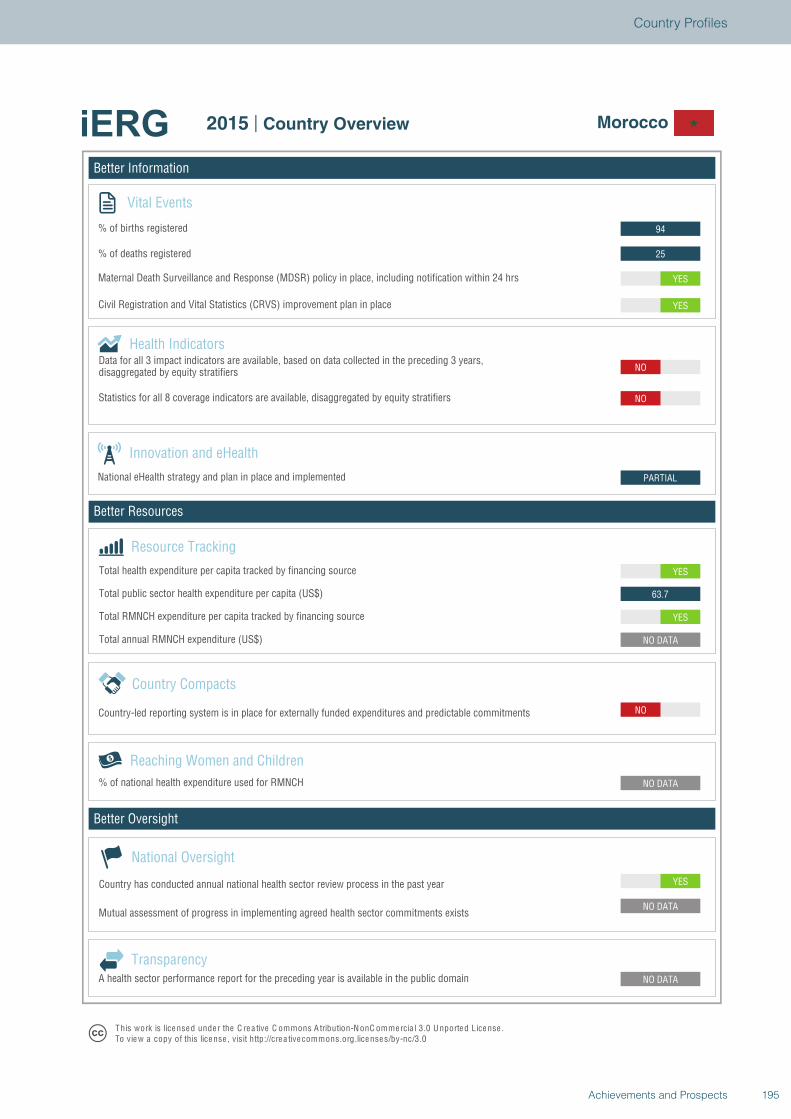
Better Information
Better Resources
Better Oversight
Morocco
Vital Events
% of births registered
% of deaths registered
Innovation and eHealth
National eHealth strategy and plan in place and implemented
Health Indicators
Statistics for all 8 coverage indicators are available, disaggregated by equity stratifiers
Reaching Women and Children
Country Compacts
Country-led reporting system is in place for externally funded expenditures and predictable commitments
Resource Tracking
Total RMNCH expenditure per capita tracked by financing source
Total annual RMNCH expenditure (US$)
Total health expenditure per capita tracked by financing source
% of national health expenditure used for RMNCH
YES
NO DATA
NO DATA
NO DATA
NO
NO DATA
YES
63.7
YES
PARTIAL
NO
NO
YES
YES
25
94
National Oversight
Mutual assessment of progress in implementing agreed health sector commitments exists
Country has conducted annual national health sector review process in the past year
TransparencyA health sector performance report for the preceding year is available in the public domain
T his work is lice nse d unde r the C re a tive C ommons A tribution-N onC ommercia l 3.0 U nported License .To view a copy of this license , visit http://cre a tive commons.org.licenses/by-nc/3.0
2015 | Country Overview Morocco
Total public sector health expenditure per capita (US$)
Maternal Death Surveillance and Response (MDSR) policy in place, including notification within 24 hrs
Civil Registration and Vital Statistics (CRVS) improvement plan in place
Data for all 3 impact indicators are available, based on data collected in the preceding 3 years,disaggregated by equity stratifiers
195Achievements and Prospects
Country Profiles
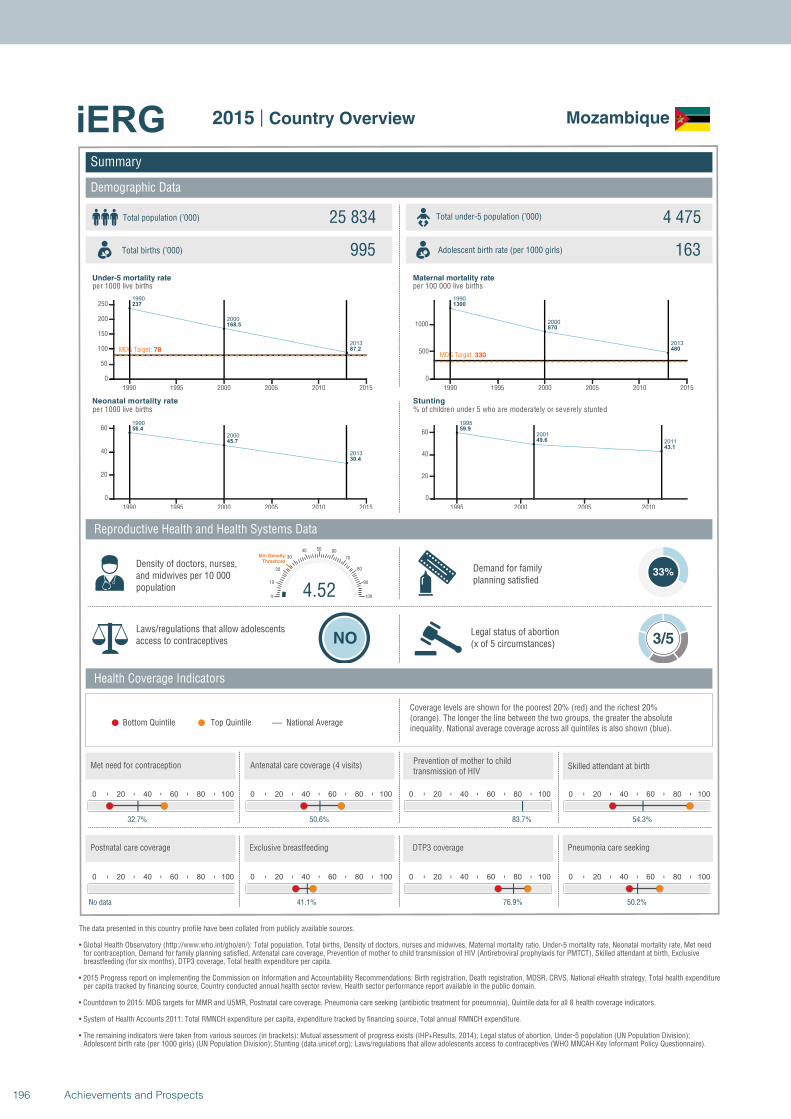
1990
2000
2013
237
168.5
87.2MDG Target: 78
1990 1995 2000 2005 2010 2015
0
50
100
150
200
250
1990
2000
2013
56.4
45.7
30.4
1990 1995 2000 2005 2010 2015
0
20
40
60
1990
2000
2013
1300
870
480
MDG Target: 330
1990 1995 2000 2005 2010 2015
0
500
1000
1995
2001
2011
59.9
49.6
43.1
1995 2000 2005 2010
0
20
40
60
Summary
Demographic Data
Mozambique
Total population (’000) Total under-5 population (’000)25 834 4 475
995 163
Reproductive Health and Health Systems Data
Health Coverage Indicators
Demand for familyplanning satisfied
33%
Laws/regulations that allow adolescents access to contraceptives NO
Legal status of abortion(x of 5 circumstances) 3/5
National AverageBottom Quintile Top Quintile
per 1000 live births per 100 000 live births
per 1000 live births % of children under 5 who are moderately or severely stunted
0 20 40 60 80 100
32.7%
0 20 40 60 80 100
50.6%
0 20 40 60 80 100
83.7%
4.520
10
20
30
40 50 60
70
80
90
100
Min Density Threshold
0 20 40 60 80 100
54.3%
0 20 40 60 80 100
No data
0 20 40 60 80 100
41.1%
0 20 40 60 80 100
76.9%
0 20 40 60 80 100
50.2%
Total births (’000) Adolescent birth rate (per 1000 girls)
Coverage levels are shown for the poorest 20% (red) and the richest 20% (orange). The longer the line between the two groups, the greater the absolute inequality. National average coverage across all quintiles is also shown (blue).
Density of doctors, nurses, and midwives per 10 000 population
Postnatal care coverage Exclusive breastfeeding DTP3 coverage Pneumonia care seeking
Met need for contraception Antenatal care coverage (4 visits)Prevention of mother to child transmission of HIV
Skilled attendant at birth
Under-5 mortality rate Maternal mortality rate
Neonatal mortality rate Stunting
The data presented in this country profile have been collated from publicly available sources.
• Global Health Observatory (http://www.who.int/gho/en/): Total population, Total births, Density of doctors, nurses and midwives, Maternal mortality ratio, Under-5 mortality rate, Neonatal mortality rate, Met need for contraception, Demand for family planning satisfied, Antenatal care coverage, Prevention of mother to child transmission of HIV (Antiretroviral prophylaxis for PMTCT), Skilled attendant at birth, Exclusive breastfeeding (for six months), DTP3 coverage, Total health expenditure per capita.
• 2015 Progress report on implementing the Commission on Information and Accountability Recommendations: Birth registration, Death registration, MDSR, CRVS, National eHealth strategy, Total health expenditureper capita tracked by financing source, Country conducted annual health sector review, Health sector performance report available in the public domain.
• Countdown to 2015: MDG targets for MMR and U5MR, Postnatal care coverage, Pneumonia care seeking (antibiotic treatment for pneumonia), Quintile data for all 8 health coverage indicators.
• System of Health Accounts 2011: Total RMNCH expenditure per capita, expenditure tracked by financing source, Total annual RMNCH expenditure.
• The remaining indicators were taken from various sources (in brackets): Mutual assessment of progress exists (IHP+Results, 2014); Legal status of abortion, Under-5 population (UN Population Division);Adolescent birth rate (per 1000 girls) (UN Population Division); Stunting (data.unicef.org); Laws/regulations that allow adolescents access to contraceptives (WHO MNCAH Key Informant Policy Questionnaire).
2015 | Country Overview
196 Achievements and Prospects
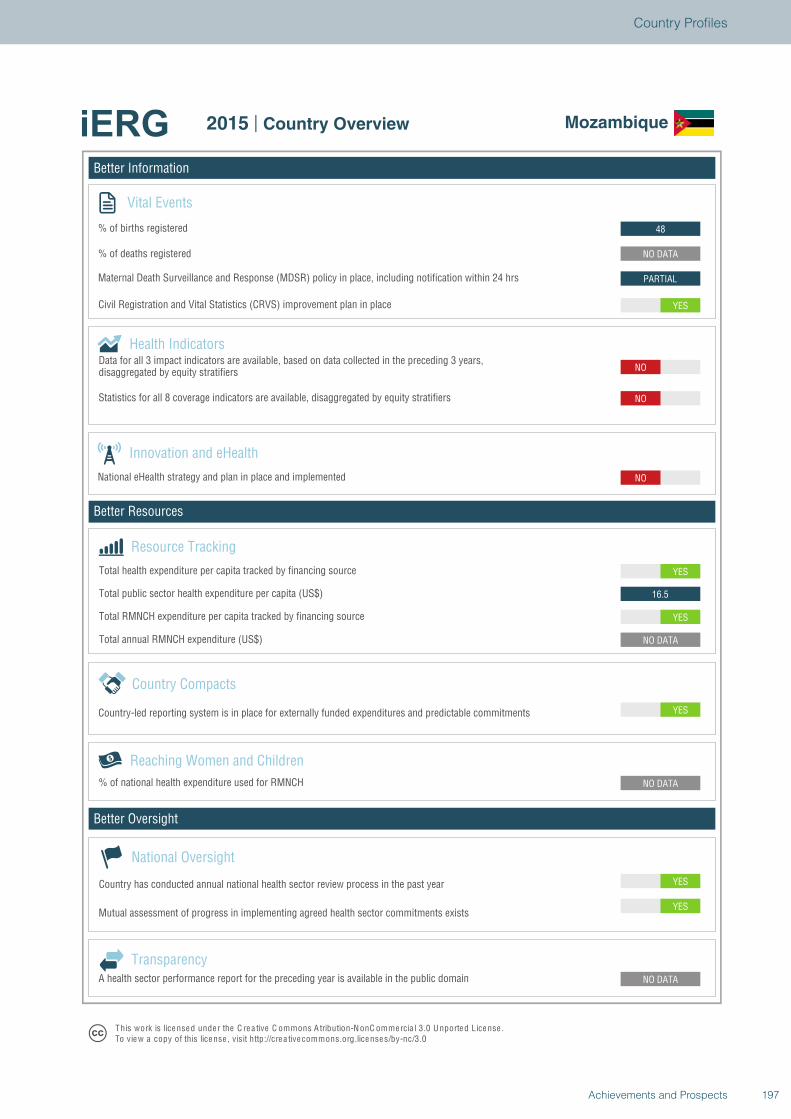
Better Information
Better Resources
Better Oversight
Mozambique
Vital Events
% of births registered
% of deaths registered
Innovation and eHealth
National eHealth strategy and plan in place and implemented
Health Indicators
Statistics for all 8 coverage indicators are available, disaggregated by equity stratifiers
Reaching Women and Children
Country Compacts
Country-led reporting system is in place for externally funded expenditures and predictable commitments
Resource Tracking
Total RMNCH expenditure per capita tracked by financing source
Total annual RMNCH expenditure (US$)
Total health expenditure per capita tracked by financing source
% of national health expenditure used for RMNCH
YES
YES
NO DATA
NO DATA
YES
NO DATA
YES
16.5
YES
NO
NO
NO
YES
PARTIAL
NO DATA
48
National Oversight
Mutual assessment of progress in implementing agreed health sector commitments exists
Country has conducted annual national health sector review process in the past year
TransparencyA health sector performance report for the preceding year is available in the public domain
T his work is lice nse d unde r the C re a tive C ommons A tribution-N onC ommercia l 3.0 U nported License .To view a copy of this license , visit http://cre a tive commons.org.licenses/by-nc/3.0
2015 | Country Overview Mozambique
Total public sector health expenditure per capita (US$)
Maternal Death Surveillance and Response (MDSR) policy in place, including notification within 24 hrs
Civil Registration and Vital Statistics (CRVS) improvement plan in place
Data for all 3 impact indicators are available, based on data collected in the preceding 3 years,disaggregated by equity stratifiers
197Achievements and Prospects
Country Profiles

1990
2000
2013
108.6
79.5
50.5
MDG Target: 35
1990 1995 2000 2005 2010 2015
0
50
100
1990
2000
2013
42.2
34.8
25.5
1990 1995 2000 2005 2010 2015
0
10
20
30
40
1990
2000
2013
580
360
200MDG Target: 150
1990 1995 2000 2005 2010 2015
0
200
400
600
1991
2000
2009
53.6
40.8
35.1
1990 1995 2000 2005 2010
0
20
40
Summary
Demographic Data
Myanmar
Total population (’000) Total under-5 population (’000)53 259 4 364
922 16
Reproductive Health and Health Systems Data
Health Coverage Indicators
Demand for familyplanning satisfied
29%
Laws/regulations that allow adolescents access to contraceptives PARTIAL
Legal status of abortion(x of 5 circumstances) 1/5
National AverageBottom Quintile Top Quintile
per 1000 live births per 100 000 live births
per 1000 live births % of children under 5 who are moderately or severely stunted
0 20 40 60 80 100
29%
0 20 40 60 80 100
43%
0 20 40 60 80 100
71.5%
16.150
10
20
30
40 50 60
70
80
90
100
Min Density Threshold
0 20 40 60 80 100
78%
0 20 40 60 80 100
No data
0 20 40 60 80 100
24%
0 20 40 60 80 100
75%
0 20 40 60 80 100
69%
Total births (’000) Adolescent birth rate (per 1000 girls)
Coverage levels are shown for the poorest 20% (red) and the richest 20% (orange). The longer the line between the two groups, the greater the absolute inequality. National average coverage across all quintiles is also shown (blue).
Density of doctors, nurses, and midwives per 10 000 population
Postnatal care coverage Exclusive breastfeeding DTP3 coverage Pneumonia care seeking
Met need for contraception Antenatal care coverage (4 visits)Prevention of mother to child transmission of HIV
Skilled attendant at birth
Under-5 mortality rate Maternal mortality rate
Neonatal mortality rate Stunting
The data presented in this country profile have been collated from publicly available sources.
• Global Health Observatory (http://www.who.int/gho/en/): Total population, Total births, Density of doctors, nurses and midwives, Maternal mortality ratio, Under-5 mortality rate, Neonatal mortality rate, Met need for contraception, Demand for family planning satisfied, Antenatal care coverage, Prevention of mother to child transmission of HIV (Antiretroviral prophylaxis for PMTCT), Skilled attendant at birth, Exclusive breastfeeding (for six months), DTP3 coverage, Total health expenditure per capita.
• 2015 Progress report on implementing the Commission on Information and Accountability Recommendations: Birth registration, Death registration, MDSR, CRVS, National eHealth strategy, Total health expenditureper capita tracked by financing source, Country conducted annual health sector review, Health sector performance report available in the public domain.
• Countdown to 2015: MDG targets for MMR and U5MR, Postnatal care coverage, Pneumonia care seeking (antibiotic treatment for pneumonia), Quintile data for all 8 health coverage indicators.
• System of Health Accounts 2011: Total RMNCH expenditure per capita, expenditure tracked by financing source, Total annual RMNCH expenditure.
• The remaining indicators were taken from various sources (in brackets): Mutual assessment of progress exists (IHP+Results, 2014); Legal status of abortion, Under-5 population (UN Population Division);Adolescent birth rate (per 1000 girls) (UN Population Division); Stunting (data.unicef.org); Laws/regulations that allow adolescents access to contraceptives (WHO MNCAH Key Informant Policy Questionnaire).
2015 | Country Overview
198 Achievements and Prospects
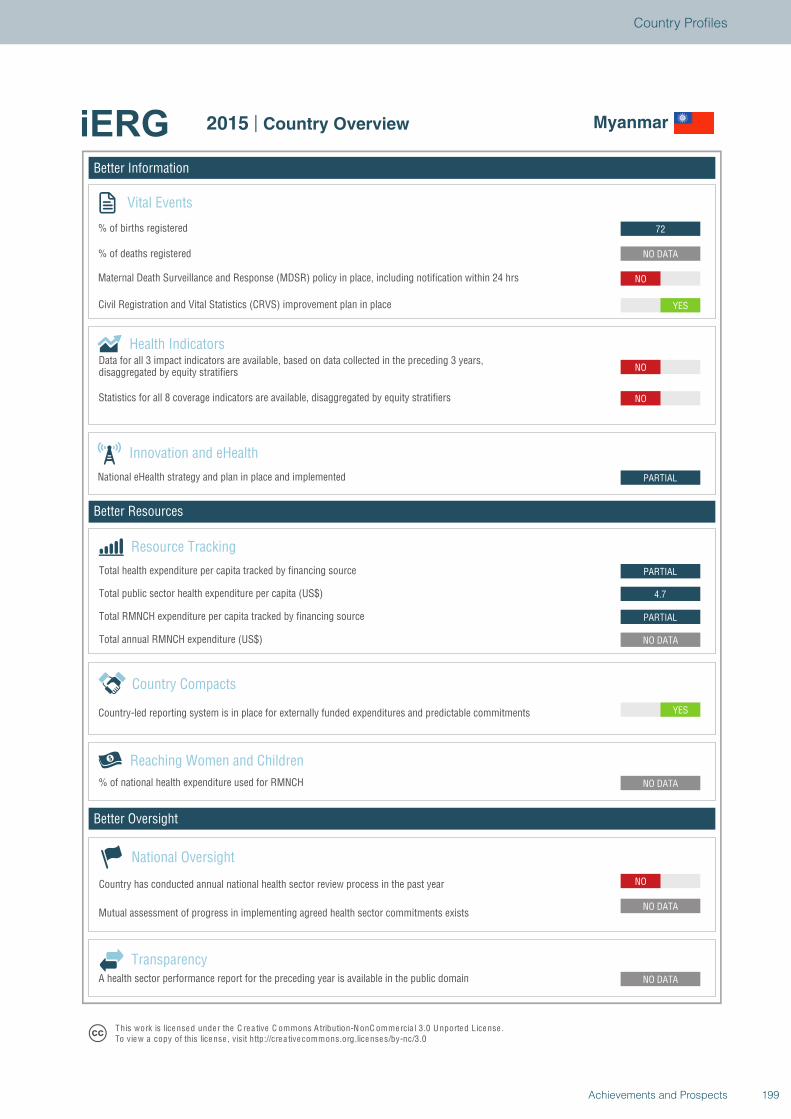
Better Information
Better Resources
Better Oversight
Myanmar
Vital Events
% of births registered
% of deaths registered
Innovation and eHealth
National eHealth strategy and plan in place and implemented
Health Indicators
Statistics for all 8 coverage indicators are available, disaggregated by equity stratifiers
Reaching Women and Children
Country Compacts
Country-led reporting system is in place for externally funded expenditures and predictable commitments
Resource Tracking
Total RMNCH expenditure per capita tracked by financing source
Total annual RMNCH expenditure (US$)
Total health expenditure per capita tracked by financing source
% of national health expenditure used for RMNCH
NO
NO DATA
NO DATA
NO DATA
YES
NO DATA
PARTIAL
4.7
PARTIAL
PARTIAL
NO
NO
YES
NO
NO DATA
72
National Oversight
Mutual assessment of progress in implementing agreed health sector commitments exists
Country has conducted annual national health sector review process in the past year
TransparencyA health sector performance report for the preceding year is available in the public domain
T his work is lice nse d unde r the C re a tive C ommons A tribution-N onC ommercia l 3.0 U nported License .To view a copy of this license , visit http://cre a tive commons.org.licenses/by-nc/3.0
2015 | Country Overview Myanmar
Total public sector health expenditure per capita (US$)
Maternal Death Surveillance and Response (MDSR) policy in place, including notification within 24 hrs
Civil Registration and Vital Statistics (CRVS) improvement plan in place
Data for all 3 impact indicators are available, based on data collected in the preceding 3 years,disaggregated by equity stratifiers
199Achievements and Prospects
Country Profiles
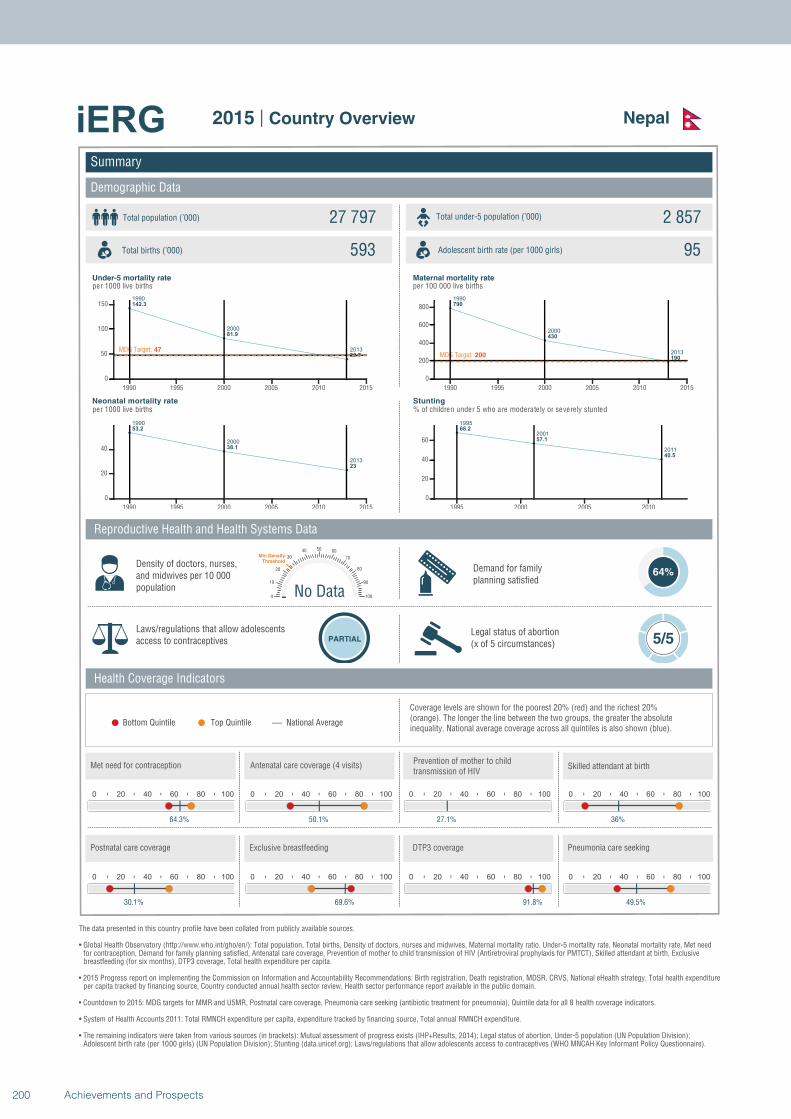
1990
2000
2013
142.3
81.9
39.7
MDG Target: 47
1990 1995 2000 2005 2010 2015
0
50
100
150
1990
2000
2013
53.2
38.1
23
1990 1995 2000 2005 2010 2015
0
20
40
1990
2000
2013
790
430
190MDG Target: 200
1990 1995 2000 2005 2010 2015
0
200
400
600
800
1995
2001
2011
68.2
57.1
40.5
1995 2000 2005 2010
0
20
40
60
Summary
Demographic Data
Nepal
Total population (’000) Total under-5 population (’000)27 797 2 857
593 95
Reproductive Health and Health Systems Data
Health Coverage Indicators
Demand for familyplanning satisfied
64%
Laws/regulations that allow adolescents access to contraceptives PARTIAL
Legal status of abortion(x of 5 circumstances) 5/5
National AverageBottom Quintile Top Quintile
per 1000 live births per 100 000 live births
per 1000 live births % of children under 5 who are moderately or severely stunted
0 20 40 60 80 100
64.3%
0 20 40 60 80 100
50.1%
0 20 40 60 80 100
27.1%
No Data0
10
20
30
40 50 60
70
80
90
100
Min Density Threshold
0 20 40 60 80 100
36%
0 20 40 60 80 100
30.1%
0 20 40 60 80 100
69.6%
0 20 40 60 80 100
91.8%
0 20 40 60 80 100
49.5%
Total births (’000) Adolescent birth rate (per 1000 girls)
Coverage levels are shown for the poorest 20% (red) and the richest 20% (orange). The longer the line between the two groups, the greater the absolute inequality. National average coverage across all quintiles is also shown (blue).
Density of doctors, nurses, and midwives per 10 000 population
Postnatal care coverage Exclusive breastfeeding DTP3 coverage Pneumonia care seeking
Met need for contraception Antenatal care coverage (4 visits)Prevention of mother to child transmission of HIV
Skilled attendant at birth
Under-5 mortality rate Maternal mortality rate
Neonatal mortality rate Stunting
The data presented in this country profile have been collated from publicly available sources.
• Global Health Observatory (http://www.who.int/gho/en/): Total population, Total births, Density of doctors, nurses and midwives, Maternal mortality ratio, Under-5 mortality rate, Neonatal mortality rate, Met need for contraception, Demand for family planning satisfied, Antenatal care coverage, Prevention of mother to child transmission of HIV (Antiretroviral prophylaxis for PMTCT), Skilled attendant at birth, Exclusive breastfeeding (for six months), DTP3 coverage, Total health expenditure per capita.
• 2015 Progress report on implementing the Commission on Information and Accountability Recommendations: Birth registration, Death registration, MDSR, CRVS, National eHealth strategy, Total health expenditureper capita tracked by financing source, Country conducted annual health sector review, Health sector performance report available in the public domain.
• Countdown to 2015: MDG targets for MMR and U5MR, Postnatal care coverage, Pneumonia care seeking (antibiotic treatment for pneumonia), Quintile data for all 8 health coverage indicators.
• System of Health Accounts 2011: Total RMNCH expenditure per capita, expenditure tracked by financing source, Total annual RMNCH expenditure.
• The remaining indicators were taken from various sources (in brackets): Mutual assessment of progress exists (IHP+Results, 2014); Legal status of abortion, Under-5 population (UN Population Division);Adolescent birth rate (per 1000 girls) (UN Population Division); Stunting (data.unicef.org); Laws/regulations that allow adolescents access to contraceptives (WHO MNCAH Key Informant Policy Questionnaire).
2015 | Country Overview
200 Achievements and Prospects
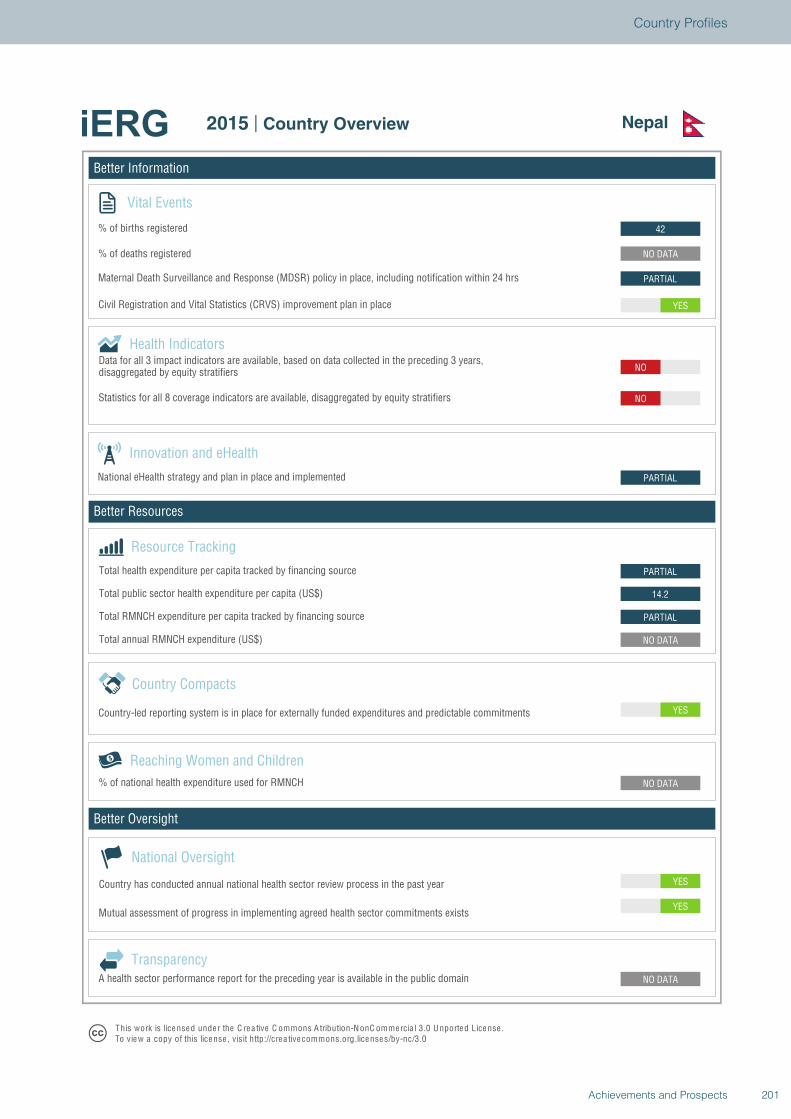
Better Information
Better Resources
Better Oversight
Nepal
Vital Events
% of births registered
% of deaths registered
Innovation and eHealth
National eHealth strategy and plan in place and implemented
Health Indicators
Statistics for all 8 coverage indicators are available, disaggregated by equity stratifiers
Reaching Women and Children
Country Compacts
Country-led reporting system is in place for externally funded expenditures and predictable commitments
Resource Tracking
Total RMNCH expenditure per capita tracked by financing source
Total annual RMNCH expenditure (US$)
Total health expenditure per capita tracked by financing source
% of national health expenditure used for RMNCH
YES
YES
NO DATA
NO DATA
YES
NO DATA
PARTIAL
14.2
PARTIAL
PARTIAL
NO
NO
YES
PARTIAL
NO DATA
42
National Oversight
Mutual assessment of progress in implementing agreed health sector commitments exists
Country has conducted annual national health sector review process in the past year
TransparencyA health sector performance report for the preceding year is available in the public domain
T his work is lice nse d unde r the C re a tive C ommons A tribution-N onC ommercia l 3.0 U nported License .To view a copy of this license , visit http://cre a tive commons.org.licenses/by-nc/3.0
2015 | Country Overview Nepal
Total public sector health expenditure per capita (US$)
Maternal Death Surveillance and Response (MDSR) policy in place, including notification within 24 hrs
Civil Registration and Vital Statistics (CRVS) improvement plan in place
Data for all 3 impact indicators are available, based on data collected in the preceding 3 years,disaggregated by equity stratifiers
201Achievements and Prospects
Country Profiles
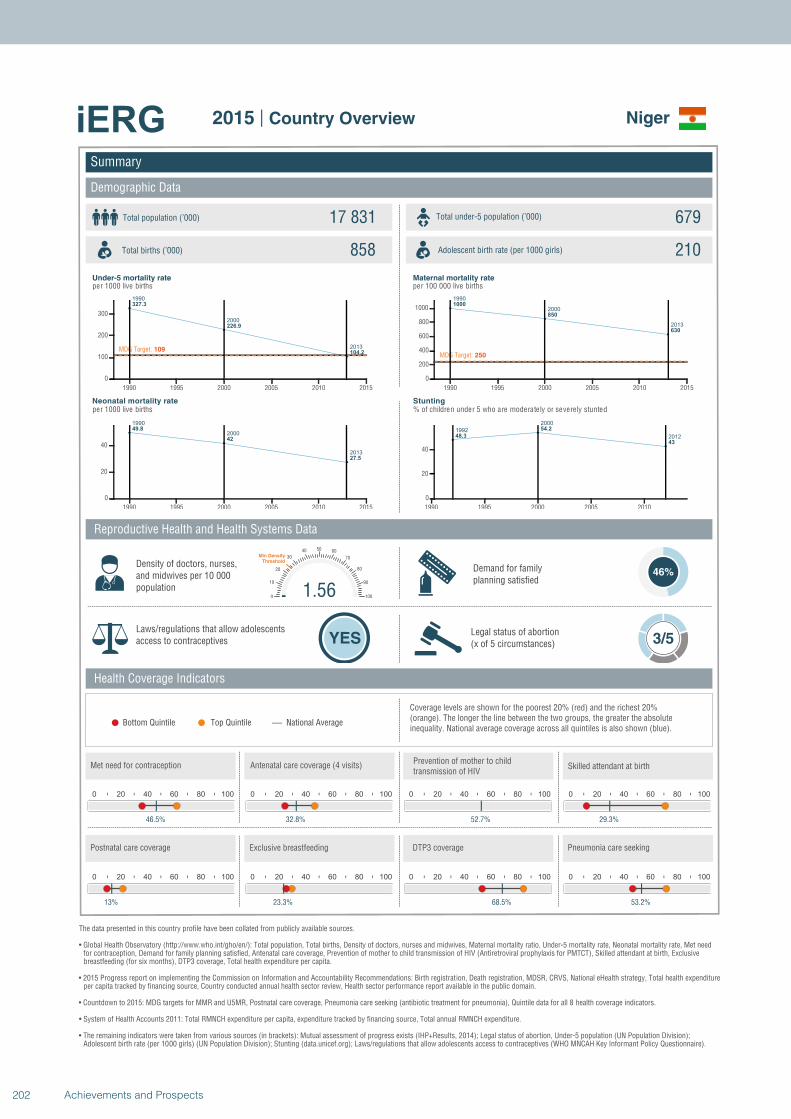
1990
2000
2013
327.3
226.9
104.2MDG Target: 109
1990 1995 2000 2005 2010 2015
0
100
200
300
1990
2000
2013
49.8
42
27.5
1990 1995 2000 2005 2010 2015
0
20
40
1990
2000
2013
1000
850
630
MDG Target: 250
1990 1995 2000 2005 2010 2015
0
200
400
600
800
1000
1992
2000
201248.3
54.2
43
1990 1995 2000 2005 2010
0
20
40
Summary
Demographic Data
Niger
Total population (’000) Total under-5 population (’000)17 831 679
858 210
Reproductive Health and Health Systems Data
Health Coverage Indicators
Demand for familyplanning satisfied
46%
Laws/regulations that allow adolescents access to contraceptives YES
Legal status of abortion(x of 5 circumstances) 3/5
National AverageBottom Quintile Top Quintile
per 1000 live births per 100 000 live births
per 1000 live births % of children under 5 who are moderately or severely stunted
0 20 40 60 80 100
46.5%
0 20 40 60 80 100
32.8%
0 20 40 60 80 100
52.7%
1.560
10
20
30
40 50 60
70
80
90
100
Min Density Threshold
0 20 40 60 80 100
29.3%
0 20 40 60 80 100
13%
0 20 40 60 80 100
23.3%
0 20 40 60 80 100
68.5%
0 20 40 60 80 100
53.2%
Total births (’000) Adolescent birth rate (per 1000 girls)
Coverage levels are shown for the poorest 20% (red) and the richest 20% (orange). The longer the line between the two groups, the greater the absolute inequality. National average coverage across all quintiles is also shown (blue).
Density of doctors, nurses, and midwives per 10 000 population
Postnatal care coverage Exclusive breastfeeding DTP3 coverage Pneumonia care seeking
Met need for contraception Antenatal care coverage (4 visits)Prevention of mother to child transmission of HIV
Skilled attendant at birth
Under-5 mortality rate Maternal mortality rate
Neonatal mortality rate Stunting
The data presented in this country profile have been collated from publicly available sources.
• Global Health Observatory (http://www.who.int/gho/en/): Total population, Total births, Density of doctors, nurses and midwives, Maternal mortality ratio, Under-5 mortality rate, Neonatal mortality rate, Met need for contraception, Demand for family planning satisfied, Antenatal care coverage, Prevention of mother to child transmission of HIV (Antiretroviral prophylaxis for PMTCT), Skilled attendant at birth, Exclusive breastfeeding (for six months), DTP3 coverage, Total health expenditure per capita.
• 2015 Progress report on implementing the Commission on Information and Accountability Recommendations: Birth registration, Death registration, MDSR, CRVS, National eHealth strategy, Total health expenditureper capita tracked by financing source, Country conducted annual health sector review, Health sector performance report available in the public domain.
• Countdown to 2015: MDG targets for MMR and U5MR, Postnatal care coverage, Pneumonia care seeking (antibiotic treatment for pneumonia), Quintile data for all 8 health coverage indicators.
• System of Health Accounts 2011: Total RMNCH expenditure per capita, expenditure tracked by financing source, Total annual RMNCH expenditure.
• The remaining indicators were taken from various sources (in brackets): Mutual assessment of progress exists (IHP+Results, 2014); Legal status of abortion, Under-5 population (UN Population Division);Adolescent birth rate (per 1000 girls) (UN Population Division); Stunting (data.unicef.org); Laws/regulations that allow adolescents access to contraceptives (WHO MNCAH Key Informant Policy Questionnaire).
2015 | Country Overview
202 Achievements and Prospects
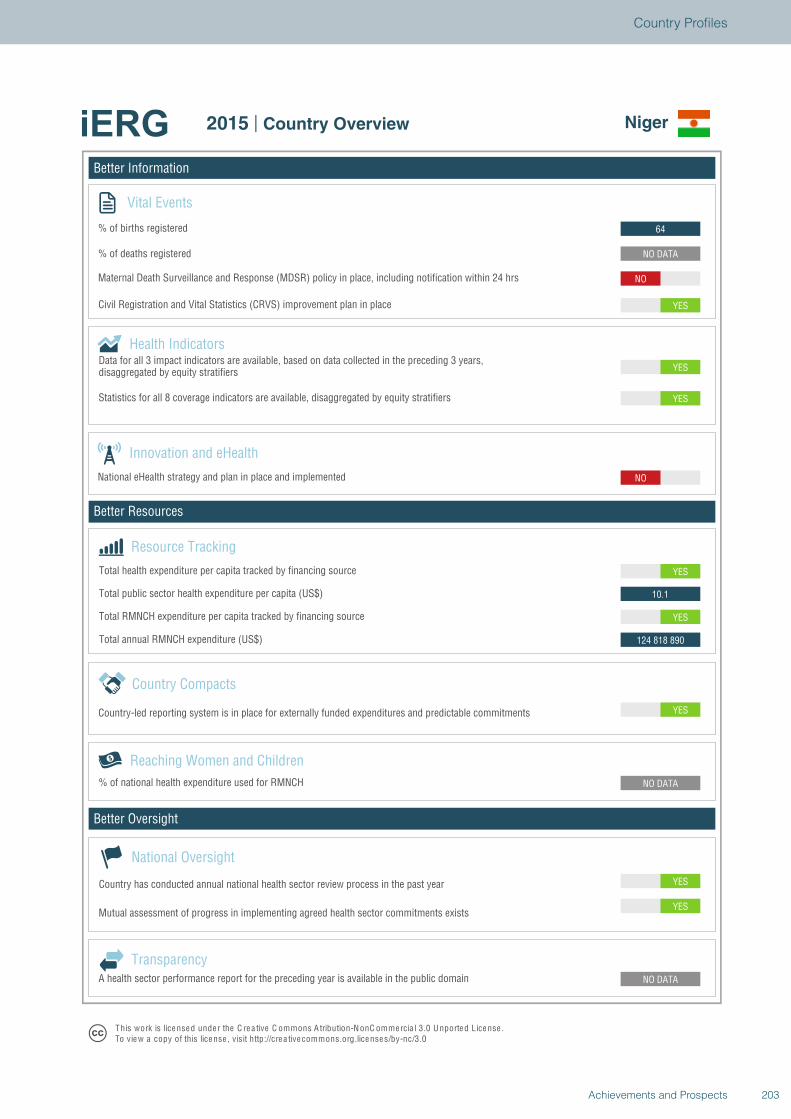
Better Information
Better Resources
Better Oversight
Niger
Vital Events
% of births registered
% of deaths registered
Innovation and eHealth
National eHealth strategy and plan in place and implemented
Health Indicators
Statistics for all 8 coverage indicators are available, disaggregated by equity stratifiers
Reaching Women and Children
Country Compacts
Country-led reporting system is in place for externally funded expenditures and predictable commitments
Resource Tracking
Total RMNCH expenditure per capita tracked by financing source
Total annual RMNCH expenditure (US$)
Total health expenditure per capita tracked by financing source
% of national health expenditure used for RMNCH
YES
YES
NO DATA
NO DATA
YES
124 818 890
YES
10.1
YES
NO
YES
YES
YES
NO
NO DATA
64
National Oversight
Mutual assessment of progress in implementing agreed health sector commitments exists
Country has conducted annual national health sector review process in the past year
TransparencyA health sector performance report for the preceding year is available in the public domain
T his work is lice nse d unde r the C re a tive C ommons A tribution-N onC ommercia l 3.0 U nported License .To view a copy of this license , visit http://cre a tive commons.org.licenses/by-nc/3.0
2015 | Country Overview Niger
Total public sector health expenditure per capita (US$)
Maternal Death Surveillance and Response (MDSR) policy in place, including notification within 24 hrs
Civil Registration and Vital Statistics (CRVS) improvement plan in place
Data for all 3 impact indicators are available, based on data collected in the preceding 3 years,disaggregated by equity stratifiers
203Achievements and Prospects
Country Profiles
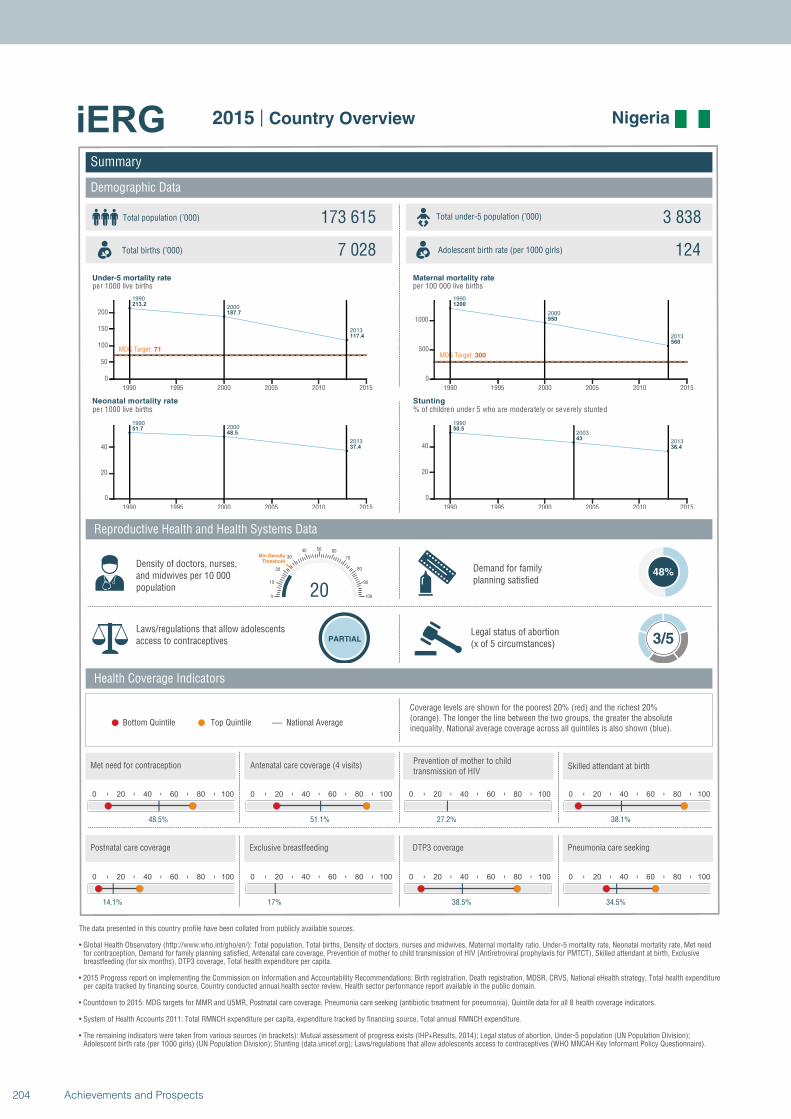
1990
2000
2013
213.2
187.7
117.4
MDG Target: 71
1990 1995 2000 2005 2010 2015
0
50
100
150
200
19902000
2013
51.748.5
37.4
1990 1995 2000 2005 2010 2015
0
20
40
1990
2000
2013
1200
950
560
MDG Target: 300
1990 1995 2000 2005 2010 2015
0
500
1000
1990
2003
2013
50.5
43
36.4
1990 1995 2000 2005 2010 2015
0
20
40
Summary
Demographic Data
Nigeria
Total population (’000) Total under-5 population (’000)173 615 3 838
7 028 124
Reproductive Health and Health Systems Data
Health Coverage Indicators
Demand for familyplanning satisfied
48%
Laws/regulations that allow adolescents access to contraceptives PARTIAL
Legal status of abortion(x of 5 circumstances) 3/5
National AverageBottom Quintile Top Quintile
per 1000 live births per 100 000 live births
per 1000 live births % of children under 5 who are moderately or severely stunted
0 20 40 60 80 100
48.5%
0 20 40 60 80 100
51.1%
0 20 40 60 80 100
27.2%
200
10
20
30
40 50 60
70
80
90
100
Min Density Threshold
0 20 40 60 80 100
38.1%
0 20 40 60 80 100
14.1%
0 20 40 60 80 100
17%
0 20 40 60 80 100
38.5%
0 20 40 60 80 100
34.5%
Total births (’000) Adolescent birth rate (per 1000 girls)
Coverage levels are shown for the poorest 20% (red) and the richest 20% (orange). The longer the line between the two groups, the greater the absolute inequality. National average coverage across all quintiles is also shown (blue).
Density of doctors, nurses, and midwives per 10 000 population
Postnatal care coverage Exclusive breastfeeding DTP3 coverage Pneumonia care seeking
Met need for contraception Antenatal care coverage (4 visits)Prevention of mother to child transmission of HIV
Skilled attendant at birth
Under-5 mortality rate Maternal mortality rate
Neonatal mortality rate Stunting
The data presented in this country profile have been collated from publicly available sources.
• Global Health Observatory (http://www.who.int/gho/en/): Total population, Total births, Density of doctors, nurses and midwives, Maternal mortality ratio, Under-5 mortality rate, Neonatal mortality rate, Met need for contraception, Demand for family planning satisfied, Antenatal care coverage, Prevention of mother to child transmission of HIV (Antiretroviral prophylaxis for PMTCT), Skilled attendant at birth, Exclusive breastfeeding (for six months), DTP3 coverage, Total health expenditure per capita.
• 2015 Progress report on implementing the Commission on Information and Accountability Recommendations: Birth registration, Death registration, MDSR, CRVS, National eHealth strategy, Total health expenditureper capita tracked by financing source, Country conducted annual health sector review, Health sector performance report available in the public domain.
• Countdown to 2015: MDG targets for MMR and U5MR, Postnatal care coverage, Pneumonia care seeking (antibiotic treatment for pneumonia), Quintile data for all 8 health coverage indicators.
• System of Health Accounts 2011: Total RMNCH expenditure per capita, expenditure tracked by financing source, Total annual RMNCH expenditure.
• The remaining indicators were taken from various sources (in brackets): Mutual assessment of progress exists (IHP+Results, 2014); Legal status of abortion, Under-5 population (UN Population Division);Adolescent birth rate (per 1000 girls) (UN Population Division); Stunting (data.unicef.org); Laws/regulations that allow adolescents access to contraceptives (WHO MNCAH Key Informant Policy Questionnaire).
2015 | Country Overview
204 Achievements and Prospects
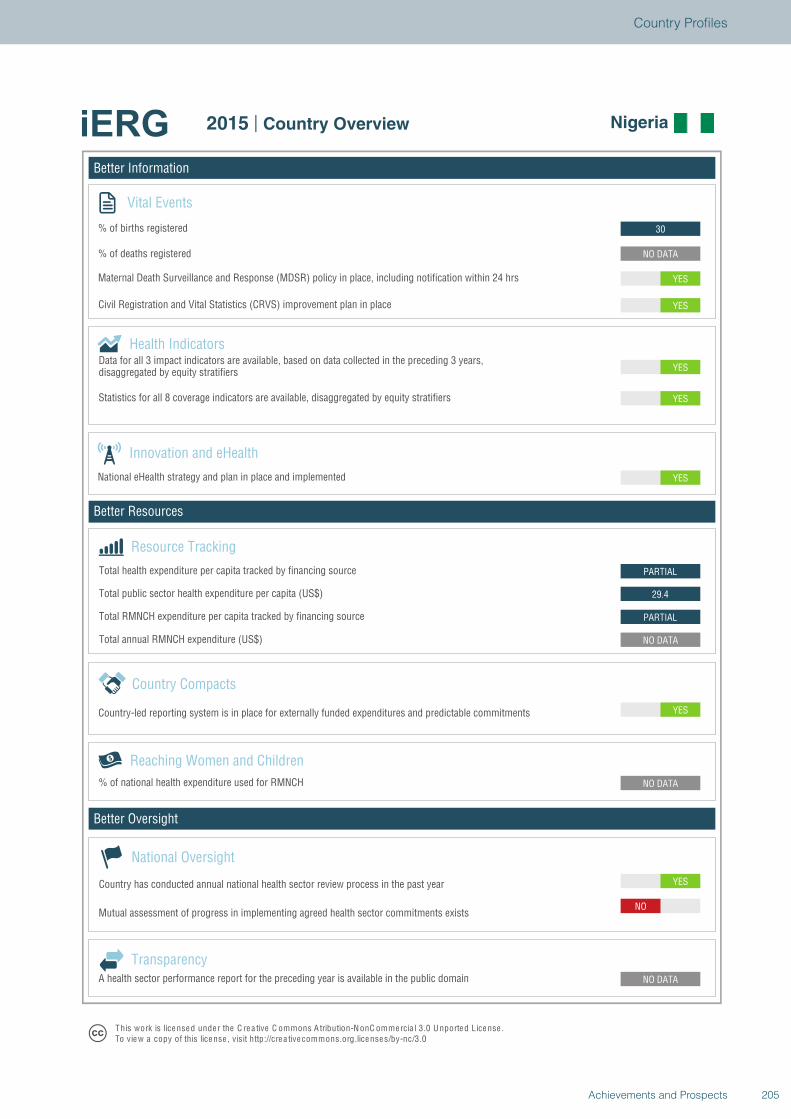
Better Information
Better Resources
Better Oversight
Nigeria
Vital Events
% of births registered
% of deaths registered
Innovation and eHealth
National eHealth strategy and plan in place and implemented
Health Indicators
Statistics for all 8 coverage indicators are available, disaggregated by equity stratifiers
Reaching Women and Children
Country Compacts
Country-led reporting system is in place for externally funded expenditures and predictable commitments
Resource Tracking
Total RMNCH expenditure per capita tracked by financing source
Total annual RMNCH expenditure (US$)
Total health expenditure per capita tracked by financing source
% of national health expenditure used for RMNCH
YES
NO
NO DATA
NO DATA
YES
NO DATA
PARTIAL
29.4
PARTIAL
YES
YES
YES
YES
YES
NO DATA
30
National Oversight
Mutual assessment of progress in implementing agreed health sector commitments exists
Country has conducted annual national health sector review process in the past year
TransparencyA health sector performance report for the preceding year is available in the public domain
T his work is lice nse d unde r the C re a tive C ommons A tribution-N onC ommercia l 3.0 U nported License .To view a copy of this license , visit http://cre a tive commons.org.licenses/by-nc/3.0
2015 | Country Overview Nigeria
Total public sector health expenditure per capita (US$)
Maternal Death Surveillance and Response (MDSR) policy in place, including notification within 24 hrs
Civil Registration and Vital Statistics (CRVS) improvement plan in place
Data for all 3 impact indicators are available, based on data collected in the preceding 3 years,disaggregated by equity stratifiers
205Achievements and Prospects
Country Profiles
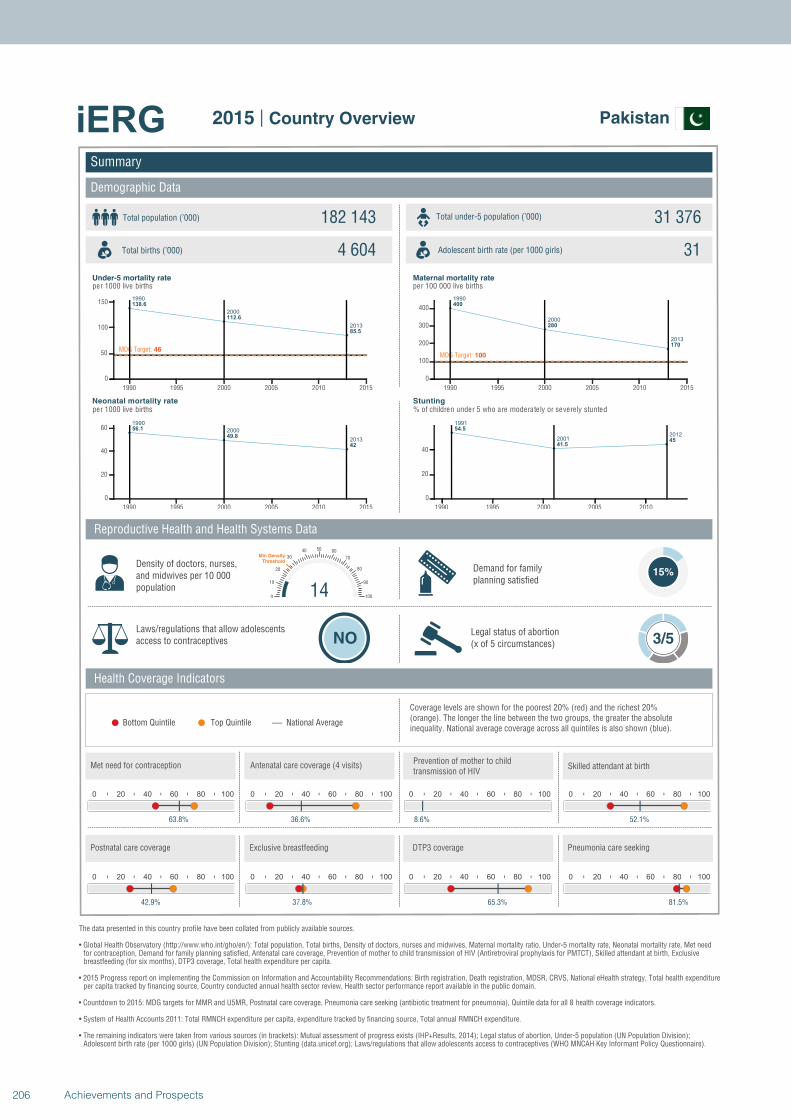
1990
2000
2013
138.6
112.6
85.5
MDG Target: 46
1990 1995 2000 2005 2010 2015
0
50
100
150
1990
2000
2013
56.1
49.8
42
1990 1995 2000 2005 2010 2015
0
20
40
60
1990
2000
2013
400
280
170
MDG Target: 100
1990 1995 2000 2005 2010 2015
0
100
200
300
400
1991
20012012
54.5
41.545
1990 1995 2000 2005 2010
0
20
40
Summary
Demographic Data
Pakistan
Total population (’000) Total under-5 population (’000)182 143 31 376
4 604 31
Reproductive Health and Health Systems Data
Health Coverage Indicators
Demand for familyplanning satisfied
15%
Laws/regulations that allow adolescents access to contraceptives NO
Legal status of abortion(x of 5 circumstances) 3/5
National AverageBottom Quintile Top Quintile
per 1000 live births per 100 000 live births
per 1000 live births % of children under 5 who are moderately or severely stunted
0 20 40 60 80 100
63.8%
0 20 40 60 80 100
36.6%
0 20 40 60 80 100
8.6%
140
10
20
30
40 50 60
70
80
90
100
Min Density Threshold
0 20 40 60 80 100
52.1%
0 20 40 60 80 100
42.9%
0 20 40 60 80 100
37.8%
0 20 40 60 80 100
65.3%
0 20 40 60 80 100
81.5%
Total births (’000) Adolescent birth rate (per 1000 girls)
Coverage levels are shown for the poorest 20% (red) and the richest 20% (orange). The longer the line between the two groups, the greater the absolute inequality. National average coverage across all quintiles is also shown (blue).
Density of doctors, nurses, and midwives per 10 000 population
Postnatal care coverage Exclusive breastfeeding DTP3 coverage Pneumonia care seeking
Met need for contraception Antenatal care coverage (4 visits)Prevention of mother to child transmission of HIV
Skilled attendant at birth
Under-5 mortality rate Maternal mortality rate
Neonatal mortality rate Stunting
The data presented in this country profile have been collated from publicly available sources.
• Global Health Observatory (http://www.who.int/gho/en/): Total population, Total births, Density of doctors, nurses and midwives, Maternal mortality ratio, Under-5 mortality rate, Neonatal mortality rate, Met need for contraception, Demand for family planning satisfied, Antenatal care coverage, Prevention of mother to child transmission of HIV (Antiretroviral prophylaxis for PMTCT), Skilled attendant at birth, Exclusive breastfeeding (for six months), DTP3 coverage, Total health expenditure per capita.
• 2015 Progress report on implementing the Commission on Information and Accountability Recommendations: Birth registration, Death registration, MDSR, CRVS, National eHealth strategy, Total health expenditureper capita tracked by financing source, Country conducted annual health sector review, Health sector performance report available in the public domain.
• Countdown to 2015: MDG targets for MMR and U5MR, Postnatal care coverage, Pneumonia care seeking (antibiotic treatment for pneumonia), Quintile data for all 8 health coverage indicators.
• System of Health Accounts 2011: Total RMNCH expenditure per capita, expenditure tracked by financing source, Total annual RMNCH expenditure.
• The remaining indicators were taken from various sources (in brackets): Mutual assessment of progress exists (IHP+Results, 2014); Legal status of abortion, Under-5 population (UN Population Division);Adolescent birth rate (per 1000 girls) (UN Population Division); Stunting (data.unicef.org); Laws/regulations that allow adolescents access to contraceptives (WHO MNCAH Key Informant Policy Questionnaire).
2015 | Country Overview
206 Achievements and Prospects
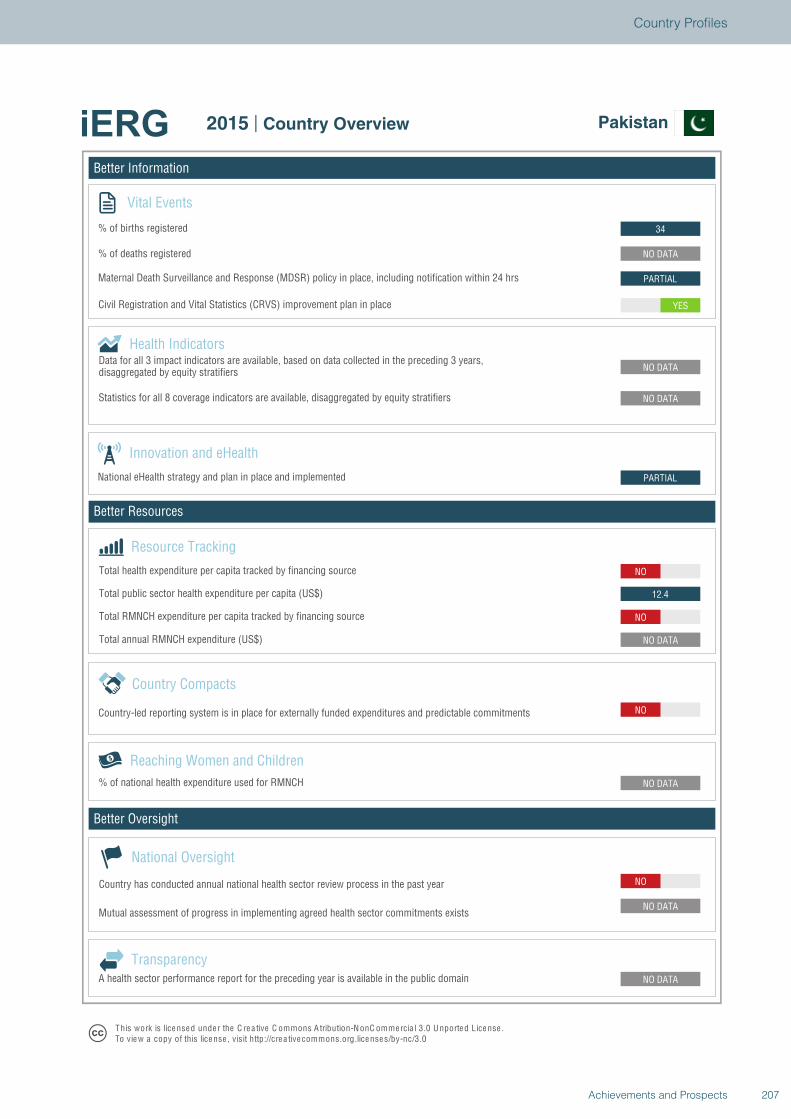
Better Information
Better Resources
Better Oversight
Pakistan
Vital Events
% of births registered
% of deaths registered
Innovation and eHealth
National eHealth strategy and plan in place and implemented
Health Indicators
Statistics for all 8 coverage indicators are available, disaggregated by equity stratifiers
Reaching Women and Children
Country Compacts
Country-led reporting system is in place for externally funded expenditures and predictable commitments
Resource Tracking
Total RMNCH expenditure per capita tracked by financing source
Total annual RMNCH expenditure (US$)
Total health expenditure per capita tracked by financing source
% of national health expenditure used for RMNCH
NO
NO DATA
NO DATA
NO DATA
NO
NO DATA
NO
12.4
NO
PARTIAL
NO DATA
NO DATA
YES
PARTIAL
NO DATA
34
National Oversight
Mutual assessment of progress in implementing agreed health sector commitments exists
Country has conducted annual national health sector review process in the past year
TransparencyA health sector performance report for the preceding year is available in the public domain
T his work is lice nse d unde r the C re a tive C ommons A tribution-N onC ommercia l 3.0 U nported License .To view a copy of this license , visit http://cre a tive commons.org.licenses/by-nc/3.0
2015 | Country Overview Pakistan
Total public sector health expenditure per capita (US$)
Maternal Death Surveillance and Response (MDSR) policy in place, including notification within 24 hrs
Civil Registration and Vital Statistics (CRVS) improvement plan in place
Data for all 3 impact indicators are available, based on data collected in the preceding 3 years,disaggregated by equity stratifiers
207Achievements and Prospects
Country Profiles
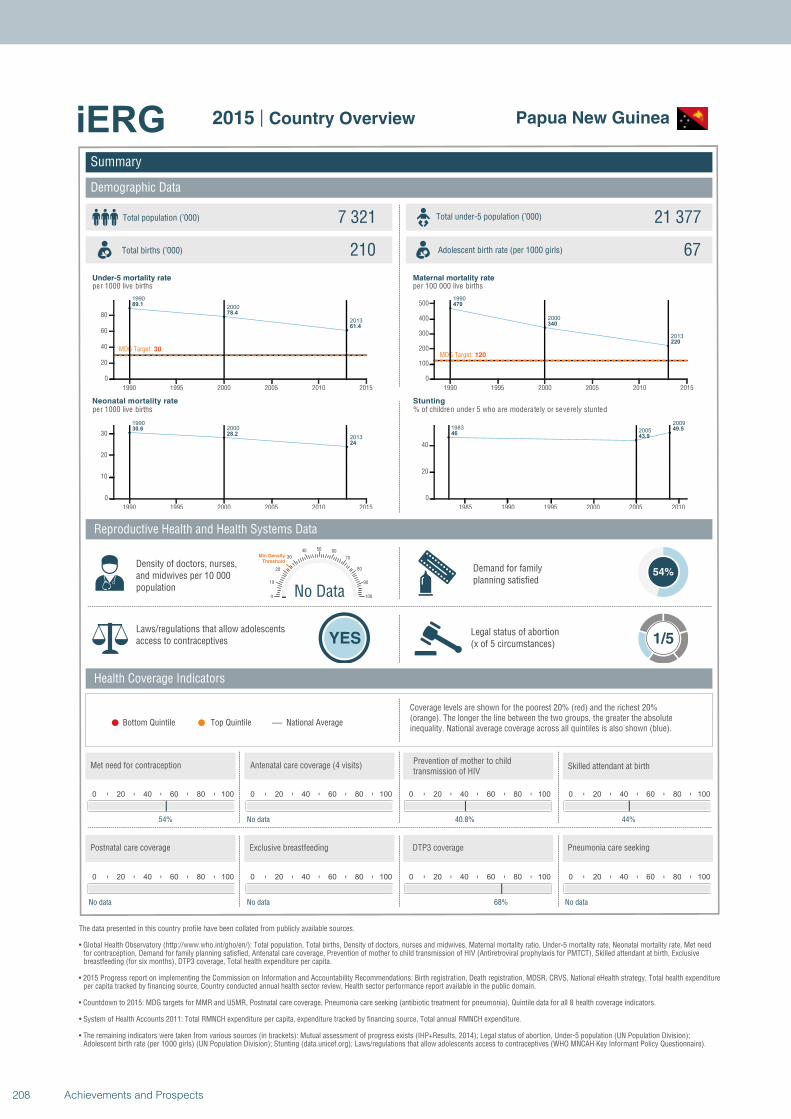
1990
2000
2013
89.1
78.4
61.4
MDG Target: 30
1990 1995 2000 2005 2010 2015
0
20
40
60
80
19902000
2013
30.628.2
24
1990 1995 2000 2005 2010 2015
0
10
20
30
1990
2000
2013
470
340
220
MDG Target: 120
1990 1995 2000 2005 2010 2015
0
100
200
300
400
500
19832005
2009
4643.9
49.5
1985 1990 1995 2000 2005 2010
0
20
40
Summary
Demographic Data
Papua New Guinea
Total population (’000) Total under-5 population (’000)7 321 21 377
210 67
Reproductive Health and Health Systems Data
Health Coverage Indicators
Demand for familyplanning satisfied
54%
Laws/regulations that allow adolescents access to contraceptives YES
Legal status of abortion(x of 5 circumstances) 1/5
National AverageBottom Quintile Top Quintile
per 1000 live births per 100 000 live births
per 1000 live births % of children under 5 who are moderately or severely stunted
0 20 40 60 80 100
54%
0 20 40 60 80 100
No data
0 20 40 60 80 100
40.8%
No Data0
10
20
30
40 50 60
70
80
90
100
Min Density Threshold
0 20 40 60 80 100
44%
0 20 40 60 80 100
No data
0 20 40 60 80 100
No data
0 20 40 60 80 100
68%
0 20 40 60 80 100
No data
Total births (’000) Adolescent birth rate (per 1000 girls)
Coverage levels are shown for the poorest 20% (red) and the richest 20% (orange). The longer the line between the two groups, the greater the absolute inequality. National average coverage across all quintiles is also shown (blue).
Density of doctors, nurses, and midwives per 10 000 population
Postnatal care coverage Exclusive breastfeeding DTP3 coverage Pneumonia care seeking
Met need for contraception Antenatal care coverage (4 visits)Prevention of mother to child transmission of HIV
Skilled attendant at birth
Under-5 mortality rate Maternal mortality rate
Neonatal mortality rate Stunting
The data presented in this country profile have been collated from publicly available sources.
• Global Health Observatory (http://www.who.int/gho/en/): Total population, Total births, Density of doctors, nurses and midwives, Maternal mortality ratio, Under-5 mortality rate, Neonatal mortality rate, Met need for contraception, Demand for family planning satisfied, Antenatal care coverage, Prevention of mother to child transmission of HIV (Antiretroviral prophylaxis for PMTCT), Skilled attendant at birth, Exclusive breastfeeding (for six months), DTP3 coverage, Total health expenditure per capita.
• 2015 Progress report on implementing the Commission on Information and Accountability Recommendations: Birth registration, Death registration, MDSR, CRVS, National eHealth strategy, Total health expenditureper capita tracked by financing source, Country conducted annual health sector review, Health sector performance report available in the public domain.
• Countdown to 2015: MDG targets for MMR and U5MR, Postnatal care coverage, Pneumonia care seeking (antibiotic treatment for pneumonia), Quintile data for all 8 health coverage indicators.
• System of Health Accounts 2011: Total RMNCH expenditure per capita, expenditure tracked by financing source, Total annual RMNCH expenditure.
• The remaining indicators were taken from various sources (in brackets): Mutual assessment of progress exists (IHP+Results, 2014); Legal status of abortion, Under-5 population (UN Population Division);Adolescent birth rate (per 1000 girls) (UN Population Division); Stunting (data.unicef.org); Laws/regulations that allow adolescents access to contraceptives (WHO MNCAH Key Informant Policy Questionnaire).
2015 | Country Overview
208 Achievements and Prospects
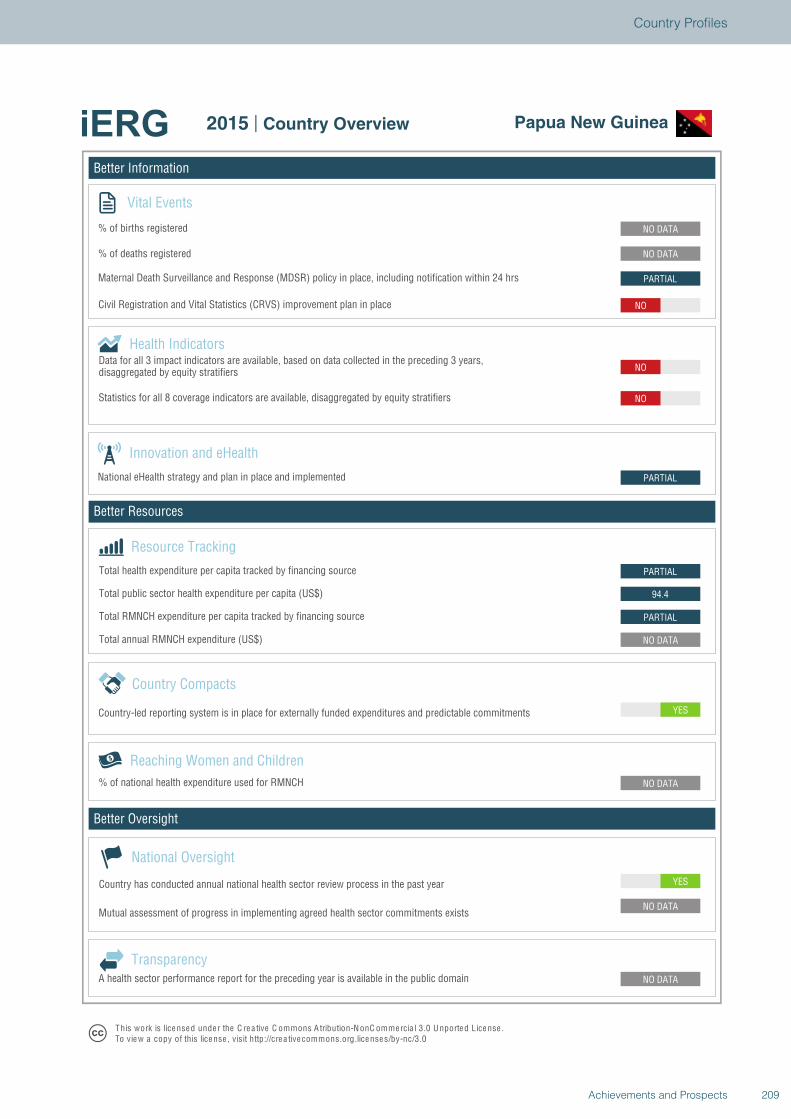
Better Information
Better Resources
Better Oversight
Papua New Guinea
Vital Events
% of births registered
% of deaths registered
Innovation and eHealth
National eHealth strategy and plan in place and implemented
Health Indicators
Statistics for all 8 coverage indicators are available, disaggregated by equity stratifiers
Reaching Women and Children
Country Compacts
Country-led reporting system is in place for externally funded expenditures and predictable commitments
Resource Tracking
Total RMNCH expenditure per capita tracked by financing source
Total annual RMNCH expenditure (US$)
Total health expenditure per capita tracked by financing source
% of national health expenditure used for RMNCH
YES
NO DATA
NO DATA
NO DATA
YES
NO DATA
PARTIAL
94.4
PARTIAL
PARTIAL
NO
NO
NO
PARTIAL
NO DATA
NO DATA
National Oversight
Mutual assessment of progress in implementing agreed health sector commitments exists
Country has conducted annual national health sector review process in the past year
TransparencyA health sector performance report for the preceding year is available in the public domain
T his work is lice nse d unde r the C re a tive C ommons A tribution-N onC ommercia l 3.0 U nported License .To view a copy of this license , visit http://cre a tive commons.org.licenses/by-nc/3.0
2015 | Country Overview Papua New Guinea
Total public sector health expenditure per capita (US$)
Maternal Death Surveillance and Response (MDSR) policy in place, including notification within 24 hrs
Civil Registration and Vital Statistics (CRVS) improvement plan in place
Data for all 3 impact indicators are available, based on data collected in the preceding 3 years,disaggregated by equity stratifiers
209Achievements and Prospects
Country Profiles
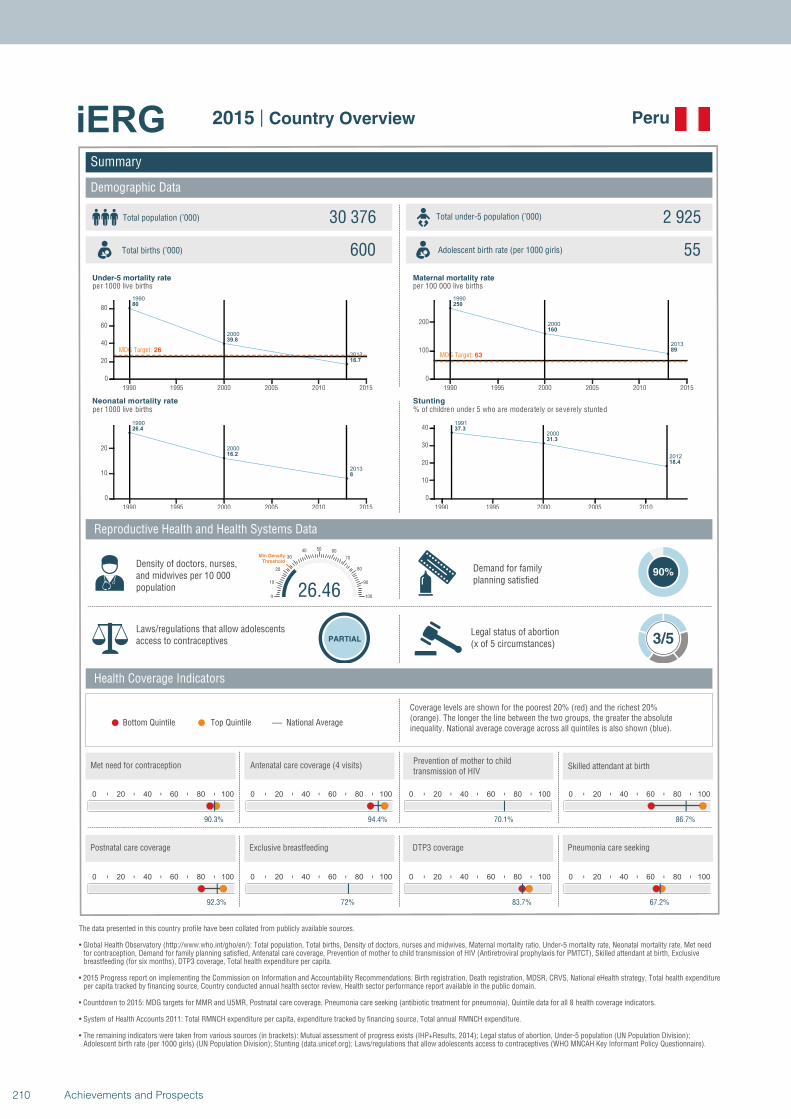
1990
2000
2013
80
39.8
16.7
MDG Target: 26
1990 1995 2000 2005 2010 2015
0
20
40
60
80
1990
2000
2013
26.4
16.2
8
1990 1995 2000 2005 2010 2015
0
10
20
1990
2000
2013
250
160
89
MDG Target: 63
1990 1995 2000 2005 2010 2015
0
100
200
1991
2000
2012
37.3
31.3
18.4
1990 1995 2000 2005 2010
0
10
20
30
40
Summary
Demographic Data
Peru
Total population (’000) Total under-5 population (’000)30 376 2 925
600 55
Reproductive Health and Health Systems Data
Health Coverage Indicators
Demand for familyplanning satisfied
90%
Laws/regulations that allow adolescents access to contraceptives PARTIAL
Legal status of abortion(x of 5 circumstances) 3/5
National AverageBottom Quintile Top Quintile
per 1000 live births per 100 000 live births
per 1000 live births % of children under 5 who are moderately or severely stunted
0 20 40 60 80 100
90.3%
0 20 40 60 80 100
94.4%
0 20 40 60 80 100
70.1%
26.460
10
20
30
40 50 60
70
80
90
100
Min Density Threshold
0 20 40 60 80 100
86.7%
0 20 40 60 80 100
92.3%
0 20 40 60 80 100
72%
0 20 40 60 80 100
83.7%
0 20 40 60 80 100
67.2%
Total births (’000) Adolescent birth rate (per 1000 girls)
Coverage levels are shown for the poorest 20% (red) and the richest 20% (orange). The longer the line between the two groups, the greater the absolute inequality. National average coverage across all quintiles is also shown (blue).
Density of doctors, nurses, and midwives per 10 000 population
Postnatal care coverage Exclusive breastfeeding DTP3 coverage Pneumonia care seeking
Met need for contraception Antenatal care coverage (4 visits)Prevention of mother to child transmission of HIV
Skilled attendant at birth
Under-5 mortality rate Maternal mortality rate
Neonatal mortality rate Stunting
The data presented in this country profile have been collated from publicly available sources.
• Global Health Observatory (http://www.who.int/gho/en/): Total population, Total births, Density of doctors, nurses and midwives, Maternal mortality ratio, Under-5 mortality rate, Neonatal mortality rate, Met need for contraception, Demand for family planning satisfied, Antenatal care coverage, Prevention of mother to child transmission of HIV (Antiretroviral prophylaxis for PMTCT), Skilled attendant at birth, Exclusive breastfeeding (for six months), DTP3 coverage, Total health expenditure per capita.
• 2015 Progress report on implementing the Commission on Information and Accountability Recommendations: Birth registration, Death registration, MDSR, CRVS, National eHealth strategy, Total health expenditureper capita tracked by financing source, Country conducted annual health sector review, Health sector performance report available in the public domain.
• Countdown to 2015: MDG targets for MMR and U5MR, Postnatal care coverage, Pneumonia care seeking (antibiotic treatment for pneumonia), Quintile data for all 8 health coverage indicators.
• System of Health Accounts 2011: Total RMNCH expenditure per capita, expenditure tracked by financing source, Total annual RMNCH expenditure.
• The remaining indicators were taken from various sources (in brackets): Mutual assessment of progress exists (IHP+Results, 2014); Legal status of abortion, Under-5 population (UN Population Division);Adolescent birth rate (per 1000 girls) (UN Population Division); Stunting (data.unicef.org); Laws/regulations that allow adolescents access to contraceptives (WHO MNCAH Key Informant Policy Questionnaire).
2015 | Country Overview
210 Achievements and Prospects
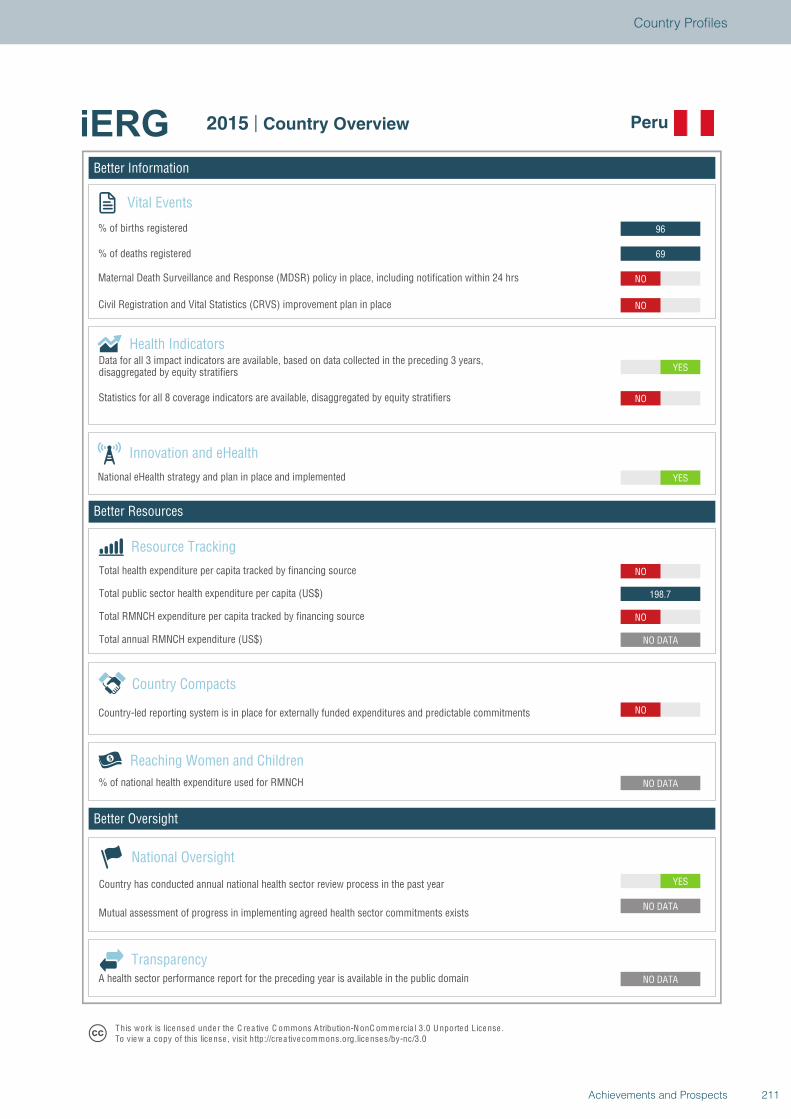
Better Information
Better Resources
Better Oversight
Peru
Vital Events
% of births registered
% of deaths registered
Innovation and eHealth
National eHealth strategy and plan in place and implemented
Health Indicators
Statistics for all 8 coverage indicators are available, disaggregated by equity stratifiers
Reaching Women and Children
Country Compacts
Country-led reporting system is in place for externally funded expenditures and predictable commitments
Resource Tracking
Total RMNCH expenditure per capita tracked by financing source
Total annual RMNCH expenditure (US$)
Total health expenditure per capita tracked by financing source
% of national health expenditure used for RMNCH
YES
NO DATA
NO DATA
NO DATA
NO
NO DATA
NO
198.7
NO
YES
YES
NO
NO
NO
69
96
National Oversight
Mutual assessment of progress in implementing agreed health sector commitments exists
Country has conducted annual national health sector review process in the past year
TransparencyA health sector performance report for the preceding year is available in the public domain
T his work is lice nse d unde r the C re a tive C ommons A tribution-N onC ommercia l 3.0 U nported License .To view a copy of this license , visit http://cre a tive commons.org.licenses/by-nc/3.0
2015 | Country Overview Peru
Total public sector health expenditure per capita (US$)
Maternal Death Surveillance and Response (MDSR) policy in place, including notification within 24 hrs
Civil Registration and Vital Statistics (CRVS) improvement plan in place
Data for all 3 impact indicators are available, based on data collected in the preceding 3 years,disaggregated by equity stratifiers
211Achievements and Prospects
Country Profiles
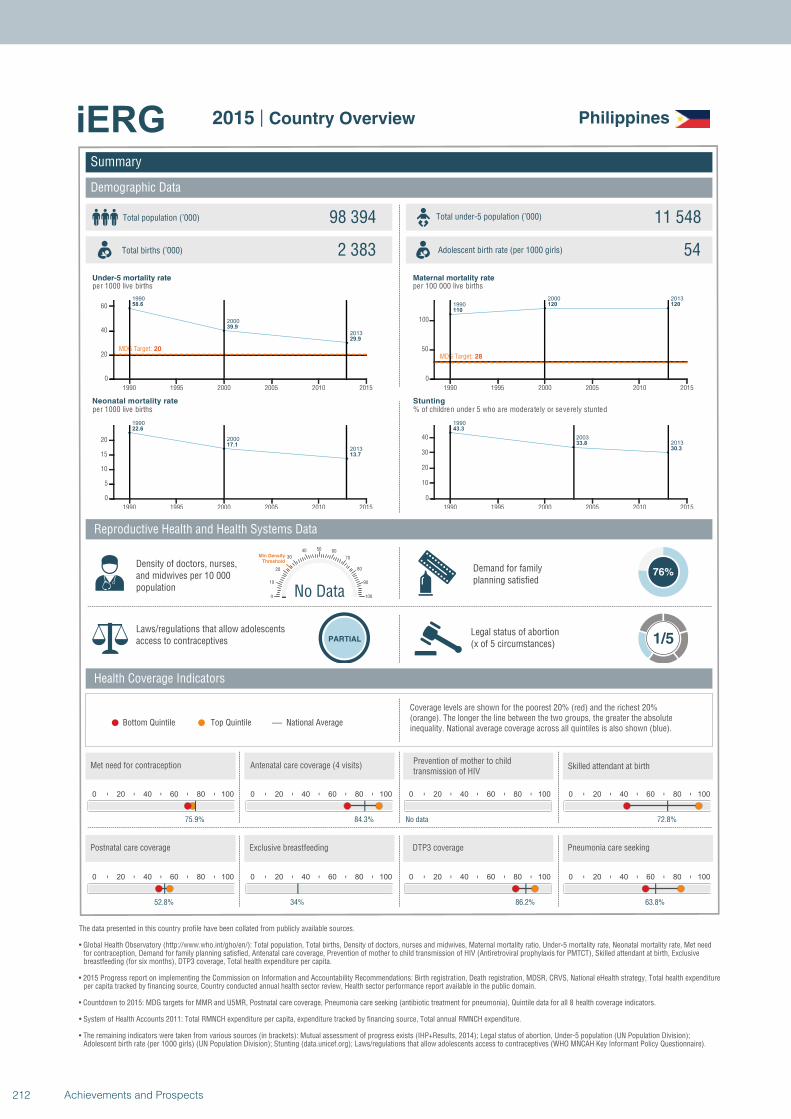
1990
2000
2013
58.6
39.9
29.9
MDG Target: 20
1990 1995 2000 2005 2010 2015
0
20
40
60
1990
2000
2013
22.6
17.1
13.7
1990 1995 2000 2005 2010 2015
0
5
10
15
20
1990
2000 2013
110
120 120
MDG Target: 28
1990 1995 2000 2005 2010 2015
0
50
100
1990
2003
2013
43.3
33.8
30.3
1990 1995 2000 2005 2010 2015
0
10
20
30
40
Summary
Demographic Data
Philippines
Total population (’000) Total under-5 population (’000)98 394 11 548
2 383 54
Reproductive Health and Health Systems Data
Health Coverage Indicators
Demand for familyplanning satisfied
76%
Laws/regulations that allow adolescents access to contraceptives PARTIAL
Legal status of abortion(x of 5 circumstances) 1/5
National AverageBottom Quintile Top Quintile
per 1000 live births per 100 000 live births
per 1000 live births % of children under 5 who are moderately or severely stunted
0 20 40 60 80 100
75.9%
0 20 40 60 80 100
84.3%
0 20 40 60 80 100
No data
No Data0
10
20
30
40 50 60
70
80
90
100
Min Density Threshold
0 20 40 60 80 100
72.8%
0 20 40 60 80 100
52.8%
0 20 40 60 80 100
34%
0 20 40 60 80 100
86.2%
0 20 40 60 80 100
63.8%
Total births (’000) Adolescent birth rate (per 1000 girls)
Coverage levels are shown for the poorest 20% (red) and the richest 20% (orange). The longer the line between the two groups, the greater the absolute inequality. National average coverage across all quintiles is also shown (blue).
Density of doctors, nurses, and midwives per 10 000 population
Postnatal care coverage Exclusive breastfeeding DTP3 coverage Pneumonia care seeking
Met need for contraception Antenatal care coverage (4 visits)Prevention of mother to child transmission of HIV
Skilled attendant at birth
Under-5 mortality rate Maternal mortality rate
Neonatal mortality rate Stunting
The data presented in this country profile have been collated from publicly available sources.
• Global Health Observatory (http://www.who.int/gho/en/): Total population, Total births, Density of doctors, nurses and midwives, Maternal mortality ratio, Under-5 mortality rate, Neonatal mortality rate, Met need for contraception, Demand for family planning satisfied, Antenatal care coverage, Prevention of mother to child transmission of HIV (Antiretroviral prophylaxis for PMTCT), Skilled attendant at birth, Exclusive breastfeeding (for six months), DTP3 coverage, Total health expenditure per capita.
• 2015 Progress report on implementing the Commission on Information and Accountability Recommendations: Birth registration, Death registration, MDSR, CRVS, National eHealth strategy, Total health expenditureper capita tracked by financing source, Country conducted annual health sector review, Health sector performance report available in the public domain.
• Countdown to 2015: MDG targets for MMR and U5MR, Postnatal care coverage, Pneumonia care seeking (antibiotic treatment for pneumonia), Quintile data for all 8 health coverage indicators.
• System of Health Accounts 2011: Total RMNCH expenditure per capita, expenditure tracked by financing source, Total annual RMNCH expenditure.
• The remaining indicators were taken from various sources (in brackets): Mutual assessment of progress exists (IHP+Results, 2014); Legal status of abortion, Under-5 population (UN Population Division);Adolescent birth rate (per 1000 girls) (UN Population Division); Stunting (data.unicef.org); Laws/regulations that allow adolescents access to contraceptives (WHO MNCAH Key Informant Policy Questionnaire).
2015 | Country Overview
212 Achievements and Prospects
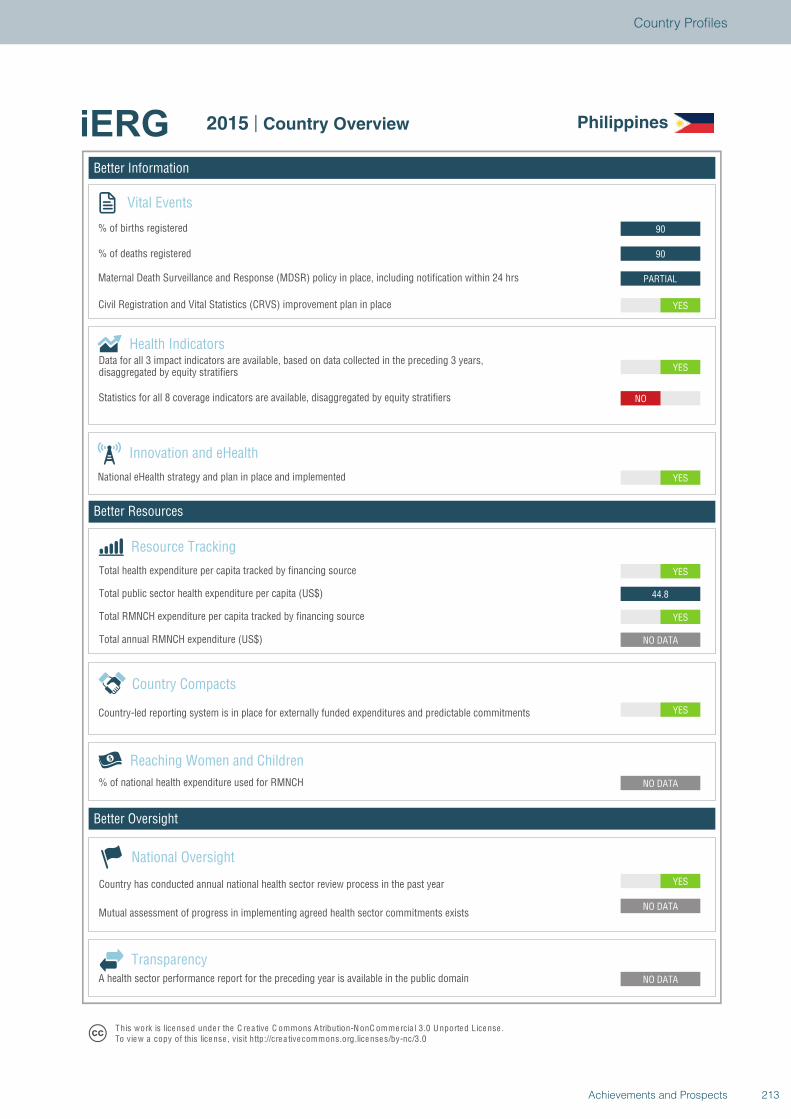
Better Information
Better Resources
Better Oversight
Philippines
Vital Events
% of births registered
% of deaths registered
Innovation and eHealth
National eHealth strategy and plan in place and implemented
Health Indicators
Statistics for all 8 coverage indicators are available, disaggregated by equity stratifiers
Reaching Women and Children
Country Compacts
Country-led reporting system is in place for externally funded expenditures and predictable commitments
Resource Tracking
Total RMNCH expenditure per capita tracked by financing source
Total annual RMNCH expenditure (US$)
Total health expenditure per capita tracked by financing source
% of national health expenditure used for RMNCH
YES
NO DATA
NO DATA
NO DATA
YES
NO DATA
YES
44.8
YES
YES
YES
NO
YES
PARTIAL
90
90
National Oversight
Mutual assessment of progress in implementing agreed health sector commitments exists
Country has conducted annual national health sector review process in the past year
TransparencyA health sector performance report for the preceding year is available in the public domain
T his work is lice nse d unde r the C re a tive C ommons A tribution-N onC ommercia l 3.0 U nported License .To view a copy of this license , visit http://cre a tive commons.org.licenses/by-nc/3.0
2015 | Country Overview Philippines
Total public sector health expenditure per capita (US$)
Maternal Death Surveillance and Response (MDSR) policy in place, including notification within 24 hrs
Civil Registration and Vital Statistics (CRVS) improvement plan in place
Data for all 3 impact indicators are available, based on data collected in the preceding 3 years,disaggregated by equity stratifiers
213Achievements and Prospects
Country Profiles
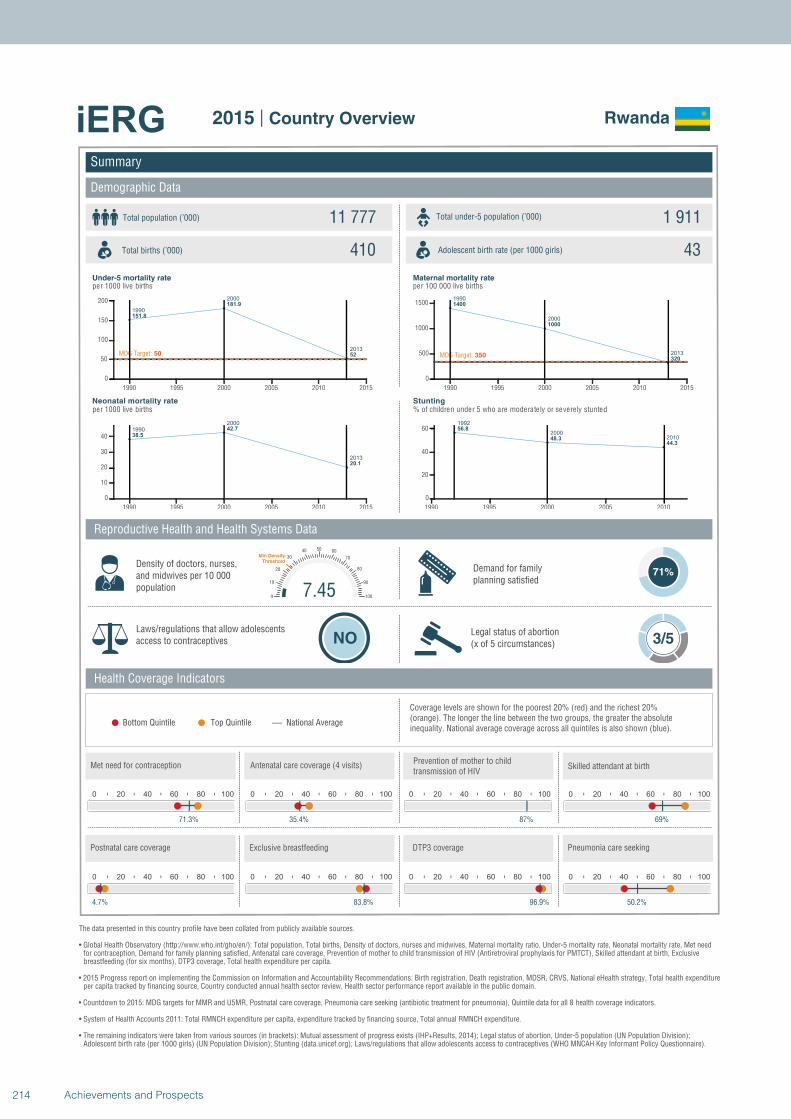
1990
2000
2013
151.8
181.9
52MDG Target: 50
1990 1995 2000 2005 2010 2015
0
50
100
150
200
1990
2000
2013
38.5
42.7
20.1
1990 1995 2000 2005 2010 2015
0
10
20
30
40
1990
2000
2013
1400
1000
320MDG Target: 350
1990 1995 2000 2005 2010 2015
0
500
1000
1500
1992
20002010
56.8
48.344.3
1990 1995 2000 2005 2010
0
20
40
60
Summary
Demographic Data
Rwanda
Total population (’000) Total under-5 population (’000)11 777 1 911
410 43
Reproductive Health and Health Systems Data
Health Coverage Indicators
Demand for familyplanning satisfied
71%
Laws/regulations that allow adolescents access to contraceptives NO
Legal status of abortion(x of 5 circumstances) 3/5
National AverageBottom Quintile Top Quintile
per 1000 live births per 100 000 live births
per 1000 live births % of children under 5 who are moderately or severely stunted
0 20 40 60 80 100
71.3%
0 20 40 60 80 100
35.4%
0 20 40 60 80 100
87%
7.450
10
20
30
40 50 60
70
80
90
100
Min Density Threshold
0 20 40 60 80 100
69%
0 20 40 60 80 100
4.7%
0 20 40 60 80 100
83.8%
0 20 40 60 80 100
96.9%
0 20 40 60 80 100
50.2%
Total births (’000) Adolescent birth rate (per 1000 girls)
Coverage levels are shown for the poorest 20% (red) and the richest 20% (orange). The longer the line between the two groups, the greater the absolute inequality. National average coverage across all quintiles is also shown (blue).
Density of doctors, nurses, and midwives per 10 000 population
Postnatal care coverage Exclusive breastfeeding DTP3 coverage Pneumonia care seeking
Met need for contraception Antenatal care coverage (4 visits)Prevention of mother to child transmission of HIV
Skilled attendant at birth
Under-5 mortality rate Maternal mortality rate
Neonatal mortality rate Stunting
The data presented in this country profile have been collated from publicly available sources.
• Global Health Observatory (http://www.who.int/gho/en/): Total population, Total births, Density of doctors, nurses and midwives, Maternal mortality ratio, Under-5 mortality rate, Neonatal mortality rate, Met need for contraception, Demand for family planning satisfied, Antenatal care coverage, Prevention of mother to child transmission of HIV (Antiretroviral prophylaxis for PMTCT), Skilled attendant at birth, Exclusive breastfeeding (for six months), DTP3 coverage, Total health expenditure per capita.
• 2015 Progress report on implementing the Commission on Information and Accountability Recommendations: Birth registration, Death registration, MDSR, CRVS, National eHealth strategy, Total health expenditureper capita tracked by financing source, Country conducted annual health sector review, Health sector performance report available in the public domain.
• Countdown to 2015: MDG targets for MMR and U5MR, Postnatal care coverage, Pneumonia care seeking (antibiotic treatment for pneumonia), Quintile data for all 8 health coverage indicators.
• System of Health Accounts 2011: Total RMNCH expenditure per capita, expenditure tracked by financing source, Total annual RMNCH expenditure.
• The remaining indicators were taken from various sources (in brackets): Mutual assessment of progress exists (IHP+Results, 2014); Legal status of abortion, Under-5 population (UN Population Division);Adolescent birth rate (per 1000 girls) (UN Population Division); Stunting (data.unicef.org); Laws/regulations that allow adolescents access to contraceptives (WHO MNCAH Key Informant Policy Questionnaire).
2015 | Country Overview
214 Achievements and Prospects
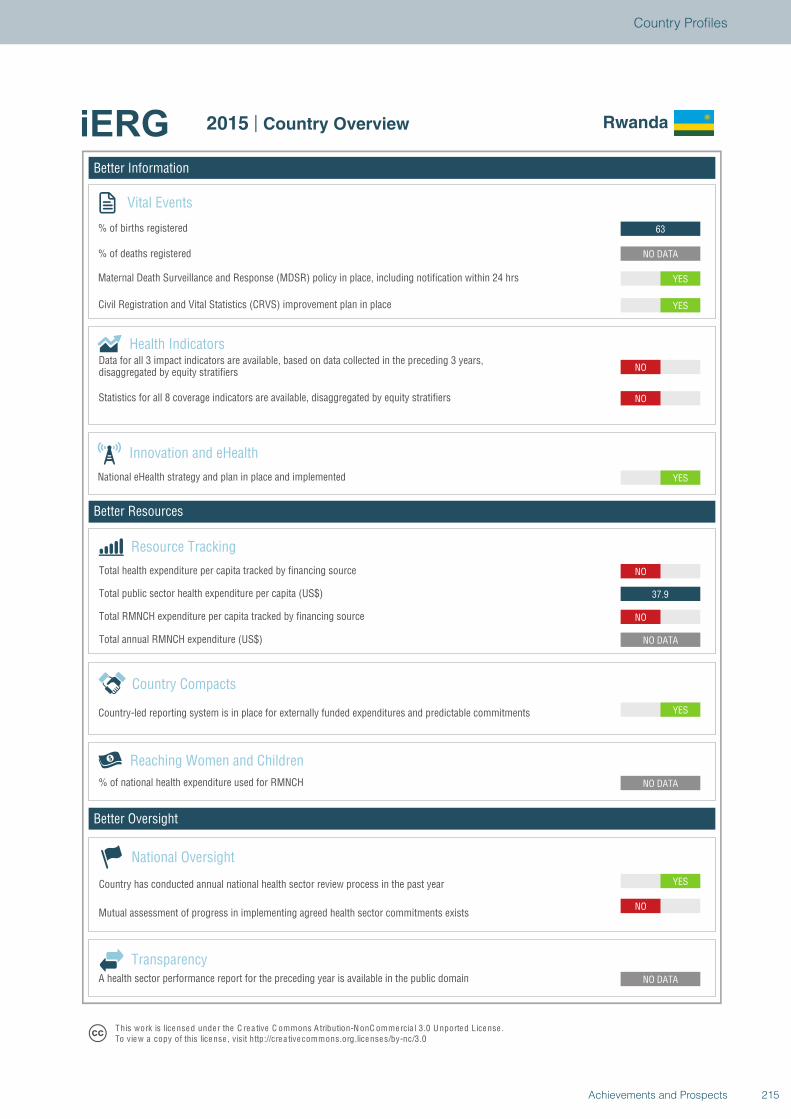
Better Information
Better Resources
Better Oversight
Rwanda
Vital Events
% of births registered
% of deaths registered
Innovation and eHealth
National eHealth strategy and plan in place and implemented
Health Indicators
Statistics for all 8 coverage indicators are available, disaggregated by equity stratifiers
Reaching Women and Children
Country Compacts
Country-led reporting system is in place for externally funded expenditures and predictable commitments
Resource Tracking
Total RMNCH expenditure per capita tracked by financing source
Total annual RMNCH expenditure (US$)
Total health expenditure per capita tracked by financing source
% of national health expenditure used for RMNCH
YES
NO
NO DATA
NO DATA
YES
NO DATA
NO
37.9
NO
YES
NO
NO
YES
YES
NO DATA
63
National Oversight
Mutual assessment of progress in implementing agreed health sector commitments exists
Country has conducted annual national health sector review process in the past year
TransparencyA health sector performance report for the preceding year is available in the public domain
T his work is lice nse d unde r the C re a tive C ommons A tribution-N onC ommercia l 3.0 U nported License .To view a copy of this license , visit http://cre a tive commons.org.licenses/by-nc/3.0
2015 | Country Overview Rwanda
Total public sector health expenditure per capita (US$)
Maternal Death Surveillance and Response (MDSR) policy in place, including notification within 24 hrs
Civil Registration and Vital Statistics (CRVS) improvement plan in place
Data for all 3 impact indicators are available, based on data collected in the preceding 3 years,disaggregated by equity stratifiers
215Achievements and Prospects
Country Profiles
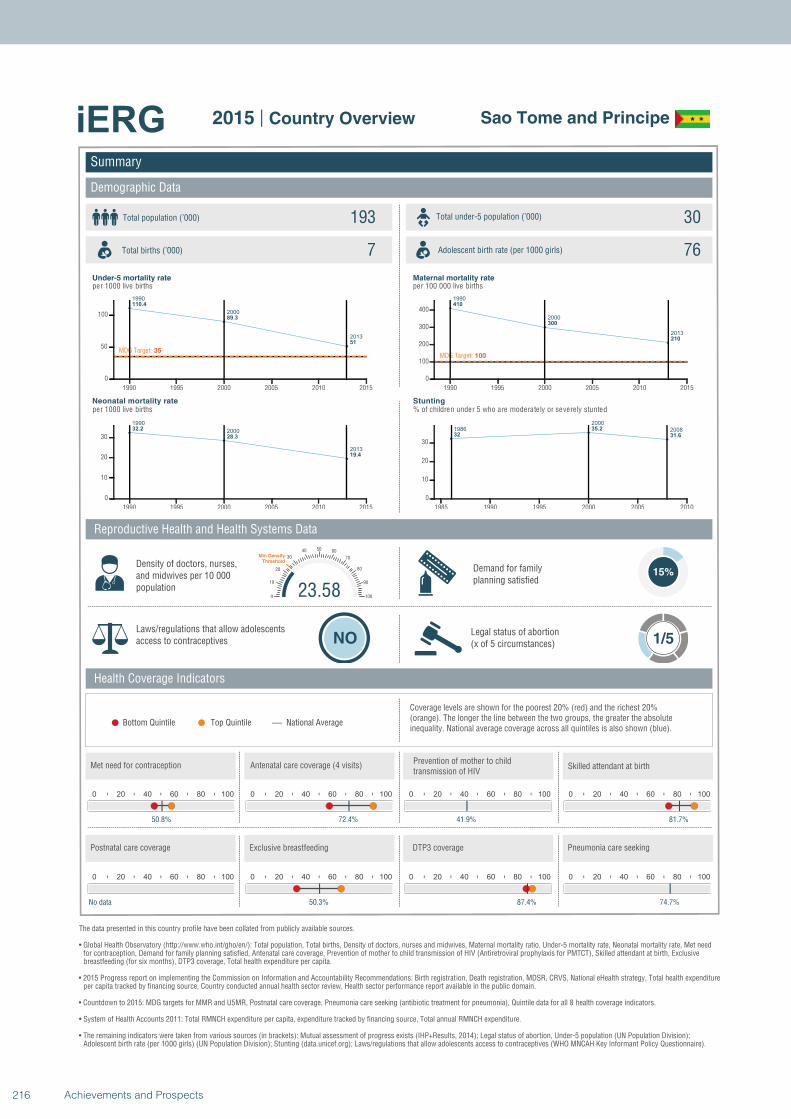
1990
2000
2013
110.4
89.3
51
MDG Target: 35
1990 1995 2000 2005 2010 2015
0
50
100
1990
2000
2013
32.2
28.3
19.4
1990 1995 2000 2005 2010 2015
0
10
20
30
1990
2000
2013
410
300
210
MDG Target: 100
1990 1995 2000 2005 2010 2015
0
100
200
300
400
1986
2000
200832
35.2
31.6
1985 1990 1995 2000 2005 2010
0
10
20
30
Summary
Demographic Data
Sao Tome and Principe
Total population (’000) Total under-5 population (’000)193 30
7 76
Reproductive Health and Health Systems Data
Health Coverage Indicators
Demand for familyplanning satisfied
15%
Laws/regulations that allow adolescents access to contraceptives NO
Legal status of abortion(x of 5 circumstances) 1/5
National AverageBottom Quintile Top Quintile
per 1000 live births per 100 000 live births
per 1000 live births % of children under 5 who are moderately or severely stunted
0 20 40 60 80 100
50.8%
0 20 40 60 80 100
72.4%
0 20 40 60 80 100
41.9%
23.580
10
20
30
40 50 60
70
80
90
100
Min Density Threshold
0 20 40 60 80 100
81.7%
0 20 40 60 80 100
No data
0 20 40 60 80 100
50.3%
0 20 40 60 80 100
87.4%
0 20 40 60 80 100
74.7%
Total births (’000) Adolescent birth rate (per 1000 girls)
Coverage levels are shown for the poorest 20% (red) and the richest 20% (orange). The longer the line between the two groups, the greater the absolute inequality. National average coverage across all quintiles is also shown (blue).
Density of doctors, nurses, and midwives per 10 000 population
Postnatal care coverage Exclusive breastfeeding DTP3 coverage Pneumonia care seeking
Met need for contraception Antenatal care coverage (4 visits)Prevention of mother to child transmission of HIV
Skilled attendant at birth
Under-5 mortality rate Maternal mortality rate
Neonatal mortality rate Stunting
The data presented in this country profile have been collated from publicly available sources.
• Global Health Observatory (http://www.who.int/gho/en/): Total population, Total births, Density of doctors, nurses and midwives, Maternal mortality ratio, Under-5 mortality rate, Neonatal mortality rate, Met need for contraception, Demand for family planning satisfied, Antenatal care coverage, Prevention of mother to child transmission of HIV (Antiretroviral prophylaxis for PMTCT), Skilled attendant at birth, Exclusive breastfeeding (for six months), DTP3 coverage, Total health expenditure per capita.
• 2015 Progress report on implementing the Commission on Information and Accountability Recommendations: Birth registration, Death registration, MDSR, CRVS, National eHealth strategy, Total health expenditureper capita tracked by financing source, Country conducted annual health sector review, Health sector performance report available in the public domain.
• Countdown to 2015: MDG targets for MMR and U5MR, Postnatal care coverage, Pneumonia care seeking (antibiotic treatment for pneumonia), Quintile data for all 8 health coverage indicators.
• System of Health Accounts 2011: Total RMNCH expenditure per capita, expenditure tracked by financing source, Total annual RMNCH expenditure.
• The remaining indicators were taken from various sources (in brackets): Mutual assessment of progress exists (IHP+Results, 2014); Legal status of abortion, Under-5 population (UN Population Division);Adolescent birth rate (per 1000 girls) (UN Population Division); Stunting (data.unicef.org); Laws/regulations that allow adolescents access to contraceptives (WHO MNCAH Key Informant Policy Questionnaire).
2015 | Country Overview
216 Achievements and Prospects
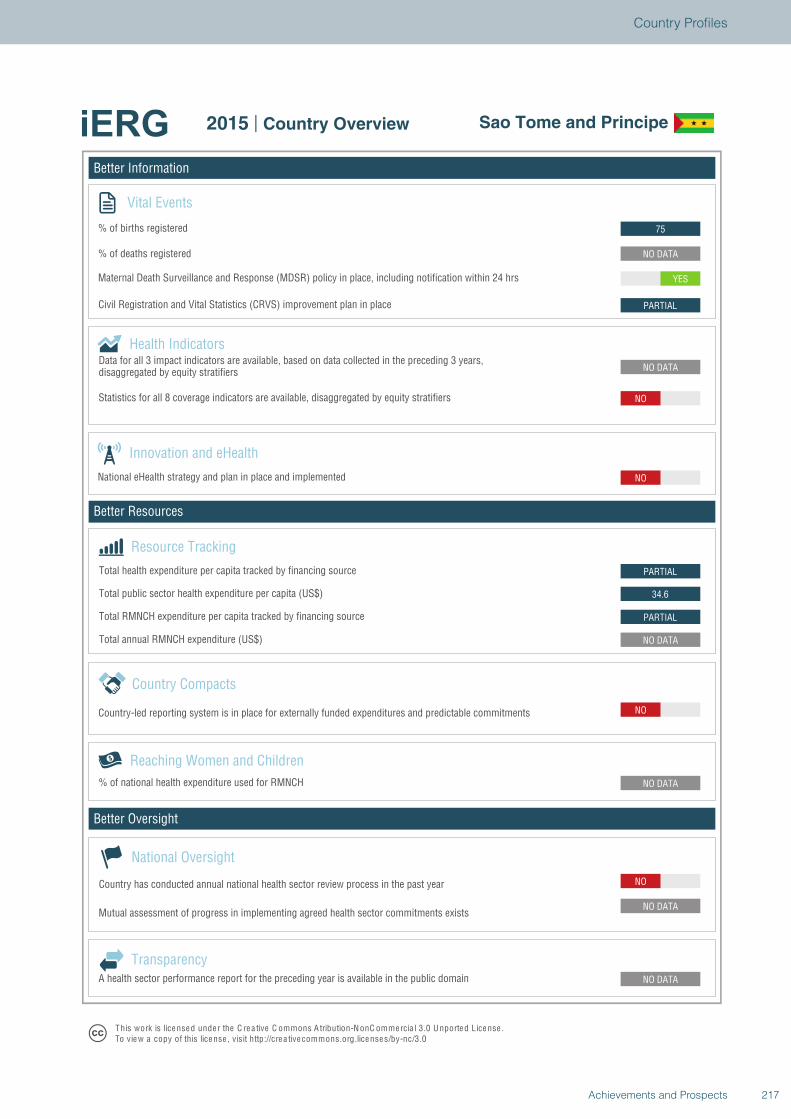
Better Information
Better Resources
Better Oversight
Sao Tome and Principe
Vital Events
% of births registered
% of deaths registered
Innovation and eHealth
National eHealth strategy and plan in place and implemented
Health Indicators
Statistics for all 8 coverage indicators are available, disaggregated by equity stratifiers
Reaching Women and Children
Country Compacts
Country-led reporting system is in place for externally funded expenditures and predictable commitments
Resource Tracking
Total RMNCH expenditure per capita tracked by financing source
Total annual RMNCH expenditure (US$)
Total health expenditure per capita tracked by financing source
% of national health expenditure used for RMNCH
NO
NO DATA
NO DATA
NO DATA
NO
NO DATA
PARTIAL
34.6
PARTIAL
NO
NO DATA
NO
PARTIAL
YES
NO DATA
75
National Oversight
Mutual assessment of progress in implementing agreed health sector commitments exists
Country has conducted annual national health sector review process in the past year
TransparencyA health sector performance report for the preceding year is available in the public domain
T his work is lice nse d unde r the C re a tive C ommons A tribution-N onC ommercia l 3.0 U nported License .To view a copy of this license , visit http://cre a tive commons.org.licenses/by-nc/3.0
2015 | Country Overview Sao Tome and Principe
Total public sector health expenditure per capita (US$)
Maternal Death Surveillance and Response (MDSR) policy in place, including notification within 24 hrs
Civil Registration and Vital Statistics (CRVS) improvement plan in place
Data for all 3 impact indicators are available, based on data collected in the preceding 3 years,disaggregated by equity stratifiers
217Achievements and Prospects
Country Profiles
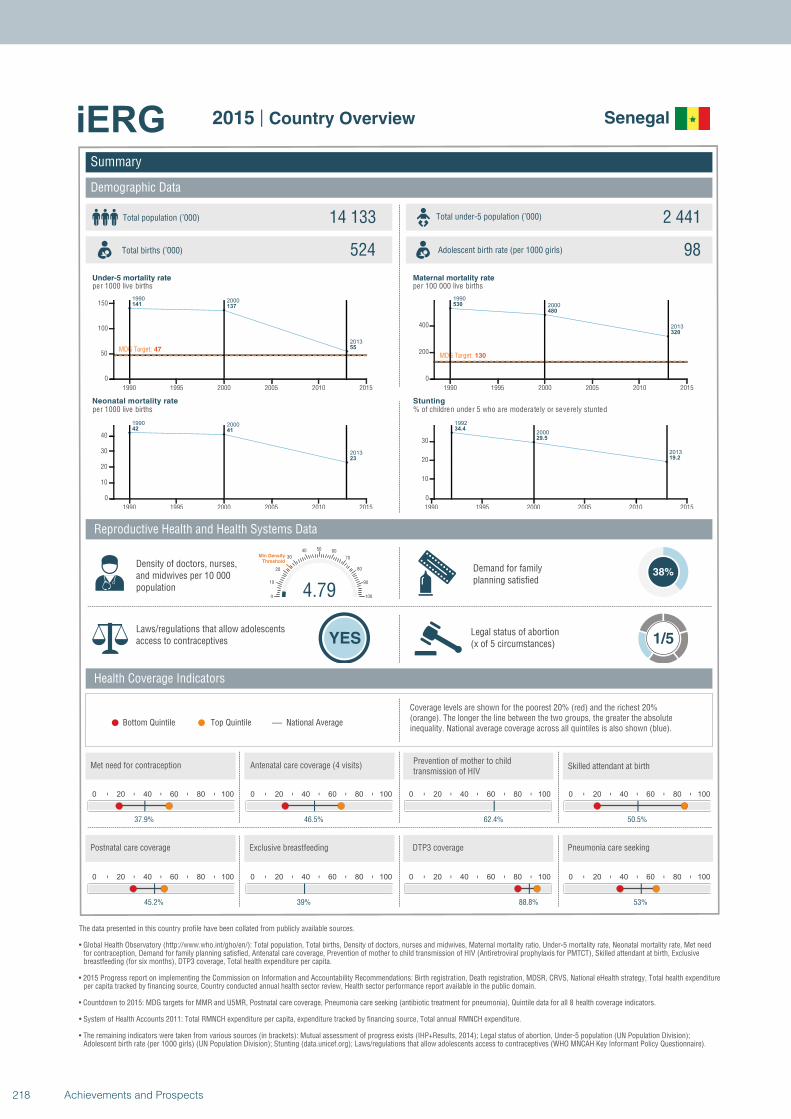
1990 2000
2013
141 137
55MDG Target: 47
1990 1995 2000 2005 2010 2015
0
50
100
150
1990 2000
2013
42 41
23
1990 1995 2000 2005 2010 2015
0
10
20
30
40
1990
2000
2013
530
480
320
MDG Target: 130
1990 1995 2000 2005 2010 2015
0
200
400
1992
2000
2013
34.4
29.5
19.2
1990 1995 2000 2005 2010 2015
0
10
20
30
Summary
Demographic Data
Senegal
Total population (’000) Total under-5 population (’000)14 133 2 441
524 98
Reproductive Health and Health Systems Data
Health Coverage Indicators
Demand for familyplanning satisfied
38%
Laws/regulations that allow adolescents access to contraceptives YES
Legal status of abortion(x of 5 circumstances) 1/5
National AverageBottom Quintile Top Quintile
per 1000 live births per 100 000 live births
per 1000 live births % of children under 5 who are moderately or severely stunted
0 20 40 60 80 100
37.9%
0 20 40 60 80 100
46.5%
0 20 40 60 80 100
62.4%
4.790
10
20
30
40 50 60
70
80
90
100
Min Density Threshold
0 20 40 60 80 100
50.5%
0 20 40 60 80 100
45.2%
0 20 40 60 80 100
39%
0 20 40 60 80 100
88.8%
0 20 40 60 80 100
53%
Total births (’000) Adolescent birth rate (per 1000 girls)
Coverage levels are shown for the poorest 20% (red) and the richest 20% (orange). The longer the line between the two groups, the greater the absolute inequality. National average coverage across all quintiles is also shown (blue).
Density of doctors, nurses, and midwives per 10 000 population
Postnatal care coverage Exclusive breastfeeding DTP3 coverage Pneumonia care seeking
Met need for contraception Antenatal care coverage (4 visits)Prevention of mother to child transmission of HIV
Skilled attendant at birth
Under-5 mortality rate Maternal mortality rate
Neonatal mortality rate Stunting
The data presented in this country profile have been collated from publicly available sources.
• Global Health Observatory (http://www.who.int/gho/en/): Total population, Total births, Density of doctors, nurses and midwives, Maternal mortality ratio, Under-5 mortality rate, Neonatal mortality rate, Met need for contraception, Demand for family planning satisfied, Antenatal care coverage, Prevention of mother to child transmission of HIV (Antiretroviral prophylaxis for PMTCT), Skilled attendant at birth, Exclusive breastfeeding (for six months), DTP3 coverage, Total health expenditure per capita.
• 2015 Progress report on implementing the Commission on Information and Accountability Recommendations: Birth registration, Death registration, MDSR, CRVS, National eHealth strategy, Total health expenditureper capita tracked by financing source, Country conducted annual health sector review, Health sector performance report available in the public domain.
• Countdown to 2015: MDG targets for MMR and U5MR, Postnatal care coverage, Pneumonia care seeking (antibiotic treatment for pneumonia), Quintile data for all 8 health coverage indicators.
• System of Health Accounts 2011: Total RMNCH expenditure per capita, expenditure tracked by financing source, Total annual RMNCH expenditure.
• The remaining indicators were taken from various sources (in brackets): Mutual assessment of progress exists (IHP+Results, 2014); Legal status of abortion, Under-5 population (UN Population Division);Adolescent birth rate (per 1000 girls) (UN Population Division); Stunting (data.unicef.org); Laws/regulations that allow adolescents access to contraceptives (WHO MNCAH Key Informant Policy Questionnaire).
2015 | Country Overview
218 Achievements and Prospects
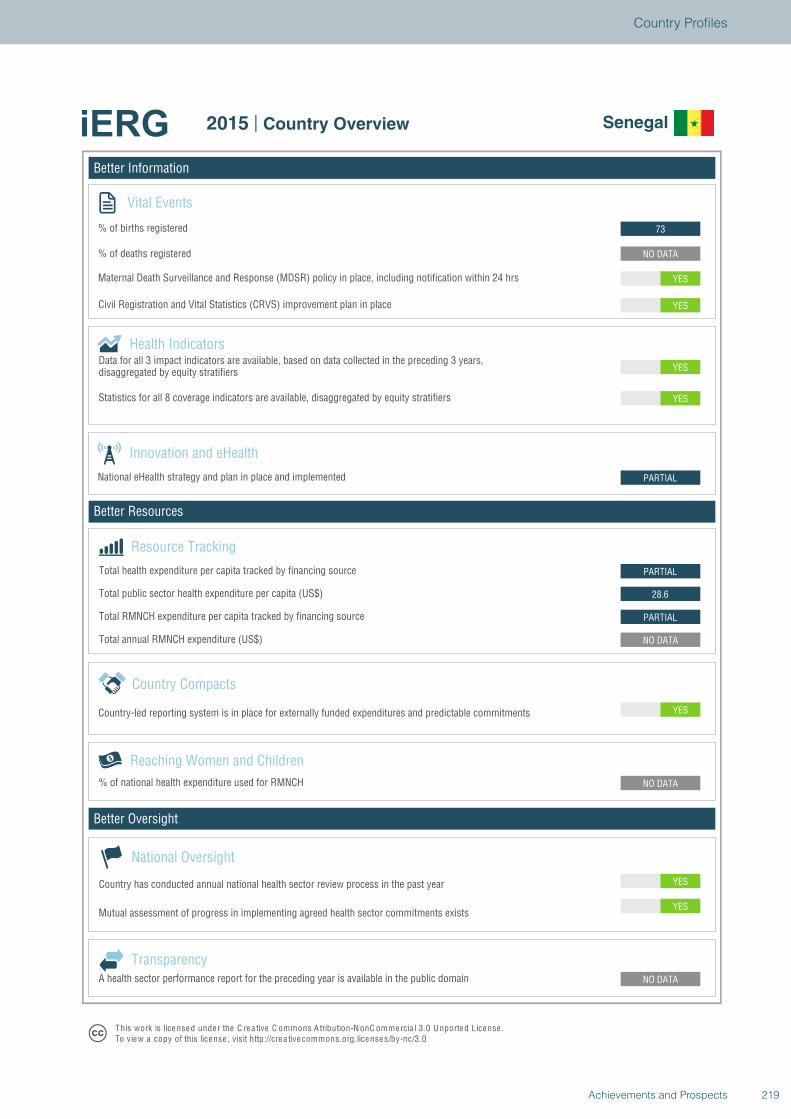
Better Information
Better Resources
Better Oversight
Senegal
Vital Events
% of births registered
% of deaths registered
Innovation and eHealth
National eHealth strategy and plan in place and implemented
Health Indicators
Statistics for all 8 coverage indicators are available, disaggregated by equity stratifiers
Reaching Women and Children
Country Compacts
Country-led reporting system is in place for externally funded expenditures and predictable commitments
Resource Tracking
Total RMNCH expenditure per capita tracked by financing source
Total annual RMNCH expenditure (US$)
Total health expenditure per capita tracked by financing source
% of national health expenditure used for RMNCH
YES
YES
NO DATA
NO DATA
YES
NO DATA
PARTIAL
28.6
PARTIAL
PARTIAL
YES
YES
YES
YES
NO DATA
73
National Oversight
Mutual assessment of progress in implementing agreed health sector commitments exists
Country has conducted annual national health sector review process in the past year
TransparencyA health sector performance report for the preceding year is available in the public domain
T his work is lice nse d unde r the C re a tive C ommons A tribution-N onC ommercia l 3.0 U nported License .To view a copy of this license , visit http://cre a tive commons.org.licenses/by-nc/3.0
2015 | Country Overview Senegal
Total public sector health expenditure per capita (US$)
Maternal Death Surveillance and Response (MDSR) policy in place, including notification within 24 hrs
Civil Registration and Vital Statistics (CRVS) improvement plan in place
Data for all 3 impact indicators are available, based on data collected in the preceding 3 years,disaggregated by equity stratifiers
219Achievements and Prospects
Country Profiles
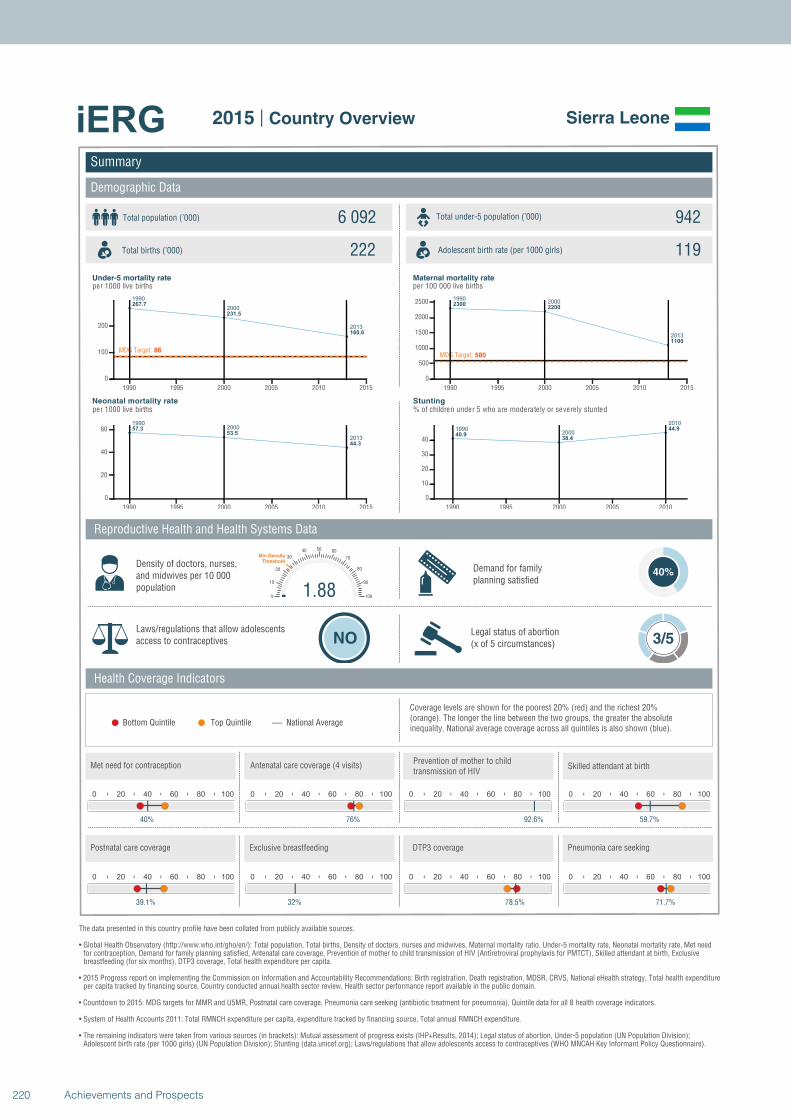
1990
2000
2013
267.7
231.5
160.6
MDG Target: 86
1990 1995 2000 2005 2010 2015
0
100
200
19902000
2013
57.353.5
44.3
1990 1995 2000 2005 2010 2015
0
20
40
60
19902000
2013
23002200
1100
MDG Target: 580
1990 1995 2000 2005 2010 2015
0
500
1000
1500
2000
2500
19902000
2010
40.938.4
44.9
1990 1995 2000 2005 2010
0
10
20
30
40
Summary
Demographic Data
Sierra Leone
Total population (’000) Total under-5 population (’000)6 092 942
222 119
Reproductive Health and Health Systems Data
Health Coverage Indicators
Demand for familyplanning satisfied
40%
Laws/regulations that allow adolescents access to contraceptives NO
Legal status of abortion(x of 5 circumstances) 3/5
National AverageBottom Quintile Top Quintile
per 1000 live births per 100 000 live births
per 1000 live births % of children under 5 who are moderately or severely stunted
0 20 40 60 80 100
40%
0 20 40 60 80 100
76%
0 20 40 60 80 100
92.6%
1.880
10
20
30
40 50 60
70
80
90
100
Min Density Threshold
0 20 40 60 80 100
59.7%
0 20 40 60 80 100
39.1%
0 20 40 60 80 100
32%
0 20 40 60 80 100
78.5%
0 20 40 60 80 100
71.7%
Total births (’000) Adolescent birth rate (per 1000 girls)
Coverage levels are shown for the poorest 20% (red) and the richest 20% (orange). The longer the line between the two groups, the greater the absolute inequality. National average coverage across all quintiles is also shown (blue).
Density of doctors, nurses, and midwives per 10 000 population
Postnatal care coverage Exclusive breastfeeding DTP3 coverage Pneumonia care seeking
Met need for contraception Antenatal care coverage (4 visits)Prevention of mother to child transmission of HIV
Skilled attendant at birth
Under-5 mortality rate Maternal mortality rate
Neonatal mortality rate Stunting
The data presented in this country profile have been collated from publicly available sources.
• Global Health Observatory (http://www.who.int/gho/en/): Total population, Total births, Density of doctors, nurses and midwives, Maternal mortality ratio, Under-5 mortality rate, Neonatal mortality rate, Met need for contraception, Demand for family planning satisfied, Antenatal care coverage, Prevention of mother to child transmission of HIV (Antiretroviral prophylaxis for PMTCT), Skilled attendant at birth, Exclusive breastfeeding (for six months), DTP3 coverage, Total health expenditure per capita.
• 2015 Progress report on implementing the Commission on Information and Accountability Recommendations: Birth registration, Death registration, MDSR, CRVS, National eHealth strategy, Total health expenditureper capita tracked by financing source, Country conducted annual health sector review, Health sector performance report available in the public domain.
• Countdown to 2015: MDG targets for MMR and U5MR, Postnatal care coverage, Pneumonia care seeking (antibiotic treatment for pneumonia), Quintile data for all 8 health coverage indicators.
• System of Health Accounts 2011: Total RMNCH expenditure per capita, expenditure tracked by financing source, Total annual RMNCH expenditure.
• The remaining indicators were taken from various sources (in brackets): Mutual assessment of progress exists (IHP+Results, 2014); Legal status of abortion, Under-5 population (UN Population Division);Adolescent birth rate (per 1000 girls) (UN Population Division); Stunting (data.unicef.org); Laws/regulations that allow adolescents access to contraceptives (WHO MNCAH Key Informant Policy Questionnaire).
2015 | Country Overview
220 Achievements and Prospects
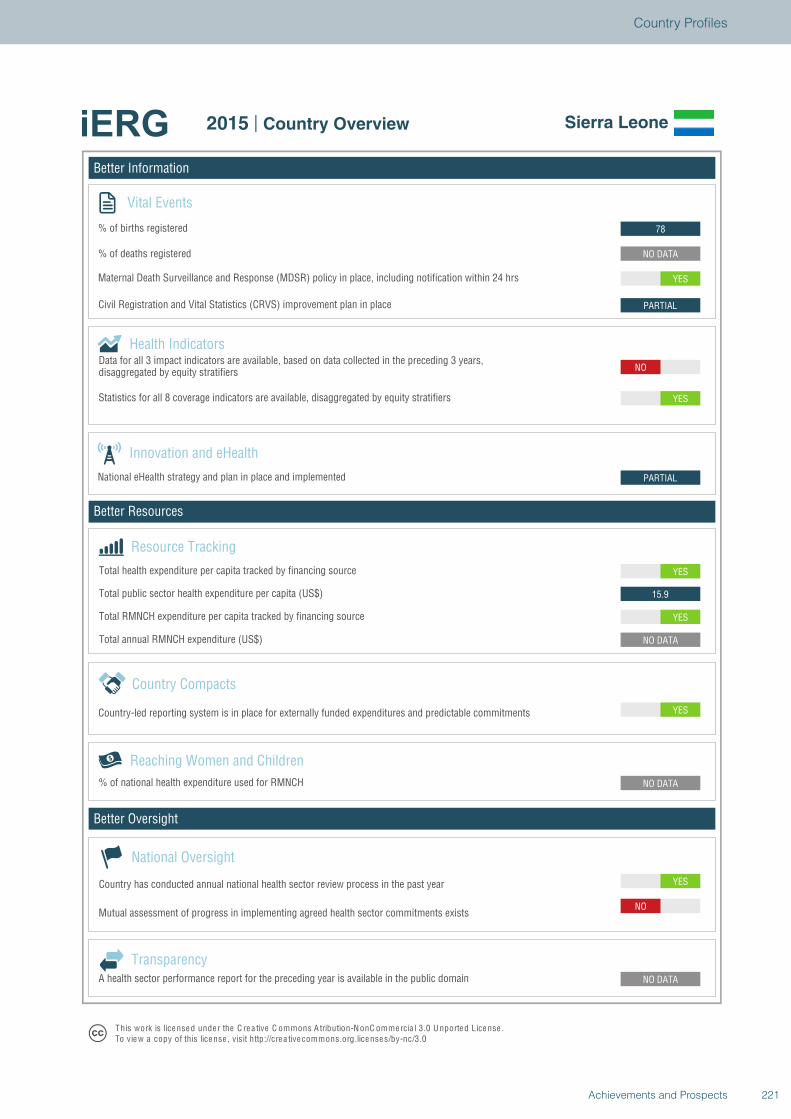
Better Information
Better Resources
Better Oversight
Sierra Leone
Vital Events
% of births registered
% of deaths registered
Innovation and eHealth
National eHealth strategy and plan in place and implemented
Health Indicators
Statistics for all 8 coverage indicators are available, disaggregated by equity stratifiers
Reaching Women and Children
Country Compacts
Country-led reporting system is in place for externally funded expenditures and predictable commitments
Resource Tracking
Total RMNCH expenditure per capita tracked by financing source
Total annual RMNCH expenditure (US$)
Total health expenditure per capita tracked by financing source
% of national health expenditure used for RMNCH
YES
NO
NO DATA
NO DATA
YES
NO DATA
YES
15.9
YES
PARTIAL
NO
YES
PARTIAL
YES
NO DATA
78
National Oversight
Mutual assessment of progress in implementing agreed health sector commitments exists
Country has conducted annual national health sector review process in the past year
TransparencyA health sector performance report for the preceding year is available in the public domain
T his work is lice nse d unde r the C re a tive C ommons A tribution-N onC ommercia l 3.0 U nported License .To view a copy of this license , visit http://cre a tive commons.org.licenses/by-nc/3.0
2015 | Country Overview Sierra Leone
Total public sector health expenditure per capita (US$)
Maternal Death Surveillance and Response (MDSR) policy in place, including notification within 24 hrs
Civil Registration and Vital Statistics (CRVS) improvement plan in place
Data for all 3 impact indicators are available, based on data collected in the preceding 3 years,disaggregated by equity stratifiers
221Achievements and Prospects
Country Profiles
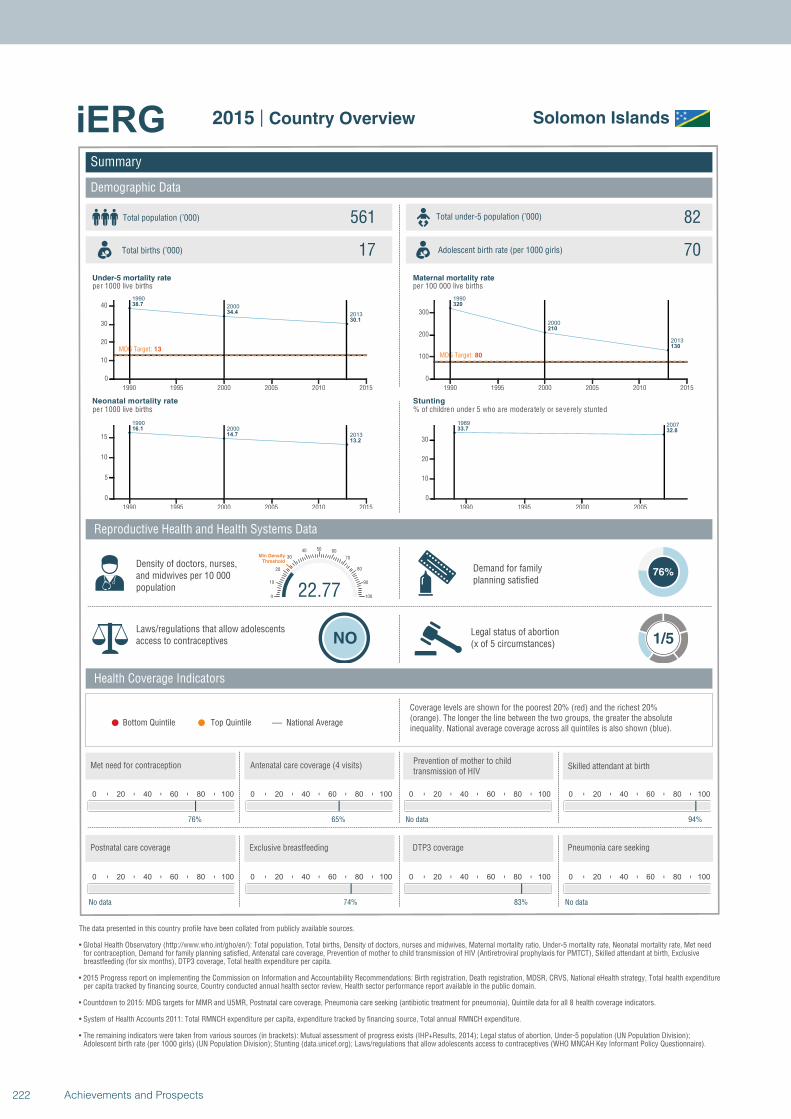
1990
2000
2013
38.7
34.4
30.1
MDG Target: 13
1990 1995 2000 2005 2010 2015
0
10
20
30
40
1990
2000
2013
16.1
14.7
13.2
1990 1995 2000 2005 2010 2015
0
5
10
15
1990
2000
2013
320
210
130
MDG Target: 80
1990 1995 2000 2005 2010 2015
0
100
200
300
1989 200733.7 32.8
1990 1995 2000 2005
0
10
20
30
Summary
Demographic Data
Solomon Islands
Total population (’000) Total under-5 population (’000)561 82
17 70
Reproductive Health and Health Systems Data
Health Coverage Indicators
Demand for familyplanning satisfied
76%
Laws/regulations that allow adolescents access to contraceptives NO
Legal status of abortion(x of 5 circumstances) 1/5
National AverageBottom Quintile Top Quintile
per 1000 live births per 100 000 live births
per 1000 live births % of children under 5 who are moderately or severely stunted
0 20 40 60 80 100
76%
0 20 40 60 80 100
65%
0 20 40 60 80 100
No data
22.770
10
20
30
40 50 60
70
80
90
100
Min Density Threshold
0 20 40 60 80 100
94%
0 20 40 60 80 100
No data
0 20 40 60 80 100
74%
0 20 40 60 80 100
83%
0 20 40 60 80 100
No data
Total births (’000) Adolescent birth rate (per 1000 girls)
Coverage levels are shown for the poorest 20% (red) and the richest 20% (orange). The longer the line between the two groups, the greater the absolute inequality. National average coverage across all quintiles is also shown (blue).
Density of doctors, nurses, and midwives per 10 000 population
Postnatal care coverage Exclusive breastfeeding DTP3 coverage Pneumonia care seeking
Met need for contraception Antenatal care coverage (4 visits)Prevention of mother to child transmission of HIV
Skilled attendant at birth
Under-5 mortality rate Maternal mortality rate
Neonatal mortality rate Stunting
The data presented in this country profile have been collated from publicly available sources.
• Global Health Observatory (http://www.who.int/gho/en/): Total population, Total births, Density of doctors, nurses and midwives, Maternal mortality ratio, Under-5 mortality rate, Neonatal mortality rate, Met need for contraception, Demand for family planning satisfied, Antenatal care coverage, Prevention of mother to child transmission of HIV (Antiretroviral prophylaxis for PMTCT), Skilled attendant at birth, Exclusive breastfeeding (for six months), DTP3 coverage, Total health expenditure per capita.
• 2015 Progress report on implementing the Commission on Information and Accountability Recommendations: Birth registration, Death registration, MDSR, CRVS, National eHealth strategy, Total health expenditureper capita tracked by financing source, Country conducted annual health sector review, Health sector performance report available in the public domain.
• Countdown to 2015: MDG targets for MMR and U5MR, Postnatal care coverage, Pneumonia care seeking (antibiotic treatment for pneumonia), Quintile data for all 8 health coverage indicators.
• System of Health Accounts 2011: Total RMNCH expenditure per capita, expenditure tracked by financing source, Total annual RMNCH expenditure.
• The remaining indicators were taken from various sources (in brackets): Mutual assessment of progress exists (IHP+Results, 2014); Legal status of abortion, Under-5 population (UN Population Division);Adolescent birth rate (per 1000 girls) (UN Population Division); Stunting (data.unicef.org); Laws/regulations that allow adolescents access to contraceptives (WHO MNCAH Key Informant Policy Questionnaire).
2015 | Country Overview
222 Achievements and Prospects
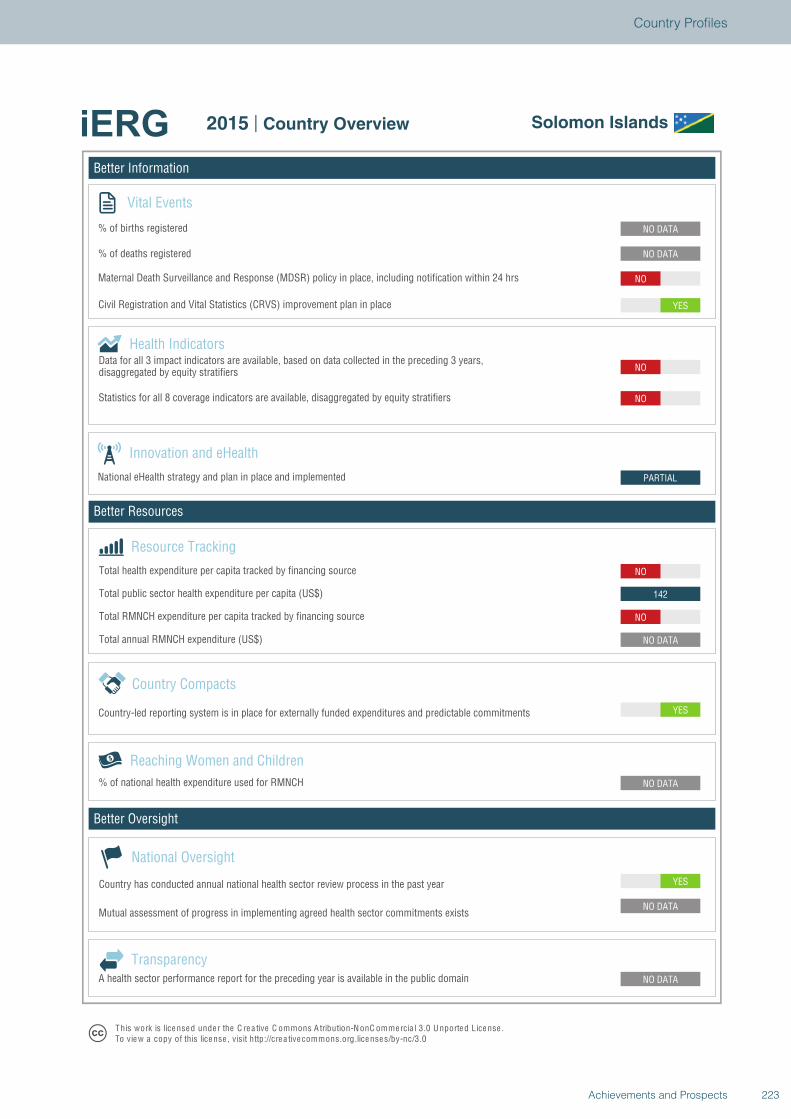
Better Information
Better Resources
Better Oversight
Solomon Islands
Vital Events
% of births registered
% of deaths registered
Innovation and eHealth
National eHealth strategy and plan in place and implemented
Health Indicators
Statistics for all 8 coverage indicators are available, disaggregated by equity stratifiers
Reaching Women and Children
Country Compacts
Country-led reporting system is in place for externally funded expenditures and predictable commitments
Resource Tracking
Total RMNCH expenditure per capita tracked by financing source
Total annual RMNCH expenditure (US$)
Total health expenditure per capita tracked by financing source
% of national health expenditure used for RMNCH
YES
NO DATA
NO DATA
NO DATA
YES
NO DATA
NO
142
NO
PARTIAL
NO
NO
YES
NO
NO DATA
NO DATA
National Oversight
Mutual assessment of progress in implementing agreed health sector commitments exists
Country has conducted annual national health sector review process in the past year
TransparencyA health sector performance report for the preceding year is available in the public domain
T his work is lice nse d unde r the C re a tive C ommons A tribution-N onC ommercia l 3.0 U nported License .To view a copy of this license , visit http://cre a tive commons.org.licenses/by-nc/3.0
2015 | Country Overview Solomon Islands
Total public sector health expenditure per capita (US$)
Maternal Death Surveillance and Response (MDSR) policy in place, including notification within 24 hrs
Civil Registration and Vital Statistics (CRVS) improvement plan in place
Data for all 3 impact indicators are available, based on data collected in the preceding 3 years,disaggregated by equity stratifiers
223Achievements and Prospects
Country Profiles
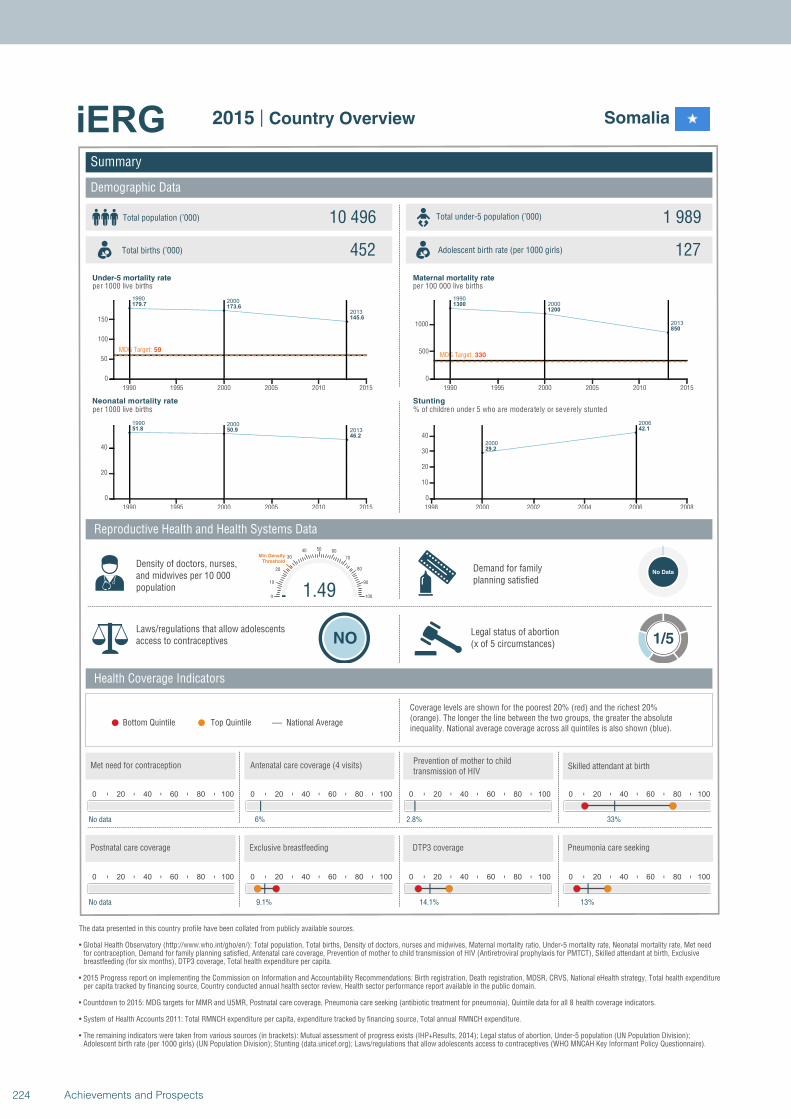
19902000
2013
179.7173.6
145.6
MDG Target: 59
1990 1995 2000 2005 2010 2015
0
50
100
150
1990 2000
201351.8 50.9
46.2
1990 1995 2000 2005 2010 2015
0
20
40
1990
2000
2013
1300
1200
850
MDG Target: 330
1990 1995 2000 2005 2010 2015
0
500
1000
2000
2006
29.2
42.1
1998 2000 2002 2004 2006 2008
0
10
20
30
40
Summary
Demographic Data
Somalia
Total population (’000) Total under-5 population (’000)10 496 1 989
452 127
Reproductive Health and Health Systems Data
Health Coverage Indicators
Demand for familyplanning satisfied
No Data
Laws/regulations that allow adolescents access to contraceptives NO
Legal status of abortion(x of 5 circumstances) 1/5
National AverageBottom Quintile Top Quintile
per 1000 live births per 100 000 live births
per 1000 live births % of children under 5 who are moderately or severely stunted
0 20 40 60 80 100
No data
0 20 40 60 80 100
6%
0 20 40 60 80 100
2.8%
1.490
10
20
30
40 50 60
70
80
90
100
Min Density Threshold
0 20 40 60 80 100
33%
0 20 40 60 80 100
No data
0 20 40 60 80 100
9.1%
0 20 40 60 80 100
14.1%
0 20 40 60 80 100
13%
Total births (’000) Adolescent birth rate (per 1000 girls)
Coverage levels are shown for the poorest 20% (red) and the richest 20% (orange). The longer the line between the two groups, the greater the absolute inequality. National average coverage across all quintiles is also shown (blue).
Density of doctors, nurses, and midwives per 10 000 population
Postnatal care coverage Exclusive breastfeeding DTP3 coverage Pneumonia care seeking
Met need for contraception Antenatal care coverage (4 visits)Prevention of mother to child transmission of HIV
Skilled attendant at birth
Under-5 mortality rate Maternal mortality rate
Neonatal mortality rate Stunting
The data presented in this country profile have been collated from publicly available sources.
• Global Health Observatory (http://www.who.int/gho/en/): Total population, Total births, Density of doctors, nurses and midwives, Maternal mortality ratio, Under-5 mortality rate, Neonatal mortality rate, Met need for contraception, Demand for family planning satisfied, Antenatal care coverage, Prevention of mother to child transmission of HIV (Antiretroviral prophylaxis for PMTCT), Skilled attendant at birth, Exclusive breastfeeding (for six months), DTP3 coverage, Total health expenditure per capita.
• 2015 Progress report on implementing the Commission on Information and Accountability Recommendations: Birth registration, Death registration, MDSR, CRVS, National eHealth strategy, Total health expenditureper capita tracked by financing source, Country conducted annual health sector review, Health sector performance report available in the public domain.
• Countdown to 2015: MDG targets for MMR and U5MR, Postnatal care coverage, Pneumonia care seeking (antibiotic treatment for pneumonia), Quintile data for all 8 health coverage indicators.
• System of Health Accounts 2011: Total RMNCH expenditure per capita, expenditure tracked by financing source, Total annual RMNCH expenditure.
• The remaining indicators were taken from various sources (in brackets): Mutual assessment of progress exists (IHP+Results, 2014); Legal status of abortion, Under-5 population (UN Population Division);Adolescent birth rate (per 1000 girls) (UN Population Division); Stunting (data.unicef.org); Laws/regulations that allow adolescents access to contraceptives (WHO MNCAH Key Informant Policy Questionnaire).
2015 | Country Overview
224 Achievements and Prospects

Better Information
Better Resources
Better Oversight
Somalia
Vital Events
% of births registered
% of deaths registered
Innovation and eHealth
National eHealth strategy and plan in place and implemented
Health Indicators
Statistics for all 8 coverage indicators are available, disaggregated by equity stratifiers
Reaching Women and Children
Country Compacts
Country-led reporting system is in place for externally funded expenditures and predictable commitments
Resource Tracking
Total RMNCH expenditure per capita tracked by financing source
Total annual RMNCH expenditure (US$)
Total health expenditure per capita tracked by financing source
% of national health expenditure used for RMNCH
NO
NO DATA
NO DATA
NO DATA
YES
NO DATA
NO
1.7
NO
NO
NO
NO
YES
NO
NO DATA
NO DATA
National Oversight
Mutual assessment of progress in implementing agreed health sector commitments exists
Country has conducted annual national health sector review process in the past year
TransparencyA health sector performance report for the preceding year is available in the public domain
T his work is lice nse d unde r the C re a tive C ommons A tribution-N onC ommercia l 3.0 U nported License .To view a copy of this license , visit http://cre a tive commons.org.licenses/by-nc/3.0
2015 | Country Overview Somalia
Total public sector health expenditure per capita (US$)
Maternal Death Surveillance and Response (MDSR) policy in place, including notification within 24 hrs
Civil Registration and Vital Statistics (CRVS) improvement plan in place
Data for all 3 impact indicators are available, based on data collected in the preceding 3 years,disaggregated by equity stratifiers
225Achievements and Prospects
Country Profiles
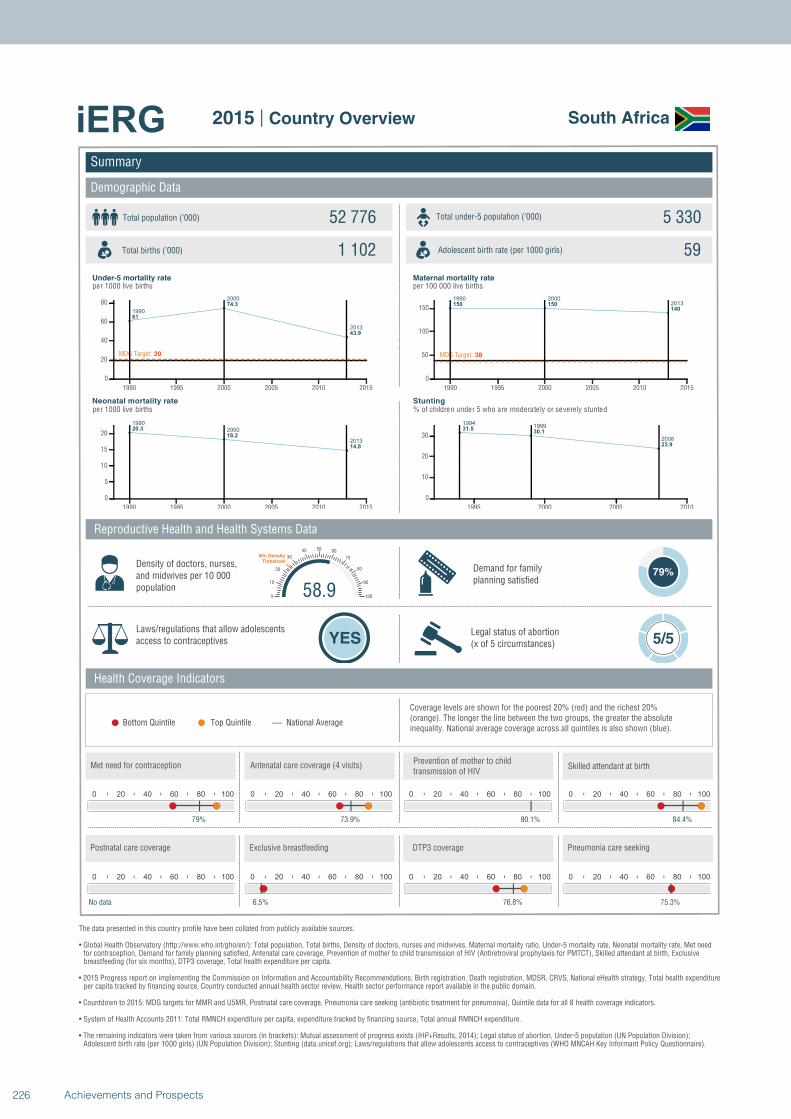
1990
2000
2013
61
74.3
43.9
MDG Target: 20
1990 1995 2000 2005 2010 2015
0
20
40
60
80
1990
2000
2013
20.3
18.2
14.8
1990 1995 2000 2005 2010 2015
0
5
10
15
20
1990 20002013150 150140
MDG Target: 38
1990 1995 2000 2005 2010 2015
0
50
100
150
19941999
2008
31.530.1
23.9
1995 2000 2005 2010
0
10
20
30
Summary
Demographic Data
South Africa
Total population (’000) Total under-5 population (’000)52 776 5 330
1 102 59
Reproductive Health and Health Systems Data
Health Coverage Indicators
Demand for familyplanning satisfied
79%
Laws/regulations that allow adolescents access to contraceptives YES
Legal status of abortion(x of 5 circumstances) 5/5
National AverageBottom Quintile Top Quintile
per 1000 live births per 100 000 live births
per 1000 live births % of children under 5 who are moderately or severely stunted
0 20 40 60 80 100
79%
0 20 40 60 80 100
73.9%
0 20 40 60 80 100
90.1%
58.90
10
20
30
40 50 60
70
80
90
100
Min Density Threshold
0 20 40 60 80 100
84.4%
0 20 40 60 80 100
No data
0 20 40 60 80 100
6.5%
0 20 40 60 80 100
76.8%
0 20 40 60 80 100
75.3%
Total births (’000) Adolescent birth rate (per 1000 girls)
Coverage levels are shown for the poorest 20% (red) and the richest 20% (orange). The longer the line between the two groups, the greater the absolute inequality. National average coverage across all quintiles is also shown (blue).
Density of doctors, nurses, and midwives per 10 000 population
Postnatal care coverage Exclusive breastfeeding DTP3 coverage Pneumonia care seeking
Met need for contraception Antenatal care coverage (4 visits)Prevention of mother to child transmission of HIV
Skilled attendant at birth
Under-5 mortality rate Maternal mortality rate
Neonatal mortality rate Stunting
The data presented in this country profile have been collated from publicly available sources.
• Global Health Observatory (http://www.who.int/gho/en/): Total population, Total births, Density of doctors, nurses and midwives, Maternal mortality ratio, Under-5 mortality rate, Neonatal mortality rate, Met need for contraception, Demand for family planning satisfied, Antenatal care coverage, Prevention of mother to child transmission of HIV (Antiretroviral prophylaxis for PMTCT), Skilled attendant at birth, Exclusive breastfeeding (for six months), DTP3 coverage, Total health expenditure per capita.
• 2015 Progress report on implementing the Commission on Information and Accountability Recommendations: Birth registration, Death registration, MDSR, CRVS, National eHealth strategy, Total health expenditureper capita tracked by financing source, Country conducted annual health sector review, Health sector performance report available in the public domain.
• Countdown to 2015: MDG targets for MMR and U5MR, Postnatal care coverage, Pneumonia care seeking (antibiotic treatment for pneumonia), Quintile data for all 8 health coverage indicators.
• System of Health Accounts 2011: Total RMNCH expenditure per capita, expenditure tracked by financing source, Total annual RMNCH expenditure.
• The remaining indicators were taken from various sources (in brackets): Mutual assessment of progress exists (IHP+Results, 2014); Legal status of abortion, Under-5 population (UN Population Division);Adolescent birth rate (per 1000 girls) (UN Population Division); Stunting (data.unicef.org); Laws/regulations that allow adolescents access to contraceptives (WHO MNCAH Key Informant Policy Questionnaire).
2015 | Country Overview
226 Achievements and Prospects
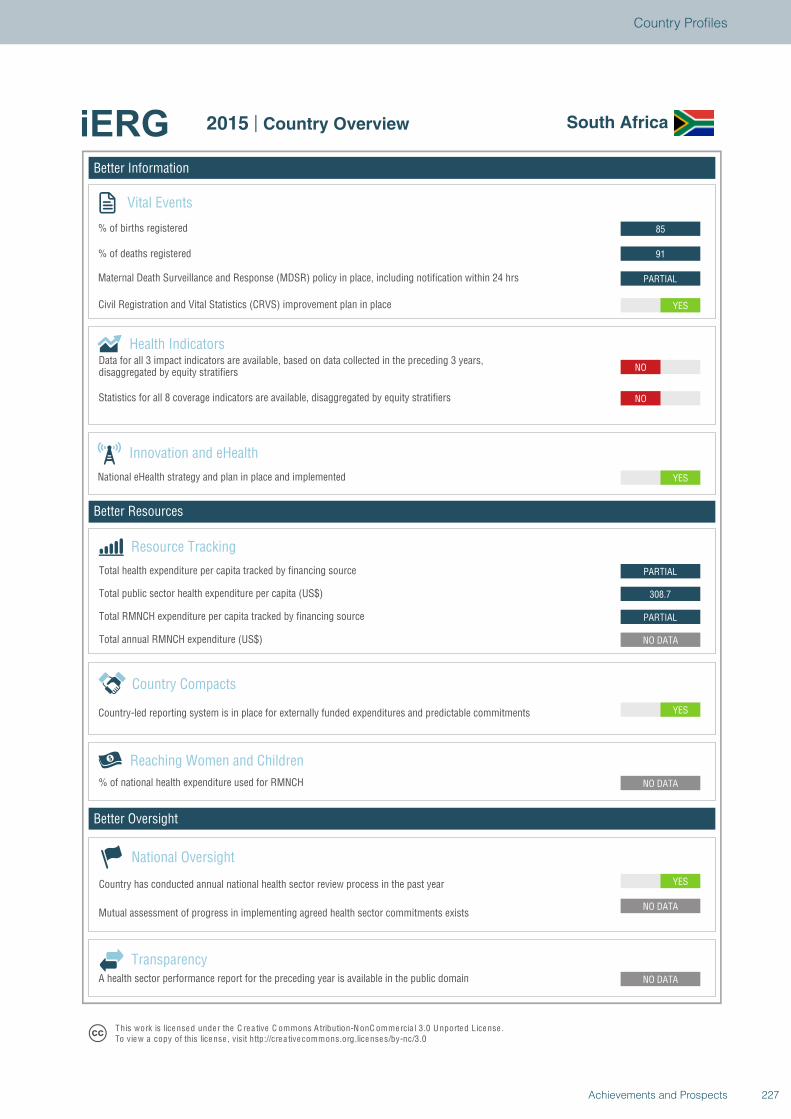
Better Information
Better Resources
Better Oversight
South Africa
Vital Events
% of births registered
% of deaths registered
Innovation and eHealth
National eHealth strategy and plan in place and implemented
Health Indicators
Statistics for all 8 coverage indicators are available, disaggregated by equity stratifiers
Reaching Women and Children
Country Compacts
Country-led reporting system is in place for externally funded expenditures and predictable commitments
Resource Tracking
Total RMNCH expenditure per capita tracked by financing source
Total annual RMNCH expenditure (US$)
Total health expenditure per capita tracked by financing source
% of national health expenditure used for RMNCH
YES
NO DATA
NO DATA
NO DATA
YES
NO DATA
PARTIAL
308.7
PARTIAL
YES
NO
NO
YES
PARTIAL
91
85
National Oversight
Mutual assessment of progress in implementing agreed health sector commitments exists
Country has conducted annual national health sector review process in the past year
TransparencyA health sector performance report for the preceding year is available in the public domain
T his work is lice nse d unde r the C re a tive C ommons A tribution-N onC ommercia l 3.0 U nported License .To view a copy of this license , visit http://cre a tive commons.org.licenses/by-nc/3.0
2015 | Country Overview South Africa
Total public sector health expenditure per capita (US$)
Maternal Death Surveillance and Response (MDSR) policy in place, including notification within 24 hrs
Civil Registration and Vital Statistics (CRVS) improvement plan in place
Data for all 3 impact indicators are available, based on data collected in the preceding 3 years,disaggregated by equity stratifiers
227Achievements and Prospects
Country Profiles
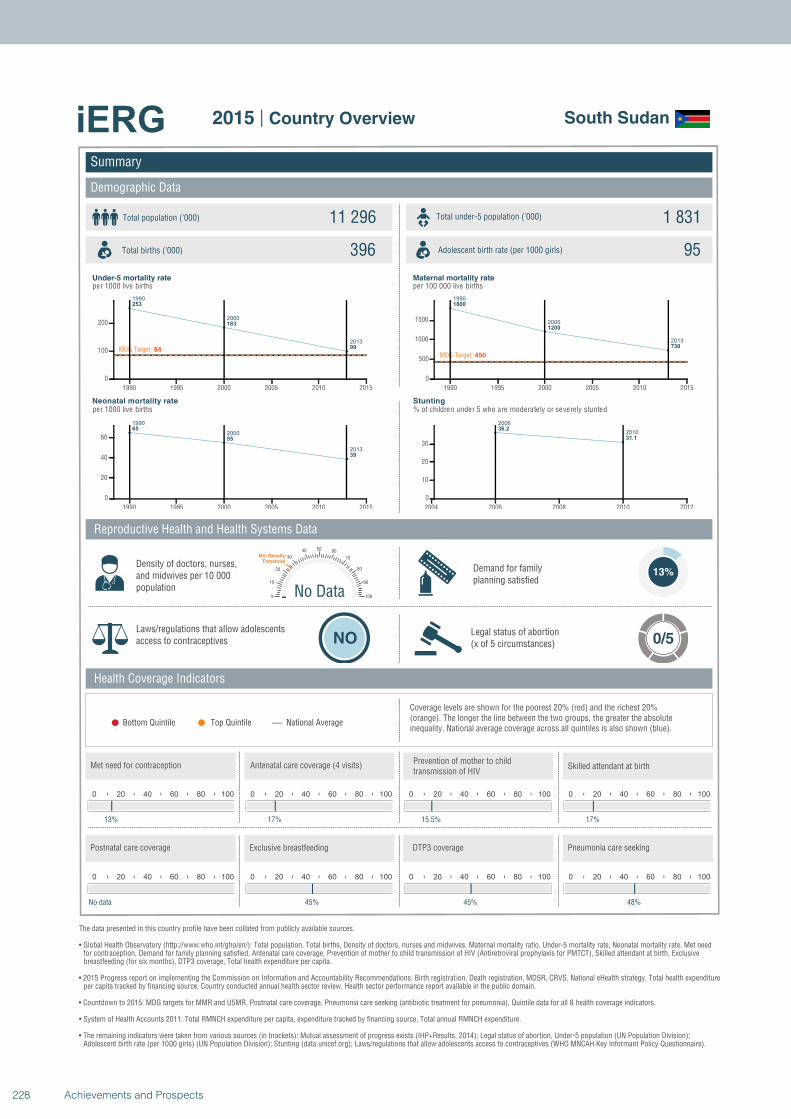
1990
2000
2013
253
183
99MDG Target: 84
1990 1995 2000 2005 2010 2015
0
100
200
1990
2000
2013
65
55
39
1990 1995 2000 2005 2010 2015
0
20
40
60
1990
2000
2013
1800
1200
730
MDG Target: 450
1990 1995 2000 2005 2010 2015
0
500
1000
1500
2006
201036.2
31.1
2004 2006 2008 2010 2012
0
10
20
30
Summary
Demographic Data
South Sudan
Total population (’000) Total under-5 population (’000)11 296 1 831
396 95
Reproductive Health and Health Systems Data
Health Coverage Indicators
Demand for familyplanning satisfied
13%
Laws/regulations that allow adolescents access to contraceptives NO
Legal status of abortion(x of 5 circumstances) 0/5
National AverageBottom Quintile Top Quintile
per 1000 live births per 100 000 live births
per 1000 live births % of children under 5 who are moderately or severely stunted
0 20 40 60 80 100
13%
0 20 40 60 80 100
17%
0 20 40 60 80 100
15.5%
No Data0
10
20
30
40 50 60
70
80
90
100
Min Density Threshold
0 20 40 60 80 100
17%
0 20 40 60 80 100
No data
0 20 40 60 80 100
45%
0 20 40 60 80 100
45%
0 20 40 60 80 100
48%
Total births (’000) Adolescent birth rate (per 1000 girls)
Coverage levels are shown for the poorest 20% (red) and the richest 20% (orange). The longer the line between the two groups, the greater the absolute inequality. National average coverage across all quintiles is also shown (blue).
Density of doctors, nurses, and midwives per 10 000 population
Postnatal care coverage Exclusive breastfeeding DTP3 coverage Pneumonia care seeking
Met need for contraception Antenatal care coverage (4 visits)Prevention of mother to child transmission of HIV
Skilled attendant at birth
Under-5 mortality rate Maternal mortality rate
Neonatal mortality rate Stunting
The data presented in this country profile have been collated from publicly available sources.
• Global Health Observatory (http://www.who.int/gho/en/): Total population, Total births, Density of doctors, nurses and midwives, Maternal mortality ratio, Under-5 mortality rate, Neonatal mortality rate, Met need for contraception, Demand for family planning satisfied, Antenatal care coverage, Prevention of mother to child transmission of HIV (Antiretroviral prophylaxis for PMTCT), Skilled attendant at birth, Exclusive breastfeeding (for six months), DTP3 coverage, Total health expenditure per capita.
• 2015 Progress report on implementing the Commission on Information and Accountability Recommendations: Birth registration, Death registration, MDSR, CRVS, National eHealth strategy, Total health expenditureper capita tracked by financing source, Country conducted annual health sector review, Health sector performance report available in the public domain.
• Countdown to 2015: MDG targets for MMR and U5MR, Postnatal care coverage, Pneumonia care seeking (antibiotic treatment for pneumonia), Quintile data for all 8 health coverage indicators.
• System of Health Accounts 2011: Total RMNCH expenditure per capita, expenditure tracked by financing source, Total annual RMNCH expenditure.
• The remaining indicators were taken from various sources (in brackets): Mutual assessment of progress exists (IHP+Results, 2014); Legal status of abortion, Under-5 population (UN Population Division);Adolescent birth rate (per 1000 girls) (UN Population Division); Stunting (data.unicef.org); Laws/regulations that allow adolescents access to contraceptives (WHO MNCAH Key Informant Policy Questionnaire).
2015 | Country Overview
228 Achievements and Prospects
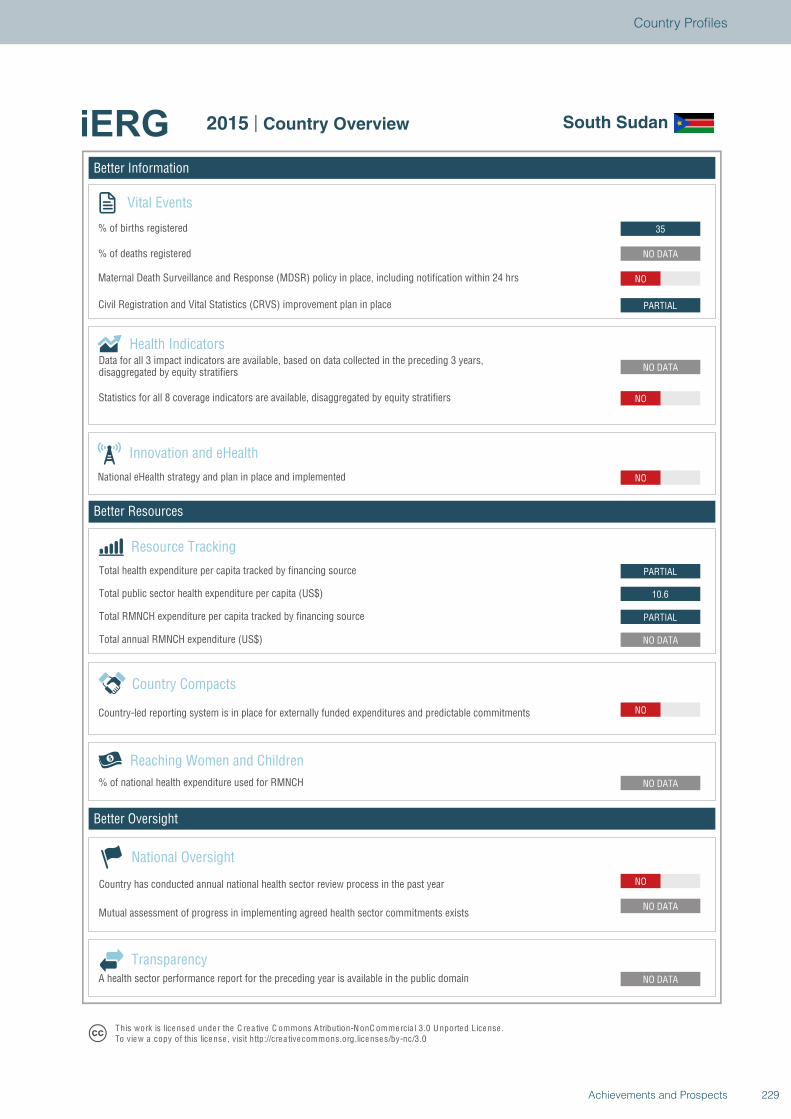
Better Information
Better Resources
Better Oversight
South Sudan
Vital Events
% of births registered
% of deaths registered
Innovation and eHealth
National eHealth strategy and plan in place and implemented
Health Indicators
Statistics for all 8 coverage indicators are available, disaggregated by equity stratifiers
Reaching Women and Children
Country Compacts
Country-led reporting system is in place for externally funded expenditures and predictable commitments
Resource Tracking
Total RMNCH expenditure per capita tracked by financing source
Total annual RMNCH expenditure (US$)
Total health expenditure per capita tracked by financing source
% of national health expenditure used for RMNCH
NO
NO DATA
NO DATA
NO DATA
NO
NO DATA
PARTIAL
10.6
PARTIAL
NO
NO DATA
NO
PARTIAL
NO
NO DATA
35
National Oversight
Mutual assessment of progress in implementing agreed health sector commitments exists
Country has conducted annual national health sector review process in the past year
TransparencyA health sector performance report for the preceding year is available in the public domain
T his work is lice nse d unde r the C re a tive C ommons A tribution-N onC ommercia l 3.0 U nported License .To view a copy of this license , visit http://cre a tive commons.org.licenses/by-nc/3.0
2015 | Country Overview South Sudan
Total public sector health expenditure per capita (US$)
Maternal Death Surveillance and Response (MDSR) policy in place, including notification within 24 hrs
Civil Registration and Vital Statistics (CRVS) improvement plan in place
Data for all 3 impact indicators are available, based on data collected in the preceding 3 years,disaggregated by equity stratifiers
229Achievements and Prospects
Country Profiles
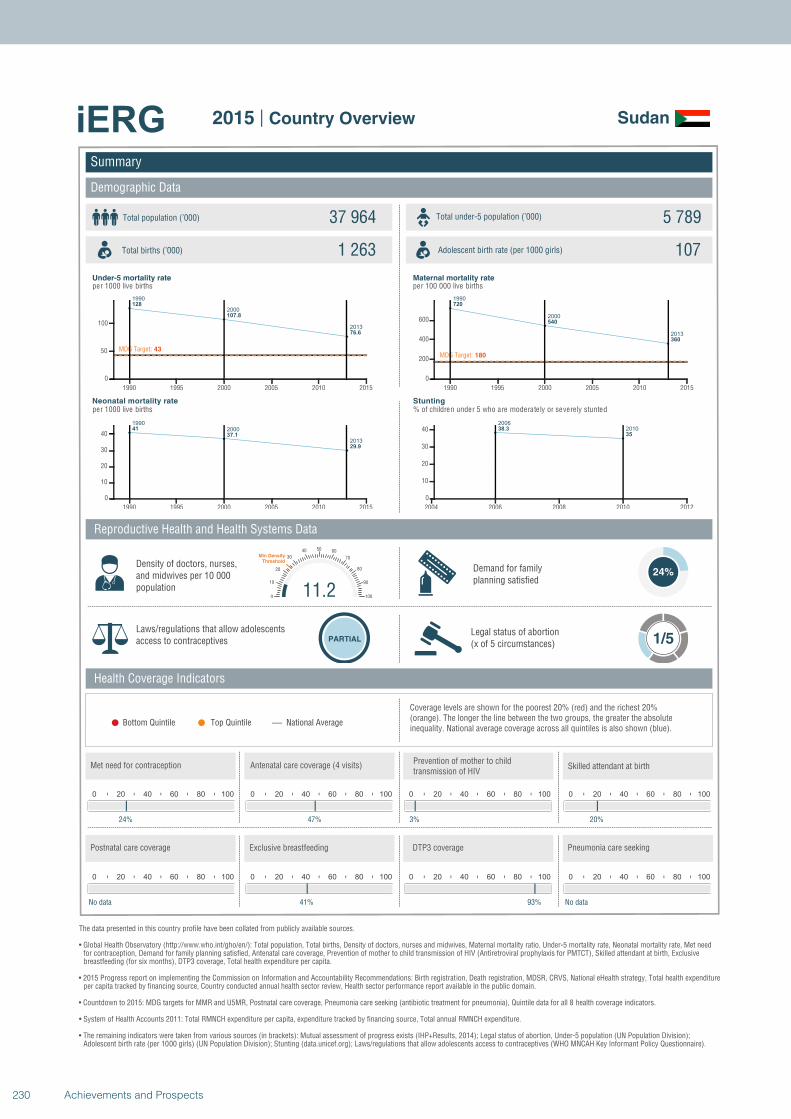
1990
2000
2013
128
107.8
76.6
MDG Target: 43
1990 1995 2000 2005 2010 2015
0
50
100
1990
2000
2013
41
37.1
29.9
1990 1995 2000 2005 2010 2015
0
10
20
30
40
1990
2000
2013
720
540
360
MDG Target: 180
1990 1995 2000 2005 2010 2015
0
200
400
600
2006
201038.3
35
2004 2006 2008 2010 2012
0
10
20
30
40
Summary
Demographic Data
Sudan
Total population (’000) Total under-5 population (’000)37 964 5 789
1 263 107
Reproductive Health and Health Systems Data
Health Coverage Indicators
Demand for familyplanning satisfied
24%
Laws/regulations that allow adolescents access to contraceptives PARTIAL
Legal status of abortion(x of 5 circumstances) 1/5
National AverageBottom Quintile Top Quintile
per 1000 live births per 100 000 live births
per 1000 live births % of children under 5 who are moderately or severely stunted
0 20 40 60 80 100
24%
0 20 40 60 80 100
47%
0 20 40 60 80 100
3%
11.20
10
20
30
40 50 60
70
80
90
100
Min Density Threshold
0 20 40 60 80 100
20%
0 20 40 60 80 100
No data
0 20 40 60 80 100
41%
0 20 40 60 80 100
93%
0 20 40 60 80 100
No data
Total births (’000) Adolescent birth rate (per 1000 girls)
Coverage levels are shown for the poorest 20% (red) and the richest 20% (orange). The longer the line between the two groups, the greater the absolute inequality. National average coverage across all quintiles is also shown (blue).
Density of doctors, nurses, and midwives per 10 000 population
Postnatal care coverage Exclusive breastfeeding DTP3 coverage Pneumonia care seeking
Met need for contraception Antenatal care coverage (4 visits)Prevention of mother to child transmission of HIV
Skilled attendant at birth
Under-5 mortality rate Maternal mortality rate
Neonatal mortality rate Stunting
The data presented in this country profile have been collated from publicly available sources.
• Global Health Observatory (http://www.who.int/gho/en/): Total population, Total births, Density of doctors, nurses and midwives, Maternal mortality ratio, Under-5 mortality rate, Neonatal mortality rate, Met need for contraception, Demand for family planning satisfied, Antenatal care coverage, Prevention of mother to child transmission of HIV (Antiretroviral prophylaxis for PMTCT), Skilled attendant at birth, Exclusive breastfeeding (for six months), DTP3 coverage, Total health expenditure per capita.
• 2015 Progress report on implementing the Commission on Information and Accountability Recommendations: Birth registration, Death registration, MDSR, CRVS, National eHealth strategy, Total health expenditureper capita tracked by financing source, Country conducted annual health sector review, Health sector performance report available in the public domain.
• Countdown to 2015: MDG targets for MMR and U5MR, Postnatal care coverage, Pneumonia care seeking (antibiotic treatment for pneumonia), Quintile data for all 8 health coverage indicators.
• System of Health Accounts 2011: Total RMNCH expenditure per capita, expenditure tracked by financing source, Total annual RMNCH expenditure.
• The remaining indicators were taken from various sources (in brackets): Mutual assessment of progress exists (IHP+Results, 2014); Legal status of abortion, Under-5 population (UN Population Division);Adolescent birth rate (per 1000 girls) (UN Population Division); Stunting (data.unicef.org); Laws/regulations that allow adolescents access to contraceptives (WHO MNCAH Key Informant Policy Questionnaire).
2015 | Country Overview
230 Achievements and Prospects
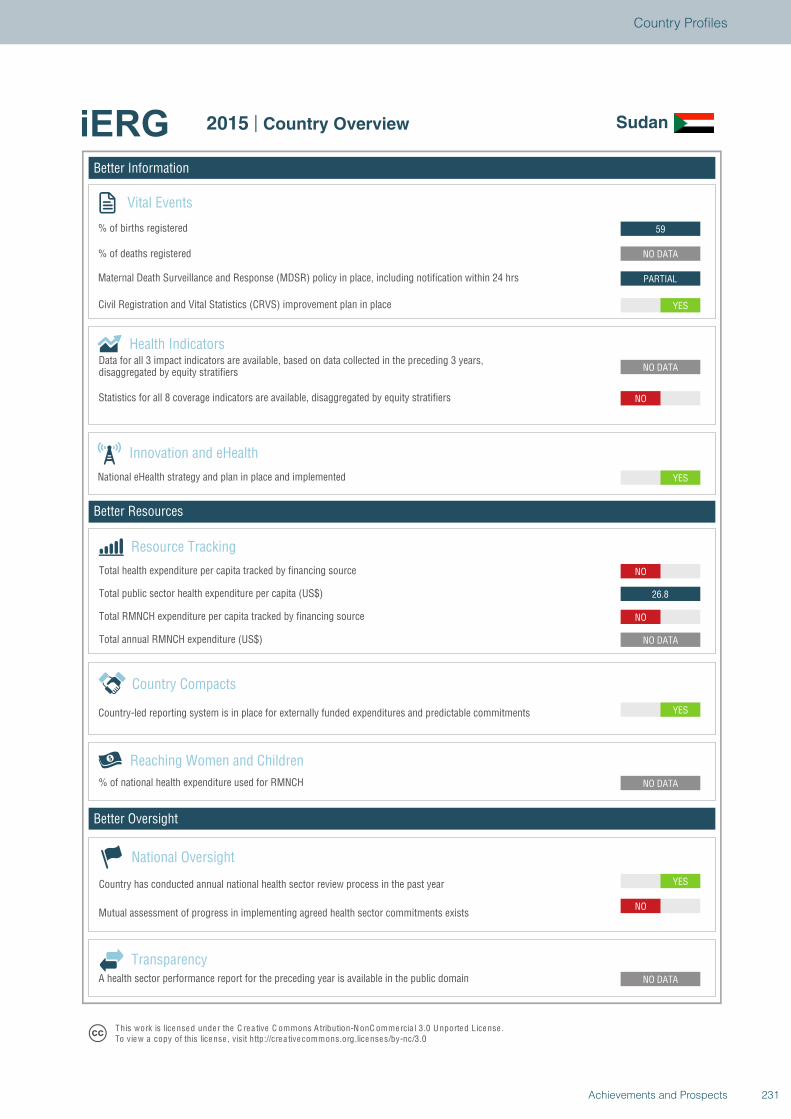
Better Information
Better Resources
Better Oversight
Sudan
Vital Events
% of births registered
% of deaths registered
Innovation and eHealth
National eHealth strategy and plan in place and implemented
Health Indicators
Statistics for all 8 coverage indicators are available, disaggregated by equity stratifiers
Reaching Women and Children
Country Compacts
Country-led reporting system is in place for externally funded expenditures and predictable commitments
Resource Tracking
Total RMNCH expenditure per capita tracked by financing source
Total annual RMNCH expenditure (US$)
Total health expenditure per capita tracked by financing source
% of national health expenditure used for RMNCH
YES
NO
NO DATA
NO DATA
YES
NO DATA
NO
26.8
NO
YES
NO DATA
NO
YES
PARTIAL
NO DATA
59
National Oversight
Mutual assessment of progress in implementing agreed health sector commitments exists
Country has conducted annual national health sector review process in the past year
TransparencyA health sector performance report for the preceding year is available in the public domain
T his work is lice nse d unde r the C re a tive C ommons A tribution-N onC ommercia l 3.0 U nported License .To view a copy of this license , visit http://cre a tive commons.org.licenses/by-nc/3.0
2015 | Country Overview Sudan
Total public sector health expenditure per capita (US$)
Maternal Death Surveillance and Response (MDSR) policy in place, including notification within 24 hrs
Civil Registration and Vital Statistics (CRVS) improvement plan in place
Data for all 3 impact indicators are available, based on data collected in the preceding 3 years,disaggregated by equity stratifiers
231Achievements and Prospects
Country Profiles
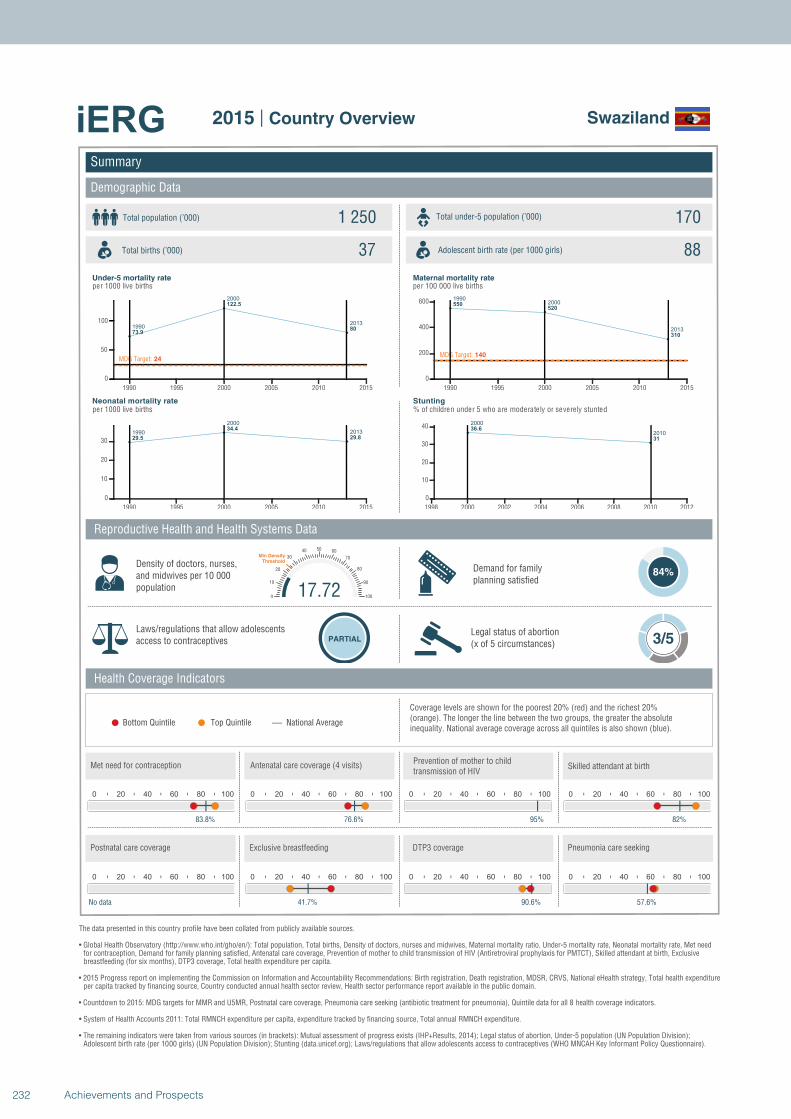
1990
2000
2013
73.9
122.5
80
MDG Target: 24
1990 1995 2000 2005 2010 2015
0
50
100
1990
2000
2013
29.5
34.4
29.8
1990 1995 2000 2005 2010 2015
0
10
20
30
19902000
2013
550520
310
MDG Target: 140
1990 1995 2000 2005 2010 2015
0
200
400
600
2000
201036.6
31
1998 2000 2002 2004 2006 2008 2010 2012
0
10
20
30
40
Summary
Demographic Data
Swaziland
Total population (’000) Total under-5 population (’000)1 250 170
37 88
Reproductive Health and Health Systems Data
Health Coverage Indicators
Demand for familyplanning satisfied
84%
Laws/regulations that allow adolescents access to contraceptives PARTIAL
Legal status of abortion(x of 5 circumstances) 3/5
National AverageBottom Quintile Top Quintile
per 1000 live births per 100 000 live births
per 1000 live births % of children under 5 who are moderately or severely stunted
0 20 40 60 80 100
83.8%
0 20 40 60 80 100
76.6%
0 20 40 60 80 100
95%
17.720
10
20
30
40 50 60
70
80
90
100
Min Density Threshold
0 20 40 60 80 100
82%
0 20 40 60 80 100
No data
0 20 40 60 80 100
41.7%
0 20 40 60 80 100
90.6%
0 20 40 60 80 100
57.6%
Total births (’000) Adolescent birth rate (per 1000 girls)
Coverage levels are shown for the poorest 20% (red) and the richest 20% (orange). The longer the line between the two groups, the greater the absolute inequality. National average coverage across all quintiles is also shown (blue).
Density of doctors, nurses, and midwives per 10 000 population
Postnatal care coverage Exclusive breastfeeding DTP3 coverage Pneumonia care seeking
Met need for contraception Antenatal care coverage (4 visits)Prevention of mother to child transmission of HIV
Skilled attendant at birth
Under-5 mortality rate Maternal mortality rate
Neonatal mortality rate Stunting
The data presented in this country profile have been collated from publicly available sources.
• Global Health Observatory (http://www.who.int/gho/en/): Total population, Total births, Density of doctors, nurses and midwives, Maternal mortality ratio, Under-5 mortality rate, Neonatal mortality rate, Met need for contraception, Demand for family planning satisfied, Antenatal care coverage, Prevention of mother to child transmission of HIV (Antiretroviral prophylaxis for PMTCT), Skilled attendant at birth, Exclusive breastfeeding (for six months), DTP3 coverage, Total health expenditure per capita.
• 2015 Progress report on implementing the Commission on Information and Accountability Recommendations: Birth registration, Death registration, MDSR, CRVS, National eHealth strategy, Total health expenditureper capita tracked by financing source, Country conducted annual health sector review, Health sector performance report available in the public domain.
• Countdown to 2015: MDG targets for MMR and U5MR, Postnatal care coverage, Pneumonia care seeking (antibiotic treatment for pneumonia), Quintile data for all 8 health coverage indicators.
• System of Health Accounts 2011: Total RMNCH expenditure per capita, expenditure tracked by financing source, Total annual RMNCH expenditure.
• The remaining indicators were taken from various sources (in brackets): Mutual assessment of progress exists (IHP+Results, 2014); Legal status of abortion, Under-5 population (UN Population Division);Adolescent birth rate (per 1000 girls) (UN Population Division); Stunting (data.unicef.org); Laws/regulations that allow adolescents access to contraceptives (WHO MNCAH Key Informant Policy Questionnaire).
2015 | Country Overview
232 Achievements and Prospects
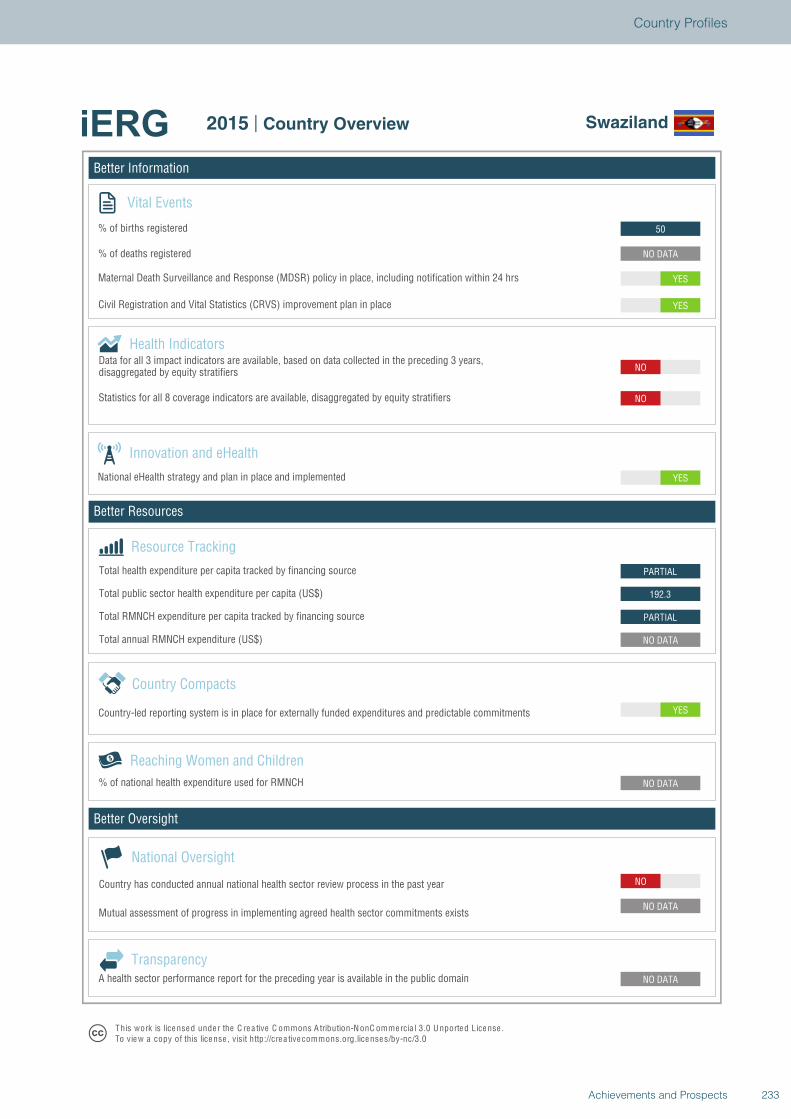
Better Information
Better Resources
Better Oversight
Swaziland
Vital Events
% of births registered
% of deaths registered
Innovation and eHealth
National eHealth strategy and plan in place and implemented
Health Indicators
Statistics for all 8 coverage indicators are available, disaggregated by equity stratifiers
Reaching Women and Children
Country Compacts
Country-led reporting system is in place for externally funded expenditures and predictable commitments
Resource Tracking
Total RMNCH expenditure per capita tracked by financing source
Total annual RMNCH expenditure (US$)
Total health expenditure per capita tracked by financing source
% of national health expenditure used for RMNCH
NO
NO DATA
NO DATA
NO DATA
YES
NO DATA
PARTIAL
192.3
PARTIAL
YES
NO
NO
YES
YES
NO DATA
50
National Oversight
Mutual assessment of progress in implementing agreed health sector commitments exists
Country has conducted annual national health sector review process in the past year
TransparencyA health sector performance report for the preceding year is available in the public domain
T his work is lice nse d unde r the C re a tive C ommons A tribution-N onC ommercia l 3.0 U nported License .To view a copy of this license , visit http://cre a tive commons.org.licenses/by-nc/3.0
2015 | Country Overview Swaziland
Total public sector health expenditure per capita (US$)
Maternal Death Surveillance and Response (MDSR) policy in place, including notification within 24 hrs
Civil Registration and Vital Statistics (CRVS) improvement plan in place
Data for all 3 impact indicators are available, based on data collected in the preceding 3 years,disaggregated by equity stratifiers
233Achievements and Prospects
Country Profiles
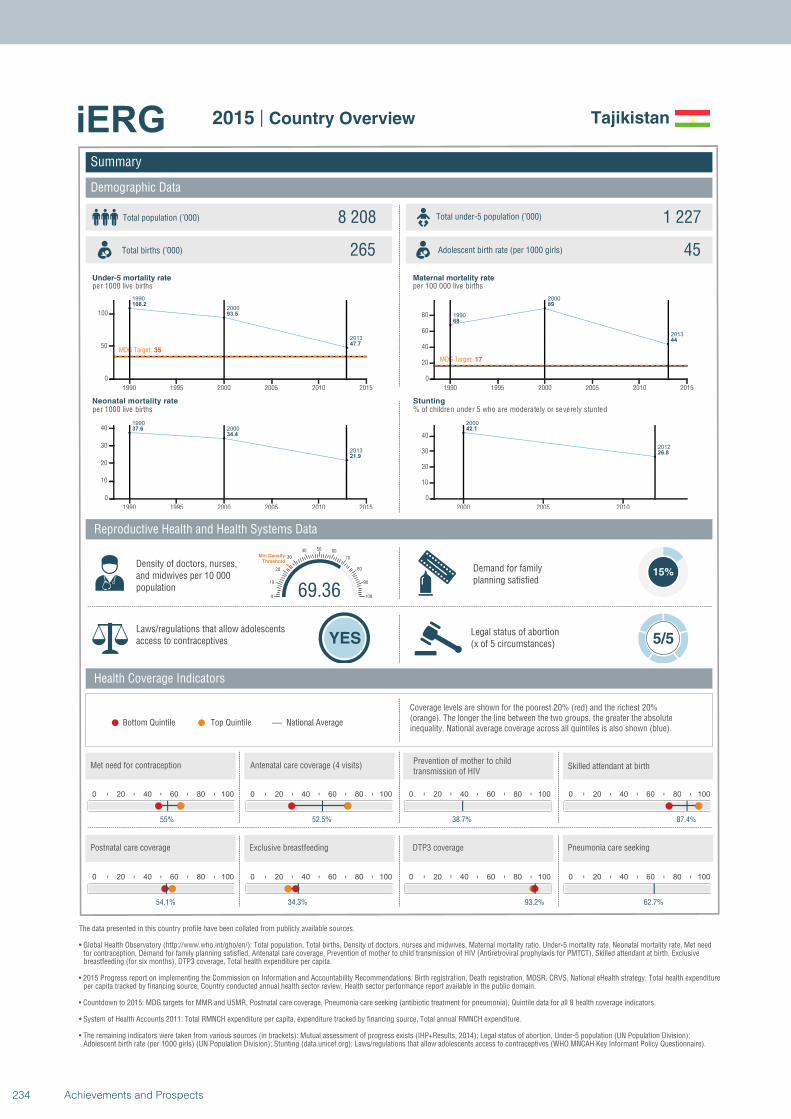
1990
2000
2013
108.2
93.5
47.7
MDG Target: 35
1990 1995 2000 2005 2010 2015
0
50
100
1990
2000
2013
37.6
34.4
21.9
1990 1995 2000 2005 2010 2015
0
10
20
30
40
1990
2000
2013
68
89
44
MDG Target: 17
1990 1995 2000 2005 2010 2015
0
20
40
60
80
2000
2012
42.1
26.8
2000 2005 2010
0
10
20
30
40
Summary
Demographic Data
Tajikistan
Total population (’000) Total under-5 population (’000)8 208 1 227
265 45
Reproductive Health and Health Systems Data
Health Coverage Indicators
Demand for familyplanning satisfied
15%
Laws/regulations that allow adolescents access to contraceptives YES
Legal status of abortion(x of 5 circumstances) 5/5
National AverageBottom Quintile Top Quintile
per 1000 live births per 100 000 live births
per 1000 live births % of children under 5 who are moderately or severely stunted
0 20 40 60 80 100
55%
0 20 40 60 80 100
52.5%
0 20 40 60 80 100
38.7%
69.360
10
20
30
40 50 60
70
80
90
100
Min Density Threshold
0 20 40 60 80 100
87.4%
0 20 40 60 80 100
54.1%
0 20 40 60 80 100
34.3%
0 20 40 60 80 100
93.2%
0 20 40 60 80 100
62.7%
Total births (’000) Adolescent birth rate (per 1000 girls)
Coverage levels are shown for the poorest 20% (red) and the richest 20% (orange). The longer the line between the two groups, the greater the absolute inequality. National average coverage across all quintiles is also shown (blue).
Density of doctors, nurses, and midwives per 10 000 population
Postnatal care coverage Exclusive breastfeeding DTP3 coverage Pneumonia care seeking
Met need for contraception Antenatal care coverage (4 visits)Prevention of mother to child transmission of HIV
Skilled attendant at birth
Under-5 mortality rate Maternal mortality rate
Neonatal mortality rate Stunting
The data presented in this country profile have been collated from publicly available sources.
• Global Health Observatory (http://www.who.int/gho/en/): Total population, Total births, Density of doctors, nurses and midwives, Maternal mortality ratio, Under-5 mortality rate, Neonatal mortality rate, Met need for contraception, Demand for family planning satisfied, Antenatal care coverage, Prevention of mother to child transmission of HIV (Antiretroviral prophylaxis for PMTCT), Skilled attendant at birth, Exclusive breastfeeding (for six months), DTP3 coverage, Total health expenditure per capita.
• 2015 Progress report on implementing the Commission on Information and Accountability Recommendations: Birth registration, Death registration, MDSR, CRVS, National eHealth strategy, Total health expenditureper capita tracked by financing source, Country conducted annual health sector review, Health sector performance report available in the public domain.
• Countdown to 2015: MDG targets for MMR and U5MR, Postnatal care coverage, Pneumonia care seeking (antibiotic treatment for pneumonia), Quintile data for all 8 health coverage indicators.
• System of Health Accounts 2011: Total RMNCH expenditure per capita, expenditure tracked by financing source, Total annual RMNCH expenditure.
• The remaining indicators were taken from various sources (in brackets): Mutual assessment of progress exists (IHP+Results, 2014); Legal status of abortion, Under-5 population (UN Population Division);Adolescent birth rate (per 1000 girls) (UN Population Division); Stunting (data.unicef.org); Laws/regulations that allow adolescents access to contraceptives (WHO MNCAH Key Informant Policy Questionnaire).
2015 | Country Overview
234 Achievements and Prospects
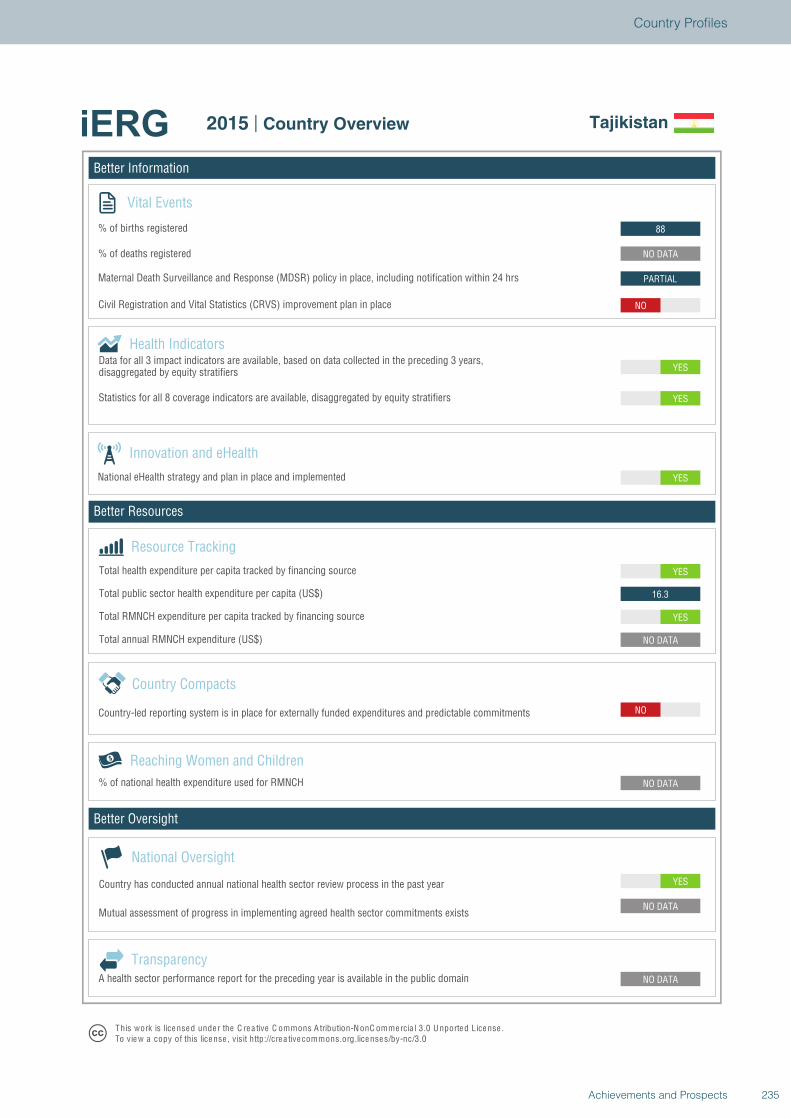
Better Information
Better Resources
Better Oversight
Tajikistan
Vital Events
% of births registered
% of deaths registered
Innovation and eHealth
National eHealth strategy and plan in place and implemented
Health Indicators
Statistics for all 8 coverage indicators are available, disaggregated by equity stratifiers
Reaching Women and Children
Country Compacts
Country-led reporting system is in place for externally funded expenditures and predictable commitments
Resource Tracking
Total RMNCH expenditure per capita tracked by financing source
Total annual RMNCH expenditure (US$)
Total health expenditure per capita tracked by financing source
% of national health expenditure used for RMNCH
YES
NO DATA
NO DATA
NO DATA
NO
NO DATA
YES
16.3
YES
YES
YES
YES
NO
PARTIAL
NO DATA
88
National Oversight
Mutual assessment of progress in implementing agreed health sector commitments exists
Country has conducted annual national health sector review process in the past year
TransparencyA health sector performance report for the preceding year is available in the public domain
T his work is lice nse d unde r the C re a tive C ommons A tribution-N onC ommercia l 3.0 U nported License .To view a copy of this license , visit http://cre a tive commons.org.licenses/by-nc/3.0
2015 | Country Overview Tajikistan
Total public sector health expenditure per capita (US$)
Maternal Death Surveillance and Response (MDSR) policy in place, including notification within 24 hrs
Civil Registration and Vital Statistics (CRVS) improvement plan in place
Data for all 3 impact indicators are available, based on data collected in the preceding 3 years,disaggregated by equity stratifiers
235Achievements and Prospects
Country Profiles
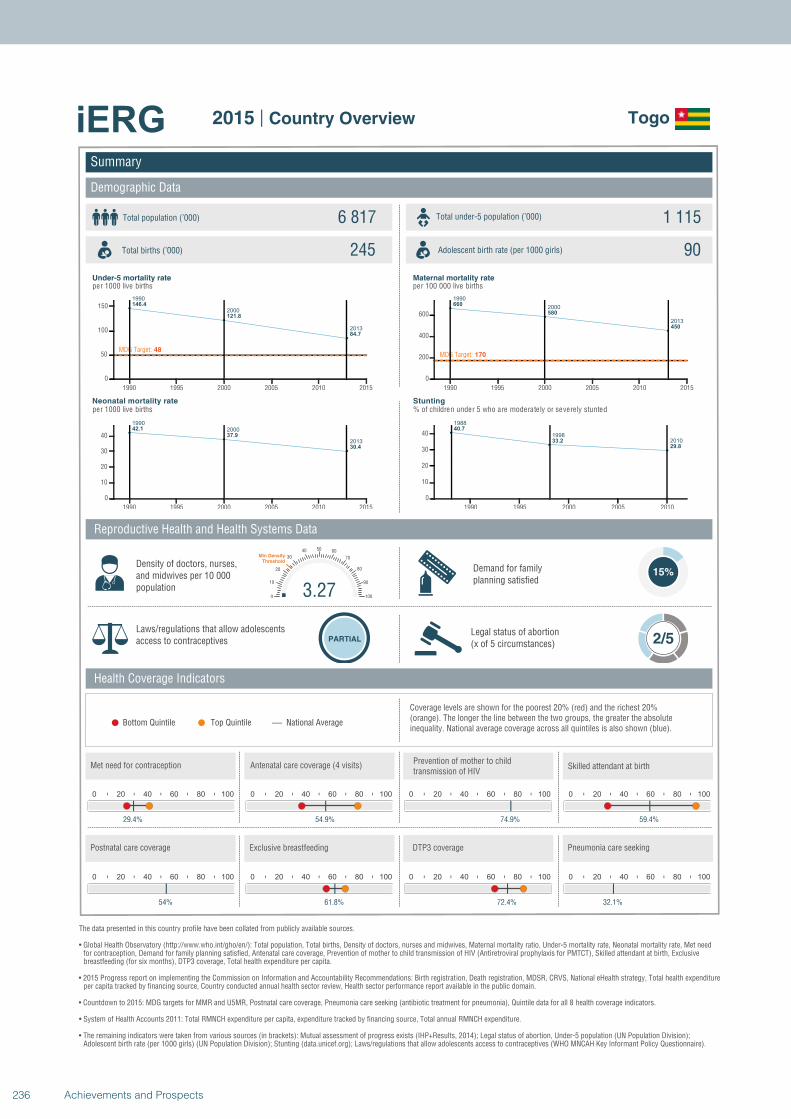
1990
2000
2013
146.4
121.8
84.7
MDG Target: 48
1990 1995 2000 2005 2010 2015
0
50
100
150
1990
2000
2013
42.1
37.9
30.4
1990 1995 2000 2005 2010 2015
0
10
20
30
40
1990
2000
2013
660
580
450
MDG Target: 170
1990 1995 2000 2005 2010 2015
0
200
400
600
1988
1998
2010
40.7
33.2
29.8
1990 1995 2000 2005 2010
0
10
20
30
40
Summary
Demographic Data
Togo
Total population (’000) Total under-5 population (’000)6 817 1 115
245 90
Reproductive Health and Health Systems Data
Health Coverage Indicators
Demand for familyplanning satisfied
15%
Laws/regulations that allow adolescents access to contraceptives PARTIAL
Legal status of abortion(x of 5 circumstances) 2/5
National AverageBottom Quintile Top Quintile
per 1000 live births per 100 000 live births
per 1000 live births % of children under 5 who are moderately or severely stunted
0 20 40 60 80 100
29.4%
0 20 40 60 80 100
54.9%
0 20 40 60 80 100
74.9%
3.270
10
20
30
40 50 60
70
80
90
100
Min Density Threshold
0 20 40 60 80 100
59.4%
0 20 40 60 80 100
54%
0 20 40 60 80 100
61.8%
0 20 40 60 80 100
72.4%
0 20 40 60 80 100
32.1%
Total births (’000) Adolescent birth rate (per 1000 girls)
Coverage levels are shown for the poorest 20% (red) and the richest 20% (orange). The longer the line between the two groups, the greater the absolute inequality. National average coverage across all quintiles is also shown (blue).
Density of doctors, nurses, and midwives per 10 000 population
Postnatal care coverage Exclusive breastfeeding DTP3 coverage Pneumonia care seeking
Met need for contraception Antenatal care coverage (4 visits)Prevention of mother to child transmission of HIV
Skilled attendant at birth
Under-5 mortality rate Maternal mortality rate
Neonatal mortality rate Stunting
The data presented in this country profile have been collated from publicly available sources.
• Global Health Observatory (http://www.who.int/gho/en/): Total population, Total births, Density of doctors, nurses and midwives, Maternal mortality ratio, Under-5 mortality rate, Neonatal mortality rate, Met need for contraception, Demand for family planning satisfied, Antenatal care coverage, Prevention of mother to child transmission of HIV (Antiretroviral prophylaxis for PMTCT), Skilled attendant at birth, Exclusive breastfeeding (for six months), DTP3 coverage, Total health expenditure per capita.
• 2015 Progress report on implementing the Commission on Information and Accountability Recommendations: Birth registration, Death registration, MDSR, CRVS, National eHealth strategy, Total health expenditureper capita tracked by financing source, Country conducted annual health sector review, Health sector performance report available in the public domain.
• Countdown to 2015: MDG targets for MMR and U5MR, Postnatal care coverage, Pneumonia care seeking (antibiotic treatment for pneumonia), Quintile data for all 8 health coverage indicators.
• System of Health Accounts 2011: Total RMNCH expenditure per capita, expenditure tracked by financing source, Total annual RMNCH expenditure.
• The remaining indicators were taken from various sources (in brackets): Mutual assessment of progress exists (IHP+Results, 2014); Legal status of abortion, Under-5 population (UN Population Division);Adolescent birth rate (per 1000 girls) (UN Population Division); Stunting (data.unicef.org); Laws/regulations that allow adolescents access to contraceptives (WHO MNCAH Key Informant Policy Questionnaire).
2015 | Country Overview
236 Achievements and Prospects
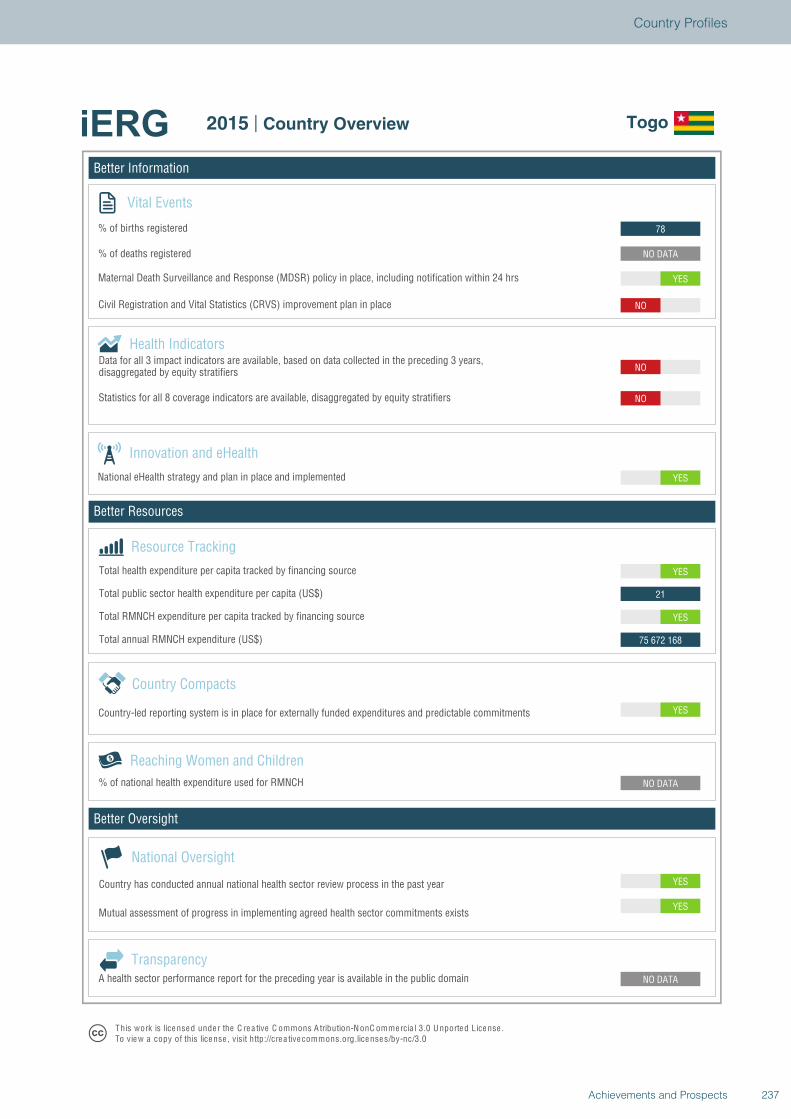
Better Information
Better Resources
Better Oversight
Togo
Vital Events
% of births registered
% of deaths registered
Innovation and eHealth
National eHealth strategy and plan in place and implemented
Health Indicators
Statistics for all 8 coverage indicators are available, disaggregated by equity stratifiers
Reaching Women and Children
Country Compacts
Country-led reporting system is in place for externally funded expenditures and predictable commitments
Resource Tracking
Total RMNCH expenditure per capita tracked by financing source
Total annual RMNCH expenditure (US$)
Total health expenditure per capita tracked by financing source
% of national health expenditure used for RMNCH
YES
YES
NO DATA
NO DATA
YES
75 672 168
YES
21
YES
YES
NO
NO
NO
YES
NO DATA
78
National Oversight
Mutual assessment of progress in implementing agreed health sector commitments exists
Country has conducted annual national health sector review process in the past year
TransparencyA health sector performance report for the preceding year is available in the public domain
T his work is lice nse d unde r the C re a tive C ommons A tribution-N onC ommercia l 3.0 U nported License .To view a copy of this license , visit http://cre a tive commons.org.licenses/by-nc/3.0
2015 | Country Overview Togo
Total public sector health expenditure per capita (US$)
Maternal Death Surveillance and Response (MDSR) policy in place, including notification within 24 hrs
Civil Registration and Vital Statistics (CRVS) improvement plan in place
Data for all 3 impact indicators are available, based on data collected in the preceding 3 years,disaggregated by equity stratifiers
237Achievements and Prospects
Country Profiles
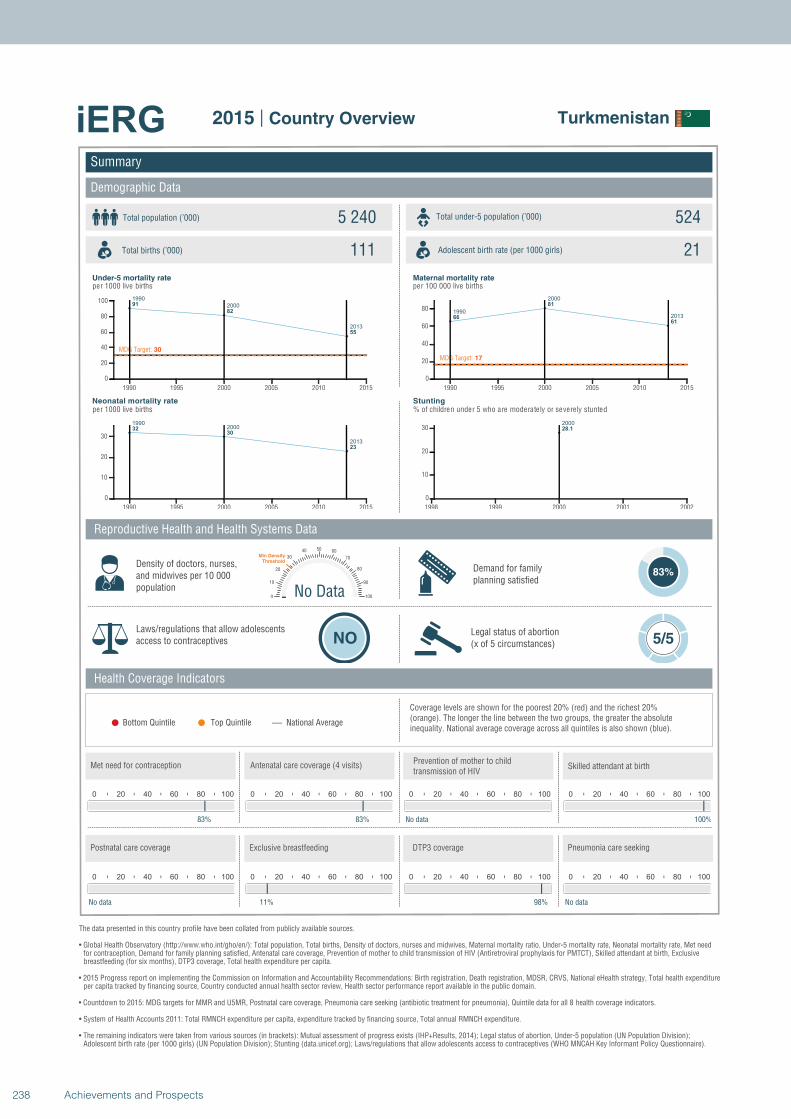
1990
2000
2013
91
82
55
MDG Target: 30
1990 1995 2000 2005 2010 2015
0
20
40
60
80
100
19902000
2013
3230
23
1990 1995 2000 2005 2010 2015
0
10
20
30
1990
2000
201366
81
61
MDG Target: 17
1990 1995 2000 2005 2010 2015
0
20
40
60
80
2000
28.1
1998 1999 2000 2001 2002
0
10
20
30
Summary
Demographic Data
Turkmenistan
Total population (’000) Total under-5 population (’000)5 240 524
111 21
Reproductive Health and Health Systems Data
Health Coverage Indicators
Demand for familyplanning satisfied
83%
Laws/regulations that allow adolescents access to contraceptives NO
Legal status of abortion(x of 5 circumstances) 5/5
National AverageBottom Quintile Top Quintile
per 1000 live births per 100 000 live births
per 1000 live births % of children under 5 who are moderately or severely stunted
0 20 40 60 80 100
83%
0 20 40 60 80 100
83%
0 20 40 60 80 100
No data
No Data0
10
20
30
40 50 60
70
80
90
100
Min Density Threshold
0 20 40 60 80 100
100%
0 20 40 60 80 100
No data
0 20 40 60 80 100
11%
0 20 40 60 80 100
98%
0 20 40 60 80 100
No data
Total births (’000) Adolescent birth rate (per 1000 girls)
Coverage levels are shown for the poorest 20% (red) and the richest 20% (orange). The longer the line between the two groups, the greater the absolute inequality. National average coverage across all quintiles is also shown (blue).
Density of doctors, nurses, and midwives per 10 000 population
Postnatal care coverage Exclusive breastfeeding DTP3 coverage Pneumonia care seeking
Met need for contraception Antenatal care coverage (4 visits)Prevention of mother to child transmission of HIV
Skilled attendant at birth
Under-5 mortality rate Maternal mortality rate
Neonatal mortality rate Stunting
The data presented in this country profile have been collated from publicly available sources.
• Global Health Observatory (http://www.who.int/gho/en/): Total population, Total births, Density of doctors, nurses and midwives, Maternal mortality ratio, Under-5 mortality rate, Neonatal mortality rate, Met need for contraception, Demand for family planning satisfied, Antenatal care coverage, Prevention of mother to child transmission of HIV (Antiretroviral prophylaxis for PMTCT), Skilled attendant at birth, Exclusive breastfeeding (for six months), DTP3 coverage, Total health expenditure per capita.
• 2015 Progress report on implementing the Commission on Information and Accountability Recommendations: Birth registration, Death registration, MDSR, CRVS, National eHealth strategy, Total health expenditureper capita tracked by financing source, Country conducted annual health sector review, Health sector performance report available in the public domain.
• Countdown to 2015: MDG targets for MMR and U5MR, Postnatal care coverage, Pneumonia care seeking (antibiotic treatment for pneumonia), Quintile data for all 8 health coverage indicators.
• System of Health Accounts 2011: Total RMNCH expenditure per capita, expenditure tracked by financing source, Total annual RMNCH expenditure.
• The remaining indicators were taken from various sources (in brackets): Mutual assessment of progress exists (IHP+Results, 2014); Legal status of abortion, Under-5 population (UN Population Division);Adolescent birth rate (per 1000 girls) (UN Population Division); Stunting (data.unicef.org); Laws/regulations that allow adolescents access to contraceptives (WHO MNCAH Key Informant Policy Questionnaire).
2015 | Country Overview
238 Achievements and Prospects
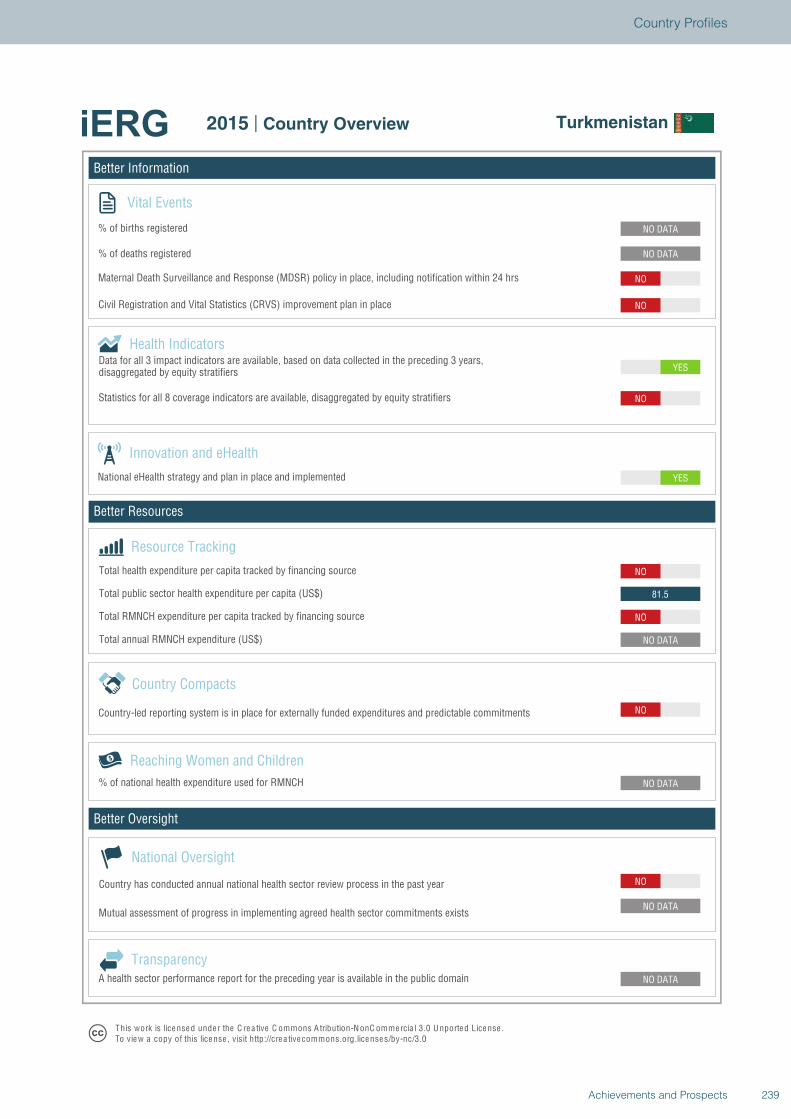
Better Information
Better Resources
Better Oversight
Turkmenistan
Vital Events
% of births registered
% of deaths registered
Innovation and eHealth
National eHealth strategy and plan in place and implemented
Health Indicators
Statistics for all 8 coverage indicators are available, disaggregated by equity stratifiers
Reaching Women and Children
Country Compacts
Country-led reporting system is in place for externally funded expenditures and predictable commitments
Resource Tracking
Total RMNCH expenditure per capita tracked by financing source
Total annual RMNCH expenditure (US$)
Total health expenditure per capita tracked by financing source
% of national health expenditure used for RMNCH
NO
NO DATA
NO DATA
NO DATA
NO
NO DATA
NO
81.5
NO
YES
YES
NO
NO
NO
NO DATA
NO DATA
National Oversight
Mutual assessment of progress in implementing agreed health sector commitments exists
Country has conducted annual national health sector review process in the past year
TransparencyA health sector performance report for the preceding year is available in the public domain
T his work is lice nse d unde r the C re a tive C ommons A tribution-N onC ommercia l 3.0 U nported License .To view a copy of this license , visit http://cre a tive commons.org.licenses/by-nc/3.0
2015 | Country Overview Turkmenistan
Total public sector health expenditure per capita (US$)
Maternal Death Surveillance and Response (MDSR) policy in place, including notification within 24 hrs
Civil Registration and Vital Statistics (CRVS) improvement plan in place
Data for all 3 impact indicators are available, based on data collected in the preceding 3 years,disaggregated by equity stratifiers
239Achievements and Prospects
Country Profiles
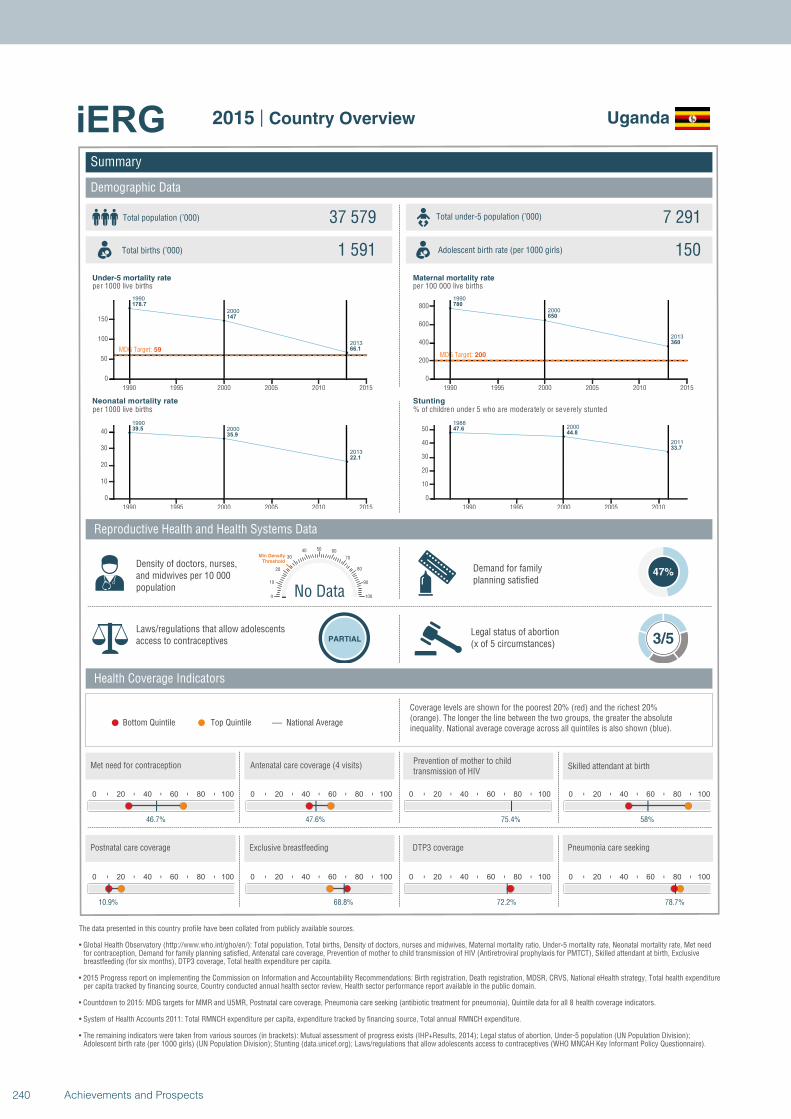
1990
2000
2013
178.7
147
66.1MDG Target: 59
1990 1995 2000 2005 2010 2015
0
50
100
150
1990
2000
2013
39.5
35.9
22.1
1990 1995 2000 2005 2010 2015
0
10
20
30
40
1990
2000
2013
780
650
360
MDG Target: 200
1990 1995 2000 2005 2010 2015
0
200
400
600
800
19882000
2011
47.644.8
33.7
1990 1995 2000 2005 2010
0
10
20
30
40
50
Summary
Demographic Data
Uganda
Total population (’000) Total under-5 population (’000)37 579 7 291
1 591 150
Reproductive Health and Health Systems Data
Health Coverage Indicators
Demand for familyplanning satisfied
47%
Laws/regulations that allow adolescents access to contraceptives PARTIAL
Legal status of abortion(x of 5 circumstances) 3/5
National AverageBottom Quintile Top Quintile
per 1000 live births per 100 000 live births
per 1000 live births % of children under 5 who are moderately or severely stunted
0 20 40 60 80 100
46.7%
0 20 40 60 80 100
47.6%
0 20 40 60 80 100
75.4%
No Data0
10
20
30
40 50 60
70
80
90
100
Min Density Threshold
0 20 40 60 80 100
58%
0 20 40 60 80 100
10.9%
0 20 40 60 80 100
68.8%
0 20 40 60 80 100
72.2%
0 20 40 60 80 100
78.7%
Total births (’000) Adolescent birth rate (per 1000 girls)
Coverage levels are shown for the poorest 20% (red) and the richest 20% (orange). The longer the line between the two groups, the greater the absolute inequality. National average coverage across all quintiles is also shown (blue).
Density of doctors, nurses, and midwives per 10 000 population
Postnatal care coverage Exclusive breastfeeding DTP3 coverage Pneumonia care seeking
Met need for contraception Antenatal care coverage (4 visits)Prevention of mother to child transmission of HIV
Skilled attendant at birth
Under-5 mortality rate Maternal mortality rate
Neonatal mortality rate Stunting
The data presented in this country profile have been collated from publicly available sources.
• Global Health Observatory (http://www.who.int/gho/en/): Total population, Total births, Density of doctors, nurses and midwives, Maternal mortality ratio, Under-5 mortality rate, Neonatal mortality rate, Met need for contraception, Demand for family planning satisfied, Antenatal care coverage, Prevention of mother to child transmission of HIV (Antiretroviral prophylaxis for PMTCT), Skilled attendant at birth, Exclusive breastfeeding (for six months), DTP3 coverage, Total health expenditure per capita.
• 2015 Progress report on implementing the Commission on Information and Accountability Recommendations: Birth registration, Death registration, MDSR, CRVS, National eHealth strategy, Total health expenditureper capita tracked by financing source, Country conducted annual health sector review, Health sector performance report available in the public domain.
• Countdown to 2015: MDG targets for MMR and U5MR, Postnatal care coverage, Pneumonia care seeking (antibiotic treatment for pneumonia), Quintile data for all 8 health coverage indicators.
• System of Health Accounts 2011: Total RMNCH expenditure per capita, expenditure tracked by financing source, Total annual RMNCH expenditure.
• The remaining indicators were taken from various sources (in brackets): Mutual assessment of progress exists (IHP+Results, 2014); Legal status of abortion, Under-5 population (UN Population Division);Adolescent birth rate (per 1000 girls) (UN Population Division); Stunting (data.unicef.org); Laws/regulations that allow adolescents access to contraceptives (WHO MNCAH Key Informant Policy Questionnaire).
2015 | Country Overview
240 Achievements and Prospects
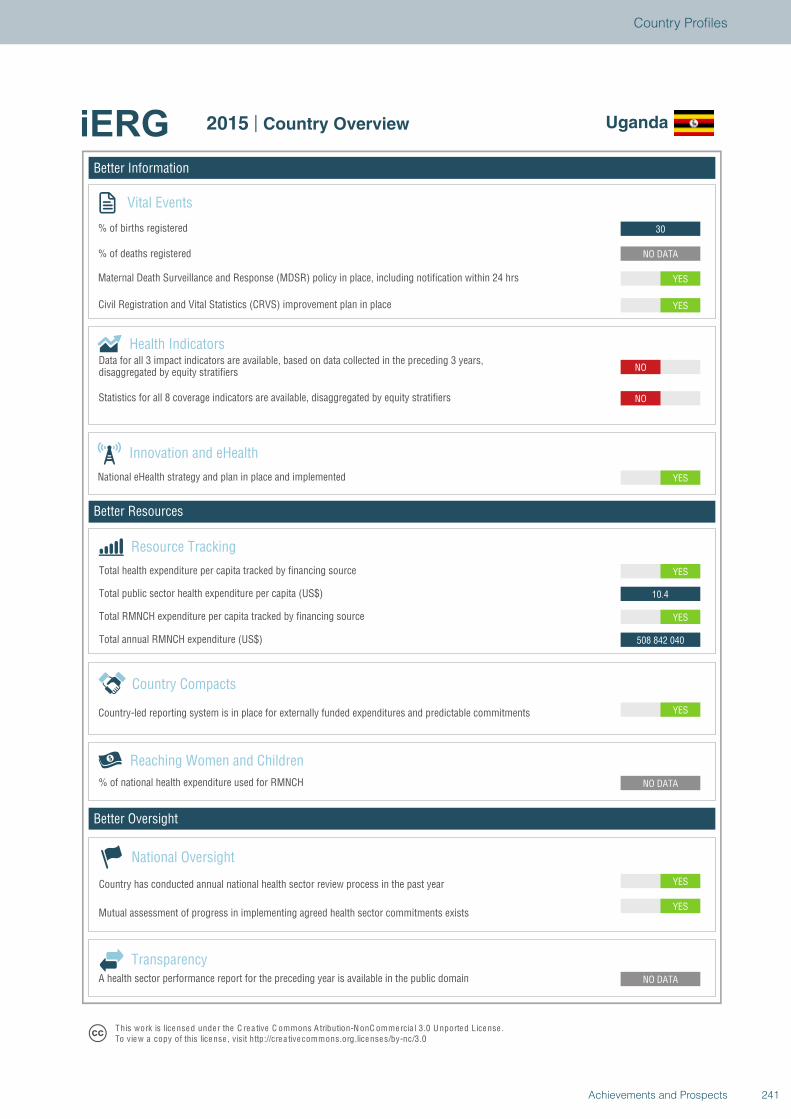
Better Information
Better Resources
Better Oversight
Uganda
Vital Events
% of births registered
% of deaths registered
Innovation and eHealth
National eHealth strategy and plan in place and implemented
Health Indicators
Statistics for all 8 coverage indicators are available, disaggregated by equity stratifiers
Reaching Women and Children
Country Compacts
Country-led reporting system is in place for externally funded expenditures and predictable commitments
Resource Tracking
Total RMNCH expenditure per capita tracked by financing source
Total annual RMNCH expenditure (US$)
Total health expenditure per capita tracked by financing source
% of national health expenditure used for RMNCH
YES
YES
NO DATA
NO DATA
YES
508 842 040
YES
10.4
YES
YES
NO
NO
YES
YES
NO DATA
30
National Oversight
Mutual assessment of progress in implementing agreed health sector commitments exists
Country has conducted annual national health sector review process in the past year
TransparencyA health sector performance report for the preceding year is available in the public domain
T his work is lice nse d unde r the C re a tive C ommons A tribution-N onC ommercia l 3.0 U nported License .To view a copy of this license , visit http://cre a tive commons.org.licenses/by-nc/3.0
2015 | Country Overview Uganda
Total public sector health expenditure per capita (US$)
Maternal Death Surveillance and Response (MDSR) policy in place, including notification within 24 hrs
Civil Registration and Vital Statistics (CRVS) improvement plan in place
Data for all 3 impact indicators are available, based on data collected in the preceding 3 years,disaggregated by equity stratifiers
241Achievements and Prospects
Country Profiles
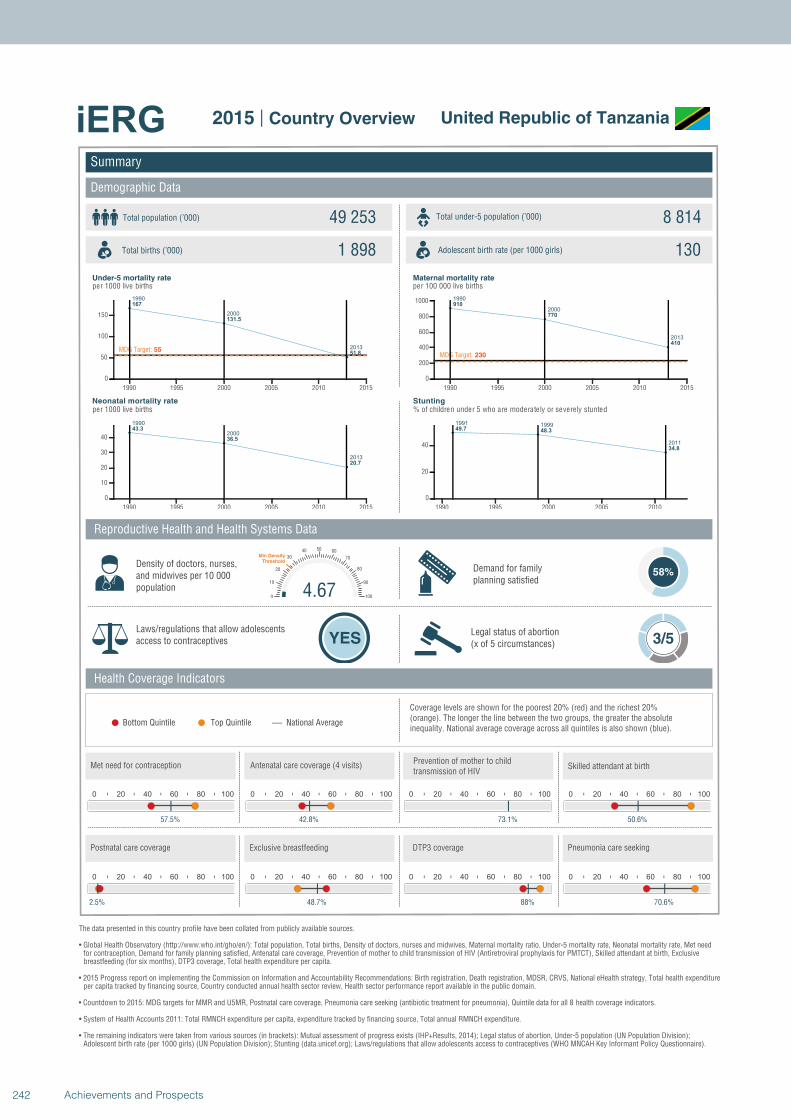
1990
2000
2013
167
131.5
51.8MDG Target: 55
1990 1995 2000 2005 2010 2015
0
50
100
150
1990
2000
2013
43.3
36.5
20.7
1990 1995 2000 2005 2010 2015
0
10
20
30
40
1990
2000
2013
910
770
410
MDG Target: 230
1990 1995 2000 2005 2010 2015
0
200
400
600
800
1000
1991 1999
2011
49.7 48.3
34.8
1990 1995 2000 2005 2010
0
20
40
Summary
Demographic Data
United Republic of Tanzania
Total population (’000) Total under-5 population (’000)49 253 8 814
1 898 130
Reproductive Health and Health Systems Data
Health Coverage Indicators
Demand for familyplanning satisfied
58%
Laws/regulations that allow adolescents access to contraceptives YES
Legal status of abortion(x of 5 circumstances) 3/5
National AverageBottom Quintile Top Quintile
per 1000 live births per 100 000 live births
per 1000 live births % of children under 5 who are moderately or severely stunted
0 20 40 60 80 100
57.5%
0 20 40 60 80 100
42.8%
0 20 40 60 80 100
73.1%
4.670
10
20
30
40 50 60
70
80
90
100
Min Density Threshold
0 20 40 60 80 100
50.6%
0 20 40 60 80 100
2.5%
0 20 40 60 80 100
48.7%
0 20 40 60 80 100
88%
0 20 40 60 80 100
70.6%
Total births (’000) Adolescent birth rate (per 1000 girls)
Coverage levels are shown for the poorest 20% (red) and the richest 20% (orange). The longer the line between the two groups, the greater the absolute inequality. National average coverage across all quintiles is also shown (blue).
Density of doctors, nurses, and midwives per 10 000 population
Postnatal care coverage Exclusive breastfeeding DTP3 coverage Pneumonia care seeking
Met need for contraception Antenatal care coverage (4 visits)Prevention of mother to child transmission of HIV
Skilled attendant at birth
Under-5 mortality rate Maternal mortality rate
Neonatal mortality rate Stunting
The data presented in this country profile have been collated from publicly available sources.
• Global Health Observatory (http://www.who.int/gho/en/): Total population, Total births, Density of doctors, nurses and midwives, Maternal mortality ratio, Under-5 mortality rate, Neonatal mortality rate, Met need for contraception, Demand for family planning satisfied, Antenatal care coverage, Prevention of mother to child transmission of HIV (Antiretroviral prophylaxis for PMTCT), Skilled attendant at birth, Exclusive breastfeeding (for six months), DTP3 coverage, Total health expenditure per capita.
• 2015 Progress report on implementing the Commission on Information and Accountability Recommendations: Birth registration, Death registration, MDSR, CRVS, National eHealth strategy, Total health expenditureper capita tracked by financing source, Country conducted annual health sector review, Health sector performance report available in the public domain.
• Countdown to 2015: MDG targets for MMR and U5MR, Postnatal care coverage, Pneumonia care seeking (antibiotic treatment for pneumonia), Quintile data for all 8 health coverage indicators.
• System of Health Accounts 2011: Total RMNCH expenditure per capita, expenditure tracked by financing source, Total annual RMNCH expenditure.
• The remaining indicators were taken from various sources (in brackets): Mutual assessment of progress exists (IHP+Results, 2014); Legal status of abortion, Under-5 population (UN Population Division);Adolescent birth rate (per 1000 girls) (UN Population Division); Stunting (data.unicef.org); Laws/regulations that allow adolescents access to contraceptives (WHO MNCAH Key Informant Policy Questionnaire).
2015 | Country Overview
242 Achievements and Prospects
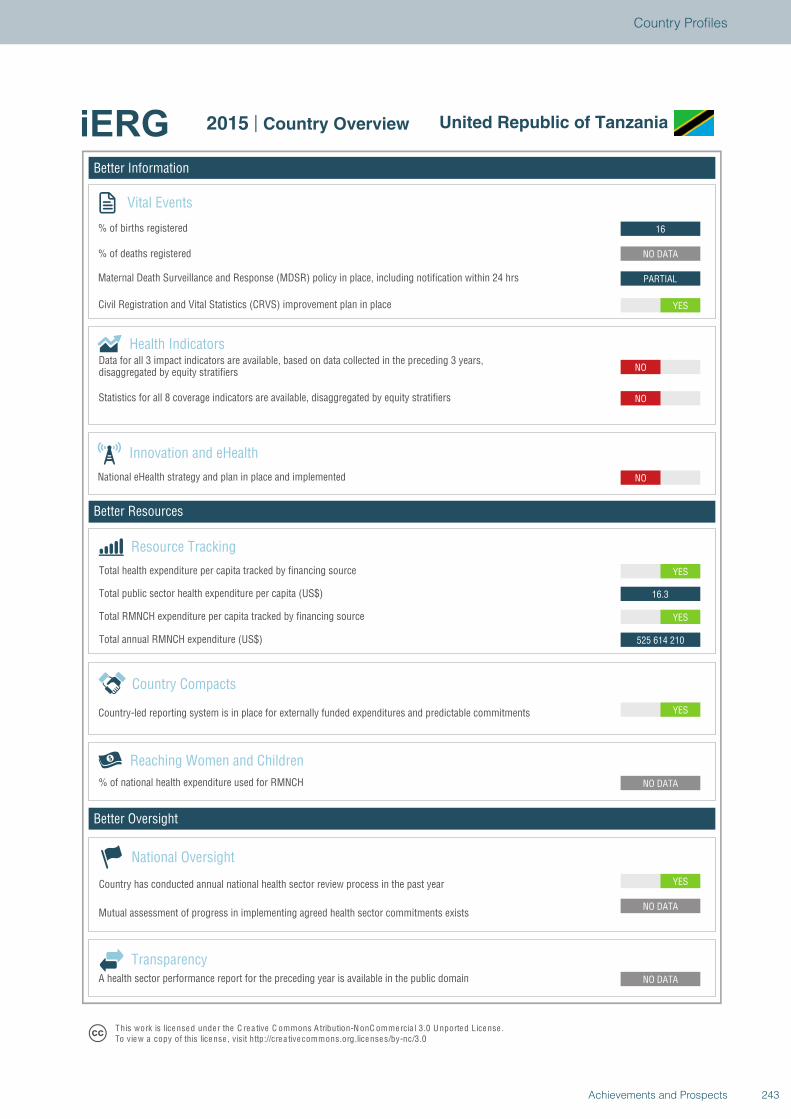
Better Information
Better Resources
Better Oversight
United Republic of Tanzania
Vital Events
% of births registered
% of deaths registered
Innovation and eHealth
National eHealth strategy and plan in place and implemented
Health Indicators
Statistics for all 8 coverage indicators are available, disaggregated by equity stratifiers
Reaching Women and Children
Country Compacts
Country-led reporting system is in place for externally funded expenditures and predictable commitments
Resource Tracking
Total RMNCH expenditure per capita tracked by financing source
Total annual RMNCH expenditure (US$)
Total health expenditure per capita tracked by financing source
% of national health expenditure used for RMNCH
YES
NO DATA
NO DATA
NO DATA
YES
525 614 210
YES
16.3
YES
NO
NO
NO
YES
PARTIAL
NO DATA
16
National Oversight
Mutual assessment of progress in implementing agreed health sector commitments exists
Country has conducted annual national health sector review process in the past year
TransparencyA health sector performance report for the preceding year is available in the public domain
T his work is lice nse d unde r the C re a tive C ommons A tribution-N onC ommercia l 3.0 U nported License .To view a copy of this license , visit http://cre a tive commons.org.licenses/by-nc/3.0
2015 | Country Overview United Republic of Tanzania
Total public sector health expenditure per capita (US$)
Maternal Death Surveillance and Response (MDSR) policy in place, including notification within 24 hrs
Civil Registration and Vital Statistics (CRVS) improvement plan in place
Data for all 3 impact indicators are available, based on data collected in the preceding 3 years,disaggregated by equity stratifiers
243Achievements and Prospects
Country Profiles
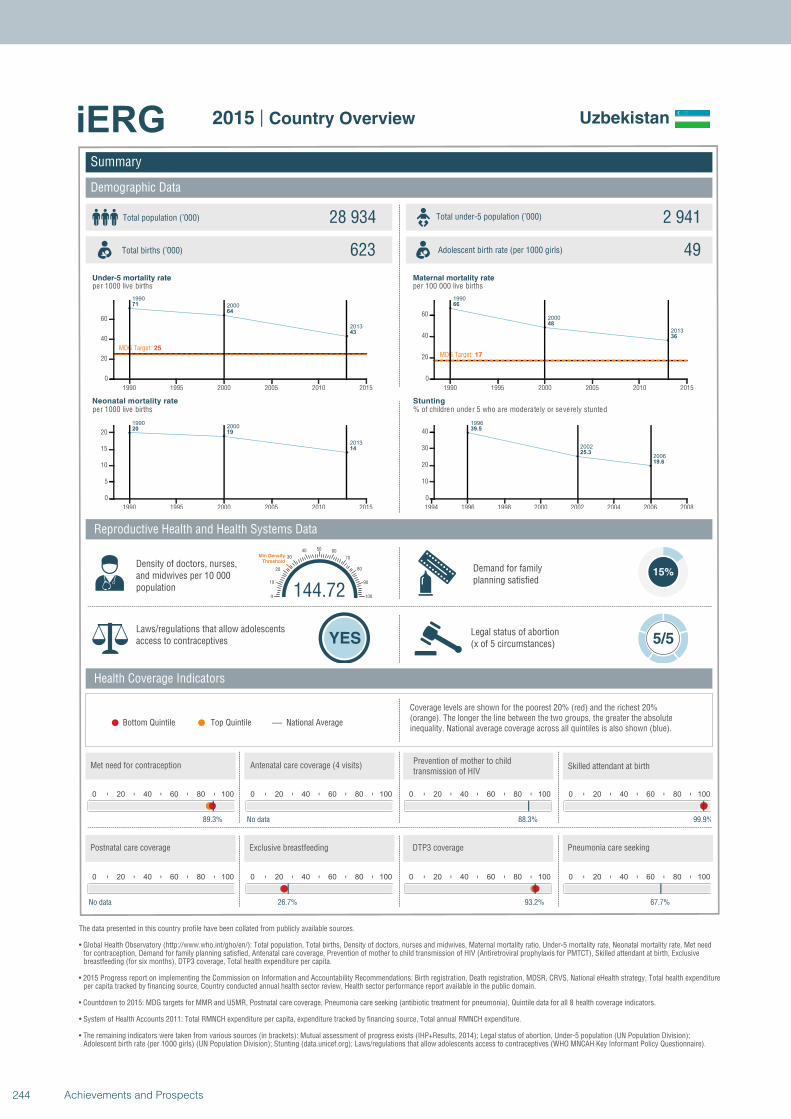
1990
2000
2013
71
64
43
MDG Target: 25
1990 1995 2000 2005 2010 2015
0
20
40
60
19902000
2013
2019
14
1990 1995 2000 2005 2010 2015
0
5
10
15
20
1990
2000
2013
66
48
36
MDG Target: 17
1990 1995 2000 2005 2010 2015
0
20
40
60
1996
2002
2006
39.5
25.3
19.6
1994 1996 1998 2000 2002 2004 2006 2008
0
10
20
30
40
Summary
Demographic Data
Uzbekistan
Total population (’000) Total under-5 population (’000)28 934 2 941
623 49
Reproductive Health and Health Systems Data
Health Coverage Indicators
Demand for familyplanning satisfied
15%
Laws/regulations that allow adolescents access to contraceptives YES
Legal status of abortion(x of 5 circumstances) 5/5
National AverageBottom Quintile Top Quintile
per 1000 live births per 100 000 live births
per 1000 live births % of children under 5 who are moderately or severely stunted
0 20 40 60 80 100
89.3%
0 20 40 60 80 100
No data
0 20 40 60 80 100
88.3%
144.720
10
20
30
40 50 60
70
80
90
100
Min Density Threshold
0 20 40 60 80 100
99.9%
0 20 40 60 80 100
No data
0 20 40 60 80 100
26.7%
0 20 40 60 80 100
93.2%
0 20 40 60 80 100
67.7%
Total births (’000) Adolescent birth rate (per 1000 girls)
Coverage levels are shown for the poorest 20% (red) and the richest 20% (orange). The longer the line between the two groups, the greater the absolute inequality. National average coverage across all quintiles is also shown (blue).
Density of doctors, nurses, and midwives per 10 000 population
Postnatal care coverage Exclusive breastfeeding DTP3 coverage Pneumonia care seeking
Met need for contraception Antenatal care coverage (4 visits)Prevention of mother to child transmission of HIV
Skilled attendant at birth
Under-5 mortality rate Maternal mortality rate
Neonatal mortality rate Stunting
The data presented in this country profile have been collated from publicly available sources.
• Global Health Observatory (http://www.who.int/gho/en/): Total population, Total births, Density of doctors, nurses and midwives, Maternal mortality ratio, Under-5 mortality rate, Neonatal mortality rate, Met need for contraception, Demand for family planning satisfied, Antenatal care coverage, Prevention of mother to child transmission of HIV (Antiretroviral prophylaxis for PMTCT), Skilled attendant at birth, Exclusive breastfeeding (for six months), DTP3 coverage, Total health expenditure per capita.
• 2015 Progress report on implementing the Commission on Information and Accountability Recommendations: Birth registration, Death registration, MDSR, CRVS, National eHealth strategy, Total health expenditureper capita tracked by financing source, Country conducted annual health sector review, Health sector performance report available in the public domain.
• Countdown to 2015: MDG targets for MMR and U5MR, Postnatal care coverage, Pneumonia care seeking (antibiotic treatment for pneumonia), Quintile data for all 8 health coverage indicators.
• System of Health Accounts 2011: Total RMNCH expenditure per capita, expenditure tracked by financing source, Total annual RMNCH expenditure.
• The remaining indicators were taken from various sources (in brackets): Mutual assessment of progress exists (IHP+Results, 2014); Legal status of abortion, Under-5 population (UN Population Division);Adolescent birth rate (per 1000 girls) (UN Population Division); Stunting (data.unicef.org); Laws/regulations that allow adolescents access to contraceptives (WHO MNCAH Key Informant Policy Questionnaire).
2015 | Country Overview
244 Achievements and Prospects
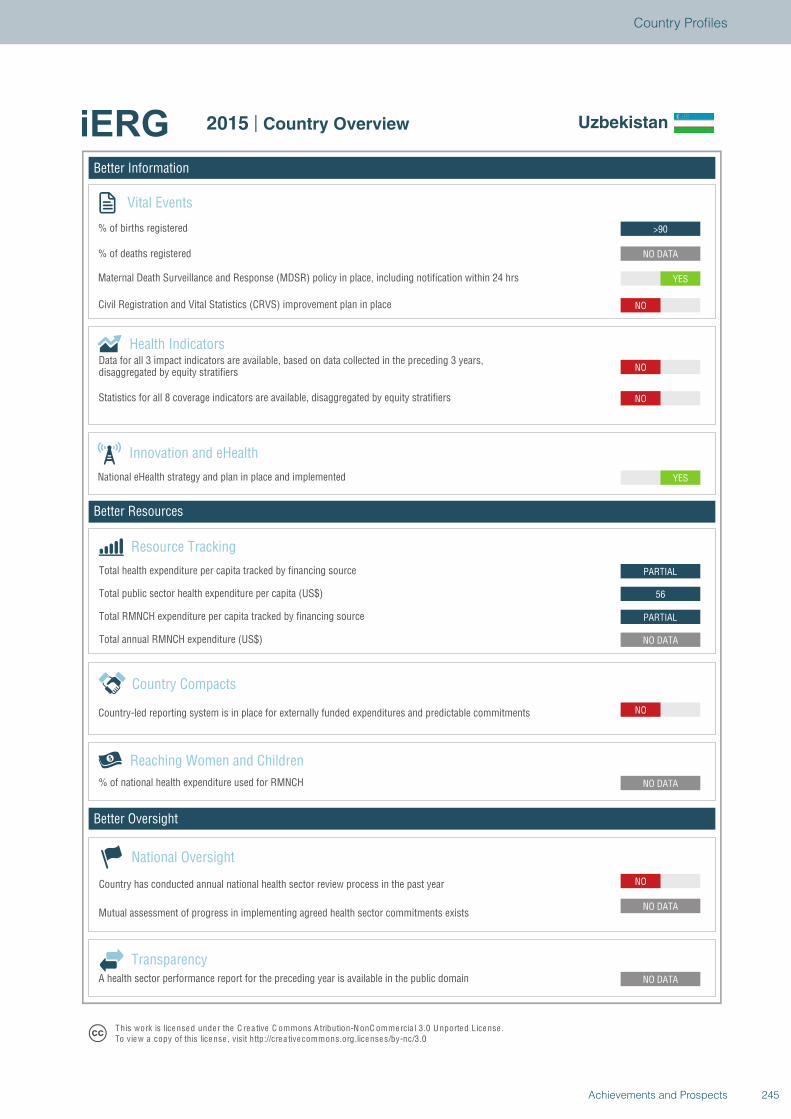
Better Information
Better Resources
Better Oversight
Uzbekistan
Vital Events
% of births registered
% of deaths registered
Innovation and eHealth
National eHealth strategy and plan in place and implemented
Health Indicators
Statistics for all 8 coverage indicators are available, disaggregated by equity stratifiers
Reaching Women and Children
Country Compacts
Country-led reporting system is in place for externally funded expenditures and predictable commitments
Resource Tracking
Total RMNCH expenditure per capita tracked by financing source
Total annual RMNCH expenditure (US$)
Total health expenditure per capita tracked by financing source
% of national health expenditure used for RMNCH
NO
NO DATA
NO DATA
NO DATA
NO
NO DATA
PARTIAL
56
PARTIAL
YES
NO
NO
NO
YES
NO DATA
>90
National Oversight
Mutual assessment of progress in implementing agreed health sector commitments exists
Country has conducted annual national health sector review process in the past year
TransparencyA health sector performance report for the preceding year is available in the public domain
T his work is lice nse d unde r the C re a tive C ommons A tribution-N onC ommercia l 3.0 U nported License .To view a copy of this license , visit http://cre a tive commons.org.licenses/by-nc/3.0
2015 | Country Overview Uzbekistan
Total public sector health expenditure per capita (US$)
Maternal Death Surveillance and Response (MDSR) policy in place, including notification within 24 hrs
Civil Registration and Vital Statistics (CRVS) improvement plan in place
Data for all 3 impact indicators are available, based on data collected in the preceding 3 years,disaggregated by equity stratifiers
245Achievements and Prospects
Country Profiles

1990
2000
2013
51
35
24
MDG Target: 17
1990 1995 2000 2005 2010 2015
0
20
40
1990
2000
2013
23
17
13
1990 1995 2000 2005 2010 2015
0
5
10
15
20
25
1990
2000
2013
140
82
49
MDG Target: 35
1990 1995 2000 2005 2010 2015
0
50
100
150
1988
2000
2011
61.3
43.4
23.3
1990 1995 2000 2005 2010
0
20
40
60
Summary
Demographic Data
Viet Nam
Total population (’000) Total under-5 population (’000)91 680 7 083
1 440 32
Reproductive Health and Health Systems Data
Health Coverage Indicators
Demand for familyplanning satisfied
15%
Laws/regulations that allow adolescents access to contraceptives YES
Legal status of abortion(x of 5 circumstances) 5/5
National AverageBottom Quintile Top Quintile
per 1000 live births per 100 000 live births
per 1000 live births % of children under 5 who are moderately or severely stunted
0 20 40 60 80 100
95.5%
0 20 40 60 80 100
59.6%
0 20 40 60 80 100
65.3%
24.260
10
20
30
40 50 60
70
80
90
100
Min Density Threshold
0 20 40 60 80 100
92.9%
0 20 40 60 80 100
No data
0 20 40 60 80 100
16.6%
0 20 40 60 80 100
73.9%
0 20 40 60 80 100
73%
Total births (’000) Adolescent birth rate (per 1000 girls)
Coverage levels are shown for the poorest 20% (red) and the richest 20% (orange). The longer the line between the two groups, the greater the absolute inequality. National average coverage across all quintiles is also shown (blue).
Density of doctors, nurses, and midwives per 10 000 population
Postnatal care coverage Exclusive breastfeeding DTP3 coverage Pneumonia care seeking
Met need for contraception Antenatal care coverage (4 visits)Prevention of mother to child transmission of HIV
Skilled attendant at birth
Under-5 mortality rate Maternal mortality rate
Neonatal mortality rate Stunting
The data presented in this country profile have been collated from publicly available sources.
• Global Health Observatory (http://www.who.int/gho/en/): Total population, Total births, Density of doctors, nurses and midwives, Maternal mortality ratio, Under-5 mortality rate, Neonatal mortality rate, Met need for contraception, Demand for family planning satisfied, Antenatal care coverage, Prevention of mother to child transmission of HIV (Antiretroviral prophylaxis for PMTCT), Skilled attendant at birth, Exclusive breastfeeding (for six months), DTP3 coverage, Total health expenditure per capita.
• 2015 Progress report on implementing the Commission on Information and Accountability Recommendations: Birth registration, Death registration, MDSR, CRVS, National eHealth strategy, Total health expenditureper capita tracked by financing source, Country conducted annual health sector review, Health sector performance report available in the public domain.
• Countdown to 2015: MDG targets for MMR and U5MR, Postnatal care coverage, Pneumonia care seeking (antibiotic treatment for pneumonia), Quintile data for all 8 health coverage indicators.
• System of Health Accounts 2011: Total RMNCH expenditure per capita, expenditure tracked by financing source, Total annual RMNCH expenditure.
• The remaining indicators were taken from various sources (in brackets): Mutual assessment of progress exists (IHP+Results, 2014); Legal status of abortion, Under-5 population (UN Population Division);Adolescent birth rate (per 1000 girls) (UN Population Division); Stunting (data.unicef.org); Laws/regulations that allow adolescents access to contraceptives (WHO MNCAH Key Informant Policy Questionnaire).
2015 | Country Overview
246 Achievements and Prospects
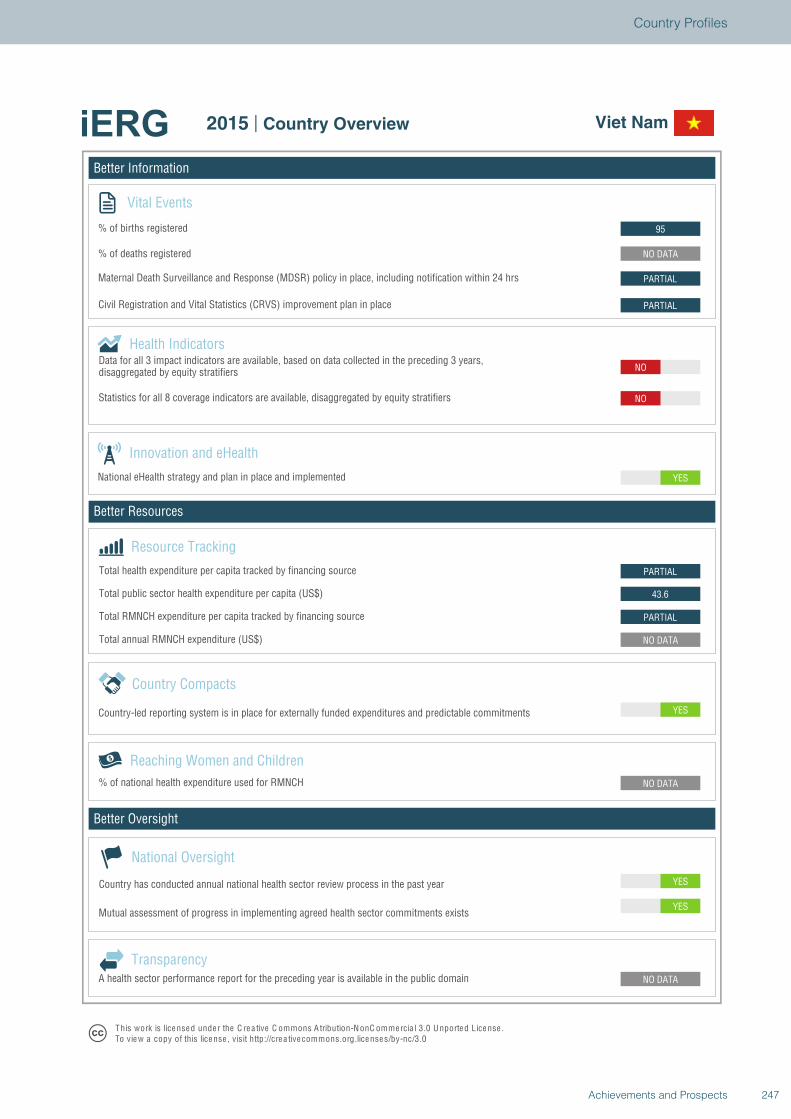
Better Information
Better Resources
Better Oversight
Viet Nam
Vital Events
% of births registered
% of deaths registered
Innovation and eHealth
National eHealth strategy and plan in place and implemented
Health Indicators
Statistics for all 8 coverage indicators are available, disaggregated by equity stratifiers
Reaching Women and Children
Country Compacts
Country-led reporting system is in place for externally funded expenditures and predictable commitments
Resource Tracking
Total RMNCH expenditure per capita tracked by financing source
Total annual RMNCH expenditure (US$)
Total health expenditure per capita tracked by financing source
% of national health expenditure used for RMNCH
YES
YES
NO DATA
NO DATA
YES
NO DATA
PARTIAL
43.6
PARTIAL
YES
NO
NO
PARTIAL
PARTIAL
NO DATA
95
National Oversight
Mutual assessment of progress in implementing agreed health sector commitments exists
Country has conducted annual national health sector review process in the past year
TransparencyA health sector performance report for the preceding year is available in the public domain
T his work is lice nse d unde r the C re a tive C ommons A tribution-N onC ommercia l 3.0 U nported License .To view a copy of this license , visit http://cre a tive commons.org.licenses/by-nc/3.0
2015 | Country Overview Viet Nam
Total public sector health expenditure per capita (US$)
Maternal Death Surveillance and Response (MDSR) policy in place, including notification within 24 hrs
Civil Registration and Vital Statistics (CRVS) improvement plan in place
Data for all 3 impact indicators are available, based on data collected in the preceding 3 years,disaggregated by equity stratifiers
247Achievements and Prospects
Country Profiles
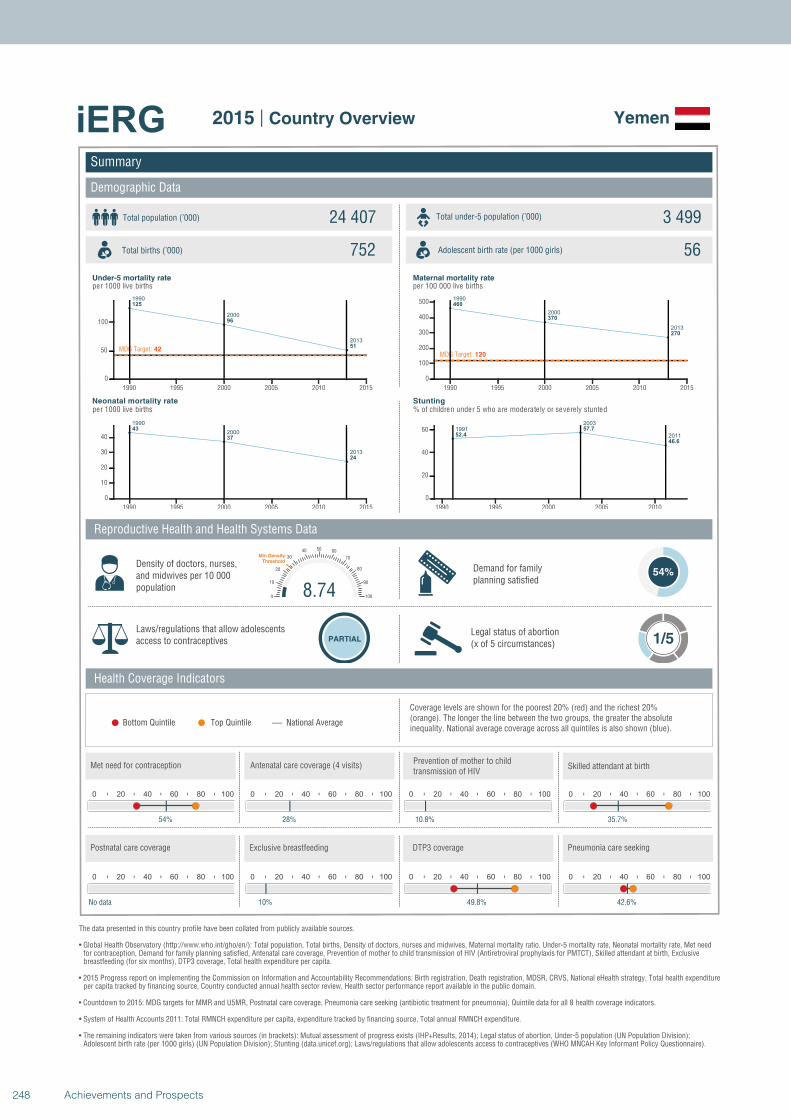
1990
2000
2013
125
96
51MDG Target: 42
1990 1995 2000 2005 2010 2015
0
50
100
1990
2000
2013
43
37
24
1990 1995 2000 2005 2010 2015
0
10
20
30
40
1990
2000
2013
460
370
270
MDG Target: 120
1990 1995 2000 2005 2010 2015
0
100
200
300
400
500
1991
2003
201152.4
57.7
46.6
1990 1995 2000 2005 2010
0
20
40
60
Summary
Demographic Data
Yemen
Total population (’000) Total under-5 population (’000)24 407 3 499
752 56
Reproductive Health and Health Systems Data
Health Coverage Indicators
Demand for familyplanning satisfied
54%
Laws/regulations that allow adolescents access to contraceptives PARTIAL
Legal status of abortion(x of 5 circumstances) 1/5
National AverageBottom Quintile Top Quintile
per 1000 live births per 100 000 live births
per 1000 live births % of children under 5 who are moderately or severely stunted
0 20 40 60 80 100
54%
0 20 40 60 80 100
28%
0 20 40 60 80 100
10.8%
8.740
10
20
30
40 50 60
70
80
90
100
Min Density Threshold
0 20 40 60 80 100
35.7%
0 20 40 60 80 100
No data
0 20 40 60 80 100
10%
0 20 40 60 80 100
49.8%
0 20 40 60 80 100
42.6%
Total births (’000) Adolescent birth rate (per 1000 girls)
Coverage levels are shown for the poorest 20% (red) and the richest 20% (orange). The longer the line between the two groups, the greater the absolute inequality. National average coverage across all quintiles is also shown (blue).
Density of doctors, nurses, and midwives per 10 000 population
Postnatal care coverage Exclusive breastfeeding DTP3 coverage Pneumonia care seeking
Met need for contraception Antenatal care coverage (4 visits)Prevention of mother to child transmission of HIV
Skilled attendant at birth
Under-5 mortality rate Maternal mortality rate
Neonatal mortality rate Stunting
The data presented in this country profile have been collated from publicly available sources.
• Global Health Observatory (http://www.who.int/gho/en/): Total population, Total births, Density of doctors, nurses and midwives, Maternal mortality ratio, Under-5 mortality rate, Neonatal mortality rate, Met need for contraception, Demand for family planning satisfied, Antenatal care coverage, Prevention of mother to child transmission of HIV (Antiretroviral prophylaxis for PMTCT), Skilled attendant at birth, Exclusive breastfeeding (for six months), DTP3 coverage, Total health expenditure per capita.
• 2015 Progress report on implementing the Commission on Information and Accountability Recommendations: Birth registration, Death registration, MDSR, CRVS, National eHealth strategy, Total health expenditureper capita tracked by financing source, Country conducted annual health sector review, Health sector performance report available in the public domain.
• Countdown to 2015: MDG targets for MMR and U5MR, Postnatal care coverage, Pneumonia care seeking (antibiotic treatment for pneumonia), Quintile data for all 8 health coverage indicators.
• System of Health Accounts 2011: Total RMNCH expenditure per capita, expenditure tracked by financing source, Total annual RMNCH expenditure.
• The remaining indicators were taken from various sources (in brackets): Mutual assessment of progress exists (IHP+Results, 2014); Legal status of abortion, Under-5 population (UN Population Division);Adolescent birth rate (per 1000 girls) (UN Population Division); Stunting (data.unicef.org); Laws/regulations that allow adolescents access to contraceptives (WHO MNCAH Key Informant Policy Questionnaire).
2015 | Country Overview
248 Achievements and Prospects
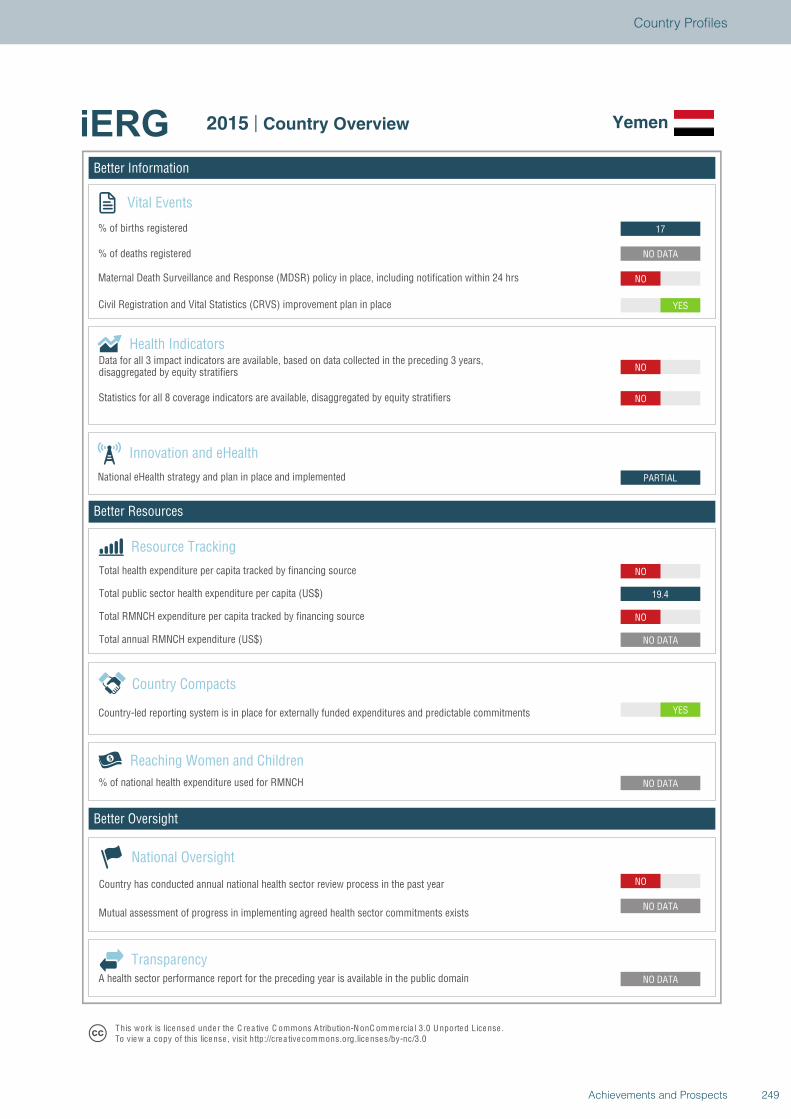
Better Information
Better Resources
Better Oversight
Yemen
Vital Events
% of births registered
% of deaths registered
Innovation and eHealth
National eHealth strategy and plan in place and implemented
Health Indicators
Statistics for all 8 coverage indicators are available, disaggregated by equity stratifiers
Reaching Women and Children
Country Compacts
Country-led reporting system is in place for externally funded expenditures and predictable commitments
Resource Tracking
Total RMNCH expenditure per capita tracked by financing source
Total annual RMNCH expenditure (US$)
Total health expenditure per capita tracked by financing source
% of national health expenditure used for RMNCH
NO
NO DATA
NO DATA
NO DATA
YES
NO DATA
NO
19.4
NO
PARTIAL
NO
NO
YES
NO
NO DATA
17
National Oversight
Mutual assessment of progress in implementing agreed health sector commitments exists
Country has conducted annual national health sector review process in the past year
TransparencyA health sector performance report for the preceding year is available in the public domain
T his work is lice nse d unde r the C re a tive C ommons A tribution-N onC ommercia l 3.0 U nported License .To view a copy of this license , visit http://cre a tive commons.org.licenses/by-nc/3.0
2015 | Country Overview Yemen
Total public sector health expenditure per capita (US$)
Maternal Death Surveillance and Response (MDSR) policy in place, including notification within 24 hrs
Civil Registration and Vital Statistics (CRVS) improvement plan in place
Data for all 3 impact indicators are available, based on data collected in the preceding 3 years,disaggregated by equity stratifiers
249Achievements and Prospects
Country Profiles
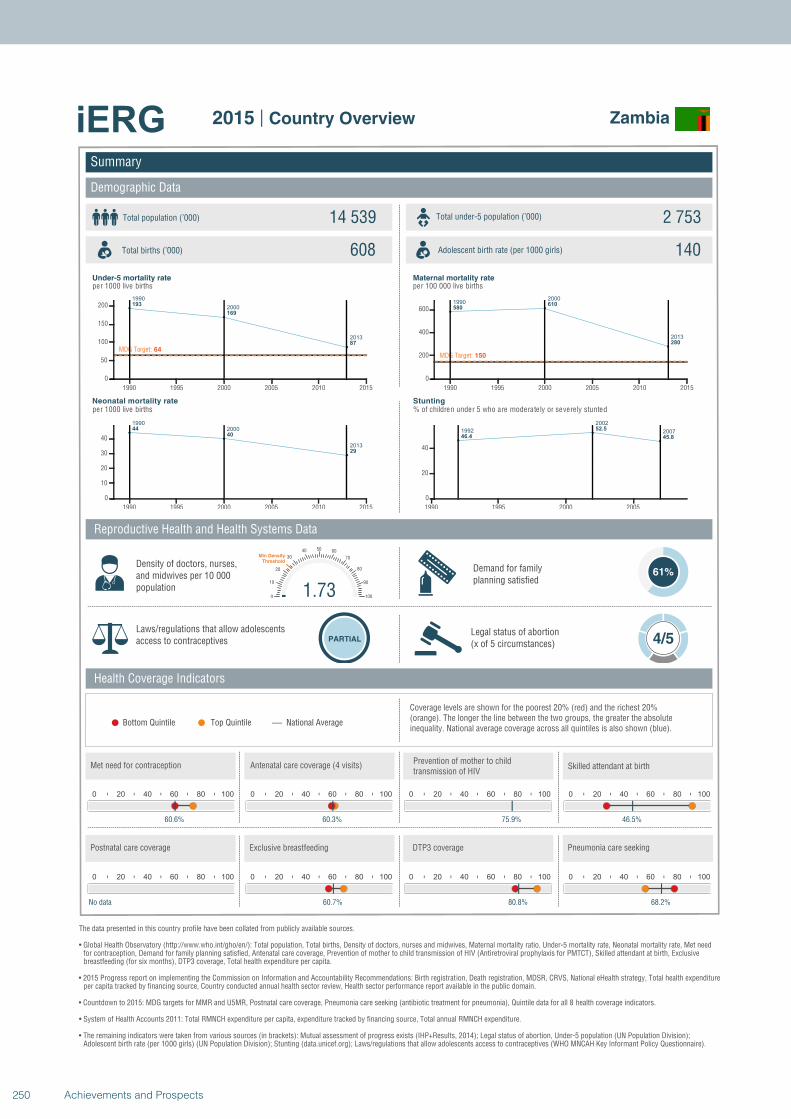
1990
2000
2013
193
169
87
MDG Target: 64
1990 1995 2000 2005 2010 2015
0
50
100
150
200
1990
2000
2013
44
40
29
1990 1995 2000 2005 2010 2015
0
10
20
30
40
19902000
2013
580610
280
MDG Target: 150
1990 1995 2000 2005 2010 2015
0
200
400
600
1992
2002
200746.4
52.5
45.8
1990 1995 2000 2005
0
20
40
Summary
Demographic Data
Zambia
Total population (’000) Total under-5 population (’000)14 539 2 753
608 140
Reproductive Health and Health Systems Data
Health Coverage Indicators
Demand for familyplanning satisfied
61%
Laws/regulations that allow adolescents access to contraceptives PARTIAL
Legal status of abortion(x of 5 circumstances) 4/5
National AverageBottom Quintile Top Quintile
per 1000 live births per 100 000 live births
per 1000 live births % of children under 5 who are moderately or severely stunted
0 20 40 60 80 100
60.6%
0 20 40 60 80 100
60.3%
0 20 40 60 80 100
75.9%
1.730
10
20
30
40 50 60
70
80
90
100
Min Density Threshold
0 20 40 60 80 100
46.5%
0 20 40 60 80 100
No data
0 20 40 60 80 100
60.7%
0 20 40 60 80 100
80.8%
0 20 40 60 80 100
68.2%
Total births (’000) Adolescent birth rate (per 1000 girls)
Coverage levels are shown for the poorest 20% (red) and the richest 20% (orange). The longer the line between the two groups, the greater the absolute inequality. National average coverage across all quintiles is also shown (blue).
Density of doctors, nurses, and midwives per 10 000 population
Postnatal care coverage Exclusive breastfeeding DTP3 coverage Pneumonia care seeking
Met need for contraception Antenatal care coverage (4 visits)Prevention of mother to child transmission of HIV
Skilled attendant at birth
Under-5 mortality rate Maternal mortality rate
Neonatal mortality rate Stunting
The data presented in this country profile have been collated from publicly available sources.
• Global Health Observatory (http://www.who.int/gho/en/): Total population, Total births, Density of doctors, nurses and midwives, Maternal mortality ratio, Under-5 mortality rate, Neonatal mortality rate, Met need for contraception, Demand for family planning satisfied, Antenatal care coverage, Prevention of mother to child transmission of HIV (Antiretroviral prophylaxis for PMTCT), Skilled attendant at birth, Exclusive breastfeeding (for six months), DTP3 coverage, Total health expenditure per capita.
• 2015 Progress report on implementing the Commission on Information and Accountability Recommendations: Birth registration, Death registration, MDSR, CRVS, National eHealth strategy, Total health expenditureper capita tracked by financing source, Country conducted annual health sector review, Health sector performance report available in the public domain.
• Countdown to 2015: MDG targets for MMR and U5MR, Postnatal care coverage, Pneumonia care seeking (antibiotic treatment for pneumonia), Quintile data for all 8 health coverage indicators.
• System of Health Accounts 2011: Total RMNCH expenditure per capita, expenditure tracked by financing source, Total annual RMNCH expenditure.
• The remaining indicators were taken from various sources (in brackets): Mutual assessment of progress exists (IHP+Results, 2014); Legal status of abortion, Under-5 population (UN Population Division);Adolescent birth rate (per 1000 girls) (UN Population Division); Stunting (data.unicef.org); Laws/regulations that allow adolescents access to contraceptives (WHO MNCAH Key Informant Policy Questionnaire).
2015 | Country Overview
250 Achievements and Prospects
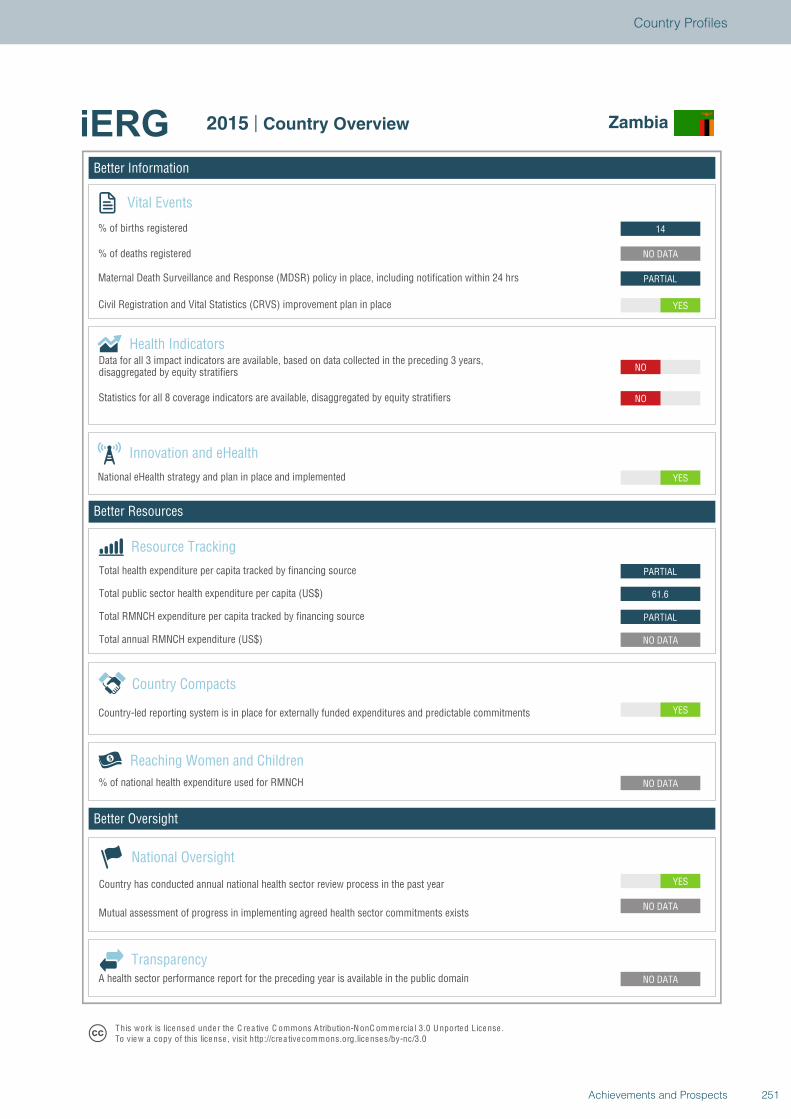
Better Information
Better Resources
Better Oversight
Zambia
Vital Events
% of births registered
% of deaths registered
Innovation and eHealth
National eHealth strategy and plan in place and implemented
Health Indicators
Statistics for all 8 coverage indicators are available, disaggregated by equity stratifiers
Reaching Women and Children
Country Compacts
Country-led reporting system is in place for externally funded expenditures and predictable commitments
Resource Tracking
Total RMNCH expenditure per capita tracked by financing source
Total annual RMNCH expenditure (US$)
Total health expenditure per capita tracked by financing source
% of national health expenditure used for RMNCH
YES
NO DATA
NO DATA
NO DATA
YES
NO DATA
PARTIAL
61.6
PARTIAL
YES
NO
NO
YES
PARTIAL
NO DATA
14
National Oversight
Mutual assessment of progress in implementing agreed health sector commitments exists
Country has conducted annual national health sector review process in the past year
TransparencyA health sector performance report for the preceding year is available in the public domain
T his work is lice nse d unde r the C re a tive C ommons A tribution-N onC ommercia l 3.0 U nported License .To view a copy of this license , visit http://cre a tive commons.org.licenses/by-nc/3.0
2015 | Country Overview Zambia
Total public sector health expenditure per capita (US$)
Maternal Death Surveillance and Response (MDSR) policy in place, including notification within 24 hrs
Civil Registration and Vital Statistics (CRVS) improvement plan in place
Data for all 3 impact indicators are available, based on data collected in the preceding 3 years,disaggregated by equity stratifiers
251Achievements and Prospects
Country Profiles

1990
2000
2013
74.6
102.6
88.5
MDG Target: 25
1990 1995 2000 2005 2010 2015
0
20
40
60
80
100
19902000
2013
3129.1
39.2
1990 1995 2000 2005 2010 2015
0
10
20
30
40
1990
2000
2013520
680
470
MDG Target: 130
1990 1995 2000 2005 2010 2015
0
200
400
600
1988
19992010
31
33.732.3
1990 1995 2000 2005 2010
0
10
20
30
Summary
Demographic Data
Zimbabwe
Total population (’000) Total under-5 population (’000)14 150 2 080
439 73
Reproductive Health and Health Systems Data
Health Coverage Indicators
Demand for familyplanning satisfied
80%
Laws/regulations that allow adolescents access to contraceptives NO
Legal status of abortion(x of 5 circumstances) 2/5
National AverageBottom Quintile Top Quintile
per 1000 live births per 100 000 live births
per 1000 live births % of children under 5 who are moderately or severely stunted
0 20 40 60 80 100
80.1%
0 20 40 60 80 100
64.8%
0 20 40 60 80 100
78%
14.180
10
20
30
40 50 60
70
80
90
100
Min Density Threshold
0 20 40 60 80 100
66.2%
0 20 40 60 80 100
11.8%
0 20 40 60 80 100
31.3%
0 20 40 60 80 100
73.6%
0 20 40 60 80 100
48%
Total births (’000) Adolescent birth rate (per 1000 girls)
Coverage levels are shown for the poorest 20% (red) and the richest 20% (orange). The longer the line between the two groups, the greater the absolute inequality. National average coverage across all quintiles is also shown (blue).
Density of doctors, nurses, and midwives per 10 000 population
Postnatal care coverage Exclusive breastfeeding DTP3 coverage Pneumonia care seeking
Met need for contraception Antenatal care coverage (4 visits)Prevention of mother to child transmission of HIV
Skilled attendant at birth
Under-5 mortality rate Maternal mortality rate
Neonatal mortality rate Stunting
The data presented in this country profile have been collated from publicly available sources.
• Global Health Observatory (http://www.who.int/gho/en/): Total population, Total births, Density of doctors, nurses and midwives, Maternal mortality ratio, Under-5 mortality rate, Neonatal mortality rate, Met need for contraception, Demand for family planning satisfied, Antenatal care coverage, Prevention of mother to child transmission of HIV (Antiretroviral prophylaxis for PMTCT), Skilled attendant at birth, Exclusive breastfeeding (for six months), DTP3 coverage, Total health expenditure per capita.
• 2015 Progress report on implementing the Commission on Information and Accountability Recommendations: Birth registration, Death registration, MDSR, CRVS, National eHealth strategy, Total health expenditureper capita tracked by financing source, Country conducted annual health sector review, Health sector performance report available in the public domain.
• Countdown to 2015: MDG targets for MMR and U5MR, Postnatal care coverage, Pneumonia care seeking (antibiotic treatment for pneumonia), Quintile data for all 8 health coverage indicators.
• System of Health Accounts 2011: Total RMNCH expenditure per capita, expenditure tracked by financing source, Total annual RMNCH expenditure.
• The remaining indicators were taken from various sources (in brackets): Mutual assessment of progress exists (IHP+Results, 2014); Legal status of abortion, Under-5 population (UN Population Division);Adolescent birth rate (per 1000 girls) (UN Population Division); Stunting (data.unicef.org); Laws/regulations that allow adolescents access to contraceptives (WHO MNCAH Key Informant Policy Questionnaire).
2015 | Country Overview
252 Achievements and Prospects
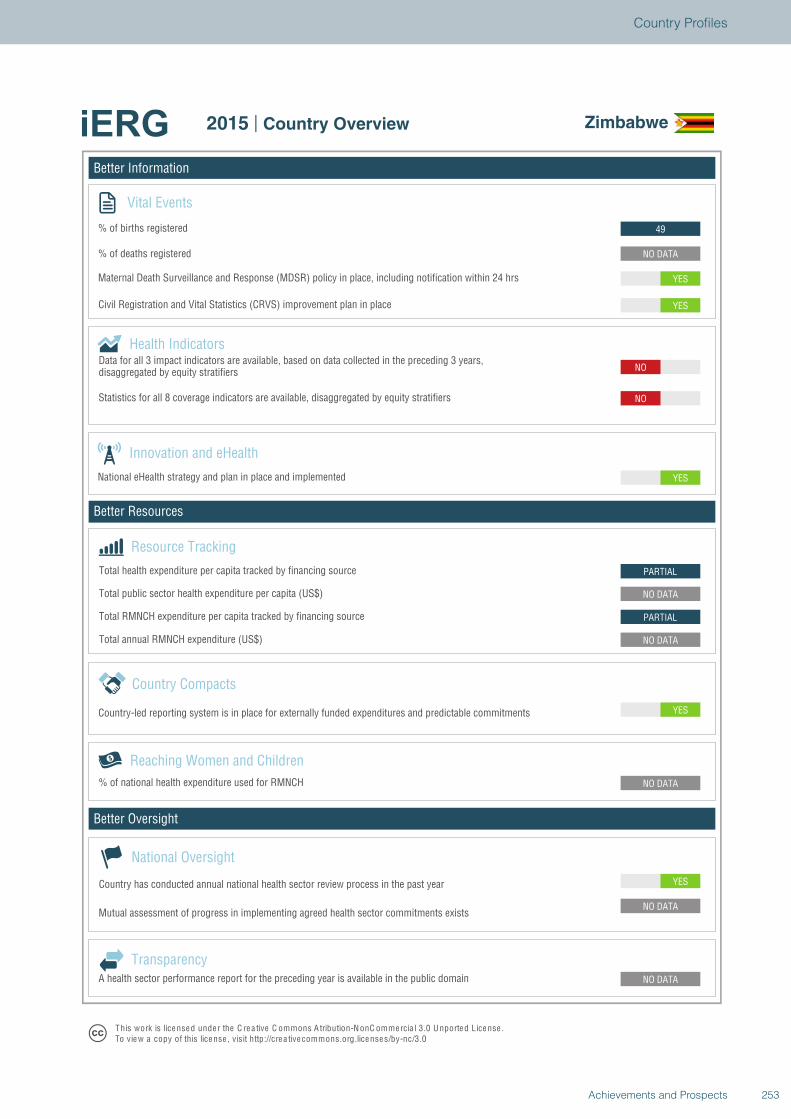
Better Information
Better Resources
Better Oversight
Zimbabwe
Vital Events
% of births registered
% of deaths registered
Innovation and eHealth
National eHealth strategy and plan in place and implemented
Health Indicators
Statistics for all 8 coverage indicators are available, disaggregated by equity stratifiers
Reaching Women and Children
Country Compacts
Country-led reporting system is in place for externally funded expenditures and predictable commitments
Resource Tracking
Total RMNCH expenditure per capita tracked by financing source
Total annual RMNCH expenditure (US$)
Total health expenditure per capita tracked by financing source
% of national health expenditure used for RMNCH
YES
NO DATA
NO DATA
NO DATA
YES
NO DATA
PARTIAL
NO DATA
PARTIAL
YES
NO
NO
YES
YES
NO DATA
49
National Oversight
Mutual assessment of progress in implementing agreed health sector commitments exists
Country has conducted annual national health sector review process in the past year
TransparencyA health sector performance report for the preceding year is available in the public domain
T his work is lice nse d unde r the C re a tive C ommons A tribution-N onC ommercia l 3.0 U nported License .To view a copy of this license , visit http://cre a tive commons.org.licenses/by-nc/3.0
2015 | Country Overview Zimbabwe
Total public sector health expenditure per capita (US$)
Maternal Death Surveillance and Response (MDSR) policy in place, including notification within 24 hrs
Civil Registration and Vital Statistics (CRVS) improvement plan in place
Data for all 3 impact indicators are available, based on data collected in the preceding 3 years,disaggregated by equity stratifiers
253Achievements and Prospects
Country Profiles

254 Achievements and Prospects

DONOR PROFILES
255Achievements and Prospects
iERG DONOR PROFILE: MEASURING PROGRESS ON ACCOUNTABILITY
The iERG donor profile presents a snapshot picture of a donor’s financial and policy commitments to women’s and children’s health. The profile consists of one page which presents the financial expenditure for Official Development Assistance (ODA) and percent of GPD spent on ODA with trends over time; similar charts are presented for health ODA including as a percent of overall ODA, and for RMNCH expenditure. It also presents data, where available and relevant, for the proportion of resources that flows through intermediaries; on the transparency of each donor; and on the major pledges made for women’s and children’s health. The information is intended to help policy makers and their partners assess progress and prioritise further actions to save women’s and children’s lives.
Most of the data come from OECD datasets (OECD.Stat). Data on RMNCH expenditure is taken from Arregoces et al, Countdown to 2015: changes in official development assistance to reproductive, maternal, newborn, and child health, and assessment of progress between 2003 and 2012; The Lancet Global Health. Data on transparency come from the International Aid Transparency Index 2013 and 2014 (http://ati.publishwhatyoufund.org/); and information on major pledges comes from the Every Woman Every Child commitments database (http://www.everywomaneverychild.org/commitments/all-commitments).
Profiles are presented for 15 donors with strong commitments to women’s and children’s health.
AustraliaBill & Melinda Gates FoundationCanadaFranceGAVI Alliance
GermanyGlobal FundItalyJapanNorway
Russian Federation SwedenUnited KingdomUnited StatesWorld Bank
256 Achievements and Prospects
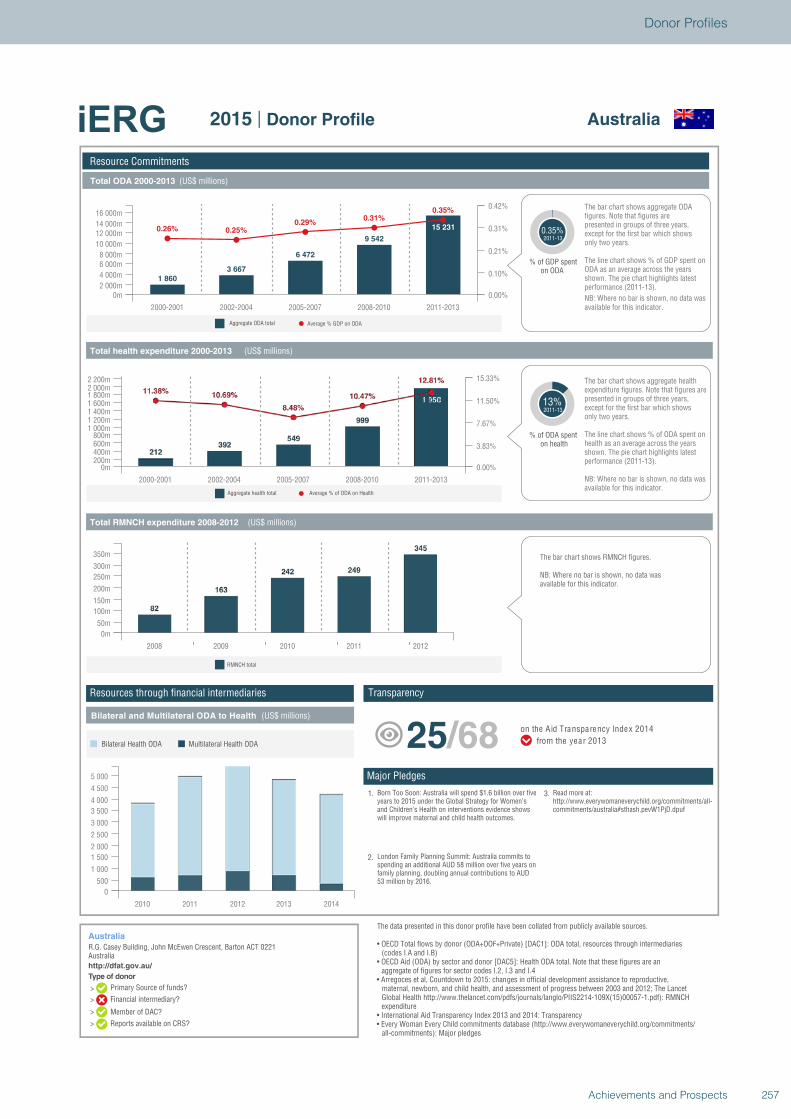
Type of donor
>
>
>
>
Total ODA 2000-2013 (US$ millions)
Total health expenditure 2000-2013 (US$ millions)
Total RMNCH expenditure 2008-2012 (US$ millions)
Bilateral and Multilateral ODA to Health (US$ millions)
Average % GDP on ODAAggregate ODA total
Average % of ODA on HealthAggregate health total
Resource Commitments
Australia
R.G. Casey Building, John McEwen Crescent, Barton ACT 0221Australiahttp://dfat.gov.au/
Australia2015 | Donor Profile
1 860
3 667
6 472
9 542
15 2310.26% 0.25%0.29%
0.31%0.35%
2000-2001 2002-2004 2005-2007 2008-2010 2011-2013
0m2 000m
4 000m
6 000m8 000m
10 000m
12 000m14 000m
16 000m
0.00%
0.10%
0.21%
0.31%
0.42%
% of GDP spenton ODA
0.35%2011-13
only two years.except for the first bar which shows presented in groups of three years, figures. Note that figures are The bar chart shows aggregate ODA
ODA as an average across the years shown. The pie chart highlights latest performance (2011-13).
The line chart shows % of GDP spent on
NB: Where no bar is shown, no data wasavailable for this indicator.
13%2011-13
% of ODA spenton health
The bar chart shows aggregate health expenditure figures. Note that figures arepresented in groups of three years,except for the first bar which showsonly two years.
The line chart shows % of ODA spent on health as an average across the years shown. The pie chart highlights latest performance (2011-13).
NB: Where no bar is shown, no data wasavailable for this indicator.
2000-2001 2002-2004 2005-2007 2008-2010 2011-2013
0m200m400m600m800m
1 000m1 200m1 400m1 600m1 800m2 000m2 200m
0.00%
3.83%
7.67%
11.50%
15.33%
2008 2009 2010 2011 2012
0m
50m
100m
150m
200m
250m
300m
350m
RMNCH total
The bar chart shows RMNCH figures.
NB: Where no bar is shown, no data wasavailable for this indicator.
2010 2011 2012 2013 2014
0
500
1 000
1 500
2 000
2 500
3 000
3 500
4 000
4 500
5 000
Multilateral Health ODABilateral Health ODA
1. Born Too Soon: Australia will spend $1.6 billion over fiveyears to 2015 under the Global Strategy for Women’sand Children’s Health on interventions evidence showswill improve maternal and child health outcomes.
2. London Family Planning Summit: Australia commits tospending an additional AUD 58 million over five years onfamily planning, doubling annual contributions to AUD53 million by 2016.
3. Read more at:http://www.everywomaneverychild.org/commitments/all-commitments/australia#sthash.pevW1PjD.dpuf
25/68 on the Aid Transparency Index 2014
from the year 2013
The data presented in this donor profile have been collated from publicly available sources.
• OECD Total flows by donor (ODA+OOF+Private) [DAC1]: ODA total, resources through intermediaries (codes I.A and I.B)
• OECD Aid (ODA) by sector and donor [DAC5]: Health ODA total. Note that these figures are an aggregate of figures for sector codes I.2, I.3 and I.4
• Arregoces et al, Countdown to 2015: changes in official development assistance to reproductive, maternal, newborn, and child health, and assessment of progress between 2003 and 2012; The Lancet Global Health http://www.thelancet.com/pdfs/journals/langlo/PIIS2214-109X(15)00057-1.pdf): RMNCH expenditure
• International Aid Transparency Index 2013 and 2014: Transparency• Every Woman Every Child commitments database (http://www.everywomaneverychild.org/commitments/
all-commitments): Major pledges
TransparencyResources through financial intermediaries
Major Pledges
Primary Source of funds?
Financial intermediary?
Member of DAC?
Reports available on CRS?
257Achievements and Prospects
Donor Profiles
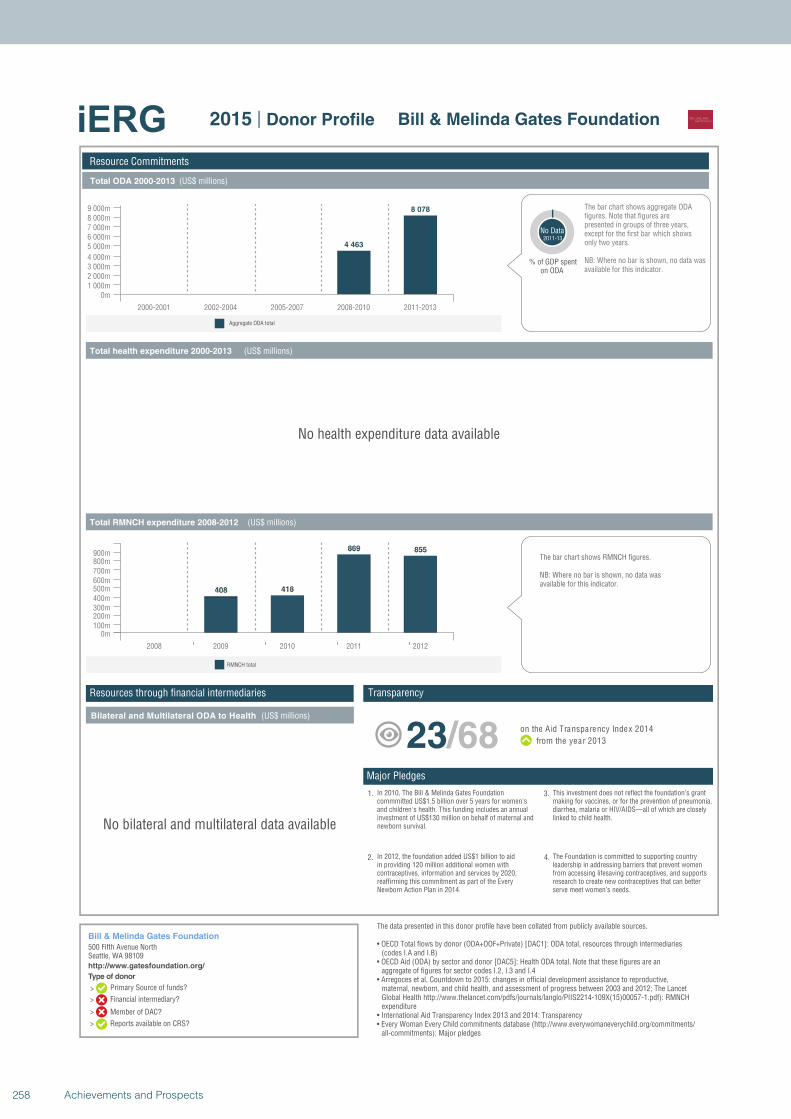
Type of donor
>
>
>
>
Total ODA 2000-2013 (US$ millions)
Total health expenditure 2000-2013 (US$ millions)
Total RMNCH expenditure 2008-2012 (US$ millions)
Bilateral and Multilateral ODA to Health (US$ millions)
Aggregate ODA total
Resource Commitments
Bill & Melinda Gates Foundation
500 Fifth Avenue NorthSeattle, WA 98109http://www.gatesfoundation.org/
Bill & Melinda Gates Foundation2015 | Donor Profile
4 463
8 078
2000-2001 2002-2004 2005-2007 2008-2010 2011-2013
0m1 000m2 000m3 000m4 000m
5 000m6 000m7 000m8 000m9 000m
% of GDP spenton ODA
No Data2011-13
only two years.except for the first bar which shows presented in groups of three years, figures. Note that figures are The bar chart shows aggregate ODA
NB: Where no bar is shown, no data wasavailable for this indicator.
No health expenditure data available
2008 2009 2010 2011 2012
0m100m200m300m400m500m600m700m800m900m
RMNCH total
The bar chart shows RMNCH figures.
NB: Where no bar is shown, no data wasavailable for this indicator.
No bilateral and multilateral data available
1. In 2010, The Bill & Melinda Gates Foundationcommmitted US$1.5 billion over 5 years for women'sand children's health. This funding includes an annualinvestment of US$130 million on behalf of maternal andnewborn survival.
2. In 2012, the foundation added US$1 billion to aidin providing 120 million additional women withcontraceptives, information and services by 2020,reaffirming this commitment as part of the EveryNewborn Action Plan in 2014.
4. The Foundation is committed to supporting countryleadership in addressing barriers that prevent womenfrom accessing lifesaving contraceptives, and supportsresearch to create new contraceptives that can betterserve meet women’s needs.
3. This investment does not reflect the foundation’s grantmaking for vaccines, or for the prevention of pneumonia,diarrhea, malaria or HIV/AIDS—all of which are closelylinked to child health.
23/68 on the Aid Transparency Index 2014
from the year 2013
The data presented in this donor profile have been collated from publicly available sources.
• OECD Total flows by donor (ODA+OOF+Private) [DAC1]: ODA total, resources through intermediaries(codes I.A and I.B)
• OECD Aid (ODA) by sector and donor [DAC5]: Health ODA total. Note that these figures are an aggregate of figures for sector codes I.2, I.3 and I.4
• Arregoces et al, Countdown to 2015: changes in official development assistance to reproductive, maternal, newborn, and child health, and assessment of progress between 2003 and 2012; The Lancet Global Health http://www.thelancet.com/pdfs/journals/langlo/PIIS2214-109X(15)00057-1.pdf): RMNCHexpenditure
• International Aid Transparency Index 2013 and 2014: Transparency• Every Woman Every Child commitments database (http://www.everywomaneverychild.org/commitments/
all-commitments): Major pledges
TransparencyResources through financial intermediaries
Major Pledges
Primary Source of funds?
Financial intermediary?
Member of DAC?
Reports available on CRS?
258 Achievements and Prospects
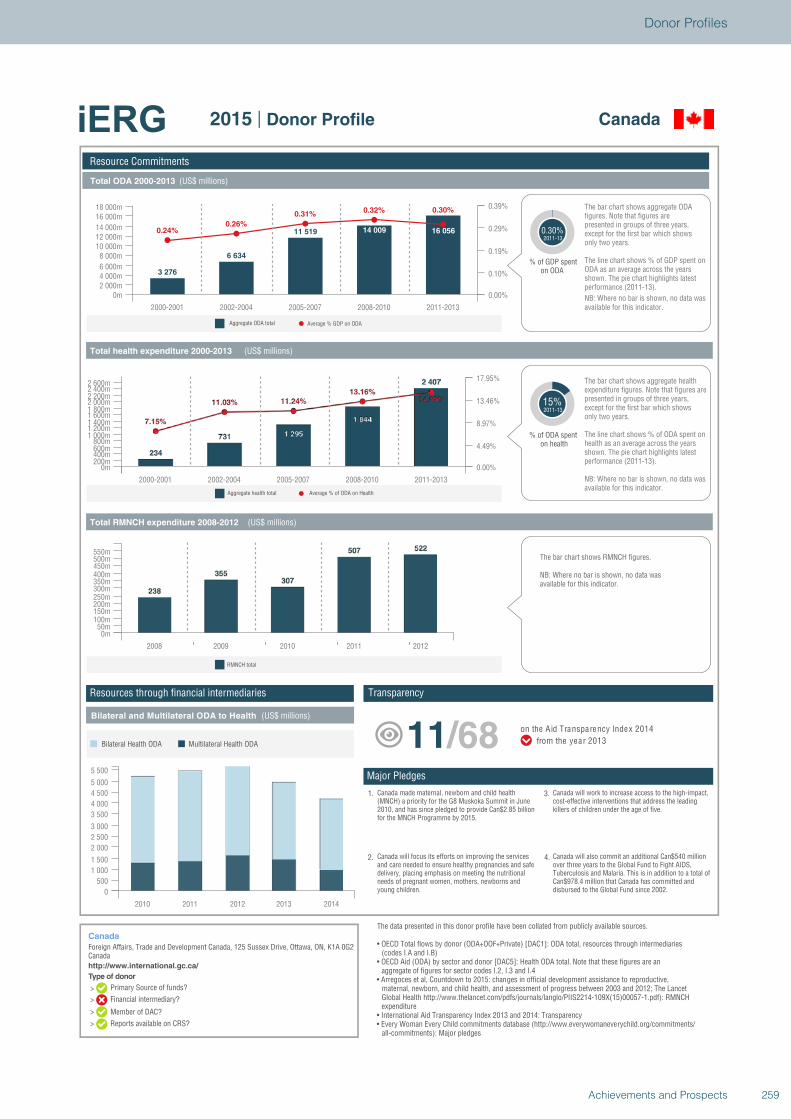
Type of donor
>
>
>
>
Total ODA 2000-2013 (US$ millions)
Total health expenditure 2000-2013 (US$ millions)
Total RMNCH expenditure 2008-2012 (US$ millions)
Bilateral and Multilateral ODA to Health (US$ millions)
Average % GDP on ODAAggregate ODA total
Average % of ODA on HealthAggregate health total
Resource Commitments
Canada
Foreign Affairs, Trade and Development Canada, 125 Sussex Drive, Ottawa, ON, K1A 0G2Canadahttp://www.international.gc.ca/
Canada2015 | Donor Profile
3 276
6 634
11 519 14 009 16 0560.24%0.26%
0.31%0.32% 0.30%
2000-2001 2002-2004 2005-2007 2008-2010 2011-2013
0m2 000m4 000m6 000m
8 000m10 000m12 000m14 000m
16 000m18 000m
0.00%
0.10%
0.19%
0.29%
0.39%
% of GDP spenton ODA
0.30%2011-13
only two years.except for the first bar which shows presented in groups of three years, figures. Note that figures are The bar chart shows aggregate ODA
ODA as an average across the years shown. The pie chart highlights latest performance (2011-13).
The line chart shows % of GDP spent on
NB: Where no bar is shown, no data wasavailable for this indicator.
15%2011-13
% of ODA spenton health
The bar chart shows aggregate health expenditure figures. Note that figures arepresented in groups of three years,except for the first bar which showsonly two years.
The line chart shows % of ODA spent on health as an average across the years shown. The pie chart highlights latest performance (2011-13).
NB: Where no bar is shown, no data wasavailable for this indicator.
2000-2001 2002-2004 2005-2007 2008-2010 2011-2013
0m200m400m600m800m
1 000m1 200m1 400m1 600m1 800m2 000m2 200m2 400m2 600m
0.00%
4.49%
8.97%
13.46%
17.95%
2008 2009 2010 2011 2012
0m50m
100m150m200m250m300m350m400m450m500m550m
RMNCH total
The bar chart shows RMNCH figures.
NB: Where no bar is shown, no data wasavailable for this indicator.
2010 2011 2012 2013 2014
0
500
1 000
1 500
2 000
2 500
3 000
3 500
4 000
4 500
5 000
5 500
Multilateral Health ODABilateral Health ODA
1. Canada made maternal, newborn and child health(MNCH) a priority for the G8 Muskoka Summit in June2010, and has since pledged to provide Can$2.85 billionfor the MNCH Programme by 2015.
2. Canada will focus its efforts on improving the servicesand care needed to ensure healthy pregnancies and safedelivery, placing emphasis on meeting the nutritionalneeds of pregnant women, mothers, newborns andyoung children.
4. Canada will also commit an additional Can$540 millionover three years to the Global Fund to Fight AIDS,Tuberculosis and Malaria. This is in addition to a total ofCan$978.4 million that Canada has committed anddisbursed to the Global Fund since 2002.
3. Canada will work to increase access to the high-impact,cost-effective interventions that address the leadingkillers of children under the age of five.
11/68 on the Aid Transparency Index 2014
from the year 2013
The data presented in this donor profile have been collated from publicly available sources.
• OECD Total flows by donor (ODA+OOF+Private) [DAC1]: ODA total, resources through intermediaries (codes I.A and I.B)
• OECD Aid (ODA) by sector and donor [DAC5]: Health ODA total. Note that these figures are an aggregate of figures for sector codes I.2, I.3 and I.4
• Arregoces et al, Countdown to 2015: changes in official development assistance to reproductive, maternal, newborn, and child health, and assessment of progress between 2003 and 2012; The Lancet Global Health http://www.thelancet.com/pdfs/journals/langlo/PIIS2214-109X(15)00057-1.pdf): RMNCH expenditure
• International Aid Transparency Index 2013 and 2014: Transparency• Every Woman Every Child commitments database (http://www.everywomaneverychild.org/commitments/
all-commitments): Major pledges
TransparencyResources through financial intermediaries
Major Pledges
Primary Source of funds?
Financial intermediary?
Member of DAC?
Reports available on CRS?
259Achievements and Prospects
Donor Profiles
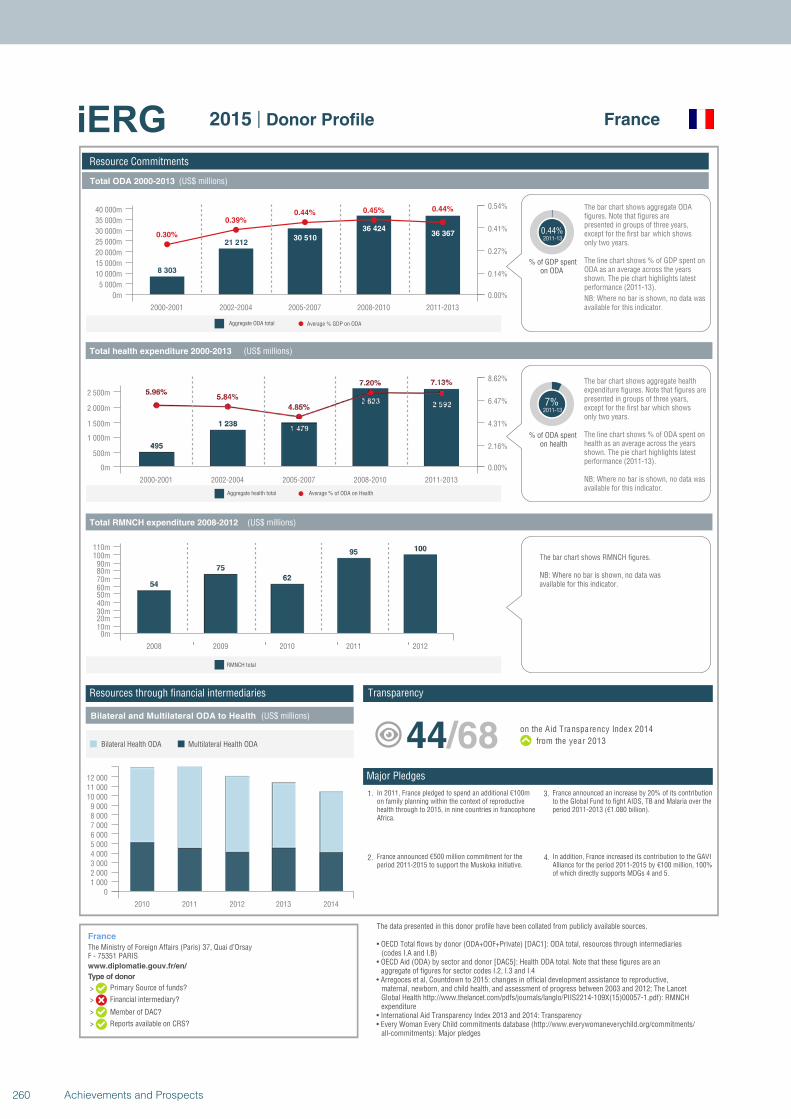
Type of donor
>
>
>
>
Total ODA 2000-2013 (US$ millions)
Total health expenditure 2000-2013 (US$ millions)
Total RMNCH expenditure 2008-2012 (US$ millions)
Bilateral and Multilateral ODA to Health (US$ millions)
Average % GDP on ODAAggregate ODA total
Average % of ODA on HealthAggregate health total
Resource Commitments
France
The Ministry of Foreign Affairs (Paris) 37, Quai d’OrsayF - 75351 PARISwww.diplomatie.gouv.fr/en/
France2015 | Donor Profile
8 303
21 21230 510
36 42436 3670.30%
0.39%0.44% 0.45% 0.44%
2000-2001 2002-2004 2005-2007 2008-2010 2011-2013
0m
5 000m
10 000m
15 000m
20 000m
25 000m
30 000m
35 000m
40 000m
0.00%
0.14%
0.27%
0.41%
0.54%
% of GDP spenton ODA
0.44%2011-13
only two years.except for the first bar which shows presented in groups of three years, figures. Note that figures are The bar chart shows aggregate ODA
ODA as an average across the years shown. The pie chart highlights latest performance (2011-13).
The line chart shows % of GDP spent on
NB: Where no bar is shown, no data wasavailable for this indicator.
7%2011-13
% of ODA spenton health
The bar chart shows aggregate health expenditure figures. Note that figures arepresented in groups of three years,except for the first bar which showsonly two years.
The line chart shows % of ODA spent on health as an average across the years shown. The pie chart highlights latest performance (2011-13).
NB: Where no bar is shown, no data wasavailable for this indicator.
2000-2001 2002-2004 2005-2007 2008-2010 2011-2013
0m
500m
1 000m
1 500m
2 000m
2 500m
0.00%
2.16%
4.31%
6.47%
8.62%
2008 2009 2010 2011 2012
0m10m20m30m40m50m60m70m80m90m
100m110m
RMNCH total
The bar chart shows RMNCH figures.
NB: Where no bar is shown, no data wasavailable for this indicator.
2010 2011 2012 2013 2014
01 0002 0003 0004 0005 0006 0007 0008 0009 000
10 00011 00012 000
Multilateral Health ODABilateral Health ODA
1. In 2011, France pledged to spend an additional €100mon family planning within the context of reproductivehealth through to 2015, in nine countries in francophoneAfrica.
2. France announced €500 million commitment for theperiod 2011-2015 to support the Muskoka initiative.
4. In addition, France increased its contribution to the GAVIAlliance for the period 2011-2015 by €100 million, 100%of which directly supports MDGs 4 and 5.
3. France announced an increase by 20% of its contributionto the Global Fund to fight AIDS, TB and Malaria over theperiod 2011-2013 (€1.080 billion).
44/68 on the Aid Transparency Index 2014
from the year 2013
The data presented in this donor profile have been collated from publicly available sources.
• OECD Total flows by donor (ODA+OOF+Private) [DAC1]: ODA total, resources through intermediaries (codes I.A and I.B)
• OECD Aid (ODA) by sector and donor [DAC5]: Health ODA total. Note that these figures are an aggregate of figures for sector codes I.2, I.3 and I.4
• Arregoces et al, Countdown to 2015: changes in official development assistance to reproductive, maternal, newborn, and child health, and assessment of progress between 2003 and 2012; The Lancet Global Health http://www.thelancet.com/pdfs/journals/langlo/PIIS2214-109X(15)00057-1.pdf): RMNCH expenditure
• International Aid Transparency Index 2013 and 2014: Transparency• Every Woman Every Child commitments database (http://www.everywomaneverychild.org/commitments/
all-commitments): Major pledges
TransparencyResources through financial intermediaries
Major Pledges
Primary Source of funds?
Financial intermediary?
Member of DAC?
Reports available on CRS?
260 Achievements and Prospects
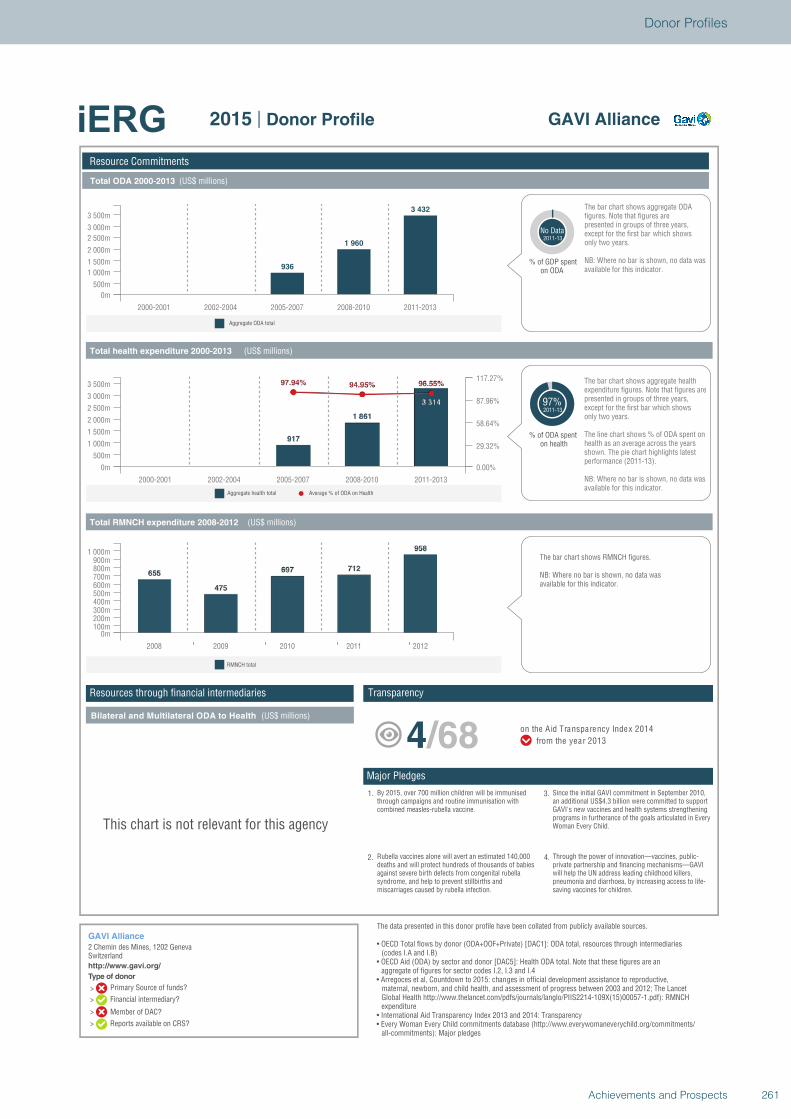
Type of donor
>
>
>
>
Total ODA 2000-2013 (US$ millions)
Total health expenditure 2000-2013 (US$ millions)
Total RMNCH expenditure 2008-2012 (US$ millions)
Bilateral and Multilateral ODA to Health (US$ millions)
Aggregate ODA total
Average % of ODA on HealthAggregate health total
Resource Commitments
GAVI Alliance
2 Chemin des Mines, 1202 GenevaSwitzerlandhttp://www.gavi.org/
GAVI Alliance2015 | Donor Profile
936
1 960
3 432
2000-2001 2002-2004 2005-2007 2008-2010 2011-2013
0m
500m
1 000m
1 500m
2 000m
2 500m
3 000m
3 500m
% of GDP spenton ODA
No Data2011-13
only two years.except for the first bar which shows presented in groups of three years, figures. Note that figures are The bar chart shows aggregate ODA
NB: Where no bar is shown, no data wasavailable for this indicator.
97%2011-13
% of ODA spenton health
The bar chart shows aggregate health expenditure figures. Note that figures arepresented in groups of three years,except for the first bar which showsonly two years.
The line chart shows % of ODA spent on health as an average across the years shown. The pie chart highlights latest performance (2011-13).
NB: Where no bar is shown, no data wasavailable for this indicator.
2000-2001 2002-2004 2005-2007 2008-2010 2011-2013
0m
500m
1 000m
1 500m
2 000m
2 500m
3 000m
3 500m
0.00%
29.32%
58.64%
87.96%
117.27%
2008 2009 2010 2011 2012
0m100m200m300m400m500m600m700m800m900m
1 000m
RMNCH total
The bar chart shows RMNCH figures.
NB: Where no bar is shown, no data wasavailable for this indicator.
This chart is not relevant for this agency
1. By 2015, over 700 million children will be immunisedthrough campaigns and routine immunisation withcombined measles-rubella vaccine.
2. Rubella vaccines alone will avert an estimated 140,000deaths and will protect hundreds of thousands of babiesagainst severe birth defects from congenital rubellasyndrome, and help to prevent stillbirths andmiscarriages caused by rubella infection.
4. Through the power of innovation—vaccines, public-private partnership and financing mechanisms—GAVIwill help the UN address leading childhood killers,pneumonia and diarrhoea, by increasing access to life-saving vaccines for children.
3. Since the initial GAVI commitment in September 2010,an additional US$4.3 billion were committed to supportGAVI's new vaccines and health systems strengtheningprograms in furtherance of the goals articulated in EveryWoman Every Child.
4/68 on the Aid Transparency Index 2014
from the year 2013
The data presented in this donor profile have been collated from publicly available sources.
• OECD Total flows by donor (ODA+OOF+Private) [DAC1]: ODA total, resources through intermediaries (codes I.A and I.B)
• OECD Aid (ODA) by sector and donor [DAC5]: Health ODA total. Note that these figures are an aggregate of figures for sector codes I.2, I.3 and I.4
• Arregoces et al, Countdown to 2015: changes in official development assistance to reproductive, maternal, newborn, and child health, and assessment of progress between 2003 and 2012; The Lancet Global Health http://www.thelancet.com/pdfs/journals/langlo/PIIS2214-109X(15)00057-1.pdf): RMNCH expenditure
• International Aid Transparency Index 2013 and 2014: Transparency• Every Woman Every Child commitments database (http://www.everywomaneverychild.org/commitments/
all-commitments): Major pledges
TransparencyResources through financial intermediaries
Major Pledges
Primary Source of funds?
Financial intermediary?
Member of DAC?
Reports available on CRS?
261Achievements and Prospects
Donor Profiles
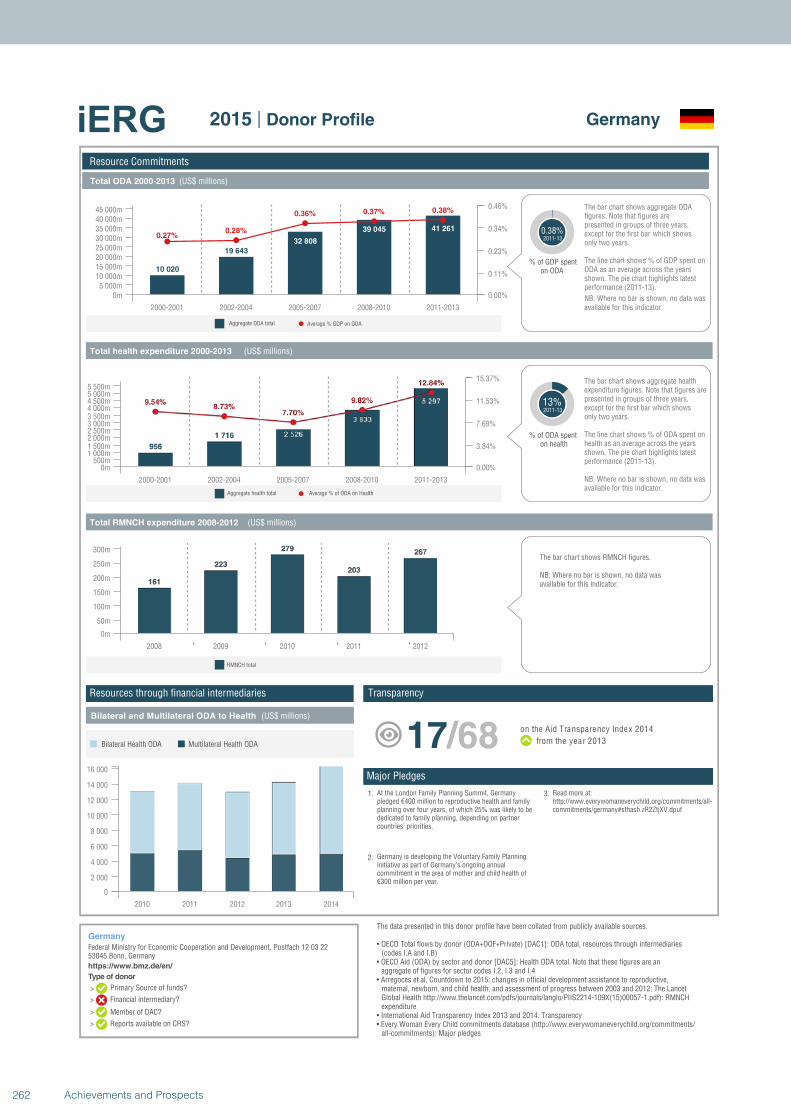
Type of donor
>
>
>
>
Total ODA 2000-2013 (US$ millions)
Total health expenditure 2000-2013 (US$ millions)
Total RMNCH expenditure 2008-2012 (US$ millions)
Bilateral and Multilateral ODA to Health (US$ millions)
Average % GDP on ODAAggregate ODA total
Average % of ODA on HealthAggregate health total
Resource Commitments
Germany
Federal Ministry for Economic Cooperation and Development, Postfach 12 03 2253045 Bonn, Germanyhttps://www.bmz.de/en/
Germany2015 | Donor Profile
10 020
19 643
32 808
39 045 41 2610.27%
0.28%
0.36% 0.37% 0.38%
2000-2001 2002-2004 2005-2007 2008-2010 2011-2013
0m5 000m
10 000m15 000m20 000m25 000m30 000m35 000m40 000m45 000m
0.00%
0.11%
0.23%
0.34%
0.46%
% of GDP spenton ODA
0.38%2011-13
only two years.except for the first bar which shows presented in groups of three years, figures. Note that figures are The bar chart shows aggregate ODA
ODA as an average across the years shown. The pie chart highlights latest performance (2011-13).
The line chart shows % of GDP spent on
NB: Where no bar is shown, no data wasavailable for this indicator.
13%2011-13
% of ODA spenton health
The bar chart shows aggregate health expenditure figures. Note that figures arepresented in groups of three years,except for the first bar which showsonly two years.
The line chart shows % of ODA spent on health as an average across the years shown. The pie chart highlights latest performance (2011-13).
NB: Where no bar is shown, no data wasavailable for this indicator.
2000-2001 2002-2004 2005-2007 2008-2010 2011-2013
0m500m
1 000m1 500m2 000m2 500m3 000m3 500m4 000m4 500m5 000m5 500m
0.00%
3.84%
7.69%
11.53%
15.37%
2008 2009 2010 2011 2012
0m
50m
100m
150m
200m
250m
300m
RMNCH total
The bar chart shows RMNCH figures.
NB: Where no bar is shown, no data wasavailable for this indicator.
2010 2011 2012 2013 2014
0
2 000
4 000
6 000
8 000
10 000
12 000
14 000
16 000
Multilateral Health ODABilateral Health ODA
1. At the London Family Planning Summit, Germanypledged €400 million to reproductive health and familyplanning over four years, of which 25% was likely to bededicated to family planning, depending on partnercountries’ priorities.
2. Germany is developing the Voluntary Family Planninginitiative as part of Germany’s ongoing annualcommitment in the area of mother and child health of€300 million per year.
3. Read more at:http://www.everywomaneverychild.org/commitments/all-commitments/germany#sthash.zR2ZtjXV.dpuf
17/68 on the Aid Transparency Index 2014
from the year 2013
The data presented in this donor profile have been collated from publicly available sources.
• OECD Total flows by donor (ODA+OOF+Private) [DAC1]: ODA total, resources through intermediaries (codes I.A and I.B)
• OECD Aid (ODA) by sector and donor [DAC5]: Health ODA total. Note that these figures are an aggregate of figures for sector codes I.2, I.3 and I.4
• Arregoces et al, Countdown to 2015: changes in official development assistance to reproductive, maternal, newborn, and child health, and assessment of progress between 2003 and 2012; The Lancet Global Health http://www.thelancet.com/pdfs/journals/langlo/PIIS2214-109X(15)00057-1.pdf): RMNCH expenditure
• International Aid Transparency Index 2013 and 2014: Transparency• Every Woman Every Child commitments database (http://www.everywomaneverychild.org/commitments/
all-commitments): Major pledges
TransparencyResources through financial intermediaries
Major Pledges
Primary Source of funds?
Financial intermediary?
Member of DAC?
Reports available on CRS?
262 Achievements and Prospects
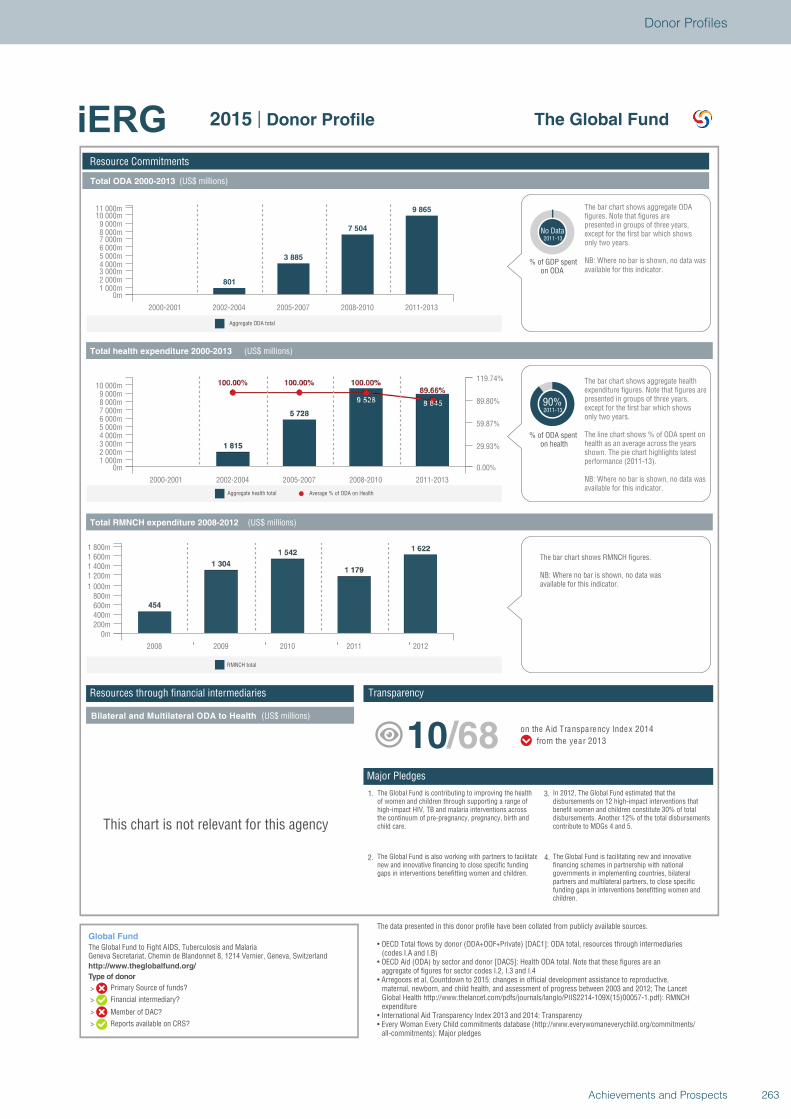
Type of donor
>
>
>
>
Total ODA 2000-2013 (US$ millions)
Total health expenditure 2000-2013 (US$ millions)
Total RMNCH expenditure 2008-2012 (US$ millions)
Bilateral and Multilateral ODA to Health (US$ millions)
Aggregate ODA total
Average % of ODA on HealthAggregate health total
Resource Commitments
Global Fund
The Global Fund to Fight AIDS, Tuberculosis and MalariaGeneva Secretariat, Chemin de Blandonnet 8, 1214 Vernier, Geneva, Switzerlandhttp://www.theglobalfund.org/
The Global Fund2015 | Donor Profile
801
3 885
7 504
9 865
2000-2001 2002-2004 2005-2007 2008-2010 2011-2013
0m1 000m2 000m3 000m4 000m5 000m6 000m7 000m8 000m9 000m
10 000m11 000m
% of GDP spenton ODA
No Data2011-13
only two years.except for the first bar which shows presented in groups of three years, figures. Note that figures are The bar chart shows aggregate ODA
NB: Where no bar is shown, no data wasavailable for this indicator.
90%2011-13
% of ODA spenton health
The bar chart shows aggregate health expenditure figures. Note that figures arepresented in groups of three years,except for the first bar which showsonly two years.
The line chart shows % of ODA spent on health as an average across the years shown. The pie chart highlights latest performance (2011-13).
NB: Where no bar is shown, no data wasavailable for this indicator.
2000-2001 2002-2004 2005-2007 2008-2010 2011-2013
0m1 000m2 000m3 000m4 000m5 000m6 000m7 000m8 000m9 000m
10 000m
0.00%
29.93%
59.87%
89.80%
119.74%
2008 2009 2010 2011 2012
0m200m400m600m800m
1 000m
1 200m1 400m1 600m1 800m
RMNCH total
The bar chart shows RMNCH figures.
NB: Where no bar is shown, no data wasavailable for this indicator.
This chart is not relevant for this agency
1. The Global Fund is contributing to improving the healthof women and children through supporting a range ofhigh-impact HIV, TB and malaria interventions acrossthe continuum of pre-pregnancy, pregnancy, birth andchild care.
2. The Global Fund is also working with partners to facilitatenew and innovative financing to close specific fundinggaps in interventions benefitting women and children.
4. The Global Fund is facilitating new and innovativefinancing schemes in partnership with nationalgovernments in implementing countries, bilateralpartners and multilateral partners, to close specificfunding gaps in interventions benefitting women andchildren.
3. In 2012, The Global Fund estimated that thedisbursements on 12 high-impact interventions thatbenefit women and children constitute 30% of totaldisbursements. Another 12% of the total disbursementscontribute to MDGs 4 and 5.
10/68 on the Aid Transparency Index 2014
from the year 2013
The data presented in this donor profile have been collated from publicly available sources.
• OECD Total flows by donor (ODA+OOF+Private) [DAC1]: ODA total, resources through intermediaries(codes I.A and I.B)
• OECD Aid (ODA) by sector and donor [DAC5]: Health ODA total. Note that these figures are an aggregate of figures for sector codes I.2, I.3 and I.4
• Arregoces et al, Countdown to 2015: changes in official development assistance to reproductive, maternal, newborn, and child health, and assessment of progress between 2003 and 2012; The Lancet Global Health http://www.thelancet.com/pdfs/journals/langlo/PIIS2214-109X(15)00057-1.pdf): RMNCHexpenditure
• International Aid Transparency Index 2013 and 2014: Transparency• Every Woman Every Child commitments database (http://www.everywomaneverychild.org/commitments/
all-commitments): Major pledges
TransparencyResources through financial intermediaries
Major Pledges
Primary Source of funds?
Financial intermediary?
Member of DAC?
Reports available on CRS?
263Achievements and Prospects
Donor Profiles
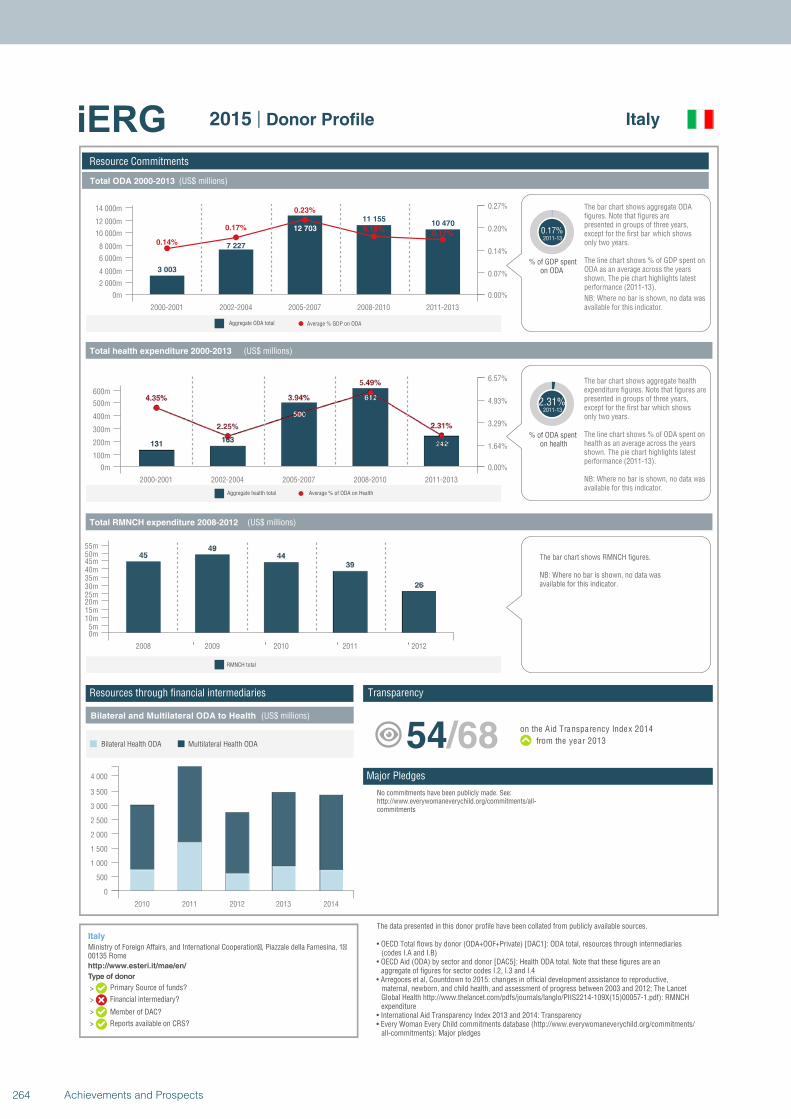
Type of donor
>
>
>
>
Total ODA 2000-2013 (US$ millions)
Total health expenditure 2000-2013 (US$ millions)
Total RMNCH expenditure 2008-2012 (US$ millions)
Bilateral and Multilateral ODA to Health (US$ millions)
Average % GDP on ODAAggregate ODA total
Average % of ODA on HealthAggregate health total
Resource Commitments
Italy
Ministry of Foreign Affairs, and International Cooperation�, Piazzale della Farnesina, 1�00135 Romehttp://www.esteri.it/mae/en/
Italy2015 | Donor Profile
3 003
7 227
12 703
11 15510 470
0.14%
0.17%
0.23%
0.18%0.17%
2000-2001 2002-2004 2005-2007 2008-2010 2011-2013
0m
2 000m
4 000m
6 000m
8 000m
10 000m
12 000m
14 000m
0.00%
0.07%
0.14%
0.20%
0.27%
% of GDP spenton ODA
0.17%2011-13
only two years.except for the first bar which shows presented in groups of three years, figures. Note that figures are The bar chart shows aggregate ODA
ODA as an average across the years shown. The pie chart highlights latest performance (2011-13).
The line chart shows % of GDP spent on
NB: Where no bar is shown, no data wasavailable for this indicator.
2.31%2011-13
% of ODA spenton health
The bar chart shows aggregate health expenditure figures. Note that figures arepresented in groups of three years,except for the first bar which showsonly two years.
The line chart shows % of ODA spent on health as an average across the years shown. The pie chart highlights latest performance (2011-13).
NB: Where no bar is shown, no data wasavailable for this indicator.
2000-2001 2002-2004 2005-2007 2008-2010 2011-2013
0m
100m
200m
300m
400m
500m
600m
0.00%
1.64%
3.29%
4.93%
6.57%
2008 2009 2010 2011 2012
0m5m
10m15m20m25m30m35m40m45m50m55m
RMNCH total
The bar chart shows RMNCH figures.
NB: Where no bar is shown, no data wasavailable for this indicator.
2010 2011 2012 2013 2014
0
500
1 000
1 500
2 000
2 500
3 000
3 500
4 000
Multilateral Health ODABilateral Health ODA
No commitments have been publicly made. See:http://www.everywomaneverychild.org/commitments/all-commitments
54/68 on the Aid Transparency Index 2014
from the year 2013
The data presented in this donor profile have been collated from publicly available sources.
• OECD Total flows by donor (ODA+OOF+Private) [DAC1]: ODA total, resources through intermediaries (codes I.A and I.B)
• OECD Aid (ODA) by sector and donor [DAC5]: Health ODA total. Note that these figures are an aggregate of figures for sector codes I.2, I.3 and I.4
• Arregoces et al, Countdown to 2015: changes in official development assistance to reproductive, maternal, newborn, and child health, and assessment of progress between 2003 and 2012; The Lancet Global Health http://www.thelancet.com/pdfs/journals/langlo/PIIS2214-109X(15)00057-1.pdf): RMNCH expenditure
• International Aid Transparency Index 2013 and 2014: Transparency• Every Woman Every Child commitments database (http://www.everywomaneverychild.org/commitments/
all-commitments): Major pledges
TransparencyResources through financial intermediaries
Major Pledges
Primary Source of funds?
Financial intermediary?
Member of DAC?
Reports available on CRS?
Type of donor
>
>
>
>
Total ODA 2000-2013 (US$ millions)
Total health expenditure 2000-2013 (US$ millions)
Total RMNCH expenditure 2008-2012 (US$ millions)
Bilateral and Multilateral ODA to Health (US$ millions)
Average % GDP on ODAAggregate ODA total
Average % of ODA on HealthAggregate health total
Resource Commitments
Japan
Nibancho Center Building 5-25,, Niban-cho, Chiyoda-kuTokyo 102-8012http://www.jica.go.jp/english/index.html
Japan2015 | Donor Profile
23 35527 085
31 95830 125
33 0180.26%
0.21%0.23%
0.19%
0.19%
2000-2001 2002-2004 2005-2007 2008-2010 2011-2013
0m
5 000m
10 000m
15 000m
20 000m
25 000m
30 000m
35 000m
0.00%
0.08%
0.15%
0.23%
0.31%
% of GDP spenton ODA
0.19%2011-13
only two years.except for the first bar which shows presented in groups of three years, figures. Note that figures are The bar chart shows aggregate ODA
ODA as an average across the years shown. The pie chart highlights latest performance (2011-13).
The line chart shows % of GDP spent on
NB: Where no bar is shown, no data wasavailable for this indicator.
22%2011-13
% of ODA spenton health
The bar chart shows aggregate health expenditure figures. Note that figures arepresented in groups of three years,except for the first bar which showsonly two years.
The line chart shows % of ODA spent on health as an average across the years shown. The pie chart highlights latest performance (2011-13).
NB: Where no bar is shown, no data wasavailable for this indicator.
2000-2001 2002-2004 2005-2007 2008-2010 2011-2013
0m1 000m
2 000m
3 000m
4 000m
5 000m
6 000m
7 000m
8 000m
0.00%
7.41%
14.82%
22.23%
29.64%
2008 2009 2010 2011 2012
0m
50m
100m
150m
200m
250m
300m
350m
400m
RMNCH total
The bar chart shows RMNCH figures.
NB: Where no bar is shown, no data wasavailable for this indicator.
2010 2011 2012 2013 2014
0
1 000
2 000
3 000
4 000
5 000
6 000
7 000
8 000
9 000
10 000
11 000
Multilateral Health ODABilateral Health ODA
1. Japan gave more than US$ 570 million (2000-12) towardassistance in family planning. At the London FamilyPlanning Summit, Japan announced it would continuethat commitment by funding US$ 5 billion over fiveyears.
2. JICA will contribute to achieving the goals expressed inJapan's Global Health Policy 2011-2015, which commitsto saving approximately 11.3 million children’s lives and430,000 maternal lives in cooperation with other donors.
4. Japan’s Global Health Policy supports the GlobalStrategy by implementing the “EMBRACE” project, whichensures the continuum of care from pregnancy to postnatal stage.
3. Every year, JICA implements technical cooperation andgrant aid projects for MNCH at the level of 3 billion and3-16 billion Japanese yen respectively.
33/68 on the Aid Transparency Index 2014
from the year 2013
The data presented in this donor profile have been collated from publicly available sources.
• OECD Total flows by donor (ODA+OOF+Private) [DAC1]: ODA total, resources through intermediaries (codes I.A and I.B)
• OECD Aid (ODA) by sector and donor [DAC5]: Health ODA total. Note that these figures are an aggregate of figures for sector codes I.2, I.3 and I.4
• Arregoces et al, Countdown to 2015: changes in official development assistance to reproductive, maternal, newborn, and child health, and assessment of progress between 2003 and 2012; The Lancet Global Health http://www.thelancet.com/pdfs/journals/langlo/PIIS2214-109X(15)00057-1.pdf): RMNCH expenditure
• International Aid Transparency Index 2013 and 2014: Transparency• Every Woman Every Child commitments database (http://www.everywomaneverychild.org/commitments/
all-commitments): Major pledges
TransparencyResources through financial intermediaries
Major Pledges
Primary Source of funds?
Financial intermediary?
Member of DAC?
Reports available on CRS?
264 Achievements and Prospects
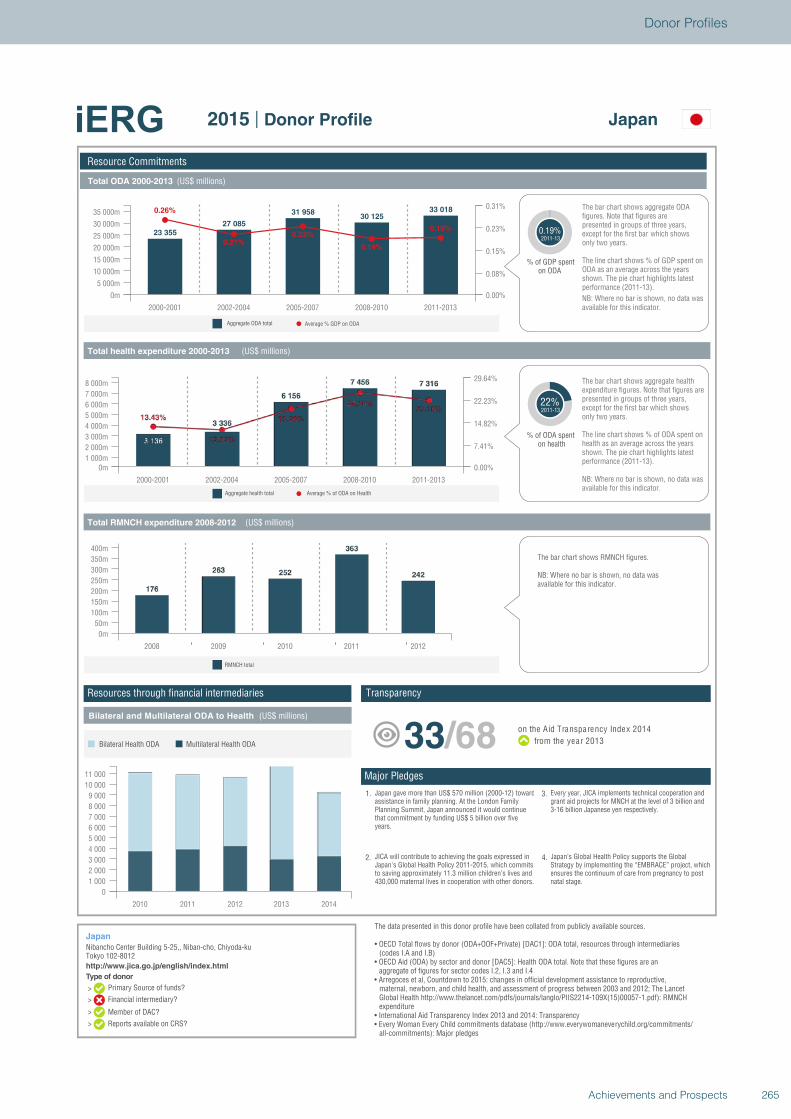
Type of donor
>
>
>
>
Total ODA 2000-2013 (US$ millions)
Total health expenditure 2000-2013 (US$ millions)
Total RMNCH expenditure 2008-2012 (US$ millions)
Bilateral and Multilateral ODA to Health (US$ millions)
Average % GDP on ODAAggregate ODA total
Average % of ODA on HealthAggregate health total
Resource Commitments
Japan
Nibancho Center Building 5-25,, Niban-cho, Chiyoda-kuTokyo 102-8012http://www.jica.go.jp/english/index.html
Japan2015 | Donor Profile
23 35527 085
31 95830 125
33 0180.26%
0.21%0.23%
0.19%
0.19%
2000-2001 2002-2004 2005-2007 2008-2010 2011-2013
0m
5 000m
10 000m
15 000m
20 000m
25 000m
30 000m
35 000m
0.00%
0.08%
0.15%
0.23%
0.31%
% of GDP spenton ODA
0.19%2011-13
only two years.except for the first bar which shows presented in groups of three years, figures. Note that figures are The bar chart shows aggregate ODA
ODA as an average across the years shown. The pie chart highlights latest performance (2011-13).
The line chart shows % of GDP spent on
NB: Where no bar is shown, no data wasavailable for this indicator.
22%2011-13
% of ODA spenton health
The bar chart shows aggregate health expenditure figures. Note that figures arepresented in groups of three years,except for the first bar which showsonly two years.
The line chart shows % of ODA spent on health as an average across the years shown. The pie chart highlights latest performance (2011-13).
NB: Where no bar is shown, no data wasavailable for this indicator.
2000-2001 2002-2004 2005-2007 2008-2010 2011-2013
0m1 000m
2 000m
3 000m
4 000m
5 000m
6 000m
7 000m
8 000m
0.00%
7.41%
14.82%
22.23%
29.64%
2008 2009 2010 2011 2012
0m
50m
100m
150m
200m
250m
300m
350m
400m
RMNCH total
The bar chart shows RMNCH figures.
NB: Where no bar is shown, no data wasavailable for this indicator.
2010 2011 2012 2013 2014
0
1 000
2 000
3 000
4 000
5 000
6 000
7 000
8 000
9 000
10 000
11 000
Multilateral Health ODABilateral Health ODA
1. Japan gave more than US$ 570 million (2000-12) towardassistance in family planning. At the London FamilyPlanning Summit, Japan announced it would continuethat commitment by funding US$ 5 billion over fiveyears.
2. JICA will contribute to achieving the goals expressed inJapan's Global Health Policy 2011-2015, which commitsto saving approximately 11.3 million children’s lives and430,000 maternal lives in cooperation with other donors.
4. Japan’s Global Health Policy supports the GlobalStrategy by implementing the “EMBRACE” project, whichensures the continuum of care from pregnancy to postnatal stage.
3. Every year, JICA implements technical cooperation andgrant aid projects for MNCH at the level of 3 billion and3-16 billion Japanese yen respectively.
33/68 on the Aid Transparency Index 2014
from the year 2013
The data presented in this donor profile have been collated from publicly available sources.
• OECD Total flows by donor (ODA+OOF+Private) [DAC1]: ODA total, resources through intermediaries (codes I.A and I.B)
• OECD Aid (ODA) by sector and donor [DAC5]: Health ODA total. Note that these figures are an aggregate of figures for sector codes I.2, I.3 and I.4
• Arregoces et al, Countdown to 2015: changes in official development assistance to reproductive, maternal, newborn, and child health, and assessment of progress between 2003 and 2012; The Lancet Global Health http://www.thelancet.com/pdfs/journals/langlo/PIIS2214-109X(15)00057-1.pdf): RMNCH expenditure
• International Aid Transparency Index 2013 and 2014: Transparency• Every Woman Every Child commitments database (http://www.everywomaneverychild.org/commitments/
all-commitments): Major pledges
TransparencyResources through financial intermediaries
Major Pledges
Primary Source of funds?
Financial intermediary?
Member of DAC?
Reports available on CRS?
265Achievements and Prospects
Donor Profiles
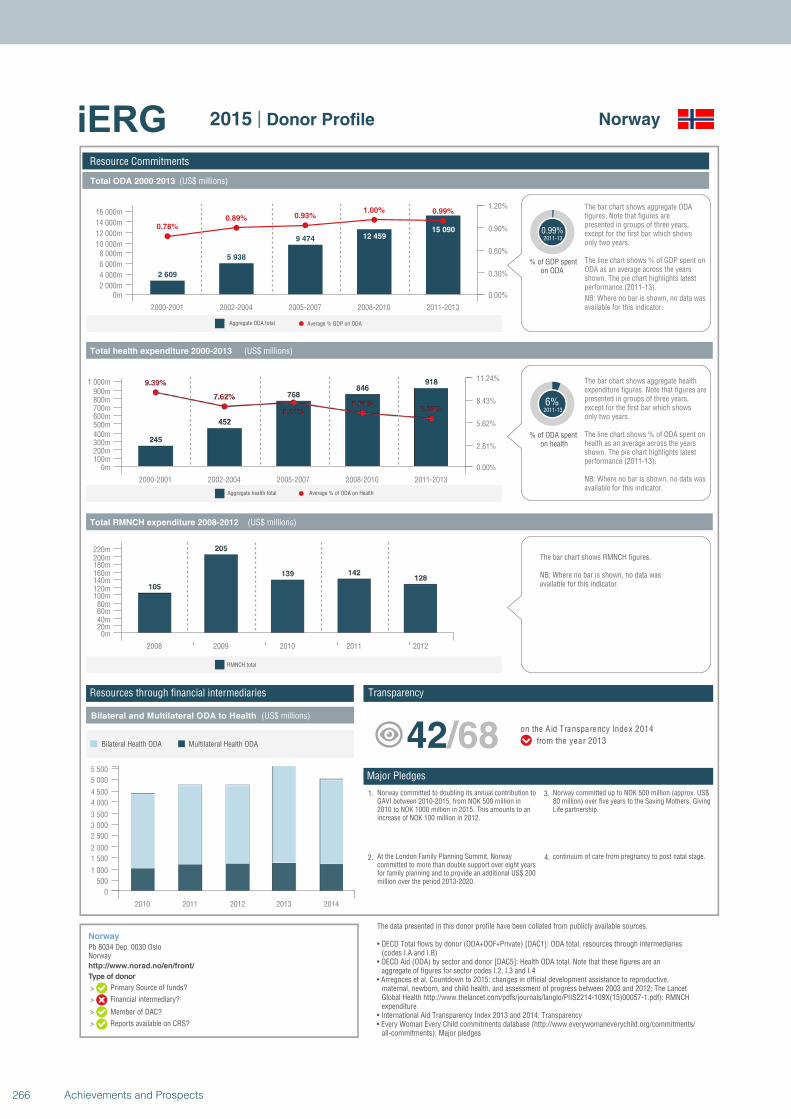
Type of donor
>
>
>
>
Total ODA 2000-2013 (US$ millions)
Total health expenditure 2000-2013 (US$ millions)
Total RMNCH expenditure 2008-2012 (US$ millions)
Bilateral and Multilateral ODA to Health (US$ millions)
Average % GDP on ODAAggregate ODA total
Average % of ODA on HealthAggregate health total
Resource Commitments
Norway
Pb 8034 Dep. 0030 OsloNorwayhttp://www.norad.no/en/front/
Norway2015 | Donor Profile
2 609
5 938
9 474 12 45915 0900.78%
0.89% 0.93%1.00% 0.99%
2000-2001 2002-2004 2005-2007 2008-2010 2011-2013
0m2 000m
4 000m
6 000m
8 000m10 000m
12 000m
14 000m
16 000m
0.00%
0.30%
0.60%
0.90%
1.20%
% of GDP spenton ODA
0.99%2011-13
only two years.except for the first bar which shows presented in groups of three years, figures. Note that figures are The bar chart shows aggregate ODA
ODA as an average across the years shown. The pie chart highlights latest performance (2011-13).
The line chart shows % of GDP spent on
NB: Where no bar is shown, no data wasavailable for this indicator.
6%2011-13
% of ODA spenton health
The bar chart shows aggregate health expenditure figures. Note that figures arepresented in groups of three years,except for the first bar which showsonly two years.
The line chart shows % of ODA spent on health as an average across the years shown. The pie chart highlights latest performance (2011-13).
NB: Where no bar is shown, no data wasavailable for this indicator.
2000-2001 2002-2004 2005-2007 2008-2010 2011-2013
0m100m200m300m400m500m600m700m800m900m
1 000m
0.00%
2.81%
5.62%
8.43%
11.24%
2008 2009 2010 2011 2012
0m20m40m60m80m
100m120m140m160m180m200m220m
RMNCH total
The bar chart shows RMNCH figures.
NB: Where no bar is shown, no data wasavailable for this indicator.
2010 2011 2012 2013 2014
0
500
1 000
1 500
2 000
2 500
3 000
3 500
4 000
4 500
5 000
5 500
Multilateral Health ODABilateral Health ODA
1. Norway committed to doubling its annual contribution toGAVI between 2010-2015, from NOK 500 million in2010 to NOK 1000 million in 2015. This amounts to anincrease of NOK 100 million in 2012.
2. At the London Family Planning Summit, Norwaycommitted to more than double support over eight yearsfor family planning and to provide an additional US$ 200million over the period 2013-2020.
4. continuum of care from pregnancy to post natal stage.
3. Norway committed up to NOK 500 million (approx. US$80 million) over five years to the Saving Mothers, GivingLife partnership.
42/68 on the Aid Transparency Index 2014
from the year 2013
The data presented in this donor profile have been collated from publicly available sources.
• OECD Total flows by donor (ODA+OOF+Private) [DAC1]: ODA total, resources through intermediaries (codes I.A and I.B)
• OECD Aid (ODA) by sector and donor [DAC5]: Health ODA total. Note that these figures are an aggregate of figures for sector codes I.2, I.3 and I.4
• Arregoces et al, Countdown to 2015: changes in official development assistance to reproductive, maternal, newborn, and child health, and assessment of progress between 2003 and 2012; The Lancet Global Health http://www.thelancet.com/pdfs/journals/langlo/PIIS2214-109X(15)00057-1.pdf): RMNCH expenditure
• International Aid Transparency Index 2013 and 2014: Transparency• Every Woman Every Child commitments database (http://www.everywomaneverychild.org/commitments/
all-commitments): Major pledges
TransparencyResources through financial intermediaries
Major Pledges
Primary Source of funds?
Financial intermediary?
Member of DAC?
Reports available on CRS?
266 Achievements and Prospects
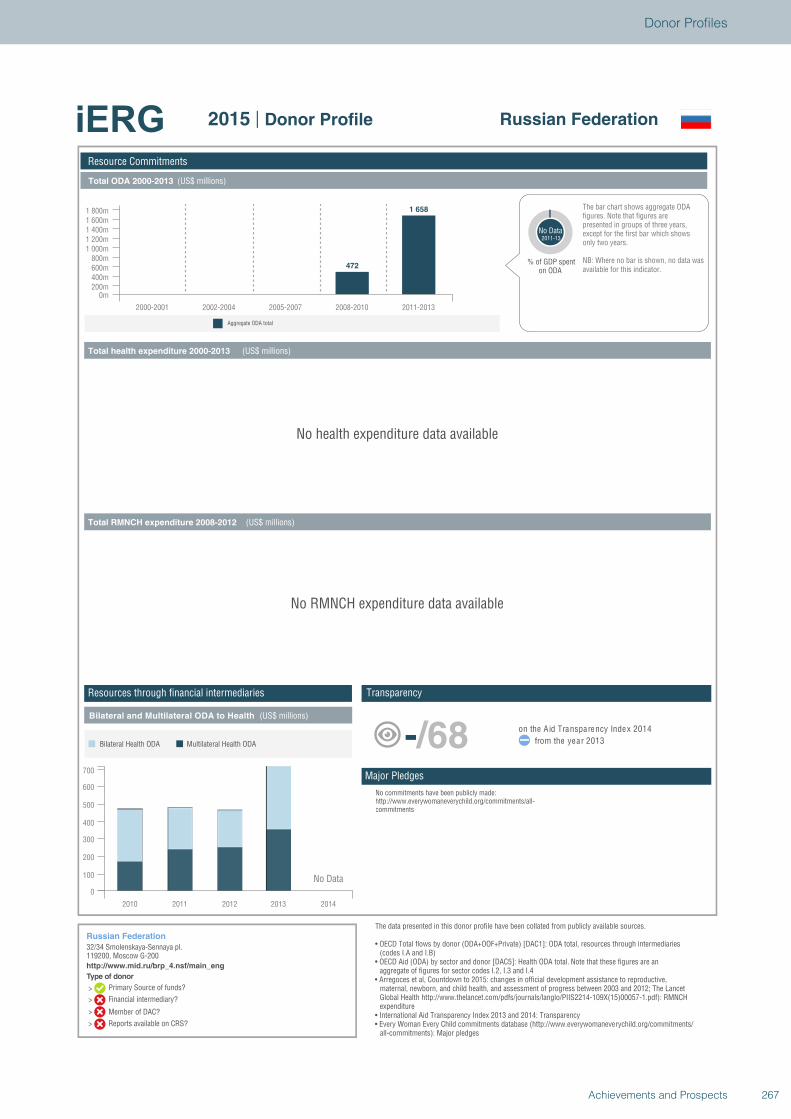
Type of donor
>
>
>
>
Total ODA 2000-2013 (US$ millions)
Total health expenditure 2000-2013 (US$ millions)
Total RMNCH expenditure 2008-2012 (US$ millions)
Bilateral and Multilateral ODA to Health (US$ millions)
Aggregate ODA total
Resource Commitments
Russian Federation
32/34 Smolenskaya-Sennaya pl.119200, Moscow G-200http://www.mid.ru/brp_4.nsf/main_eng
Russian Federation2015 | Donor Profile
472
1 658
2000-2001 2002-2004 2005-2007 2008-2010 2011-2013
0m200m400m600m800m
1 000m1 200m1 400m1 600m1 800m
% of GDP spenton ODA
No Data2011-13
only two years.except for the first bar which shows presented in groups of three years, figures. Note that figures are The bar chart shows aggregate ODA
NB: Where no bar is shown, no data wasavailable for this indicator.
No health expenditure data available
No RMNCH expenditure data available
2010 2011 2012 2013 2014
0
100
200
300
400
500
600
700
Multilateral Health ODABilateral Health ODA
No Data
No commitments have been publicly made:http://www.everywomaneverychild.org/commitments/all-commitments
-/68 on the Aid Transparency Index 2014
from the year 2013
The data presented in this donor profile have been collated from publicly available sources.
• OECD Total flows by donor (ODA+OOF+Private) [DAC1]: ODA total, resources through intermediaries (codes I.A and I.B)
• OECD Aid (ODA) by sector and donor [DAC5]: Health ODA total. Note that these figures are an aggregate of figures for sector codes I.2, I.3 and I.4
• Arregoces et al, Countdown to 2015: changes in official development assistance to reproductive, maternal, newborn, and child health, and assessment of progress between 2003 and 2012; The Lancet Global Health http://www.thelancet.com/pdfs/journals/langlo/PIIS2214-109X(15)00057-1.pdf): RMNCH expenditure
• International Aid Transparency Index 2013 and 2014: Transparency• Every Woman Every Child commitments database (http://www.everywomaneverychild.org/commitments/
all-commitments): Major pledges
TransparencyResources through financial intermediaries
Major Pledges
Primary Source of funds?
Financial intermediary?
Member of DAC?
Reports available on CRS?
267Achievements and Prospects
Donor Profiles
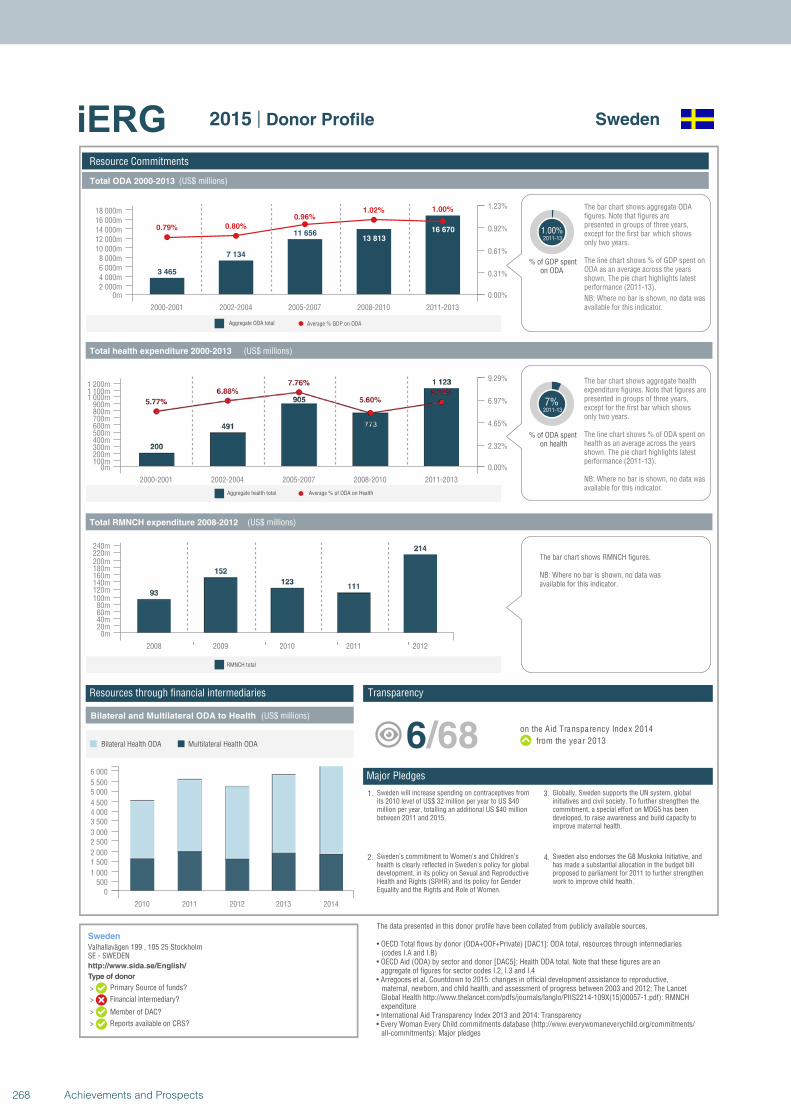
Type of donor
>
>
>
>
Total ODA 2000-2013 (US$ millions)
Total health expenditure 2000-2013 (US$ millions)
Total RMNCH expenditure 2008-2012 (US$ millions)
Bilateral and Multilateral ODA to Health (US$ millions)
Average % GDP on ODAAggregate ODA total
Average % of ODA on HealthAggregate health total
Resource Commitments
Sweden
Valhallavägen 199 , 105 25 StockholmSE - SWEDENhttp://www.sida.se/English/
Sweden2015 | Donor Profile
3 465
7 134
11 65613 813
16 6700.79% 0.80%
0.96%1.02% 1.00%
2000-2001 2002-2004 2005-2007 2008-2010 2011-2013
0m2 000m4 000m6 000m8 000m
10 000m12 000m14 000m16 000m18 000m
0.00%
0.31%
0.61%
0.92%
1.23%
% of GDP spenton ODA
1.00%2011-13
only two years.except for the first bar which shows presented in groups of three years, figures. Note that figures are The bar chart shows aggregate ODA
ODA as an average across the years shown. The pie chart highlights latest performance (2011-13).
The line chart shows % of GDP spent on
NB: Where no bar is shown, no data wasavailable for this indicator.
7%2011-13
% of ODA spenton health
The bar chart shows aggregate health expenditure figures. Note that figures arepresented in groups of three years,except for the first bar which showsonly two years.
The line chart shows % of ODA spent on health as an average across the years shown. The pie chart highlights latest performance (2011-13).
NB: Where no bar is shown, no data wasavailable for this indicator.
2000-2001 2002-2004 2005-2007 2008-2010 2011-2013
0m100m200m300m400m500m600m700m800m900m
1 000m1 100m1 200m
0.00%
2.32%
4.65%
6.97%
9.29%
2008 2009 2010 2011 2012
0m20m40m60m80m
100m120m140m160m180m200m220m240m
RMNCH total
The bar chart shows RMNCH figures.
NB: Where no bar is shown, no data wasavailable for this indicator.
2010 2011 2012 2013 2014
0500
1 000
1 5002 000
2 5003 000
3 5004 0004 500
5 0005 500
6 000
Multilateral Health ODABilateral Health ODA
1. Sweden will increase spending on contraceptives fromits 2010 level of US$ 32 million per year to US $40million per year, totalling an additional US $40 millionbetween 2011 and 2015.
2. Sweden’s commitment to Women’s and Children’shealth is clearly reflected in Sweden's policy for globaldevelopment, in its policy on Sexual and ReproductiveHealth and Rights (SRHR) and its policy for GenderEquality and the Rights and Role of Women.
4. Sweden also endorses the G8 Muskoka Initiative, andhas made a substantial allocation in the budget billproposed to parliament for 2011 to further strengthenwork to improve child health.
3. Globally, Sweden supports the UN system, globalinitiatives and civil society. To further strengthen thecommitment, a special effort on MDG5 has beendeveloped, to raise awareness and build capacity toimprove maternal health.
6/68 on the Aid Transparency Index 2014
from the year 2013
The data presented in this donor profile have been collated from publicly available sources.
• OECD Total flows by donor (ODA+OOF+Private) [DAC1]: ODA total, resources through intermediaries (codes I.A and I.B)
• OECD Aid (ODA) by sector and donor [DAC5]: Health ODA total. Note that these figures are an aggregate of figures for sector codes I.2, I.3 and I.4
• Arregoces et al, Countdown to 2015: changes in official development assistance to reproductive, maternal, newborn, and child health, and assessment of progress between 2003 and 2012; The Lancet Global Health http://www.thelancet.com/pdfs/journals/langlo/PIIS2214-109X(15)00057-1.pdf): RMNCH expenditure
• International Aid Transparency Index 2013 and 2014: Transparency• Every Woman Every Child commitments database (http://www.everywomaneverychild.org/commitments/
all-commitments): Major pledges
TransparencyResources through financial intermediaries
Major Pledges
Primary Source of funds?
Financial intermediary?
Member of DAC?
Reports available on CRS?
268 Achievements and Prospects
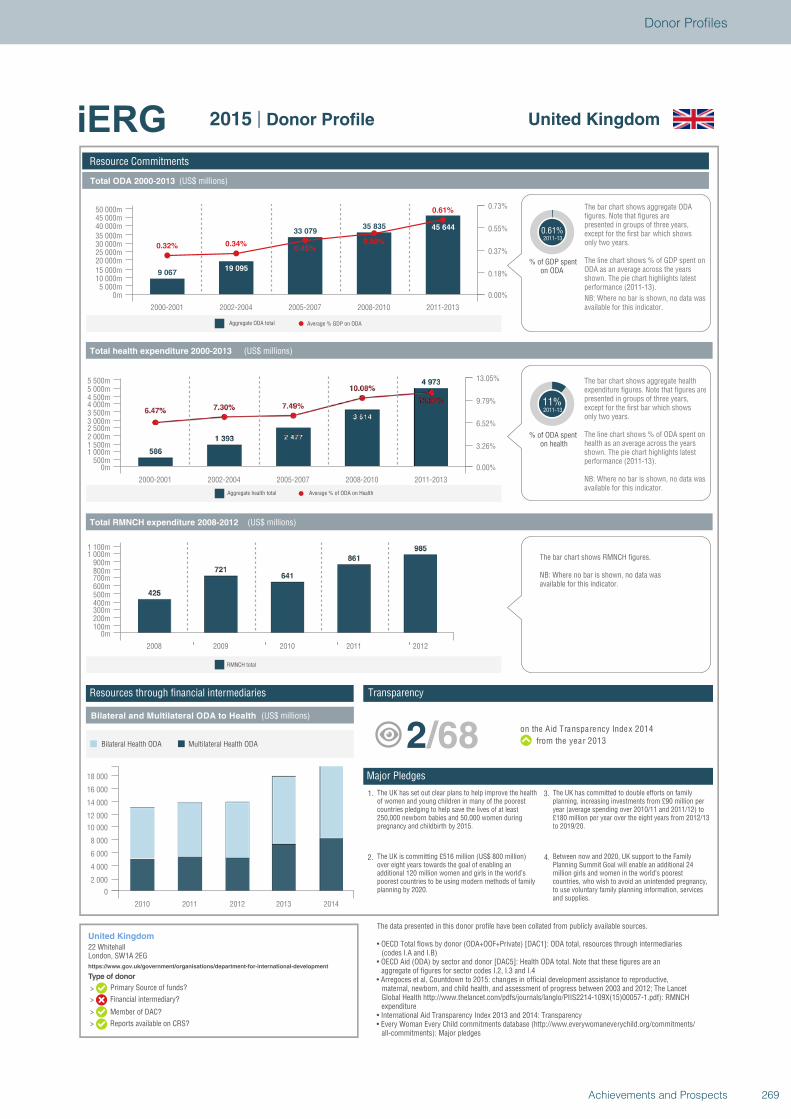
Type of donor
>
>
>
>
Total ODA 2000-2013 (US$ millions)
Total health expenditure 2000-2013 (US$ millions)
Total RMNCH expenditure 2008-2012 (US$ millions)
Bilateral and Multilateral ODA to Health (US$ millions)
Average % GDP on ODAAggregate ODA total
Average % of ODA on HealthAggregate health total
Resource Commitments
United Kingdom
22 WhitehallLondon, SW1A 2EGhttps://www.gov.uk/government/organisations/department-for-international-development
United Kingdom2015 | Donor Profile
9 06719 095
33 07935 835 45 644
0.32% 0.34%0.45%
0.50%
0.61%
2000-2001 2002-2004 2005-2007 2008-2010 2011-2013
0m5 000m
10 000m15 000m20 000m25 000m30 000m35 000m40 000m45 000m50 000m
0.00%
0.18%
0.37%
0.55%
0.73%
% of GDP spenton ODA
0.61%2011-13
only two years.except for the first bar which shows presented in groups of three years, figures. Note that figures are The bar chart shows aggregate ODA
ODA as an average across the years shown. The pie chart highlights latest performance (2011-13).
The line chart shows % of GDP spent on
NB: Where no bar is shown, no data wasavailable for this indicator.
11%2011-13
% of ODA spenton health
The bar chart shows aggregate health expenditure figures. Note that figures arepresented in groups of three years,except for the first bar which showsonly two years.
The line chart shows % of ODA spent on health as an average across the years shown. The pie chart highlights latest performance (2011-13).
NB: Where no bar is shown, no data wasavailable for this indicator.
2000-2001 2002-2004 2005-2007 2008-2010 2011-2013
0m500m
1 000m1 500m2 000m2 500m3 000m3 500m4 000m4 500m5 000m5 500m
0.00%
3.26%
6.52%
9.79%
13.05%
2008 2009 2010 2011 2012
0m100m200m300m400m500m600m700m800m900m
1 000m1 100m
RMNCH total
The bar chart shows RMNCH figures.
NB: Where no bar is shown, no data wasavailable for this indicator.
2010 2011 2012 2013 2014
0
2 000
4 000
6 000
8 000
10 000
12 000
14 000
16 000
18 000
Multilateral Health ODABilateral Health ODA
1. The UK has set out clear plans to help improve the healthof women and young children in many of the poorestcountries pledging to help save the lives of at least250,000 newborn babies and 50,000 women duringpregnancy and childbirth by 2015.
2. The UK is committing £516 million (US$ 800 million)over eight years towards the goal of enabling anadditional 120 million women and girls in the world’spoorest countries to be using modern methods of familyplanning by 2020.
4. Between now and 2020, UK support to the FamilyPlanning Summit Goal will enable an additional 24million girls and women in the world’s poorestcountries, who wish to avoid an unintended pregnancy,to use voluntary family planning information, servicesand supplies.
3. The UK has committed to double efforts on familyplanning, increasing investments from £90 million peryear (average spending over 2010/11 and 2011/12) to£180 million per year over the eight years from 2012/13to 2019/20.
2/68 on the Aid Transparency Index 2014
from the year 2013
The data presented in this donor profile have been collated from publicly available sources.
• OECD Total flows by donor (ODA+OOF+Private) [DAC1]: ODA total, resources through intermediaries (codes I.A and I.B)
• OECD Aid (ODA) by sector and donor [DAC5]: Health ODA total. Note that these figures are an aggregate of figures for sector codes I.2, I.3 and I.4
• Arregoces et al, Countdown to 2015: changes in official development assistance to reproductive, maternal, newborn, and child health, and assessment of progress between 2003 and 2012; The Lancet Global Health http://www.thelancet.com/pdfs/journals/langlo/PIIS2214-109X(15)00057-1.pdf): RMNCH expenditure
• International Aid Transparency Index 2013 and 2014: Transparency• Every Woman Every Child commitments database (http://www.everywomaneverychild.org/commitments/
all-commitments): Major pledges
TransparencyResources through financial intermediaries
Major Pledges
Primary Source of funds?
Financial intermediary?
Member of DAC?
Reports available on CRS?
269Achievements and Prospects
Donor Profiles
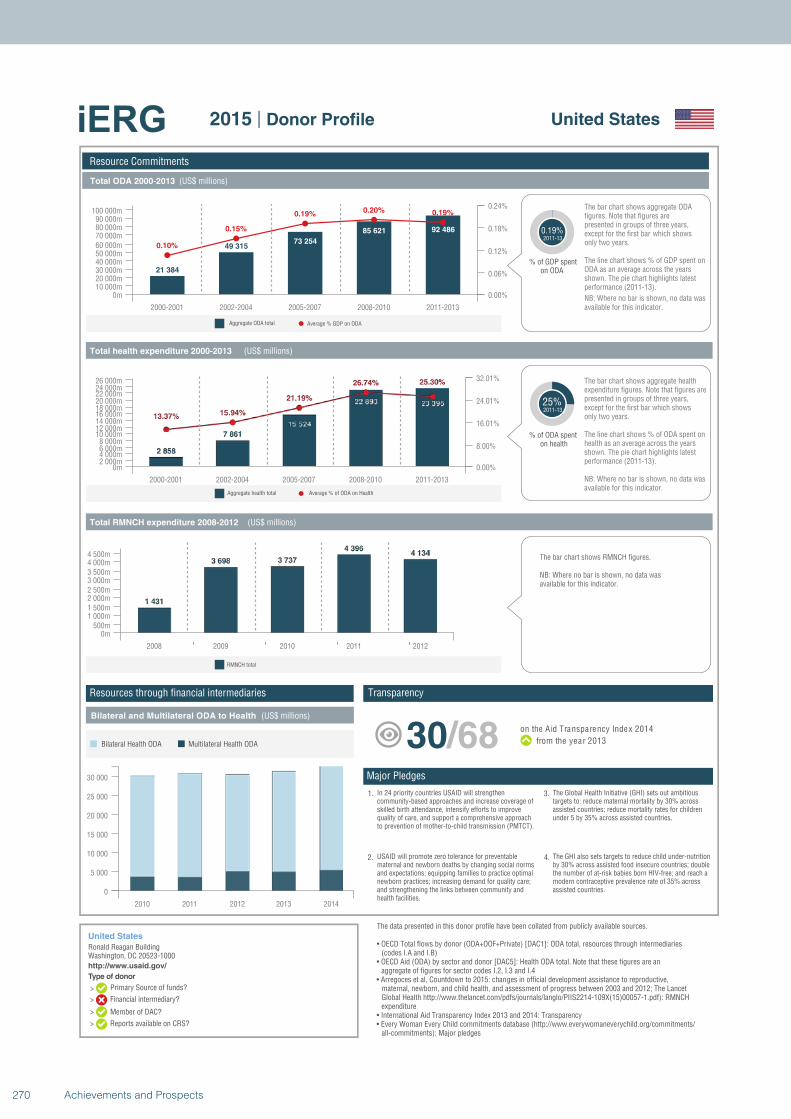
Type of donor
>
>
>
>
Total ODA 2000-2013 (US$ millions)
Total health expenditure 2000-2013 (US$ millions)
Total RMNCH expenditure 2008-2012 (US$ millions)
Bilateral and Multilateral ODA to Health (US$ millions)
Average % GDP on ODAAggregate ODA total
Average % of ODA on HealthAggregate health total
Resource Commitments
United States
Ronald Reagan BuildingWashington, DC 20523-1000http://www.usaid.gov/
United States2015 | Donor Profile
21 384
49 31573 254
85 621 92 486
0.10%
0.15%
0.19%0.20% 0.19%
2000-2001 2002-2004 2005-2007 2008-2010 2011-2013
0m10 000m20 000m30 000m40 000m50 000m60 000m70 000m80 000m90 000m
100 000m
0.00%
0.06%
0.12%
0.18%
0.24%
% of GDP spenton ODA
0.19%2011-13
only two years.except for the first bar which shows presented in groups of three years, figures. Note that figures are The bar chart shows aggregate ODA
ODA as an average across the years shown. The pie chart highlights latest performance (2011-13).
The line chart shows % of GDP spent on
NB: Where no bar is shown, no data wasavailable for this indicator.
25%2011-13
% of ODA spenton health
The bar chart shows aggregate health expenditure figures. Note that figures arepresented in groups of three years,except for the first bar which showsonly two years.
The line chart shows % of ODA spent on health as an average across the years shown. The pie chart highlights latest performance (2011-13).
NB: Where no bar is shown, no data wasavailable for this indicator.
2000-2001 2002-2004 2005-2007 2008-2010 2011-2013
0m2 000m4 000m6 000m8 000m
10 000m12 000m14 000m16 000m18 000m20 000m22 000m24 000m26 000m
0.00%
8.00%
16.01%
24.01%
32.01%
2008 2009 2010 2011 2012
0m500m
1 000m1 500m2 000m2 500m3 000m3 500m4 000m4 500m
RMNCH total
The bar chart shows RMNCH figures.
NB: Where no bar is shown, no data wasavailable for this indicator.
2010 2011 2012 2013 2014
0
5 000
10 000
15 000
20 000
25 000
30 000
Multilateral Health ODABilateral Health ODA
1. In 24 priority countries USAID will strengthencommunity-based approaches and increase coverage ofskilled birth attendance, intensify efforts to improvequality of care, and support a comprehensive approachto prevention of mother-to-child transmission (PMTCT).
2. USAID will promote zero tolerance for preventablematernal and newborn deaths by changing social normsand expectations; equipping families to practice optimalnewborn practices; increasing demand for quality care;and strengthening the links between community andhealth facilities.
4. The GHI also sets targets to reduce child under-nutritionby 30% across assisted food insecure countries; doublethe number of at-risk babies born HIV-free; and reach amodern contraceptive prevalence rate of 35% acrossassisted countries.
3. The Global Health Initiative (GHI) sets out ambitioustargets to: reduce maternal mortality by 30% acrossassisted countries; reduce mortality rates for childrenunder 5 by 35% across assisted countries.
30/68 on the Aid Transparency Index 2014
from the year 2013
The data presented in this donor profile have been collated from publicly available sources.
• OECD Total flows by donor (ODA+OOF+Private) [DAC1]: ODA total, resources through intermediaries (codes I.A and I.B)
• OECD Aid (ODA) by sector and donor [DAC5]: Health ODA total. Note that these figures are an aggregate of figures for sector codes I.2, I.3 and I.4
• Arregoces et al, Countdown to 2015: changes in official development assistance to reproductive, maternal, newborn, and child health, and assessment of progress between 2003 and 2012; The Lancet Global Health http://www.thelancet.com/pdfs/journals/langlo/PIIS2214-109X(15)00057-1.pdf): RMNCH expenditure
• International Aid Transparency Index 2013 and 2014: Transparency• Every Woman Every Child commitments database (http://www.everywomaneverychild.org/commitments/
all-commitments): Major pledges
TransparencyResources through financial intermediaries
Major Pledges
Primary Source of funds?
Financial intermediary?
Member of DAC?
Reports available on CRS?
270 Achievements and Prospects
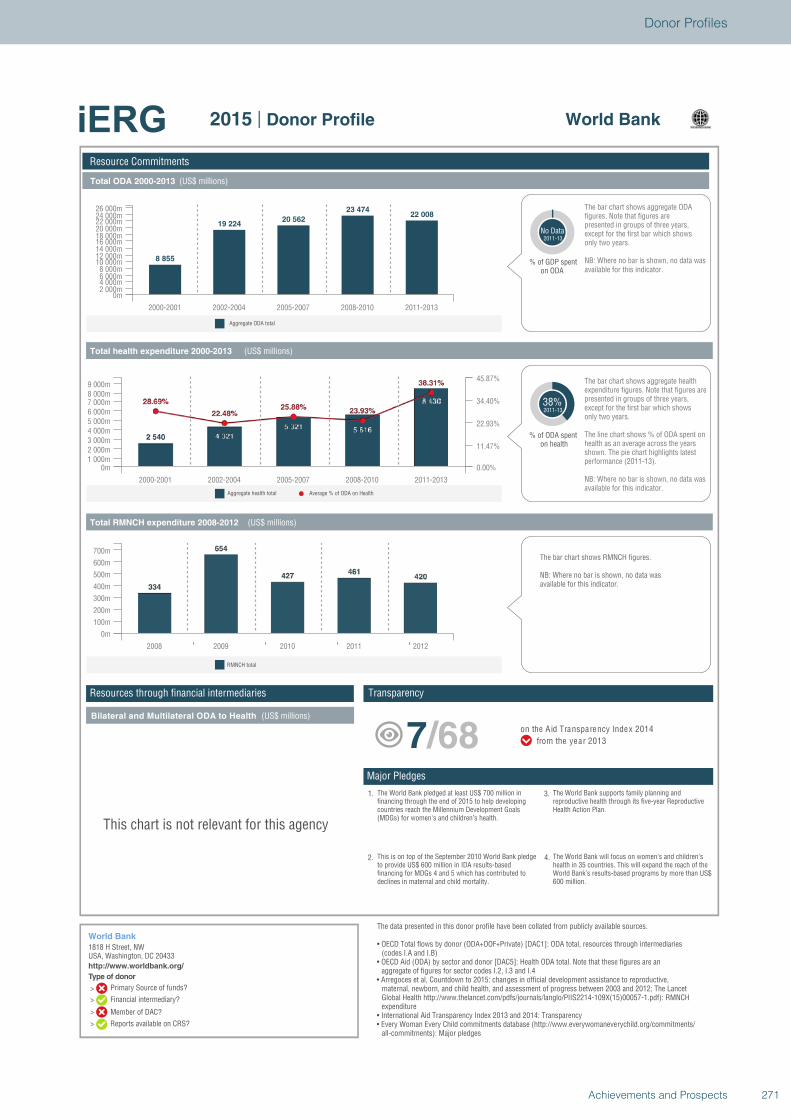
Type of donor
>
>
>
>
Total ODA 2000-2013 (US$ millions)
Total health expenditure 2000-2013 (US$ millions)
Total RMNCH expenditure 2008-2012 (US$ millions)
Bilateral and Multilateral ODA to Health (US$ millions)
Aggregate ODA total
Average % of ODA on HealthAggregate health total
Resource Commitments
World Bank
1818 H Street, NWUSA, Washington, DC 20433http://www.worldbank.org/
World Bank2015 | Donor Profile
8 855
19 22420 562
23 47422 008
2000-2001 2002-2004 2005-2007 2008-2010 2011-2013
0m2 000m4 000m6 000m8 000m
10 000m12 000m14 000m16 000m18 000m20 000m22 000m24 000m26 000m
% of GDP spenton ODA
No Data2011-13
only two years.except for the first bar which shows presented in groups of three years, figures. Note that figures are The bar chart shows aggregate ODA
NB: Where no bar is shown, no data wasavailable for this indicator.
38%2011-13
% of ODA spenton health
The bar chart shows aggregate health expenditure figures. Note that figures arepresented in groups of three years,except for the first bar which showsonly two years.
The line chart shows % of ODA spent on health as an average across the years shown. The pie chart highlights latest performance (2011-13).
NB: Where no bar is shown, no data wasavailable for this indicator.
2000-2001 2002-2004 2005-2007 2008-2010 2011-2013
0m1 000m2 000m3 000m4 000m5 000m6 000m7 000m8 000m9 000m
0.00%
11.47%
22.93%
34.40%
45.87%
2008 2009 2010 2011 2012
0m
100m
200m
300m
400m
500m
600m
700m
RMNCH total
The bar chart shows RMNCH figures.
NB: Where no bar is shown, no data wasavailable for this indicator.
This chart is not relevant for this agency
1. The World Bank pledged at least US$ 700 million infinancing through the end of 2015 to help developingcountries reach the Millennium Development Goals(MDGs) for women's and children’s health.
2. This is on top of the September 2010 World Bank pledgeto provide US$ 600 million in IDA results-basedfinancing for MDGs 4 and 5 which has contributed todeclines in maternal and child mortality.
4. The World Bank will focus on women’s and children’shealth in 35 countries. This will expand the reach of theWorld Bank’s results-based programs by more than US$600 million.
3. The World Bank supports family planning andreproductive health through its five-year ReproductiveHealth Action Plan.
7/68 on the Aid Transparency Index 2014
from the year 2013
The data presented in this donor profile have been collated from publicly available sources.
• OECD Total flows by donor (ODA+OOF+Private) [DAC1]: ODA total, resources through intermediaries (codes I.A and I.B)
• OECD Aid (ODA) by sector and donor [DAC5]: Health ODA total. Note that these figures are an aggregate of figures for sector codes I.2, I.3 and I.4
• Arregoces et al, Countdown to 2015: changes in official development assistance to reproductive, maternal, newborn, and child health, and assessment of progress between 2003 and 2012; The Lancet Global Health http://www.thelancet.com/pdfs/journals/langlo/PIIS2214-109X(15)00057-1.pdf): RMNCH expenditure
• International Aid Transparency Index 2013 and 2014: Transparency• Every Woman Every Child commitments database (http://www.everywomaneverychild.org/commitments/
all-commitments): Major pledges
TransparencyResources through financial intermediaries
Major Pledges
Primary Source of funds?
Financial intermediary?
Member of DAC?
Reports available on CRS?
271Achievements and Prospects
Donor Profiles

272 Achievements and Prospects

ANNEXES
ANNEX 1. TERMS OF REFERENCE OF THE iERG AND ITS COUNTRIES OF CONCERN
The UN Commission on Information and Accountability for Women’s and Children’s Health was established by WHO at the request of the United Nations Secretary- General to accelerate progress on the Global Strategy for Women’s and Children’s Health. The Commission was chaired by H.E. Jakaya Kikwete, President of the United Republic of Tanzania and Rt. Hon. Stephen Harper, Prime Minister of Canada, with the Director- General of WHO and the Secretary-General of ITU as vice-chairs. The Final Report of the Commission proposed an accountability framework and ten recommendations. The full Report is available online at www.everywomaneverychild.org/accountability_ commission. On the issue of global reporting, the Commission proposed a time-limited independent Expert Review Group be established and operate until 2015:
“Global oversight: Starting in 2012 and ending in 2015, an independent Expert Review Group is reporting regularly to the United Nations Secretary- General on the results and resources related to the Global Strategy and on progress in implementing this Commission’s recommendations.”
In response to Recommendation 10 (Global oversight), starting in 2012 and ending in 2015, the independent Expert Review Group (iERG) will serve as the principal global review group and report to the UN Secretary- General, through WHO Director-General.
The independent ERG will:• assess the extent to which all stakeholders honour
their commitments to the Global Strategy and the Commission; including the US$ 40 billion of commitments made in September, 2010;
• review progress in implementation of the recommendations of the Commission;
• assess progress towards greater transparency in the flow of resources and achieving results;
• identify obstacles to implementing both the Global Strategy and the Commission’s recommendations;
• identify good practice, including in policy and service delivery, accountability arrangements and value-for- money approaches relating to the health of women and children;
• make recommendations to improve the effectiveness of the accountability framework developed by the Commission.
CountriesThe global oversight covers 75 low and middle income countries with 98% of the world’s maternal and child mortality. As stated in the Strategic Workplan, these include 49 countries in the UN Global Strategy and 26 additional countries in the Countdown to 2015 (marked with *). The countries are grouped according to WHO regional classification.
African Region (AFRO)Angola*, Benin, Botswana*, Burkina Faso, Burundi, Cameroon*, Central African Republic, Chad, Comoros, Congo*, Côte d’Ivoire, Democratic Republic of the Congo, Equatorial Guinea*, Eritrea, Ethiopia, Gabon*, The Gambia, Ghana, Guinea, Guinea-Bissau, Kenya, Lesotho*, Liberia, Madagascar, Malawi, Mali, Mauritania, Mozambique, Niger, Nigeria, Rwanda, Sao Tome and Principe, Senegal, Sierra Leone, South Africa*, South Sudan*, Swaziland*, Togo, Uganda, United Republic of Tanzania, Zambia, Zimbabwe
Pan American Health Organization (PAHO)Bolivia (Plurinational State of)*, Brazil*, Guatemala*, Haiti, Mexico*, Peru*
Eastern Mediterranean Region (EMRO)Afghanistan, Djibouti*, Egypt*, Iraq*, Morocco*, Pakistan, Somalia, Sudan*, Yemen
European Region (EURO)Azerbaijan*, Kyrgyzstan, Tajikistan, Turkmenistan*, Uzbekistan
South‐East Asia Region (SEARO)Bangladesh, Democratic People’s Republic of Korea, India*, Indonesia*, Myanmar, Nepal
Western Pacific Region (WPRO)Cambodia, China*, Lao People’s Democratic Republic, Papua New Guinea, Philippines*, Solomon Islands, Viet Nam
274 Achievements and Prospects
ANNEX 2: RECOMMENDATIONS OF THE COMMISSION ON INFORMATION AND ACCOUNTABILITY FOR WOMEN’S AND CHILDREN’S HEALTH
Better information for better results• Recommendation 1 – Vital events: By 2015, all
countries have taken significant steps to establish a system for registration of births, deaths, and causes of death and have well-functioning health information systems that combine data from facilities, administrative sources, and surveys.
• Recommendation 2 – Health indicators: By 2012, the same 11 indicators on reproductive, maternal, and child health, disaggregated for gender and other equity considerations, are being used for the purpose of monitoring progress towards the goals of the Global Strategy.
• Recommendation 3 – Innovation: By 2015, all countries have integrated the use of Information and Communication Technologies in their national health information systems and health infrastructure.
Better tracking of resources for women’s and children’s health• Recommendation 4 – Resource tracking: By 2015,
all 75 countries where 98% of maternal and child deaths take place are tracking and reporting, at a minimum, two aggregate resource indicators: (i) total health expenditure by financing source, per capita and (ii) total reproductive, maternal, newborn, and child health expenditure by financing source, per capita.
• Recommendation 5 – Country compacts: By 2012, in order to facilitate resource tracking, “compacts” between country governments and all major development partners are in place that require reporting, based on a format to be agreed in each country, on externally funded expenditures and predictable commitments.
• Recommendation 6 – Reaching women and children: By 2015, all governments have the capacity to regularly review health spending (including spending on reproductive, maternal, newborn, and child health) and to relate spending to commitments, human rights, gender, and other equity goals and results.
Better oversight of results and resources: nationally and globally• Recommendation 7 – National oversight: By 2012,
all countries have established national accountability mechanisms that are transparent, that are inclusive of all stakeholders, and that recommend remedial action, as required.
• Recommendation 8 – Transparency: By 2013, all stakeholders are publicly sharing information on commitments, resources provided, and results achieved annually at both national and international levels.
• Recommendation 9 – Reporting aid for women’s and children’s health: By 2012, development partners request the OECD-DAC to agree on how to improve the Creditor Reporting System so that it can capture, in a timely manner, all reproductive, maternal, newborn, and child health spending by development partners. In the interim, development partners and the OECD implement a simple method for reporting such expenditures.
• Recommendation 10 – Global oversight: Starting in 2012 and ending in 2015, an independent “Expert Review Group” is reporting regularly to the United Nations Secretary-General on the results and resources related to the Global Strategy and on progress in implementing this Commission’s recommendations.
275Achievements and Prospects
Annexes
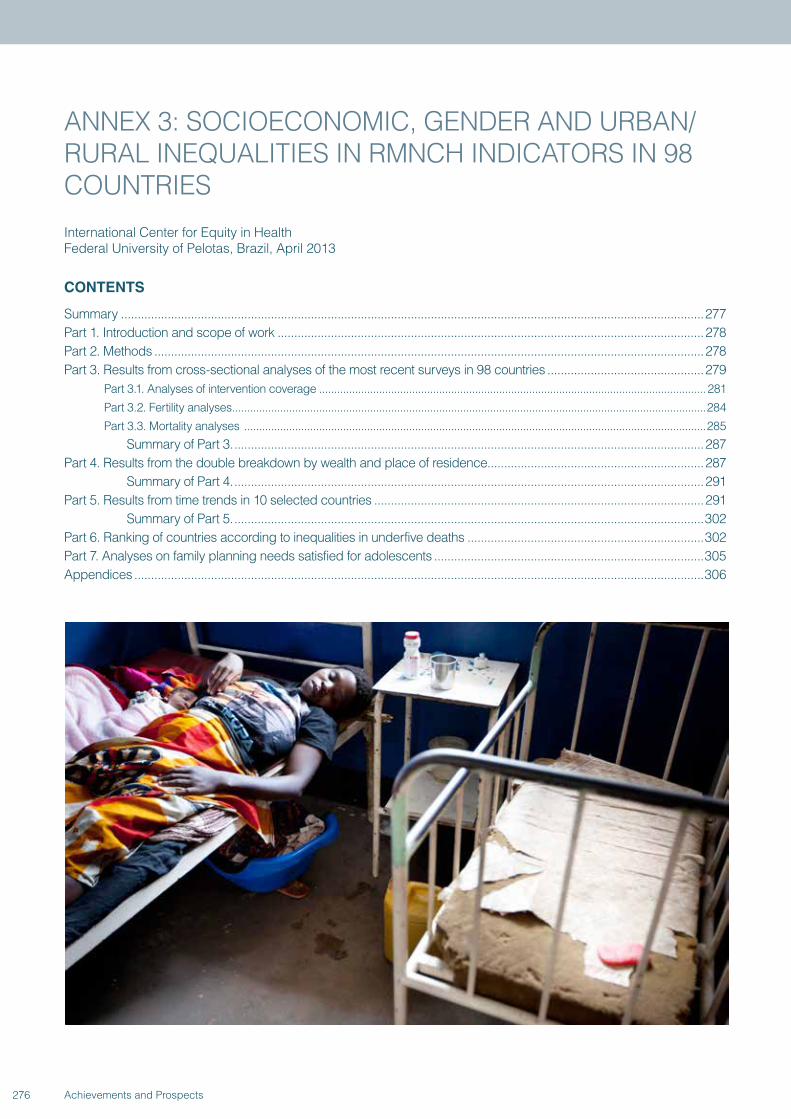
ANNEX 3: SOCIOECONOMIC, GENDER AND URBAN/RURAL INEQUALITIES IN RMNCH INDICATORS IN 98 COUNTRIES
CONTENTS
Summary ...............................................................................................................................................................................277Part 1. Introduction and scope of work ................................................................................................................................278Part 2. Methods .....................................................................................................................................................................278Part 3. Results from cross-sectional analyses of the most recent surveys in 98 countries ...............................................279
Part 3.1. Analyses of intervention coverage .................................................................................................................................281
Part 3.2. Fertility analyses ..............................................................................................................................................................284
Part 3.3. Mortality analyses ..........................................................................................................................................................285
Summary of Part 3. .............................................................................................................................................287Part 4. Results from the double breakdown by wealth and place of residence.................................................................287
Summary of Part 4. .............................................................................................................................................291Part 5. Results from time trends in 10 selected countries ...................................................................................................291
Summary of Part 5. .............................................................................................................................................302Part 6. Ranking of countries according to inequalities in underfive deaths .......................................................................302Part 7. Analyses on family planning needs satisfied for adolescents .................................................................................305Appendices ...........................................................................................................................................................................306
International Center for Equity in Health Federal University of Pelotas, Brazil, April 2013
276 Achievements and Prospects
Summary
This report include four sets of analyses of inequalities in the health of mothers and children, based on survey data from 98 low- and middle-income countries. The main results are presented in the body of the report, and detailed results for all countries are provided as appendices.
Part 1 of the report describes the background and objectives of the analyses, and Part 2 the data sources and methodology.
Part 3 reports on the breakdowns of 11 indicators of interest to the iERG according to wealth quintiles, sex of the child, and urban/rural residence. Seven indicators of intervention coverage were analysed: family planning needs satisfied; antenatal care; skilled birth attendance; postnatal care; exclusive breastfeeding; DPT3 vaccine; and pneumonia careseeking. Except for breastfeeding, all other indicators showed clear pro-rich and pro-urban inequalities. Sex differences in coverage were virtually non-existent. Skilled attendance at birth and antenatal care were the most inequitable, and exclusive breastfeeding the most equitable, but at low levels in all wealth quintiles. DPT3 vaccine showed the best combination of high coverage and small inequalities. The magnitude of inequalities in coverage varied by region, with smaller gaps in CEE/CIS, Latin America & Caribbean, and the Middle East & North Africa, and wider gaps in South Asia and sub-Saharan Africa.
There were twice as many children per women in rural than in urban areas, and wealth-related gaps were also large. The largest inequalities in fertility were observed in sub-Saharan Africa.
Stunting and underfive mortality rates were about twice as high in the poorest quintile compared to the richest. Meanwhile, inequalities in neonatal mortality were less marked.
Important inequalities in stunting and underfive mortality were observed within all regions of the world.
In Part 4, all indicators are broken down into ten population subgroups according to place of residence
(urban or rural) and wealth quintiles (five groups). When results from all countries are averaged, skilled birth attendance coverage is higher, and fertility lower, in urban compared to rural areas within each wealth quintile. Stunting prevalence is similar in urban and rural children in any given quintile. Underfive mortality rates are also similar, except for in the richest quintile where urban children are less likely to die than rural children. Detailed analyses of the 10 countries of interest to the iERG confirm these general patterns, but also indicate that there may be substantial variations from country to country.
Part 5 shows analyses of the time trends in inequalities for these 10 countries. Inequalities increased for skilled birth attendance in Bangladesh and fertility in Rwanda. In all other analyses, inequalities were unchanged or reduced. Notably, absolute inequalities in underfive mortality fell in all 10 countries, including Kenya where the reduction was small. As mentioned earlier, reductions in absolute inequalities (difference in U5MR between poor and rich) are not always accompanied by reductions in relative inequalities (ratio of U5MR between poor and rich). Of eight countries with data on stunting, inequalities fell in only two, Colombia and Egypt, and possibly in Senegal. Overall, the best performing countries were Colombia and Egypt, where inequalities fell for all four indicators under study, and the worst performers were Kenya and Nigeria.
Part 6 includes a ranking of countries with available data, according to the proportion of all underfive deaths that occur in the poorest quintile. This proportion is affected both by differential fertility and by differential mortality across the wealth quintiles. The leading countries were Brazil, Guatemala, Philippines, Turkey, Viet Nam, and Bolivia, whereas the most equitable countries were Kyrgyzstan, Zambia, Ukraine, Niger, and Chad.
Part 7 shows an analysis of family planning according to the woman’s age, showing how adolescent women tend to have lower coverage levels in many countries, particularly adolescents aged under 18 years.
277Achievements and Prospects
Annexes
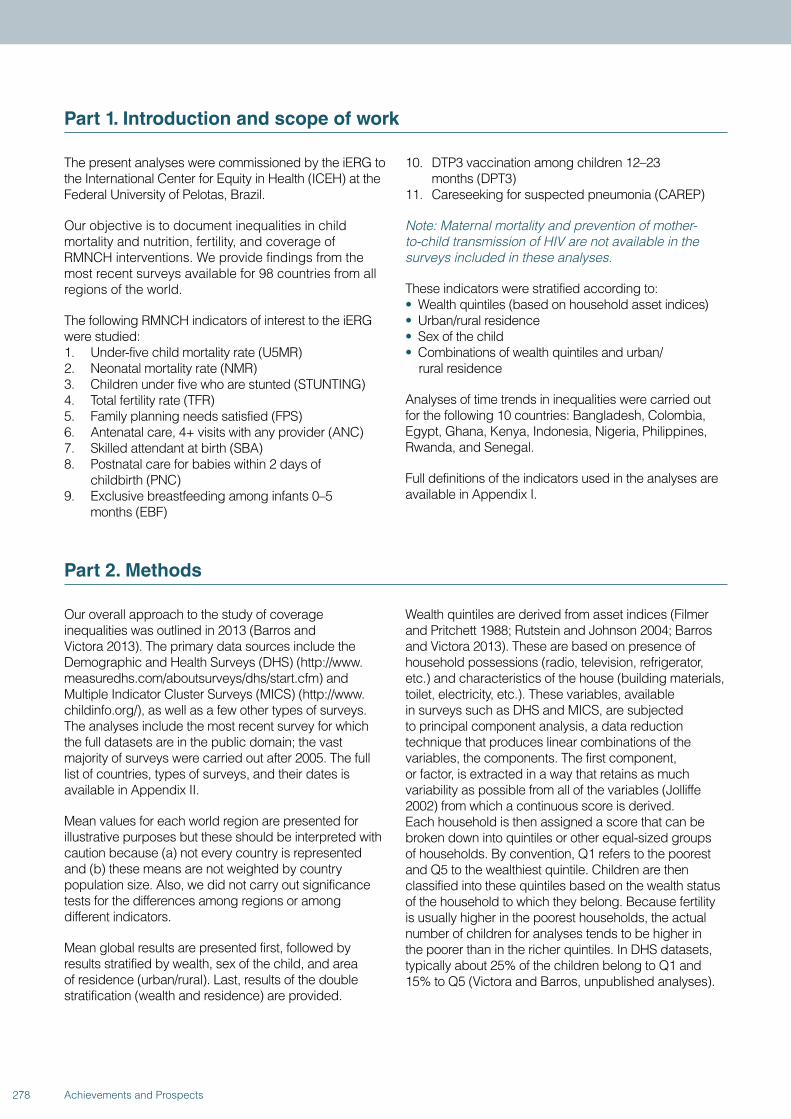
Part 1. Introduction and scope of work
The present analyses were commissioned by the iERG to the International Center for Equity in Health (ICEH) at the Federal University of Pelotas, Brazil.
Our objective is to document inequalities in child mortality and nutrition, fertility, and coverage of RMNCH interventions. We provide findings from the most recent surveys available for 98 countries from all regions of the world.
The following RMNCH indicators of interest to the iERG were studied: 1. Under-five child mortality rate (U5MR) 2. Neonatal mortality rate (NMR)3. Children under five who are stunted (STUNTING) 4. Total fertility rate (TFR)5. Family planning needs satisfied (FPS)6. Antenatal care, 4+ visits with any provider (ANC)7. Skilled attendant at birth (SBA)8. Postnatal care for babies within 2 days of
childbirth (PNC)9. Exclusive breastfeeding among infants 0–5
months (EBF)
10. DTP3 vaccination among children 12–23 months (DPT3)
11. Careseeking for suspected pneumonia (CAREP)
Note: Maternal mortality and prevention of mother-to-child transmission of HIV are not available in the surveys included in these analyses.
These indicators were stratified according to:• Wealth quintiles (based on household asset indices)• Urban/rural residence• Sex of the child• Combinations of wealth quintiles and urban/
rural residence
Analyses of time trends in inequalities were carried out for the following 10 countries: Bangladesh, Colombia, Egypt, Ghana, Kenya, Indonesia, Nigeria, Philippines, Rwanda, and Senegal.
Full definitions of the indicators used in the analyses are available in Appendix I.
Part 2. Methods
Our overall approach to the study of coverage inequalities was outlined in 2013 (Barros and Victora 2013). The primary data sources include the Demographic and Health Surveys (DHS) (http://www.measuredhs.com/aboutsurveys/dhs/start.cfm) and Multiple Indicator Cluster Surveys (MICS) (http://www.childinfo.org/), as well as a few other types of surveys. The analyses include the most recent survey for which the full datasets are in the public domain; the vast majority of surveys were carried out after 2005. The full list of countries, types of surveys, and their dates is available in Appendix II.
Mean values for each world region are presented for illustrative purposes but these should be interpreted with caution because (a) not every country is represented and (b) these means are not weighted by country population size. Also, we did not carry out significance tests for the differences among regions or among different indicators.
Mean global results are presented first, followed by results stratified by wealth, sex of the child, and area of residence (urban/rural). Last, results of the double stratification (wealth and residence) are provided.
Wealth quintiles are derived from asset indices (Filmer and Pritchett 1988; Rutstein and Johnson 2004; Barros and Victora 2013). These are based on presence of household possessions (radio, television, refrigerator, etc.) and characteristics of the house (building materials, toilet, electricity, etc.). These variables, available in surveys such as DHS and MICS, are subjected to principal component analysis, a data reduction technique that produces linear combinations of the variables, the components. The first component, or factor, is extracted in a way that retains as much variability as possible from all of the variables (Jolliffe 2002) from which a continuous score is derived. Each household is then assigned a score that can be broken down into quintiles or other equal-sized groups of households. By convention, Q1 refers to the poorest and Q5 to the wealthiest quintile. Children are then classified into these quintiles based on the wealth status of the household to which they belong. Because fertility is usually higher in the poorest households, the actual number of children for analyses tends to be higher in the poorer than in the richer quintiles. In DHS datasets, typically about 25% of the children belong to Q1 and 15% to Q5 (Victora and Barros, unpublished analyses).
278 Achievements and Prospects
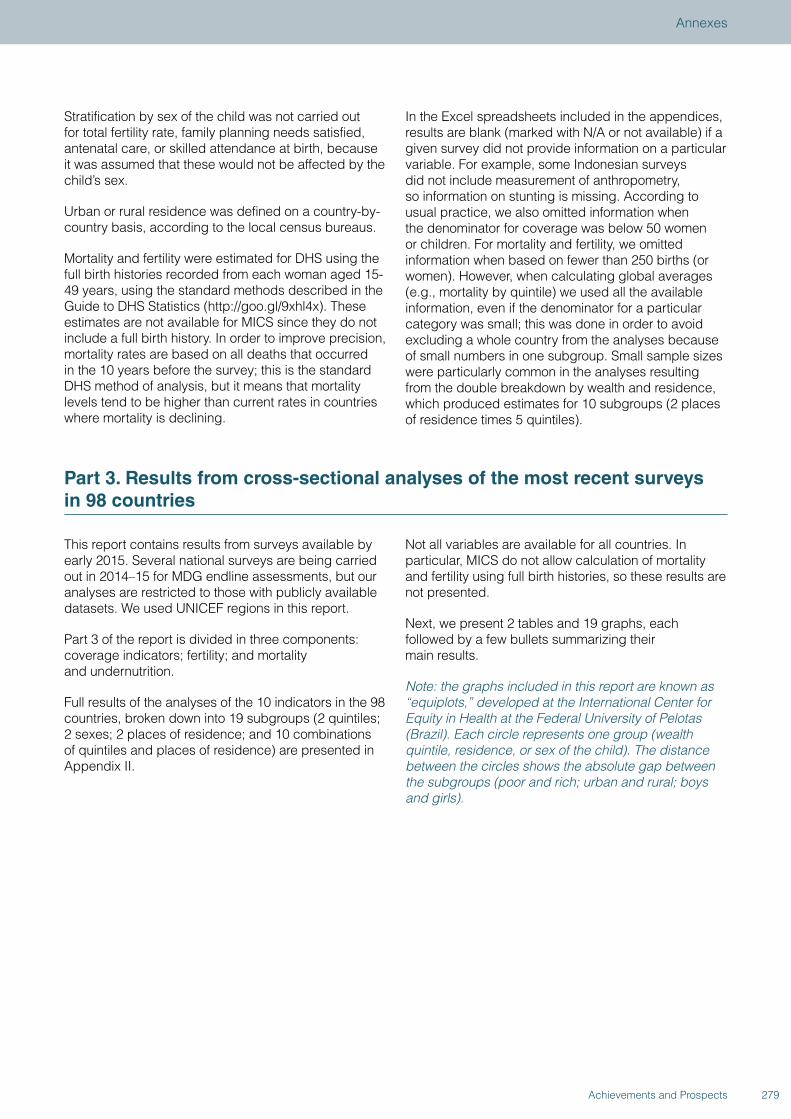
Stratification by sex of the child was not carried out for total fertility rate, family planning needs satisfied, antenatal care, or skilled attendance at birth, because it was assumed that these would not be affected by the child’s sex.
Urban or rural residence was defined on a country-by-country basis, according to the local census bureaus.
Mortality and fertility were estimated for DHS using the full birth histories recorded from each woman aged 15-49 years, using the standard methods described in the Guide to DHS Statistics (http://goo.gl/9xhl4x). These estimates are not available for MICS since they do not include a full birth history. In order to improve precision, mortality rates are based on all deaths that occurred in the 10 years before the survey; this is the standard DHS method of analysis, but it means that mortality levels tend to be higher than current rates in countries where mortality is declining.
In the Excel spreadsheets included in the appendices, results are blank (marked with N/A or not available) if a given survey did not provide information on a particular variable. For example, some Indonesian surveys did not include measurement of anthropometry, so information on stunting is missing. According to usual practice, we also omitted information when the denominator for coverage was below 50 women or children. For mortality and fertility, we omitted information when based on fewer than 250 births (or women). However, when calculating global averages (e.g., mortality by quintile) we used all the available information, even if the denominator for a particular category was small; this was done in order to avoid excluding a whole country from the analyses because of small numbers in one subgroup. Small sample sizes were particularly common in the analyses resulting from the double breakdown by wealth and residence, which produced estimates for 10 subgroups (2 places of residence times 5 quintiles).
Part 3. Results from cross-sectional analyses of the most recent surveys in 98 countries
This report contains results from surveys available by early 2015. Several national surveys are being carried out in 2014–15 for MDG endline assessments, but our analyses are restricted to those with publicly available datasets. We used UNICEF regions in this report.
Part 3 of the report is divided in three components: coverage indicators; fertility; and mortality and undernutrition.
Full results of the analyses of the 10 indicators in the 98 countries, broken down into 19 subgroups (2 quintiles; 2 sexes; 2 places of residence; and 10 combinations of quintiles and places of residence) are presented in Appendix II.
Not all variables are available for all countries. In particular, MICS do not allow calculation of mortality and fertility using full birth histories, so these results are not presented.
Next, we present 2 tables and 19 graphs, each followed by a few bullets summarizing their main results.
Note: the graphs included in this report are known as “equiplots,” developed at the International Center for Equity in Health at the Federal University of Pelotas (Brazil). Each circle represents one group (wealth quintile, residence, or sex of the child). The distance between the circles shows the absolute gap between the subgroups (poor and rich; urban and rural; boys and girls).
279Achievements and Prospects
Annexes
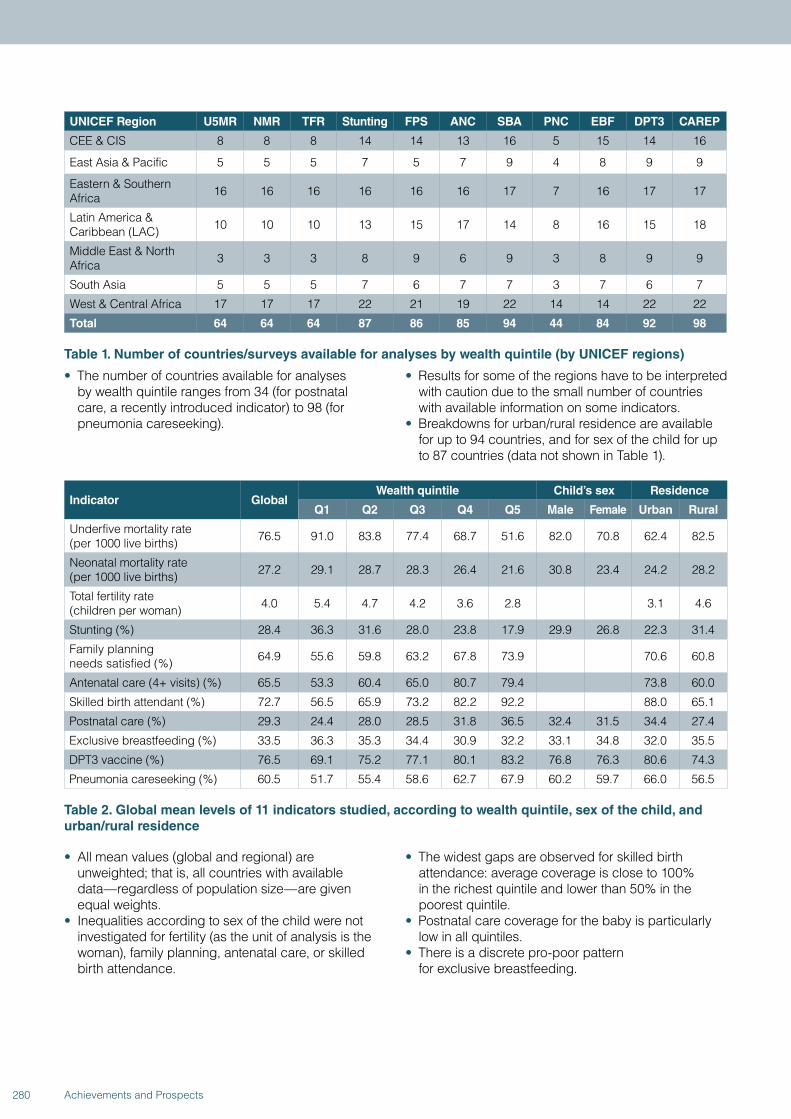
UNICEF Region U5MR NMR TFR Stunting FPS ANC SBA PNC EBF DPT3 CAREP
CEE & CIS 8 8 8 14 14 13 16 5 15 14 16
East Asia & Pacific 5 5 5 7 5 7 9 4 8 9 9
Eastern & Southern Africa 16 16 16 16 16 16 17 7 16 17 17
Latin America & Caribbean (LAC) 10 10 10 13 15 17 14 8 16 15 18
Middle East & North Africa 3 3 3 8 9 6 9 3 8 9 9
South Asia 5 5 5 7 6 7 7 3 7 6 7
West & Central Africa 17 17 17 22 21 19 22 14 14 22 22
Total 64 64 64 87 86 85 94 44 84 92 98
Table 1. Number of countries/surveys available for analyses by wealth quintile (by UNICEF regions)
• The number of countries available for analyses by wealth quintile ranges from 34 (for postnatal care, a recently introduced indicator) to 98 (for pneumonia careseeking).
• Results for some of the regions have to be interpreted with caution due to the small number of countries with available information on some indicators.
• Breakdowns for urban/rural residence are available for up to 94 countries, and for sex of the child for up to 87 countries (data not shown in Table 1).
Indicator GlobalWealth quintile Child’s sex Residence
Q1 Q2 Q3 Q4 Q5 Male Female Urban Rural
Underfive mortality rate (per 1000 live births) 76.5 91.0 83.8 77.4 68.7 51.6 82.0 70.8 62.4 82.5
Neonatal mortality rate (per 1000 live births) 27.2 29.1 28.7 28.3 26.4 21.6 30.8 23.4 24.2 28.2
Total fertility rate (children per woman) 4.0 5.4 4.7 4.2 3.6 2.8 3.1 4.6
Stunting (%) 28.4 36.3 31.6 28.0 23.8 17.9 29.9 26.8 22.3 31.4
Family planning needs satisfied (%) 64.9 55.6 59.8 63.2 67.8 73.9 70.6 60.8
Antenatal care (4+ visits) (%) 65.5 53.3 60.4 65.0 80.7 79.4 73.8 60.0
Skilled birth attendant (%) 72.7 56.5 65.9 73.2 82.2 92.2 88.0 65.1
Postnatal care (%) 29.3 24.4 28.0 28.5 31.8 36.5 32.4 31.5 34.4 27.4
Exclusive breastfeeding (%) 33.5 36.3 35.3 34.4 30.9 32.2 33.1 34.8 32.0 35.5
DPT3 vaccine (%) 76.5 69.1 75.2 77.1 80.1 83.2 76.8 76.3 80.6 74.3
Pneumonia careseeking (%) 60.5 51.7 55.4 58.6 62.7 67.9 60.2 59.7 66.0 56.5
Table 2. Global mean levels of 11 indicators studied, according to wealth quintile, sex of the child, and urban/rural residence
• All mean values (global and regional) are unweighted; that is, all countries with available data—regardless of population size—are given equal weights.
• Inequalities according to sex of the child were not investigated for fertility (as the unit of analysis is the woman), family planning, antenatal care, or skilled birth attendance.
• The widest gaps are observed for skilled birth attendance: average coverage is close to 100% in the richest quintile and lower than 50% in the poorest quintile.
• Postnatal care coverage for the baby is particularly low in all quintiles.
• There is a discrete pro-poor pattern for exclusive breastfeeding.
280 Achievements and Prospects
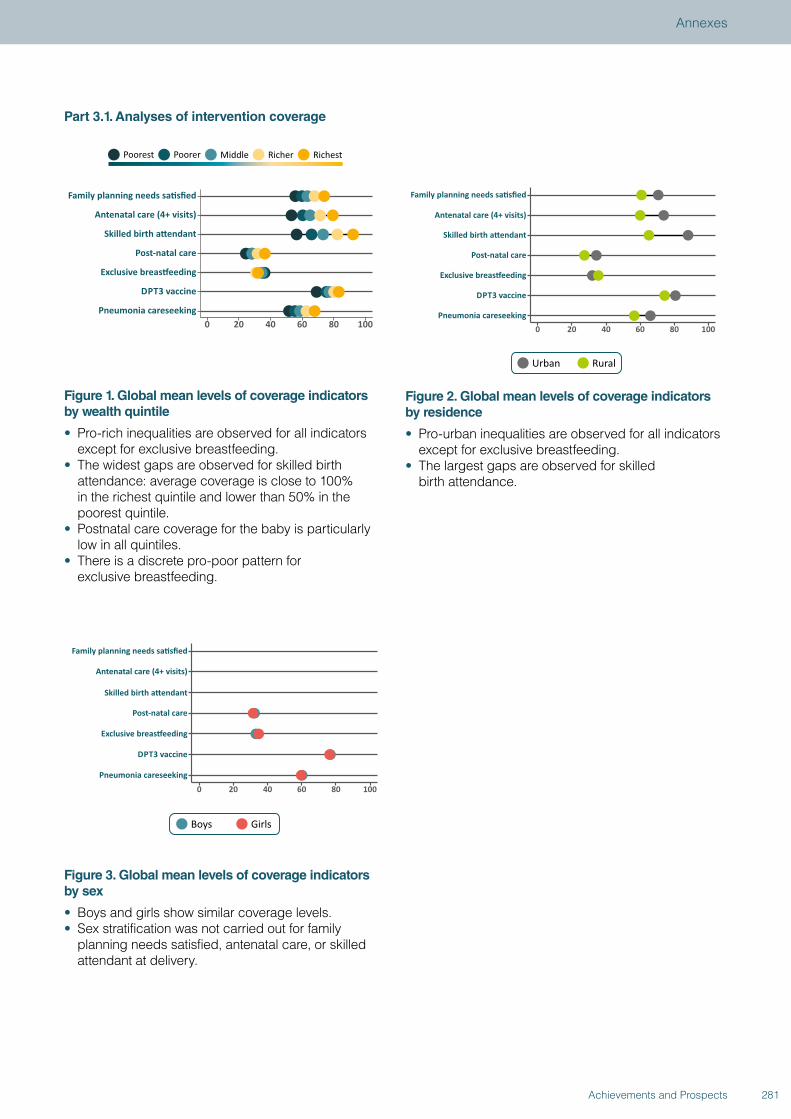
Part 3.1. Analyses of intervention coverage
Figure 1. Global mean levels of coverage indicators by wealth quintile
• Pro-rich inequalities are observed for all indicators except for exclusive breastfeeding.
• The widest gaps are observed for skilled birth attendance: average coverage is close to 100% in the richest quintile and lower than 50% in the poorest quintile.
• Postnatal care coverage for the baby is particularly low in all quintiles.
• There is a discrete pro-poor pattern for exclusive breastfeeding.
Figure 2. Global mean levels of coverage indicators by residence
• Pro-urban inequalities are observed for all indicators except for exclusive breastfeeding.
• The largest gaps are observed for skilled birth attendance.
Figure 3. Global mean levels of coverage indicators by sex
• Boys and girls show similar coverage levels.• Sex stratification was not carried out for family
planning needs satisfied, antenatal care, or skilled attendant at delivery.
281Achievements and Prospects
Annexes
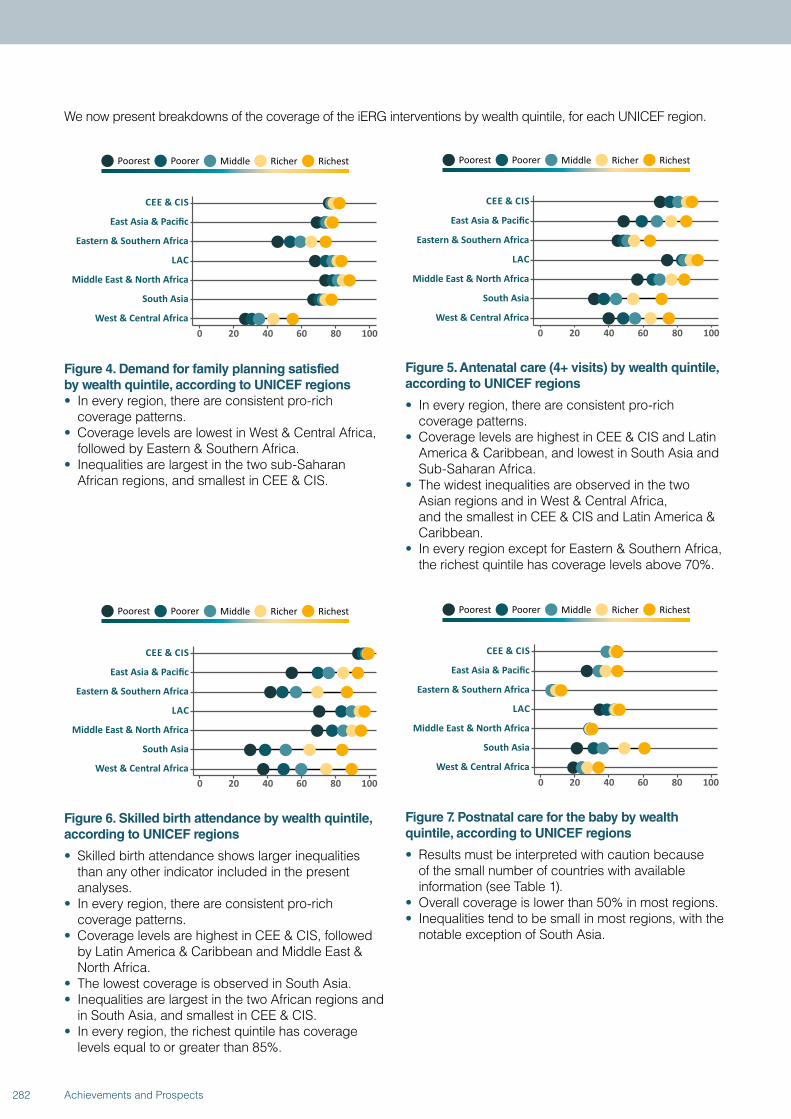
We now present breakdowns of the coverage of the iERG interventions by wealth quintile, for each UNICEF region.
Figure 4. Demand for family planning satisfied by wealth quintile, according to UNICEF regions• In every region, there are consistent pro-rich
coverage patterns.• Coverage levels are lowest in West & Central Africa,
followed by Eastern & Southern Africa.• Inequalities are largest in the two sub-Saharan
African regions, and smallest in CEE & CIS.
Figure 5. Antenatal care (4+ visits) by wealth quintile, according to UNICEF regions
• In every region, there are consistent pro-rich coverage patterns.
• Coverage levels are highest in CEE & CIS and Latin America & Caribbean, and lowest in South Asia and Sub-Saharan Africa.
• The widest inequalities are observed in the two Asian regions and in West & Central Africa, and the smallest in CEE & CIS and Latin America & Caribbean.
• In every region except for Eastern & Southern Africa, the richest quintile has coverage levels above 70%.
Figure 6. Skilled birth attendance by wealth quintile, according to UNICEF regions
• Skilled birth attendance shows larger inequalities than any other indicator included in the present analyses.
• In every region, there are consistent pro-rich coverage patterns.
• Coverage levels are highest in CEE & CIS, followed by Latin America & Caribbean and Middle East & North Africa.
• The lowest coverage is observed in South Asia.• Inequalities are largest in the two African regions and
in South Asia, and smallest in CEE & CIS.• In every region, the richest quintile has coverage
levels equal to or greater than 85%.
Figure 7. Postnatal care for the baby by wealth quintile, according to UNICEF regions
• Results must be interpreted with caution because of the small number of countries with available information (see Table 1).
• Overall coverage is lower than 50% in most regions.• Inequalities tend to be small in most regions, with the
notable exception of South Asia.
282 Achievements and Prospects
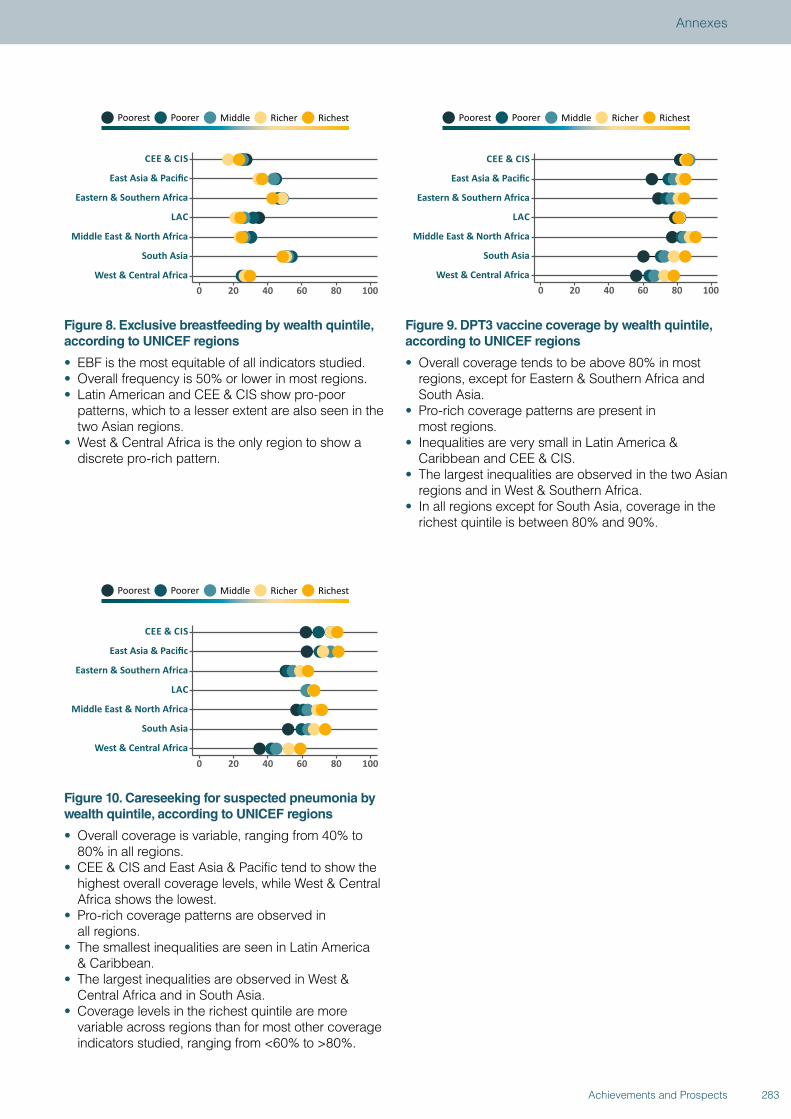
Figure 8. Exclusive breastfeeding by wealth quintile, according to UNICEF regions
• EBF is the most equitable of all indicators studied. • Overall frequency is 50% or lower in most regions.• Latin American and CEE & CIS show pro-poor
patterns, which to a lesser extent are also seen in the two Asian regions.
• West & Central Africa is the only region to show a discrete pro-rich pattern.
Figure 9. DPT3 vaccine coverage by wealth quintile, according to UNICEF regions
• Overall coverage tends to be above 80% in most regions, except for Eastern & Southern Africa and South Asia.
• Pro-rich coverage patterns are present in most regions.
• Inequalities are very small in Latin America & Caribbean and CEE & CIS.
• The largest inequalities are observed in the two Asian regions and in West & Southern Africa.
• In all regions except for South Asia, coverage in the richest quintile is between 80% and 90%.
Figure 10. Careseeking for suspected pneumonia by wealth quintile, according to UNICEF regions
• Overall coverage is variable, ranging from 40% to 80% in all regions.
• CEE & CIS and East Asia & Pacific tend to show the highest overall coverage levels, while West & Central Africa shows the lowest.
• Pro-rich coverage patterns are observed in all regions.
• The smallest inequalities are seen in Latin America & Caribbean.
• The largest inequalities are observed in West & Central Africa and in South Asia.
• Coverage levels in the richest quintile are more variable across regions than for most other coverage indicators studied, ranging from <60% to >80%.
283Achievements and Prospects
Annexes
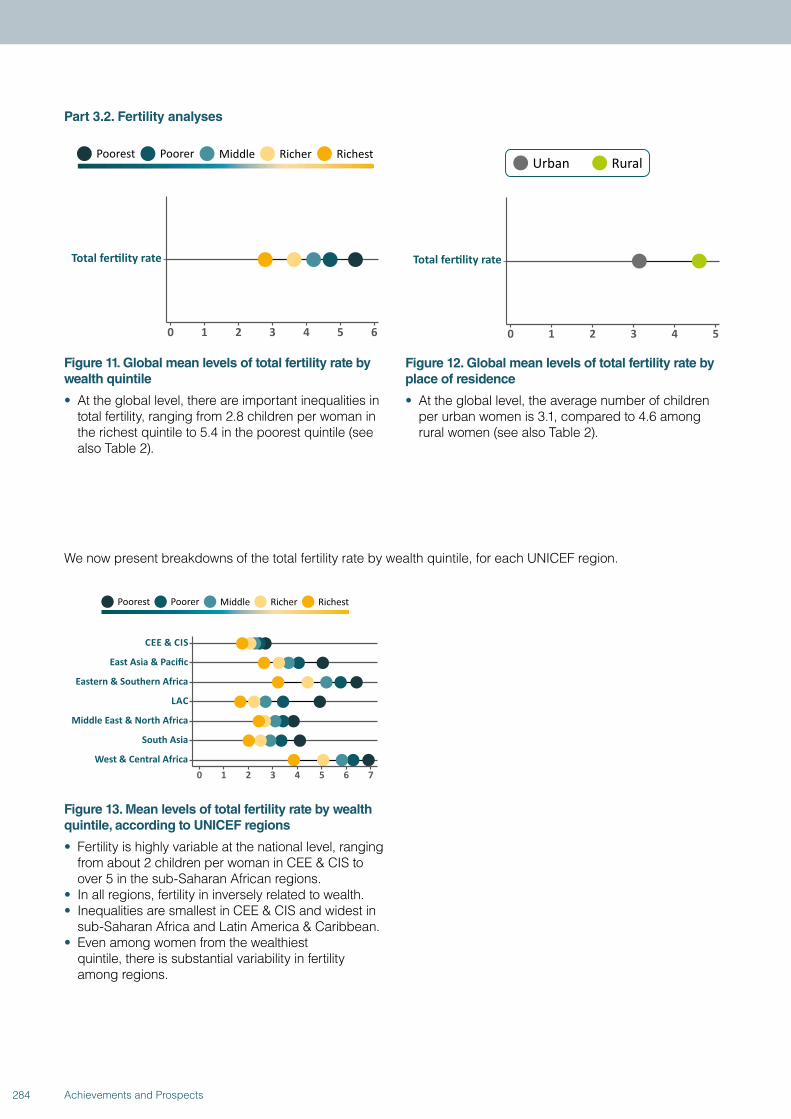
Part 3.2. Fertility analyses
Figure 11. Global mean levels of total fertility rate by wealth quintile
• At the global level, there are important inequalities in total fertility, ranging from 2.8 children per woman in the richest quintile to 5.4 in the poorest quintile (see also Table 2).
Figure 12. Global mean levels of total fertility rate by place of residence
• At the global level, the average number of children per urban women is 3.1, compared to 4.6 among rural women (see also Table 2).
We now present breakdowns of the total fertility rate by wealth quintile, for each UNICEF region.
Figure 13. Mean levels of total fertility rate by wealth quintile, according to UNICEF regions
• Fertility is highly variable at the national level, ranging from about 2 children per woman in CEE & CIS to over 5 in the sub-Saharan African regions.
• In all regions, fertility in inversely related to wealth.• Inequalities are smallest in CEE & CIS and widest in
sub-Saharan Africa and Latin America & Caribbean.• Even among women from the wealthiest
quintile, there is substantial variability in fertility among regions.
284 Achievements and Prospects
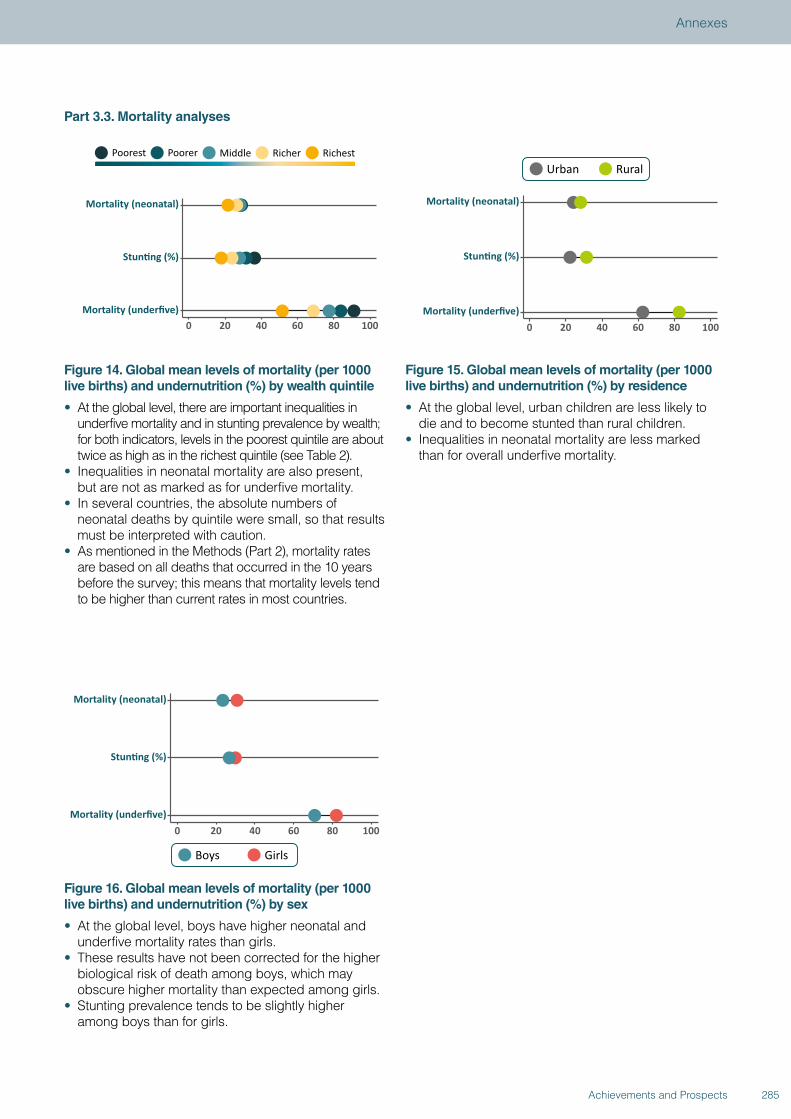
Part 3.3. Mortality analyses
Figure 14. Global mean levels of mortality (per 1000 live births) and undernutrition (%) by wealth quintile
• At the global level, there are important inequalities in underfive mortality and in stunting prevalence by wealth; for both indicators, levels in the poorest quintile are about twice as high as in the richest quintile (see Table 2).
• Inequalities in neonatal mortality are also present, but are not as marked as for underfive mortality.
• In several countries, the absolute numbers of neonatal deaths by quintile were small, so that results must be interpreted with caution.
• As mentioned in the Methods (Part 2), mortality rates are based on all deaths that occurred in the 10 years before the survey; this means that mortality levels tend to be higher than current rates in most countries.
Figure 15. Global mean levels of mortality (per 1000 live births) and undernutrition (%) by residence
• At the global level, urban children are less likely to die and to become stunted than rural children.
• Inequalities in neonatal mortality are less marked than for overall underfive mortality.
Figure 16. Global mean levels of mortality (per 1000 live births) and undernutrition (%) by sex
• At the global level, boys have higher neonatal and underfive mortality rates than girls.
• These results have not been corrected for the higher biological risk of death among boys, which may obscure higher mortality than expected among girls.
• Stunting prevalence tends to be slightly higher among boys than for girls.
285Achievements and Prospects
Annexes
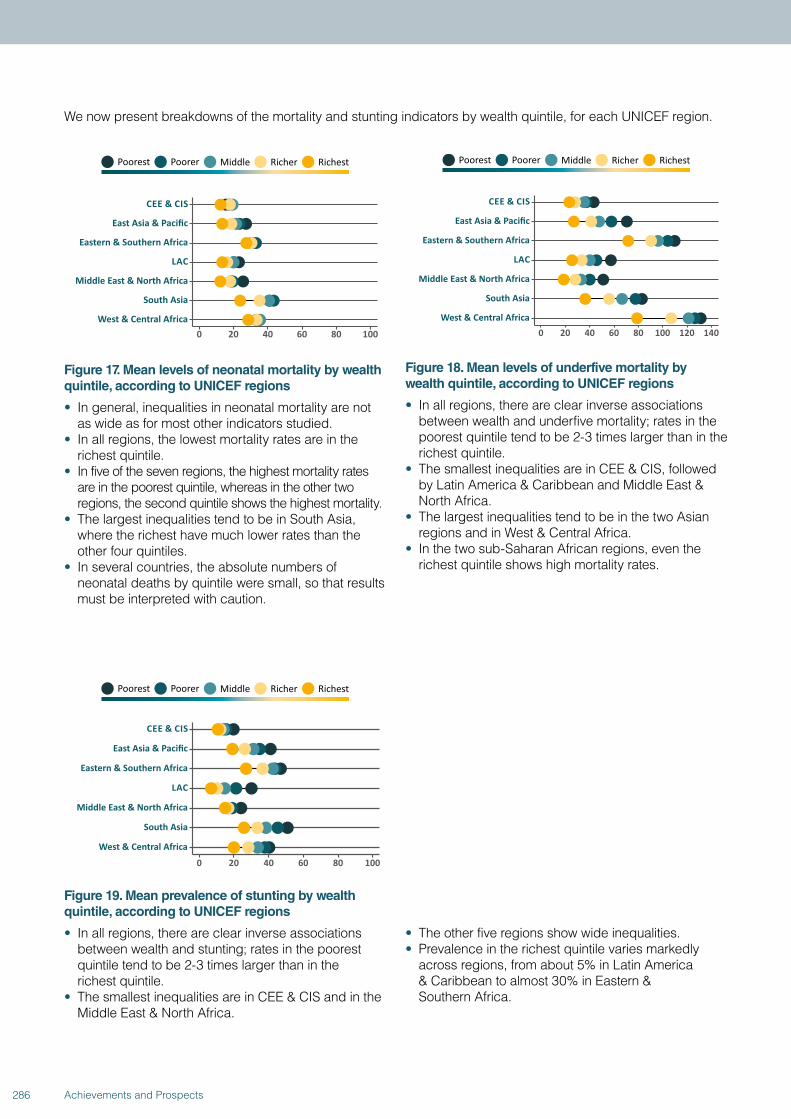
We now present breakdowns of the mortality and stunting indicators by wealth quintile, for each UNICEF region.
Figure 17. Mean levels of neonatal mortality by wealth quintile, according to UNICEF regions
• In general, inequalities in neonatal mortality are not as wide as for most other indicators studied.
• In all regions, the lowest mortality rates are in the richest quintile.
• In five of the seven regions, the highest mortality rates are in the poorest quintile, whereas in the other two regions, the second quintile shows the highest mortality.
• The largest inequalities tend to be in South Asia, where the richest have much lower rates than the other four quintiles.
• In several countries, the absolute numbers of neonatal deaths by quintile were small, so that results must be interpreted with caution.
Figure 18. Mean levels of underfive mortality by wealth quintile, according to UNICEF regions
• In all regions, there are clear inverse associations between wealth and underfive mortality; rates in the poorest quintile tend to be 2-3 times larger than in the richest quintile.
• The smallest inequalities are in CEE & CIS, followed by Latin America & Caribbean and Middle East & North Africa.
• The largest inequalities tend to be in the two Asian regions and in West & Central Africa.
• In the two sub-Saharan African regions, even the richest quintile shows high mortality rates.
Figure 19. Mean prevalence of stunting by wealth quintile, according to UNICEF regions
• In all regions, there are clear inverse associations between wealth and stunting; rates in the poorest quintile tend to be 2-3 times larger than in the richest quintile.
• The smallest inequalities are in CEE & CIS and in the Middle East & North Africa.
• The other five regions show wide inequalities.• Prevalence in the richest quintile varies markedly
across regions, from about 5% in Latin America & Caribbean to almost 30% in Eastern & Southern Africa.
286 Achievements and Prospects
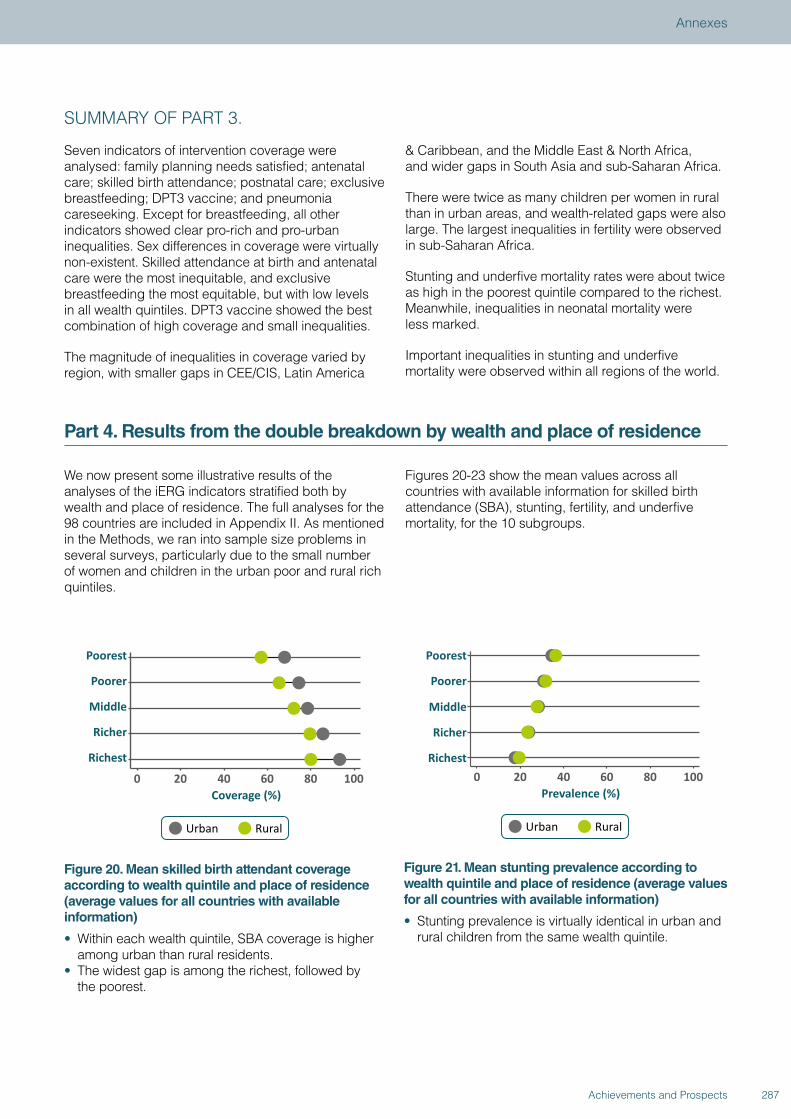
SUMMARY OF PART 3.
Seven indicators of intervention coverage were analysed: family planning needs satisfied; antenatal care; skilled birth attendance; postnatal care; exclusive breastfeeding; DPT3 vaccine; and pneumonia careseeking. Except for breastfeeding, all other indicators showed clear pro-rich and pro-urban inequalities. Sex differences in coverage were virtually non-existent. Skilled attendance at birth and antenatal care were the most inequitable, and exclusive breastfeeding the most equitable, but with low levels in all wealth quintiles. DPT3 vaccine showed the best combination of high coverage and small inequalities.
The magnitude of inequalities in coverage varied by region, with smaller gaps in CEE/CIS, Latin America
& Caribbean, and the Middle East & North Africa, and wider gaps in South Asia and sub-Saharan Africa.
There were twice as many children per women in rural than in urban areas, and wealth-related gaps were also large. The largest inequalities in fertility were observed in sub-Saharan Africa.
Stunting and underfive mortality rates were about twice as high in the poorest quintile compared to the richest. Meanwhile, inequalities in neonatal mortality were less marked.
Important inequalities in stunting and underfive mortality were observed within all regions of the world.
Part 4. Results from the double breakdown by wealth and place of residence
We now present some illustrative results of the analyses of the iERG indicators stratified both by wealth and place of residence. The full analyses for the 98 countries are included in Appendix II. As mentioned in the Methods, we ran into sample size problems in several surveys, particularly due to the small number of women and children in the urban poor and rural rich quintiles.
Figures 20-23 show the mean values across all countries with available information for skilled birth attendance (SBA), stunting, fertility, and underfive mortality, for the 10 subgroups.
Figure 20. Mean skilled birth attendant coverage according to wealth quintile and place of residence (average values for all countries with available information)
• Within each wealth quintile, SBA coverage is higher among urban than rural residents.
• The widest gap is among the richest, followed by the poorest.
Figure 21. Mean stunting prevalence according to wealth quintile and place of residence (average values for all countries with available information)
• Stunting prevalence is virtually identical in urban and rural children from the same wealth quintile.
287Achievements and Prospects
Annexes
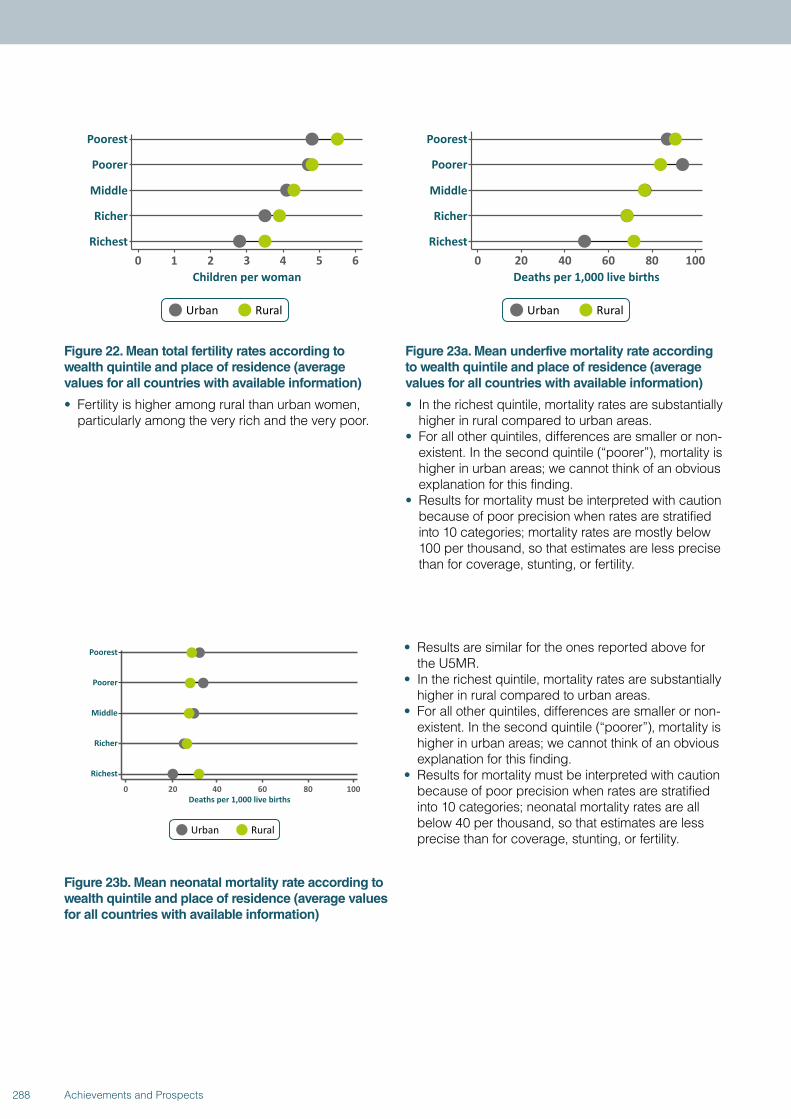
Figure 22. Mean total fertility rates according to wealth quintile and place of residence (average values for all countries with available information)
• Fertility is higher among rural than urban women, particularly among the very rich and the very poor.
Figure 23a. Mean underfive mortality rate according to wealth quintile and place of residence (average values for all countries with available information)
• In the richest quintile, mortality rates are substantially higher in rural compared to urban areas.
• For all other quintiles, differences are smaller or non-existent. In the second quintile (“poorer”), mortality is higher in urban areas; we cannot think of an obvious explanation for this finding.
• Results for mortality must be interpreted with caution because of poor precision when rates are stratified into 10 categories; mortality rates are mostly below 100 per thousand, so that estimates are less precise than for coverage, stunting, or fertility.
Figure 23b. Mean neonatal mortality rate according to wealth quintile and place of residence (average values for all countries with available information)
• Results are similar for the ones reported above for the U5MR.
• In the richest quintile, mortality rates are substantially higher in rural compared to urban areas.
• For all other quintiles, differences are smaller or non-existent. In the second quintile (“poorer”), mortality is higher in urban areas; we cannot think of an obvious explanation for this finding.
• Results for mortality must be interpreted with caution because of poor precision when rates are stratified into 10 categories; neonatal mortality rates are all below 40 per thousand, so that estimates are less precise than for coverage, stunting, or fertility.
288 Achievements and Prospects
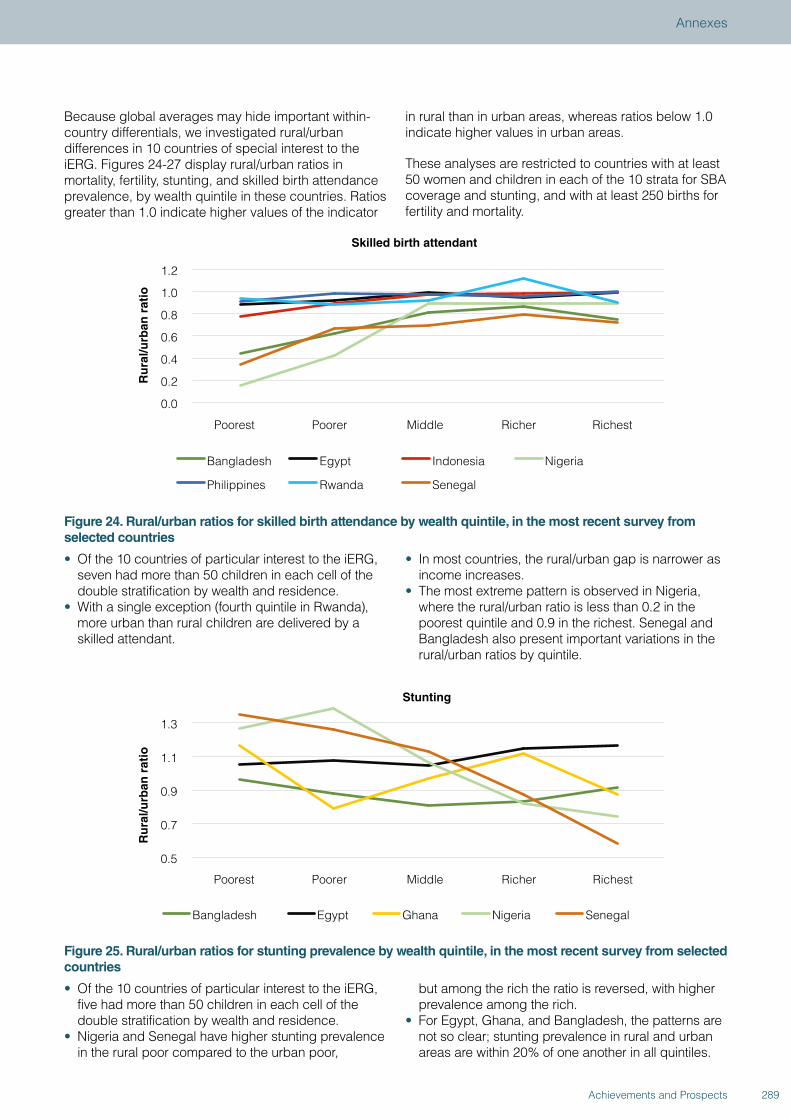
Because global averages may hide important within-country differentials, we investigated rural/urban differences in 10 countries of special interest to the iERG. Figures 24-27 display rural/urban ratios in mortality, fertility, stunting, and skilled birth attendance prevalence, by wealth quintile in these countries. Ratios greater than 1.0 indicate higher values of the indicator
in rural than in urban areas, whereas ratios below 1.0 indicate higher values in urban areas.
These analyses are restricted to countries with at least 50 women and children in each of the 10 strata for SBA coverage and stunting, and with at least 250 births for fertility and mortality.
0.0
0.2
0.4
0.6
0.8
1.0
1.2
Poorest Poorer Middle Richer Richest
Ru
ral/u
rban
rat
io
Skilled birth attendant
Bangladesh Egypt Indonesia Nigeria
Philippines Rwanda Senegal
Figure 24. Rural/urban ratios for skilled birth attendance by wealth quintile, in the most recent survey from selected countries
• Of the 10 countries of particular interest to the iERG, seven had more than 50 children in each cell of the double stratification by wealth and residence.
• With a single exception (fourth quintile in Rwanda), more urban than rural children are delivered by a skilled attendant.
• In most countries, the rural/urban gap is narrower as income increases.
• The most extreme pattern is observed in Nigeria, where the rural/urban ratio is less than 0.2 in the poorest quintile and 0.9 in the richest. Senegal and Bangladesh also present important variations in the rural/urban ratios by quintile.
0.5
0.7
0.9
1.1
1.3
Poorest Poorer Middle Richer Richest
Ru
ral/u
rban
rat
io
Stunting
Bangladesh Egypt Ghana Nigeria Senegal
Figure 25. Rural/urban ratios for stunting prevalence by wealth quintile, in the most recent survey from selected countries
• Of the 10 countries of particular interest to the iERG, five had more than 50 children in each cell of the double stratification by wealth and residence.
• Nigeria and Senegal have higher stunting prevalence in the rural poor compared to the urban poor,
but among the rich the ratio is reversed, with higher prevalence among the rich.
• For Egypt, Ghana, and Bangladesh, the patterns are not so clear; stunting prevalence in rural and urban areas are within 20% of one another in all quintiles.
289Achievements and Prospects
Annexes
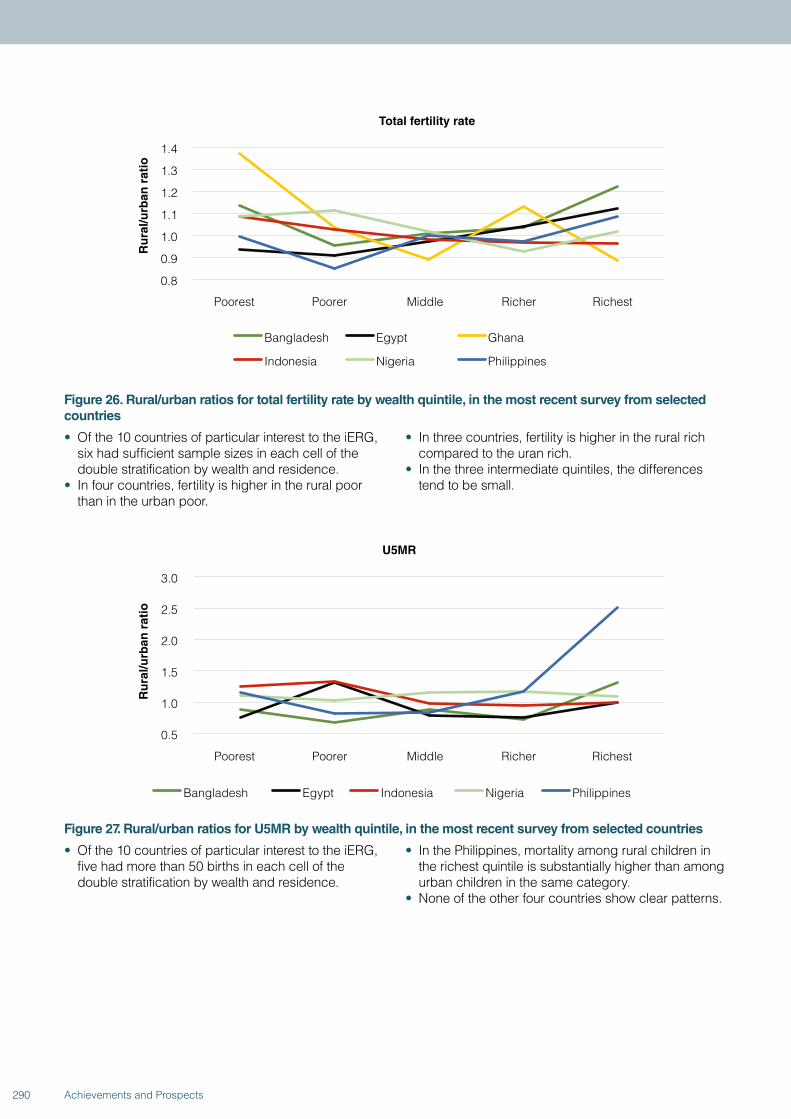
0.8
0.9
1.0
1.1
1.2
1.3
1.4
Poorest Poorer Middle Richer Richest
Ru
ral/u
rban
rat
io
Total fertility rate
Bangladesh Egypt Ghana
Indonesia Nigeria Philippines
Figure 26. Rural/urban ratios for total fertility rate by wealth quintile, in the most recent survey from selected countries
• Of the 10 countries of particular interest to the iERG, six had sufficient sample sizes in each cell of the double stratification by wealth and residence.
• In four countries, fertility is higher in the rural poor than in the urban poor.
• In three countries, fertility is higher in the rural rich compared to the uran rich.
• In the three intermediate quintiles, the differences tend to be small.
0.5
1.0
1.5
2.0
2.5
3.0
Poorest Poorer Middle Richer Richest
Ru
ral/u
rban
rat
io
U5MR
Bangladesh Egypt Indonesia Nigeria Philippines
Figure 27. Rural/urban ratios for U5MR by wealth quintile, in the most recent survey from selected countries
• Of the 10 countries of particular interest to the iERG, five had more than 50 births in each cell of the double stratification by wealth and residence.
• In the Philippines, mortality among rural children in the richest quintile is substantially higher than among urban children in the same category.
• None of the other four countries show clear patterns.
290 Achievements and Prospects
SUMMARY OF PART 4.
When results from all countries are averaged, skilled birth attendance coverage is higher, and fertility lower, in urban compared to rural areas within each wealth quintile. Stunting prevalence is similar in urban and rural children in any given quintile. Underfive mortality rates are also similar, except for in the richest quintile where urban children are less likely to die than rural children.
Analyses of the 10 countries of particular interest to the iERG confirm these general patterns, but also indicate that there may be substantial variations from country to country.
Part 5. Results from time trends in 10 selected countries
In Part 5, we present information on time trends for 10 countries of interest to the iERG, all of which have had at least three surveys since the 1990s.
Even within the same country, the number of data points may vary from one indicator to another. Some of the surveys are MICS, that do not allow for calculation of mortality or fertility based on birth histories. Some surveys, for example in Indonesia, did not include anthropometry, so that information on stunting is not available. Regarding fertility, some DHS are restricted to samples of ever-married women. This requires a correction factor in order to estimate fertility rates. This factor is not available for older surveys, thus precluding the analysis of fertility by wealth quintile, even though other indicators—such as mortality or stunting—can still be broken down by quintile.
Appendix III (an Excel spreadsheet) contains the equity analyses of the 10 indicators for each survey available in the 10 countries.
To illustrate the data available in Appendix III, we show time trends in wealth-related inequalities in four indicators (skilled birth attendance coverage; stunting prevalence; total fertility rate; and underfive mortality rate) for the 10 countries. Appendix III provides similar results regarding inequalities according to place of residence and sex of the child.
We focus the interpretation of results on absolute inequalities—that is, differences between the wealth quintiles. Time trends in relative inequalities (the ratios between quintiles) may on occasion lead to different conclusions regarding whether inequalities are increasing or decreasing.
291Achievements and Prospects
Annexes
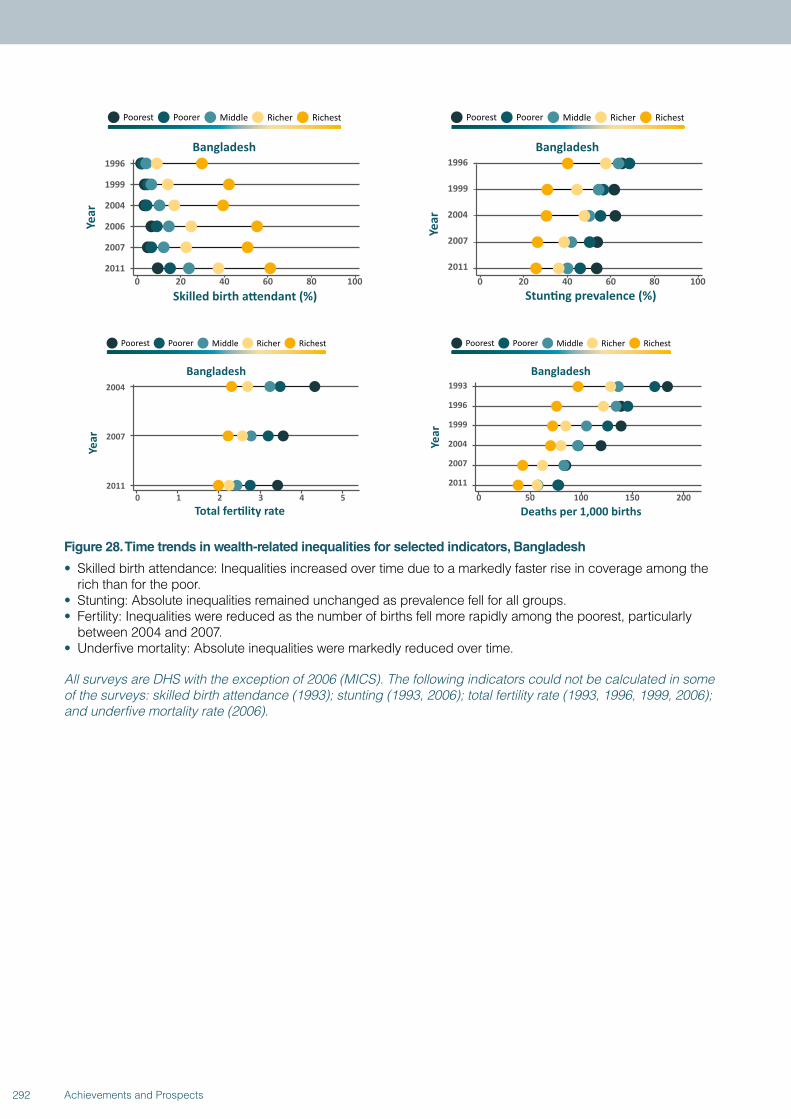
Figure 28. Time trends in wealth-related inequalities for selected indicators, Bangladesh
• Skilled birth attendance: Inequalities increased over time due to a markedly faster rise in coverage among the rich than for the poor.
• Stunting: Absolute inequalities remained unchanged as prevalence fell for all groups.• Fertility: Inequalities were reduced as the number of births fell more rapidly among the poorest, particularly
between 2004 and 2007.• Underfive mortality: Absolute inequalities were markedly reduced over time.
All surveys are DHS with the exception of 2006 (MICS). The following indicators could not be calculated in some of the surveys: skilled birth attendance (1993); stunting (1993, 2006); total fertility rate (1993, 1996, 1999, 2006); and underfive mortality rate (2006).
292 Achievements and Prospects
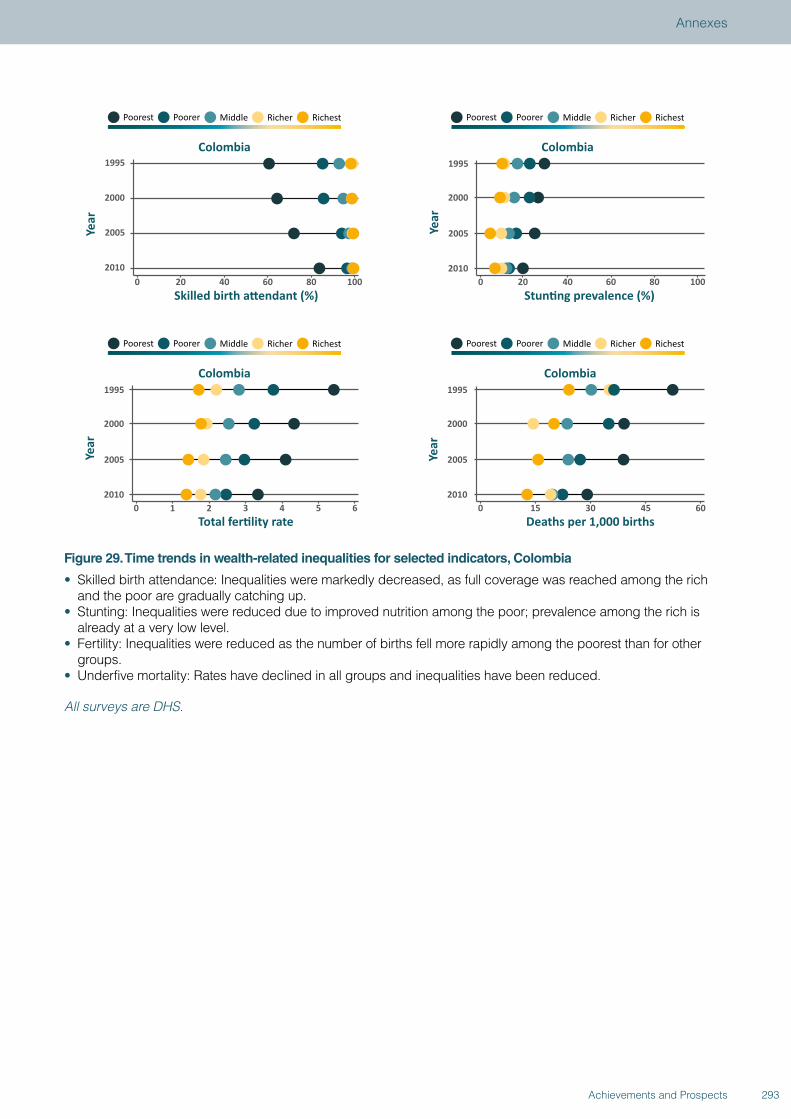
Figure 29. Time trends in wealth-related inequalities for selected indicators, Colombia
• Skilled birth attendance: Inequalities were markedly decreased, as full coverage was reached among the rich and the poor are gradually catching up.
• Stunting: Inequalities were reduced due to improved nutrition among the poor; prevalence among the rich is already at a very low level.
• Fertility: Inequalities were reduced as the number of births fell more rapidly among the poorest than for other groups.
• Underfive mortality: Rates have declined in all groups and inequalities have been reduced.
All surveys are DHS.
293Achievements and Prospects
Annexes
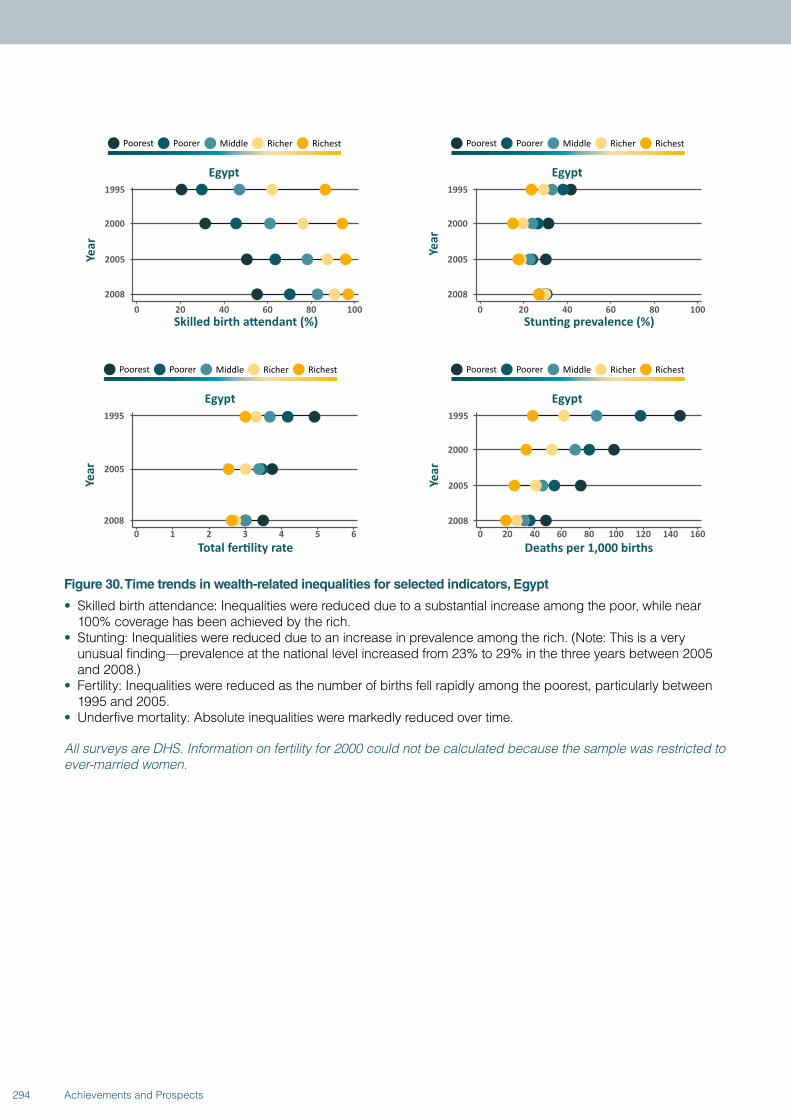
Figure 30. Time trends in wealth-related inequalities for selected indicators, Egypt
• Skilled birth attendance: Inequalities were reduced due to a substantial increase among the poor, while near 100% coverage has been achieved by the rich.
• Stunting: Inequalities were reduced due to an increase in prevalence among the rich. (Note: This is a very unusual finding—prevalence at the national level increased from 23% to 29% in the three years between 2005 and 2008.)
• Fertility: Inequalities were reduced as the number of births fell rapidly among the poorest, particularly between 1995 and 2005.
• Underfive mortality: Absolute inequalities were markedly reduced over time.
All surveys are DHS. Information on fertility for 2000 could not be calculated because the sample was restricted to ever-married women.
294 Achievements and Prospects
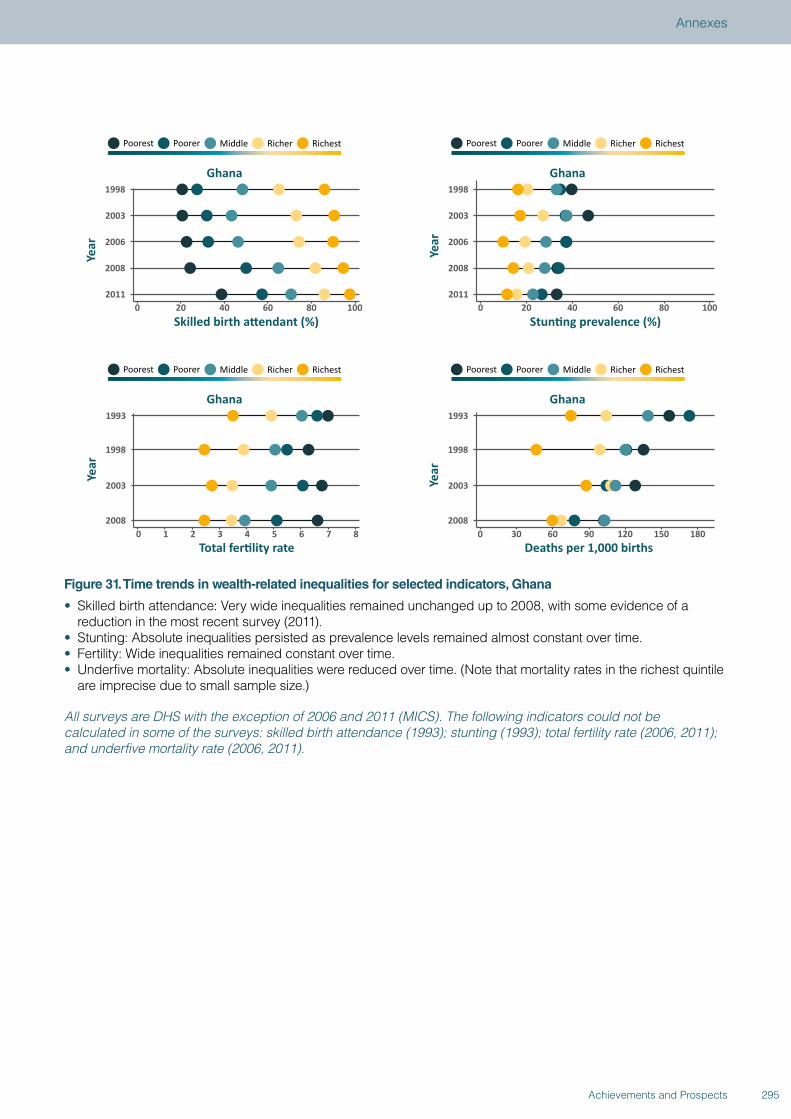
Figure 31. Time trends in wealth-related inequalities for selected indicators, Ghana
• Skilled birth attendance: Very wide inequalities remained unchanged up to 2008, with some evidence of a reduction in the most recent survey (2011).
• Stunting: Absolute inequalities persisted as prevalence levels remained almost constant over time.• Fertility: Wide inequalities remained constant over time.• Underfive mortality: Absolute inequalities were reduced over time. (Note that mortality rates in the richest quintile
are imprecise due to small sample size.)
All surveys are DHS with the exception of 2006 and 2011 (MICS). The following indicators could not be calculated in some of the surveys: skilled birth attendance (1993); stunting (1993); total fertility rate (2006, 2011); and underfive mortality rate (2006, 2011).
295Achievements and Prospects
Annexes
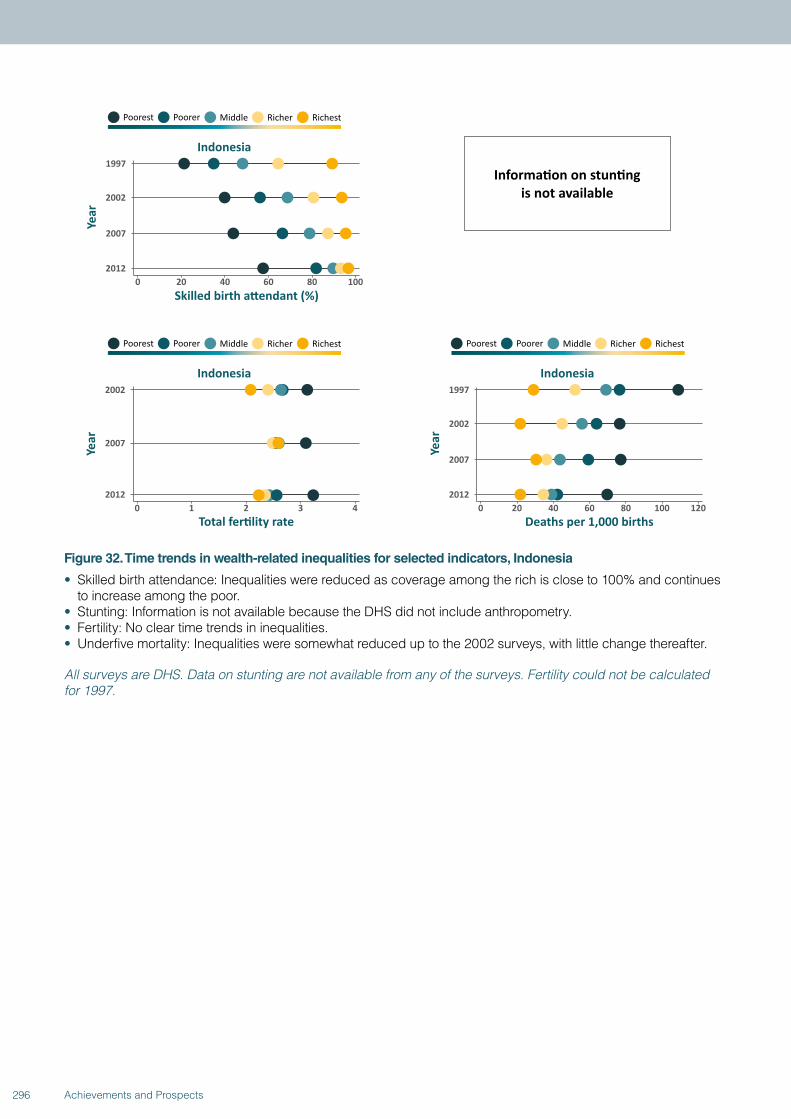
Figure 32. Time trends in wealth-related inequalities for selected indicators, Indonesia
• Skilled birth attendance: Inequalities were reduced as coverage among the rich is close to 100% and continues to increase among the poor.
• Stunting: Information is not available because the DHS did not include anthropometry.• Fertility: No clear time trends in inequalities.• Underfive mortality: Inequalities were somewhat reduced up to the 2002 surveys, with little change thereafter.
All surveys are DHS. Data on stunting are not available from any of the surveys. Fertility could not be calculated for 1997.
296 Achievements and Prospects
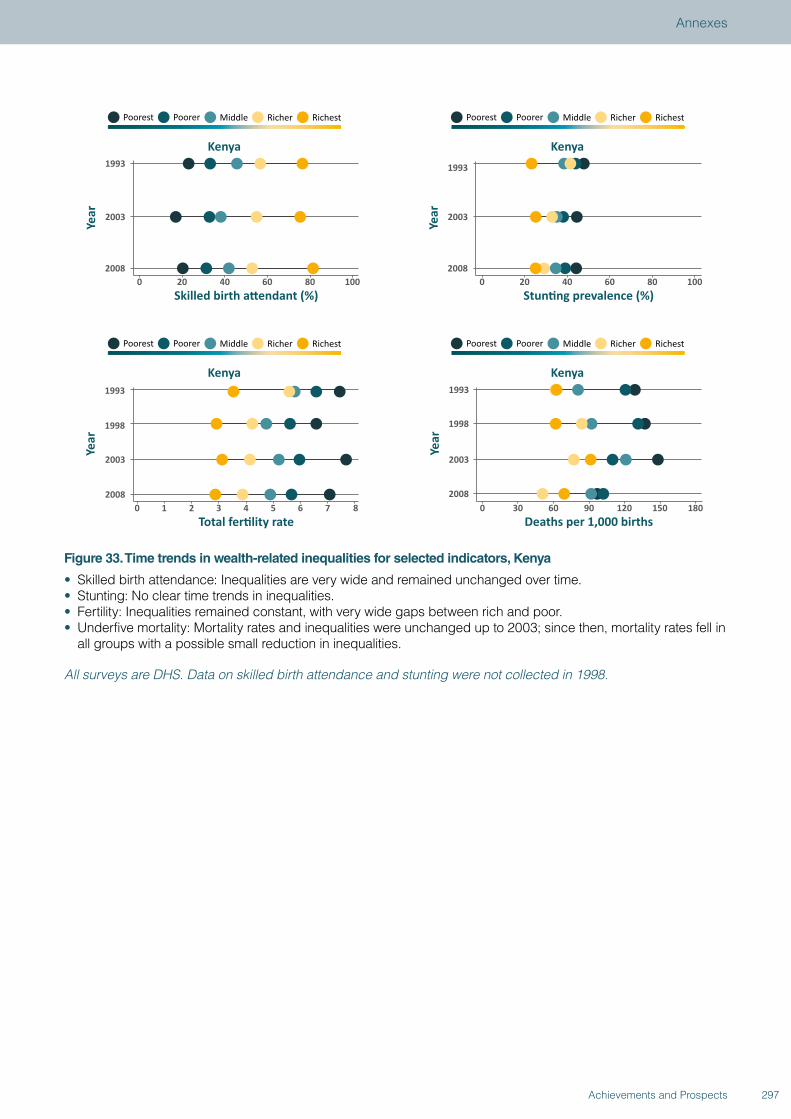
Figure 33. Time trends in wealth-related inequalities for selected indicators, Kenya
• Skilled birth attendance: Inequalities are very wide and remained unchanged over time.• Stunting: No clear time trends in inequalities.• Fertility: Inequalities remained constant, with very wide gaps between rich and poor.• Underfive mortality: Mortality rates and inequalities were unchanged up to 2003; since then, mortality rates fell in
all groups with a possible small reduction in inequalities.
All surveys are DHS. Data on skilled birth attendance and stunting were not collected in 1998.
297Achievements and Prospects
Annexes
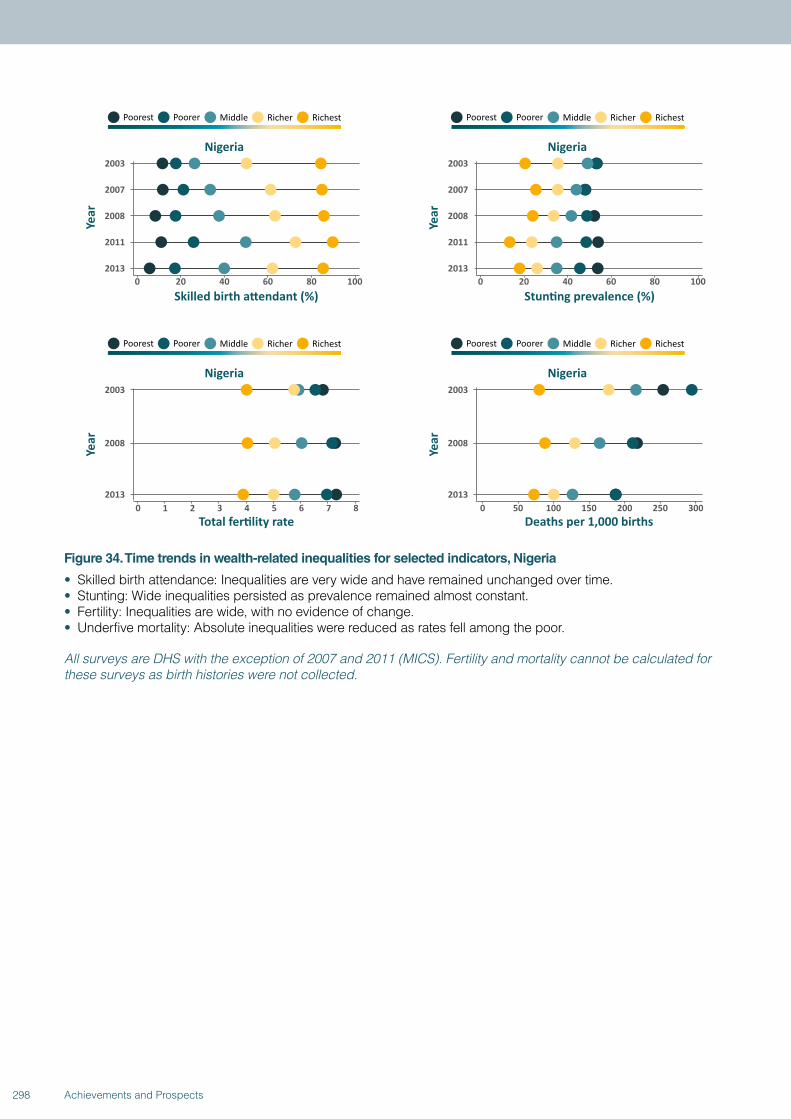
Figure 34. Time trends in wealth-related inequalities for selected indicators, Nigeria
• Skilled birth attendance: Inequalities are very wide and have remained unchanged over time. • Stunting: Wide inequalities persisted as prevalence remained almost constant. • Fertility: Inequalities are wide, with no evidence of change.• Underfive mortality: Absolute inequalities were reduced as rates fell among the poor.
All surveys are DHS with the exception of 2007 and 2011 (MICS). Fertility and mortality cannot be calculated for these surveys as birth histories were not collected.
298 Achievements and Prospects
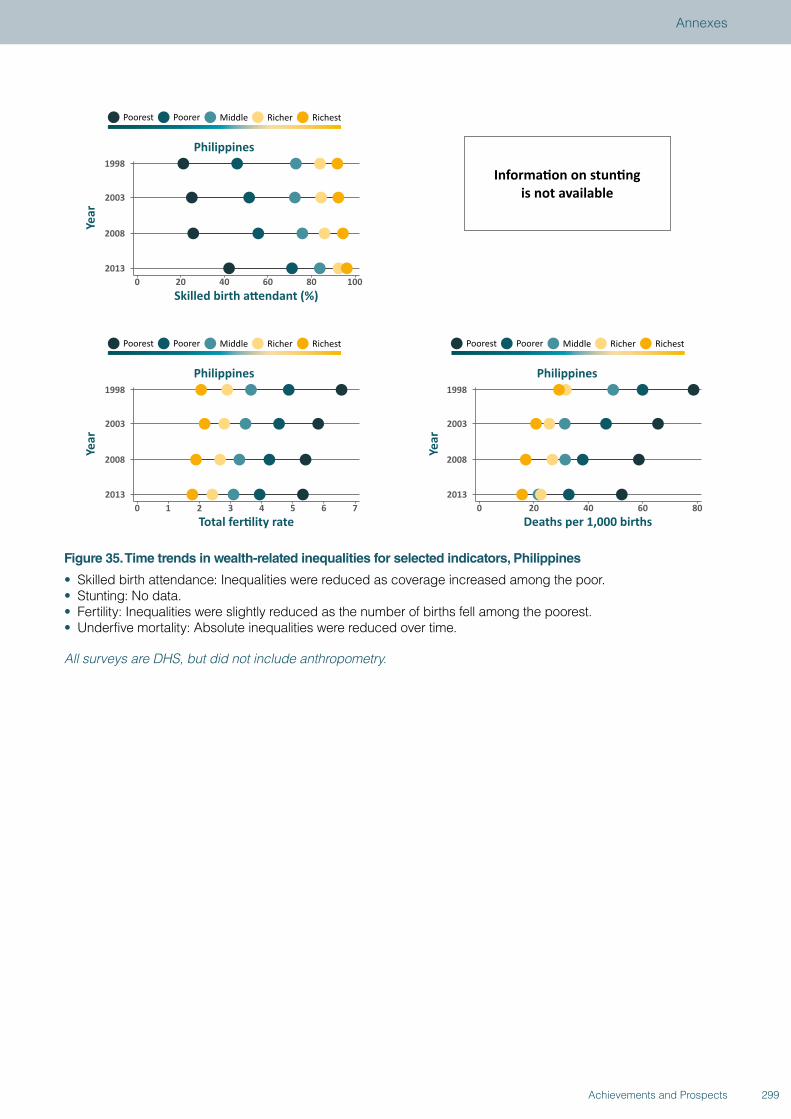
Figure 35. Time trends in wealth-related inequalities for selected indicators, Philippines
• Skilled birth attendance: Inequalities were reduced as coverage increased among the poor. • Stunting: No data. • Fertility: Inequalities were slightly reduced as the number of births fell among the poorest.• Underfive mortality: Absolute inequalities were reduced over time.
All surveys are DHS, but did not include anthropometry.
299Achievements and Prospects
Annexes
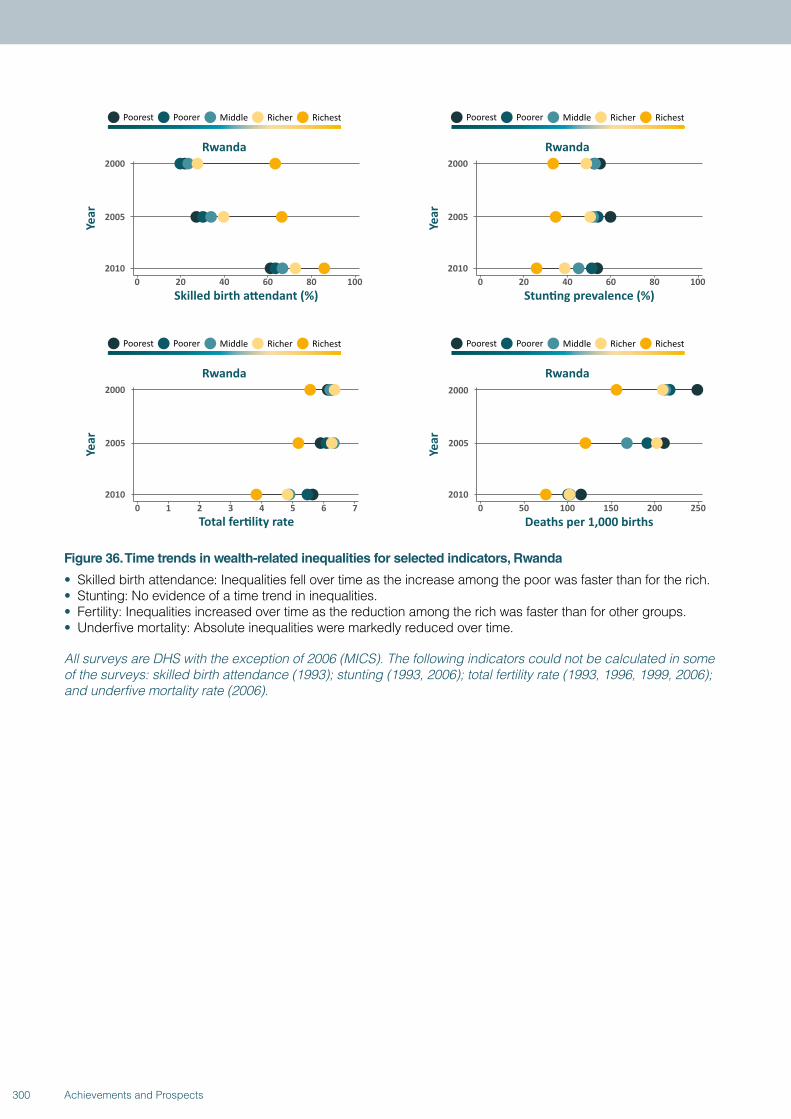
Figure 36. Time trends in wealth-related inequalities for selected indicators, Rwanda
• Skilled birth attendance: Inequalities fell over time as the increase among the poor was faster than for the rich. • Stunting: No evidence of a time trend in inequalities. • Fertility: Inequalities increased over time as the reduction among the rich was faster than for other groups. • Underfive mortality: Absolute inequalities were markedly reduced over time.
All surveys are DHS with the exception of 2006 (MICS). The following indicators could not be calculated in some of the surveys: skilled birth attendance (1993); stunting (1993, 2006); total fertility rate (1993, 1996, 1999, 2006); and underfive mortality rate (2006).
300 Achievements and Prospects
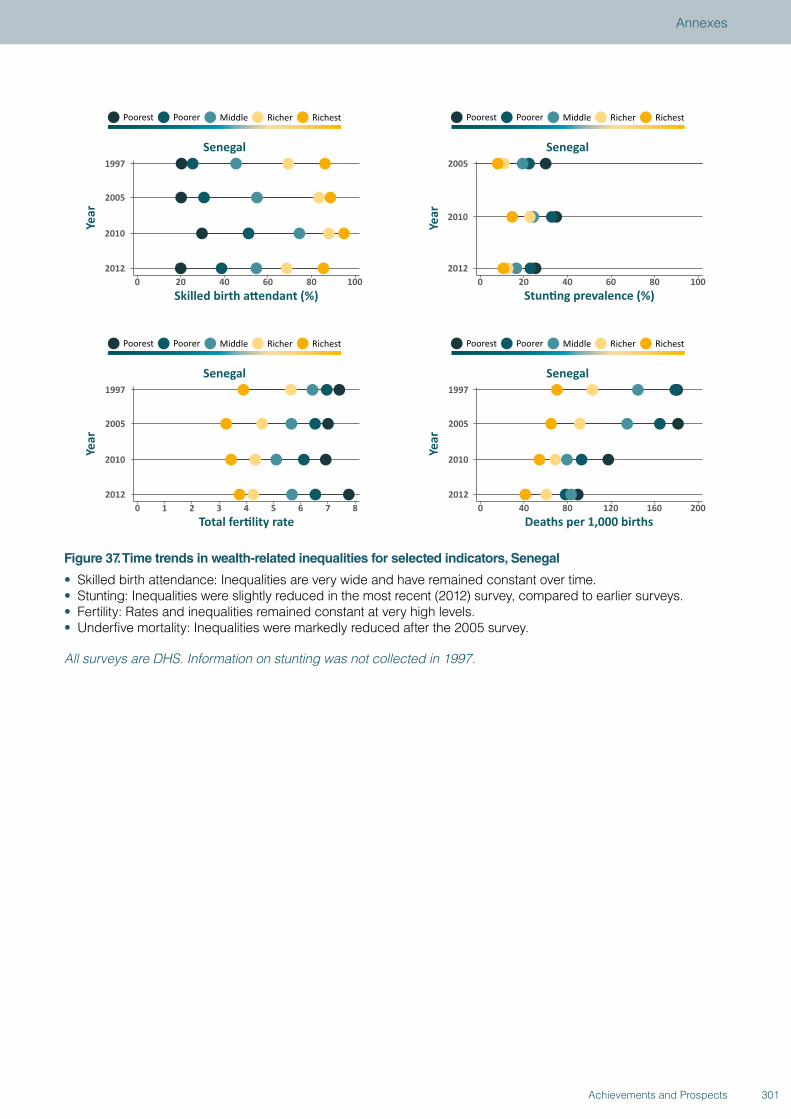
Figure 37. Time trends in wealth-related inequalities for selected indicators, Senegal
• Skilled birth attendance: Inequalities are very wide and have remained constant over time.• Stunting: Inequalities were slightly reduced in the most recent (2012) survey, compared to earlier surveys.• Fertility: Rates and inequalities remained constant at very high levels.• Underfive mortality: Inequalities were markedly reduced after the 2005 survey.
All surveys are DHS. Information on stunting was not collected in 1997.
301Achievements and Prospects
Annexes
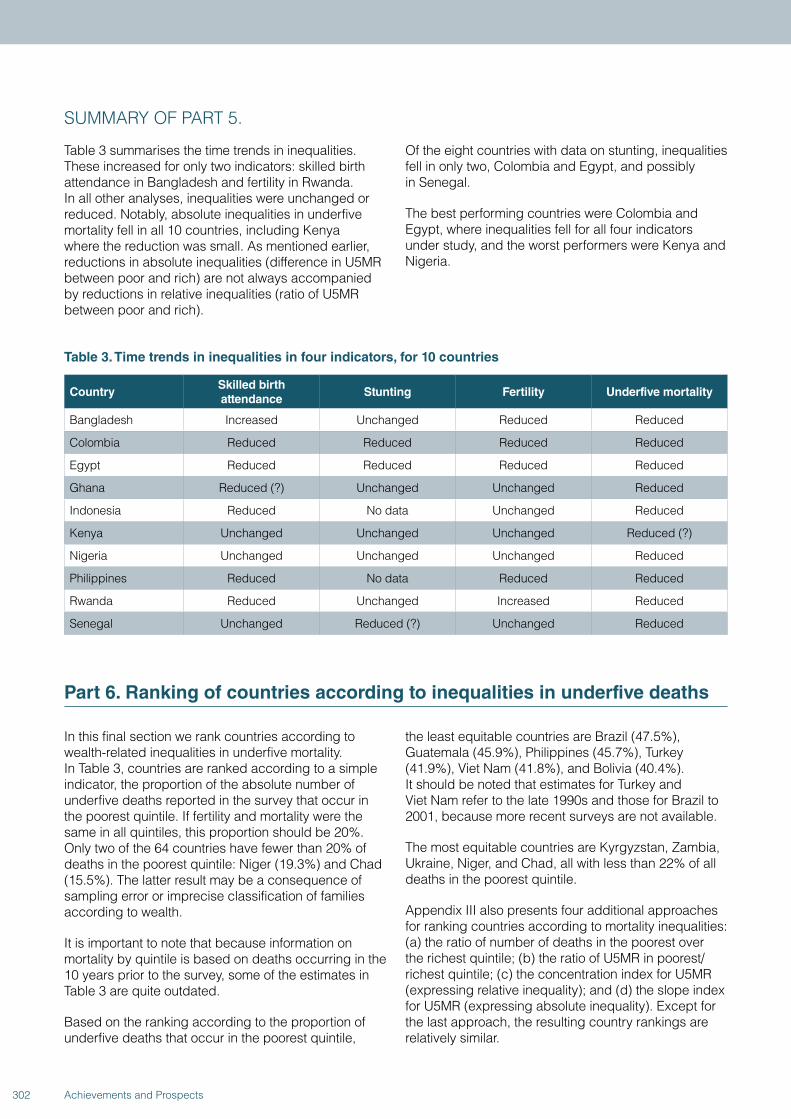
SUMMARY OF PART 5.
Table 3 summarises the time trends in inequalities. These increased for only two indicators: skilled birth attendance in Bangladesh and fertility in Rwanda. In all other analyses, inequalities were unchanged or reduced. Notably, absolute inequalities in underfive mortality fell in all 10 countries, including Kenya where the reduction was small. As mentioned earlier, reductions in absolute inequalities (difference in U5MR between poor and rich) are not always accompanied by reductions in relative inequalities (ratio of U5MR between poor and rich).
Of the eight countries with data on stunting, inequalities fell in only two, Colombia and Egypt, and possibly in Senegal.
The best performing countries were Colombia and Egypt, where inequalities fell for all four indicators under study, and the worst performers were Kenya and Nigeria.
Table 3. Time trends in inequalities in four indicators, for 10 countries
CountrySkilled birth attendance
Stunting Fertility Underfive mortality
Bangladesh Increased Unchanged Reduced Reduced
Colombia Reduced Reduced Reduced Reduced
Egypt Reduced Reduced Reduced Reduced
Ghana Reduced (?) Unchanged Unchanged Reduced
Indonesia Reduced No data Unchanged Reduced
Kenya Unchanged Unchanged Unchanged Reduced (?)
Nigeria Unchanged Unchanged Unchanged Reduced
Philippines Reduced No data Reduced Reduced
Rwanda Reduced Unchanged Increased Reduced
Senegal Unchanged Reduced (?) Unchanged Reduced
Part 6. Ranking of countries according to inequalities in underfive deaths
In this final section we rank countries according to wealth-related inequalities in underfive mortality. In Table 3, countries are ranked according to a simple indicator, the proportion of the absolute number of underfive deaths reported in the survey that occur in the poorest quintile. If fertility and mortality were the same in all quintiles, this proportion should be 20%. Only two of the 64 countries have fewer than 20% of deaths in the poorest quintile: Niger (19.3%) and Chad (15.5%). The latter result may be a consequence of sampling error or imprecise classification of families according to wealth.
It is important to note that because information on mortality by quintile is based on deaths occurring in the 10 years prior to the survey, some of the estimates in Table 3 are quite outdated.
Based on the ranking according to the proportion of underfive deaths that occur in the poorest quintile,
the least equitable countries are Brazil (47.5%), Guatemala (45.9%), Philippines (45.7%), Turkey (41.9%), Viet Nam (41.8%), and Bolivia (40.4%). It should be noted that estimates for Turkey and Viet Nam refer to the late 1990s and those for Brazil to 2001, because more recent surveys are not available.
The most equitable countries are Kyrgyzstan, Zambia, Ukraine, Niger, and Chad, all with less than 22% of all deaths in the poorest quintile.
Appendix III also presents four additional approaches for ranking countries according to mortality inequalities: (a) the ratio of number of deaths in the poorest over the richest quintile; (b) the ratio of U5MR in poorest/ richest quintile; (c) the concentration index for U5MR (expressing relative inequality); and (d) the slope index for U5MR (expressing absolute inequality). Except for the last approach, the resulting country rankings are relatively similar.
302 Achievements and Prospects
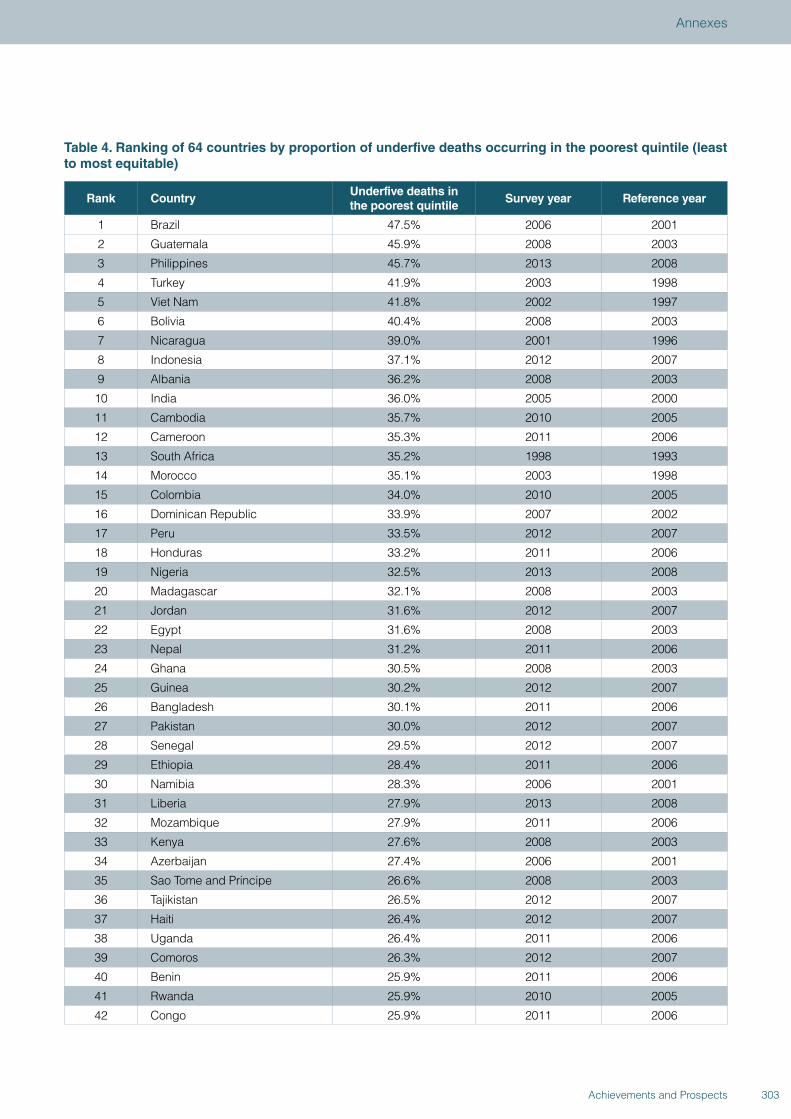
Table 4. Ranking of 64 countries by proportion of underfive deaths occurring in the poorest quintile (least to most equitable)
Rank CountryUnderfive deaths in the poorest quintile
Survey year Reference year
1 Brazil 47.5% 2006 2001
2 Guatemala 45.9% 2008 2003
3 Philippines 45.7% 2013 2008
4 Turkey 41.9% 2003 1998
5 Viet Nam 41.8% 2002 1997
6 Bolivia 40.4% 2008 2003
7 Nicaragua 39.0% 2001 1996
8 Indonesia 37.1% 2012 2007
9 Albania 36.2% 2008 2003
10 India 36.0% 2005 2000
11 Cambodia 35.7% 2010 2005
12 Cameroon 35.3% 2011 2006
13 South Africa 35.2% 1998 1993
14 Morocco 35.1% 2003 1998
15 Colombia 34.0% 2010 2005
16 Dominican Republic 33.9% 2007 2002
17 Peru 33.5% 2012 2007
18 Honduras 33.2% 2011 2006
19 Nigeria 32.5% 2013 2008
20 Madagascar 32.1% 2008 2003
21 Jordan 31.6% 2012 2007
22 Egypt 31.6% 2008 2003
23 Nepal 31.2% 2011 2006
24 Ghana 30.5% 2008 2003
25 Guinea 30.2% 2012 2007
26 Bangladesh 30.1% 2011 2006
27 Pakistan 30.0% 2012 2007
28 Senegal 29.5% 2012 2007
29 Ethiopia 28.4% 2011 2006
30 Namibia 28.3% 2006 2001
31 Liberia 27.9% 2013 2008
32 Mozambique 27.9% 2011 2006
33 Kenya 27.6% 2008 2003
34 Azerbaijan 27.4% 2006 2001
35 Sao Tome and Principe 26.6% 2008 2003
36 Tajikistan 26.5% 2012 2007
37 Haiti 26.4% 2012 2007
38 Uganda 26.4% 2011 2006
39 Comoros 26.3% 2012 2007
40 Benin 25.9% 2011 2006
41 Rwanda 25.9% 2010 2005
42 Congo 25.9% 2011 2006
303Achievements and Prospects
Annexes

Rank CountryUnderfive deaths in the poorest quintile
Survey year Reference year
43 Burkina Faso 25.7% 2010 2005
44 Zimbabwe 25.4% 2010 2005
45 Gabon 25.3% 2012 2007
46 Côte d’Ivoire 25.0% 2011 2006
47 Sierra Leone 24.7% 2013 2008
48 Burundi 24.2% 2010 2005
49 United Rep. of Tanzania 24.2% 2010 2005
50 Armenia 23.8% 2010 2005
51 Guyana 23.2% 2009 2004
52 Lesotho 23.1% 2009 2004
53 Moldova 22.9% 2005 2000
54 Timor-Leste 22.8% 2009 2004
55 Mali 22.7% 2012 2007
56Democratic Republic of the Congo 22.6% 2013 2008
57 Swaziland 22.3% 2006 2001
58 Maldives 22.1% 2009 2004
59 Malawi 22.0% 2010 2005
60 Kyrgyzstan 21.2% 2012 2007
61 Zambia 21.1% 2007 2002
62 Ukraine 20.0% 2007 2002
63 Niger 19.3% 2012 2007
64 Chad 15.5% 2004 1999
Note: Reference year is approximately 5 years before date of survey.
SUMMARY OF PART 6.
When countries were ranked according to the proportion of all underfive deaths that occur in the poorest quintile, the least equitable countries were Brazil, Guatemala, Philippines, Turkey, Viet Nam, and Bolivia. The most equitable countries were Kyrgyzstan, Zambia, Ukraine, Niger, and Chad.
304 Achievements and Prospects
Part 7. Analyses on family planning needs satisfied for adolescents
These analyses provide information on the indicator “demand for family planning needs satisfied” (FPS) according to 3 categories of maternal age: 15–17 years, 18–19 years, and 20–49 years. Only adolescents and women who reported being sexually active were included in the analyses.
The FPS variable is defined as the “proportion of all women aged 15-49 using contraception among those who are fecund, in union, and in need of contraception.” Women who are willing to get pregnant are excluded from the denominator.
We were able to analyse data for 48 countries, out of the 98 with available surveys. We could not include 24 countries with a MICS and 18 with a DHS because information was lacking on maternal age, on sexual
activity, or on use of contraceptives. Eight of the 56 countries with the required information included fewer than 25 women in one of the age groups; these are not included in the figure because of poor precision of the FPS estimate. Thus, Figure 38 shows 48 countries with surveys since 2001, ordered by family planning needs satisfied among adolescents aged 15-17, from lowest to highest.
The figure shows that, in virtually all countries, adolescents have lower coverage of family planning needs satisfied than women aged 20 years or older. In several countries, the differences are substantial. In addition, younger adolescents (aged under 18 years) tend to have lower coverage than those aged 18-19 years.
305Achievements and Prospects
Annexes
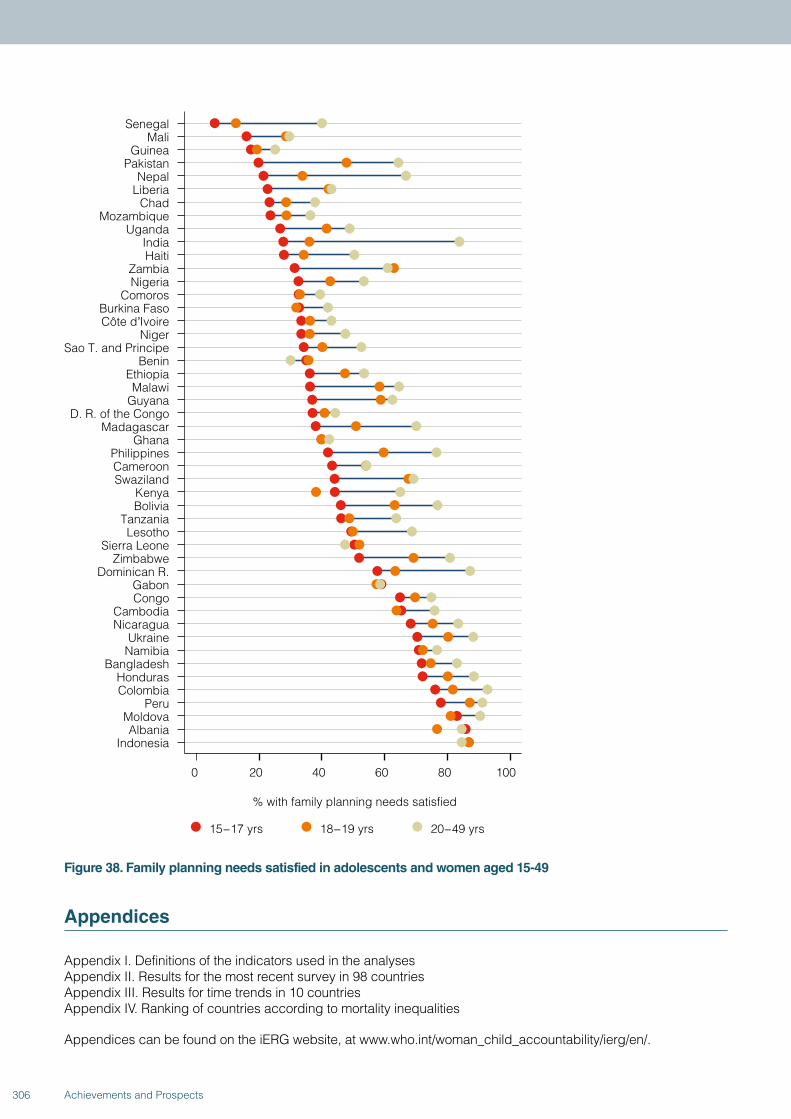
SenegalMali
GuineaPakistan
NepalLiberia
ChadMozambique
UgandaIndiaHaiti
ZambiaNigeria
ComorosBurkina FasoCôte dʼIvoire
NigerSao T. and Principe
BeninEthiopiaMalawi
GuyanaD. R. of the Congo
MadagascarGhana
PhilippinesCameroonSwaziland
KenyaBolivia
TanzaniaLesotho
Sierra LeoneZimbabwe
Dominican R.GabonCongo
CambodiaNicaragua
UkraineNamibia
BangladeshHondurasColombia
PeruMoldovaAlbania
Indonesia
0 20 40 60 80 100
15−17 yrs 18−19 yrs 20−49 yrs
% with family planning needs satisfied
Figure 38. Family planning needs satisfied in adolescents and women aged 15-49
Appendices
Appendix I. Definitions of the indicators used in the analysesAppendix II. Results for the most recent survey in 98 countriesAppendix III. Results for time trends in 10 countriesAppendix IV. Ranking of countries according to mortality inequalities
Appendices can be found on the iERG website, at www.who.int/woman_child_accountability/ierg/en/.
306 Achievements and Prospects
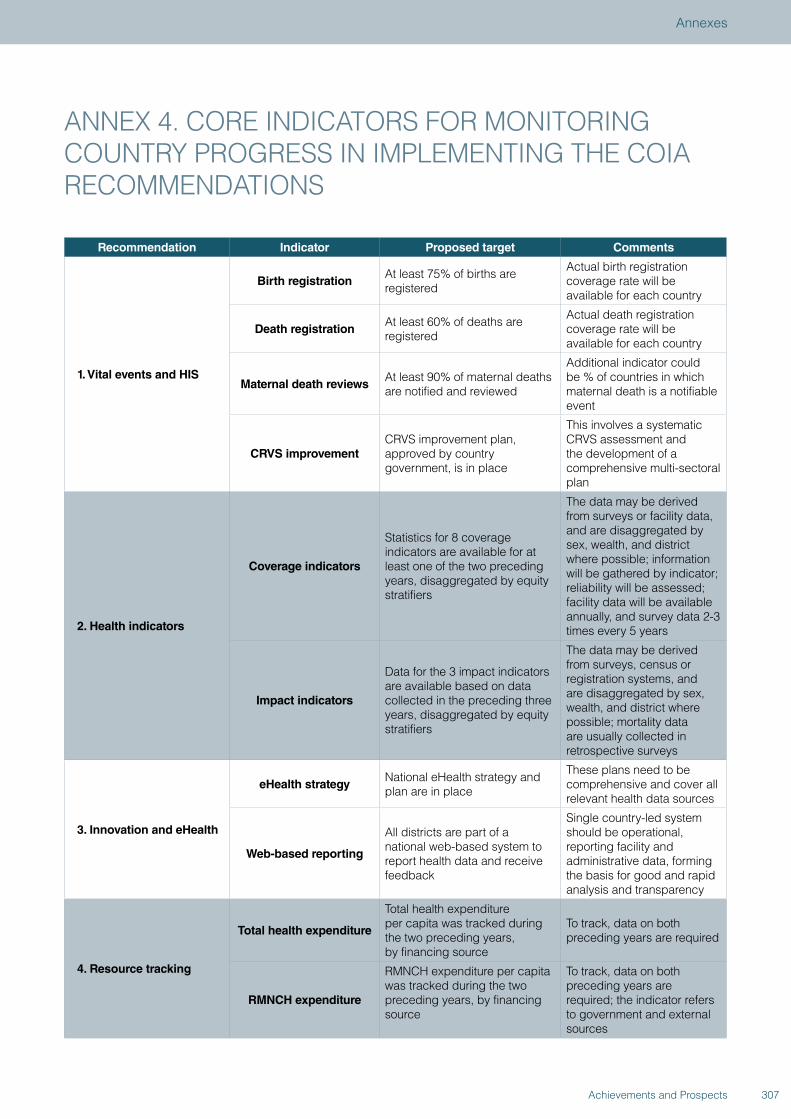
ANNEX 4. CORE INDICATORS FOR MONITORING COUNTRY PROGRESS IN IMPLEMENTING THE COIA RECOMMENDATIONS
Recommendation Indicator Proposed target Comments
1. Vital events and HIS
Birth registrationAt least 75% of births are registered
Actual birth registration coverage rate will be available for each country
Death registrationAt least 60% of deaths are registered
Actual death registration coverage rate will be available for each country
Maternal death reviewsAt least 90% of maternal deaths are notified and reviewed
Additional indicator could be % of countries in which maternal death is a notifiable event
CRVS improvementCRVS improvement plan, approved by country government, is in place
This involves a systematic CRVS assessment and the development of a comprehensive multi-sectoral plan
2. Health indicators
Coverage indicators
Statistics for 8 coverage indicators are available for at least one of the two preceding years, disaggregated by equity stratifiers
The data may be derived from surveys or facility data, and are disaggregated by sex, wealth, and district where possible; information will be gathered by indicator; reliability will be assessed; facility data will be available annually, and survey data 2-3 times every 5 years
Impact indicators
Data for the 3 impact indicators are available based on data collected in the preceding three years, disaggregated by equity stratifiers
The data may be derived from surveys, census or registration systems, and are disaggregated by sex, wealth, and district where possible; mortality data are usually collected in retrospective surveys
3. Innovation and eHealth
eHealth strategyNational eHealth strategy and plan are in place
These plans need to be comprehensive and cover all relevant health data sources
Web-based reporting
All districts are part of a national web-based system to report health data and receive feedback
Single country-led systemshould be operational, reporting facility and administrative data, forming the basis for good and rapid analysis and transparency
4. Resource tracking
Total health expenditure
Total health expenditure per capita was tracked during the two preceding years, by financing source
To track, data on both preceding years are required
RMNCH expenditure
RMNCH expenditure per capita was tracked during the two preceding years, by financing source
To track, data on both preceding years are required; the indicator refers to government and external sources
307Achievements and Prospects
Annexes
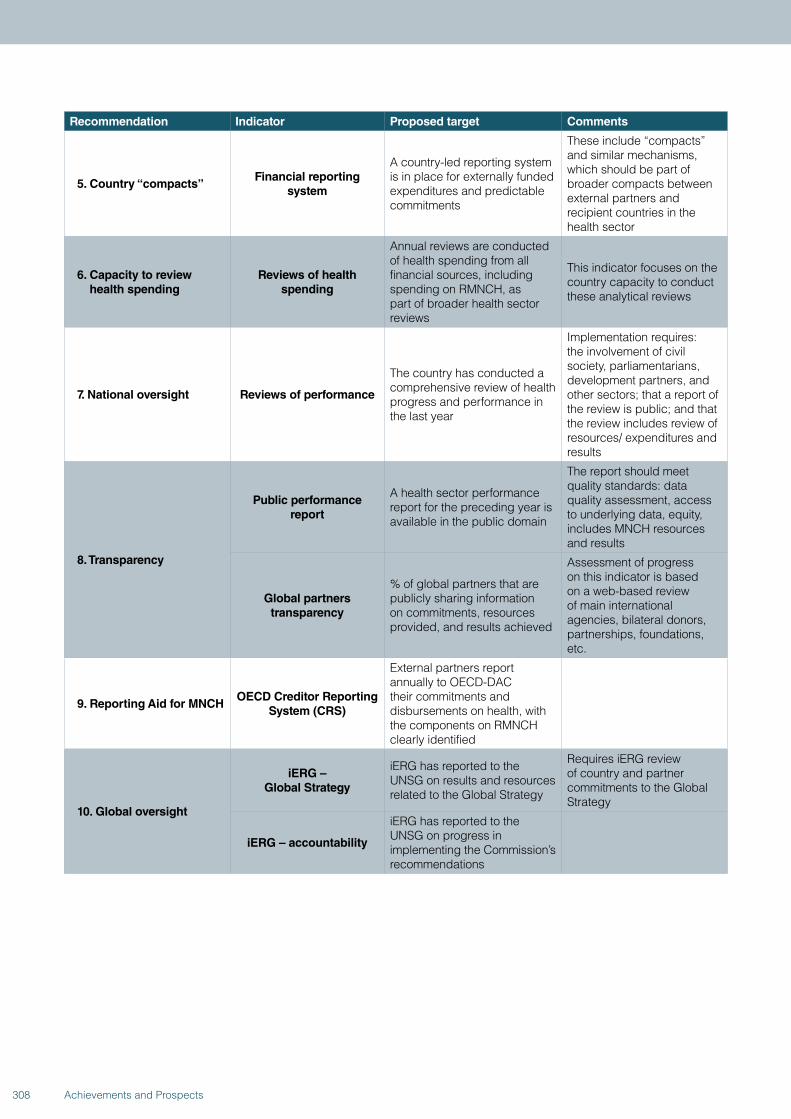
Recommendation Indicator Proposed target Comments
5. Country “compacts”Financial reporting
system
A country-led reporting systemis in place for externally funded expenditures and predictable commitments
These include “compacts” and similar mechanisms, which should be part of broader compacts between external partners and recipient countries in the health sector
6. Capacity to review health spending
Reviews of health spending
Annual reviews are conducted of health spending from all financial sources, including spending on RMNCH, as part of broader health sector reviews
This indicator focuses on the country capacity to conduct these analytical reviews
7. National oversight Reviews of performance
The country has conducted a comprehensive review of health progress and performance in the last year
Implementation requires: the involvement of civil society, parliamentarians, development partners, and other sectors; that a report of the review is public; and that the review includes review of resources/ expenditures and results
8. Transparency
Public performance report
A health sector performance report for the preceding year is available in the public domain
The report should meet quality standards: data quality assessment, access to underlying data, equity, includes MNCH resources and results
Global partners transparency
% of global partners that are publicly sharing information on commitments, resources provided, and results achieved
Assessment of progress on this indicator is based on a web-based review of main international agencies, bilateral donors, partnerships, foundations, etc.
9. Reporting Aid for MNCHOECD Creditor Reporting
System (CRS)
External partners report annually to OECD-DAC their commitments and disbursements on health, with the components on RMNCH clearly identified
10. Global oversight
iERG – Global Strategy
iERG has reported to the UNSG on results and resources related to the Global Strategy
Requires iERG review of country and partner commitments to the Global Strategy
iERG – accountability
iERG has reported to the UNSG on progress in implementing the Commission’s recommendations
308 Achievements and Prospects
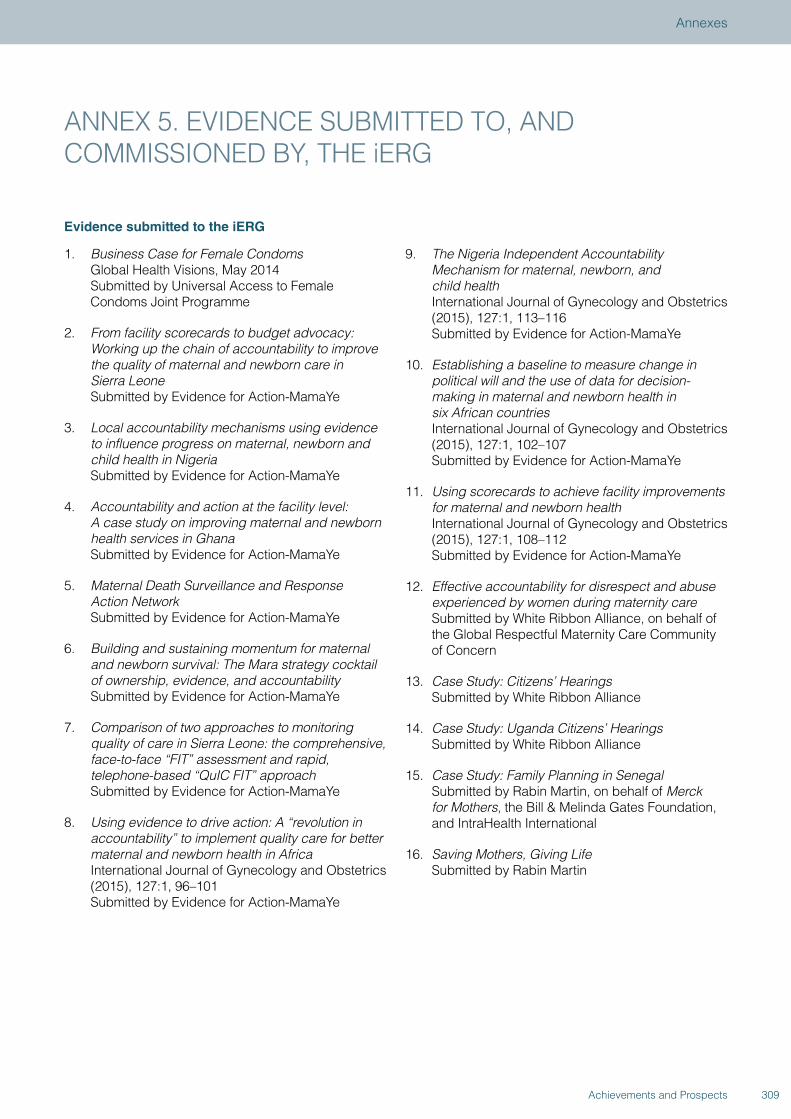
ANNEX 5. EVIDENCE SUBMITTED TO, AND COMMISSIONED BY, THE iERG
Evidence submitted to the iERG
1. Business Case for Female Condoms Global Health Visions, May 2014 Submitted by Universal Access to Female Condoms Joint Programme
2. From facility scorecards to budget advocacy: Working up the chain of accountability to improve the quality of maternal and newborn care in Sierra Leone Submitted by Evidence for Action-MamaYe
3. Local accountability mechanisms using evidence to influence progress on maternal, newborn and child health in Nigeria Submitted by Evidence for Action-MamaYe
4. Accountability and action at the facility level: A case study on improving maternal and newborn health services in Ghana Submitted by Evidence for Action-MamaYe
5. Maternal Death Surveillance and Response Action Network Submitted by Evidence for Action-MamaYe
6. Building and sustaining momentum for maternal and newborn survival: The Mara strategy cocktail of ownership, evidence, and accountability Submitted by Evidence for Action-MamaYe
7. Comparison of two approaches to monitoring quality of care in Sierra Leone: the comprehensive, face-to-face “FIT” assessment and rapid, telephone-based “QuIC FIT” approach Submitted by Evidence for Action-MamaYe
8. Using evidence to drive action: A “revolution in accountability” to implement quality care for better maternal and newborn health in Africa International Journal of Gynecology and Obstetrics (2015), 127:1, 96–101 Submitted by Evidence for Action-MamaYe
9. The Nigeria Independent Accountability Mechanism for maternal, newborn, and child health International Journal of Gynecology and Obstetrics (2015), 127:1, 113–116 Submitted by Evidence for Action-MamaYe
10. Establishing a baseline to measure change in political will and the use of data for decision-making in maternal and newborn health in six African countries International Journal of Gynecology and Obstetrics (2015), 127:1, 102–107 Submitted by Evidence for Action-MamaYe
11. Using scorecards to achieve facility improvements for maternal and newborn health International Journal of Gynecology and Obstetrics (2015), 127:1, 108–112 Submitted by Evidence for Action-MamaYe
12. Effective accountability for disrespect and abuse experienced by women during maternity care Submitted by White Ribbon Alliance, on behalf of the Global Respectful Maternity Care Community of Concern
13. Case Study: Citizens’ Hearings Submitted by White Ribbon Alliance
14. Case Study: Uganda Citizens’ Hearings Submitted by White Ribbon Alliance
15. Case Study: Family Planning in Senegal Submitted by Rabin Martin, on behalf of Merck for Mothers, the Bill & Melinda Gates Foundation, and IntraHealth International
16. Saving Mothers, Giving Life Submitted by Rabin Martin
309Achievements and Prospects
Annexes
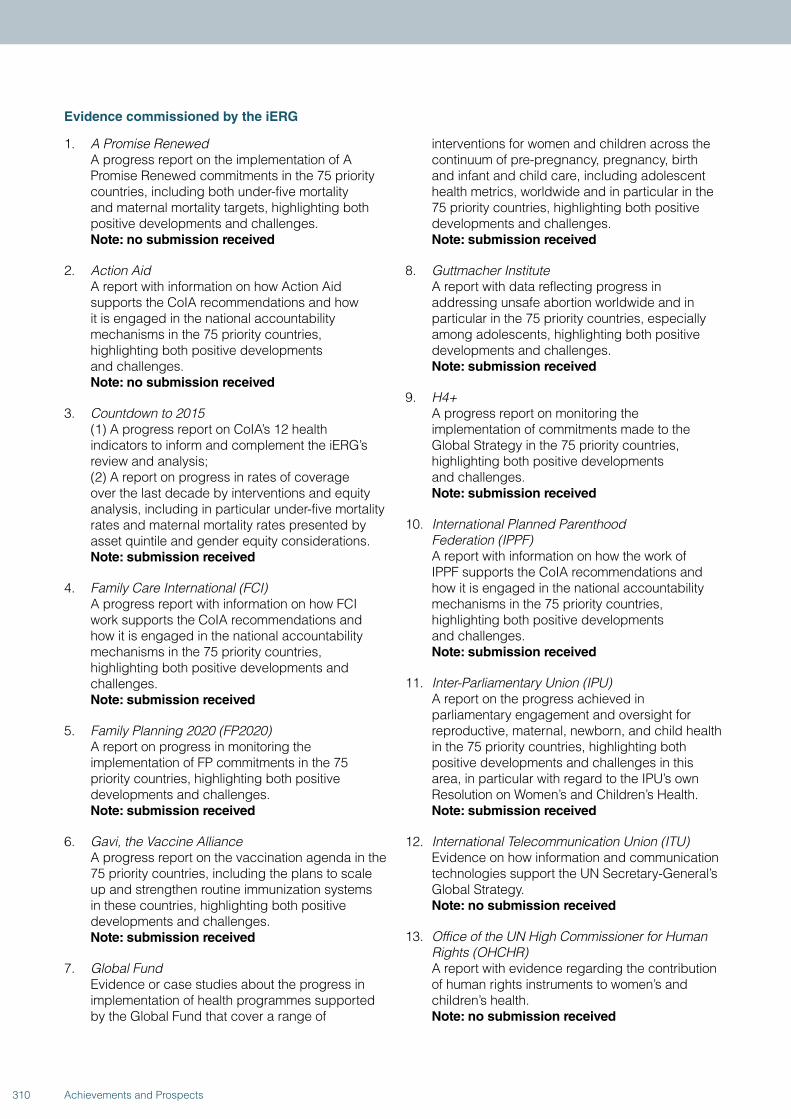
Evidence commissioned by the iERG
1. A Promise Renewed A progress report on the implementation of A Promise Renewed commitments in the 75 priority countries, including both under-five mortality and maternal mortality targets, highlighting both positive developments and challenges. Note: no submission received
2. Action Aid A report with information on how Action Aid supports the CoIA recommendations and how it is engaged in the national accountability mechanisms in the 75 priority countries, highlighting both positive developments and challenges. Note: no submission received
3. Countdown to 2015 (1) A progress report on CoIA’s 12 health indicators to inform and complement the iERG’s review and analysis; (2) A report on progress in rates of coverage over the last decade by interventions and equity analysis, including in particular under-five mortality rates and maternal mortality rates presented by asset quintile and gender equity considerations. Note: submission received
4. Family Care International (FCI) A progress report with information on how FCI work supports the CoIA recommendations and how it is engaged in the national accountability mechanisms in the 75 priority countries, highlighting both positive developments and challenges. Note: submission received
5. Family Planning 2020 (FP2020) A report on progress in monitoring the implementation of FP commitments in the 75 priority countries, highlighting both positive developments and challenges. Note: submission received
6. Gavi, the Vaccine Alliance A progress report on the vaccination agenda in the 75 priority countries, including the plans to scale up and strengthen routine immunization systems in these countries, highlighting both positive developments and challenges. Note: submission received
7. Global Fund Evidence or case studies about the progress in implementation of health programmes supported by the Global Fund that cover a range of
interventions for women and children across the continuum of pre-pregnancy, pregnancy, birth and infant and child care, including adolescent health metrics, worldwide and in particular in the 75 priority countries, highlighting both positive developments and challenges. Note: submission received
8. Guttmacher Institute A report with data reflecting progress in addressing unsafe abortion worldwide and in particular in the 75 priority countries, especially among adolescents, highlighting both positive developments and challenges. Note: submission received
9. H4+ A progress report on monitoring the implementation of commitments made to the Global Strategy in the 75 priority countries, highlighting both positive developments and challenges. Note: submission received
10. International Planned Parenthood Federation (IPPF) A report with information on how the work of IPPF supports the CoIA recommendations and how it is engaged in the national accountability mechanisms in the 75 priority countries, highlighting both positive developments and challenges. Note: submission received
11. Inter-Parliamentary Union (IPU) A report on the progress achieved in parliamentary engagement and oversight for reproductive, maternal, newborn, and child health in the 75 priority countries, highlighting both positive developments and challenges in this area, in particular with regard to the IPU’s own Resolution on Women’s and Children’s Health. Note: submission received
12. International Telecommunication Union (ITU) Evidence on how information and communication technologies support the UN Secretary-General’s Global Strategy. Note: no submission received
13. Office of the UN High Commissioner for Human Rights (OHCHR) A report with evidence regarding the contribution of human rights instruments to women’s and children’s health. Note: no submission received
310 Achievements and Prospects
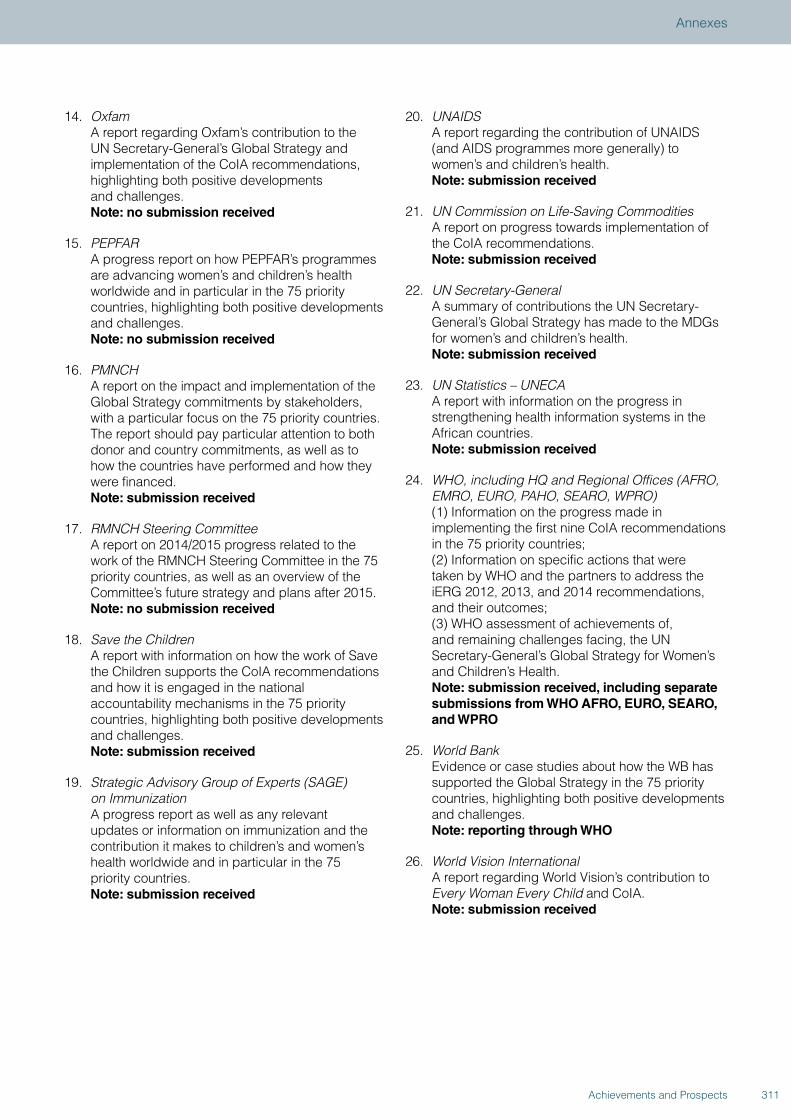
14. Oxfam A report regarding Oxfam’s contribution to the UN Secretary-General’s Global Strategy and implementation of the CoIA recommendations, highlighting both positive developments and challenges. Note: no submission received
15. PEPFAR A progress report on how PEPFAR’s programmes are advancing women’s and children’s health worldwide and in particular in the 75 priority countries, highlighting both positive developments and challenges. Note: no submission received
16. PMNCH A report on the impact and implementation of the Global Strategy commitments by stakeholders, with a particular focus on the 75 priority countries. The report should pay particular attention to both donor and country commitments, as well as to how the countries have performed and how they were financed. Note: submission received
17. RMNCH Steering Committee A report on 2014/2015 progress related to the work of the RMNCH Steering Committee in the 75 priority countries, as well as an overview of the Committee’s future strategy and plans after 2015. Note: no submission received
18. Save the Children A report with information on how the work of Save the Children supports the CoIA recommendations and how it is engaged in the national accountability mechanisms in the 75 priority countries, highlighting both positive developments and challenges. Note: submission received
19. Strategic Advisory Group of Experts (SAGE) on Immunization A progress report as well as any relevant updates or information on immunization and the contribution it makes to children’s and women’s health worldwide and in particular in the 75 priority countries. Note: submission received
20. UNAIDS A report regarding the contribution of UNAIDS (and AIDS programmes more generally) to women’s and children’s health. Note: submission received
21. UN Commission on Life-Saving Commodities A report on progress towards implementation of the CoIA recommendations. Note: submission received
22. UN Secretary-General A summary of contributions the UN Secretary-General’s Global Strategy has made to the MDGs for women’s and children’s health. Note: submission received
23. UN Statistics – UNECA A report with information on the progress in strengthening health information systems in the African countries. Note: submission received
24. WHO, including HQ and Regional Offices (AFRO, EMRO, EURO, PAHO, SEARO, WPRO) (1) Information on the progress made in implementing the first nine CoIA recommendations in the 75 priority countries; (2) Information on specific actions that were taken by WHO and the partners to address the iERG 2012, 2013, and 2014 recommendations, and their outcomes; (3) WHO assessment of achievements of, and remaining challenges facing, the UN Secretary-General’s Global Strategy for Women’s and Children’s Health. Note: submission received, including separate submissions from WHO AFRO, EURO, SEARO, and WPRO
25. World Bank Evidence or case studies about how the WB has supported the Global Strategy in the 75 priority countries, highlighting both positive developments and challenges. Note: reporting through WHO
26. World Vision International A report regarding World Vision’s contribution to Every Woman Every Child and CoIA. Note: submission received
311Achievements and Prospects
Annexes
ANNEX 6. THE iERG’S INPUT ON THE BACKGROUND PAPER ON ACCOUNTABILITY FOR THE UPDATED GLOBAL STRATEGY FOR WOMEN’S, CHILDREN’S, AND ADOLESCENTS’ HEALTH
The iERG met in London in April to discuss the latest draft of the Background Paper on Accountability (dated 24 March, 2015), prepared by the Accountability Substream as part of the preparation for the updated Global Strategy for Women’s, Children’s, and Adolescents’ Health. On 13 April, 2015, the iERG submitted its input to the coordinators and to PMNCH, summarizing their discussions and outlining their position on independent accountability with regard to the updated Global Strategy.
1. The iERG very much welcomes the positive references to existing work, reports, and recommendations regarding progress towards strengthening independent accountability mechanisms to accelerate advances in women’s, children’s, and adolescents’ health. We are extremely pleased that the drafting team endorses the tripartite CoIA framework for independent accountability, which we have been using for 4 years now—to monitor, review, and act/remedy. We also support the operating principles for post-2015 accountability (page 10), many of which we set out in our 2014 report.
2. We agree that while much progress has been made in strengthening independent accountability since 2010, serious challenges remain in countries and globally. We therefore strongly support the renewed attention to countries—a consistent theme in each of our three annual reports. We urge you to consider carefully, and make specific recommendations for, ways in which national mechanisms that are robust and fully participatory, including the most marginalized populations, can become a major force for independent accountability in countries and can feed into global accountability mechanisms.
3. We welcome the recommendation that a broader set of harmonized and SDG-aligned indicators needs to be defined urgently, including indicators for human rights.
4. We also agree that a revised Global Strategy 2.0 independent accountability system must take greater note of equity considerations (which will be extensively covered in the iERG’s 2015 report),
adolescent health (see the iERG’s 2013 Report), social determinants of health (our 2014 report), sexual and reproductive health (reports passim), humanitarian settings, and the private sector.
5. We wish to draw attention to the importance of donor accountability, notably missing from the current draft. Donor accountability was core to the original vision of CoIA, and is increasingly becoming a strong demand from countries. Unless donor accountability is fully addressed, we will likely find that independent accountability in countries will be resisted or seen as inequitable.
6. We support the conclusion by the drafting team that stronger processes are needed to facilitate follow-up actions. Despite several attempts, the iERG has not been able to secure strong enough follow-up by partners outside of a stakeholders’ forum held after publication of iERG, PMNCH, and Countdown reports.
7. While we agree that existing independent accountability arrangements are fragmented, we do not fully share the solution for global accountability proposed by the drafting team. Here are some reasons for our concern.
• The nature and extent of fragmentation is both misdiagnosed and insufficiently acknowledged. The division in global accountability is not primarily between iERG, Countdown, and PMNCH. In fact, these three entities have worked closely together these past 4 years to ensure the maximum possible coordination and coherence. The major fragmentation has been between vertical programmes—with separate accountability arrangements for A Promise Renewed, FP2020, Gavi, nutrition, Global Fund, and so on.
• While we agree that PMNCH has many advantages as an organisation to support administratively and logistically global accountability, we do not agree that PMNCH itself should carry out the independent accountability function for GS 2.0. It is not sufficiently independent to do so, and nor does
312 Achievements and Prospects
it currently have the diversity and depth of experience necessary for this role.
• While we support the creation of an Independent Advisory panel, we do not agree that its function should be to “guide” and “peer review” an accountability process that is primarily the responsibility of PMNCH.
• We do not agree that the Independent Advisory Panel (IAP) should report to the Chair of the PMNCH Board. The Chair of the PMNCH Board is not responsible for implementation of GS 2.0. The locus of that responsibility—and so the reporting line for the IAP—rests with the Executive Office of the Secretary-General, through WHO.
8. We have an alternative proposal to make to secure appropriately independent global accountability for women’s, children’s, and adolescents’ health.
• A 7-9 member IAP should be established through a widely disseminated call for nominations to all stakeholders, overseen by the PMNCH Board. The Board, or a sub-committee of the Board, would review candidates and make the final selection for IAP membership. That final shortlist would be sent to the UNSG for approval.
• The core task of the IAP would be to gather and commission evidence from multiple sources and write an annual State of Women’s, Children’s, and Adolescents’ Health Report. PMNCH itself would not be given the primary responsibility for writing this report.
• To assist the IAP, a small technical team would be established (total 2 FTEs, appointed by the IAP in collaboration with PMNCH) to gather, analyse, and help interpret the data being considered by the IAP.
• The IAP would report to the UNSG, through the DG of WHO.
• PMNCH would not only act as the appointee organisation, through its Board, for the IAP—it would also be the locus of full administrative and logistical support for the IAP.
• We would also encourage country-based IAPs to be created, set up by national governments, with the support of the H4+.
9. Regarding dissemination and action, we endorse your proposal that “a key lesson from GS1 is to ensure that the accountability process is linked/embedded in inter-governmental mechanisms. In this regard, key intergovernmental and regional bodies include the UNGA and the World Health Assembly, the African Union and the PPD.”
10. Finally, we would like to inform you that we are submitting a request to the EWEC Technical Content Working Group on Financing to add a sixth recommendation—namely, that a portion of financing be devoted to independent accountability at both global and national levels.
313Achievements and Prospects
Annexes

Mrs Joy Phumaphi iERG Co-Chair
Joy Phumaphi is the Executive Secretary of the African Leaders Malaria Alliance, a member of the UNSG’s High-Level Panel on the Global Response to Health Crises, and the Chair of the Global Leaders Council for Reproductive Health. She served as Member of Parliament in Botswana, holding portfolio responsibility in the cabinet, first for Lands and Housing (1995–1999), and then for Health (1999–2003). She later joined the WHO as Assistant Director General for Family and Community Health (2003–2007). She has served as Vice President for Human Development at the World Bank (2007–2009) and has held positions on a number of commissions and expert groups. She currently sits on the Board of several international non-profit organizations working on global health.
Professor Richard Horton iERG Co-Chair
Richard Horton is Editor-in-Chief of The Lancet. He is an honorary professor at the London School of Hygiene and Tropical Medicine, University College London, and the University of Oslo; a Foreign Associate of the US Institute of Medicine; and a Fellow of the UK’s Academy of Medical Sciences.
Dr Carmen BarrosoiERG Member
Carmen Barroso is the Regional Director of International Planned Parenthood Federation, Western Hemisphere Region (IPPF/WHR). She has been a Professor of the Sociology Faculty at the University of Sao Paulo, Brazil—her native country—and a Director of the Population and Reproductive Health Program of the MacArthur Foundation, in Chicago, US.
Professor Zulfiqar BhuttaiERG Member
Zulfiqar Bhutta is the Robert Harding Inaugural Chair in Global Child Health and Policy at the Centre for Global Child Health at the Hospital for Sick Children, Toronto, Canada and the Founding Director of the Center of Excellence in Women and Child Health across all campuses of the Aga Khan University, in South-Central Asia and East Africa. He also holds adjunct professorships at several leading universities globally, including the Schools of Public Health at Johns Hopkins (Baltimore), Boston University School of Public Health, Tufts University (Boston), University of Alberta, and the London School of Hygiene & Tropical Medicine. Dr Bhutta leads large research groups across Karachi and Toronto focusing on knowledge synthesis, translation for policy, and impact.
independent Expert Review Group (iERG)Members
314 Achievements and Prospects

Mrs Kathleen FerrieriERG Member
Kathleen Ferrier is actively involved in issues relating to international relations and cooperation, with a focus on health, human rights, migration, and sustainability. Born in Suriname, she worked on grassroots health, education, and development projects in Chile and Brazil, before serving as a member of parliament in the Netherlands for ten years. She currently lives in Hong Kong, where she works as an academic professor.
Ms Sejal HathiiERG Member
Sejal Hathi is an MD/MBA student at Stanford University, and the Cofounder & Global Ambassador for Girltank. She is a Stanford Hospital & Clinics Innovation Fellow, a Yale University Global Health Fellow, and a Paul & Daisy Soros Fellow. Sejal is pursuing a career at the nexus of technology, policy, and global health.
Professor Dean JamisoniERG Member
Dean Jamison is an Emeritus Professor in the Department of Global Health at the University of Washington and a Senior Fellow in Global Health Sciences at the University of California, San Francisco. An economist, he is an elected member of the U.S. National Academy of Medicine.
Professor Tarek MeguidiERG Member
Tarek Meguid is Consultant Obstetrician and Gynaecologist in Mnazi Mmoja Hospital and Associate Professor at the State University of Zanzibar (SUZA), School of Health & Medical Sciences, in Tanzania. He is the former Associate Professor and Head of the Department of Obstetrics & Gynaecology at the University of Namibia School of Medicine. He also served as Head of the Department of Obstetrics & Gynaecology at Bwaila Hospital and Kamuzu Central Hospital in Lilongwe, Malawi.
Professor Miriam WereiERG Member
Miriam Were is currently the Chancellor of Moi University, Kenya. Professor Were’s career path includes working as member of the University of Nairobi’s Faculty of Medicine, with the Ministry of Health in Kenya, as UNICEF’s Chief of Health and Nutrition in Ethiopia, as the WHO Representative in Ethiopia, and as Director of UNFPA’s Technical Advisory Team for East, Central and Anglophone West Africa. Since retirement in 2000, she has remained professionally involved in the health sector, including as Chair of Kenya’s National AIDS Control Council, Chair of the Board of the African Medical and Research Foundation (AMREF), and member of the Board of the Global Health Workforce Alliance (GHWA).
315Achievements and Prospects


http://www.who.int/woman_child_accountability/ierg/en/ACHIEVEMENTS AND PROSPECTS
ISBN 978 92 4 150928 2


