Embed Size (px)
Citation preview

FAST TRACK
Estimates of the cancer burden in Europe from radioactive fallout from the
Chernobyl accident
Elisabeth Cardis1*, Daniel Krewski2, Mathieu Boniol1, Vladimir Drozdovitch1, Sarah C. Darby3, Ethel S. Gilbert4,Suminori Akiba
5, Jacques Benichou
6, Jacques Ferlay
1, Sara Gandini
7, Catherine Hill
8, Geoffrey Howe
9,
Ausrele Kesminiene1, Mirjana Moser10, Marie Sanchez1, Hans Storm11, Laurent Voisin1 and Peter Boyle1
1International Agency for Research on Cancer, Lyon, France2McLaughlin Centre for Population Health Risk Assessment, Institute of Population Health,University of Ottawa, Ottawa, Ontario, Canada3Clinical Trial Service Unit, University of Oxford, United Kingdom4Radiation Epidemiology Branch, Division of Epidemiology and Genetics, National Cancer Institute, Bethesda, MD, USA5Kagoshima University, Graduate School of Medical and Dental Sciences, Kagoshima, Japan6Biostatistics Unit, University of Rouen Medical School and Rouen University Hospital, Rouen, France7European Institute of Oncology, Milano, Italy8Institut Gustave-Roussy, Villejuif, France9Department of Epidemiology, Mailman School of Public Health, Columbia University, New York, NY, USA10Federal Office of Public Health, Bern, Switzerland11Danish Cancer Society, Copenhagen, Denmark
The Chernobyl accident, which occurred April 26, 1986, resulted ina large release of radionuclides, which were deposited over a verywide area, particularly in Europe. Although an increased risk of thy-roid cancer in exposed children has been clearly demonstrated in themost contaminated regions, the impact of the accident on the risk ofother cancers as well as elsewhere in Europe is less clear. The objec-tive of the present study was to evaluate the human cancer burden inEurope as a whole from radioactive fallout from the accident. Aver-age country- and region-specific whole-body and thyroid doses fromChernobyl were estimated using new dosimetric models and radio-logical data. Numbers of cancer cases and deaths possibly attributa-ble to radiation from Chernobyl were estimated, applying state-of-the-art risk models derived from studies of other irradiated popula-tions. Simultaneously, trends in cancer incidence and mortality wereexamined over time and by dose level. The risk projections suggestthat by now Chernobyl may have caused about 1,000 cases of thyroidcancer and 4,000 cases of other cancers in Europe, representingabout 0.01% of all incident cancers since the accident. Models pre-dict that by 2065 about 16,000 (95% UI 3,400–72,000) cases of thy-roid cancer and 25,000 (95% UI 11,000–59,000) cases of other can-cers may be expected due to radiation from the accident, whereasseveral hundred million cancer cases are expected from other causes.Although these estimates are subject to considerable uncertainty,they provide an indication of the order of magnitude of the possibleimpact of the Chernobyl accident. It is unlikely that the cancer bur-den from the largest radiological accident to date could be detectedby monitoring national cancer statistics. Indeed, results of analyses oftime trends in cancer incidence and mortality in Europe do not, atpresent, indicate any increase in cancer rates—other than of thyroidcancer in the most contaminated regions—that can be clearly attrib-uted to radiation from the Chernobyl accident.' 2006 Wiley-Liss, Inc.
Key words: ionizing radiation; Chernobyl accident; radiation risk;time trends; cancer incidence; cancer mortality
The Chernobyl nuclear power plant, in Ukraine approximately10 km south of Belarus, experienced a major accident on April 26,1986, resulting in the release of several types of radionuclides,including (1.2–1.8) 3 1018 Bq of short-lived 131I and about 1.4 31017 Bq of long-lived 134Cs and 137Cs.1 This is the most severe ra-diological accident to date.2
Long-range transport of these and other radionuclides has causedserious contamination of the regions close to the Chernobyl powerplant and dissemination of radionuclides throughout Europe, as wellas to other continents. Deposition was highest in Belarus, Ukraine,and the western part of the Russian Federation, where ingestion offood contaminated with radioactive iodine resulted in inhabitants(particularly children) receiving considerable doses to the thyroid.
Epidemiological studies focusing on the most contaminatedregions of the 3 most affected countries have confirmed a causalrelationship between the observed increased risk of thyroid cancerand exposure to radioactive iodines from the Chernobyl falloutamong those who were children or adolescents when the accidenthappened.3–5 Other types of cancer, including leukemia, have alsobeen investigated,1,6–17 but as yet no association with radiation ex-posure has been clearly demonstrated. Recent studies suggest a pos-sible doubling of the risk of leukemia among Chernobyl cleanupworkers18 and a small increase in the incidence of premenopausalbreast cancer19 in the most contaminated districts (with averagewhole-body doses above 40 mSv), both of which appear to berelated to radiation dose. These findings need confirmation in furtherepidemiological studies with careful individual dose reconstruction.
The full extent of the health impact of Chernobyl on the popula-tion is difficult to gauge. Ten years ago, Cardis and collaborators20
estimated that about 9,000 deaths from cancers and leukemiamight be expected over the course of a lifetime in the mostexposed populations in Belarus, the Russian Federation andUkraine. The objective of the present study was to evaluate thehuman cancer burden in Europe as a whole from radioactive fall-out from the Chernobyl accident. The exposure of Chernobylcleanup workers is not considered here.
Material and methods
There are several approaches to estimating the cancer burden inEurope from Chernobyl, including using risk projection modelsand studying both incidence rates and mortality rates. We used all
This article contains supplementary material that can be found on theInternational Journal of Cancer website.
Grant sponsor: Swiss Federal Office of Public Health; Grant sponsor:Cancer Research UK.*Correspondence to: Radiation Group, International Agency for
Research on Cancer, 150, Cours Albert-Thomas, 69372 Lyon Cedex 08,France. Fax:133-4-72-73-80-54. E-mail: [email protected] 8 March 2006; Accepted after revision 30 March 2006DOI 10.1002/ijc.22037Published online 20 April 2006 in Wiley InterScience (www.interscience.
wiley.com).
Abbreviations: AF, attributable fraction; ATA, at time of accident; BEIRVII, Committee on the Biological Effects of Ionizing Radiation; DDREF,dose and dose-rate effectiveness factor; EAR, excess absolute risk; ERR,excess relative risk; IARC, International Agency for Research on Cancer;UI, uncertainty interval; UNSCEAR, United Nations Scientific Committeeon the Effects of Atomic Radiation.
Int. J. Cancer: 119, 1224–1235 (2006)' 2006 Wiley-Liss, Inc.
Publication of the International Union Against Cancer

these approaches in the current study and based our overall assess-ment on comparisons of the 3.
Sources of data
The present analysis focused on 40 European countries*. Thesecountries constitute the whole of what is defined geographically asEurope, except the Caucasus, Turkey, Andorra and San Marino. Inthe Russian Federation, only the 4 most contaminated regions(Bryansk, Kaluga, Orel and Tula, which make up only a smallfraction of the territory of that country) are included. Informationon population demographics, cancer incidence and mortality wascompiled from a variety of sources, as described in Table A1(electronic supplementary material).
Radiation dosimetry
An assessment of radiation doses received during the first year af-ter the accident was undertaken in most European countries shortlyafter the accident occurred in 1986. These estimates were summar-ized in the United Nations Scientific Committee on the Effects ofAtomic Radiation (UNSCEAR) 1988 report.21 For the purpose of thepresent article, these estimates needed to be updated for the followingreasons. First, the results presented in the UNSCEAR 1988 reportwere based on information then available and were related to expo-sure only during the first year after the accident. A large number ofradiation measurements conducted in the environment, foodstuffs,and humans since 1987 have provided important information onwhich to base estimates of doses accumulating between 1986 and2005. Second, a comprehensive monitoring program was undertakenin Europe (except some Balkan states and Iceland) during 1992–1996 to reconstruct deposition of 137Cs and to create an Atlas on137Cs deposition in Europe.22 Third, improved metabolic modelsdescribing the kinetics of radionuclides in the human body havebecome available since 1987.23–28
Within the framework of the current project, average whole-body doses to adults as a result of external irradiation from radio-nuclides deposited on the ground surface and intake of long-livedisotopes, notably 134Cs and 137Cs, were estimated for 1986–2005and projected to 2065. Age-dependent doses to the thyroid frominhalation and ingestion of 131I within the first 2 months after theaccident (when nearly all the intake of 131I occurred) were alsoestimated. Doses to active bone marrow and to the breast fromexternal irradiation and intake of long-lived isotopes were not esti-mated separately, as they are similar to the whole-body dose.24,27
In this article doses are expressed in mSv as equivalent doses, witha radiation weighting factor of 1 for external g exposure and forb- and g-radiation emitted by 131I, 134Cs and 137Cs.
Dose reconstruction was based on available country-specific radi-ation monitoring data and estimates of exposure levels to popula-tions. Dose evaluation for Belarus, Ukraine and the Russian Federa-tion made use of detailed information provided by local experts orpublished in UNSCEAR and the UN Chernobyl Forum Report.1,29
For less affected European countries, information was eitherobtained from local experts or authorities (Bulgaria, Czech Republic,Finland, Lithuania, and Switzerland) or from relevant publica-tions.30–38 Data on 137Cs deposition density and time-integrated ac-tivity of 131I and 137Cs in foodstuffs in the first year after the acci-dent were available in the Atlas on 137Cs Deposition in Europe22
and in the UNSCEAR 1988 report,21 respectively. This information,together with dose coefficients for inhalation26 and ingestion23–25
and conversion factors for external exposure27,28 and data on popula-tion size and structure in 1986–2005 (http://globalis.gvu.unu.edu/),was used to derive country- and region-specific estimates of whole-body doses and of thyroid doses from 131I.
The following country- and region-specific input data were usedto estimate doses: population-weighted 137Cs ground depositiondensity; radionuclide composition in depositions; time-integratedactivity of radionuclides in foodstuffs, including milk and milkproducts, leafy vegetables, grain products, vegetables and fruitsand meat; age-dependent consumption rates of milk and leafy veg-etables; population structure; and protective actions applied inorder to reduce the exposure of the local populations. In somecountries (Albania, Bosnia and Herzegovina) insufficient datawere available for dose reconstruction, and interpolation betweenneighboring countries was used to derive necessary data. Averagedoses were estimated separately for each country, for each of themost contaminated regions of Belarus, the Russian Federation andUkraine, as well as for regions covered by the cancer registriesincluded in the time trend analyses.
Uncertainties in doses were subjectively evaluated on the basisof availability and reliability of radiation data used for dose recon-struction. Uncertainty was considered smallest in Belarus, Ukraineand the Russian Federation, where a comprehensive dose recon-struction has been done based on results of intensive radiationmonitoring. Higher degrees of uncertainty were assigned to othercountries, particularly when obtained from very limited data(Albania, Bosnia and Herzegovina, Iceland, Macedonia).
Risk projection models
Projections of the number of cancer cases and of the number ofcancer deaths possibly attributable to fallout from Chernobyl werebased on risk models recently developed by the U.S. NationalResearch Council’s Committee on the Biological Effects of Ioniz-ing Radiation (BEIR VII).39 The BEIR VII risk models are a com-bination of excess relative risk (ERR) and excess absolute risk(EAR) models, both of which are written as a linear function ofdose, depending on sex, age at exposure and attained age. TheBEIR VII risk models were derived from analyses of data on theJapanese atomic bomb survivors for all cancer sites except breastand thyroid; for the latter, they were based on published combinedanalyses of data on the atomic bomb survivors and medicallyexposed cohorts.40,41 To estimate risks from exposure at low dosesand dose rates, a dose and dose-rate effectiveness factor (DDREF)of 1.5 was used for all outcomes except leukemia.
Predictions were made for leukemia, breast cancer, thyroid can-cer and all cancers other than leukemia, thyroid and nonmelanomaskin cancer for the 40 countries listed above; for the Russian Fed-eration, predictions were made only for the most heavily contami-nated regions. Estimates for all cancers other than leukemia, thy-roid and nonmelanoma skin cancer were based on the BEIR VIIapproach for all solid cancers, as it was assumed that there was noexcess risk of lymphoma or multiple myeloma.1 Cases arising inpeople born after the accident were included in the predictionsbased on doses from long-lived isotopes and from external expo-sures accumulated after birth.
The population distributions for 1986 and the life table, mortal-ity and cancer rates for each country for 2000 were used in theanalyses. For Belarus, Ukraine and the contaminated regions ofthe Russian Federation, where rates of thyroid cancer in 2000reflected a large radiation-related increase, the baseline rates wereestimated as the population-weighted average of rates in neighbor-ing countries with established cancer registries (Czech Republic,Estonia, Finland and Lithuania).
In projecting risks related to radiation exposure over time, itwas assumed that the population demographics (including the ageand sex distributions of the population and life table) and cancerincidence would remain constant from 1986 to 2065.
As in the BEIR VII report, the risk estimates presented in thisarticle are accompanied by subjective uncertainty intervals thatquantify the most important uncertainty sources: (i) sampling vari-ability in risk model parameter estimates from the atomic bombsurvivor data, (ii) uncertainty in the appropriate value of a DDREFand (iii) for all solid cancers and leukemia, uncertainty in using
*Albania, Austria, Belarus, Belgium, Bosnia and Herzegovina, Bulgaria,Croatia, Cyprus, Czech Republic, Denmark, Estonia, Finland, France, Ger-many, Greece, Hungary, Iceland, Ireland, Italy, Latvia, Liechtenstein, Lith-uania, Luxembourg, Macedonia, Malta, Moldova, Netherlands, Norway,Poland, Portugal, Romania, the Russian Federation, Serbia and Montene-gro, Slovakia, Slovenia, Spain, Sweden, Switzerland, Ukraine and theUnited Kingdom (see Figures 1 and 2).
1225CANCER BURDEN IN EUROPE FROM CHERNOBYL
Japanese atomic bomb survivors to estimate risks in populationswith different baseline risks. These uncertainties were evaluatedas described in BEIR VII.39 In the current article, uncertainty inreconstructed dose estimates is also included.
Trends in cancer incidence and mortality
Annual cancer incidence rates were estimated using data for1981–2002 from 22 registries (from 15 countries, including 11national registries—see Table A1 and Figure A1, electronic sup-plementary material) using Poisson regression, adjusting for regis-try, age at diagnosis, sex and their interaction, taking into accountextra Poisson variation with a scale parameter.42 Rates were stand-ardized directly to the standard world population.43
Analysis of trends in mortality in 30 European countries (Table A1)was based on data from a recent study of mortality and smoking indeveloped countries 1950–2000.44 For ages 0–34, age-, sex- andcause-specific mortality rates were available for each year for1980–2000. For ages 35–69, mortality rates were available for1980, 1985, 1990, 1995 and 2000 by age, sex and cause, and, inaddition, cancer mortality attributed and not attributed to smokingwas available separately, calculated using the method of Petoet al.45 From these data, standardized mortality rates were calcu-lated that were directly standardized to the world population.
Trends in mortality and cancer incidence when age at diagnosiswas at least 70 years were not considered, as it is recognized thatthey are often subject to large artificial trends because of changesin the extent to which cancers in older people are diagnosed andrecorded.46 Cancer groupings and types a priori of interest were:childhood cancers, thyroid cancer, all cancers excluding nonmela-noma skin cancer, leukemia and breast cancer. For mortality, can-cers attributed to and not attributed to smoking45 were also consid-ered, but not thyroid cancer, as this disease is rarely fatal.
The effect of dose on cancer incidence was examined using aPoisson regression model allowing for a registry effect, in addition
to age at diagnosis (in 5-year categories), sex and their interac-tions. Whole-body dose was calculated annually as the cumulativedose since 1986, allowing for a lag time of 2 years for leukemiaand 5 years for all other cancers, as has been done in studies ofatomic bomb survivors.47 For thyroid cancer, age-specific (0–4, 5–9, 10–14, 15–29, 30–59 and �60 years) dose to the thyroid in1986 was used, allowing for a 5-year lag.
Analyses adjusting for age at diagnosis, sex and registry werealso conducted, testing for a change in the slope of the time trendsafter the Chernobyl accident using linear contrasts,48 in which theincrease in cancer incidence during 1981–1990 (the period prior toand up to 5 years after the Chernobyl accident, allowing for a lagof 5 years after the accident before a possible effect on cancerrates could occur) was compared to that for 1991–2000.
To test for differing trends in mortality over time between coun-tries, or groups of countries, with different average doses from Cher-nobyl, the numbers of deaths and of person-years were also stratifiedaccording to age in 5-year groups, sex, calendar year and country.For each country (or group of countries), the linear trend in the mor-tality rate over calendar year was estimated, assuming that the num-ber of deaths in each age-sex group in each year had a Poisson distri-bution with mean depending on the relevant number of person-years.Tests for an interaction between the trend with calendar year anddose were carried out by an F test after carrying out linear regressionof the estimated trend in each country on the country-specific meandose. This method was used because it was found that there was sub-stantial random variability between the calendar-year trends in thedifferent countries, even after allowing for the extra-Poisson variationaccounted for by a negative-binomial distribution.
Ethical issues
The study did not include any contact with individual study sub-jects, and no individuals could be identified from the data used inthe analyses.
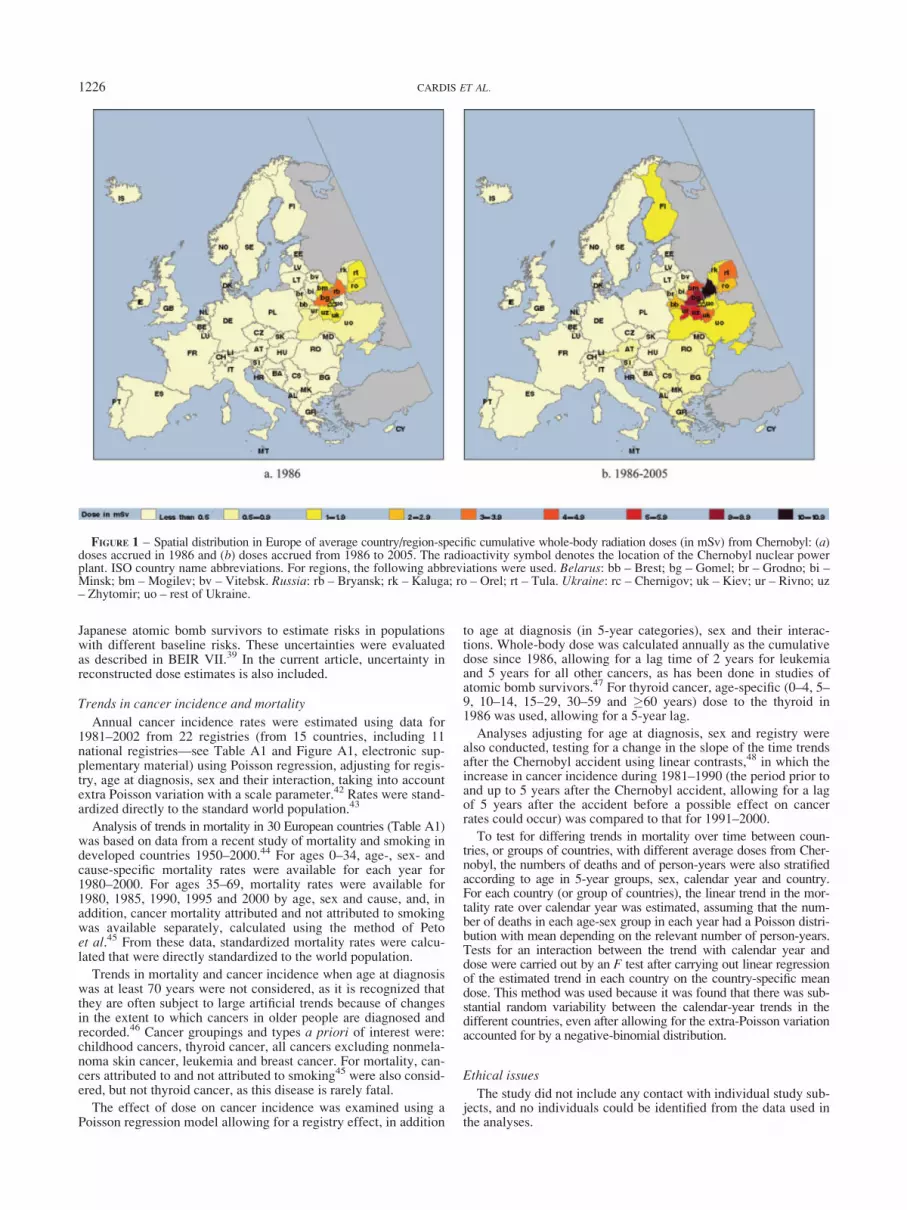
FIGURE 1 – Spatial distribution in Europe of average country/region-specific cumulative whole-body radiation doses (in mSv) from Chernobyl: (a)doses accrued in 1986 and (b) doses accrued from 1986 to 2005. The radioactivity symbol denotes the location of the Chernobyl nuclear powerplant. ISO country name abbreviations. For regions, the following abbreviations were used. Belarus: bb – Brest; bg – Gomel; br – Grodno; bi –Minsk; bm – Mogilev; bv – Vitebsk. Russia: rb – Bryansk; rk – Kaluga; ro – Orel; rt – Tula. Ukraine: rc – Chernigov; uk – Kiev; ur – Rivno; uz– Zhytomir; uo – rest of Ukraine.
1226 CARDIS ET AL.

Results
Radiation doses resulting from the Chernobyl accident
The spatial distribution of average country-specific whole-bodydoses from internal and external exposure from long-lived radio-nuclides for 1986 is shown in Figure 1a, and the cumulative dosefrom 1986 to 2005 is shown in Figure 1b. The latter represents, onaverage, about 85% of the lifetime dose from Chernobyl thatwould be accumulated by a person who lived until 2065. Country-and, where appropriate, region-specific average doses used in therisk predictions are shown in Figure A2 in the electronic supple-mentary material. The distribution of average doses in the geo-graphical areas used in the analyses of cancer incidence trends andin the countries included in the analyses of mortality trends areshown in Figure A3. In 1986 doses were highest in Belarus andUkraine, with the average cumulative whole-body dose exceeding0.5 mSv. By 2005 the average cumulative country-specific whole-body doses were respectively, 2.8 mSv in Belarus, 5.1 mSv in themost contaminated areas of the Russian Federation and 2.1 mSv inUkraine; it was 1.4 mSv in Finland. The average cumulative dosethrough 2005 in the Gomel region of Belarus and in the Bryanskregion of the Russian Federation was estimated to be about 20times higher (around 10 mSv) than that for Europe as a whole (0.5mSv). For comparison, in Europe the average individual whole-body dose accumulated from natural background radiation,excluding radon, over that period is about 20 mSv. The geometricstandard deviation (GSD) of the average cumulative whole-bodydose estimates was evaluated to range from 1.1 in the most conta-minated areas (Belarus, the 4 regions of the Russian Federationand Ukraine) to 1.6 in the least contaminated countries.
The spatial distribution of doses to the thyroid from 131I isshown in Figure 2 for children younger than 5 years and for adultsat least 30 years old in 1986. The country- or, where appropriate,region-specific doses used in the risk predictions are shown in Fig-
ure A4, whereas Figure A5 shows the distribution of averagedoses in the geographical areas used in the analyses of cancer inci-dence trends. Doses to the thyroid from 131I were considerablyhigher than whole-body doses from external and internal exposureto long-lived radionuclides. The highest average doses to the thyroidwere received in the Gomel region of Belarus (630 and 150 mSvfor young children and adults, respectively), in the Bryansk regionof the Russian Federation (180 and 25 mSv, respectively) and inthe Zhytomir region of Ukraine (150 and 40 mSv respectively).Doses to young children were consistently higher than dosesreceived by adults. The GSD of the average thyroid dose estimateswas evaluated to range from 1.2, in the most contaminated areas,where they were based on direct thyroid measurement (the Gomelregion of Belarus, the Bryansk region of the Russian Federationand the Kiev and Zhytomir regions of Ukraine) to 2.0, in the leastcontaminated countries.
Comparisons of the doses with those estimated and publishedby UNSCEAR21 will be discussed in detail in another article. Thelargest changes concerned thyroid doses in the 3 most affectedcountries. Finland, Austria, Greece and Liechtenstein now appearto have had the highest average whole-body doses outside Belarus,the Russian Federation and Ukraine.
Cancer risk projections
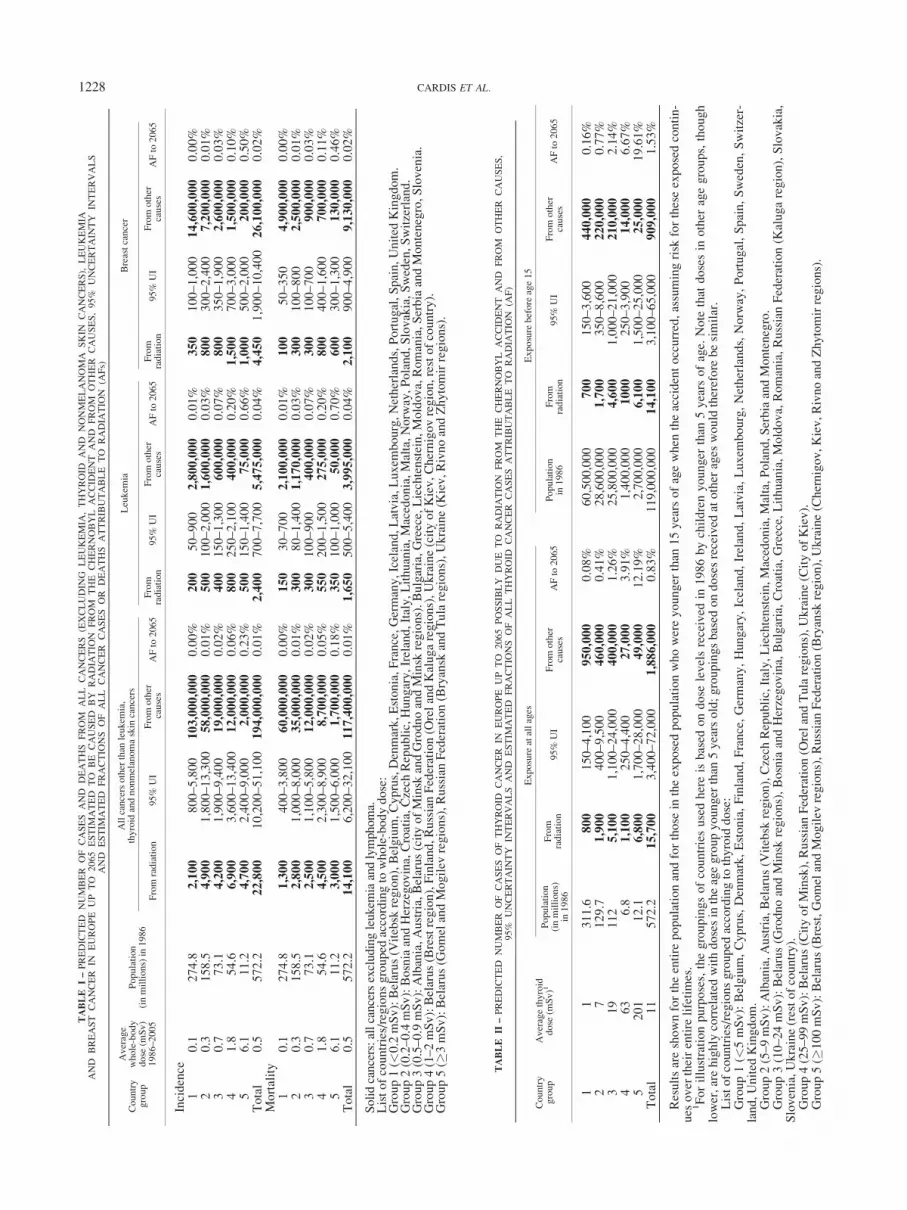
The numbers of cases and deaths predicted to occur between1986 and 2065 (the latter will be 80 years after the accident) fromradiation exposure from the Chernobyl accident are shown inTable I for all cancers (excluding leukemia, thyroid cancer andnonmelanoma skin cancer), leukaemia and breast cancer and inTable II for thyroid cancer. Corresponding estimates for 1986–2005 are shown in Tables III and IV. Also shown are the numbersof cancer cases predicted to occur from causes unrelated to the
FIGURE 2 – Spatial distribution in Europe of average country/region-specific thyroid doses (in mSv) from Chernobyl: (a) doses to childrenbelow the age of 5 at the time of the accident and (b) doses to adults 30 years or older at the time of the accident. The radioactivity symboldenotes the location of the Chernobyl nuclear power plant. ISO country name abbreviations. For regions, the following abbreviations were used.Belarus: bb – Brest; bg – Gomel; br – Grodno; bi – Minsk; bm – Mogilev; bv – Vitebsk. Russia: rb – Bryansk; rk – Kaluga; ro – Orel; rt – Tula.Ukraine: rc – Chernigov; uk – Kiev; ur – Rivno; uz – Zhytomir; uo – rest of Ukraine.
1227CANCER BURDEN IN EUROPE FROM CHERNOBYL
TABLE
I–PREDICTED
NUMBER
OF
CASES
AND
DEATHS
FROM
ALL
CANCERS
(EXCLUDIN
GLEUKEMIA
,THYROID
AND
NONMELANOMA
SKIN
CANCERS),
LEUKEMIA
AND
BREAST
CANCER
INEUROPE
UP
TO
2065ESTIM
ATED
TO
BE
CAUSED
BY
RADIA
TIO
NFROM
THE
CHERNOBYL
ACCID
ENT
AND
FROM
OTHER
CAUSES,95%
UNCERTAIN
TY
INTERVALS
AND
ESTIM
ATED
FRACTIO
NS
OF
ALL
CANCER
CASES
OR
DEATHS
ATTRIBUTABLE
TO
RADIA
TIO
N(A
Fs)
Country
group
Average
whole-body
dose
(mSv)
1986–2005
Population
(inmillions)in
1986
Allcancersother
than
leukem
ia,
thyroid
andnonmelanomaskin
cancers
Leukem
iaBreastcancer
From
radiation
95%
UI
From
other
causes
AFto
2065
From
radiation
95%
UI
From
other
causes
AFto
2065
From
radiation
95%
UI
From
other
causes
AFto
2065
Incidence
10.1
274.8
2,100
800–5,800
103,000,000
0.00%
200
50–900
2,800,000
0.01%
350
100–1,000
14,600,000
0.00%
20.3
158.5
4,900
1,800–13,300
58,000,000
0.01%
500
100–2,000
1,600,000
0.03%
800
300–2,400
7,200,000
0.01%
30.7
73.1
4,200
1,900–9,400
19,000,000
0.02%
400
150–1,300
600,000
0.07%
800
350–1,900
2,600,000
0.03%
41.8
54.6
6,900
3,600–13,400
12,000,000
0.06%
800
250–2,100
400,000
0.20%
1,500
700–3,000
1,500,000
0.10%
56.1
11.2
4,700
2,400–9,000
2,000,000
0.23%
500
150–1,400
75,000
0.66%
1,000
500–2,000
200,000
0.50%
Total
0.5
572.2
22,800
10,200–51,100
194,000,000
0.01%
2,400
700–7,700
5,475,000
0.04%
4,450
1,900–10,400
26,100,000
0.02%
Mortality
10.1
274.8
1,300
400–3,800
60,000,000
0.00%
150
30–700
2,100,000
0.01%
100
50–350
4,900,000
0.00%
20.3
158.5
2,800
1,000–8,000
35,000,000
0.01%
300
80–1,400
1,170,000
0.03%
300
100–800
2,500,000
0.01%
30.7
73.1
2,500
1,100–5,800
12,000,000
0.02%
300
100–900
400,000
0.07%
300
100–700
900,000
0.03%
41.8
54.6
4,500
2,300–8,900
8,700,000
0.05%
550
200–1,500
275,000
0.20%
800
400–1,600
700,000
0.11%
56.1
11.2
3,000
1,500–6,000
1,700,000
0.18%
350
100–1,000
50,000
0.70%
600
300–1,300
130,000
0.46%
Total
0.5
572.2
14,100
6,200–32,100
117,400,000
0.01%
1,650
500–5,400
3,995,000
0.04%
2,100
900–4,900
9,130,000
0.02%
Solidcancers:allcancersexcludingleukem
iaandlymphoma.
Listofcountries/regionsgrouped
accordingto
whole-bodydose:
Group1(<
0.2mSv):Belarus(V
itebsk
region),Belgium,Cyprus,Denmark,Estonia,France,Germany,Iceland,Latvia,Luxem
bourg,Netherlands,Portugal,Spain,United
Kingdom.
Group2(0.2–0.4mSv):BosniaandHerzegovina,Croatia,Czech
Republic,Hungary,Ireland,Italy,Lithuania,Macedonia,Malta,Norw
ay,Poland,Slovakia,Sweden,Switzerland.
Group3(0.5–0.9mSv):Albania,Austria,Belarus(cityofMinsk
andGrodnoandMinsk
regions).Bulgaria,Greece,Liechtenstein,Moldova,Romania,SerbiaandMontenegro,Slovenia.
Group4(1–2mSv):Belarus(Brestregion),Finland,RussianFederation(O
relandKalugaregions),Ukraine(cityofKiev,Chernigovregion,restofcountry).
Group5(�
3mSv):Belarus(G
omelandMogilev
regions),RussianFederation(Bryansk
andTularegions),Ukraine(K
iev,RivnoandZhytomirregions).
TABLE
II–PREDICTED
NUMBER
OF
CASES
OF
THYROID
CANCER
INEUROPE
UP
TO
2065POSSIBLY
DUE
TO
RADIA
TIO
NFROM
THE
CHERNOBYL
ACCID
ENT
AND
FROM
OTHER
CAUSES,
95%
UNCERTAIN
TY
INTERVALS
AND
ESTIM
ATED
FRACTIO
NS
OF
ALL
THYROID
CANCER
CASES
ATTRIBUTABLE
TO
RADIA
TIO
N(A
F)
Country
group
Averagethyroid
dose
(mSv)1
Exposure
atallages
Exposure
before
age15
Population
(inmillions)
in1986
From
radiation
95%
UI
From
other
causes
AFto
2065
Population
in1986
From
radiation
95%
UI
From
other
causes
AFto
2065
11
311.6
800
150–4,100
950,000
0.08%
60,500,000
700
150–3,600
440,000
0.16%
27
129.7
1,900
400–9,500
460,000
0.41%
28,600,000
1,700
350–8,600
220,000
0.77%
319
112
5,100
1,100–24,000
400,000
1.26%
25,800,000
4,600
1,000–21,000
210,000
2.14%
463
6.8
1,100
250–4,400
27,000
3.91%
1,400,000
1000
250–3,900
14,000
6.67%
5201
12.1
6,800
1,700–28,000
49,000
12.19%
2,700,000
6,100
1,500–25,000
25,000
19.61%
Total
11
572.2
15,700
3,400–72,000
1,886,000
0.83%
119,000,000
14,100
3,100–65,000
909,000
1.53%
Resultsareshownfortheentire
populationandforthose
intheexposedpopulationwhowereyounger
than
15yearsofagewhen
theaccidentoccurred,assumingrisk
fortheseexposedcontin-
ues
over
theirentire
lifetimes.
1Forillustrationpurposes,thegroupingsofcountriesusedhereisbased
ondose
levelsreceived
in1986bychildrenyounger
than
5years
ofage.
Note
that
dosesin
other
agegroups,though
lower,arehighly
correlated
withdosesin
theagegroupyounger
than
5yearsold;groupingsbased
ondosesreceived
atother
ages
would
therefore
besimilar.
Listofcountries/regionsgrouped
accordingto
thyroid
dose:
Group1(<
5mSv):Belgium,Cyprus,Denmark,Estonia,Finland,France,Germany,Hungary,Iceland,Ireland,Latvia,Luxem
bourg,Netherlands,Norw
ay,Portugal,Spain,Sweden,Switzer-
land,United
Kingdom.
Group2(5–9mSv):Albania,Austria,Belarus(V
itebsk
region),Czech
Republic,Italy,Liechtenstein,Macedonia,Malta,Poland,SerbiaandMontenegro.
Group3(10–24mSv):Belarus(G
rodnoandMinsk
regions),Bosnia
andHerzegovina,Bulgaria,Croatia,Greece,Lithuania,Moldova,Romania,RussianFederation(K
alugaregion),Slovakia,
Slovenia,Ukraine(restofcountry).
Group4(25–99mSv):Belarus(CityofMinsk),RussianFederation(O
relandTularegions),Ukraine(CityofKiev).
Group5(�
100mSv):Belarus(Brest,GomelandMogilev
regions),RussianFederation(Bryansk
region),Ukraine(Chernigov,Kiev,RivnoandZhytomirregions).
1228 CARDIS ET AL.
TABLE
IV–PREDICTED
NUMBER
OF
CASES
OF
THYROID
CANCER
INEUROPE
UP
TO
2005
POSSIBLY
DUE
TO
RADIA
TIO
NFROM
THE
CHERNOBYL
ACCID
ENT
AND
FROM
OTHER
CAUSES,
95%
UNCERTAIN
TY
INTERVALS
AND
ESTIM
ATED
FRACTIO
NOF
ALL
THYROID
CANCER
CASES
ATTRIBUTABLE
TO
RADIA
TIO
N(A
F)
Country
group
Averagethyroid
dose
(mSv)1
Exposure
atallages
Exposure
before
age15
Population
(inmillions)
in1986
From
radiation
95%
UI
From
other
causes
AFto
2005
Population
(inmillions)
in1986
From
radiation
95%
UI
From
other
causes
AFto
2005
11
311.6
60
10–270
224,000
0.03%
60.5
30
5–170
15,000
0.20%
27
129.7
125
25–600
105,000
0.12%
28.6
80
20–420
7,000
1.13%
319
112
300
70–1,400
91,000
0.33%
25.8
200
40–900
5,000
3.85%
463
6.8
60
20–250
6,000
0.99%
1.4
40
10–160
300
11.76%
5201
12.1
400
100–1,600
11,500
3.36%
2.7
250
60–1,000
600
29.41%
Total
11
572.2
945
200–4,400
437,500
0.22%
119
600
130–2,800
27,900
2.11%
Resultsareshownfortheentire
populationandforthepopulationexposedbefore
ageof15.
1Forillustrationpurposesthegroupingsofcountriesusedherearebased
ondose
levelsreceived
in1986bychildrenyounger
than
5years
ofage.
Note
that
dosesin
other
agegroups,though
lower,arehighly
correlated
withdosesin
theagegroupyounger
5yearsofage;groupingsbased
ondosesreceived
atother
ages
would
therefore
besimilar.
TABLE
III–PREDICTED
NUMBER
OF
CASES
AND
DEATHS
FROM
ALL
CANCERS
(EXCLUDIN
GLEUKEMIA
,THYROID
AND
NONMELANOMA
SKIN
CANCERS),
LEUKEMIA
AND
BREAST
CANCER
INEUROPE
UP
TO
2005POSSIBLY
DUE
TO
RADIA
TIO
NFROM
THE
CHERNOBYL
ACCID
ENT
AND
FROM
OTHER
CAUSES,95%
UNCERTAIN
TY
INTERVALS
AND
ESTIM
ATED
FRACTIO
NS
OF
CASES
OR
DEATHS
ATTRIBUTABLE
TO
RADIA
TIO
N(A
Fs)
Country
group
Average
whole-body
dose
(mSv)
1986–2005
Population
(inmillions)
in1986
Allcancersother
than
leukem
ia,
thyroid
andnonmelanomaskin
cancer
Leukem
iaBreastcancer
From
radiation
95%
UI
From
other
causes
AFto
2005
From
radiation
95%
UI
From
other
causes
AFto
2005
From
radiation
95%
UI
From
other
causes
AFto
2005
Incidence
10.1
311.6
300
100–800
21,000,000
0.00%
80
20–300
600,000
0.01%
20
5–60
3,300,000
0.00%
20.3
129.7
700
250–2,100
12,000,000
0.01%
200
50–700
340,000
0.06%
60
20–150
1,600,000
0.00%
30.7
112
600
250–1,400
4,000,000
0.01%
160
50–500
115,000
0.14%
50
20–120
550,000
0.01%
41.8
6.8
950
500–1,900
2,700,000
0.04%
300
100–850
85,000
0.35%
90
50–200
350,000
0.03%
56.1
12.1
700
350–1,500
550,000
0.13%
200
75–550
18,000
1.10%
60
30–120
60,000
0.10%
Total
0.5
572.2
3,250
1,400–7,700
40,250,000
0.01%
940
310–2,900
1,158,000
0.08%
280
120–650
5,860,000
0.00%
Mortality
10.1
311.6
150
60–450
12,000,000
0.00%
50
10–200
420,000
0.01%
52–15
1,070,000
0.00%
20.3
129.7
350
130–1,000
6,900,000
0.00%
120
30–450
235,000
0.05%
10
5–35
515,000
0.00%
30.7
112
300
130–700
2,400,000
0.01%
110
40–350
79,000
0.14%
10
5–30
190,000
0.00%
41.8
6.8
500
250–950
2,000,000
0.02%
200
80–550
63,000
0.32%
40
20–80
170,000
0.02%
56.1
12.1
350
180–650
420,000
0.08%
140
50–400
13,000
1.07%
30
15–60
33,000
0.09%
Total
0.5
572.2
1,650
700–3,700
23,720,000
0.01%
620
200–1,900
810,000
0.08%
95
40–230
1,978,000
0.00%
1229CANCER BURDEN IN EUROPE FROM CHERNOBYL
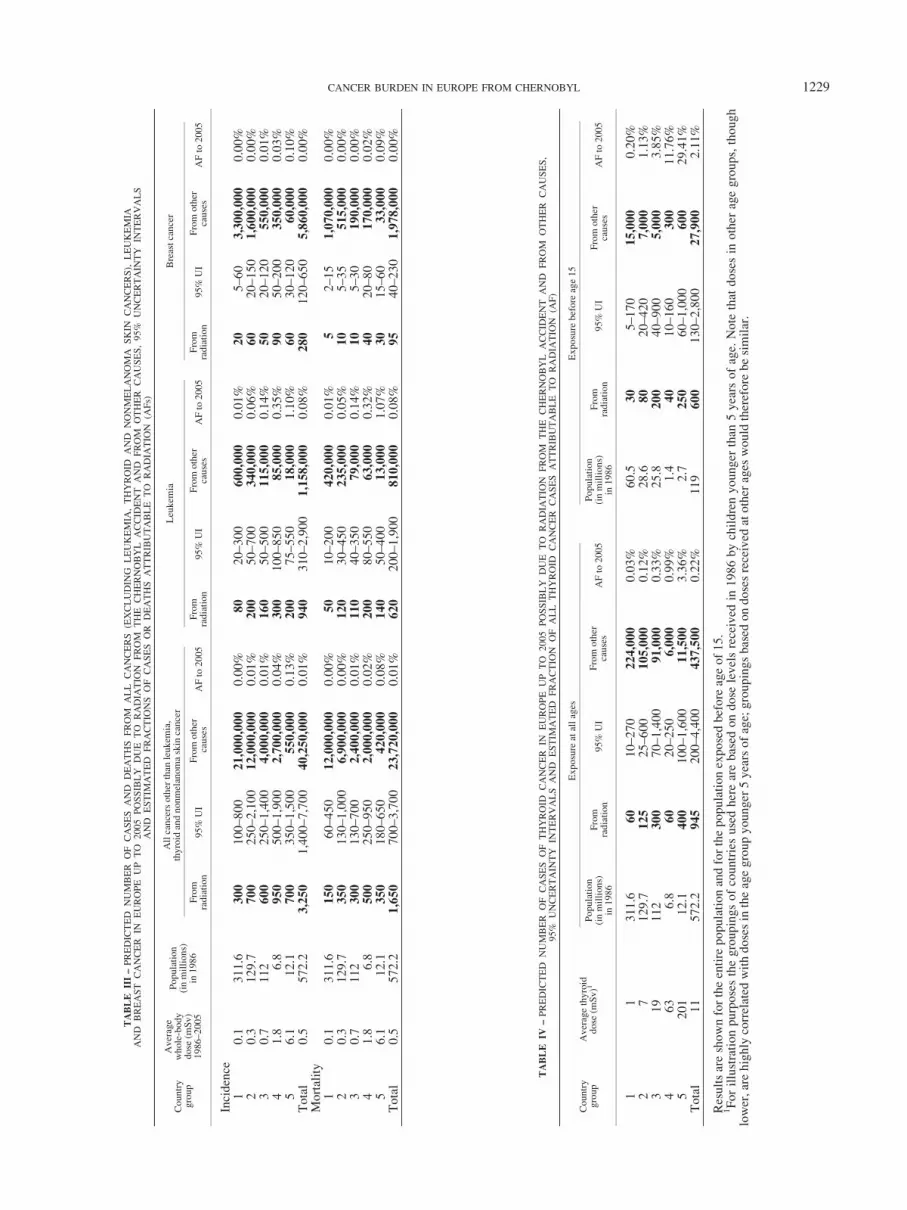
Chernobyl accident, as well as the estimated attributable fractions,defined as the percentage of the total cancer burden that could beexpected from the Chernobyl accident over the same periods.
The total predicted number of cases possibly attributable toChernobyl in Europe (whose population was more 570 millionpeople in 1986) up to 2065 is large in absolute terms, about23,000 for all cancers excluding leukemia, thyroid cancer andnonmelanoma skin cancer (including 4,500 cases of breast cancer)and 2,400 for leukemia (Table I). An additional 16,000 cases ofthyroid cancer are predicted from 131I exposure (Table II). Thepredicted number of deaths up to 2065 is about 14,000 for all can-cers excluding leukemia, thyroid cancer and nonmelanoma skincancer (including 2,000 from breast cancer) and about 1,700 forleukemia. These estimates are subject to substantial uncertainty,as reflected by the 95% uncertainty intervals.
The estimated attributable fractions (AFs) are very small com-pared to the background number of cases expected in the absenceof exposure from Chernobyl. For all cancers excluding leukemia,thyroid cancer and nonmelanoma skin cancer, they range from0.002%, in the least contaminated countries (with a cumulativewhole-body dose of less than 0.2 mSv by 2005), to 0.23%, in themost contaminated countries (with a cumulative whole-body doseof at least 3 mSv). For leukemia, they range from 0.01%, in the leastcontaminated countries, to 0.66%, in the most contaminated countries.
For all cancers combined (excluding leukemia, thyroid cancerand nonmelanoma skin cancer), leukemia and breast cancer, morethan half the possible excess of cases is expected in countrieswhere the average dose is at least 1 mSv, which represent only11% of the entire population under consideration. Of the totalnumber of excess cases predicted to 2065, about 14% of all can-cers, 40% of leukemia cases and 6% of breast cancers are pre-dicted to have occurred in the first 20 years after the accident.
For thyroid cancer, the estimated AFs range from 0.08%, in thecountries least contaminated by 131I (with an average thyroid dose ofless than 5 mSv), to 12%, in the most contaminated countries (with
an average thyroid dose of at least 100 mSv), and 31%, in the Gomelregion of Belarus (not shown). The uncertainty intervals for the esti-mates are particularly wide, ranging from about 3,400 to 72,000excess thyroid cancer cases in Europe by 2065. About half the possi-ble excess cases are predicted to occur in countries with an averagedose of at least 25 mSv, which represent only 3% of the populationunder study. Of the total excess cases predicted up to 2065, about6% are predicted to have occurred in the first 20 years after the acci-dent. The vast majority (90%) of the predicted radiation-inducedcases of thyroid cancer are expected among those who were youngerthan 15 years of age when the Chernobyl accident occurred.
Trends in cancer mortality
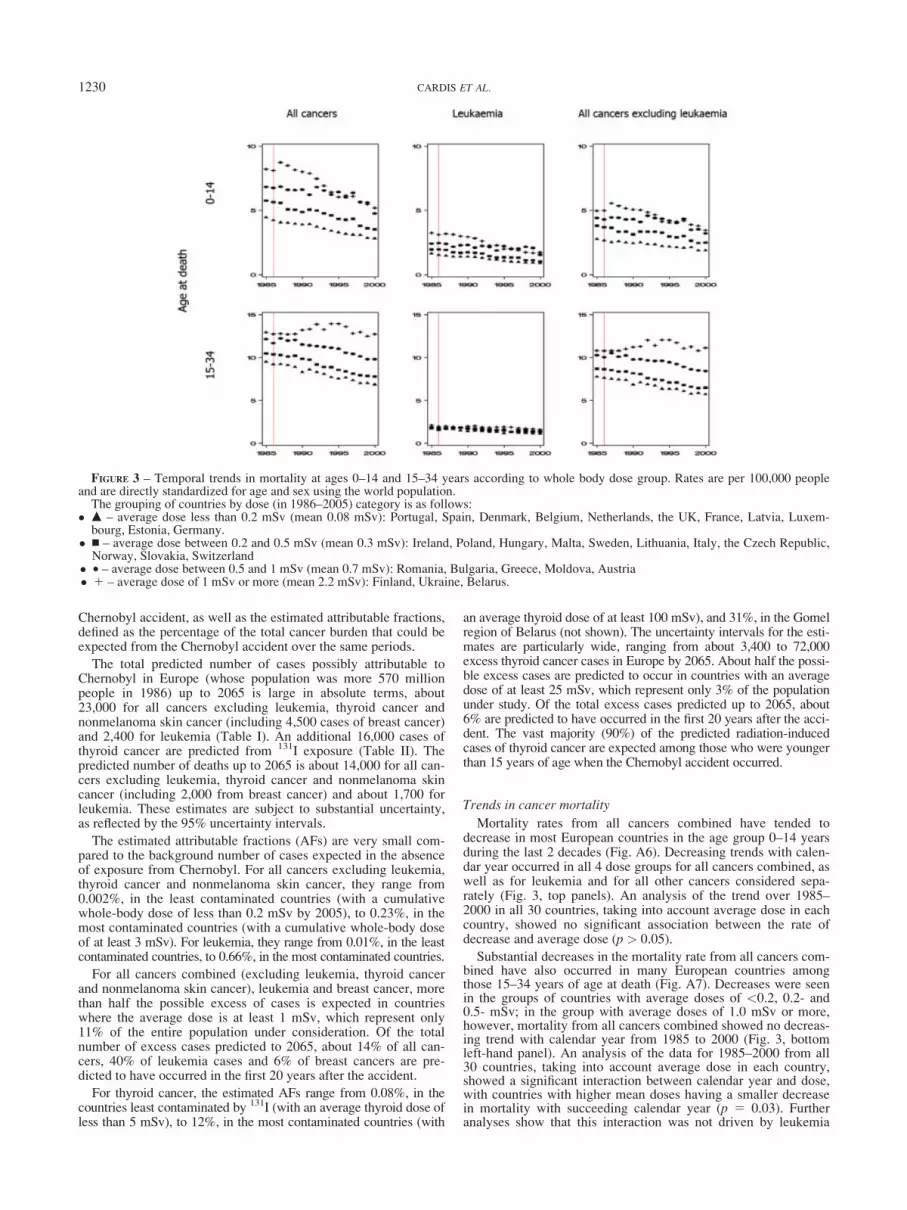
Mortality rates from all cancers combined have tended todecrease in most European countries in the age group 0–14 yearsduring the last 2 decades (Fig. A6). Decreasing trends with calen-dar year occurred in all 4 dose groups for all cancers combined, aswell as for leukemia and for all other cancers considered sepa-rately (Fig. 3, top panels). An analysis of the trend over 1985–2000 in all 30 countries, taking into account average dose in eachcountry, showed no significant association between the rate ofdecrease and average dose (p > 0.05).
Substantial decreases in the mortality rate from all cancers com-bined have also occurred in many European countries amongthose 15–34 years of age at death (Fig. A7). Decreases were seenin the groups of countries with average doses of <0.2, 0.2- and0.5- mSv; in the group with average doses of 1.0 mSv or more,however, mortality from all cancers combined showed no decreas-ing trend with calendar year from 1985 to 2000 (Fig. 3, bottomleft-hand panel). An analysis of the data for 1985–2000 from all30 countries, taking into account average dose in each country,showed a significant interaction between calendar year and dose,with countries with higher mean doses having a smaller decreasein mortality with succeeding calendar year (p 5 0.03). Furtheranalyses show that this interaction was not driven by leukemia
FIGURE 3 – Temporal trends in mortality at ages 0–14 and 15–34 years according to whole body dose group. Rates are per 100,000 peopleand are directly standardized for age and sex using the world population.
The grouping of countries by dose (in 1986–2005) category is as follows:� m – average dose less than 0.2 mSv (mean 0.08 mSv): Portugal, Spain, Denmark, Belgium, Netherlands, the UK, France, Latvia, Luxem-
bourg, Estonia, Germany.� n – average dose between 0.2 and 0.5 mSv (mean 0.3 mSv): Ireland, Poland, Hungary, Malta, Sweden, Lithuania, Italy, the Czech Republic,Norway, Slovakia, Switzerland
� • – average dose between 0.5 and 1 mSv (mean 0.7 mSv): Romania, Bulgaria, Greece, Moldova, Austria� 1 – average dose of 1 mSv or more (mean 2.2 mSv): Finland, Ukraine, Belarus.
1230 CARDIS ET AL.
(Fig. 3, bottom middle panel) or by any of the specific cancers forwhich mortality data were available for analysis (lymphomas orcolorectal, stomach or lung cancers; data not shown). When thetrends over time among individual countries were examined, itcould be seen that the interaction was entirely due to Ukraine,where cancer mortality rates in this age group tended to increaseover this period. In all the other countries included in the analysesthey either decreased or tended to decrease. Mortality rates in thisage group from causes other than cancer have also been increasingover the same period in Ukraine.
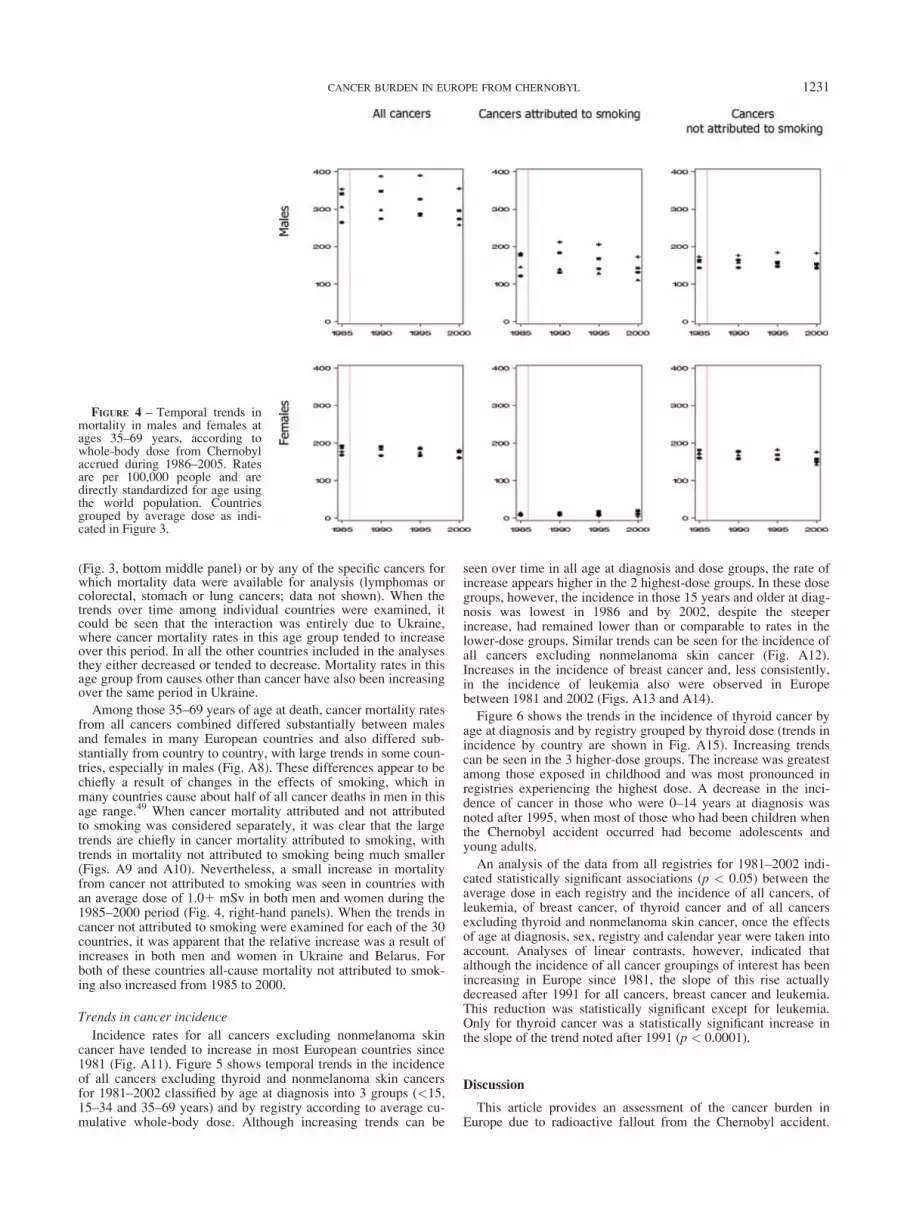
Among those 35–69 years of age at death, cancer mortality ratesfrom all cancers combined differed substantially between malesand females in many European countries and also differed sub-stantially from country to country, with large trends in some coun-tries, especially in males (Fig. A8). These differences appear to bechiefly a result of changes in the effects of smoking, which inmany countries cause about half of all cancer deaths in men in thisage range.49 When cancer mortality attributed and not attributedto smoking was considered separately, it was clear that the largetrends are chiefly in cancer mortality attributed to smoking, withtrends in mortality not attributed to smoking being much smaller(Figs. A9 and A10). Nevertheless, a small increase in mortalityfrom cancer not attributed to smoking was seen in countries withan average dose of 1.01 mSv in both men and women during the1985–2000 period (Fig. 4, right-hand panels). When the trends incancer not attributed to smoking were examined for each of the 30countries, it was apparent that the relative increase was a result ofincreases in both men and women in Ukraine and Belarus. Forboth of these countries all-cause mortality not attributed to smok-ing also increased from 1985 to 2000.
Trends in cancer incidence
Incidence rates for all cancers excluding nonmelanoma skincancer have tended to increase in most European countries since1981 (Fig. A11). Figure 5 shows temporal trends in the incidenceof all cancers excluding thyroid and nonmelanoma skin cancersfor 1981–2002 classified by age at diagnosis into 3 groups (<15,15–34 and 35–69 years) and by registry according to average cu-mulative whole-body dose. Although increasing trends can be
seen over time in all age at diagnosis and dose groups, the rate ofincrease appears higher in the 2 highest-dose groups. In these dosegroups, however, the incidence in those 15 years and older at diag-nosis was lowest in 1986 and by 2002, despite the steeperincrease, had remained lower than or comparable to rates in thelower-dose groups. Similar trends can be seen for the incidence ofall cancers excluding nonmelanoma skin cancer (Fig. A12).Increases in the incidence of breast cancer and, less consistently,in the incidence of leukemia also were observed in Europebetween 1981 and 2002 (Figs. A13 and A14).
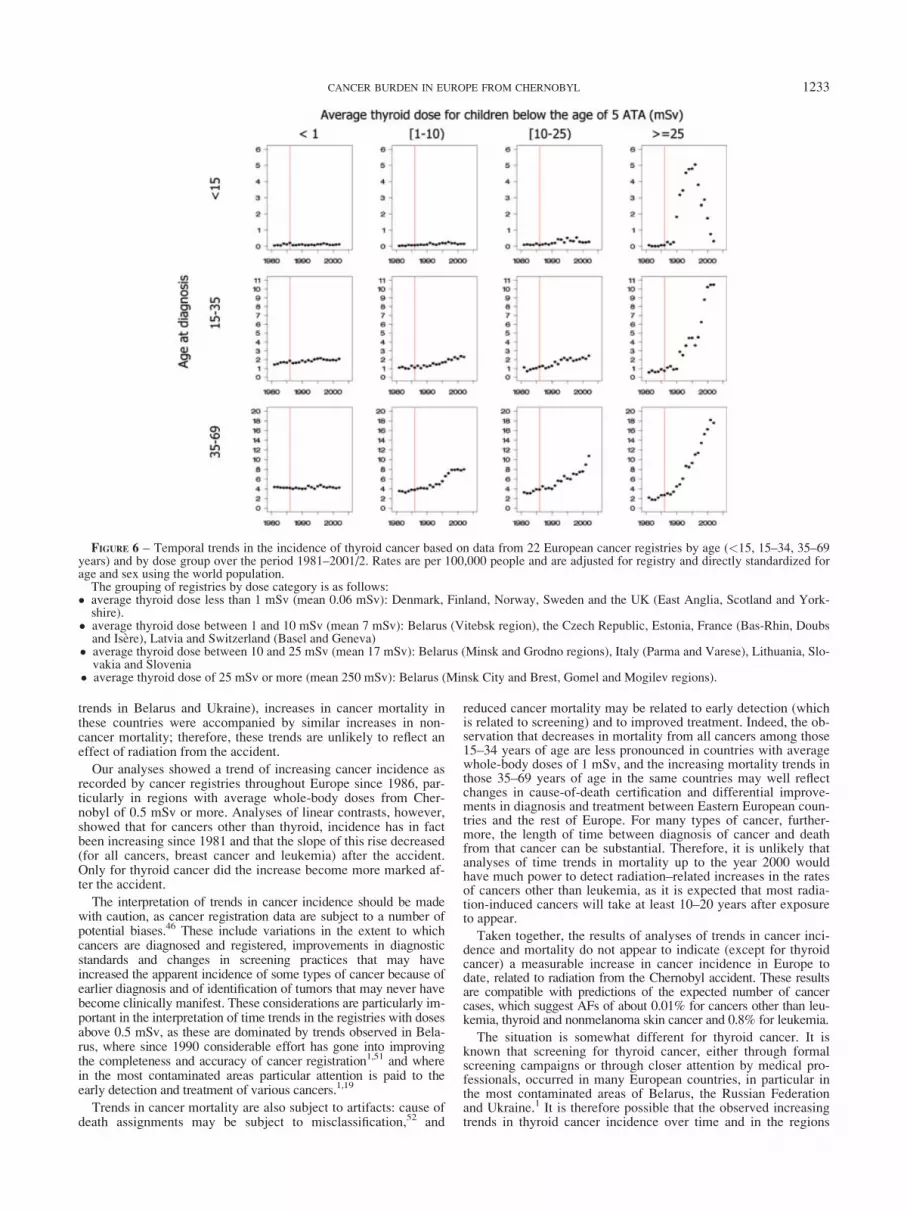
Figure 6 shows the trends in the incidence of thyroid cancer byage at diagnosis and by registry grouped by thyroid dose (trends inincidence by country are shown in Fig. A15). Increasing trendscan be seen in the 3 higher-dose groups. The increase was greatestamong those exposed in childhood and was most pronounced inregistries experiencing the highest dose. A decrease in the inci-dence of cancer in those who were 0–14 years at diagnosis wasnoted after 1995, when most of those who had been children whenthe Chernobyl accident occurred had become adolescents andyoung adults.
An analysis of the data from all registries for 1981–2002 indi-cated statistically significant associations (p < 0.05) between theaverage dose in each registry and the incidence of all cancers, ofleukemia, of breast cancer, of thyroid cancer and of all cancersexcluding thyroid and nonmelanoma skin cancer, once the effectsof age at diagnosis, sex, registry and calendar year were taken intoaccount. Analyses of linear contrasts, however, indicated thatalthough the incidence of all cancer groupings of interest has beenincreasing in Europe since 1981, the slope of this rise actuallydecreased after 1991 for all cancers, breast cancer and leukemia.This reduction was statistically significant except for leukemia.Only for thyroid cancer was a statistically significant increase inthe slope of the trend noted after 1991 (p < 0.0001).
Discussion
This article provides an assessment of the cancer burden inEurope due to radioactive fallout from the Chernobyl accident.
FIGURE 4 – Temporal trends inmortality in males and females atages 35–69 years, according towhole-body dose from Chernobylaccrued during 1986–2005. Ratesare per 100,000 people and aredirectly standardized for age usingthe world population. Countriesgrouped by average dose as indi-cated in Figure 3.
1231CANCER BURDEN IN EUROPE FROM CHERNOBYL

Strengths of our analysis include having performed a systematicreview and synthesis of available data on radionuclide exposures,culminating in an evaluation of the spatial distribution of whole-body and thyroid doses in Europe. Our analysis includes predic-tions of the number of cancer cases and cancer deaths due to radia-tion from the Chernobyl accident to 2065 using risk projectionmodels based on the long-term experience of other populationsexposed to radiation,39 as well as an evaluation of trends in cancerincidence and mortality before and after the Chernobyl accidentand by radiation dose. Weaknesses include the ecological natureof the trend analyses, where exposure to radiation and to potentialconfounding factors are not known at the individual level andwhere cancer registration has been increasing in quality over timein some countries. In addition, the risk models used for predictionswere based on different populations exposed to higher doses forbrief periods and may not be generalizable to circumstances ofvery low cumulative doses delivered over decades.
It is estimated that to date, exposure to radiation from Cher-nobyl may have caused about 3,000 cases of cancer other than leu-kemia, thyroid and nonmelanoma skin cancer in Europe (with anuncertainty range of 1,400–7,700 cases), about 0.008% of the totalnumber of cancer cases in Europe during this period. The numberof cases of leukemia that are possibly a result of the Chernobylaccident is estimated as about 950, similar to the estimated num-ber of cases of thyroid cancer. Apart from leukemia, for which40% of the cases are expected to have occurred already, only asmall proportion of the cases that can possibly be attributed toChernobyl are predicted to have occurred to date. This is becauseof the relatively long average latency (10–20 years or more)between exposure and occurrence of most types of radiation-
related cancers. Further, based on the experience of other popula-tions exposed to radiation in other settings, risk appears to be larg-est after exposure at young ages and does not become apparentuntil later in life.
Because of the very small doses generally received outsideBelarus, the Russian Federation and Ukraine, the small proportionof cancers estimated to be attributable to these exposures and thefact that most radiation-related cases are expected to occur 20years or more after exposure, epidemiological studies to date(including analyses of time trends) have had very little power todetect an effect of the Chernobyl accident on cancer risk. Anexception is thyroid cancer in young people, where, because of thehigh 131I thyroid doses received in the most contaminated areasand the low background incidence rates, epidemiological studieshave demonstrated an association between radiation dose to thethyroid and thyroid cancer risk in the general population.6,7
Cancer mortality rates for children and young adults tended todecrease throughout Europe from 1985 to 2000, except amongthose 15–34 years of age at death in countries with average whole-body doses of 1 mSv or greater. It is notable that decreases in all-cancer and leukemia mortality were seen in those 0–14 years ofage at death where, if a radiation effect were detectable, it wouldbe expected to be largest. Survival from childhood cancer hasimproved substantially in Europe in the last 30 years,50 however,especially for leukemia. Hence, a small increase in the risk ofchildhood cancer mortality related to Chernobyl will be difficultto detect. Among those 35–69 years of age at death, trendsthroughout Europe vary, depending on sex and whether the canceris smoking related. Although trends appear to differ in countriesthat have average whole-body doses of 1 mSv or more (because of
FIGURE 5 – Temporal trends in the incidence of all cancers except thyroid cancer and nonmelanoma skin cancer based on data from 22 Euro-pean cancer registries by age (<15, 15–34, 35–69 years) and by dose group over the period 1981–2001/2. Rates are per 100,000 people adjustedfor registry and directly standardized for age and sex using the world population.
The grouping of registries by dose (in 1986–2005) category is as follows:� average dose less than 0.2 mSv (mean 0.08 mSv): United Kingdom (England and Scotland), Denmark, Latvia, Belarus (Vitebsk region) and
Estonia.� average dose between 0.2 and 0.5 mSv (mean 0.3 mSv): Switzerland (Basel and Geneva), France (Bas-Rhin, Doubs and Isere), Sweden, Lith-uania, the Czech Republic, Norway and Slovakia
� average dose between 0.5 and 1 mSv (mean 0.8 mSv): Belarus (Minsk City, Minsk and Grodno regions), and Slovenia,� average dose of 1 mSv or more (mean 3.2 mSv): Italy (Varese and Parma), Finland, Belarus (Brest, Mogilev and Gomel regions).
1232 CARDIS ET AL.
trends in Belarus and Ukraine), increases in cancer mortality inthese countries were accompanied by similar increases in non-cancer mortality; therefore, these trends are unlikely to reflect aneffect of radiation from the accident.
Our analyses showed a trend of increasing cancer incidence asrecorded by cancer registries throughout Europe since 1986, par-ticularly in regions with average whole-body doses from Cher-nobyl of 0.5 mSv or more. Analyses of linear contrasts, however,showed that for cancers other than thyroid, incidence has in factbeen increasing since 1981 and that the slope of this rise decreased(for all cancers, breast cancer and leukemia) after the accident.Only for thyroid cancer did the increase become more marked af-ter the accident.
The interpretation of trends in cancer incidence should be madewith caution, as cancer registration data are subject to a number ofpotential biases.46 These include variations in the extent to whichcancers are diagnosed and registered, improvements in diagnosticstandards and changes in screening practices that may haveincreased the apparent incidence of some types of cancer because ofearlier diagnosis and of identification of tumors that may never havebecome clinically manifest. These considerations are particularly im-portant in the interpretation of time trends in the registries with dosesabove 0.5 mSv, as these are dominated by trends observed in Bela-rus, where since 1990 considerable effort has gone into improvingthe completeness and accuracy of cancer registration1,51 and wherein the most contaminated areas particular attention is paid to theearly detection and treatment of various cancers.1,19
Trends in cancer mortality are also subject to artifacts: cause ofdeath assignments may be subject to misclassification,52 and
reduced cancer mortality may be related to early detection (whichis related to screening) and to improved treatment. Indeed, the ob-servation that decreases in mortality from all cancers among those15–34 years of age are less pronounced in countries with averagewhole-body doses of 1 mSv, and the increasing mortality trends inthose 35–69 years of age in the same countries may well reflectchanges in cause-of-death certification and differential improve-ments in diagnosis and treatment between Eastern European coun-tries and the rest of Europe. For many types of cancer, further-more, the length of time between diagnosis of cancer and deathfrom that cancer can be substantial. Therefore, it is unlikely thatanalyses of time trends in mortality up to the year 2000 wouldhave much power to detect radiation–related increases in the ratesof cancers other than leukemia, as it is expected that most radia-tion-induced cancers will take at least 10–20 years after exposureto appear.
Taken together, the results of analyses of trends in cancer inci-dence and mortality do not appear to indicate (except for thyroidcancer) a measurable increase in cancer incidence in Europe todate, related to radiation from the Chernobyl accident. These resultsare compatible with predictions of the expected number of cancercases, which suggest AFs of about 0.01% for cancers other than leu-kemia, thyroid and nonmelanoma skin cancer and 0.8% for leukemia.
The situation is somewhat different for thyroid cancer. It isknown that screening for thyroid cancer, either through formalscreening campaigns or through closer attention by medical pro-fessionals, occurred in many European countries, in particular inthe most contaminated areas of Belarus, the Russian Federationand Ukraine.1 It is therefore possible that the observed increasingtrends in thyroid cancer incidence over time and in the regions
FIGURE 6 – Temporal trends in the incidence of thyroid cancer based on data from 22 European cancer registries by age (<15, 15–34, 35–69years) and by dose group over the period 1981–2001/2. Rates are per 100,000 people and are adjusted for registry and directly standardized forage and sex using the world population.
The grouping of registries by dose category is as follows:� average thyroid dose less than 1 mSv (mean 0.06 mSv): Denmark, Finland, Norway, Sweden and the UK (East Anglia, Scotland and York-
shire).� average thyroid dose between 1 and 10 mSv (mean 7 mSv): Belarus (Vitebsk region), the Czech Republic, Estonia, France (Bas-Rhin, Doubsand Isere), Latvia and Switzerland (Basel and Geneva)
� average thyroid dose between 10 and 25 mSv (mean 17 mSv): Belarus (Minsk and Grodno regions), Italy (Parma and Varese), Lithuania, Slo-vakia and Slovenia
� average thyroid dose of 25 mSv or more (mean 250 mSv): Belarus (Minsk City and Brest, Gomel and Mogilev regions).
1233CANCER BURDEN IN EUROPE FROM CHERNOBYL

with the highest doses are attributable at least in part to a screen-ing bias. Much of the increased incidence of thyroid cancerobserved in the most contaminated regions, however, relates tochildhood and adolescent thyroid cancer. Analyses of the cases inthese countries showed that most of these cases were fairly aggres-sive, with a large proportion showing extracapsular invasion anddistant metastases,1,6 cases that are likely to have been diagnosedeven in the absence of screening. However, this may be differentin European countries that were less contaminated by Chernobyl.When analyses of thyroid cancer incidence in relation to radiationdose were restricted to Belarus (not shown) 50% of the cases ofthyroid cancer diagnosed in 1986–2002 were attributed to radia-tion in those exposed before age 15 (23% of cases regardless ofage at exposure). This is consistent with recent analyses that indi-cated that approximately 60% of the cases diagnosed in Belarusbetween 1986 and 2001 among those who were children or adoles-cents in 1986 can be attributed to radiation.5 These estimates aregreater than our predictions using the BEIR VII model (170 cases,with an AF of 25% for the slightly wider period of 1986–2005),although these results are consistent within their uncertainty limits.
Given the lack of demonstrated increases in cancer risk (otherthan for thyroid cancer) in the most affected countries and the rel-atively short follow-up for cancers other than thyroid and leuke-mia (diseases with a very long latent period), it is clear that anyassessment of the cancer burden from the Chernobyl accidentmust be based on risk prediction models derived from other popu-lations exposed to radiation, most notably the atomic bomb survi-vors and patients exposed to medical sources of radiation. Majorquestions relate to the choice of models for transport of riskbetween populations with different background cancer rates, forprojection of risk over time and for extrapolation of risks follow-ing high-dose and high dose-rate exposure to primarily externalradiation to low-dose and low dose-rate exposure involving a mix-ture of external and internal radiation. These factors limit the ac-curacy and precision of such projections. Uncertainties related totransport and DDREF have been taken into account in the currentarticle. Further uncertainty arises, however, from the varying qual-ity of cancer incidence and mortality data throughout Europe,from the assumption of constant population demographics andincidence and mortality rates over time and, in particular, from theunknown shape of the dose–response relationship at the very lowdoses of radiation that many countries received from Chernobyl.Although uncertainties in incidence and mortality rates might beimportant for individual countries, they are of lesser importancefor overall predictions because such uncertainties are averagedover countries. The predictions made in our study from extrapola-tions to low doses are based on models developed by the BEIRVII Committee39 which, after a comprehensive and critical reviewof available epidemiological, biological and biophysical data, con-cluded that the risk would continue in a linear fashion at lowerdoses without a threshold and that even the smallest dose has thepotential to cause a small increase in the risk to humans.
Despite uncertainties in the predictions of the cancer burdendue to Chernobyl, they are useful for public health reasons. Suchpredictions provide an idea of the order of magnitude of the likelyimpact of the accident, estimated to be several tens of thousands
of cancer cases in Europe as a whole. Although this number is farfrom negligible, it should be viewed in the context of the consider-ably larger number of cancer cases expected to occur in Europefrom other causes. Our predictions suggest that of all the cancercases expected to occur in Europe between 1986 and 2065, around0.01% may be related to radiation from the Chernobyl accident.The largest AF, about 1%, is predicted for thyroid cancer, with thevast majority of these cases (close to 70%) expected to occur inthe most contaminated regions of Belarus, the Russian Federationand Ukraine.
The predictions presented here are difficult to verify because,except for thyroid cancer, the AF is too low to be detected epide-miologically. For thyroid cancer, predictions based on the BEIRVII model are consistent with the number of cases observed in themost contaminated regions of Belarus, the Russian Federation andUkraine among those exposed in childhood6 (3,800 reported vs.3,600 predicted). In Belarus, however, the predictions are lowerthan, but statistically compatible with, the number of cancers thathave been diagnosed in Belarus among those exposed in child-hood: our prediction of the total number of cases (attributable toradiation and to other causes) is of the order of 700 (95% UI: 500–1,200) up to the end of 2005, whereas in fact 1,700 cases havebeen diagnosed through the end of 2002.6 The reasons for the dis-crepancies between the predicted and observed number of thyroidcancer cases include instability in baseline thyroid cancer rates inyoung people,53 a possible acceleration of the incidence of thyroidtumors that would otherwise have been diagnosed later because ofthe promoting effect of iodine deficiency in the more heavilyexposed areas of Belarus, the Russian Federation and Ukraine3
and widespread thyroid screening in the affected countries.1 Pre-dictions of the number of cancer deaths in the most contaminatedareas of Belarus, the Russian Federation and Ukraine (8,200 – notshown) are similar to those published previously.20
Further follow-up of the most exposed populations in Belarus,the Russian Federation and Ukraine, and careful analytical studiesof specific outcomes, in particular breast cancer in the most conta-minated areas, will provide important information for assessingthe adequacy of risk models developed from other populationsexposed to radiation in other settings for the evaluation of cancerburden from Chernobyl in the future.
Acknowledgements
We thank representatives of the cancer registries of Belarus, Lat-via, Lithuania and Ukraine who provided data specifically for use inthe present analysis, the dosimetrists (Drs. I. Mal�atov�a, T. Ilus, T.Nedveckaite, V. Filistovic, G. Bruk, I. Zvonova, H. V€olkle, I. Likh-tarev, L. Kovgan, N. Chobanova) who provided detailed informa-tion used in the dose reconstruction reported here, Dr. J. Borehamfor providing the data for analysis of the mortality trends, Mr. T.Boulet for assistance in the production of the maps and Dr. J. Boice,Jr., for helpful suggestions on a previous version of the manuscript.Dr. D. Krewski is the NSERC/SSHRC/McLaughlin Chair in Popu-lation Health Risk Assessment at the University of Ottawa. Dr. S.Darby is supported by Cancer Research UK.
References
1. United Nations Scientific Committee on the Effects of Atomic Radia-tion (UNSCEAR). Sources and effects of ionizing radiation—VolumeII, Effects. New York: United Nations, 2000.
2. United Nations Scientific Committee on the Effects of Atomic Radia-tion (UNSCEAR). Sources and effects of ionizing radiation. NewYork: United Nations, 1993.
3. Cardis E, Kesminiene A, Ivanov V, Malakhova I, Shibata Y, Khrouch V,Drozdovitch V, Maceika E, Zvonova I, Vlassov O, Bouville A,Goulko G, et al. Risk of thyroid cancer after exposure to 131I in child-hood. J Natl Cancer Inst 2005;97:724–32.
4. Davis S, Stepanenko V, Rivkind N, Kopecky KJ, Voilleque P,Shakhtarin V, Parshkov E, Kulikov S, Lushnikov E, Abrosimov A,Troshin V, Romanova G, et al. Risk of thyroid cancer in the Bryansk
oblast of the Russian Federation after the Chernobyl power stationaccident. Radiat Res 2004;162:241–8.
5. Jacob P, Bogdanova TI, Buglova E, Chepurniy M, Demidchik Y, GavrilinY, Kenigsberg J, Meckbach R, Schotola C, Shinkarev S, Tronko MD,Ulanovsky A, et al. Thyroid cancer risk in areas of Ukraine and Belarusaffected by the Chernobyl accident. Radiat Res 2006;165:1–8.
6. UN Chernobyl Forum Expert Group Health (EGH). Health effects ofthe Chernobyl accident and special health care programmes. Geneva,Switzerland: World Health Organization, 2006.
7. Cardis E, Howe G, Ron E, Bebeshko VG, Bogdanova T, Bouville A,Carr Z, Chumak V, Davis S, Demidchik Y, Drozdovitch V, Gentner N,et al. Cancer consequences of the Chernobyl accident: 20 years after.J Radiol Prot 2006;26:(doi: 10.1088/0952-4746/26/2/001).
1234 CARDIS ET AL.
8. Parkin DM, Cardis E, Masuyer E, Friedl HP, Hansluwka H, Bobev D,Ivanov E, Sinnaeve J, Augustin J, Plesko I, Storm HH, Rahu M, et al.Childhood leukaemia following the Chernobyl accident: the EuropeanChildhood Leukaemia-Lymphoma Incidence Study (ECLIS). Eur JCancer 1993;29A:87–95.
9. Parkin DM, Clayton D, Black RJ, Masuyer E, Friedl HP, Ivanov E,Sinnaeve J, Tzvetansky CG, Geryk E, Storm HH, Rahu M, Pukkala E,et al. Childhood leukaemia in Europe after Chernobyl: 5 year follow-up. Br J Cancer 1996;73:1006–12.
10. Ivanov V. Health status and follow-up of liquidators in Russia. In:Karaoglou A, Desmet G, Kelly GN, Menzel HG. First InternationalConference of the European Commission, Belarus, the Russian Feder-ation and the Ukraine on the Radiological Consequences of the Cher-nobyl Accident (Minsk, Belarus, 18–22 March 1996); EUR 16544EN. Brussels, Belgium: European Commission, 1996. p.861–70.
11. Ivanov VK, Tsyb AF. Medical radiological effects of the Chernobylcatastrophe on the population of Russia: Estimation of radiation risks.Moscow: Meditsina, 2002.
12. Ivanov VK, Gorski AI, Tsyb AF, Khait SE. Post-Chernobyl leukemiaand thyroid cancer incidence in children and adolescents in Bryanskregion: an evaluation of risks. Voprosy Onkologii 2003;49:445–9.
13. Buzunov VN, Omelyanetz N, Strapko N, Ledoschick B, Krasnikova L,Kartushin G. Chernobyl NPP accident consequences cleaning up partic-ipants in Ukraine— health status epidemiologic study—main results.In: Karaoglou A, Desmet G, Kelly GN, Menzel HG. First InternationalConference of the European Commission, Belarus, the Russian Federa-tion and the Ukraine on the Radiological Consequences of the Cher-nobyl Accident. EUR 16544 EN (Minsk, Belarus, 18–22 March 1996).Brussels, Belgium: European Commission; 1996. p. 871–8.
14. Rahu M, Tekkel M, Veidebaum T, Pukkala E, Hakulinen T, Auvinen A,Rytomaa T, Inskip PD, Boice JD, Jr. The Estonian study of Chernobylcleanup workers: II. Incidence of cancer and mortality. Radiat Res1997;147:653–7.
15. Ivanov EP, Tolochko GV, Shuvaeva LP, Ivanov VE, Iaroshevich RF,Becker S, Nekolla E, Kellerer AM. Infant leukemia in Belarus afterthe Chernobyl accident. Radiat Environ Biophys 1998;37:53–5.
16. Davis S, Day RW, Kopecky KJ, Mahoney MC, McCarthy PL,Michalek AM, Moysich KB, Onstad LE, Stepanenko VF, Voilleque PG,Chegerova T, Falkner K, et al. Childhood leukaemia in Belarus, Russia,and Ukraine following the Chernobyl power station accident: results froman international collaborative population-based case-control study. IntJ Epidemiol 2005;3 [Epub ahead of print].
17. Prisyazhniuk A, Gristchenko V, Zakordonets V, Fouzik N, Slipeniuk Y,Ryzhak I. The time trends of cancer incidence in the most contaminatedregions of the Ukraine before and after the Chernobyl accident. RadiatEnviron Biophys 1995;34:3–6.
18. Ivanov VK, Tsyb AF, Gorski AI, Maksyutov MA, Khait SE, Preston D,Shibata Y. Elevated leukemia rates in Chernobyl accident liquidators[electronic letter]. Br Med J 2003; http://bmj.com/cgi/eletters/319/7203/145/a#31231.
19. Pukkala E, Kesminiene A, Polyakov S, Ryzhov A, Drozdovitch V,Kovgan LN, Kyyronen P, Malakhova I, Gulak L, Cardis E. Breastcancer in Belarus and Ukraine after the Chernobyl accident. Int J Can-cer 2006; www3.interscience.wiley.com, doi: 10.1002/ijc.21885 [Epubahead of print].
20. Cardis E, Anspaugh L, Ivanov VK, Likhtarev IA, Mabuchi K,Okeanov AE, Prisyazhniuk AE. Estimated long term health effects ofthe Chernobyl accident. In: One decade after Chernobyl. Summing upthe consequences of the accident. Proceedings of the EU/IAEA/WHOInternational Conference. Vienna: International Atomic Energy Agency,1996. p. 241–79.
21. United Nations Scientific Committee on the Effects of Atomic Radiation(UNSCEAR). Sources and Effects of Ionizing Radiation. New York:United Nations, 1988.
22. European Communities (EC). Atlas on Cs137 deposition on Europeafter the Chernobyl accident. Luxembourg: Office for Official Publi-cations of the European Communities, 1998.
23. International Commission on Radiological Protection (ICRP). Age-dependent doses to members of the public from intakes of radionu-clides: Part 1—Ingestion dose coefficients. ICRP Publication 56.Oxford, UK: Pergamon Press, 1990.
24. International Commission on Radiological Protection (ICRP). Age-dependent doses to members of the public from intakes of radionu-clides: Part 2—Ingestion dose coefficients. ICRP Publication 67.Oxford, UK: Pergamon Press, 1993.
25. International Commission on Radiological Protection (ICRP). Age-dependent doses to members of the public from intakes of radionu-clides: Part 3—Ingestion dose coefficients. ICRP Publication 69.Oxford, UK: Pergamon Press, 1995.
26. International Commission on Radiological Protection (ICRP). Age-dependent doses to members of the public from intakes of radionu-clides: Part 4—Inhalation dose coefficients. ICRP Publication 71.Oxford: Pergamon Press, 1995.
27. International Commission on Radiological Protection ICRP. Con-version coefficients for use in radiological protection against exter-nal radiation. ICRP Publication 74. Oxford, UK: Pergamon Press, 1996.
28. Eckerman KF, Ryman JC. External exposures to radionuclides in air,water and soil. Federal Guidance Report 12. Washington, DC: EPA,1993.
29. United Nations (UN). Environmental consequences of the Chernobylaccident and their remediation: Twenty years of experience. IAEAReport of the UN Chernobyl Forum expert group ‘‘Environmental’’(EGE). Vienna, Austria: IAEA, 2005.
30. Muck K. Longterm reduction of caesium concentration in milk afternuclear fallout. Sci Total Environ 1995;162:63–73.
31. Schwaiger M, Mueck K, Benesch T, Feichtinger J, Hrnecek E, Lovra-nich E. Investigation of food contamination since the Chernobyl fall-out in Austria. Appl Radiat Isot 2004;61:357–60.
32. Uyttenhove J, Pomme S, Van Waeyenberge B, Hardeman F, BuysseJ, Culot JP. Survey of the 137Cs contamination in Belgium by in situgamma spectrometry, a decade after the Chernobyl accident. HealthPhys 1997;73:644–6.
33. Lokobauer N, Franiæ Z, Bauman A, Maraeiæ M, Cesar D, Senear J.Radiation contamination after the Chernobyl accident and theeffective dose received by the population of Croatia. J Environ Radio-activity 1998;41:137–46.
34. Realo E, J€ogi J, Koch R, Realo K. Studies on radiocaesiums in Esto-nian soils. J Environ Radioactivity 1995;29:111–9.
35. Kritidis P, Florou H. Radiological impact in Greece of the Chernobylaccident—a 10-y retrospective synopsis. Health Phys 2001;80:440–6.
36. Nedveckaite T, Filistovic V, Mastauskas A, Thiessen K. Thyroid do-simetry in the western trace of the Chernobyl accident plume. RadiatProt Dosimetry 2004;108:133–41.
37. Pietrzak-Flis Z, Krajewski P, Radwan I, Muramatsu Y. Retrospectiveevaluation of 1311deposition density and thyroid dose in Poland afterthe Chernobyl accident. Health Phys 2003;84:698–708.
38. Krstic D, Nikezic D, Stevanovic N, Jelic M. Vertical profile of 137Csin soil. Appl Radiat Isot 2004;61:1487–92.
39. US National Research Council. Health risks from exposure to low lev-els of ionizing radiation. BEIR, VII Report, phase II. Washington,DC: National Academy of Science, 2005.
40. Preston DL, Mattsson A, Holmberg E, Shore R, Hildreth NG, Boice JD, Jr.Radiation effects on breast cancer risk: a pooled analysis of eightcohorts. Radiat Res 2002;158:220–35.
41. Ron E, Lubin JH, Shore RE, Mabuchi K, Modan B, Pottern LM,Schneider AB, Tucker MA, Boice JD, Jr. Thyroid cancer after expo-sure to external radiation: a pooled analysis of seven studies. RadiatRes 1995;141:259–77.
42. Breslow NE. Extra-Poisson variation in log-linear models. Appl Stat1984;33:38–44.
43. Segi M. Cancer mortality for selected sites in 24 countries (1950–57).Sendai, Japan: Tohoku University of Medicine, 1960.
44. Peto R, Lopez AD, Boreham J, Thun M, Health CJ. Mortality fromsmoking in developed countries 1950–2000: Indirect estimates fromnational vital statistics. Oxford, UK: Oxford University Press, 1994.
45. Peto R, Lopez AD, Boreham J, Thun M, Heath C, Jr. Mortality fromtobacco in developed countries: indirect estimation from national vitalstatistics. Lancet 1992;339:1268–78.
46. Doll R, Peto R. The causes of cancer: quantitative estimates of avoid-able risks of cancer in the United States today. J Natl Cancer Inst1981;66:1191–308.
47. Preston DL, Shimizu Y, Pierce DA, Suyama A, Mabuchi K. Studies ofmortality of atomic bomb survivors. Report 13: Solid cancer and non-cancer disease mortality: 1950–1997. Radiat Res 2003;160:381–407.
48. Scheffe H. A method for judging all contrasts in the analysis of var-iance. Biometrika 1953;40:87–104.
49. Peto R, Lopez AD, Boreham J, Thun M. Mortality from smoking indeveloped countries 1950–2000. The MRC/Cancer Research UK/BHF Clinical Trial Service Unit & Epidemiological Studies Unit(CTSU). 2005. http://www.ctsu.ox.ac.uk/~tobacco/
50. Steliarova-Foucher E, Stiller C, Kaatsch P, Berrino F, Coebergh JW,Lacour B, Parkin M. Geographical patterns and time trends of cancerincidence and survival among children and adolescents in Europesince the 1970s (the ACCIS project): an epidemiological study. Lan-cet 2004;364:2097–105.
51. Winkelmann RA, Okeanov A, Gulak L, Remennik L, Rahu M, StormHH. Cancer registration techniques in the new independent states ofthe former Soviet Union. IARC Scientific Publication 35. Lyon,France: IARC Press, 1998.
52. Percy C, Muir C. The International Comparability of Cancer MortalityData—results of an international death certificate study. Am J Epide-miol 1989;129:934–46.
53. Parkin DM, Whelan SL, Ferlay J, Teppo L, Thomas DB. Cancer inci-dence in five continents. Vol.VIII.International Agency for Researchon Cancer IARC Scientific Publication 155. Lyon, France: IARCPress, 2002.
1235CANCER BURDEN IN EUROPE FROM CHERNOBYL