Embed Size (px)
Citation preview

Statistics II
COMPUTER LAB 1:CONFIDENCE INTERVALS
ANDHYPOTHESIS TESTING
IN ONE AND TWO POPULATIONS

Objectives
During this computer lab we will perform descriptive and inferentialstatistics on the Spanish electricity market data.In particular we will:
I Compute the summary statistics
I Construct confidence intervals
I Perform tests of hypothesis
Data
Our data set:
I Corresponds to the daily average energy prices of the Spanishelectricity market
I Covers the months of June and July of 2012
I Can be downloaded from ’DataElecMarket12.xlsx’, available on thecourse website (go to Computer lab page) or from the sourcewebsite (see the next two slides)
Downloading the data (i)
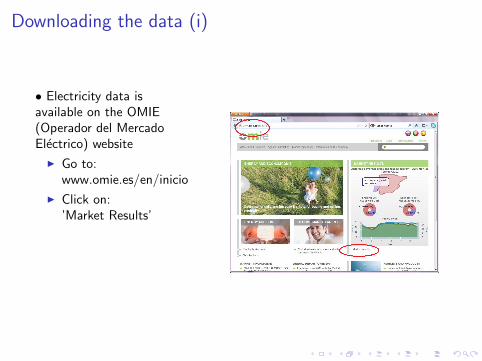
• Electricity data isavailable on the OMIE(Operador del MercadoElectrico) website
I Go to:www.omie.es/en/inicio
I Click on:’Market Results’
Downloading the data(ii)
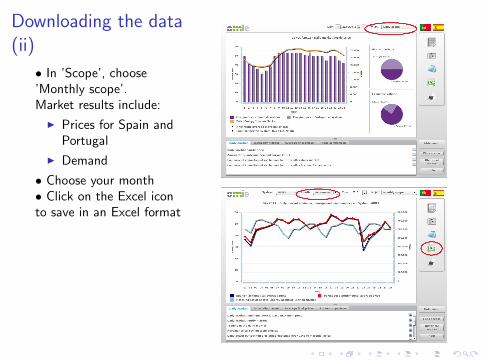
• In ’Scope’, choose’Monthly scope’.Market results include:
I Prices for Spain andPortugal
I Demand
• Choose your month• Click on the Excel iconto save in an Excel format
Changing the language from Spanish to English for themenus in Excel
• If you are running Excel from one of the University machines, it is likelythat its menus are in Spanish. To change the language go to:
I ’File’
I ’Options’
I ’Language’ (change the language from Spanish to English)
I Restart Excel
Note: When using Excel’s functions, you may need to use ”,” instead of”.” and ”;” instead of ”,”.
Data Analysis
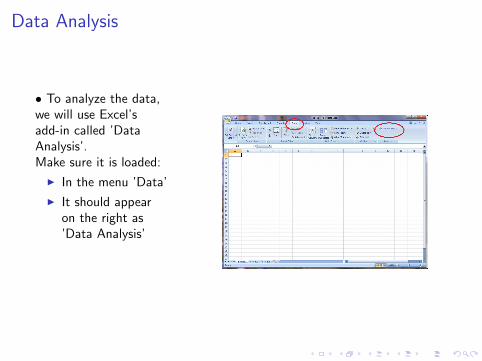
• To analyze the data,we will use Excel’sadd-in called ’DataAnalysis’.Make sure it is loaded:
I In the menu ’Data’
I It should appearon the right as’Data Analysis’
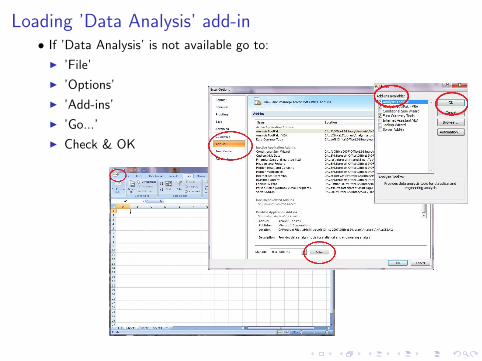
Loading ’Data Analysis’ add-in• If ’Data Analysis’ is not available go to:
I ’File’
I ’Options’
I ’Add-ins’
I ’Go...’
I Check & OK
Summarizing the data
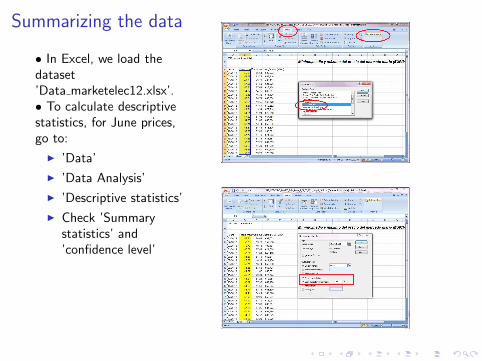
• In Excel, we load thedataset’Data marketelec12.xlsx’.• To calculate descriptivestatistics, for June prices,go to:
I ’Data’
I ’Data Analysis’
I ’Descriptive statistics’
I Check ’Summarystatistics’ and’confidence level’
Confidence intervalsfor the population mean
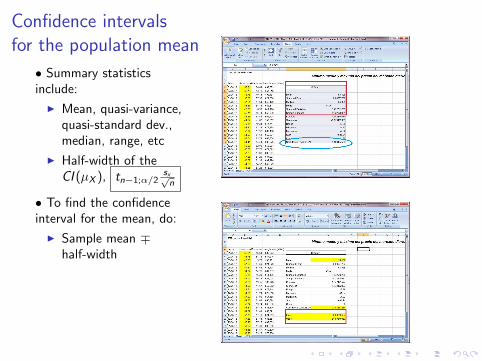
• Summary statisticsinclude:
I Mean, quasi-variance,quasi-standard dev.,median, range, etc
I Half-width of theCI (µX ), tn−1;α/2
sx√n
• To find the confidenceinterval for the mean, do:
I Sample mean ∓half-width
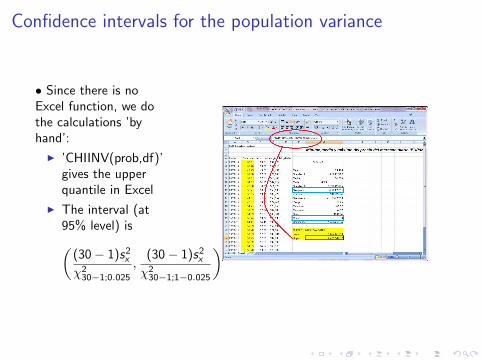
Confidence intervals for the population variance
• Since there is noExcel function, we dothe calculations ’byhand’:
I ’CHIINV(prob,df)’gives the upperquantile in Excel
I The interval (at95% level) is(
(30− 1)s2x
χ230−1;0.025
,(30− 1)s2
x
χ230−1;1−0.025
)
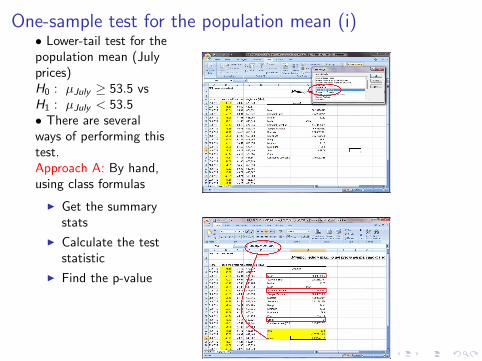
One-sample test for the population mean (i)• Lower-tail test for thepopulation mean (Julyprices)H0 : µJuly ≥ 53.5 vsH1 : µJuly < 53.5• There are severalways of performing thistest.Approach A: By hand,using class formulas
I Get the summarystats
I Calculate the teststatistic
I Find the p-value
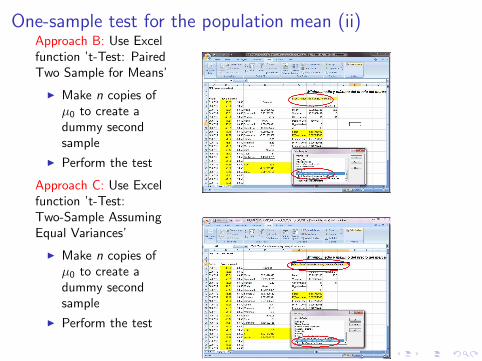
One-sample test for the population mean (ii)Approach B: Use Excelfunction ’t-Test: PairedTwo Sample for Means’
I Make n copies ofµ0 to create adummy secondsample
I Perform the test
Approach C: Use Excelfunction ’t-Test:Two-Sample AssumingEqual Variances’
I Make n copies ofµ0 to create adummy secondsample
I Perform the test
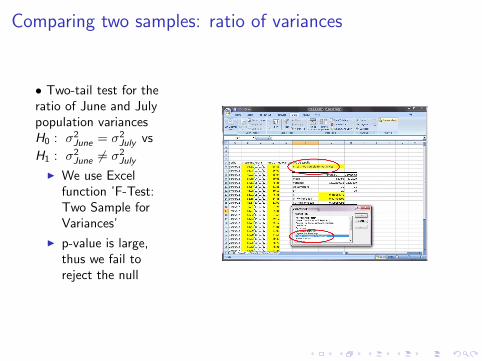
Comparing two samples: ratio of variances
• Two-tail test for theratio of June and Julypopulation variancesH0 : σ2
June = σ2July vs
H1 : σ2June 6= σ2
July
I We use Excelfunction ’F-Test:Two Sample forVariances’
I p-value is large,thus we fail toreject the null
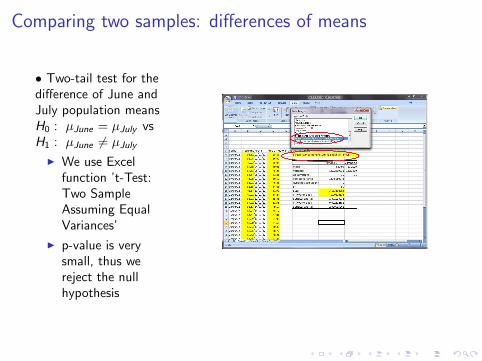
Comparing two samples: differences of means
• Two-tail test for thedifference of June andJuly population meansH0 : µJune = µJuly vsH1 : µJune 6= µJuly
I We use Excelfunction ’t-Test:Two SampleAssuming EqualVariances’
I p-value is verysmall, thus wereject the nullhypothesis
Additional exercises (i)
Complete the previous exercises by adding the following parts:
1. State the conclusions
2. Find the confidence intervals (mean and variance) for the July prices
3. Perform a two-sided test for the mean July price
4. Test if, the average price for June is less or equal to the averageprice for July
Additional exercises (ii)
5. Test if the average price for the week-days is significantly differentfrom the average price for the week-ends
6. Repeat the entire set of exercises by replacing June and July withAugust and September


