Embed Size (px)
Citation preview

S T U D Y G U I D E
www.ib.academy
SLE N V I R O N M E N TA L S Y S T E M S A N D S O C I E T I E S

IB AcademyEnvironmental systems and societies
Study GuideAvailable on learn.ib.academy
Author: Laurence Gibbons
Design Typesetting
This work may be shared digitally and in printed form,but it may not be changed and then redistributed in any form.
Copyright © 2020, IB AcademyVersion: ESS.2.1.200320
This work is published under the Creative CommonsBY-NC-ND 4.0 International License. To view a copy of thislicense, visit creativecommons.org/licenses/by-nc-nd/4.0
This work may not used for commercial purposes other than by IB Academy, orparties directly licenced by IB Academy. If you acquired this guide by paying forit, or if you have received this guide as part of a paid service or product, directlyor indirectly, we kindly ask that you contact us immediately.
Laan van Puntenburg 2a3511ER, UtrechtThe Netherlands
[email protected]+31 (0) 30 4300 430

0
Welcome to the IB Academy guide book for IB Environmental Systems and SocietyStandard Level.
This guide contains all the theory you should know for your final exam. To achieve topmarks this theory should be complimented with case studies. Although not covered inthis booklet, we provide some in our online podcast series.
The guide starts with an explanation of systems and models which are the foundationsfor the whole course. We will then look at systems in the natural world before turningour attention to humans and their impact. Throughout the guide there are helpful hintsfrom the former IB students who now teach with IB Academy.
Our IB Environmental Systems and Society Standard Level revision course builds on thisguide with interactive lectures, exam-style exercise and effective feedback; helping to putthe theory into practice and helping you achieve your best possible result.
For more information and details on our revision courses, be sure to visit our websiteat ib.academy.
We hope that you find this guide helpful.
IB.Academy Team
3


TABLE OF CONTENTS
1. Systems and models 7– Components of systems – Types of systems – Energywithin systems
2. Systems in the natural world 11– Flows of energy and matter – Biomes – Ecosystems– Species – Biodiversity within systems
3. Investigating ecosystems
(experimental methods)
29
– General data collection rules – Measuring abiotic factors– Measuring biotic factors – Collecting organisms– Identifying organisms – Species abundance (Lincoln index)– Species diversity (Simpson index) – Productivity andbiomass – Estimating biomass and productivity
4. Systems in the human world 39– Human population dynamics – Human resource use– Pollution
5. Humans and their effect on
the biotic world
47
– The value of biodiversity – Conservation of biodiversity
5

TABLE OF CONTENTS
6. Water, soil and food
production
55
– Water – Soil – Terrestrial food production – Managementstrategies
7. Energy and the atmosphere 67– Atmosphere – Energy production – Energy choice andsecurity
8. Climate change and
sustainability
75
– Climate change – Sustainability
6

1SYSTEMS AND MODELS
In this course we are examining the resources and flows of the world; large and small;natural and man-made. Often these interactions can be very complicated. By using asystems approach we simplify everything into a model. Although we may lose detailswith this simplification, often we achieve a better and more holistic overview.
1.1 Components of systems
storages
flows
boundary
Storages stores of matter or energy. Often shown as a box but can be other shapes. Thesize can be representative of the size of the storage.
Flows transfers or transformations between storages or outside of the model. Oftenshown as arrows with the direction indicating the direction of the flow. The sizecan be representative of the size of the flow.Inputs flows coming into a system or storageOutputs flows going out of a system or storage
Boundaries the dividing line between two systems (for example the atmosphere andground). Shown by a line through flows. These are not necessary but help withrepresenting the model.
7

SYSTEMS AND MODELS Types of systems
1.2 Types of systems
There are three types of systems:
Open system
Energy and matter can flow in and out of thesystems.Applies for most systems.
matter energy
Closed system
Only energy can flow in and out of the system.Most are artificially constructed, often forexperimental process, however the entire planetcan be thought of as a closed system.
energy
Isolated system
Nothing can flow in or out of the system.These systems are hypothetical but it is possible todescribe the entire universe as an isolated system.
1.3 Energy within systems
All flows of energy are governed by the laws of thermodynamics.
1. Conservation of energy: Energy in an isolated system, can be transformed butcannot be created or destroyed.
2. Entropy, the amount of disorder in a system, increases over time. In other words,energy in a system will try dissipate itself to a lower energy level. This is why thereis a decrease in the available energy as we move along a food chain.
Due to these laws, systems will normally exist in a stable equilibrium (there is a tendencyfor it to return to the previous equilibrium following disturbance). Note this does notmean that the systems is static, just that it is balanced. A steady-state equilibrium is thecondition of an open system in which there are no changes over the longer term, but inwhich there may be oscillations in the very short term.
8

SYSTEMS AND MODELS Energy within systems 1
When a change in energy or matter occurs in the systems, the system will respond in oneof two ways: either
1. a negative feedback loop will stabilise the system, by increasing a flow thatcounteracts the change (or)
2. a positive feedback loop which amplifies the change and so destabilises the system;the system will continue to destabilise until it reaches a tipping point where a newequilibrium is created.
A tipping point is the minimum amount of change within a system that will destabilizeit, causing it to reach a new equilibrium or stable state.
A resilient system is one that tends to maintain its stability. Often larger and morediverse storages improve stability, absorbing the changes. Humans can affect this byreducing these two factors. However it is sometimes hard to identify changes in systemsand predict tipping points as there is often a time delay with feedback loops.
9

2SYSTEMS IN THE NATURAL
WORLD
We can model the earth as a single system but, as mentioned in the first chapter, this canbe an over-simplification. As we want to investigate more complex interactions we findthat earth is a system of systems. We can divide planet earth into Biomes, which arethemselves collections of ecosystems; and within each ecosystems are smallercommunities of interactions between the environment and the species that inhabit it. Inthe following chapter we will examine systems at all of these scales. But first we will lookat the flows of energy and matter that are the building blocks for life as we know it.
2.1 Flows of energy and matter
2.1.1 Solar (energy)
The sun provides the earth with an average 1400 watts per square meter. This energycomes into the earth as short wave radiation and is reradiated out as long wave radiationthat can be trapped in the atmosphere. Known as the greenhouse effect, this naturalphenomenon is necessary in maintaining suitable temperatures for living systems. A lotof the sun’s energy is unavailable for ecosystems as this energy is absorbed by inorganicmatter or reflected back into the atmosphere. Pathways of radiation through theatmosphere involve a loss of radiation through reflection and absorption.
latent heat 78
107reflected solar energy
342solar energy
235infrared energy
77
reflected byclouds, aerosol andatmospheric gases
40
greenhouse gases
30
reflected bysurface
67
absorbed byatmosphere
168absorbed by surface
24thermals
78evapotranspiration
350
390surface radiation 235
absorbed by surface
emitted byatmosphere 165
emitted byclouds 30
40 235back radiation
11

SYSTEMS IN THE NATURAL WORLD Flows of energy and matter
In fact plants convert (through photosynthesis) only 0.06% of that energy in to useablechemical energy. As this useable energy is passed up the food chain, energy is lost as heatre-radiated to the atmosphere from every tropic level. The amount of energy available tothe next trophic level is found by the ecological efficiency (energy used for new biomass/ energy supplied). This averages 10%. Eventually all the energy will become heat.
producers herbivores carnivorestop
carnivores
decomposers
solarinsolation
heat heat heat heat
heat
Furthermore solar energy is not evenly distributed across the earth’s surface. Higherlatitudes receive less due to their shallow angle towards the sun. This also variesseasonally. Due to the laws of thermodynamics, the excess energy at the equator wants tomove to areas of lower energy north and south. This energy is transported in the air (andwater vapour) and causes the global winds and weather. The main movement can berepresented by the tricellular model shown below; however in reality the air movementis much more complex due to jet streams and the Coriolis effect.
Hadley cell
Hadley cell
Ferrel cell
Ferrel cell
Polar cell
Polar cell
hot air rise from theequator creating lowpressure at the surface
air cools and sinks,creating high pressureat the surface
warm air travels towardscold poles
high pressure air travelstowards areas of lowpressure
+STJ
+PFJ
+PFJ
+STJ
−
−
−
−
ITCZ
Polarfront
Polarfront
12
SYSTEMS IN THE NATURAL WORLD Flows of energy and matter 2
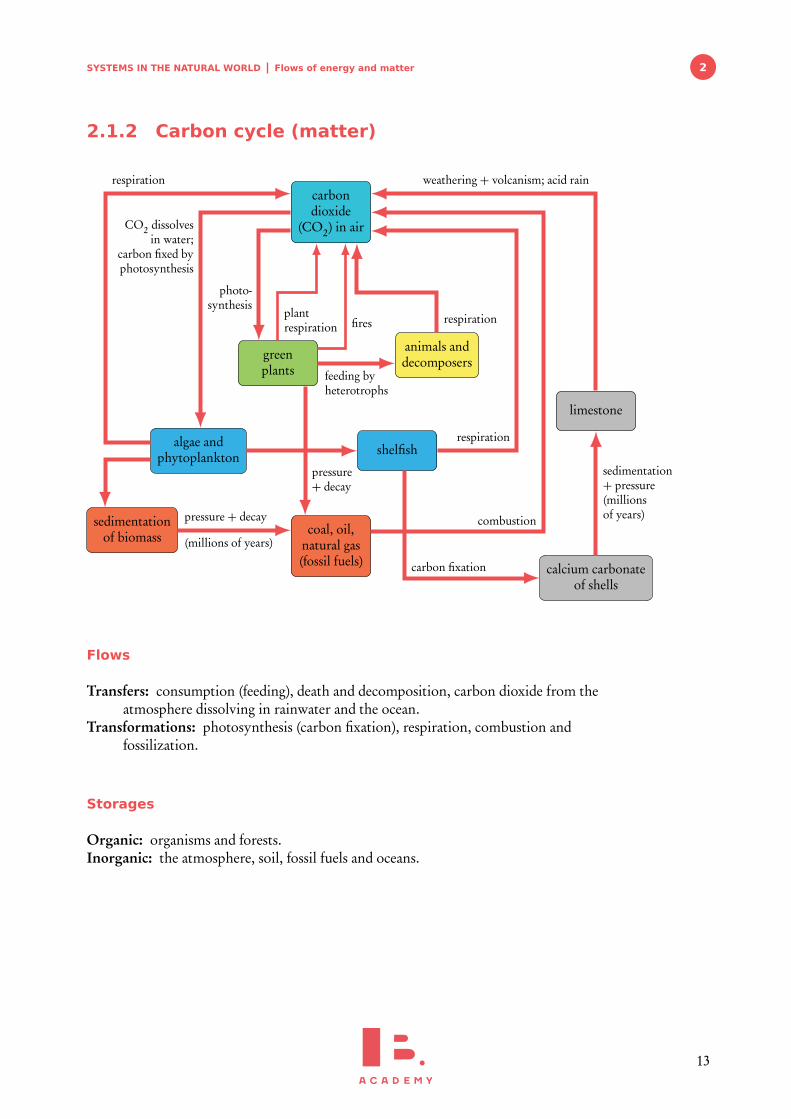
2.1.2 Carbon cycle (matter)
carbondioxide
(CO2) in air
greenplants
animals anddecomposers
limestone
algae andphytoplankton shelfish
sedimentationof biomass coal, oil,
natural gas(fossil fuels) calcium carbonate
of shells
respiration
pressure + decay
(millions of years)
carbon fixation
sedimentation+ pressure(millionsof years)
weathering + volcanism; acid rain
respiration
combustion
CO2 dissolvesin water;
carbon fixed byphotosynthesis
feeding byheterotrophs
pressure+ decay
photo-synthesis
plantrespiration fires respiration
Flows
Transfers: consumption (feeding), death and decomposition, carbon dioxide from theatmosphere dissolving in rainwater and the ocean.
Transformations: photosynthesis (carbon fixation), respiration, combustion andfossilization.
Storages
Organic: organisms and forests.Inorganic: the atmosphere, soil, fossil fuels and oceans.
13

SYSTEMS IN THE NATURAL WORLD Flows of energy and matter
2.1.3 Nitrogen cycle (matter)
nitrogen inatmosphere
nitratesplant andmicrobialprotein
animalprotein
nitrites
ammonia,ammoniumcompounds
dead organics matterand faeces
nitrifying bacteria
nitrifying bacteria
decays by saprotrophicbacteria and fungi
absorbed byplant roots feeding
deathdeath anddefecation
denitrifying bacteria
symbolic nitrogen-fixingbacteria (e.g., Rhizobium)
free-living nitrogen-fixingbacteria (e.g., Azotobacter)
Flows
Transfers: absorption, consumption (feeding), death and decomposition.Transformations: nitrogen fixation by bacteria and lightning, and denitrification by
bacteria in water-logged soils; assimilation.
Storages
Organic: organisms.Inorganic: the atmosphere, soil, fossil fuels and water bodies.
All these systems have been affected by human activities, such as burning fossil fuels,deforestation, urbanization and agriculture. We will examine these more closely inchapter 5.
14

SYSTEMS IN THE NATURAL WORLD Biomes 2
2.2 BiomesBiomes are defined by their climatic condition resulting from the insolation (amount ofsolar radiation that reaches the earth’s surface), precipitation and temperature theyreceive. There are five major classes, in which there are subclasses. You can see how theyare arranged in rough bands across the earth. This can be explained by the variation ofsolar energy received and the tricellular model of atmospheric circulation. The pattern iscomplicated by local differences due to altitude, ocean currents and winds.
Forest
Tropical forest
Temperate deciduous forest
Coniferous forest (boreal)
Grassland
Savanna (tropical grassland)
Temperate grassland
Chaparral (Mediterranean)
Tundra
Tundra• arctic• alpine
Desert
Hot desert
Cold desert(similar to tundra but with lesswater availability)
Aquatic
Freshwater• swamps• lakes• ponds• streams• rivers• bogs
Marine• rock shore• mud flats• coral reef• mangrove swamp• continental shelf• deep ocean (Any
water beyondthe continentalshelf; includeshydrothermal vents)
−10 0 10 20 30
400
300
200
100
Average annual temperature (°C)
Ann
ualp
reci
pita
tion
(cm
)
15

SYSTEMS IN THE NATURAL WORLD Biomes
The table compares some of these biomes.
BiomeArea
(106 km2)Solar
radiation(W/m2 year)
Annualprecipitation
(mm)
Net PrimaryProductivity(g/m2 year)
Total plantbiomass(milliontonnes)
Total animalbiomass(milliontonnes)
Meanbiomass(kg/m2)
Tropical rainforests17 175 2000–5000 2200
(40% ofterrestrial
ecosystems)
765000 330 45
Location and climate: Within 25° north and south of the equator. Warm and wet with little seasonal variation.Structure: Large species diversity in many niches. Tall emergent trees, canopy, understory of smaller trees, shrublayer. Nutrients are predominantly in the top-soil. Without the support of tree roots, these nutrients are quicklywashed away.
Temperate forests12 125
(greaterseasonal
variation)
600–2500 1200 385000 160 32.5
Location and climate: Between 40°–60° north and south of the equator. Mild climate.Structure: Deciduous forests, often dominated by one species of tree. Below the trees is either a shrub layer orforest floor. Rich soils fed by the rapid breaking down of leaf litter.
Boreal forests (Taiga)17 200-750 300–500 800 240000 57 20
Tropical grasslands (savanna)15 225 500–1300 900 60000 220 4
Location and climate: Mostly located in Africa (below Sahara), Brazil and northern Australia. Warm withseasonal rainfall and fires.Structure: Ample vegetation supports the largest terrestrial mammals (elephants, giraffes) and large herds ofmigrating herbivores (wildebeest, zebra). These intern support large predators (lions, cheetahs).
16

SYSTEMS IN THE NATURAL WORLD Biomes 2
Temperate grasslands9 150 250–1000
(too low forforest to
form)
600 14000 60 1.6
Location and climate: In centres of continents, between 40°–60°Structure: Large range of grasses supporting large numbers of herbivore and so carnivores. Food webs andecosystems are simple.
Arctic tundra and alpine8 90 (high
variation)<250 140 5000 3.5 0.6
Location and climate: Tundra is found just south of the arctic ice cap. Alpine on high mountain tops. Cold withhigh winds.Structure: Permafrost prevents the growth of vegetation in the winter. In summer Low growing grasses, shrubsand mosses support a variety of small hibernating mammals. Simply ecosystems with slow rates of growth anddecomposition. Possibly the most fragile biome and so the first to be effected by climate change.
Desert24 up to 300 <250 90 500 0.02 0.02
Location and climate: 30° north and south of the equator.Structure: Supports a small number of well adapted plant and animal (mainly reptile) species Water storage andcollection are prime features.
Deep oceans352 Varies –
None below1000 m
n/a 20–300 1000000+ 800–2000 Very low
Location and climate: 65% of Earth’s surface. Averaging 3.5 miles deepStructure: 0 m–200 m: phytoplankton, cyanobacteria and algae photosynthesis the available sunlight, supporting arange of zooplankton, fish and invertebrates.200 m–1000 m: Larger generally carnivorous fish adapted to lower levels of light and higher pressures.1000–bottom: Animals adapted to zero light and high pressure. Some create their own light throughbioluminescence to attract prey or avoid predators.Bottom: Slow moving scavengers, survive on dead organic matter from above.Hydrothermal vents: volcanic heat and sulphur support a wide range of organisms.
Coral reefs0.28 Varies, ideal
watertemperature26 °C–27 °C
n/a 2000 0.3
Location and climate: Shallow, warm equatorial watersStructure: “Rainforests of the ocean” – complex structure with high species number and diversity. Polyps createthe skeleton of the reef. This provides a good holding for many sea plants and therefore a rich environment forfish.
17
SYSTEMS IN THE NATURAL WORLD Ecosystems
2.3 Ecosystems
Biomes are composed of multiple ecosystems. An ecosystem is a community and thephysical environment with which it interacts, linked together by energy and matterflows. A community is a group of populations living and interacting with each other ina common habitat.
Ecosystems can be divided into three types:
1. Marine ecosystems: the sea, estuaries, salt marshes, and mangroves. Marineecosystems all have a high concentration of salt in the water.
2. Freshwater ecosystems: rivers, lakes, and wetlands.3. Terrestrial ecosystems: all land-based ecosystems.
2.3.1 Zonation
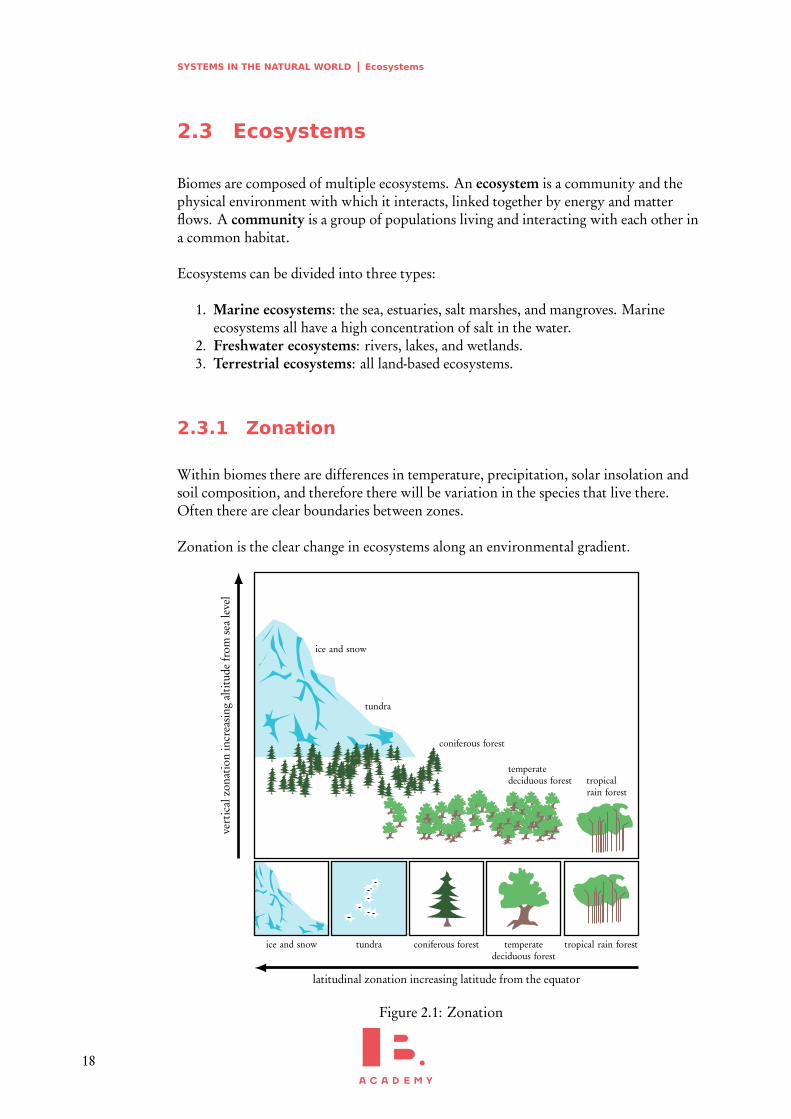
Within biomes there are differences in temperature, precipitation, solar insolation andsoil composition, and therefore there will be variation in the species that live there.Often there are clear boundaries between zones.
Zonation is the clear change in ecosystems along an environmental gradient.
ice and snow
tundra
coniferous forest
temperatedeciduous forest tropical
rain forest
ice and snow tundra coniferous forest temperatedeciduous forest
tropical rain forest
latitudinal zonation increasing latitude from the equator
vert
ical
zona
tion
incr
easi
ngal
titud
efr
omse
ale
vel
Figure 2.1: Zonation
18

SYSTEMS IN THE NATURAL WORLD Ecosystems 2
low-tide zone
splash zone
high-tide zone
mid-tide zone
lichens and periwinkles
barnacles
mussels
pink paint
red seaweedsrock pool
brown seaweeds (kelp)
Figure 2.2: Zonation
2.3.2 Succession
Succession is the change of an ecosystem over time and is most clearly seen when anenvironment is low in species diversity and population:
1. either new rock formed after volcanic eruptions – lithosere, disposition of drysoils/sands – xerosere or drying of river deltas – hydrosere (primary succession);
2. or areas where the community is destroyed due to fire, flood or human activity(secondary succession).
Succession may be arrested at a stage by abiotic or biotic limiting factors, resulting in asub-climax community. Humans may deliberately stop succession when NPP is highand crops are harvested or by deforestation, grazing with animals or controlledburning.This results in in a plagioclimax.
19

SYSTEMS IN THE NATURAL WORLD Ecosystems
Bare inorganicsurface
Stage 1colonization(pioneercommunity)
Stage 2establishment
Stage 3competition
Stage 4stabilization
Climaxcommunity(for thatenvironment)
– nutrient poor– water poor
Minerals fromoutsideHardy speciesable towithstand harshenvironmentsTypically r –selected species
– simple animalpioneers
– larger plants– some k-selected species– loss of somepioneer species
– latecolonisingspecies– complex foodwebs
– stableequilibrium
GPP increasing GPP increasingmore
GPP flattens GPP decreases Stable GPP
NPP increasing NPP high NPP decreasing NPP stabilizing NPPapproaches one
Disturbance (fire, flood, etc.) Secondary
Increasing soil depth and humus content
Increasing size of supported organisms
Increasing biodiversity
Increased mineral cycling and amount of minerals stored in the ecosystems
time
bare rock
pioneers
shrubs
small trees
Figure 2.3: In early stages of succession, gross primary productivity (GPP) is low due to theunfavourable initial conditions and low density of producers. The proportion of energylost through community respiration is relatively low too, so net primary productivity(NPP) is high-that is, the system is growing and biomass is accumulating. In later stagesof succession, with an increased consumer community, gross productivity may be highin a climax community. However, this is balanced by respiration, so net productivityapproaches 0 and the productivity-respiration (P:R) ratio approaches 1.
20

SYSTEMS IN THE NATURAL WORLD Ecosystems 2
r- and K- strategist species
These two reproductive strategies represent the extremes on a spectrum. r-strategists areideal pioneer species where as K-strategists require a more established environment.
r- strategist
• Examples: rabbits, weeds, bacteria• Short lifespan with high mortality in
early life• Rapid growth and early maturity• Many small offspring• Little parental care or protection• Highly adaptable• Can colonise new habitats quickly and
make use of short-lived resources
K- strategist
• Examples: elephants, people, whales• Long lifespan with mortality in later
stages• Slow growth and late maturity• Fewer large offspring• High parental care or protection• Specialists• Enables them to survive in long-term
climax communities
Time
Perc
enta
geof
orga
nism
ssur
vivi
ng
1
10
100
Type I (humans)
Type II (songbirds)
Type III (frogs)
Figure 2.4: Survivorship curves
21

SYSTEMS IN THE NATURAL WORLD Species
2.4 Species
2.4.1 Definitions
A species is a group of organisms that share common characteristics and that interbreedto produce fertile offspring.
A habitat is the environment in which a species normally lives.
A population is a group of organisms of the same species living in the same area at thesame time, and which are capable of interbreeding.
A community is a group of populations living in the same area at the same time.
The non-living, physical factors that influence the organisms and ecosystem-such astemperature, sunlight, pH, salinity, and precipitation are termed abiotic factors. Theinteractions between the organisms such as predation, herbivory, parasitism, mutualism,disease, and competition are termed biotic factors.
A niche describes the particular set of abiotic and biotic conditions and resources towhich an organism or population responds. The fundamental niche describes the fullrange of conditions and resources in which a species could survive and reproduce. Therealized niche describes the actual conditions and resources in which a species exists dueto biotic interactions.
Biotic interactions
One organism can interact with another organism in the following ways:
Predation One animal (or occasionally plant) hunts/eats another.Herbivory animal feeds on plantParasitism a symbiosis where an organism (the parasite) benefits at the expense of
another (the host)Mutualism a symbiosis where both organisms benefit from the relationship.Disease a organism (usually a virus, bacteria, or fungi) inhibits or kills another
organism.Competition where two organism are competing for a resource (or niche). The
organisms can be in the same species (intraspecific) or different species(interspecific).
22

SYSTEMS IN THE NATURAL WORLD Species 2
These interactions tend to be density dependent (dependent on the population densitiesof the species) and so help to control population density through a negative feedbackloop. For example, where two animals have a close predator – prey relationship (the preyis the predator’s main food source, and the predator is the prey’s main predator) theyregulate one another’s population as shown below.
prey increasesdue to small number of predators
predator increasesdue to more prey
prey decreasesdue to more predators
predator decreasesdue to less prey
2.4.2 Changes in species population
Populations change and respond to interactions with the environment. Interactionsshould be understood in terms of the influences each species has on the populationdynamics of others, and upon the carrying capacity of the others’ environment. S and Jpopulation curves describe a generalized response of populations to a particular set ofconditions (abiotic and biotic factors). Any system has a carrying capacity for a givenspecies. Limiting factors will slow population growth as it approaches the carryingcapacity of the system.
23

SYSTEMS IN THE NATURAL WORLD Species
S curve
S-curves start with exponential growth. No limiting factors affect the growth at first. However, above acertain population size, the growth rate slows down gradually, finally resulting in a population ofconstant size.
1. Lag phase – population numbers arelow and so birth rates are low.
2. Exponential growth phase –population grows at an increasinglyrapid rate unrestricted by limitingfactors.
3. Transitional phase – populationgrowth slows down considerably aslimiting factors are reached.
4. Stationary phase – populationgrowth stabilizes and then populationfluctuates around a level thatrepresents the carrying capacity.
time
popu
latio
nsi
ze
carryingcapacity (K)
1
2
3
4
J-curve
J-curves show exponential growth in a population past the carrying capacity. These are followed bysudden population collapses known as diebacks.
1. Exponential growth – populationgrows at an increasingly rapid rateunrestricted by limiting factors.
2. Overshoot – population grows pastits carrying capacity.
3. Dieback – population suddenlycollapses usually due to a lack of food.The population declines below itsoriginal carrying capacity as thelimiting factor is depleted.
4. Renewed growth – growth startsagain once the depleted factor hasrecovered.
time
popu
latio
nsi
ze
carryingcapacity (K)
1
2 34
24

SYSTEMS IN THE NATURAL WORLD Species 2
2.4.3 Trophic levels
Quaternaryconsumers 2 kcal/m2/yr
heat
Tertiaryconsumers 20 kcal/m2/yr
heat
Secondaryconsumers 200 kcal/m2/yr
heat
Primaryconsumers 2000 kcal/m2/yr
heat
Primaryproducers 20000 kcal/m2/yr
heat
decomposers
waste and dead matter
heat
light energy
energy stored as biomass
The trophic level is the position that an organism occupies in a food chain
1. Primary producers. Green plants.A few organisms are autotrophs: Make their own food from solar energy, carbondioxide and water.Chemosynthetic organisms which make their own food from other simplecompounds (e.g., ammonia, hydrogen sulphide or methane) do not requiresunlight and are often bacteria found in deep oceans.
2. Primary consumers. Herbivores and omnivores.Heterotrophs: Consume primary producers.
3. Secondary consumers. Carnivores and omnivores.Heterotrophs: Consume herbivores and other carnivores, sometimes primaryproducers.
4. Tertiary consumers. Carnivores and omnivores.Heterotrophs: Consume herbivores and other carnivores, sometimes primaryproducers.
Decomposers. Bacteria and fungi.Obtain their energy from dead organisms by secreting enzymes that break downthe organic matter.
Detritivores. Snails, slugs, blowfly maggots, vultures.Derive their energy from detritus or decomposing organic material. Deadorganisms or feces or parts of an organism.
The relationships between these species can been shown in food chains and food webs,where arrows indicate the flow of energy (or more bluntly who eats who). As mentionedin the previous chapter energy is passed up the food chain with a large proportion lost asheat, due to entropy. Other things are also passed up the food chain.
25

SYSTEMS IN THE NATURAL WORLD Species
Persistent or non-biodegradable pollutants can build up in an organism or trophic levelbecause they cannot be broken down (bioaccumulation). These can then be passed upthe food chain and commonly, due to the decrease of biomass and energy, increase inconcentration (biomagnification). They can be natural pollutants such as mercury ormanmade such as DDT.
DDT was a popular insecticide introduced to the market in 1945. It was used inagriculture and to eradicate malaria by controlling mosquito populations. Howeverthe chemical passed in to aquatic environments and up the food chain and had seriousimpacts on many marine and bird species. A by-effect was the thinning of theeggshells of some of the effected bird species putting a further pressure on thesespecies. These effects where highlighted in Rachel Carson’s book Silent Spring (1962)leading to increased public opposition to the use of DDT. DDT was banned foragricultural use in most developed countries between 1970-80. A global ban cameinto effect in 2004 while still allowing for some use in malaria control.
Case
stu
dy.
Photosynthesis
Most primary producers convert light energy into chemical energy by the process ofphotosynthesis. Photosynthesis produces the raw material for producing biomass.
The photosynthesis reaction:
carbon dioxide+water+ energy (from the sun)= glucose+ oxygen
Respiration
Respiration is the release of energy from converting organic matter into carbon dioxideand water in all living organisms, releasing energy.
Aerobic respiration reaction:
glucose+ oxygen= carbon dioxide+water+ energy
During respiration, large amounts of energy are dissipated as heat, increasing the entropyin the ecosystem while enabling organisms to maintain relatively low entropy and sohigh organization.
26

SYSTEMS IN THE NATURAL WORLD Biodiversity within systems 2
2.5 Biodiversity within systems
Biodiversity is a general term describing the variability in a community, ecosystem orbiome. It can be defined as the combination of:
Habitat Diversity – the range of different habitats in an ecosystem or biome. This hasthe greatest effect on the other two. Great habitat diversity will usually lead togreater species and genetic diversity.
Species Diversity – defined by two variables: the number of species (richness) and theirrelative proportions (evenness). Communities can be described and comparedthrough the use of diversity indices. When comparing communities that aresimilar, low diversity could be indicative of pollution, eutrophication or recentcolonization of a site. The number of species present in an area is often indicativeof general patterns of biodiversity. Species diversity within a community is acomponent of the broader description of the biodiversity of an entire ecosystem.
Genetic Diversity – the range of genetic material present in a population of a species.Larger populations in many locations tend to have greater genetic diversity.Humans can alter diversity through breeding and genetic engineering. In general,greater genetic diversity improves the resilience of a species.
Biodiversity can be used to evaluate the health and complexity of an ecosystem.Comparison can be made, however only in similar ecosystems.
It is worth noting that interpreting diversity is complex. In general, higher biodiversity(for example, tropical rainforests) creates complex and resilient ecosystems. However,low biodiversity can be present in natural, ancient and unpolluted sites (for example, inArctic ecosystems).
2.5.1 Natural Changes in Biodiversity
Biodiversity is a result of the evolutionary process. Evolution is a gradual change in thegenetic character of populations over many generations, achieved largely through themechanism of natural selection; Biological variation arises randomly and can either be:beneficial to, damaging to, or have no impact on, the survival of the individual. Naturalselection is an evolutionary driving force, sometimes called “survival of the fittest”. Inthis context, the meaning of “fittest” is understood to be “best-suited to the niche”.Natural selection occurs through the following mechanism.
1. Within a population of one species, there is genetic diversity, which is calledvariation.
2. Due to natural variation, some individuals will be fitter than others.3. Fitter individuals have an advantage and will reproduce more successfully than
individuals who are less fit.4. The offspring of fitter individuals may inherit the genes that give that advantage,
and so these genes will remain in the gene pool.
27

SYSTEMS IN THE NATURAL WORLD Biodiversity within systems
Environmental change gives new challenges to species, which drives the evolution ofdiversity. Those that are suited will survive, and those that are not suited will notsurvive. There have been major mass extinction events in the geological past caused byvarious factors, such as tectonic plate movements, super-volcanic eruption, climaticchanges (including drought and ice ages), and meteorite impact-all of which resulted innew directions in evolution and therefore increased biodiversity. Less than 1 per cent ofall species that have ever existed are still alive today.
Speciation is the formation of new species when populations of a species become isolatedand evolve differently from other populations. Isolation of populations can be caused byenvironmental changes forming barriers, such as: mountain formation, changes in rivers,sea level change, climatic change or plate movements. The surface of the Earth is dividedinto crustal, tectonic plates that have moved throughout geological time. This has led tothe creation of both land bridges and physical barriers with evolutionary consequences.
geographicalbarrier
geographicalbarrier
two populations of one species caninterbreed and mix genes (gene flowoccurs)
populations separated by ageographical barrier cannotinterbreed; each develops its ownvariations (gene flow interrupted)
eventually two separate speciesdevelop in response to differentselection pressure
even without a geographical barrier,two species remain genetically distinct
The distribution of continents has also caused climatic variations and variation in foodsupply, both contributing to evolution.
28

3INVESTIGATING
ECOSYSTEMS
(EXPERIMENTAL METHODS)
3.1 General data collection rules
Naming The study of an ecosystem requires that it be named and located(e.g., Deinikerwald, Baar, Switzerland, a mixed deciduous-coniferous managedwoodland).
Sampling and extrapolation Ecosystems are large and complex and thereforeimpossible to measure completely. Thus a key step when planning an experimentis in how much of an area will be sampled. There is a balance to strike betweenincreasing accuracy with increasing size; and time available and the number ofsamples. Measurements should be repeated to increase reliability of data. Thenumber of repetitions required depends on the factor being measured. With almostall the following techniques, there are limitations. A key skill when planningexperiments is to understand the limitations of your experiment and account for it.
3.2 Measuring abiotic factors
There are various experimental tools used to quantify the non living factors in aecosystem. By measuring at numerous points/times, it is possible to show: change alongan environmental gradient, or change over time through succession, or change before andafter a human impact. We have outlined some experimental methods in a table below.This will be a useful reference when conducting your internal assessment. Detailedknowledge of these is rarely required in exams.
29

INVESTIGATING ECOSYSTEMS (EXPERIMENTAL METHODS) Measuring abiotic factors
Type of ecosystem
Factor Experimental equipment /technique
Method
Marine
Salinity Electrical conductivity of density
pH pH meter
Temperature Thermometer
Dissolved oxygen Oxygen selective electrode / datalogging /Winkler titration
Wave action Dynamometer Must use averages over a long time
Freshwater
Turbidity (cloudinessof water)
Optical instruments / Secchi disc
pH pH meter
Temperature Thermometer
Dissolved oxygen Oxygen selective electrode / datalogging /Winkler titration
Flow velocity Flow meter / Impellers / Floattimed between two points
Average flow=surface flow
1.25
Terrestrial
Temperature Thermometer
Light intensity Electronic light meter Account for natural variation when taking measurements
Wind speed Anemometer / Ventimeter
Soil: Particle size Sort and measure particles Large particles can be measured by hand.Smaller particles can be measured with sievesSediment can be measured using optical techniques
Soil moisture Weigh wet and dry (scales) Take one weight measurement. Dry the soil completely andthen take another measurement. The difference is the soil;moisture.
Soil: Organic content Measure Loss on Ignition (LOI) Take weight measurement of original sample. Heat at hightemperature (500–1000 °C) to burn off any organicmaterial. Continue to heat until mass is constant. Weighagain. The difference in mass is the organic content.
Slope Surveying equipment
Soil: MineralContent/pH
Soil testing kits / pH meter
Rainfall Rain gauge Record amount every 24 hours, emptying each time.
30

INVESTIGATING ECOSYSTEMS (EXPERIMENTAL METHODS) Measuring biotic factors 3
3.3 Measuring biotic factors
We often want to measure diversity and species abundance within an ecosystem. Becauseit is unfeasible to measure an entire ecosystem, we take samples and extrapolate results.Two common sampling methods are point (quadrat) and line/belt transects. Samplingcan be:
Continuous – where every thing is measured: the entire line transect of the entire area.Interrupted (transect) – points at regular intervals are measured.Random – points are determined by random. A good practice is to draw a grid (at the
size of your quadrat) over an area, giving a number to each square. A list ofrandom numbers can then be generated by a computer or using a table. Theseshould then be sampled.
Stratified random – where an area has two or more distinct areas, each area should betreated separately using the random method above.
Systematic – points/transects are placed at a set distant. Often the first is placerandomly and then the rest by a systematic method.
3.4 Collecting organisms
For non motile (non or slow moving) organisms we can count organisms using quadrats.The size of the quadrat should be determined by the size of the organisms being sampled.We can chose to count actual numbers, percentage cover (% of the quadrat in which theorganism — usually a plant — occurs), or percentage frequency (% of squares in aquadrant in which the organism occurs)
For motile (moving organisms) we can use traps. Examples of traps include:
pitfall traps beakers or pots buried in the soil which animals walk into and cannotescape from
nets sweep, butterfly, seine, and purseflight interception traps fine-meshed nets that intercept the flight of insects – the
animals fall into trays where they can be collectedsmall mammal traps often baited, with a door that closes once an animal is insidelight traps a UV bulb against a white sheet attracts certain night flying insectsTullgren funnels paired cloth funnels, with a light source at one end, a sample pot the
other, and a wire mesh between: invertebrates in soil samples placed on the meshmove away from the heat of the lamp and fall into the collecting bottle at thebottom
Pooters sucks insects from vegetationKick sampling (water) disturbing a river bed and collecting the animals downstream in
a net.
31

INVESTIGATING ECOSYSTEMS (EXPERIMENTAL METHODS) Identifying organisms
3.5 Identifying organisms
We need to identify organisms so we can count them correctly. Methods to do thisinclude:
• Keys. These can be:
Paired statement keywritten list
1. single leaf got to 2several leaflets got to 6
2. leaf with prickles hollyleaf with no prickles got to 3
3. leaf edge with lobes got to 4leaf edge with no lobes got to 5
4. lobes sharp pointed sycamorelobes rounded oak
5. leaf with smooth edge beechleaf with serrated edge elm
6. leaflets in fan shape horse chestnutleaflets in pairs got to 7
7. leaf edge serrated rowanleaf edge plain ash
Dichotomousdone in steps with two options at each step
Vertebrate Classes
fur
Mammals
no fur
feathers
Birds
no feathers
external fertilisation internal fertilisation
Reptilesgills in adult
Fish
no gills in adults
Amphibians
Diagrammatic
Loblolly Pine White Oak Sweetgum
Southern Red Oak Redbud Yellow Poplar
Hickory Red Maple Sycamore
American Holly Sassafras Dogwood
Keys are limited by the number of organisms they contain.• Comparison to herbarium or specimen collections in museums.• Technologies such as DNA profiling.
32

INVESTIGATING ECOSYSTEMS (EXPERIMENTAL METHODS) Species abundance (Lincoln index) 3
3.6 Species abundance (Lincoln index)
Species abundance refers to the number of organisms in a species relative to itsenvironment. We can count the number of organisms of each species in a sample andthen compare their number. For plants, it is often easier to measure the percentage cover.These numbers can then be used to grade a species on the DAFOR/ACFOR scale
D
A
F
O
R
A
C
abudant
common
dominant
abundant
frequent
occasional
rare
>50%
25–50%
12–25%
6–12%
<6%
in sample
Often direct counts are too great an undertaking, we therefore use an indirect methodsuch as the Lincoln index.
This method requires the use of capture-mark-release-recapture with the application ofthe Lincoln index.
Lincoln index=n1× n2
nm
where n1 is the number caught in the first sample, n2 is the number caught in the secondsample and nm is the number caught in the second sample that were previously marked.
3.7 Species diversity (Simpson index)
A function of the number of species and their relative abundance can be compared usingthe Simpson index. This indication of diversity is only useful when comparing twosimilar habitats or the same habitat over time.
D=N (N − 1)∑
n(n− 1)
where D is the Simpson diversity index, N is the total number of organisms of all speciesfound and n is the number of individuals of a particular species. The sigma notation,
∑
,
33

INVESTIGATING ECOSYSTEMS (EXPERIMENTAL METHODS) Productivity and biomass
means the denominator is the sum of n(n− 1) for all the species that make up N . Usingthis formula, the higher the result, the greater the species diversity.
Species richness is the number of species in a community and is a useful comparativemeasure.
3.8 Productivity and biomass
3.8.1 Definitions
Gross Primary Productivity (GPP): the amount of energy/biomass converted byproducers per unit area per unit time. (g/m2 year)
Net Primary Productivity (NPP): the gain (after respiration) by producers inenergy/biomass per unit area per unit time. (g/m2 year)
NPP=GPP−R
Gross Secondary Productivity (GSP): the total energy/biomass assimilated byconsumers through feeding and absorption per unit area per unit time. (g/m2 year)
GSP= food eaten− fecal loss
Net Secondary Productivity (NSP): the gain (after respiration) by consumers inenergy/biomass per unit area per unit time. (g/m2 year)
NSP=GSP−R
Maximum sustainable yields are those that are less than or equivalent to the netprimary or net secondary productivity of a system. It is sustainable as the rateimplies that the resource will not have a biomass smaller than it original had whenharvested.
fishing effort
catc
h
population recovery population crash
MSYover fishing
34

INVESTIGATING ECOSYSTEMS (EXPERIMENTAL METHODS) Productivity and biomass 3
3.8.2 Pyramids
Pyramids are graphical models of the amount of living material stored at each trophiclevel of a food chain by either numbers, biomass or productivity for a given area andtime. Quantitative data for each trophic level are drawn to scale as horizontal barsarranged symmetrically around a central axis. Generally, due to the loss of energy up thefood chain, pyramids have a wide base and become narrower towards the apex. Onecommon issue with pyramids is the difficulty in assigning some species (particularlyomnivores) a trophic level.
Pyramid of numbers record the number ofindividuals at each trophic level. They are asimple, easy method of giving an overviewand are good at comparing changes inpopulation numbers with time or season.However they do not account for size, so atree is counted the same as an ant. This meanspyramids of some ecosystems are inverted.
owl
blue tit
aphid
oak tree
Pyramid of biomass represents the biological massof the standing stock at each trophic level at aparticular point in time measured in unitssuch as grams of biomass per square metre(g m−2). Biomass may also be measured inunits of energy, such as J m−2. However asorganisms must be killed to measure drymass, samples are made and extrapolated.Therefore results are not exact. Furthermorethe measure is susceptible to seasonaldifferences in fast growing species (e.g., algae)
Pyramid of productivity Two organisms with thesame mass do not have to have the sameenergy content. Pyramid of productivityshows the flow of energy (starting from solarradiation – optional) through each trophiclevel of a food chain over a period of time.Productivity is measured in units of flow(g m−2 yr−1 or J m−2 yr−1). Unlike the firsttwo, this type of pyramid allows forcomparison between ecosystems but islimited in comparing seasonal differences. Itis impossible for these pyramids to beinverted. However, they are also the mostcomplicated to collect data for.
35

INVESTIGATING ECOSYSTEMS (EXPERIMENTAL METHODS) Estimating biomass and productivity
3.9 Estimating biomass and productivity
To find biomass, it is necessary to capture and kill part of a population and thenextrapolate results. The organism should be heated at around 80 °C so that only the drymass is measure. After weighing the dry mass, it can by combusted under controlledconditions to find the amount of energy. Data from these methods can be used toconstruct ecological pyramids.
To find primary productivity on land, we require 3 similar patches of the vegetation inquestion. One is harvested and measured as above (Sample 1); another is covered withblack plastic to prevent photosynthesis (Sample 2); and the third is left as it is (Sample 3).After a set time period, the other two are harvested and measured. From these three wecan determine the GPP, NPP and amount of respiration.
GPP=Sample 3− Sample 1
time period
Respiration=Sample 2− Sample 1
time period
NPP=(Sample 3− Sample 1)− (Sample 2− Sample 1)
time period
To find primary productivityin water, a light (open to light)and dark (covered from light)bottle technique can be used.The oxygen concentration ofthe water should be measured.The water should then be splitbetween two bottles with noair present. An equal amountof the aquatic species should beplaced in both. The oxygenconcentration should bemeasured after several hours.
I
Initial DO
O2
O2
0
Dark DO
O2
O2
− = Respiration
100
Light DO
O2
O2
O2
0
Dark DO
O2
O2
− = Gross productivity
100
Light DO
O2
O2
O2
I
Initial DO
O2
O2
− =Net productivity
36

INVESTIGATING ECOSYSTEMS (EXPERIMENTAL METHODS) Estimating biomass and productivity 3
Secondary productivity can be found by monitoring the weight of an animal, its foodand its feces over a set period of time.
GSP=Weight of food−weight of feces
time period
NSP=Weight of animal before−Weight of animal after
time periodRespiration=GSP−NSP
37

INVESTIGATING ECOSYSTEMS (EXPERIMENTAL METHODS) Estimating biomass and productivity
38

4SYSTEMS IN THE HUMAN
WORLD
4.1 Human population dynamics
Demographic tools for quantifying human population include
Crude Birth Rate (CBR) – Number of births per 1000 people, per yearTotal Fertility Rate – Average number of births per 1000 women of childbearing age
(usually 15-49).Crude Death Rate (CDR) – Number of deaths per 1000 people per year.Natural Increase (NIR)
Natural Increase=Crude Birth Rate−Crude Death Rate
This can then be divided by 10 and expressed as a percentageDoubling time (DT) – number of years for a population to double in size assuming the
natural growth rate remains constant. = 70/NIR (%).
Global human population has followed a rapid growth curve but there is uncertainty asto how this may be changing. As the human population grows, increased stress is placedon all of Earth’s systems.
year
populationbillions
0
2
4
6
8
10
12
1950 1960 1970 1980 1990 2000 2010 2020 2030 2040 2050
11 billion
9 billion
7.5 billion
39

SYSTEMS IN THE HUMAN WORLD Human population dynamics
4.1.1 Demographic Transition Model
The Demographic Transition Model tries to combine patterns in birth and death rates toexplain and predict current demographics.
High birth rateParents want children:• for labour• to look after them in old age• to continue the family name• prestige• to replace other children who have died
High death ratePeople die from:• lack of clean water• lack of food• poor hygiene and sanitation• overcrowding• contagious diseases• poverty
Low birth rateBirth rates decline because:• children are very costly• the government looks after people
through pensions and health services• more women want their own career• there is more widespread use of family
planning• as the infant mortality rate comes down
there is less need for replacement children
Low death rateDeath rates decline because:• clean water• reliable food supply• good hygiene and sanitation• lower population densities• better vacations and healthcare• rising standards of living
low economic development high
death rateper 1000
population
birth rateper 1000population
0
5
10
15
20
25
0
10
20
30
40total population
death ratebirth rate
Stage 1
High and variable:• birth rates and death
rates are high andvariable
• population growthfluctuates, only someindigenous (primitive)tribes still at this stage
• UK at this stage untilabout 1750
Stage 2
Early expanding:• birth rate remains
high but the deathrate comes downrapidly
• population growth israpid
• Afghanistan andSudan are at this stage
• UK passed throughthis stage by 1850
Stage 3
Late expanding:• birth rate drops and
the death rate remainslow
• population growthcontinues but at aslower rate
• Brazil and Argentinaare at this stage
• UK passed throughthis stage in about1950
Stage 4
Low and variable:• birth rates and death
rates are low andvariable
• population growthfluctuates
• UK and mostdeveloped countriesare at this stage
Stage 5
Slow declining:• the birth rate is lower
than death rate• the population
declines• Japan and Sweden are
in this stage
40

SYSTEMS IN THE HUMAN WORLD Human population dynamics 4
4.1.2 Population pyramids
Population pyramids display information about the age and sex structure of a population.
012345678 0 1 2 3 4 5 6 7 8% of population
ages
male female
Stage 1/2
0 – 4
10 – 14
20 – 24
30 – 34
40 – 44
50 – 54
60 – 64
70 – 74
80 – 84
01234567 0 1 2 3 4 5 6 7% of population
ages
male female
Stage 3
0 – 4
10 – 14
20 – 24
30 – 34
40 – 44
50 – 54
60 – 64
70 – 74
80 – 84
01234 0 1 2 3 4% of population
ages
male female
Stage 4
0 – 4
10 – 14
20 – 24
30 – 34
40 – 44
50 – 54
60 – 64
70 – 74
80 – 84
01234 0 1 2 3 4% of population
ages
male female
Stage 5
0 – 4
10 – 14
20 – 24
30 – 34
40 – 44
50 – 54
60 – 64
70 – 74
80 – 84
Concave slopescharacterize a
high death rateA wide base
indicatesa high
birth rate
Bulges in the slope suggestbaby booms or high rates
of immigration or in-migration (e.g., excess
males aged 20–35 yearswill be economic migrants
looking for work; excesselderly, usually female, will
inundate retirement resorts)
Narrowingbase suggests
fallingbirth rate
‘Slices’ in the slope indicateemigration or out-migrationor age-specific or sex specific
deaths (epidemics, war)Straight ornear verticalsides indicate alow death rate
4.1.3 Factors that affect fertility
The general pattern for fertility is that it is lower in MEDCs and higher in LEDCs
• Status of women – Higher status = lower birth rate.• Level of Education – Higher education = lower birth rate.• Wealth – Middle-income families who aspire to live well tend to limit the number
of children they have. Those with lower ambitions or those with more wealth donot.
• Urban vs Rural – Relates to factors above. Also children are more of an asset inrural areas.
• Religion – Many religions are pro-natalist, however other factors tend to bestronger. For example Italy has one of the lowest birth rates in Europe despitebeing strongly catholic.
• Health – Good health care can result in more successful pregnancies, but birthrates tend to be higher in areas with poor healthcare (higher infant mortality) tooffset children that have been lost.
41

SYSTEMS IN THE HUMAN WORLD Human population dynamics
• The cost of children – Economic prosperity allows for more children, however ascountries develop the cost of children also increases, and therefore birthratesdecrease. In the UK the average child costs £230,000
• National and international development policies may also have an impact onhuman population dynamics.
• Governments often attempt to control the population structure in order to avoidsome of the disadvantages above. These policies are either pro-natalist (wish toincrease birth rate) or anti-natalist (wish to decrease birth rate). Many LEDCs areaiming at reducing birth rates through better family planning and support forbirth control.
The most well know anti-natalist policy is China’s Infamous “One child Policy” putinto place in 1979. The policy can be heralded as a success, claimed to of negated apotential 300 million people over 20 years. However the policy was heavy handed,including forced abortion and sterilisation and due to the social preference for boys,led to infanticide of girls (show in current gender ratio of 114 males : 100 Females).
Many developed countries have pro-natalist policies in place, ranging from economicincentives / tax breaks to more extreme measures such as government arranged “Lovecruises” (Singapore) or banning contraceptives (Romania). However few havemanaged to raise birth rate for more than a few years, finding it hard to reverse thetrends due to economic development we examined earlier. Attracting economicmigrants is currently a more effective method to balance ageing populations, butoften this just moves the problem on.
Case
stu
dy.
4.1.4 Factors that affect mortality
There is no clear global pattern for CDR, however in general MEDCs have higher lifeexpectancies, while LEDCs have higher rates of child and infant mortality. Infant deathsare often preventable and can therefore indicate poor water supply, sanitation, healthcareand nutrition.
• Age structure – Quite simply, if a country has a proportionally large elderlypopulation it will have a higher death rate than a country with a proportionallylarge younger population.
• Social class and occupation – Within a country, those of a lower social class, whomost likely work in manual jobs, have higher mortality rates. Similarly lowerclasses can be disadvantaged by poorer access to healthcare (physical or financial),and overcrowding and pollution in cities.
• Disease and war – Prevalence of certain diseases, most recently HIV Aids, can havehuge impacts of death rates in relatively short periods of time. Wars have a similareffect but tends to only effect the young adult male population.
42

SYSTEMS IN THE HUMAN WORLD Human resource use 4
4.2 Human resource use
Natural capital is a term used for natural resources that can produce a sustainablenatural income of goods or services. Natural income is the yield obtained from naturalresources
Humans draw many goods (marketable commodities like timber and minerals) and lifesupporting services (e.g., photosynthesis, decomposition) from the earth. Anything thatis regarded as being of value to us is a resource and has a natural capital. This value maybe aesthetic, cultural, economic, environmental, ethical, intrinsic, social, spiritual, ortechnological. Note that the value of a resource can differ by location and change overtime.
Renewable natural capital can be generated and/or replaced as fast as it is being used.Non-renewable natural capital is either irreplaceable or only replaceable over
geological timescales (e.g., fossil fuels, soil, and minerals).
The rate at which these resource can be replaced is know as their natural income. Ifnatural capital is used beyond its natural income, this use becomes unsustainable. Theanalysis must be holistic as The impacts of extraction, transport, and processing of arenewable natural capital may cause damage making this natural capital unsustainable.Similarly through methods of conservation, reuse and recycling we can sustain resources.
All of the challenges we currently face are due to either our over use / exploration ofresources (cover in the following chapters) or the waste they produce. However it mustbe noted that in many (particularly developing countries) there is a conflict of interestbetween environmental, economic and social concerns. Countries strive to make lifebetter for their inhabitants and often environmental degradation is seen as a small price topay for a strong economy that can lead to better education, healthcare and quality of life.
4.3 Pollution
Pollution is the addition of a substance or an agent to an environment by human activity,at a rate greater than that at which it can be rendered harmless by the environment, andwhich has an appreciable effect on the organisms within it. Pollutants may be in theform of organic/inorganic substances; light, sound, or heat energy; biological agents, orinvasive species; and derive from a wide range of human activities including thecombustion of fossil fuels. It is rarely a malicious process. Most pollutants are generatedfrom a useful process and sometime their negative effects are not noticeable until a largequantity is being produced. For example DDT is a useful pesticide but due to itswidespread use it became a pollutant (see page 26).
43

SYSTEMS IN THE HUMAN WORLD Pollution
Pollution may be:
• non-point (coming from many places) or point source• persistent (pollutant can not be naturally broken down) or biodegradable• acute (effect is seen shortly after pollutant is present) or chronic (pollutant has an
effect over a long time).• primary (active on emission) or secondary (arising from primary pollutants
undergoing physical or chemical change).• We must take these characteristics into account when managing pollution as
different strategies are require for different characteristics.
The management strategy for combating pollution can be generalised into 3 steps, whichshould be attempted in descending order.
1. Alter human activity to replace the pollutant – Promote alternative technologies,lifestyles and values through education and government legislation.
2. Regulate to minimise the release of pollutant – Extract the pollutant from thewaste and store securely.
3. Recover the pollutant and restore the natural environment
Often the measures become increasingly expensive as you go down the list. Here anounce of prevention is worth a pound of cure. Removing pollution from theenvironment is far more costly than treating the pollutant before entry or reducing itsuse.
4.3.1 Solid Domestic Waste (SDW)
The most visually emotive type of pollution is the discarded items from our own homes,official termed Solid domestic waste. Although only 5% of all waste it is something wecan all control. In the EU we produce 1.4 kg of SDW per person per day.
There are different types of SDW of which the volume and composition changes overtime. Recently, the abundance and prevalence of non-biodegradable (e.g., plastic,batteries, e-waste) pollution in particular has become a major environmental issue.Plastic waste in the sea is being broken down in to small pieces by wave actions. Theseare then ingested by fish and birds. Our electronics contain valuable metals (copper, zinc,etc), lithium batteries and various toxic substances (lead, mercury, arsenic, etc.) Howeverdue to their increasing complexity very little is recycled, and many of these substancescan leak into the environment. In 2016, 44.7 million tonnes of E-waste was generatedwith an estimated raw material value of 55 billion euros.
44

SYSTEMS IN THE HUMAN WORLD Pollution 4
Below is a list or waste disposal options from best to worse for the environment.However where our SDW goes is influenced by cultural (attitude to disposal), economic(cost of disposal), technological (methods of disposal), and political (legislation and taxes)factors.
1. Non-disposal – dispose of less through the following• Reduce – minimise waste through consuming less/ choosing options with less
packaging;• Reuse – repair items, or give to others so they can be used again in their
current form• Recycle – the raw materials of the item can be used to make new ones.
2. Composting – Naturally breaking down organic waste with microorganism Thiscan be done in your back garden are in large scale anaerobic biodigesters. These cancollect methane to be used as a fuel and the remaining solids make good fertiliser.
3. Incineration – burning waste. It is possible to generate energy and the ash can beused in road building. However incineration does realise carbon dioxide andsometimes worse chemicals from the burning of plastics and electronics. The extrafiltering required makes incineration plants expensive to build.
4. Landfill – about 40% of our waste goes to big holes in the ground, where unsortedwaste is disposed of. They are strategically located so as not to effect humanpopulation or leak out into the environment, but are becoming harder to find.Increasingly landfill is being placed in LEDCs where the environmental protectionis less strict and so pollute the areas around them. Methane gas can be recoveredand used as a power source. It is also possible to eventually build on top of.
5. Dumping in the sea.
Going a step further, there are ideas of removing waste completely. Waste as a term issubjective: one person’s waste can be another person’s resource. This is the principle of acircular economy where by keeping technological and biological materials separate, wecan endlessly recycle them to provide everything we need.
45

5HUMANS AND THEIR
EFFECT ON THE BIOTIC
WORLD
Through our increasing numbers, increasing land use and increasing pollution, we areoutcompeting the animal world. While global biodiversity is difficult to quantify, it isdecreasing rapidly due to human activity.
The total number of classified species (1.8 millions) is a small fraction of the estimatedtotal of species (from 5–100 million). They are based on mathematical models, which areinfluenced by classification issues and a lack of finance for scientific research, resulting inmany habitats and groups being significantly under-recorded. Small organisms (insects,microbes, fungi, bacteria etc.) and those that live in inaccessible environments (deepocean).
The composition of species is ever changing with the natural loss (extinction) of speciesbetween 10–100 species lost per year. Estimates of extinction rates are also varied, butcurrent extinction rates are thought to be between 100 and 10 000 times greater thanbackground rates, due to increased human influence. Put another way this is about 3species lost every hour. There have been high periods of species loss (mass extinction)before but this was due to volcanic eruptions, see level changes or other major naturalevents. Many have said that we are in the middle of a mass extinction due to humanity.
The human activities that cause species extinctions include:
Habitat destruction – degradation, fragmentation (the division of land) and loss ofhabitat mostly through modern agriculture and resource extraction. Habitat canalso be altered indirectly through climate change causing biome shifts.
Introduction of invasive species – both species which compete against native species,and diseases which can wipe out species.
Pollution – making a habitat less habitable.Over-harvesting and hunting – taking the natural biotic resource faster than
replacement.
47

HUMANS AND THEIR EFFECT ON THE BIOTIC WORLD The value of biodiversity
5.1 The value of biodiversity
Biodiversity is a resource with natural capital that only becomes clear when we imagine aworld without it. The various impacts will resonate with different environmental valuesystems (see Chapter 6). Direct values are easy to quantify, indirect are more subjective.
Aesthetic
People enjoy being in nature and travel to places of beauty.
Ecological
• Environmental stability and mineral cycles.• Soil aeration by worms.• Fertilisation and pollination by insects.• Unique habitats and species.• Natural decomposition of waste.• Biological control of pests.
Economic
Food – Although our diets have narrowed, we still eat a large variety of plants andanimals. Within these are many strains. This diversity is vital in order that ourfood is resilient of disease and pests. We are beginning to see the value of this withfarmers and breeder given focus to historical varieties.
Products – we get many medicines, fertilisers, oils, rubber, linen, rope, cotton, silk,honey, rattan, perfumes, timber and pesticides form the natural world.
Ethical and social
• Each species has a right to exist.• Indigenous tribes and strongly connected to their environments.• There is scientific value.
Possibly the strongest argument is that we do not yet know what we be valuable to us inthe future, and therefore we should aim to conserve biodiversity regardless of its currentusefulness to us.
48
HUMANS AND THEIR EFFECT ON THE BIOTIC WORLD Conservation of biodiversity 5
5.2 Conservation of biodiversity
Conservation is the act of preserving something for future generations. It is a two stageprocess. First vulnerable species and/or habitats are identified, then strategies are put inplace to protect them.
Identify
Quantification of biodiversity is important so that areas of high biodiversity may beidentified, explored, and have appropriate conservation put in place. Similarly, theability to assess changes to biodiversity in a given community over time can be used toassess the impact of human activity in the community. See Chapter 3 for experimentalmethods for this.
(Designate)
This intermediate step is not needed but is now common practice. Designating a speciesor habitat with a special status (for example endangered species, national park) can helpto publicise the need to protect it.
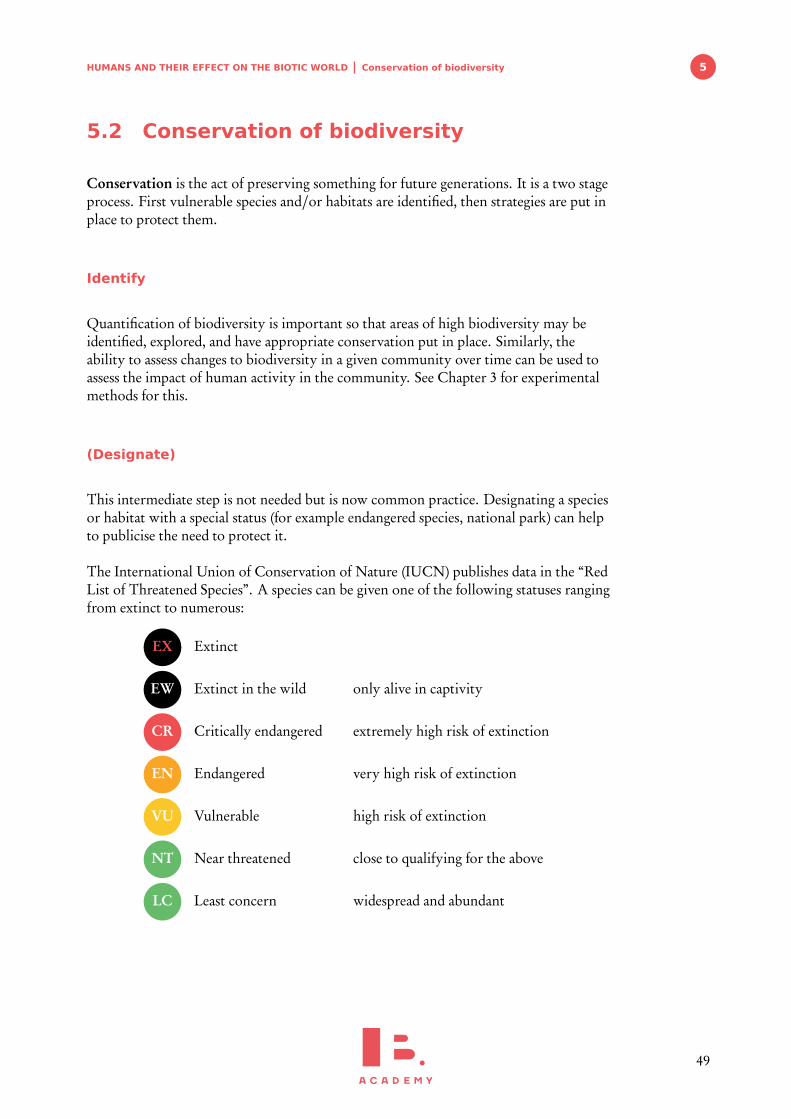
The International Union of Conservation of Nature (IUCN) publishes data in the “RedList of Threatened Species”. A species can be given one of the following statuses rangingfrom extinct to numerous:
EX
EW
CR
EN
VU
NT
LC
Extinct
Extinct in the wild
Critically endangered
Endangered
Vulnerable
Near threatened
Least concern
only alive in captivity
extremely high risk of extinction
very high risk of extinction
high risk of extinction
close to qualifying for the above
widespread and abundant
49

HUMANS AND THEIR EFFECT ON THE BIOTIC WORLD Conservation of biodiversity
Factors used to determine the conservation status of a species include:
Population size – smaller populations have fewer individuals to lose and likely havelower genetic diversity so have a lower ability to adapt to change. If a population isdecreasing it can indicate that it is under threat. Further more if a population isfragmented, this reduces the chance for reproduction and reduces the species
Geographic range and degree of specialization – highly specialised species are morevulnerable as they are dependent on a niche. Similarly species that occupy smallhabits are more likely to be wiped out.
Distribution – Species spread across a smaller area are more prone to extinction.Reproductive potential and behaviour – some animals (elephants, rhinos,
orang-utans) have low reproductive rates, and therefore take a long time to replacetheir populations.
Quality of habitat – a reduction in the quality of a habitat puts pressure on a species.Trophic level – Animals higher up the food chain are more sensitive to changes lower
down. They also tend to have smaller population numbers.Probability of extinction – some species are naturally going extinct (excluding human
impact).
Conserve
Conservation is often a large and ongoing task, therefore organisations, bothgovernmental and non-governmental, are important parts of managing the process.
Non-governmental organisations(NGOs)
Intergovernmental organisations(IGOs)
Government organisation
Example
Greenpeace, WWF European Environment Agency(EEA), United nationsenvironment program (UNEP),International Union ofConservation of Nature (IUCN)
Environmental Protection Agencyo. the USA (EPA)
Common traits
Radical often grassroots, in thefield. Often will focus on localissues
More conservative. More focusscientific research and catalogingOrganised as businesses with clearduties and approach
Research and publicise theenvironmental policies of anational government
50

HUMANS AND THEIR EFFECT ON THE BIOTIC WORLD Conservation of biodiversity 5
Agenda
Protect the environment, throughdirect protection and lobbyingpolitical change
To provide guidelines andimplement international treaties
Research, regulation, monitoringand control activities within acountry
Speed of Response
Quick to respond as organisationsrepresent groups of like mindedpeople
Slow to respond as require aconsensus of all parties involvedwith differing political agendas(more bureaucratic)
Varies, depending on politicalagenda
Financial Resources
Funding from charitable donations Funded by government andinternational funds
Funded by national government
Political influence
Focus on the environment, can beidealistic and extremeThey can check the actions ofgovernments and businessesagainst the environmentOften have no direct politicalpower
Decisions can be effected bypolitical and economic factors
Strongly influenced by thegovernment in power
Use of Media
Have to attract media attentionthrough action (protests,campaigns).+ These can be used to putpressure on governments to act−Often only focuses on “cute”animals for more public appeal− Can be censored in somecountries
Can use national media tocommunicate policies effectivelyto the public
Uses national media to promoteprepared information
Furthermore international conventions on biodiversity work to create collaborationbetween nations for biodiversity conservation. In 1980, the IUCN launched the Worldconservation strategy, outlining global priorities and encouraging countries toincorporate these in to their national development strategy. At the same time, it stressedthe importance of local community, especially those who closely depend on naturalresource, in achieving these priorities. The convention focused on three points thatcould be scientifically quantified and were therefore easier to agree on:
• maintaining life supporting systems and ecological processes• preserving genetic diversity• sustainable use of species and ecosystems.
The convention was updated in 1991, to include the benefits of sharing and sustainableuse of natural resources.
51

HUMANS AND THEIR EFFECT ON THE BIOTIC WORLD Conservation of biodiversity
Conservation strategies
The strategy for conservation can focus on conservation of the habitat, conservation ofcertain species, or a mixture of both.Often a mixture leads to the best results as habitatsand their species are strongly interconnected.
Better Worse When conserving a habitat the following criteria are considered:
Bigger is better as the increased area allows for more species and largepopulations.
SLOSS debate (single large or several small)One large area can support more habitats and species, especially toppredators, than several smaller areas of a similar total size. Similarlyit is good practice to minimise fragmentation of a large reserve.Sometimes smaller reserves are the only option. Several smallerreserves can reduce the risk of the total decline of the ecosystem dueto natural or man-made disasters.
Arrangement/Distribution and proximity to potential humaninfluenceClose and arranged in a cluster is preferable to isolated and in aline; because animals can disperse and recolonize if a reserve losesstock through disturbance. A buffer zone can be placed around theconservation area to reduce human disturbance. Some low impactactivities such as farming and selective logging can happen here.
CorridorsConnecting reserves is good to facilitate dispersal of species andseasonal migrations. A wider corridor is better than a narrow oneas it has a smaller edge. Corridors have the potential downside ofspreading disease between reserves. Narrow corridors can provide aneasier hunting ground for poachers.
Shape and edge effectsAlthough dictated by the landscape, the best shape for a reserve iscircular as this has the smallest edge to area ratio. Minimising edges isimportant because they are the border of two habitats. They thereforehave different abiotic factors and more competition than the mainconservation area. Often the most vulnerable species will not be ableto survive her.
52

HUMANS AND THEIR EFFECT ON THE BIOTIC WORLD Conservation of biodiversity 5
When conserving species the following strategies can be used:
Promotion of flagship species to gain public support. These are charismatic speciesthat people will like and so support a conservation effort. In the process other (lesscharismatic) species will be protected. One disadvantage is that these flagshipspecies can take priority, despite not often being the most important part or theecosystem.
Selection of keystone species to protect the integrity of the food web. A smallchange in the population of a keystone species can have a large effect on the rest ofthe ecosystem.
The Convention on International Trade in Endangered Species (CITES). This verysuccessful voluntary international convention aims to restrict the trade of species,where that trade threatens their survival. Species are can be put into one of threegroups:
• Appendix I: species cannot be traded internationally as they are threatenedwith extinction.
• Appendix II: species can be traded internationally but within strictregulations ensuring its sustainability.
• Appendix III: a species included at the request of a country which then needsthe cooperation of other countries to help prevent illegal exploitation.
Captive breeding and reintroduction programmes, and zoos. Keeping animals incaptivity helps to maintain species that are threatened in the wild. Zoos allowmore people to see exotic animals and so increase support for their conservation. Itis possible to reintroduce captive species back to the wild but this is a difficult andcostly strategy. To be successful, attempts must engage the local community tohelp support the species in their early stages and not exploit them too quickly.
DNA and seed banks. Stores of plant and animal DNA are maintained as both a recordof the species and as a potential way to bring species back in the future.
Even taking all of these factors into account, success of conservation efforts are stronglyinfluenced by the amount of community support, funding and proper research.
53

6WATER, SOIL AND FOOD
PRODUCTION
6.1 Water
The hydrological cycle is a system of water flows and storages driven by solar radiation.
advectionprecipitation
evaporation
transpiration evaporation
evapotranspiration
surface (overland run-off)
water table
throughflow
reservoir
infiltrationgroundwater flow
interception
sublimation
woodland
ocean
channelfloor(river)flooding
melting
ice freezing
55

WATER, SOIL AND FOOD PRODUCTION Water
Storages: organisms, soil and various water bodies, including oceans, groundwater(aquifers), lakes, rivers, atmosphere, glaciers and ice caps. Fresh water makes uponly a small fraction (approximately 2.6% by volume) of the Earth’s waterstorages. 68.7% of this is in ice. Only 0.3% of all water is accessible for us. Theamount of time water is stored (the turnover time) varies greatly between a fewdays and tens of thousands of years. Therefore depending on location water can beboth renewable and nonrenewable capital.
Flows: evapotranspiration, sublimation, evaporation, condensation, advection(wind-blown movement), precipitation, melting, freezing, flooding, surface runoff,infiltration, percolation, and stream- flow or currents.
Human activities often affect the hydrological cycle by changing the amounts of surfacerunoff and infiltration.
Agriculture – To irrigate crops, humans have diverted rivers, and extracted water fromsurface stores and ground water. Furthermore cropland and grazing pasturesintercept less rain and allow for less infiltration. Combined this can lead to greatersurface runoff, leaching of minerals and flooding. Agricultural chemicals can becarried in the runoff and discharged into rivers.
Deforestation – trees intercept large volumes of precipitation and their roots stabilisethe soil, increasing the volume of water infiltrated into the ground. When they areremoved most of the precipitation becomes surface runoff, eroding the soil andraising flood levels. If not quickly replenished with new vegetation, a positivefeedback loop forms as the soil becomes degraded, vegetation decreases and surfacerunoff increases.
Urbanization – The effects can vary from city to city. In general urban areas have moreimpermeable areas and less vegetation. During dry periods, evaporation isincreased and more strain put on water stores, depleting aquifers/lowering thewater table; where as, in wetter periods, surface runoff and the chance of flashfloods increases. This can be offset by greater water management such as: divertingrivers, building storm drains and urban basins and encouraging the use of urbangreenery and permeable surfaces. However, these measures sometimes just movethe problem downstream.
56

WATER, SOIL AND FOOD PRODUCTION Water 6
Ocean circulation
The water in our oceans is constantly circulating, driven by differences in temperatureand salinity which effect the density of sea water. Warmer, less salty water rises andcolder, saltier water sinks. These thermocline currents move water in a global loopknown as the great oceanic conveyor belt (OCB).
These currents are overlaid by smaller currents driven by the OCB, salinity and wind.Together they are key to climate as they distribute heat around the world.
57

WATER, SOIL AND FOOD PRODUCTION Water
Freshwater access
Up to 40% of humans alive today live with some level of water scarcity. Either:
Physical scarcity of water – there is not enough water.Economic scarcity of water – there is enough water but it is too expensive to access.
The supplies of freshwater resources are inequitably available and unevenly distributed,About three-quarters of annual rainfall occurs in areas containing less than a third of theworld’s population.
This can lead to conflict and concerns over water security, particularly where sources areshared. Freshwater supplies may become further limited through contamination andunsustainable extraction. As populations, irrigation and industrialisation increase, thedemand for fresh water is increasing. Furthermore climate change may disrupt rainfallpatterns and further affect this access.
Little or no water scarcity
Physical water scarcity
Approaching physical water scarcity
Economic water scarcity
Not estimated
Freshwater resources can be sustainably managed using a variety of different approaches.Water supplies can be enhanced through reservoirs, redistribution, desalination(expensive and energy intensive), artificial recharge of aquifers and rainwater harvestingschemes. Water conservation (including grey-water recycling) can help to reduce demandbut often requires a change in attitude by the water consumers.
Aquatic food production
The worlds oceans have been regarded as a seemingly abundant source of food. Theoceans have a variety of complex ecosystems, most are supported by photosynthesis byphytoplankton. The highest rates of productivity are found near coastlines or in shallowseas, especially where upwellings and nutrient enrichment of surface waters occurs.Aquatic (freshwater and marine) flora and fauna are harvested by humans. However dueto both human population growth (1.7% per year) and changing diets (aspiration for
58

WATER, SOIL AND FOOD PRODUCTION Water 6
more animal protein in NICs/LEDCs and food fashions (“health foods”)), recentdemand for aquatic food resources has grown at an average of 3.2% per year.
To meet this demand, fishing equipment has developed and fishing methods havechanged. However this has also lead to dwindling fish stocks and damage to habitats. Forexample modern trawling techniques do not distinguish between adult and young fish,removing the next generation before it can mature. Furthermore there is by-catch of“unwanted” species that often are thrown back dead into the ocean.
Many fishing areas are over exploited (the capture of fish is higher than the maximumsustainable yield). In the worst cases this has lead to environmental degradation andcollapse of wild (capture) fisheries. According to the FAO (Food and AgricultureOrganization) , more than 70% of the world’s fisheries are fully exploited, in decline,seriously depleted or too low to allow recovery.
Unsustainable exploitation of aquatic systems can be mitigated at a international,national, local and individual level through policy, legislation and changes in consumerbehaviour.
• Environmental pressure by the public has lead to new rules on discarding by-catch.• Severely depleted areas have been closed to fishing to allow them to recover.• Fish quotas are being implemented internationally to help guarantee that fish are
not being caught above MSY.• New techniques such as wider mess nets, and improved fish sonar, allow for more
selective catches.
Due to these measures wild catch has stabilised at 90 million tonnes per year.
1950 1960 1970 1980 1990 2000 20100
10
20
30
40
50
60
70
80
90
100
Years
Mill
ion
tons
wild catch
farmed fish
Figure 6.1: World wild fish catch and fish farming 1950–2012
59

WATER, SOIL AND FOOD PRODUCTION Water
Much of the continued demand increase is being met with farmed fish. Aquacultureprovides potential for increased food production and also economic development. Itinvolves intervention in the rearing process to enhance production. Issues aroundaquaculture include:
• Loss of habitats,• Pollution (with feed, antifouling agents, antibiotics and other medicines added to
fish pens)• Spread of diseases and escaped species (some involving genetically modified
organisms).• It has also been noted that the feed for the farmed fish (particularly salmon) can
come from wild catch of smaller species and so still indirectly put pressure onnatural reserves.
Controversial species
There are certain species, such as seals, sharks and whales, where hunting is morecontroversial. The ethical issues arise over the biorights of these unique and sometimeendangered animals. Under the International Whaling Commission, whaling has beenbanned since 1986 because of the commercial hunting was unsustainable and barbaric.Several countries with a historic culture for whale hunting (Japan, Norway) would likethe ban lifted. Japan continues to hunt whales under the guise of scientific research.However NGOs and counties have protested against this. In comparison small scalehunting is still carried out by Inuits. For many this is seen as acceptable becauseindigenous cultures should have the rights to their traditions.
Water pollution
Despite being so reliant on both fresh water and the oceans, we have strangely been usingwater stores as a massive dump for our waste. Pollution both to groundwater and surfacewater, is a major global problem, the effects of which influence human and otherbiological systems. Types of aquatic pollutants include:
• floating debris• organic material• inorganic plant
nutrients (nitratesand phosphates)
• toxic metals
• synthetic compounds• suspended solids• hot water• oil• radioactive pollution• pathogens
• light• noise• biological pollutants
(invasive species).
60

WATER, SOIL AND FOOD PRODUCTION Water 6
Source of aquatic pollutants include:
• surface run-off• sewage• industrial discharge/
pipelines• power station waste
• solid domestic waste• recreation and
tourism• rivers, atmosphere• oil spills
• deliberate andaccidental dischargesfrom ships
• aquaculture farms
Note: Storm water that washes off the roads and roofs can be a worse source ofpollutants than sewage. Such water may contain high levels of heavy metals, volatilesolids, and organic chemicals.
Measuring water pollution
In Chapter 3 we looked at various measures we can take to measure the environmentalcondition of the water. When measuring for pollution, a polluted and an unpolluted siteshould be compared (for example, upstream and downstream of a point source). We candetermine water pollution through directly measured samples of water for:
• pH less than 6.5 or greater than 8.5.• High concentrations of chemical indicators – nitrite, free chlorine, chloride,
fluoride, hardness, phosphates, and heavy metals such as lead.• Percentage saturation of dissolved oxygen – less than 50% can be considered
polluted.
Water quality can also be indirectly measured by examining the fish and insects that livein and around the water. Certain species, termed indicator species, are tolerant tocertain pollutants and therefore a high relative abundance can be indicative of pollutedwaters. Often this is faster and cheaper than direct methods.
Eutrophication
Certain pollutants can help a few well adapted organisms dominate an ecosystem. Aprime example is eutrophication — excessive nutrient enrichment, often from leachedagricultural fertilisers, leading to rapid growth in algae, plants and phytoplanktonpopulations.
These large blooms of algae can be seen as a green surface on the water. One exception isa marine algae species which creates huge red tidal blooms and produces dangeroustoxins.
Where the eutrophication is small, negative feedback will stabilise the system. Increase inalgae −→ Increase in fish −→ Decrease in algae.
61

WATER, SOIL AND FOOD PRODUCTION Water
When there is a sufficient amount of organic material and organisms to break it down, apositive feedback loop occurs. The biodegradation of nitrates and phosphates utilisesoxygen. Biochemical oxygen demand (BOD) is a measure of the amount of dissolvedoxygen required to break down the organic material in a given volume of water throughaerobic biological activity. The increased BOD can lead to a lack of oxygen in the water(anoxic), which in severe cases leads to formation of methane, hydrogen sulfide andammonia (toxic gases). Furthermore the algae blooms reduce light penetration to riverbeds, preventing aquatic plants from photosynthesising and replacing the lost oxygen.This kills the life in the water leaving ’dead zones’. Eventually the algae will die back andnothing is left. This effect is exaggerated in warmer waters, as the water can hold lessoxygen and the rate of respiration is higher.
Management strategies
Altering human activity• limiting fertilisers and detergents by encouraging better methods and legislation.• educating people to care for the ocean. eg stopping plastic waste.
Controlling release of pollutant• waste water treatment to remove nitrates and phosphates.
Clean-up and restoration of damaged systems• precipitation of phosphates.• removal of nutrient rich mud from eutrophic lake.• reintroduction/management of plant and fish species.
62

WATER, SOIL AND FOOD PRODUCTION Soil 6
6.2 Soil
The ground beneath our feet is very easy to overlook, but it is an essential part of theglobal system. It is a habitat for many micro-organisms; provides peats, clays, sand andgravel; and most notably it is the medium in which most of our food is produced.
pretipitation
infiltrationenergy organic material
uptake
leaching
soil movement
parent material
soil
decomposition
weathering andnutrient cycling
Inputs: organic material including leaf litter and inorganic matter from parent material,precipitation and energy
Outputs: uptake by plants and soil erosionStorages: organic matter, organisms, nutrients, minerals, air and waterFlows: Transfers of material within the soil, including biological mixing and leaching
(minerals dissolved in water moving through soil), contribute to the organizationof the soil. Transformations include decomposition, weathering and nutrientcycling.
Soil may be illustrated by a soil profile that has a layered structure known as soilhorizons. Soils vary in the number of horizons they contain and how visually differenteach horizon is.
63

WATER, SOIL AND FOOD PRODUCTION Soil
O organic horizonl un-decomposed litterf partly decomposed
(fermenting) litterh well-decomposed humus
A mixed mineral–organic horizonh humusp ploughed, as in a field or
a gardeng gleyed or waterlogged
Generally a dark colour dueto the organic material
E eluvial or leached horizona strongly leached, ash
coloured horizon, as ina podzol
b weakly bleached, lightbrown horizon, as in abrown earth
Slightly lighter due to theleaching
B illuvial or deposited horizonFe iron depositedt clay depositedh humus deposited
Contains the material fromthe leached layer
C bedrock or parent materialr rocku unconsolidated
materials
R bedrockhard bedrock
Soil can also be classified using a soil texture triangle which illustrates the composition ofthe soil based on the percentage of sand (Particles with diameter 0.05 mm–0.2 mm), silt(0.02 mm–0.05 mm), and clay (< 0.002mm). This composition is a good indication of theproperties of the soil such as: mineral and nutrient content, drainage, water-holdingcapacity, air spaces, biota and potential to hold organic matter; and therefore can help todetermine the ability of the soil to promote primary productivity. The ideal soil forcultivation is a loam in which there is a balance between water holding ability and freelydraining, aerated conditions.
Sandy soil – low primary productivity due to poor water-holding capacity and lownutrient status.
Clay soil – quite low primary productivity due to poor aeration and poor waterinfiltration.
Loam soil – high primary productivity due to medium infiltration rate, water-holdingcapacity, nutrient status, aeration, and ease of working.
Fertile loam soils take a long time to naturally build up through the process of successionand are therefore considered a non-renewable resource. Organisms within the soilprovided nitrogen (nitrogen fixing bacteria) and nutrients (decomposition); as well asmixing the soil and aerating it. By maintaining functioning nutrient cycles, thiscommunity of organisms make soils resistant to soil erosion.
64

WATER, SOIL AND FOOD PRODUCTION Terrestrial food production 6
10
10
10
2020
2030
3030
40
4040
50 5050
60
60
60
70
70
70
80
80
80
90
90
90
100
100
100
percent silt
percent sand
perc
ent c
layclay
sandyclay
clay loam
siltyclay
silty clayloamsandy clay
loam
sandy loamloam
silt loamsilt
sandloamy
sand
Humans can have a large impact on the composition of soils. We have learned how toimprove soils for food production both naturally (irrigation techniques, natural compost)and more recently artificial measures. But we can also severely degrade soils throughurbanisation (compactions), mining, deforestation, and intensive agriculture (grazing,monoculture, over irrigation). The loss of vegetation makes the soils more prone toerosion and the leaching of minerals. Compaction of soils by machinery or large grazerscan make soils imporous and so increase surface runoff. In extreme cases soils canbecome biologically irreparable through: toxification, salination and desertification.
6.3 Terrestrial food production
Due to both increased human population and improved diets, there is growing pressureon our soils. The number of people an area of land needs to feed is growing and we aredecreasing the amount of this productive land. Furthermore there is a current culturaltrend towards greater consumption of meat and dairy. These foods come from a highertrophic level and therefore require a high proportion of land, energy and water toproduce. Socio-economic, cultural, ecological, political and economic factors can be seento influence societies in their choices of food production systems.
To meet the demand, commercial, industrialised food production systems (whichgenerally tend to reduce soil fertility) are replacing small-scale subsistence farmingmethods.
65

WATER, SOIL AND FOOD PRODUCTION Management strategies
The sustainability of terrestrial food production systems is influenced by factors such as:
• scale• industrialisation• mechanisation• fossil fuel use• seed, crop and
livestock choices
• water use• fertilisers• pest control• pollinators• antibiotics• legislation
• ratio of commercialversus subsistencefood production
A real paradox in our current food production system is that we have bothoverproduction and food waste and malnourishment. This is due to the unevendistribution of fertile land and food. Food waste is an issue arising in MEDCs, whereregulatory standards may be set according to commercial preferences so that consumablefood is discarded. It can also be an issue in LEDCs, where the necessary refrigeration andtransport infrastructure is insufficient to avoid food spoilage. These inequalities can leadto conflict.
6.4 Management strategies
It should be apparent that our current approach is unsustainable. The solution is toreduce the demand on the soils and better conserve them. Increased sustainability maybe achieved through:
Altering human activity• convincing consumers to reduce meat consumption and increase consumption
of organically grown and locally produced terrestrial food products• improving the accuracy of food labels to assist consumers in making informed
food choicesControlling release of pollutant
• monitoring and control of the standards and practices of multinational andnational food corporations by governmental and intergovernmental bodies
• planting of buffer zones around land suitable for food production to absorbnutrient runoff.
Clean-up and restoration of damaged systems• Soil conservation measures include soil conditioners (such as organic materials
and lime), wind reduction techniques (wind breaks, shelter belts), cultivationtechniques (terracing, contour ploughing, strip cultivation) and avoiding the useof marginal lands.
66

7ENERGY AND THE
ATMOSPHERE
7.1 Atmosphere
The atmosphere is a dynamic system that is essential to life on Earth. The behaviour,structure and composition of the atmosphere influences variations in all ecosystems.
The atmosphere is predominantly a mixture ofnitrogen (78.1%), oxygen (20.9%), carbon dioxide (0.4%),argon, water vapour and other trace gases. But thismixture has undergone changes throughout geologicaltime due to the atmosphere’s relationship with thebiosphere. Biotic components have effected inputs,outputs, flows and storages in the atmosphere and viceversa. The atmosphere is approximately 1100 km indepth, but we shall focus on the two lower levels. Thestratosphere (10 km–50 km) which contains the Ozonelayer and the troposphere (less than 10 km) where mostclouds form. As we saw in the first chapter both of theselayers are important for the solar radiation in the planetwith clouds affecting albedo levels and trapping heat.
N2 78.1%
O2 20.9%
CO2 0.4%
other gases
We will now look at how Human activities impact atmospheric composition throughaltering inputs and outputs of the system. These changes in the concentrations ofatmospheric gases — such as ozone, carbon dioxide, and water vapour — have significanteffects on ecosystems.
Ozone
Stratospheric ozone is a key component of the atmospheric system because it protectsliving systems from the negative effects of ultraviolet radiation from the Sun. Ultravioletradiation reaching the surface of the Earth damages human living tissues, increasing theincidence of cataracts, mutation during cell division, skin cancer and other subsequenteffects on health. The effects of increased ultraviolet radiation on biological productivityinclude damage to photosynthetic organisms, especially phytoplankton, which form thebasis of aquatic food webs.
67

ENERGY AND THE ATMOSPHERE Atmosphere
Some ultraviolet radiation from the Sun is absorbed by stratospheric ozone causing theozone molecule to break apart. Under normal conditions the ozone molecule willnaturally reform. This ozone destruction and reformation is an example of a dynamicequilibrium.
Human activities have disturbed the dynamic equilibrium of stratospheric ozoneformation. Ozone depleting substances (including halogenated organic gases such aschlorofluorocarbons CFCs) are used in aerosols, gas-blown plastics, pesticides, flameretardants and refrigerants. Halogen atoms (such as chlorine) from these pollutantsincrease destruction of ozone in a repetitive cycle, allowing more ultraviolet radiation toreach the Earth.
Management strategies
The Montreal Protocol on Substances that Deplete the Ozone Layer (1987) andsubsequent updates is an international agreement for the reduction of use ofozone-depleting substances signed under the direction of UNEP. National governmentscomplying with the agreement made national laws and regulations to decrease theconsumption and production of halogenated organic gases such as chlorofluorocarbons(CFCs). Methods for this reduction include:
Altering human activity• reducing the manufacture and release of ozone-depleting substances.• developing alternatives to gas-blown plastics, halogenated pesticides, propellants
and aerosols• developing non-propellant alternatives.
Controlling release of pollutant• recycling refrigerants• UNEP has had a key role in providing information, and creating and evaluating
international agreements, for the protection of stratospheric ozone.• An illegal market for ozone-depleting substances persists and requires consistent
monitoring.Clean-up and restoration of damaged systems
• the holes in the ozone have been observed to be healing.• atmospheric scrubbing methods have been proposed but are too costly to
implement.
68
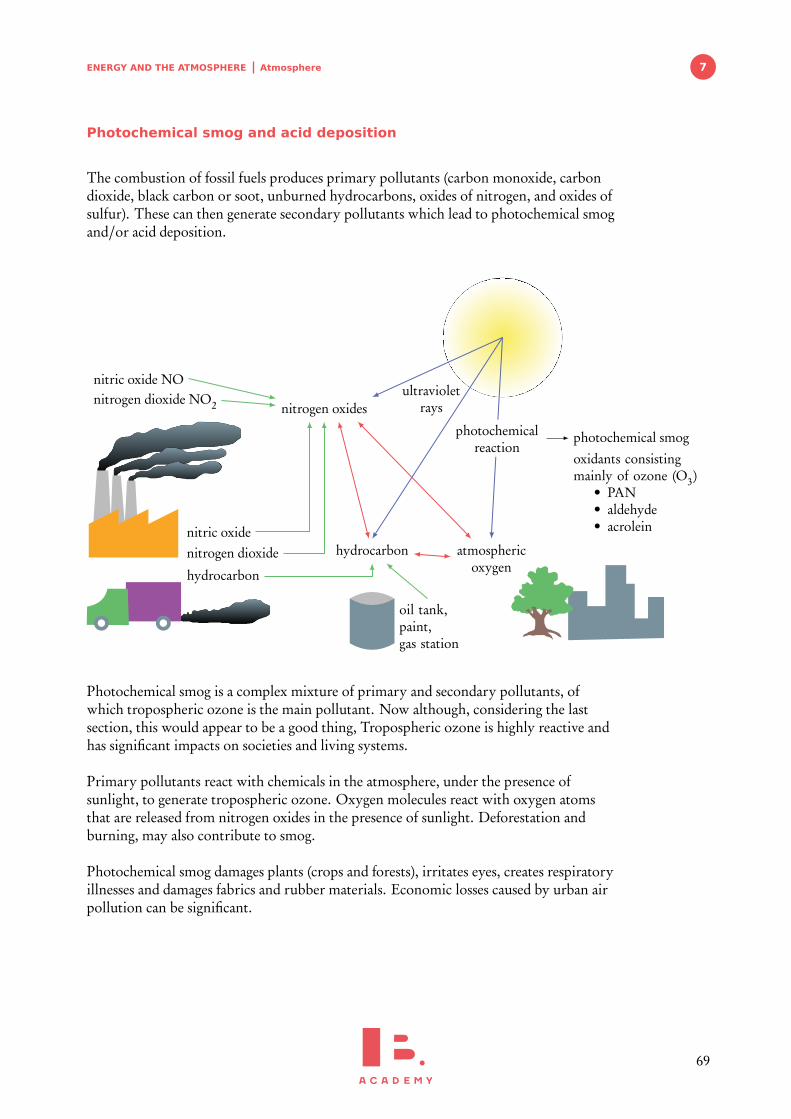
ENERGY AND THE ATMOSPHERE Atmosphere 7
Photochemical smog and acid deposition
The combustion of fossil fuels produces primary pollutants (carbon monoxide, carbondioxide, black carbon or soot, unburned hydrocarbons, oxides of nitrogen, and oxides ofsulfur). These can then generate secondary pollutants which lead to photochemical smogand/or acid deposition.
nitrogen oxidesultraviolet
rays
photochemicalreaction
atmosphericoxygen
hydrocarbon
nitric oxide NOnitrogen dioxide NO2
nitric oxidenitrogen dioxide
hydrocarbon
photochemical smog
oxidants consistingmainly of ozone (O3)
• PAN• aldehyde• acrolein
oil tank,paint,gas station
Photochemical smog is a complex mixture of primary and secondary pollutants, ofwhich tropospheric ozone is the main pollutant. Now although, considering the lastsection, this would appear to be a good thing, Tropospheric ozone is highly reactive andhas significant impacts on societies and living systems.
Primary pollutants react with chemicals in the atmosphere, under the presence ofsunlight, to generate tropospheric ozone. Oxygen molecules react with oxygen atomsthat are released from nitrogen oxides in the presence of sunlight. Deforestation andburning, may also contribute to smog.
Photochemical smog damages plants (crops and forests), irritates eyes, creates respiratoryillnesses and damages fabrics and rubber materials. Economic losses caused by urban airpollution can be significant.
69

ENERGY AND THE ATMOSPHERE Atmosphere
The frequency and severity of smog in an area can be exaggerated by local topographyand climate. Thermal inversions occur due to a lack of air movement when a layer ofdense, cool air is trapped beneath a layer of less dense, warm air. This causesconcentrations of air pollutants to build up near the ground instead of being dissipatedby “normal” air movements.
Normal pattern
cooler air
cool air
warm air
Thermal inversion
warm inversion layer
cool air
Acid deposition occurs when sulfur dioxide and oxides of nitrogen are converted intosecondary pollutants sulphuric acid and nitric acid. These fall as either dry deposition(such as ash and dry particles) or wet deposition (such as rain and snow).
The acid deposition acidifies the soil and water, which in turn kills organisms that cannottolerate the change in pH. The acidic water increased solubility of aluminium turninglakes and streams toxic. The combination of acid and aluminium kills much of theaquatic ecosystems. The acid rain leaches nutrients from the soils such as calcium. Thelack of calcium can lead to reductions in snail populations and so in turn affect birdpopulations. Plants can struggle to get the nutrients required to photosynthesise. Acidrain also directly damages the leaves of coniferous trees as it falls.
The impacts of acid deposition may be limited to areas downwind of major industrialregions but these areas may not be in the same country as the source of emissions.Therefore in certain cases, the pollution management of acid deposition often involvescross-border issues. For example Scandinavian forests were affected by the aciddepositions of pollutants from British coal power stations.
Management strategies
Altering human activity• reducing use, or using alternatives to, fossil fuels — example activities include the
purchase of energy-efficient technologies, the use of public or shared transit, andwalking or cycling
• international agreements and national governments may work to reducepollutant production through lobbying
Controlling release of pollutant• regulating and reducing pollutants at the point of emission through government
regulation or taxation
70
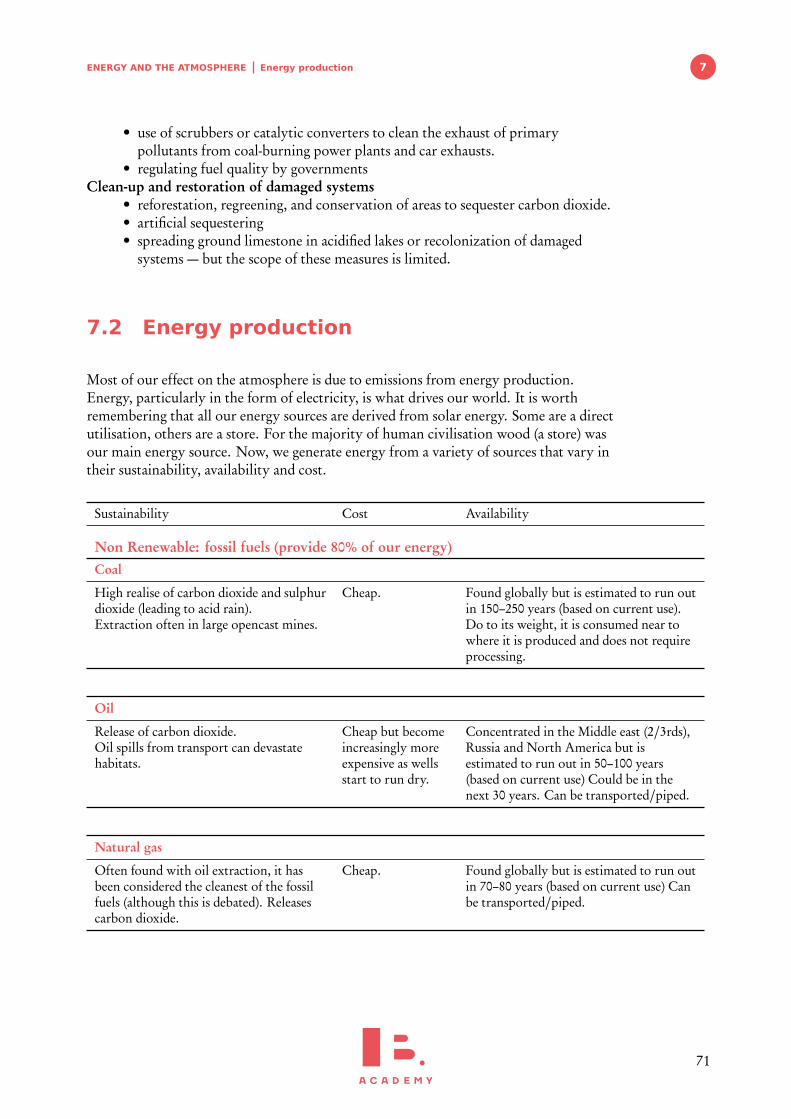
ENERGY AND THE ATMOSPHERE Energy production 7
• use of scrubbers or catalytic converters to clean the exhaust of primarypollutants from coal-burning power plants and car exhausts.
• regulating fuel quality by governmentsClean-up and restoration of damaged systems
• reforestation, regreening, and conservation of areas to sequester carbon dioxide.• artificial sequestering• spreading ground limestone in acidified lakes or recolonization of damaged
systems — but the scope of these measures is limited.
7.2 Energy production
Most of our effect on the atmosphere is due to emissions from energy production.Energy, particularly in the form of electricity, is what drives our world. It is worthremembering that all our energy sources are derived from solar energy. Some are a directutilisation, others are a store. For the majority of human civilisation wood (a store) wasour main energy source. Now, we generate energy from a variety of sources that vary intheir sustainability, availability and cost.
Sustainability Cost Availability
Non Renewable: fossil fuels (provide 80% of our energy)Coal
High realise of carbon dioxide and sulphurdioxide (leading to acid rain).Extraction often in large opencast mines.
Cheap. Found globally but is estimated to run outin 150–250 years (based on current use).Do to its weight, it is consumed near towhere it is produced and does not requireprocessing.
Oil
Release of carbon dioxide.Oil spills from transport can devastatehabitats.
Cheap but becomeincreasingly moreexpensive as wellsstart to run dry.
Concentrated in the Middle east (2/3rds),Russia and North America but isestimated to run out in 50–100 years(based on current use) Could be in thenext 30 years. Can be transported/piped.
Natural gas
Often found with oil extraction, it hasbeen considered the cleanest of the fossilfuels (although this is debated). Releasescarbon dioxide.
Cheap. Found globally but is estimated to run outin 70–80 years (based on current use) Canbe transported/piped.
71

ENERGY AND THE ATMOSPHERE Energy production
Shale gas
No worse than natural gas in terms ofemissions but requires hydraulic frackingwhich can pollute groundwater and soil,and in extreme cases trigger earthquake.
Cheap. Shale gas is found across the globe, withone fifth concentrated in China.
Tar sands
Very dirty source of oil which requires alot of refinement so is only economicallyviable when oil prices are high. Itsextraction destroys large swaths of habitat.It requires a lot of energy and water.
Expensive.
Non Renewable: grey areaNuclear
No Carbon dioxide emissions butproduces radioactive waste which has tobe securely stored for 1000s of years.
Can be used anywhere due to the highenergy in its fuel. 1 kg go uraniumcontains 20000 the energy of 1 kg of coal.Reserves are found mainly in Australiaand Canada. estimated to run out in 70–80years.
Waste to energy
Still released carbon dioxide but can beconsidered a better alternative to landfill.
RenewableWind
Can be considered ugly and noisy. Can bea problem for some bird speciesparticularly during migration.
Medium cost. Possible everywhere but best in areas withconsisted strong wind. Often bestlocations are far from populations,requiring lots of power lines.
Solar
The extraction of some of the materials inthe panels is questionable.
Starting to competewith oil for price.
Possible everywhere but best in sunnyareas.
Wave / Tidal
May impact wildlife, and effect tidal flows. High installationcost and hard toscale up.
Limited to areas with high tidal range/powerful wave action.
72

ENERGY AND THE ATMOSPHERE Energy choice and security 7
Biomass
Carbon neutral but requires a lot of land.Does release carbon due to fertilisers andthe transport of the crop. Hasdisadvantages of monoculture agriculture.Has to be refined for best results.Can displace food crops and even worstrainforest and wetlands.
Cheap. Possible everywhere.
Geothermal
Can also produce dangerous gasses whichhave to be safely disposed of.
High initial cost. Limited to a few places with ideal platetectonics (e.g., Iceland)
Hydro
Can flood large areas, displacing habitats.Can effect environments downstream.
High initial costbut cheap andplentiful on goingelectricity.
7.3 Energy choice and security
The energy choices adopted by a society may be influenced by availability, sustainability,scientific and technological developments, cultural attitudes, and political, economic,and environmental factors. These in turn affect energy security and independence. Fossilfuels are dominant due to their availability, cheap cost and ease of producing energy. It isonly with the growing social realisation of their negative impacts on the planet that wehave begun to change. Similar social movements have for good or bad halted growth innuclear energy over radiation concerns.
Due to the necessity of energy, especially for economic growth, securing a reliable andcost effective source is a dominant factor for national governments in their choice.Energy security depends on an adequate, reliable and affordable supply of energy thatprovides a degree of independence from other countries. This motivates manygovernments to search for energy sources that are produced completely in their country,even if not the cheapest or most environmental friendly. Despite it’s questionableenvironmental credentials, shale gas gives the USA energy security.
These issues are amplified by the inequitable availability and uneven distributions ofenergy sources. Energy rich nations can use their energy exports as a political tool but itcan also make them a target. For example a dispute between Russia and Ukraine over anunpaid bill for gas lead to large pipelines that also supplied Europe being cut off. Equallymuch of the conflict and focus on the middle east is over securing oil supply. Furthermadness is the rush for the arctic, where several nations are staking a claim on the oilreserves that will become exploitable as climate change melts the ice.
73

ENERGY AND THE ATMOSPHERE Energy choice and security
These threats can be reduced through:
• Improvements in energy efficiencies and energy conservation limiting growth inenergy demand.
• Having several sources of energy.• Investing in renewables which are less location dependent.• Better cooperation between nations. For example the European energy grid.
74

8CLIMATE CHANGE AND
SUSTAINABILITY
8.1 Climate change
Climate describes how the atmosphere behaves over relatively long periods of time.Climate change has been a normal feature of the Earth’s history, driven by changes in thepercentage of greenhouse gases (e.g., carbon dioxide, methane, CFCs and water vapour)in the atmosphere. In a broad sense, climate change shows how interconnected globalsystems are. Changes in one system can lead to changes in another.
Man-made climate change
There has been a significant debate about how much human activity has contributed torecent climate change. The burning of fossil fuels and industrial agriculture emitenormous amounts of greenhouse gases into the atmosphere. Furthermore deforestationis reducing the uptake of carbon dioxide into the world’s forests. Many question if thisactivity is large enough to have an effect. Although there is a degree of uncertainty withclimate models due to their complexity, most scientists now agree that we are the causeof recent climate change. Most climate-change-deniers have pointed to unusual weatherevents as evidence that climate change is not happening. For example Donald Trumpcommenting on large amounts of snowfall. REMEMBER: Weather describes theconditions in the atmosphere over a short period of time and is therefore not anindicator of climate change. Furthermore many of the negative and positive feedbackmechanisms associated with climate change involve very long time lags and so can bedifficult to identify.
The atmosphere and oceans
The main driver of weather and climate is the circulation of water and heat between theatmosphere and the oceans. The interchange of water happens by evaporation of oceanwater into the atmosphere and returns through the subsequent rainfall. The interchangeof heat happens at the sea surface. Here, a warmer ocean can warm the atmosphere or awarmer atmosphere, the ocean. Each of the systems further distribute this heat andwater through oceanic currents (see Chapter 6) and atmospheric currents (see Chapter 1).Therefore water and heat will not necessarily interchange back where it came from.
Current climate change is increasing the mean global air temperature due to thegreenhouse effect. This will lead to an increase in the sea surface temperature. Becausethe ocean is far more dense than the atmosphere, this temperature change is smaller andwith a significant time lag. The increase in oceanic temperature will likely lead toincreased frequency and intensity of extreme weather events due to increasedevaporation. Another likely effect is a rise in sea level as the warmer oceans melt the icecaps.
75

CLIMATE CHANGE AND SUSTAINABILITY Climate change
Potential impacts
Human activities
Main climate characteristics
Major threats
Fossil fuelburning
Transport
Heating
IndustryAgriculture
Land usechanges
Urbanization
Increase inimpermeable
surface
Deforestation
CO2
CH4
N2O
Carbon cycledisturbances
(enhanced)Greenhouse
effect
Averagetemperature
rise“global warming”
Ice capmelting
Clouds
Changes inprecipitation
Oceancirculationupheaval
Salinity
Watertemperature
Sea levelrise
Disaster
Droughts
Heat waves
Floods
Cyclones
Diseasesspread
Casualties
Famines
Economiclosses
Biodiversitylosses
Loss oftraditionallifestyles
Abruptclimate change
Europecooling
Gulf streammodification
Climate change processes
A spannerin the climate wheel
Greenhouse gasemissions
Climate change is likely to impact all our global systems. The potential impacts will varyfrom one location to another and may be perceived as either adverse or beneficial. Somechanges may balance themselves out (negative feedback), for example increasedevaporation is balanced by increased precipitation. Others, more worryingly, couldbecome steadily worse (positive feedback). An example is: polar ice melting reduces thealbedo effect, increasing temperatures and melting more ice.
76

CLIMATE CHANGE AND SUSTAINABILITY Climate change 8
Below are some of the potential impacts, of which many are already being observed. Aswith the systems in the previous chapters, these impacts are interlinked. Even if westopped emitting all greenhouse gases today, we would still experience these impacts dueto the planetary lag time.
• changed weather patterns – reduced or increased amounts of precipitation.• ocean acidification as the oceans absorb more carbon dioxide from the atmosphere• Biomes shifting due to changes in temperature and precipitation• loss of biodiversity and ecosystems as species cannot adapt to the shifting of biomes• change in location of crop growing areas, agriculture may shift towards the poles• Polar ice melts• rising sea levels lead to coastal inundation• increased drought and possible water shortages• spreading of tropical diseases
Mitigation and adaptation
In order to prevent catastrophic climate change, we must mitigate and adapt.
Mitigation attempts to reduce the causes of climate change through the reduction and/orstabilization of greenhouse gas (GHG) emissions and their removal from the atmosphere.
Mitigation strategies to reduce GHGs in general may include:
• reduction of energy consumption – requires large societal changes.• carbon taxes / carbon credits – by putting a price on emissions, cleaner alternatives
are encouraged.• reduction of emissions of nitrogen oxides and methane from agriculture• use of alternatives to fossil fuel such as wind, solar and hydropower.
Mitigation strategies for carbon dioxide removal (CDR techniques) include:
• protecting and enhancing carbon sinks through land management.• Reduction of Emissions from Deforestation and Forest Degradation in Developing
Countries (UN-REDD programme)• using biomass as fuel source• using carbon capture and storage (CCS)• enhancing carbon dioxide absorption by the oceans through either fertilizing
oceans with nitrogen, phosphorus, iron (N/P/Fe) to encourage the biologicalpump, or increasing upwellings to release nutrients to the surface.
Geo-engineering is a technological solution to reduce the amount of solar radiationreaching the Earth’s surface. Proposals include cloud seeding, space mirrors and dispersalof sulfur dioxide (see previous chapter for why this is a terrible idea). These “solutions”are very expensive and likely to have other negative effects. They should therefore beseen as a last resort.
77

CLIMATE CHANGE AND SUSTAINABILITY Climate change
Adaptation attempts to manage the impacts of climate change by reducing adverse affectsand maximizing any positive effects. This is necessary as, even with a large reduction inGHGs, historic emissions will still have an effect on the current climate.
Examples of adaptations include:
• flood defences to protect against sea level rises;• monitoring and control (vaccination programmes) of spreading tropical diseases;• rainwater harvesting and desalination plants to provide water in drought regions;• planting of crops in previously unsuitable climates to meet the gap in global food
supply;• adaptation of buildings and cities to their changing climate.
International cooperation
Climate change is a global challenge that requires a global solution. There is a need forinternational cooperation to effectively mitigate against climate change. Furthermore itis predicted that areas that are less responsible for GHG emissions (LEDCs) willexperience the worst effects. Is it not right that those who emitted the most (MEDCs)should provide economic and technological support.
There are several international efforts and conferences to address both mitigation andadaptation strategies. These have had varying levels of success but have shown progressover time.
1992 – Rio Earth Summit Countries developed a framework to address climate changeand stabilize greenhouse gas concentrations. The United Nations FrameworkConvention on Climate Change (UNFCCC) went into effect 1994 but failed toslow down greenhouse gas emissions. It had little effect as there were no bindinglimits or enforcement.
1997 – Kyoto Protocol An extension of the UNFCCC to commit developed countriesto reducing GHG emissions from their 1990 levels. It encouraged the use ofalternative energy sources but also allowed for carbon trading. The USA andCanada withdrew from the protocol. Furthermore China and India are notincluded.
2015 – Paris Agreement A stricter treaty committing all countries to limit globaltemperature rise to 1.5 °C. Although there are no binding mechanisms, countriesmust be transparent with their emissions to allow for continued monitoring.
Intergovernmental Panel on Climate Change (IPCC) Set up by WHO and UNEP,the panel provides reports, assessing the science related to climate change. Thelatest report in 2018 highlighted the negative impacts of global temperature riseover 1.5 °C.
National Adaptation Programmes of Action (NAPAs) National reports fromLEDCs to the UNFCCC, which focus on urgent and immediate needs to adapt toclimate change. The country provides a prioritized list of activities to best copewith the impacts of climate change. Once submitted the country is eligible forfunding through the Least Developed Countries Fund.
78

CLIMATE CHANGE AND SUSTAINABILITY Sustainability 8
8.2 Sustainability
We have started to become aware of the various impacts we can have as a species on ourplanet. We have covered many of these in the previous chapters. By thinking about thesepossible impacts before we act is thinking sustainably. This thinking can be applied to allsystems. Sustainable development meets the needs of the present withoutcompromising the ability of future generations to meet their own needs. Applied toresources this means that they can be naturally replaced at the rate at which they are usedand there is full recovery of the ecosystems affected by their extraction and use.
Environmental value systems
“Sustainable” can be a vague term as it means different things to different peopleaccording to their Environmental value system. An EVS is an individual’s worldview orparadigm that shapes the way they perceive and evaluate environmental issues. They area combination of the following:
EcocentristsAn ecocentric viewpoint integrates social, spiritual and environmental dimensionsinto a holistic ideal. It puts ecology and nature as central to humanity andemphasizes a less materialistic approach to life with greater self-sufficiency ofsocieties. An ecocentric viewpoint prioritizes biorights, emphasizes theimportance of education and encourages self-restraint in human behaviour.
AnthropocentristsHumans must sustainably manage the global system. This might be through theuse of taxes, environmental regulation and legislation. Debate would beencouraged to reach a consensual, pragmatic approach to solving environmentalproblems.
TechnocentristsOptimistic view that technological developments can provide solutions toenvironmental problems. Scientific research is encouraged in order to formpolicies and to understand how systems can be controlled, manipulated or changedto solve resource depletion. A pro-growth agenda is deemed necessary for society’simprovement.
Ecocentrists
Anthropocentrists
Technocentrists
Deep ecologists
Self-reliant soft ecologists
Environmental managers
Cornucopians
79

CLIMATE CHANGE AND SUSTAINABILITY Sustainability
Some examples EVSs:
Deep ecologists The earth is not just for usIntrinsic importance of nature and its rights. Biorights – the right of endangeredspecies or unique landscapes to remain unmolested.
Self-reliant soft ecologists We should only use what we needEmphasis on smallness of scale and hence community identity in settlement,work, and leisure. Importance of participation in community affairs, and ofguarantees of the rights of minority interests. Participation seen as both acontinuing education and a political function.
Environmental managers Humans are the stewards of the earthBelief that we should manage the environment to allow for sustainable resourceuse through legislation, taxes and compensation for affected societies/ecosystems.
Cornucopians There are infinite resources for us to useBy using technology and inventiveness we can solve any problem, including theenvironmental one. Have a strong taith that scientific and technological expertiseprovides the basic foundation for advice on matters pertaining to economicgrowth, and public health and safety.
EVS are not fixed. They are continually shaped by cultural, religious, economic,socio-political contexts, education, experience, media, historical events, technologicaldevelopments.
For example, our general attitude to our planet has changed dramatically in the last50 years. Our awareness of our impact on the planet has created the environmentalmovement.
80

CLIMATE CHANGE AND SUSTAINABILITY Sustainability 8
Some significant events are shown in the time line below.
1962Rachel Carson’s book Silent Spring highlighted the effect of ourincreased chemical use on the environment and how they can be passedup the food chain to us.
1984Bhopal Disaster 1984. Pesticide plant released 42 tonnes of methylisocyanate (MIC) gas, immediately killing nearly 3,000 people andultimately causing at least 15,000–22,000 total deaths.
1986Chernobyl disaster. The worlds worst nuclear disaster sent radiationacross Ukraine, Belarus and Russia. The 2600 km2 site around the reactoris still unsafe.
1992 Earth Summit in Rio.
1997 Kyoto Protocol.
2006An Inconvenient Truth. Davis Guggenheim’s documentary with Al Gorehelped to make global warming widely known.
2010Deepwater horizon oil spill in the gulf of Mexico. The largest oil spillin history, it released an estimated 4.9 million barrels.
2011Fukushima Daiihi nuclear disaster, Japan, lead to many countriesrethinking their future use of nuclear power.
2012 UN conference on Sustainable developement (Rio+20).
2015 Paris Climate agreement.
81

CLIMATE CHANGE AND SUSTAINABILITY Sustainability
Sustainability tools
We can use certain tools to assess sustainability.
Environmental indicators
Factors such as biodiversity, pollution, population, or climate may be used quantitativelyas environmental indicators of sustainability. These factors can be applied on a range ofscales from local to global. The Millennium Ecosystem Assessment (initiated in 2001)gave a scientific appraisal of the condition and trends in the world’s ecosystems and theservices they provide using environmental indicators, as well as the scientific basis foraction to conserve and use them sustainably.
Environmental Impact Assessments (EIAs)
Environmental Impact Assessments (EIAs) provide decision-makers with information inorder to consider the environmental impact of a development project by incorporatingbaseline studies before the project is undertaken. It is a globally adopted frameworkbased on the USA’s National Environmental Policy act (1969). EIAs, first, assess theenvironmental, social, and economic impacts (both positive and negative) of the project.A baseline study is taken of the proposed site and then the possible impacts are modelledagainst this. Second, predictions on the scale of these potential impacts are made. Third,mitigation strategies are suggested to limit the negative impacts. They include anon-technical summary so that the assessment can be understood by all. They areusually followed by an audit and continued monitoring.
Each country or region has different guidance on the use of EIAs. They are commonlyused in planning large (intrusive) developments such as quarrying, infrastructure andlarge-scale housing. There is also no standard way of carrying out an assessment, whichmakes them hard to compare from country to county. Furthermore it is not necessarilya requirement to implement an EIA’s proposals and many socio-economic factors mayinfluence the decisions made. Other criticisms of EIAs include the lack of a standardpractice or training for practitioners, the lack of a clear definition of system boundariesand the lack of inclusion of indirect impacts.
Carrying capacity
Carrying capacity is the maximum number of a species or ‘load’ that can be sustainablysupported by a given area.
Human carrying capacity is difficult to quantify compared to other species, because ourresource use is more complicated. We use a larger range of resources and can substituteand import lacking resources. Technological developments allow use to use resourcesmore efficiently and exploit new resources. Furthermore our resource use is not justbased on individual needs but desires. It has been thought that degradation of theenvironment together with the use of finite resources would limit human populationgrowth. However technological developments have allowed us to continue to grow fornow. Perhaps it is a better strategy to examine how much land we each require, ratherthan how many that land can sustain.
82

CLIMATE CHANGE AND SUSTAINABILITY Sustainability 8
Ecological footprints
An ecological footprint is a model that makes it possible to determine whether humanpopulations are living within the carrying capacity of their environment. It is the area ofland and water required to support a defined human population at a given standard ofliving. The measure takes into account of the area required to provide all the resourcesneeded by the population, and the assimilation of all wastes. These factors are influencedby lifestyle choices (environmental value systems). A full calculation would include:
bioproductive land
bioproductive sea
energy land
built land
biodiversity
Bioproductive land – for food, materials and wasteBioproductive sea – for food and waste.Energy Land – area require to produce energy requirement with renewable energy
(even if using non-renewable energy)Built land – roads and buildingsBiodiversity land – land required to support all of the non-human speciesNon-productive land – land that we cannot use (e.g., deserts).
The assessment can be visually represented and easily understood. Ecological footprintscan be used to compare the differing environmental impact of countries and people. Ifthe ecological footprint of a human population is greater than the land area available tothe population, this indicates that the population is unsustainable and exceeds thecarrying capacity of that area. If the world was evenly divided we would each have1.8 hectares. In most MEDC, people are using 5 hectares or more.
83