Embed Size (px)
Citation preview
DOI: http://dx.doi.org/10.4314/gjer.v13i1.2
GLOBAL JOURNAL OF ENGINEERING RESEARCH VOL 13, 2014: 11-20 COPYRIGHT© BACHUDO SCIENCE CO. LTD PRINTED IN NIGERIA. ISSN 1596-292x
www.globaljournalseries.com; [email protected]
ENVIRONMENTAL IMPACT ASSESSMENT OF PETROL AND GAS FILLING STATIONS ON AIR QUALITY IN UMUAHIA, NIGERIA
OKONKWO UGOCHUKWU C., ORJI IJIOMA N. AND ONWUAMAEZE IKECHUKWU
ABSTRACT This study investigated pollutants emissions from filling stations and their impact on the air quality. Gas monitors were employed to identify the different pollutants present in the ambient air of the study areas. The results showed that the most prominent pollutants present in the ambient air are the volatile organic compounds followed by methane, then carbon monoxide. Measurements were taken at the controls at distances between 20 to 200m.The pollutants concentration recorded at the study areas showed that the level of pollutants exceeded the FEPA air quality guidelines. There are few exceptions in pollutants like the particulate matter which was found to be at concentrations within the FEPA limits. Regression analysis of the pollutants at the controls showed that only the volatile organic compounds and methane are the only significant pollutants present in the ambient air primarily because of the presence of the filling stations. These two pollutants showed a strong negative correlation with distance from the study area. While the regression curve for the volatile organic compounds (VOCs) shows a nearly perfect curve with exponential functions as its regression equations, that of methane is linear. Specifically, both VOCs and methane have a correlation coefficient (R) that is above 0.9 for the study areas. Hence a conclusion was drawn from the findings that the primary pollutant to consider when building filling station are the VOCs and methane and that the minimum safe distance to site a filling station is a distance of 80m away from residential areas. KEYWORDS: Filling Station, Pollutants, Air Quality, VOCs, Methane INTRODUCTION With the advent of industrial revolution came the demand for a better source of energy which in previous times were being provided by human and animal muscle and later by the combustion of solid fuels such as wood, peat and coal. One problem associated with the use of these solid fuels is the amount of effort geared towards harnessing the energy. Liquid petroleum on the other hand proved to be a cheaper source of energy. Oil was a much more concentrated and flexible source of energy than anything that was previously available. At the beginning of the 20
th century the industrial revolution has
progressed to the extent that the use of refined oil primarily for illumination ceased to be of primary importance. The oil industry became a major supplier of energy largely because of the advent of the automobile industry. Although oil constitutes a major petrochemical feedstock, its primary importance can be seen in the fact that it is an energy source on which the world economy depends [1]. The production and consumption of oil is vital to international relations and has frequently been a decisive factor in the determination of foreign policy From the above fact, one can see how oil has played a major role in the advancement of technology in our time. But just like every other
11
Okonkwo Ugochukwu C., Department of Mechanical Engineering, Nnamdi Azikiwe University, Awka, Nigeria.
Orji Ijioma N., Department of Mechanical Engineering, Nnamdi Azikiwe University, Awka, Nigeria.
Onwuamaeze Ikechukwu, Department of Mechanical Engineering, Petroleum Training Institute, Effurum, Warri. Nigeria.
technology, oil discovery has come with some of its disadvantages. One of such disadvantage is its negative impact on the earth’s biosphere releasing pollutants and greenhouse gases into the environment and damaging ecosystem through events such as oil spillage [2]. This situation has resulted to developed countries beginning to emphasize on a cleaner and a more environmentally friendly energy source. Nigeria with a large reserve of crude and natural gas has its energy needs met by these fossil fuels. The Nigerian economy is largely dependent on the exportation of crude. The recent population explosion in Nigeria triggered an increase in the demand for petroleum products. Here, more filling stations are being built in other to meet with the increasing demand for fuel. The situation is such that it is becoming very common to see filling stations located very close to residential areas. The disadvantage seen from this development is the increased pollution of the air caused by the continued emission of toxic gases into the air. These emissions originate from the following sources viz gasoline delivery to the stations, tank breathing which occurs due to temperature and pressure changes, during vehicle refueling, emissions from loosely closed tanks and mishandling of the petroleum leading to spillage [3]. There is also the emission of combustion products from vehicle engines present in the station. These gases that are being emitted into the atmosphere are hazardous to human health. One of the most prominent of these gases is the volatile organic compounds (VOCs) which are reported by the world health organization as the major cause of cancer in humans [4]. Numerous studies found that all types of air pollutants at high concentration can affect the airways, nevertheless, similar effects are also observed with long term exposure to lower pollutants concentrations. Symptoms such as nose and throat irritation, followed by bronchro constriction and dyspnosa especially in asthmatic individual are usually experienced after exposure to increased level of sulphur dioxide and nitrogen and certain heavy metals such as arsenic or vanadium [5, 6]. In addition particulate matter that penetrates the alveolar epithelium and initiate lung inflammation [7] in patients with lung lesions or lung diseases. Moreover, air pollutants such as nitrogen oxide increase the susceptibility to respiratory infections. The aim of this study is to investigate the pollutants that are released from the petrol stations and its negative impact on the
air quality afterwhich solutions necessary in arresting this ugly trend in other to protect the life of the general populace from the harmful effect of these pollutants will be proffered. RESEARCH METHODOLOGY In this study, three different filling stations were studied in Umuahia. These filling stations are located at different parts of Umuahia namely; Mission Hill Umuahia (U1), Hospital road (close to FMC) (U2), and Aba road (U3). Umuahia is the capital of Abia state and is located along the rail line that lies between Port Harcourt to Umuahia south and Enugu city to its north. Its coordinates is 5
032’N7
0 [8]. Equipment used in the air quality
monitoring and measurement include an AEROCET 531 particle mass monitor, a Garmin U10 map GPS equipped with a compass and an AEROQUAL Environmental gas monitor (300 series). The Aerocet 531 particle gas monitor was used in measuring the concentrations of the particulate matter. The garmin U10 map GPS measures the wind direction while the AEROQUAL environmental gas monitor measures the concentrations of products of combustion and the volatile organic compounds. Each of the filling stations was visited and the ambient air quality was measured at different point of the filling station namely; the front of the stations, the dispenser area, the generator room, and the controls. The controls are points between 20m to 200m away from each filling station. The aim of the control is to ascertain how far the pollutants travel and to determine which of the pollutants is directly present in the atmosphere as a result of the activities in the study areas. The measurements were carried out twice in each sampling point and the average used for analysis. Nine different air pollutants were measured and their data collected from each filling station. These pollutants include the suspended particulate matter (PM1, PM2.5, and TSP), carbon monoxide, Nitrogen (iv) oxide, sulphur (iv) oxide, hydrogen sulphide, methane, and volatile organic compounds. The data collected from each filling station were compared to the FEPA air quality Standard to determine whether the pollutants concentrations are within the acceptable limits.The data collected at the control were treated with regression and correlation analysis to determine the relationships that exist between the pollutant concentration and the distance from
12 OKONKWO UGOCHUKWU C., ORJI IJIOMA N. AND ONWUAMAEZE IKECHUKWU
the filling stations. Correlation coefficient was calculated in other to determine the strength of the relation that exists between distance from the filling stations and concentration of the pollutants.
RESULTS AND DISCUSSION The results of the air quality measurement at the study areas are summarized in table 1.
Table 1: Average concentration of pollutants at the study stations
Pollutants U1 mg/m3
U2 mg/m3 U3 mg/m
3
PM1 0.01 0.01 0.01
PM2.5 0.07 0.02 0.09
TSP 0.36 0.03 0.25
NO2 0.60 0.20 0.15
SO2 0.18 0.13 0.23
VOCs 152.12 89.65 56.72
H2S 0.03 0.07 0.10
CO 6.48 6.72 3.24
CH4 6.51 bdl* 7.74
*bdl - below detection limit Table 1 shows the average concentration of the pollutants at the study areas. Here the volatile organic compounds are seen to be the most prominent pollutants recorded. This because of the continuous emission of the fuel vapours into the ambient air as a result of mishandling of the fuel which may lead to spillage, the displacement of air carrying fuel from the tanks during vehicle refueling and the evaporation of fuels from loosely closed underground tanks. More VOCs were recorded at the dispensing areas and the reason is because evaporation of fuel occurs during the refueling of vehicles. There is a wide gap in the concentration of VOCs recorded at U1 (i.e. 152.12mg/m
3)
compared with that of U2 and U3 (89.65 and 56.72mg/m
3, respectively). This is because U1 is
a very busy station compared to U2 and U3 at the periods that the measurements were carried out and the direct consequence of this is that more of the pollutants will be released into the ambient air at U1 when compared with the other two.Methane was also found to be in high concentration at U1 and U3 and this comes from leakages from the storage tanks for cooking gas and evaporation during the dispensing of the gas to buyers. No trace of methane was recorded at station U2
because cooking gas was not sold in the area.
CO2 was found in high concentration in the stations especially at the generator room because of incomplete combustion of fuel in the vehicle and generator engines present in the
station. Incomplete combustion occurs as a result of faulty engines or due to lack of oxygen necessary for complete combustion. H2S, SO2 and NO2 that were recorded in the ambient air of the stations are all products of the combustion of fossil fuel in the generator and vehicle engines present in the filling stations. SO2 is found when fuel containing sulphur is burnt while NO2 is released from the engines exhaust as a result of reaction with other gases present in the exhaust and in the atmosphere. Particulate matters are dust carried by the vehicles as they gain entrance in the filling stations. It was also recorded in the generator room at high concentration owing to the release of soot from the exhaust of the generators. It is believed that particulate matter from a nearby eagle cement factory contributed to the particulate matter in the ambient air. Different particulate matters were recorded and this include the PM1, PM2.5 and the total suspended particle (TSP) which is a combination of the other grades of particulate matter. Comparing the Pollutants Concentration in Study Areas to the FEPA Air Quality Guidelines The national agency responsible for setting and maintaining environmental standard in Nigeria has stated the air quality standards/guidelines. The table 2 shows the Federal Environmental Protection Agency (FEPA) standards for the different pollutants [9].
ENVIRONMENTAL IMPACT ASSESSMENT OF PETROL AND GAS FILLING STATIONS 13
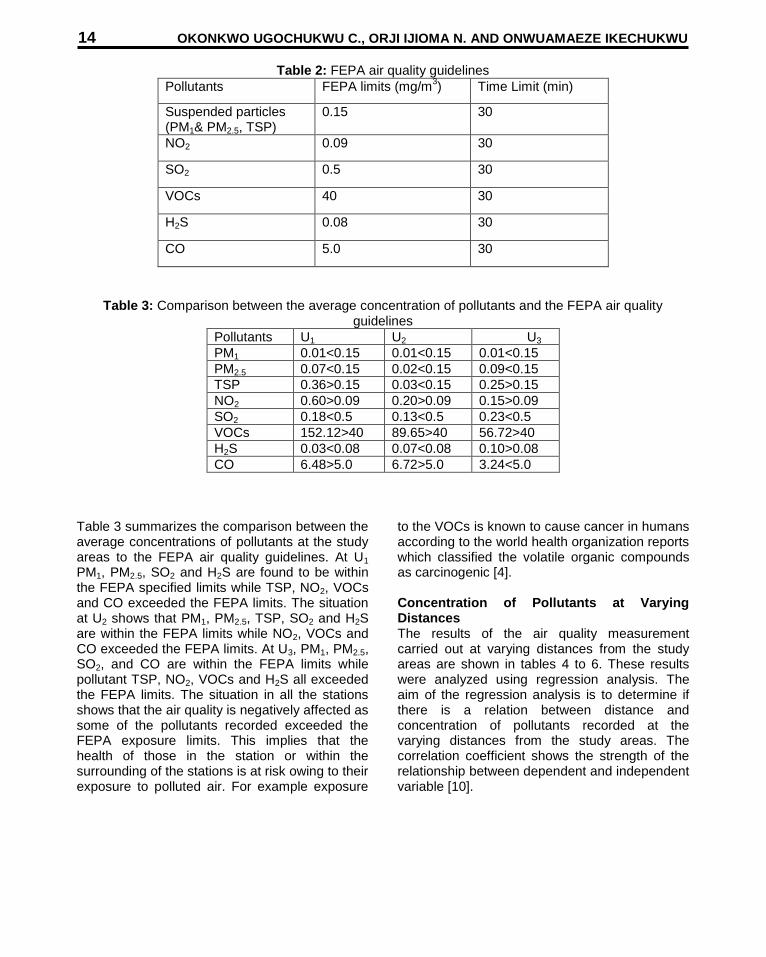
Table 2: FEPA air quality guidelines
Pollutants FEPA limits (mg/m3) Time Limit (min)
Suspended particles (PM1& PM2.5, TSP)
0.15 30
NO2 0.09 30
SO2 0.5 30
VOCs 40 30
H2S 0.08 30
CO 5.0 30
Table 3: Comparison between the average concentration of pollutants and the FEPA air quality guidelines
Pollutants U1 U2 U3
PM1 0.01<0.15 0.01<0.15 0.01<0.15
PM2.5 0.07<0.15 0.02<0.15 0.09<0.15
TSP 0.36>0.15 0.03<0.15 0.25>0.15
NO2 0.60>0.09 0.20>0.09 0.15>0.09
SO2 0.18<0.5 0.13<0.5 0.23<0.5
VOCs 152.12>40 89.65>40 56.72>40
H2S 0.03<0.08 0.07<0.08 0.10>0.08
CO 6.48>5.0 6.72>5.0 3.24<5.0
Table 3 summarizes the comparison between the average concentrations of pollutants at the study areas to the FEPA air quality guidelines. At U1
PM1, PM2.5, SO2 and H2S are found to be within the FEPA specified limits while TSP, NO2, VOCs and CO exceeded the FEPA limits. The situation at U2 shows that PM1, PM2.5, TSP, SO2 and H2S are within the FEPA limits while NO2, VOCs and CO exceeded the FEPA limits. At U3, PM1, PM2.5, SO2, and CO are within the FEPA limits while pollutant TSP, NO2, VOCs and H2S all exceeded the FEPA limits. The situation in all the stations shows that the air quality is negatively affected as some of the pollutants recorded exceeded the FEPA exposure limits. This implies that the health of those in the station or within the surrounding of the stations is at risk owing to their exposure to polluted air. For example exposure
to the VOCs is known to cause cancer in humans according to the world health organization reports which classified the volatile organic compounds as carcinogenic [4]. Concentration of Pollutants at Varying Distances The results of the air quality measurement carried out at varying distances from the study areas are shown in tables 4 to 6. These results were analyzed using regression analysis. The aim of the regression analysis is to determine if there is a relation between distance and concentration of pollutants recorded at the varying distances from the study areas. The correlation coefficient shows the strength of the relationship between dependent and independent variable [10].
14 OKONKWO UGOCHUKWU C., ORJI IJIOMA N. AND ONWUAMAEZE IKECHUKWU

Table 4: Concentration of pollutants at varying distances from U1
Pollutants Mg/m
3
Concentrations of Pollutants at Distance (m)
20 40 60 80 100 120 140 160 180 200
PM1 0.02 0.03 0.02 0.01 0.010 0.06 0.08 0.04 0.06 0.01
PM2.5 0.01 0.04 0.10 0.15 0.06 0.02 0.24 0.09 0.36 0.45
TSP 0.46 0.48 0.36 0.61 0.72 0.56 0.33 0.22 0.67 0.54
NO2 0.16 0.17 0.22 0.17 0.13 0.14 0.21 0.29 0.15 0.09
SO2 0.13 0.14 0.09 0.10 0.14 0.15 0.15 0.14 0.08 0.12
VOCs 100.67 80.32 40.43 20.43 10.17 7.87 7.66 6.98 5.42 5.00
H2S 0.03 0.03 0.02 0.06 0.07 0.03 0.06 0.04 0.04 0.01
CO 3.44 2.00 2.89 4.78 1.23 3.90 1.22 1.00 2,89 0.99
CH4 4.21 3.26 2.99 2.00 1.94 1.92 1.87 1.00 0.99 0.78
Table 5: Concentration of pollutants measured at varying distances (U2)
Pollutants Mg/m
3
Concentrations of Pollutants at Distance (m)
20 40 60 80 100 120 140 160 180 200
PM1 0.01 0.01 0.02 0.02 0.01 0.01 0.01 0.03 0.02 0.02
PM2.5 0.07 0.09 0.07 0.10 0.06 0.07 0.12 0.02 0.11 0.02
TSP 0.03 0.04 0.06 0.06 0.03 0.10 0.06 0.06 0.12 0.13
NO2 0.18 0.16 0.20 0.18 0.27 0.25 0.45 0.17 0.33 0.28
SO2 0.11 0.21 0.22 0.15 0.16 0.19 0.22 0.14 0.17 0.15
VOCs 60.23 35.23 20.43 9.35 3.91 4.76 2.96 1.99 2.74 2.77
H2S 0.14 0.11 0.20 0.13 0.17 0.24 0.32 0.09 0.31 0.45
CO 4.00 2.14 4.12 2.43 3.12 3.22 2.67 3.98 4.89 2.98
CH4 0.00 0.00 0.00 0.00 0.00 0.00 0.00 0.00 0.00 0.00
Table 6: Concentration of pollutants measured at varying distances (U3)
Pollutants Mg/m
3
Concentrations of Pollutants at Distance (m)
20 40 60 80 100 120 140 160 180 200
PM1 0.02 0.04 0.03 0.06 0.07 0.09 0.06 0.12 0.10 0.09
PM2.5 0.10 0.11 0.10 0.09 0.11 0.09 0.10 0.07 0.19 0.05
TSP 0.23 0.19 0.31 0.24 0.27 0.30 0.42 0.39 0.47 0.35
NO2 0.17 0.11 0.19 0.20 0.13 0.12 0.14 0.16 0.20 0.12
SO2 0.15 0.18 0.18 0.14 0.15 0.13 0.15 0.17 0.15 0.19
VOCs 58.65 40.34 26.23 15.23 10.45 9.45 3.23 2.45 3.78 2.44
H2S 0.14 0.11 0.20 0.13 0.17 0.24 0.32 0.09 0.31 0.45
CO 3.20 3.80 3.68 3.76 4.00 3.24 3.34 3.60 3.02 3.72
CH4 4.21 3.24 3.10 2.93 1.61 0.99 0.44 0.34 0.43 0.00
ENVIRONMENTAL IMPACT ASSESSMENT OF PETROL AND GAS FILLING STATIONS 15
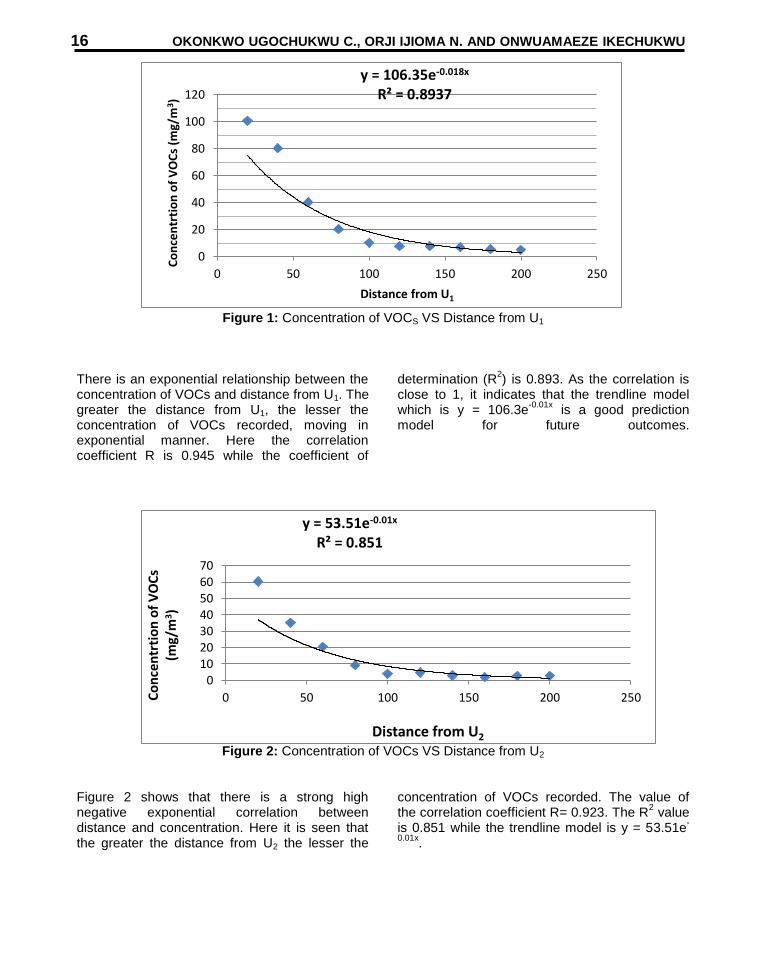
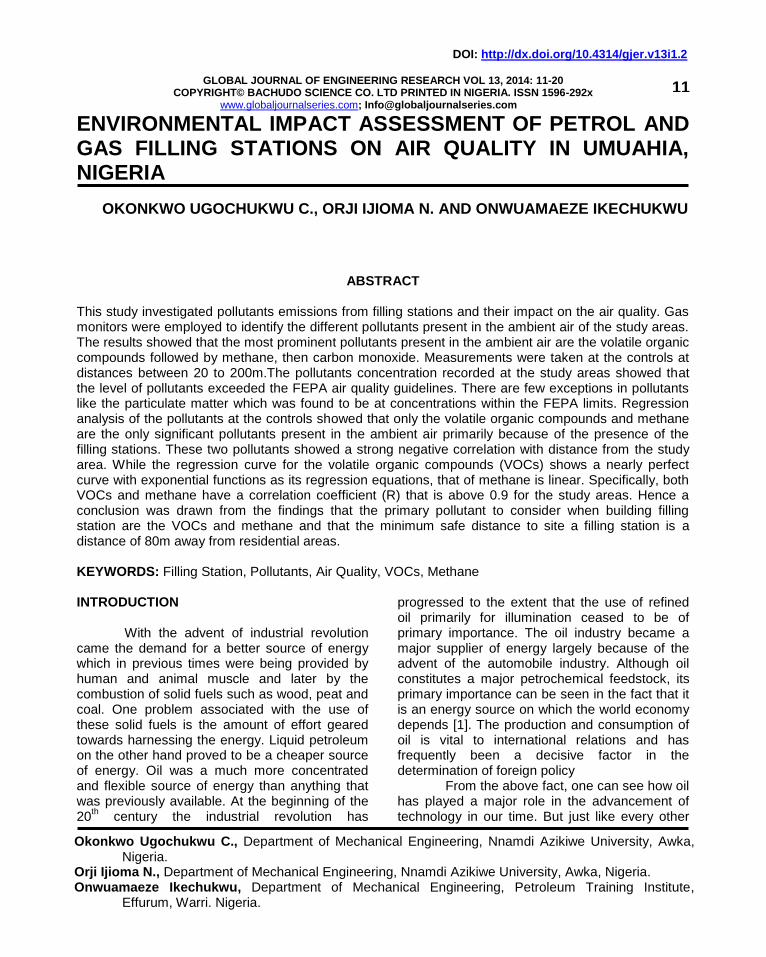
Figure 1: Concentration of VOCS VS Distance from U1
There is an exponential relationship between the concentration of VOCs and distance from U1. The greater the distance from U1, the lesser the concentration of VOCs recorded, moving in exponential manner. Here the correlation coefficient R is 0.945 while the coefficient of
determination (R2) is 0.893. As the correlation is
close to 1, it indicates that the trendline model which is y = 106.3e
-0.01x is a good prediction
model for future outcomes.
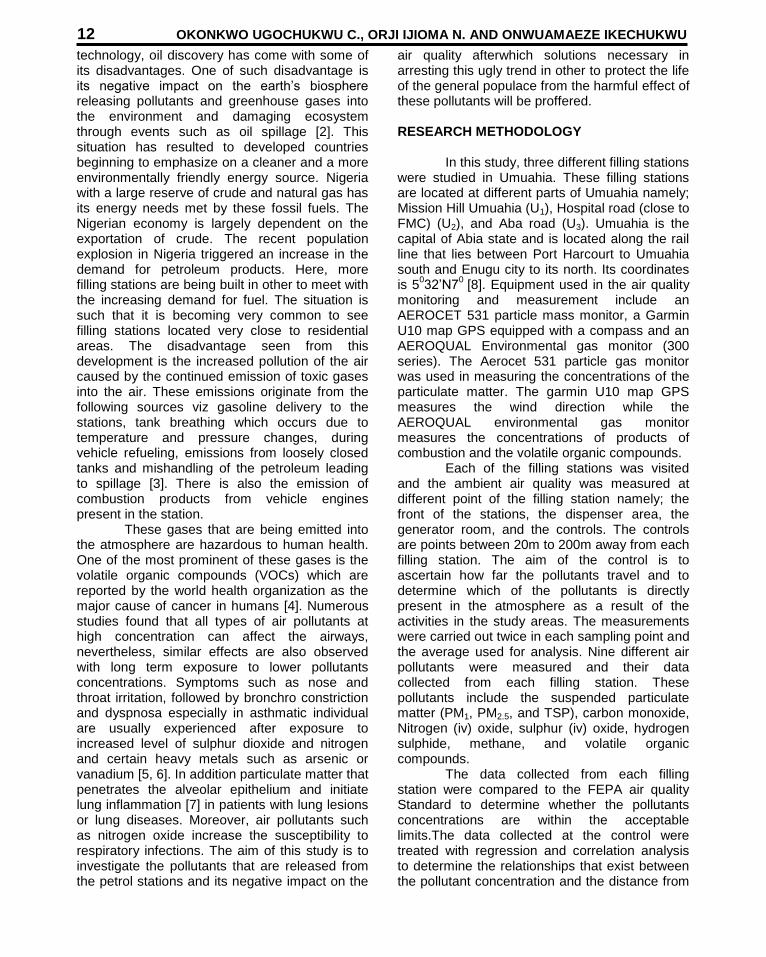
Figure 2: Concentration of VOCs VS Distance from U2 Figure 2 shows that there is a strong high negative exponential correlation between distance and concentration. Here it is seen that the greater the distance from U2 the lesser the
concentration of VOCs recorded. The value of the correlation coefficient R= 0.923. The R
2 value
is 0.851 while the trendline model is y = 53.51e-
0.01x.
y = 106.35e-0.018x R² = 0.8937
0
20
40
60
80
100
120
0 50 100 150 200 250
Co
nce
ntr
tio
n o
f V
OC
s (m
g/m
3 )
Distance from U1
y = 53.51e-0.01x R² = 0.851
010203040506070
0 50 100 150 200 250Co
nce
ntr
tio
n o
f V
OC
s (m
g/m
3)
Distance from U2
16 OKONKWO UGOCHUKWU C., ORJI IJIOMA N. AND ONWUAMAEZE IKECHUKWU
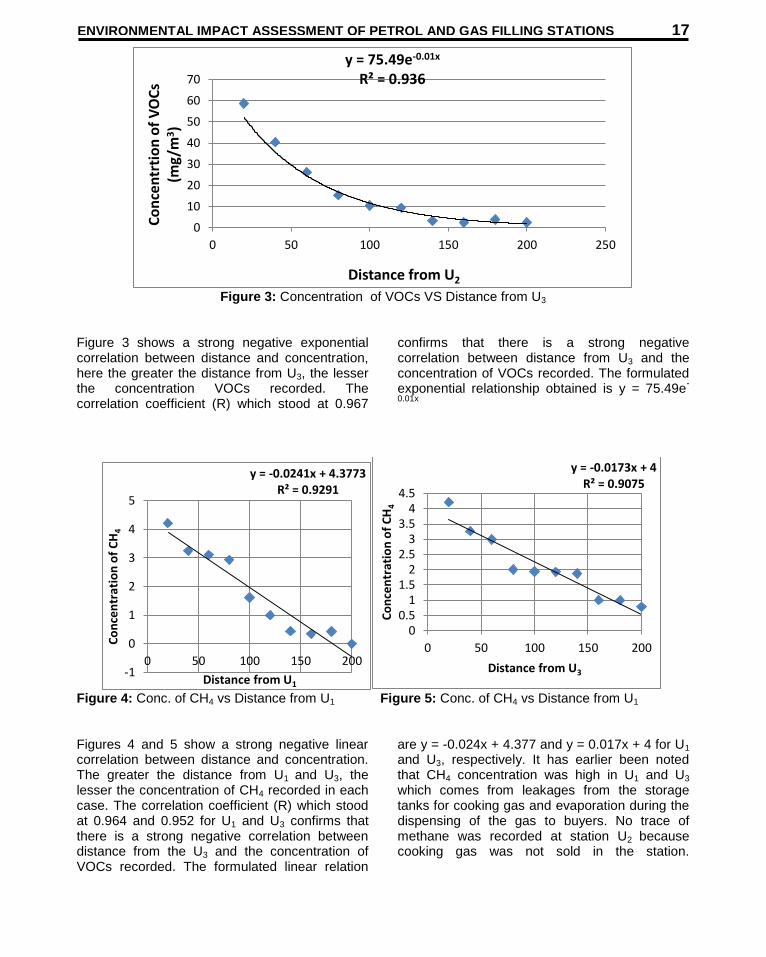
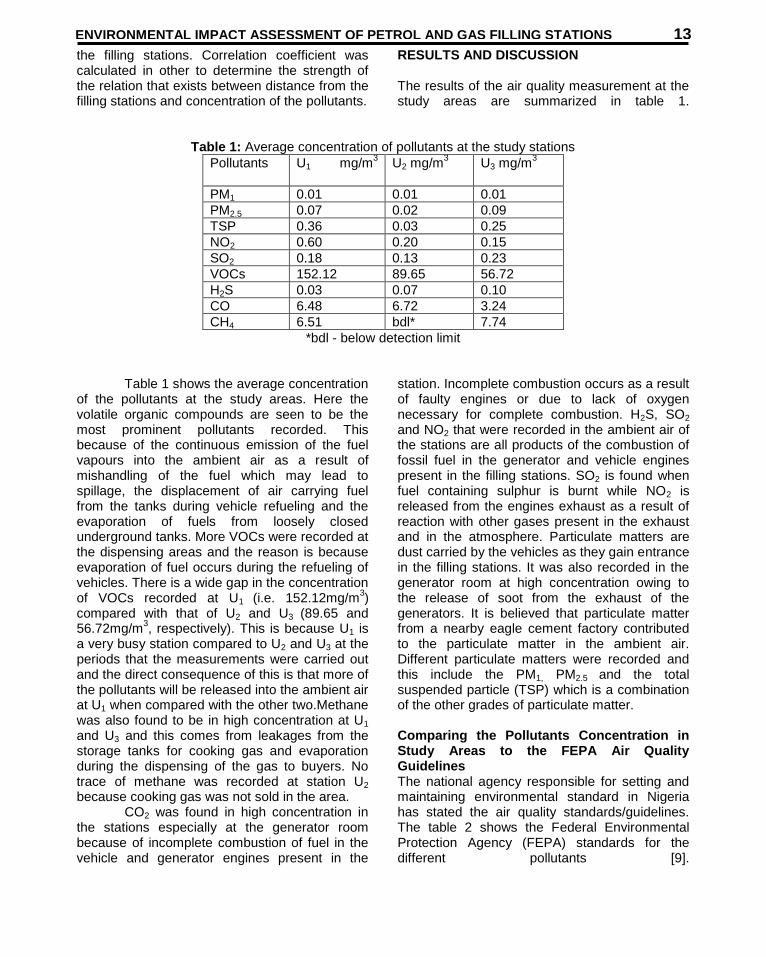
Figure 3: Concentration of VOCs VS Distance from U3
Figure 3 shows a strong negative exponential correlation between distance and concentration, here the greater the distance from U3, the lesser the concentration VOCs recorded. The correlation coefficient (R) which stood at 0.967
confirms that there is a strong negative correlation between distance from U3 and the concentration of VOCs recorded. The formulated exponential relationship obtained is y = 75.49e
-
0.01x
Figure 4: Conc. of CH4 vs Distance from U1 Figure 5: Conc. of CH4 vs Distance from U1 Figures 4 and 5 show a strong negative linear correlation between distance and concentration. The greater the distance from U1 and U3, the lesser the concentration of CH4 recorded in each case. The correlation coefficient (R) which stood at 0.964 and 0.952 for U1 and U3 confirms that there is a strong negative correlation between distance from the U3 and the concentration of VOCs recorded. The formulated linear relation
are y = -0.024x + 4.377 and y = 0.017x + 4 for U1
and U3, respectively. It has earlier been noted that CH4 concentration was high in U1 and U3 which comes from leakages from the storage tanks for cooking gas and evaporation during the dispensing of the gas to buyers. No trace of methane was recorded at station U2 because cooking gas was not sold in the station.
y = 75.49e-0.01x R² = 0.936
0
10
20
30
40
50
60
70
0 50 100 150 200 250
Co
nce
ntr
tio
n o
f V
OC
s (m
g/m
3)
Distance from U2
y = -0.0241x + 4.3773 R² = 0.9291
-1
0
1
2
3
4
5
0 50 100 150 200
Co
nce
ntr
atio
n o
f C
H4
Distance from U1
y = -0.0173x + 4 R² = 0.9075
00.5
11.5
22.5
33.5
44.5
0 50 100 150 200
Co
nce
ntr
atio
n o
f C
H4
Distance from U3
ENVIRONMENTAL IMPACT ASSESSMENT OF PETROL AND GAS FILLING STATIONS 17
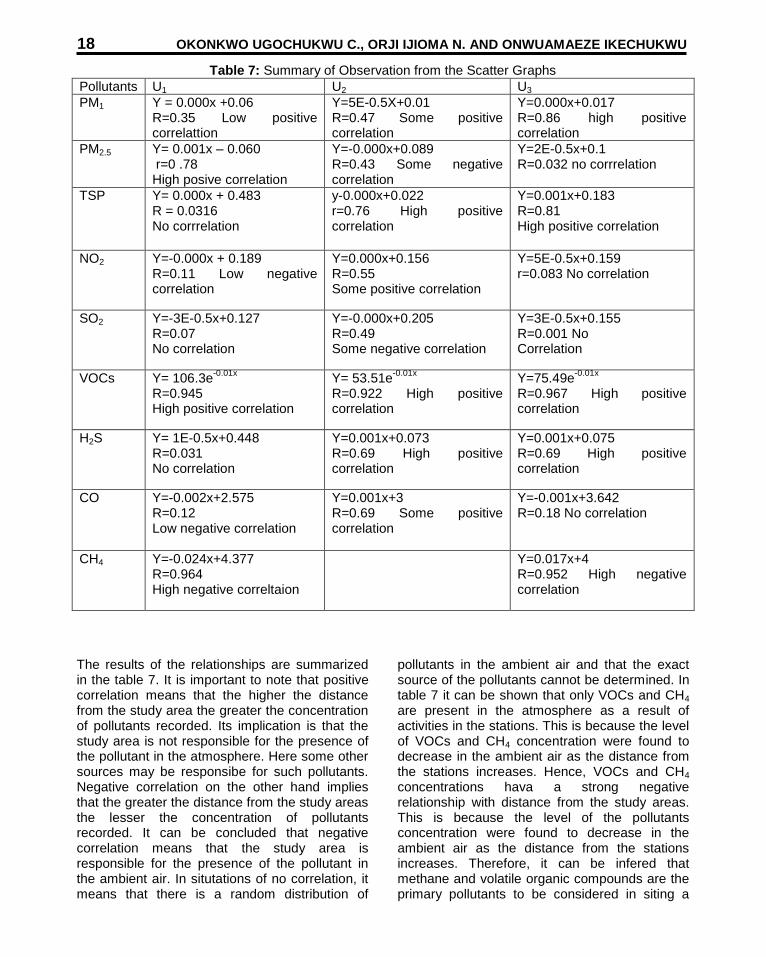
Table 7: Summary of Observation from the Scatter Graphs
Pollutants U1 U2 U3
PM1 Y = 0.000x +0.06 R=0.35 Low positive correlattion
Y=5E-0.5X+0.01 R=0.47 Some positive correlation
Y=0.000x+0.017 R=0.86 high positive correlation
PM2.5 Y= 0.001x – 0.060 r=0 .78 High posive correlation
Y=-0.000x+0.089 R=0.43 Some negative correlation
Y=2E-0.5x+0.1 R=0.032 no corrrelation
TSP Y= 0.000x + 0.483 R = 0.0316 No corrrelation
y-0.000x+0.022 r=0.76 High positive correlation
Y=0.001x+0.183 R=0.81 High positive correlation
NO2 Y=-0.000x + 0.189 R=0.11 Low negative correlation
Y=0.000x+0.156 R=0.55 Some positive correlation
Y=5E-0.5x+0.159 r=0.083 No correlation
SO2
Y=-3E-0.5x+0.127 R=0.07 No correlation
Y=-0.000x+0.205 R=0.49 Some negative correlation
Y=3E-0.5x+0.155 R=0.001 No Correlation
VOCs Y= 106.3e-0.01x
R=0.945 High positive correlation
Y= 53.51e-0.01x
R=0.922 High positive correlation
Y=75.49e-0.01x
R=0.967 High positive correlation
H2S Y= 1E-0.5x+0.448 R=0.031 No correlation
Y=0.001x+0.073 R=0.69 High positive correlation
Y=0.001x+0.075 R=0.69 High positive correlation
CO Y=-0.002x+2.575 R=0.12 Low negative correlation
Y=0.001x+3 R=0.69 Some positive correlation
Y=-0.001x+3.642 R=0.18 No correlation
CH4 Y=-0.024x+4.377 R=0.964 High negative correltaion
Y=0.017x+4 R=0.952 High negative correlation
The results of the relationships are summarized in the table 7. It is important to note that positive correlation means that the higher the distance from the study area the greater the concentration of pollutants recorded. Its implication is that the study area is not responsible for the presence of the pollutant in the atmosphere. Here some other sources may be responsibe for such pollutants. Negative correlation on the other hand implies that the greater the distance from the study areas the lesser the concentration of pollutants recorded. It can be concluded that negative correlation means that the study area is responsible for the presence of the pollutant in the ambient air. In situtations of no correlation, it means that there is a random distribution of
pollutants in the ambient air and that the exact source of the pollutants cannot be determined. In table 7 it can be shown that only VOCs and CH4 are present in the atmosphere as a result of activities in the stations. This is because the level of VOCs and CH4 concentration were found to decrease in the ambient air as the distance from the stations increases. Hence, VOCs and CH4 concentrations hava a strong negative relationship with distance from the study areas. This is because the level of the pollutants concentration were found to decrease in the ambient air as the distance from the stations increases. Therefore, it can be infered that methane and volatile organic compounds are the primary pollutants to be considered in siting a
18 OKONKWO UGOCHUKWU C., ORJI IJIOMA N. AND ONWUAMAEZE IKECHUKWU
filling station. A special interest is paid to VOCs due to reports from WHO labeling VOCs especially benzene as being a carcinogenic substance capable of causing cancer in human [4]. Finding the Safe Distance to Site a Filling Station From the result of the measurements carried out at the controls, it was discovered that VOCs and CH4 are the primary pollutants which are found in the air as a result of the activities in the filling stations. Therefore in siting a filling station, it is important that a distance is maintained between the stations and residential areas. Using the
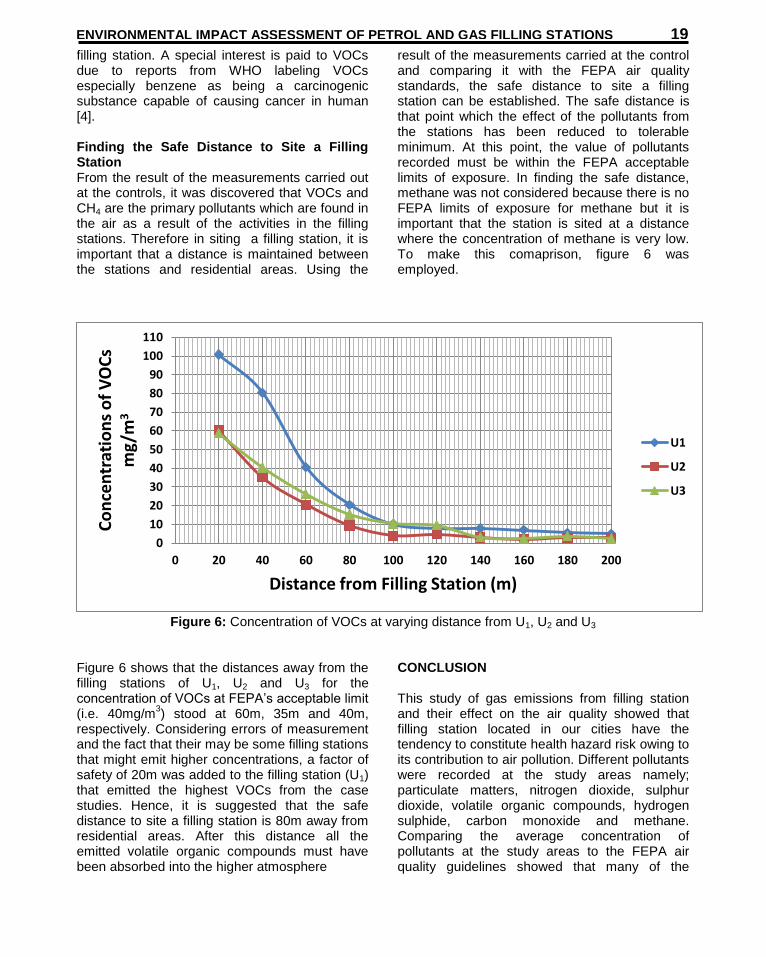
result of the measurements carried at the control and comparing it with the FEPA air quality standards, the safe distance to site a filling station can be established. The safe distance is that point which the effect of the pollutants from the stations has been reduced to tolerable minimum. At this point, the value of pollutants recorded must be within the FEPA acceptable limits of exposure. In finding the safe distance, methane was not considered because there is no FEPA limits of exposure for methane but it is important that the station is sited at a distance where the concentration of methane is very low. To make this comaprison, figure 6 was employed.
Figure 6: Concentration of VOCs at varying distance from U1, U2 and U3
Figure 6 shows that the distances away from the filling stations of U1, U2 and U3 for the concentration of VOCs at FEPA’s acceptable limit (i.e. 40mg/m
3) stood at 60m, 35m and 40m,
respectively. Considering errors of measurement and the fact that their may be some filling stations that might emit higher concentrations, a factor of safety of 20m was added to the filling station (U1) that emitted the highest VOCs from the case studies. Hence, it is suggested that the safe distance to site a filling station is 80m away from residential areas. After this distance all the emitted volatile organic compounds must have been absorbed into the higher atmosphere
CONCLUSION This study of gas emissions from filling station and their effect on the air quality showed that filling station located in our cities have the tendency to constitute health hazard risk owing to its contribution to air pollution. Different pollutants were recorded at the study areas namely; particulate matters, nitrogen dioxide, sulphur dioxide, volatile organic compounds, hydrogen sulphide, carbon monoxide and methane. Comparing the average concentration of pollutants at the study areas to the FEPA air quality guidelines showed that many of the
0
10
20
30
40
50
60
70
80
90
100
110
0 20 40 60 80 100 120 140 160 180 200
Co
nce
ntr
atio
ns
of
VO
Cs
mg/
m3
Distance from Filling Station (m)
U1
U2
U3
ENVIRONMENTAL IMPACT ASSESSMENT OF PETROL AND GAS FILLING STATIONS 19
pollutants concentration exceeded the FEPA limits of exposure. The data obtained from the controls were evaluated using regression analysis and the results showed that the major pollutant to be considered when citing filling stations is the volatile organic compounds and methane. From the regression analysis, the safe distance to site filling station is a distance of about 80m. At this distance, volatile organic compounds emitted from the station must have been evaporated into the higher atmosphere thereby eliminating the possibility of harm to people living in the residential areas. From the results of the study, it can be concluded that the air quality in our towns and villages is negatively affected due to emissions of pollutants from petrol stations into the ambient air. Therefore urgent actions should be taken to arrest this ugly trend. REFERENCES Joseph, P and Riva, J. R., 2010.The history of the words petroleum industry.1.6-7. Newyork publisher. Timothy, P. M., 2006. Health and environment effect of air pollution. USEPA publications, 23-25. Isabel, M.C., Graciela, A and Monica, R.C., 2010.Evaluating emission from gas stations. Journal of environmental management. 6.42-50.
Sergio, M., 2008.The impact of BTEX emission from gas stations into the atmosphere. Air pollution Research Journal 23.12-14. Kagawa.J., 1985.Evaluation of biological significance of nitrogen exposure. Pharmacol. 4. 199. Ghio, A. J and Huang, Y., 2004. Exposure to concentrated ambient particles.Journal of atmospheric environment. 41.1456- 1472. Chauban, A. J., Krishna, M. T and Frew, A.J., 1998.Exposure to nitrogen dioxide and respiratory disease risk.Environmental Health journal.13,73. Wikipedia., 2014. Umuahia. www.wikipedia.org/umuahia. June 2014. FEPA., 1996. Guidelines and standards for environmental protection and control. FEPA publications 12.32-33. Egbe, E., Odili, G.A andUgbebor, O.O., 2000. Further mathematics. Africana First Publishers Limited.
20 OKONKWO UGOCHUKWU C., ORJI IJIOMA N. AND ONWUAMAEZE IKECHUKWU


