Embed Size (px)
Citation preview
wwwhksharvardedu
Enrollee Choices After Their Health Plans Are Terminated Default Effects Versus Persistent Preferences Faculty Research Working Paper Series
Anna Sinaiko Harvard T H Chan School of Public Health
Richard Zeckhauser Harvard Kennedy School
December 2016 RWP16-055
Visit the HKS Faculty Research Working Paper Series at httpsresearchhksharvardedupublicationsworkingpapersIndexaspx
The views expressed in the HKS Faculty Research Working Paper Series are those of the author(s) and do not necessarily reflect those of the John F Kennedy School of Government or of Harvard University Faculty Research Working Papers have not undergone formal review and approval Such papers are included in this series to elicit feedback and to encourage debate on important public policy challenges Copyright belongs to the author(s) Papers may be downloaded for personal use only
Draft Not for Citation or Circulation
Enrollee Choices After Their Health Plans Are Terminated Default Effects Versus Persistent Preferences
Anna Sinaiko
Richard Zeckhauser
Harvard University
December 13 2016
Acknowledgements The authors gratefully acknowledge funding from the National Institute of Aging through P01 AG032952 The Role of Private Plans in Medicare We thank Alan Zaslavsky for expert guidance in estimating and implementing propensity-score-based weighting Jeff Souza and Lauren Riedel provided excellent programming and research assistance Joseph Newhouse Adam Oliver Cass Sunstein Joshua Schwarzstein and participants at the 2014 Conference on Behavioral Economics Law and Health Policy at the Petrie-Flom Center at Harvard Law School the American Society of Health Economists (ASHEcon) 5th Biennial Conference in Los Angeles CA in June 2014 and at the Academy Health 2015 Annual Research Meeting in Minneapolis MN provided useful suggestions
2
Abstract Behavioral economic research has established that defaults one form of nudge powerfully influence choices In most policy contexts all individuals receive the same nudge We present a model that analyzes the optimal universal nudge when individuals differ in their preferences different individuals should make different choices and there is a cost to resist a nudge Our empirical focus is on terminated choosers individuals whose prior choice becomes no longer available Specifically we examine the power of defaults for individuals who had enrolled in Medicare Advantage with drug coverage and had their plans discountinued Should these terminated choosers fail to actively choose another Medicare Advantage plan they are automatically defaulted into fee-for-service Medicare absent drug coverage Overall the rate of transition for TCs to FFS Medicare is low implying that original preferences and status quo bias overpowered the default Black TCs were more susceptible to the default than non-blacks Increasing numbers of Americans are choosing plans in health insurance exchange settings such as Medicare the Affordable Care Act (ACA) and private exchanges Plan exits and large numbers of TCs are inevitable along with other forms of turmoil Any guidance and defaults provided for TCs should attend to their past revealed preferences Keywords Default Effects Health Insurance Choice Health Insurance Marketplaces Status Quo Bias Nudges Optimal Nudges Medicare Advantage Affordable Care Act Medicare Terminated Plans
3
1 Introduction
The Patient Protection and Affordable Care Act (ACA) of 2010 established state and
federal insurance marketplaces Its twin objectives were to expand access to affordable high-
quality health insurance and to foster a competitive marketplace for health insurance Since the
ACArsquos implementation health insurance markets for individuals have experienced dramatic
changes including in the range of plan offerings plan affordability and impact on competition in
the marketplace (See for example Gabel et al 2014 Dafny Hendel et al 2015 Dafny Gruber
et al 2015) Product entry and exit is a natural part of any dynamic marketplace Whereas in
some markets in steady state fluctuation of product offerings may be minimal (eg pension
bond fund markets) health insurance marketplaces which rely at least in part on public
financing and regulation experience far greater turnover
Such turnover activity has become a salient side effect on ACA exchanges (Cox et al
2015 Cox and Semanskee 2016) Plan terminations stemmed from several sources For
example in 2016 12 of the 23 non-profit state-level health care cooperatives (ldquoco-opsrdquo) which
insured more than 700000 individuals (Armour 2016) and in some marketplaces had a
significant share of the market (40 market share in Colorado) exited marketplaces (King
2015) United Healthcare and Aetna two of the largest national health insurers in the US prior
to the 2016 presidential election announced their plans to exit marketplaces in 2017 impacting
up to 15 million individuals who enrolled in the two companyrsquos plans and generating additional
unrest due to significant coverage of these terminations in the national media (Cox and
Semanskee 2016 Pear 2016) At the time of this writing (in December 2016) it is impossible to
predict the future for the ACA marketplaces under President Trump and a Republican
Congress But one can confidently predict that whatever the future there will be vast numbers
of individuals whose health plans will no longer be available
Despite the earthquakes that strike health insurance markets to our knowledge there
has been no examination of the health insurance choices made by enrollees who have
4
previously made a choice that subsequently becomes unavailable We label these individuals
ldquoterminated choosersrdquo (TCs) This lack of attention to TCs contrasts sharply to the vast
literature on initial choice in public and private health insurance exchange settings TCs raise
several important underlying questions They have enrolled in health insurance in a prior
period following their plan termination will they enroll again and where If not what happens
to them How does the architecture of the insurance exchange affect these outcomes and
consumer welfare
This paper examines the impact of a critical aspect of marketplace choice architecture ndash
a terminated chooserrsquos default option ndash on ultimate plan enrollment outcomes In any decision-
making context the ldquodefault optionrdquo is a form of a nudge and is the selection that will be made
automatically if an individual fails to make an active choice In most marketplaces following
notice of plan termination enrollees can actively select a new health plan during the subsequent
open enrollment period However TCs who fail to actively choose a new plan face a default that
can range from enrollment in another selected plan random assignment to another plan or
going without insurance (no insurance)
Research has established the power of defaults for outcomes in a range of decisions
from savings and investments to organ donations (Madrian and Shea 2001 Beshears et al
2009 and Johnson and Goldstein 2003) However these studies focus overwhelmingly on how
defaults affect the decisions of individuals who are selecting options for the first time individuals
whom we label original choosers In contrast TCs represent a different set of clients because
they actively selected an option in an earlier period As such three oft-mentioned explanations
for the power of defaults (1) the presence of anxiety (Camerer et al 2005 and Frank 2007) (2)
the perception that the default is endorsed by authorities (such as financial planners personnel
officers and policy makers) who ldquoknow what is best for usrdquo (Goldstein et al 2008) and (3) the
view that the default is the status quo implying that any alternative would be a significant and
regrettable error of commission (Samuelson and Zeckhauser 1988) may apply less forcefully to
5
TCs The question of whether defaults are sufficiently powerful to strongly influence the choices
of terminated choosers is unknown
The choices of TCs in health insurance marketplaces are important for three reasons
First health insurance is increasingly offered via market-like settings (eg Medicare Advantage
and Medicare Part D ACA marketplaces private exchanges) and many health insurance plans
terminate implying that the future enrollment of TCs is an important policy issue Second
unlike the case of original choosers TCs have revealed information about their preferences for
a health plan through their prior selection When defaults differ significantly from these prior
choices TCs are tugged by two competing behavioral tendencies those tendencies linked to
defaults versus those associated with the combination of persistent preferences and status quo
bias Greater understanding of the choices TCs make under these circumstances can improve
our understanding of consumer choice dynamics in health insurance marketplaces and
probably more generally Third public health insurance marketplaces often establish defaults
for enrollees in terminated health plans In most policy contexts all individuals receive the
same default Understanding the power of defaults for TCs and by extension how to choose
appropriate defaults to maximize the welfare of TCS is important1
To address these questions this paper first presents a model that analyzes the optimal
default nudge when individuals differ in their preferences implying that different individuals
should make different choices and there may be a cost to resist a nudge We then analyze a
group of terminated choosers in a health insurance exchange setting clients in Medicare
Advantage health insurance contracts that are cancelled2
Medicare Advantage (MA) plans are private health plans in which beneficiaries can
enroll in lieu of traditional fee-for-service Medicare either when they become eligible for
1 We are here judging the effects of this nudge on the clients we are not assessing whether the health
insurance system gains or loses as a result of TC choices 2 Throughout the programrsquos history Part C has had several different names The name Medicare
Advantage dates to the Medicare Modernization and Improvement Act of 2003
6
Medicare (typically at age 65) or subsequently during annual open-enrollment periods
Although this is a different population than the one that enrolls in ACA marketplaces these
beneficiaries like ACA beneficiaries face a choice among a set of regulated plans offered at the
local level (eg county) Similarly the plans for MA and for ACA beneficiaries vary in benefit
design generosity and physician networks Also like non-group health plans MA plans
sometimes terminate either because they do not meet some new regulatory standard or
because the health insurer chooses to stop offering them usually due to expected losses going
forward Then their enrollees are terminated
If TCs of Medicare Advantage plans do not actively elect other MA plans they are
defaulted into traditional fee-for-service (FFS) Medicare One might expect defaults to
powerfully affect the choices of TCs because insurance choices involve both uncertainty and
high stakes two conditions that have been shown to intensify errors in decision-making (Frank
2007) However terminated choosers in MA at one point chose MA rather than enroll in
traditional Medicare which was also the default when they made their original choice This
choice both actively signaled their preferences for a benefits package that differs significantly
from fee-for-service Medicare and demonstrated their ability to overcome a default to make an
active choice Moreover status quo bias--the tendency of individuals to continue with a current
choice rather than switch--would also create a force that counteracts the influence of the default
In sum the expected outcome for TCs in MA is unclear when the default opposes revealed
preferences and status quo bias
This paper exploits a natural experiment Due to legislated changes in plan payment and
regulation passed in 2003 large numbers of plans exited the MA program at uneven rates
across the US in the second half of the 2000s This led large numbers of beneficiaries to
become TCs For this class of individuals we examine the competing forces of preferences
status quo bias and the default where the default nudged individuals away from the alternative
they had actively chosen for themselves in a prior period
7
This paper proceeds as follows Section 2 discusses behavioral economic theory and
the general literature on health plan choice default effects and other competing forces Section
3 presents a model analyzing the optimal default when individual preferences vary Section 4
describes the Medicare Advantage program the evidence on Medicare beneficiary plan
choices and this studyrsquos data and methods Section 5 presents our empirical analysis of
enrollment outcomes for TCs versus other MA beneficiaries Section 6 concludes
2 Health Plan Selection and Frictions Theory and Evidence
The implicit neoclassical model of consumer health-plan selection has consumers
assess the attributes of each alternative health plan including benefit coverage and limits
provider network plan quality and total cost (premium plus out-of-pocket cost as a function of
expenditures) They then select their best alternative3 While consumers cannot know their
future health care needs with any certainty they have prior beliefs about the distribution of those
needs and the costs of alternative treatments given alternative health plans Consumers are
assumed to understand the relative importance of a health planrsquos attributes and to weigh them
rationally according to their own best interests Implicitly they use a multi-attribute utility function
(Keeney and Raiffa 1976) Thus the plans they choose maximize their expected utility over the
potential states of the world A few advanced consumers will compute expected utility using a
benefit-cost approach They will enroll in the health plan where their expected net benefit
defined as expected benefit across potential states of the world less expected costs across
potential states of the world is greatest Everyday consumers will intuitively and roughly weigh
the advantages and disadvantages of alternative plans
3 Quality includes health outcome measures process measures structural measures and consumer
satisfaction scores
8
At regular intervals consumers re-evaluate their plan choices in response to changes in
plan attributes and their own health status and switch plans if better alternatives become
available Under this model consumersrsquo plan choices provide information about their
preferences among health insurance plans4
A substantial theoretical and empirical literature finds that consumers frequently behave
contrary to this model of health insurance choice This suggests in turn that some of its key
underlying assumptions are not satisfied One important deviation is that consumers have been
shown to be strongly influenced by defaults often as a result of inertia Moreover such passive
acceptance may not reflect conscious or meaningful choices Rather it may be the product of
other forces such as procrastination (Beshears et al 2008) Seminal articles find evidence of a
powerful default effect in the highly consequential area of financial planning and savings
decisions (Madrian and Shea 2001) and in organ-donation decisions (Johnson and Goldstein
2003)
The well-documented power of defaults underlies the ldquonudge approachrdquo to improving
individualsrsquo outcomes where choice architecture is designed recognizing that behavioral
decisions are likely to lead to personally suboptimal choices (Thaler and Sunstein 2009)
Nudges can take a great variety of forms By requiring a reading passage or presenting an
image before a choice is made an individual might be nudged to behave in a more moral more
generous or more long-term fashion Commercial entities frequently use such priming nudges
to get consumers to focus on particularly appealing features of their products If decisions are
of particular but often overlooked importance there might be a spotlight nudge requiring
4 More generally plan choices due to consumer preferences drive important phenomena in health
insurance markets A prime example is the adverse selection of sicker individuals into more generous plans which is a phenomenon that undermines the ability of health insurance markets to deliver care efficiently (Arrow 1963 Cutler and Reber 1998)
9
individuals to review material or participate in a conversation before making a choice Requiring
an individual to make an active choice is a mild form of spotlighting
Nudgers bring all sorts of motives when seeking to influence the decisions of others
Some are purely self interested I will be better off if I can get you to choose B rather than A
Some are purely paternalistic Choice B is better for you but you are more likely to choose A
absent my nudge Many nudges are designed to secure socially superior outcomes when
externalities are important Nudges to conserve energy or return aluminum cans fall in this
category Some nudges push toward one choice but spotlight nudges are often designed
merely to get individuals to choose more wisely for themselves
Defaults are a widely employed form of nudge For example in an effort to get
individuals to save more for retirement companies structure retirement benefits so that
employees are defaulted into automatic savings plans When this happens the vast majority
simply remain enrolled Actions by a few to escape from a default are perceived to be implicit
evidence of true preferences
Status quo bias which describes disproportionate adherence to previous choices is
another force observed to interfere with the assumptions in our simple choice model Status
quo bias was first identified as affecting health insurance choices in a study of enrollees in
employer-sponsored health plans (Samuelson and Zeckhauser 1988) Such persistence to
prior choices may reflect a quasi-rational reliance on an informal assessment of search and
transition costs combined with uncertainty about alternative options Or such persistence may
simply reflect that options change slowly and that peoplersquos preferences remain fairly consistent
However these rationalizations for persistence may not apply in many circumstances Status
quo bias also has the potential to lead clients away from rational decision processes Thus
individuals may give weight to sunk costs and use current decisions as a means to justify past
choices They may suffer an endowment effect in which something already possessed takes
on an exaggerated value They may seek to avoid regret sticking with their initial choice helps
10
them to avoid learning that that choice was poor They may weight errors of commission
(switching plans when they should not) far more than errors of omission (failing to switch when
they should) (Samuelson and Zeckhauser 1988)
In health insurance marketplaces a terminated chooser has already made a prior
choice When that choice differs substantially from the default a tug-of-war ensues for TCs
Tugging on one side is the combination of status quo bias and the persistence of the individualrsquos
original revealed preference for their health plan tugging on the other side is the default eg
the nudge The outcome is a matter of both theoretical and policy interest Moreover a nudge
that goes against an individualrsquos deliberate past choice has little normative justification We now
move from the specific to the general and present a stylized model of an optimal nudge
3 An Optimal Nudge When Preferences Vary
In the following the socially concerned nudger is taken to be male the nudgee female
Preferences Each individual has a preference between two alternatives A and B Her
preference ranges on a scale from -1 to 1 At 1 she strongly prefers A At -1 she strongly
prefers B Thus -02 would be a mild preference for B Denote the preference value by p
Nudges A nudge pushes an individual toward one alternative or the other A nudge is
calibrated on the same scale Thus a 1 is a strong nudge toward A a -1 is a strong nudge
toward B Denote the nudge value by n
Susceptibility Individuals are more or less susceptible to nudges The opposite of
susceptibility is resistance Susceptibility is measured from 0 to 1 This gives the weight to be
placed on the nudge versus the preference Denote the susceptibility value by s
The choice value C is given by
C = p(1-s) + ns (1)
Thus if s is small preference plays the predominant role if s is large n plays a major
role If C is positive then the individual picks A If it is negative she picks B In a more
11
elaborate model an error term would be added to C to represent for example behavioral
factors
Distributions in the Population Individuals differ in their preferences and their
susceptibilities to nudges For expositional ease assume independence on these two
variables though in real life that will often not be the case
The distribution of preferences is f(p) The distribution of susceptibilities is g(s)
The central question for the nudger who is seeking to maximize expected welfare taking
both direct individual utilities and societal resources into account5 is the magnitude of nudge to
use Posit that it is to be applied to the general society and that nudges must be general they
cannot be tailored to specific individuals Thus the nudger may be the government choosing a
default between Medicare and Medicare Advantage or a commercial firm trying to nudge
people on its product offerings
For expositional ease assume that the individualrsquos preference is for A but the nudger
wishes to push him toward B There are two prime cases to consider Case I occurs when
there is straight paternalism Thus the government may find that people tend to eat unhealthy
product A rather than healthier product B Representative examples would be requiring
restaurants to publish their calorie counts imposing a tax on sugar or prohibiting the sale of soft
drinks in schools
Case II occurs when the nudger has a private preference interest in the outcome quite
apart from the preferences of the individual Thus it might be a commercial company trying to
increase profits or the government trying to shuttle individuals to a health plan that is less
expensive for it to provide Under Case II the nudgers may have a further divide depending on
who is doing the nudging Presumably the commercial company would be interested solely in
its profits though it would take customer satisfaction into account to the extent that it affected
5 Of course societal resources can only come from individuals and resource expenditures would
ultimately reduce individualsrsquo utilities
12
long-term profits The government presumably would have dual goals individual satisfaction
as well as government costs Thus the government would not wish to have its nudge override
strong consumer preferences Our presentation focuses on the case where the nudger who is
seeking to maximize expected welfare has some concern with catering to consumer
preferences
Some nudges can be resisted by individuals merely by mildly resisting them Thus an
individual who has a strong preference for product A may stick with it even if advertising or
advisories or a salesman pushes them strongly towards B However to overcome some
nudges may entail an actual cost This happens frequently with defaults when for example to
overcome a default one need merely check a different box or make a single brief phone call
In other cases the process to overcome requires substantial time and effort Difficulty
overcoming a default also occurs when one has no idea of how to do so or because the time to
do so is far in the future so people do not take notice when they are defaulted (Introductory
subscriptions to a magazine which renew automatically unless you call to cancel represent a
prime example of this latter case) The costs involved in overcoming a default nudge represent
dead weight losses
Consider now the nudger who seeks the optimal nudge n to maximize expected
welfare For this illustration it will be the government The nudger knows f(p) and g(s) It also
knows that there is an unrecognized loss of k for every individual who chooses A Note k may
arise because individuals incur a health cost they ignore or because the government incurs a
financial cost if A is chosen rather than B and individuals do not internalize that cost Finally
there is a deadweight loss of d for every individual who is subjected to the nudge but still
chooses A Thus d is the cost of overcoming the nudge Both k and d are calibrated in the
same units as p The government as stated would like to maximize expected net benefits
To reiterate an individual will choose A if their C value C = p(1-s) + ns is strictly
positive (Assume that indifferent people C = 0 follow the nudge)
13
Total welfare is given by
int int (119901 minus 119896 minus 119889)119891(119901)119889119901 + int (minus119901)119891(119901) 119889119901119862lt0119862ge0
119892(119904) 119889119904119904
(2)
Thus the government will pick n to maximize (2) the expected payoff to a randomly
chosen individual
Fuller presentations will examine how n changes depending on f(p) g(s) the values of
k and d etc For example if f(p) has considerable density at high values that is lots of people
strongly like A g(s) takes on mostly modest values and if d is consequential then a strong
nudge indeed any nudge may diminish welfare This is because a large fraction of the
population will overcome the nudge and thus incur consequential cost d
Many additional factors would enter an optimal nudge model For example it would
seem plausible of course that the cost of overcoming a nudge would depend on the magnitude
of the nudge that d would be an increasing function of |n| If so as d increases the optimal
nudge would diminish6
An optimal nudge might change over time Say that you nudge a population once
Some people follow the nudge Others do not Presumably nudge followers are
disproportionately individuals with low values of p though some with higher values of p but also
high values of s will also be nudged
If nothing changed of course a second nudge of the same value would have no effect
This would not be the case if there is error in computing C7 so that an individual who usually
would have switched did not do so the first time Alternatively p and s might drift around a bit
say following a random walk so a second-round nudge would change behavior Even in light of
6 Two factors lead to this result First as d increases the benefits of switching the marginal individual
diminish Second the cost to those not switching increases A reduction in nudge is beneficial on both grounds 7 If the nudge were a default for example the individual might have missed the opportunity to ldquocorrectrdquo it
Thatrsquos how magazines make money by offering really cheap introductory subscriptions
14
these possibilities we would still expect those who resisted the nudge initially to be
disproportionately high in p
Under reasonable regularity conditions this high p result for initial resisters would imply
that for this group the optimal nudge would be weaker the second time around A greater
percentage of the folks who would be subject to it would optimally stick with choice A The
converse also applies In a situation where people had to choose a second time the optimal
nudge for those who initially succumbed would be increased
We now turn to apply this broad framework for nudges to the particular empirical
problem of defaults for TCs in health insurance markets We examine the results of a nudge of
TCs from Medicare Advantage through a default to Traditional Medicare where TCs can only
overcome that nudge if they make an active choice back to MA We first describe Medicare
Advantage in more detail and then examine that problem empirically
4 Study Context Data and Methods
41 Medicare Advantage
One of the most consequential choices an elderly person can make is whether to enroll
in traditional Medicare which provides fee-for-service health insurance or in a Medicare
Advantage plan which gives beneficiaries a choice among private health plans that offer
benefits that are at least actuarially equivalent to traditional Medicare89 The Medicare
enrollment process typically favors traditional Medicare as evidenced by the way beneficiaries
8 During the initial enrollment period of seven months around onersquos 65
th birthday beneficiaries who
choose to join traditional Medicare are defaulted into Part A (hospital insurance) they have the options to enroll in Part B (physician services) and Part D (prescription drug coverage) Delaying enrollment in Part B andor Part D results in late-enrollment penalties The majority of beneficiaries in traditional Medicare also enroll in a private Medicare supplemental plan during this period (for example Medigap) thus covering the co-pays and deductibles that are not covered by traditional Medicare 9 Beneficiaries choose among MA plans offered in the service area in which they live usually their county
There are some exceptions for enrollees in MA plans who either move temporarily or move into a planrsquos designated ldquocontinuation areardquo
15
are defaulted into the hospital insurance component of the program (known as Part A) and by
the way information is presented in the Medicare and You package10 Unlike traditional
Medicare most MA plans are managed-care plans in which beneficiaries accept access to a
limited physician network and also accept having their care managed (through prior
authorization and gatekeeping) in exchange for more generous benefits However some MA
plans are private fee-for-service plans MA plans can offer prescription drug coverage through
Medicare Part D (MA-PD plans) or not (MA-only plans)
The availability of MA plans has ebbed and flowed over the programrsquos history Prior to
2003 most MA plans were offered by Health Maintenance Organizations (HMOs) From 1997-
2003 following the passage of Balanced Budget Act of 1997 many plans were terminated
Enrollment in MA fell dramatically from 16 of Medicare beneficiaries in 1999 to 12 in 2002
In many cases a return to traditional Medicare was the only option facing these TCs as
approximately 20 of TCs in during this time had no other MA plan available after their plan
exited (Gold et al 2004)
In 2003 the Medicare Modernization and Improvement Act increased payment rates
paid to MA plans The result was that for the rest of the decade the average MA plan payment
was 12 to 14 percent higher per beneficiary than the estimated cost of coverage for similar
people in traditional Medicare (MedPAC 2010) From 2003-2008 these higher payments
coupled with regulatory provisions led to the establishment of plans offering richer benefit
packages than traditional Medicare These more favorable plans offered reduced out-of-pocket
costs (OOPC) alongside extra benefits (MedPAC 2007 MedPAC 2009) As would be expected
the supply of MA plans in terms of the number and variety of options such as Preferred
10
For example the 2015 materials explain that there is a choice between traditional Medicare and Medicare Advantage in Section 1 titled ldquoLearn how Medicare Worksrdquo However information about Medicare Advantage and its plans doesnrsquot come until page 75 of the Medicare and You booklet (which is Section 5) after ldquoSigning Up for Medicare Parts A amp Brdquo (Section 2) ldquoFind out if Medicare covers your test service or itemrdquo (Section 3) and ldquoWhatrsquos Original Medicarerdquo (Section 4)
16
Provider Organization (PPO) plans and Private Fee-for-Service (PFFS) plans expanded
substantially Like HMOs PPOs are managed-care plans that restrict physician networks
PFFS plans from the period of 2003-2008 were very similar to traditional Medicare offering fee-
for-service coverage but without imposing any provider restrictions In the most recent era of
the Medicare program (since 2006) beneficiaries have been able to switch their coverage
options during the open enrollment period each year (typically starting in mid-October and
lasting six weeks) Beneficiaries in traditional Medicare can elect to switch their prescription
drug plans within traditional Medicare or to switch from traditional Medicare into MA
Beneficiaries in MA can shift across MA plans or switch into traditional Medicare
From 2008 forward the total number of MA plans decreased for a few reasons The
Patient Protection and Affordable Care Act (ACA) of 2010 reduced payments to MA plans
relative to traditional Medicare This legislative measure led some HMO and PPO plans to exit
the market (Afendulis et al 2012) The anticipated payment reductions along with provisions in
the Medicare Improvements for Patients and Providers Act (MIPPA) of 2008 that imposed a
network requirement on PFFS plans made such plans less attractive fewer were offered
Some counties experienced much greater rates of MA plan exits than others though in contrast
to the earlier era in the late 1990s beneficiaries in all counties continued to have access to at
least one MA plan of each plan type from 2007-2010 (MedPAC 2011) Importantly for the
purposes of our study these plan exits were not likely to have been driven by demand-side
behavior (for example by lack of beneficiary demand for MA) In fact MA enrollment continued
to grow steadily through November 2015 (MedPAC 2016) the latest date available
42 Medicare Beneficiary Plan Choice
A growing body of evidence reveals behavior suggesting that some Medicare
beneficiaries enroll in a plan that is suboptimal for them A significant example is status quo
bias in the Medicare market Individuals who decide to enroll in MA tend to remain in the
program over long periods of time Yet few enrollees in traditional Medicare switch into MA
17
(Sinaiko et al 2013 Afendulis et al 2014) In theory this could merely be because the enrollees
in MA and traditional Medicare had different preferences or health risks However the Sinaiko
analysis shows that beneficiaries who remain in traditional Medicare forgo significant savings in
the sum of premiums and out-of-pocket costs an example of what we label ldquomoney-wasting
Medicare beneficiaries being elderly and often unhealthy may often face diminished decision-
making and cognitive capabilities (Hanoch and Rice 2006 Agarwal et al 2008) placing them at
higher risk for biased or inadvertent and therefore possibly poor choices In a changing world
such as the medical marketplace the simplest poor choice to make with an expensive
purchase such as medical insurance is to fail to contemplate the choices and simply to
continue with the current plan
Choice can be impaired in other ways McWilliams et al (2011) find evidence consistent
with ldquochoice overloadrdquo They show that rates of enrollment in MA increased as plan choices
increased up to 15 then plateaued with 16 to 30 plan choices and then declined when
beneficiaries had more than 30 choices available The current authors find as well that
beneficiaries with reduced cognitive function as would be expected were less responsive than
their peers to the generosity of MA benefits when choosing between traditional Medicare and
MA
In the Medicare Part D program a beneficiary chooses among prescription drug plans in
an exchange setting Ketcham et al (2012) and Ketcham et al (2015) use longitudinal data to
demonstrate that at least some Part D enrollees were able to improve their choices in their
second third and fourth year of the program particularly when the potential gains from
switching plans were high They identify this evidence in a complex choice environment which
suggests that these beneficiaries had strong existing preferences for Part D plans However
money-wasting choices in Part D defined as plans that do not roughly minimize the sum of a
beneficiaryrsquos premiums plus out-of-pocket costs for a given level of risk have been observed in
significant numbers among all enrollees and among TCs specifically These inferior choices
18
arise in part because beneficiaries over-value plan premiums relative to all out-of-pocket costs
when making their selections (Abaluck and Gruber 2011 Abaluck and Gruber 2013) Low rates
of Part D enrollment by those eligible to enroll and receive the low-income subsidy a program
that makes this drug coverage and prescription drugs essentially free to beneficiaries reflect
obvious and extreme money-wasting choices (Kuye et al 2013)
The existing literature on Medicare describes a variety of factors that interfere with plan
selection and switching including status quo bias choice overload strongly disparate weighting
of different elements of cost and straightforward money-wasting It also discusses beneficiary
characteristics that make them susceptible to these behavioral biases In this regard the
evidence suggests that TCs are among those making the most effective choices in the Medicare
program First TCs consciously chose to enroll in MA in at the outset rather than accept the
traditional Medicare default thereby demonstrating their preference for receiving health
insurance through a MA plan Second a higher proportion of MA as opposed to traditional
Medicare clients enroll in Medicare Part D which offers prescription drug coverage at heavily
subsidized rates and thus reflects an effective choice Given these facts we would expect TCs
to be less susceptible than most to a default into TM
43 Data
We obtained data from the Centers for Medicare and Medicaid services (CMS) on the
entire population of elderly (age 65+) Medicare beneficiaries in the United States who were
enrolled in an MA plan that included prescription drug coverage (known as an MA-PD plan) for
the years 2006-201111 Henceforth for ease of exposition when we refer to Medicare
Advantage or MA plans or clients we mean MA-PD enrollees
11
Due to data limitations (described in more detail below) we were only able to distinguish a plan exit from a plan merger or a consolidation in MA-PD plans Therefore we excluded MA-only plans from this analysis
19
We excluded beneficiaries who became eligible for Medicare due to disability those
dually eligible for Medicaid the long-term institutionalized and those enrolled with an insurer
outside of their county of residence We also excluded enrollees in Medicare Advantage -
employer plans and Special Needs Plans (SNPs) because these beneficiaries face significantly
different enrollment choices and incentives Finally to focus the analysis on the plan choices
and outcomes in locales with robust MA marketplaces we restricted the analysis to
beneficiaries who lived in the 200 US counties with the largest elderly populations and who were
enrolled in the three most common types of MA contracts HMOs PPOs and PFFS This
sample included 17651389 elderly-person-year observations The data included information
on beneficiariesrsquo dates of birth genders races (black or non-black) zip codes of residence the
MA contracts in which they were enrolled and whether they continued to be enrolled in MA or
switched to traditional Medicare in each month of the study period
Generally insurers contract with Medicare to offer a specific type of plan (HMO PPO or
PFFS) in a county but many insurers offer multiple plans with different names and variable
benefits under each contract Our data included identifiable contract-level but not plan-level
enrollment information for each beneficiary The data also included an encrypted plan-level ID
for each beneficiary which importantly for this study allowed us to link to information on market-
level plan changes at the county level (such as consolidations mergers exits or no change)
Because we did not have information on the default options for beneficiaries whose MA plans
went through a merger or consolidation we dropped these beneficiaries (24 of observations)
from our analysis Our final study sample following this exclusion included 17226866 person-
year observations
44 Cohorts
We analyzed the characteristics and transitions of TCs over three pairs of years 2006-
2007 2009-2010 and 2010-2011 We did not examine transitions in 2007-2008 or 2008-2009
20
because very few MA contracts terminated in those intermediate years as a consequence they
provided too few TCs to study
Our study group of TCs includes all beneficiaries in our sample who were enrolled in a
plan and MA-PD contract that was offered in their county of residence in the first year of the
period but that was no longer offered in the second year12 We conducted this analysis at the
contract level for two reasons First contract exits often leave beneficiaries without a substitute
nearly identical to the terminated plan which is not the case with plan exits13 Second we know
the default for these clients namely enrollment in traditional Medicare
We analyzed the choices of two other types of MA beneficiaries in our sample voluntary
switchers and stayers Voluntary switchers are those who chose to either switch to a new MA
contract or switch into traditional Medicare although their prior MA contract continued to be
available had they wanted to stay enrolled in it Stayers are beneficiaries who did not act during
open enrollment and therefore by choice or by inaction were re-enrolled the following year in
their existing plan Both voluntary switchers and stayers faced circumstances different from
those of terminated choosers given that TCs had no choice but to switch plans Finally we
also examined the choices of original choosers who were beneficiaries who turned 65 in the
12
MA plans that are exiting a market must notify beneficiaries 60 days before the end of the year that their coverage will end on December 31
st of that year Exiting plans must inform beneficiaries that they
can change to TM or choose another MA plan from a provided list of plans available in the service area The beneficiaries remain in the Medicare program regardless of what they choose Beneficiaries have from the time they are notified until approximately two months after their coverage ends to make these elections though enrolling by December 31
st ensures no interruption in coverage Beneficiaries electing
to return to traditional Medicare will have neither prescription drug coverage nor any Medicare supplemental coverage (Medigap) to pay the costs that traditional Medicare doesnrsquot cover unless they actively choose to enroll in those plans at that time Beneficiaries who do not enroll in Part D at that time will incur a financial penalty if they later choose to do so 13
When a single plan within a contract exits a beneficiary may have a choice of another plan offered by the same carrier under the same contract that offers covered benefits cost-sharing requirements and physician networks strikingly similar to the exiting plan We would expect choices made by these TCs who have very similar alternatives available to consciously choose MA more than others Unfortunately we cannot observe when this circumstance occurs in our data Moreover in some cases these TCs might be defaulted into the similar plan alternative still available within their existing contract We thus restrict the analysis to TCs in plans for which the entire contract is terminated where staying in MA requires that these TCs select a plan in a new contract and where the default if they fail to make a choice is to be enrolled in traditional Medicare
21
second year of the two-year period and who then enrolled in MA or traditional Medicare for the
first time the latter perhaps due to a default into traditional Medicare
45 Descriptive Analyses
First we present descriptive statistics on the enrollment outcomes for these four groups
TCs voluntary switchers stayers and original choosers and their rates of switching into
traditional Medicare and their rates of switching into different types of MA contracts for HMO
enrollees in 2006-07 for HMO enrollees in 2009-10 and for PFFS enrollees in 2009-10 In
2010 the widespread exit of PFFS contracts created many TCs However due to data
limitations we could not observe the types of MA contracts in which voluntary switchers and
TCs enrolled in 2011 neither could we examine the choices across plans for beneficiaries who
remained in MA in 2011 Therefore we only examined transitions from MA to traditional
Medicare during the 2010-2011 period both by TCs and by voluntary switchers
46 Statistical Analyses
Terminated choosers differ from voluntary switchers and from stayers because TCs but
for the termination of their plan would have included both stayers and voluntary switchers
Given the termination we cannot distinguish between these two types in enrollment claims data
Comparing TCs to either group alone would be an unfair comparison
To identify as best possible appropriate comparisons for the choices of terminated
choosers and to bring balance to our terminated and comparison populations we used a
weighting approach that uses a propensity score approach (Hirano and Imbens 2001 and Kurth
et al 2006) to account for observable differences between terminated choosers and non-
terminated choosers (including both voluntary switchers and stayers) and to bring the non-
terminated chooser population into balance with the terminated choosers We then analyzed
differences in plan outcomes between this weighted comparison group of non-terminated
choosers and the outcomes for terminated choosers
22
This approach first employs a logit model to estimate the propensity for being a
terminated chooser on the basis of age gender race (black or not) and county We control for
county because plan payment rates are set at the county level and thus could affect a health
planrsquos propensity to withdraw and therefore a beneficiaryrsquos probability of being a terminated
chooser Moreover because all residents within a county face the same plan choices our
results are not driven by differences in underlying plan choice sets facing TCs and non-TCs14
To account for changes in payments and differences in preferences for insurance plan types
models were run separately by year and MA plan type (HMO or PFFS) We applied the
coefficients from this model to the data to estimate the probability p that each beneficiary in a
non-terminated contract would be a terminated chooser We then generate a set of weights
where each terminated chooser was assigned a weight equal to 1 and non-terminated
choosers were assigned a weight of (p1-p) (Hirano and Imbens 2001 and Kurth et al 2006) 15
The weighted distributions of characteristics of terminated and non-terminated choosers are
identical (see Appendix) and weighted analyses therefore adjust for potential confounding due
to the individual characteristics included in the propensity score models16
We compared weighted rates of enrollment into traditional Medicare and into MA overall
Among beneficiaries who remained in MA we compared rates of enrollment across types of MA
plans (MA-HMO MA-PPO and MA-PFFS) Statistical significance was assessed using
Pearsonrsquos chi-square test We also compared differences in rates of enrollment in Part D plans
among beneficiaries who switched into traditional Medicare
14
Beneficiaries in counties that did not experience any plan terminations were excluded from the analysis 15
In instances where the number of terminated choosers (the treatment population) was greater than the number of non-terminated choosers (the control population) estimating propensity-score weights in this population would result in a loss in efficiency Due to the dramatic changes in the PFFS market that began in 2009 this circumstance arose for the PFFS market in a subset of our study counties during the 2009-2010 study period Therefore we restricted the 2009 PFFS models to include only counties where there were at least as many non-terminated choosers as terminated choosers 16
Others have applied this methodology to analyze the impact of health insurance on health care utilization and on health care spending (see for example McWilliams et al 2007 Zhang et al 2009)
23
5 Results
51 Beneficiary switching and descriptive transitions
Over the period 2006-2010 nearly 233000 beneficiaries in MA plans became TCs17
TCs were similar in age gender and race to both voluntary switchers and stayers but were
much more likely to have been enrolled in their MA contracts for a shorter duration one year or
less (Table 1) The vast majority of the MA contract exits examined occurred in 2006 2009 and
2010 The yearly proportion of MA enrollees who switched out their plan increased over the
study period from 88 to 138 and the majority of switchers each year were voluntary
switchers (Table 2) Voluntary switchers were more likely than TCs to transition from MA to
traditional Medicare following each of those years (Table 3)
Tables 4a and 4b present unadjusted descriptive data on the transitions of TCs and all
other types of beneficiaries voluntary switchers stayers and original choosers Considering
transitions in 2006-2007 (Table 4a) TCs in all plan types were much less likely to transition to
traditional Medicare than were voluntary switchers moving out of the same plan types The
transition numbers are 52 vs 195 for HMO enrollees 150 vs 249 for PPO enrollees
25 vs 416 for PFFS enrollees--though this last category had a very small sample size
Among beneficiaries who were in an MA-HMO in 2006 TCs were more likely to enroll in a PFFS
plan than were voluntary switchers Together voluntary switchers and TCs who stayed in MA
were more likely to enroll in a non-HMO plan than were either stayers (column 7) or original
choosers who chose MA (column 8)
By contrast in 2009 when significant numbers of PFFS plans first exited from MA
markets TCsrsquo higher rate of remaining in MA as compared to voluntary switchers was driven by
terminated choosers in PFFS plans In 2009 a large proportion of terminated choosers had
17
This figure includes TCs created in all five years of the entire period though 98 occurred in 2006 2009 and 2010
24
originally enrolled in PFFS plans In comparison with voluntary switchers from PFFS in 2009
TCs were dramatically more likely to stay in MA in 2010 (850 vs 418 Table 4b column 5
vs 6) Another large group of terminated choosers in 2009 had originally enrolled in a PPO
plan Here we observe the one instance in which a larger proportion of these beneficiaries
transitioned to traditional Medicare than did voluntary switchers from this plan type (353 vs
161 Table 4b column 3 vs 4) TCs in MA-HMO plans were slightly less likely to transition to
traditional Medicare than were voluntary switchers from MA-HMO plans (154 vs 172)
Again we observe from 2009-2010 as we did from 2006-2007 that both voluntary switchers
and TCs who stayed in MA were more likely to enroll in a non-HMO plan than were stayers
(column 7) and original choosers who chose MA (column 8)
52 Statistical Analyses
It is not possible to draw appropriate inferences about the impact of default policies and
the effects of terminated plans simply based on the results from Section 51 That is because
neither voluntary switchers nor stayers nor original choosers constitute an appropriate
comparison group for TCs This section presents results on plan enrollment outcomes of TCs
versus those for a sample of non-terminated choosers that includes both voluntary switchers
and stayers where members of that sample were weighted according to their propensity for
being in a terminated plan thereby creating balance between the two groups
TCs in our pooled sample were more likely to transition to traditional Medicare than were
non-terminated choosers (111 vs 26 plt0001) (Table 5) This pattern holds both among
TCs who were originally enrolled in HMOs and those originally enrolled in PFFS Medicare
Advantage plans TCs were three times more likely to move to traditional Medicare from MA-
HMO contracts in 2006 twelve times more likely to move to traditional Medicare from MA-HMO
contracts in 2009 and twice as likely to move to traditional Medicare from MA-PFFS contracts in
2009
25
Multiple forces could contribute to these dramatic disparities One possibility is that
status quo bias among individuals whose plans survived led them to stick with their plan going
forward A second is that some TCs were affected by the default into traditional Medicare when
traditional Medicare may or may not have been their second choice We incline to status quo
bias of the non-terminated choosers being the principal explanation as that grouprsquos members
only switched to traditional Medicare 26 of the time The switch percentage for TCs to
traditional Medicare was 111 implying that the default was hardly determinative
53 Further analysis of quality of choices and susceptibility to nudges
TCs who transitioned from MA to traditional Medicare were a distinct minority No doubt
some of these transitions were voluntary but some may have been influenced by the default
into traditional Medicare If so this should be reflected in the differential likelihood that these
two groups of TCs chose to enroll in a plan with prescription drug coverage That is because
prior to their plan termination all TCs in our sample had selected a Medicare Advantage plan
that included a prescription drug plan Traditional Medicare with Part D or a new Medicare
Advantage plan with Part D is much closer to being actuarially equivalent to their plan prior to
their termination than is traditional Medicare without Part D However traditional Medicare
without Part D is the default TCs who move into Traditional Medicare must actively enroll in a
Part D plan if they are to have prescription drug coverage Given their original choices and the
heavy subsidies of Part D we conclude that those TCs transitioning to traditional Medicare
without Part D probably made a mistake and suffered expected monetary losses
We compared the rates of enrollment in a Part D plan among TCs (Table 6) First the
top panel shows that among all TCs those moving to traditional Medicare were significantly
more likely to fail to enroll in a Part D plan than were their peers who actively chose to stay in
MA (206 vs 17)
The second panel shows the population of TCs who transitioned to Traditional Medicare
Beneficiaries who were male were more likely to fail to enroll in Part D than were women (240
26
vs 192 plt0001) as were beneficiaries who were black vs non-black (387 vs 202
plt0001) Failing to enroll in a Part D plan decreases with age and with median household
income of the zip code in which beneficiaries reside
6 Discussion
This study investigates the phenomenon of a policy-imposed default versus the forces
promoting consistent choices among terminated choosers in health insurance markets The
evidence shows that the default policy associated with contract terminations in Medicare
Advantage had a moderate impact on the transitions of beneficiaries in terminated plans from
MA to traditional Medicare TCs were more likely to be enrolled in traditional Medicare in the
year following their plan terminations than were non-terminated choosers However a very
large percentage of TCs took specific action to select new MA plans following their initial planrsquos
termination Their active choices to remain in MA likely stemmed from the same preferences
that were operating when they originally reviewed the available plans and deliberately chose
MA The persistent preferences of these individuals were perhaps reinforced by status quo
bias which has been shown to exist for some combination of rational and irrational reasons
among Medicare beneficiaries
The majority of TCs who transitioned into traditional Medicare from 2009-2010 also
showed their ability to choose contrary to a default Roughly three quarters of them took the
active step to enroll in the Part D benefit The remaining quarter of TCs transitioning to
traditional Medicare following their plan termination failed to take up a Part D plan an outcome
in contrast to their prior selection of a MA plan with Part D suggesting some susceptibility to
nudges Those most susceptible were more likely to be black male younger and to live in a zip
code with lower median household income The finding that susceptibility decreases with age is
a bit surprising given that aging is associated with cognitive decline which inhibits decision-
making However working in opposition and presumably prevailing is the fact that older
27
beneficiaries presumably are more likely to need more prescription drugs and thus benefit more
from Part D coverage
Typically default rules are used to nudge people away from making errors that might
otherwise occur in complex high-stakes choice environments (for example with 401K plan
enrollment) and where the experts are in relatively widespread agreement on which alternative
is superior The default nudge studied here differs dramatically from more traditional policy
nudges for two reasons First there is no evidence that it was actively designed to promote
superior choices for individuals In fact the lack of automatic enrollment in Part D leaves
beneficiaries who accepted the default substantially worse off in expectation than they would be
if they had been able to stay in their prior plan Second this nudge pushes individuals towards
an option that is quite different than what they had chosen in a prior period These two features
of the default and therefore their implications for consumer welfare differ from the vast majority
of nudges reported in previous literature
Why does Medicare include this default Given that Medicare Advantage costs the
government more and that Part D coverage is heavily subsidized one possible justification
would be that a successful nudge would save the government money But surely that
consideration should be weighed against having beneficiaries choose against their preferred
plans And any government that gets into the business of such nudges has to worry about
hurting its overall legitimacy Rather the specified default for TCs in Medicare Advantage is
likely in place because it mirrors the default for original choosers in the Medicare program
which is traditional Medicare and it is the most administratively simple to implement
However the specified default of TCs to traditional Medicare fails to make use of
information about beneficiariesrsquo revealed preferences among plans A second MA plan is likely
28
more similar to the original choice than TM in several consequential ways (eg covered
benefits cost-sharing requirements) hence likely to be better suited to the client18
Smart defaults which take into account individual starting positions preferences or
expected needs have been suggested as an alternative to the ldquobenignrdquo default discussed thus
far in this paper (Smith et al 2009) Smart defaults have begun to be used in other public
programs19 and have been shown to have the potential to achieve large savings for enrollees in
Medicare Part D (Zhang et al 2015)20
Because of differences in physician networks across health plans smart defaults would
add administrative complexity but they would be feasible For example in Medicare a smart
default system could analyze the degree of overlap in physician networks across MA plans in an
area it could then use MA as the default if the overlap reached a certain threshold below the
threshold the default would be TM An even more sophisticated algorithm could consider the
physicians the individual has previously used and at a more advanced level could even include
information about recent diagnoses and the implications for appropriate health-care coverage
The success of these default alternatives would be revealed if we observed that relatively few
TCs chose against them
More generally the outcomes for terminated choosers in other health-insurance
exchange settings should be examined Nearly 13 million individuals have enrolled in health
plans through state or federal health-insurance marketplaces created under the ACA These
18
By analogy consider if one had to choose a new car default for an individual who was trading in an SUV that was no longer made An SUV default would more likely meet his preferences than a sedan 19
For example the California demonstration project to Integrate Care for Dual Eligible Beneficiaries (the Cal MediConnect program) is passively enrolling individuals into health plans using an ldquointelligent assignmentrdquo process that analyzes the individualrsquos recently used providers and matches those providers to the physician networks of participating plans Individuals will be passively enrolled in the plan that best meets their current circumstances prioritizing continuity of care There is a 90-day period when individuals can change plans or opt-out (California Department of Health Care Services 2014) 20
Zhang et al simulate an ldquointelligent assignmentrdquo algorithm that would assigning Medicare beneficiaries with schizophrenia who are eligible for a low-income subsidy to the least expensive Part D prescription drug plan based on their prior year drug use instead of random assignment to any plan (the current policy) and project savings on average of $387 per beneficiary
29
include many different types of clients those who were previously insured in individual
insurance plans and who presumably have considerable experience selecting plans and
navigating the market and those who were previously uninsured and who likely have very little
experience with health insurance The effects of default policies following plan terminations
across these different types of enrollees could differ dramatically In some ACA marketplaces
TCs who fail to select a new option for coverage lose their health insurance coverage
altogether an outcome that is clearly sub-optimal relative to their prior choice In 2017
enrollees in terminated plans purchased through federally-facilitated marketplaces may be
automatically enrolled in a new plan (generally the lowest-cost plan of the same product network
type) if they donrsquot choose a new plan or actively opt-out of the marketplace (Jost 2016)
Plan enrollment decisions are very consequential for individuals Increasing numbers of
Americans are choosing plans in health insurance exchange settings such as Medicare the
Affordable Care Act (ACA) and private exchanges and turmoil and large numbers of TCs are
inevitable Whether terminated choosers in these exchanges select and enroll in new plans and
how their responses vary based on default policy and previous insurance status health status
and other characteristics are matters of great policy consequence Any guidance and defaults
provided for TCs should attend to their past revealed preferences
30
Table 1 Characteristics of Stayers vs Terminated Choosers vs Voluntary switchers
MA-PD enrollees in the 200 largest counties in the US 2006 ndash 2010
Stayers Terminated Choosers Voluntary Switchers
n (person-years) 15590641 232538 1403687
Female 584 573 558
Black (vs non-black) 79 77 91
Age
65-69 279 353 318
70-74 257 253 251
75-79 219 185 199
80-84 149 124 135
85+ 97 86 98
Years enrolled in plan (prior to switch)
lt1 131 408 270
1 135 184 191
2 106 124 145
3+ 627 285 389
Expected OOPC $284 $350 $279
Premium $135 $171 $132
Base year
2006 2684837 29283 194292
2007 2888710 3184 193470
2008 3217796 1745 207787
2009 3280679 57591 388048
2010 3518619 140735 420090
Source Authors analysis of Medicare enrollment data Sample includes beneficiaries who gained eligibility
and were not disabled Excludes beneficiaries in employer-sponsored plans and non-HMO PPO and PFFS plans
Excludes beneficiaries in contracts that experienced a merger or consolidation
Stayer = did not switch out of MA-PD contract
Terminated chooser = switched out of MA-PD contract not offered in county in subsequent year
Voluntary switchers = switched out of MA-PD contract offered in county in subsequent year
In contract switching from Excludes 2006 (data not available)
31
Table 2 MA-PD switching rates 2006-2010
Switchers who are Switch Terminated Voluntary Year Beneficiaries Contracts Choosers Switchers
2006 2908412 88 114 886 2007 3085364 66 16 984 2008 3427328 63 08 992 2009 3726318 122 132 869
2010 4079444 138 251 749
Authorsrsquo analysis of Medicare enrollment data in the 200 US counties with the largest elderly populations
Sample = 17226866 person-years
32
Table 3 Transitions from MA-PD to TM
Among beneficiaries Percent moving to TM
Year Terminated Choosers Voluntary Switchers
2006-07 67 202 2009-10 238 257
2010-11 221 456
Source Authors analysis of Medicare enrollment data
33
Table 4a Beneficiary transitions and enrollment outcomes 2006-07
MA-HMO MA-PPO MA-PFFS
Original Choosers
Terminated choosers
Voluntary switchers
Terminated choosers
Voluntary switchers
Terminated choosers
Voluntary switchers Stayers
(age 65) in 2007
(1) (2) (3) (4) (5) (6) (7) (8)
N 25040 171167 4239 22406 4 719 2684837 164857
Into TM in 2007 52 195 150 249 250 416 00 na
In MA in 2007 948 805 850 751 750 584 1000 na
Within MA
MA-HMO 618 598 341 442 00 417 951 819
MA-PPO 13 176 558 259 00 76 44 131
MA-PFFS 369 142 93 274 1000 445 05 50
MA-Other 00 84 08 25 00 62 00
Table 4b Beneficiary transitions and enrollment outcomes 2009-10
MA-HMO MA-PPO MA-PFFS
Original choosers
Terminated
choosers Voluntary switchers
Terminated choosers
Voluntary switchers
Terminated choosers
Voluntary switchers Stayers
(age 65) in 2010
N 3919 238793 24986 66605 28686 82650 3280679 229608
Into TM in 2010 154 172 353 161 150 582 00 na
In MA in 2010 846 828 647 839 850 418 1000 na
Within MA
MA-HMO 620 687 564 504 308 440 883 761
MA-PPO 218 256 373 420 366 477 96 205
MA-PFFS 158 31 54 68 325 82 22 34
MA-Other 04 26 92 77 01 02 00
34
Table 5 Enrollment outcomes for terminated choosers vs weighted comparison group1
Terminated Weighted
choosers comparison group
Enrollment in next year
Study Sample overall TM 111 26
MA-HMO 464 838
MA-PPO 128 25
MA-PFFS 295 110
Stratified by year and plan type
Enrollment in 2007
TM 52 13
MA-HMO in 2006 MA-HMO 582 968
MA-PPO 13 02
MA-PFFS 352 16
Enrollment in 2010
TM 154 13
MA-HMO in 2009 MA-HMO 524 963
MA-PPO 185 18
MA-PFFS 133 06
Enrollment in 2010
TM 175 79
MA-PFFS in 2009 MA-HMO 305 152
MA-PPO 258 120
MA-PFFS 261 650
Notes Study sample includes terminated choosers (enrollees in terminated HMO plans in 2006
or 2009 or in terminated PFFS plans in 2009) and propensity-score based weighted
comparison group of non-terminated choosers) 1
All differences in distribution of enrollment across plan types are statistically significant
at plt0001
35
Table 6 Susceptibility to nudges Proportion of Terminated Choosers (TCs)
who did NOT select a Part D plan
Did not enroll in Part D
()
All TCs with plan termination in 2009 TCs who chose a new MA plan 17 TCs who went into traditional Medicare 206
Did not enroll in Part D
()
TCs with plan termination in 2009 or 2010 who went into traditional Medicare
Male 240 Female 192
Black 387 Non-Black 202
Age group 65-69 238
70-74 207
75-79 206 80-84 198 85+ 164
Distribution of Median HH income in zip code First quartile (lowest median HH income) 245 Second quartile 206
Third quartile 204
Fourth quartile (highest median HH income) 192
Source Authors analysis of Medicare enrollment data
Predicted enrollment based on logistic regression model controlling for age gender race (black or non-black) median HH income in
zip code of residence and year Sample size 44286 TC=terminated chooser
36
References Abaluck J and J Gruber Choice Inconsistencies among the Elderly Evidence from Plan Choice in the Medicare Part D Program American Economic Review 2011 101 (4) 1180ndash210 Abaluck J and Gruber J Evolving Choice Inconsistencies in Choice of Prescription Drug Insurance NBER Working Paper 19163 June 2013 Afendulis CC Landrum MB Chernew ME The Impact of the Affordable Care Act on Medicare Advantage Plan Availability and Enrollment Health Services Research 2012 47(6) 2339-2352 Afendulis CC Sinaiko AD Frank RG Dominated Choices and Medicare Advantage Enrollment NBER Working Paper no20181 2014 Agarwal S Driscoll J Gabaix X and Laibson D The age of reason Financial decisions over the lifecycle In American Law and Economic Association Annual Meetings 2008 Armour S Republicans Question Viability of Co-Ops Wall Street Journal (online) [New York NY] 25 Feb 2016 Arrow K Uncertainty and the welfare economics of medical care American Economic Review 1963 53(5) 941-973 Beshears J J J Choi D Laibson and B C Madrian 2008 How Are Preferences Revealed Journal of Public Economics 92 (8ndash9) 1787ndash94 Beshears J J J Choi D Laibson and B C Madrian The Importance of Default Options for Retirement Savings Options In Brown Liebman and Wise eds Social Security Policy in a Changing Environment Chicago IL University of Chicago Press 2009 p 167-195 Camerer C Loewenstein G and Prelec D Neuroeconomics How Neuroscience can Inform Economics Journal of Economic Literature 2005 43(1)9-64 Cox C Claxton G Levitt L ldquoAnalysis of Insurer Participation in 2016 Marketplacesrdquo Kaiser Family Foundation Issue Brief Nov 03 2015 httpkfforghealth-reformissue-briefanalysis-of-insurer-participation-in-2016-marketplaces (Accessed on Apr 20 2015) Cox C and Semanskee A ldquoAnalysis of UnitedHealth Grouprsquos Premiums and Participation in ACA Marketplacesrdquo Kaiser Family Foundation Issue Brief April 18 2016 Cox C and Semanskee A ldquoPreliminary Data on Insurer Exits and Entrants in 2017 Affordable Care Act Marketplacesrdquo Kaiser Family Foundation Data Note August 2016 Cutler D and Reber S Paying for health insurance the trade-off between competition and adverse selection Quarterly Journal of Economics 1998 113(2) 443-466 Dafny L Hendel I and Wilson N ldquoNarrow Networks on the Health Insurance Exchanges What Do They Look Like and How Do They Affect Pricingrdquo The American Economic Review 105(5) 110-114 Dafny L Gruber J and Ody C ldquoMore Insurers Lower Premiums Evidence from Initial Pricing in the Health Insurance Marketplacesrdquo The American Journal of Health Economics 2015 1(1) 53-81
37
Frank RG (2007) Behavioral Economics and Health Economics In Behavioral Economics and Its Applications Diamond P and Vartiainen H (Eds) Princeton Princeton University Press Gabel JR Whitmore H Stromberg S et al ldquoAnalysis Finds No Nationwide Increase in Health Insurance Marketplace Premiumsrdquo Commonwealth Fund Blog [blog on the Internet] 2014 Dec 22 [cited 2016 Apr 20] Available from httpwwwcommonwealthfundorgpublicationsblog2014deczero-inflation-nationwide-for-marketplace-premiums Gold M Achman L Mittler J and Stevens B 2004 ldquoMonitoring Medicare+Choice What Have We Learned Findings and Operational Lessons for Medicare Advantagerdquo Washington DC Mathematica Policy Research Doct No PR04-43 Goldstein D G E J Johnson A Herrmann and M Heitman ldquoNudge Your Customers Toward Better Choicesrdquo Harvard Business Review December 2008 99-105 Hanoch Y and T Rice Can Limiting Choice Increase Social Welfare The Elderly and Health Insurance Milbank Quarterly 2006 84 (1) 37ndash73 Hirano Keisuke and Imbens Guido W Estimation of causal effects using propensity score weighting An application to data on right heart catheterization Health Services and Outcomes Research Methodology 2001 2259-278 Johnson EJ and Goldstein DG Do Defaults Save Lives Science 2003 3021338-1339 Jost T Updated Renewal and Discontinuation Notices Auto-Reenrollment And Other ACA Developments Health Affairs Blog September 5 2016 wwwhealthaffairsorg (accessed December 4 2016) Keeney RL and Raiffa H Decisions with Multiple Objectives Preferences and Value Trade-offs Cambridge [England] New York NY Cambridge University Press 1976 Ketcham JD Lucarelli C Miravete EJ and Roebuck MC Sinking Swimming or Learning to Swim in Medicare Part D American Economic Review 2012 102(6) 2639-2673 Ketcham JD Lucarelli C and Powers CA Paying Attention or Paying Too Much in Medicare Part D American Economic Review 2015 105(1) 204-233 King R Colorado to Close Obamacare Co-Op Washington Examiner (online) October 16 2015 Kowalski A The Early Impact of the Affordable Care Act State by State Brookings Papers on Economic Activity Economic Studies Program The Brookings Institution vol 49(2 (Fall 2014)) pages 277-355 Kurth T Walker AM Glynn RJ et al Results of multivariable logistic regression propensity matching propensity adjustment and propensity-based weighting under conditions of nonuniform effect Am J Epidemiol 163262-270 2006 Kuye IO Frank RG McWilliams JM Cognition and Take-Up of Subsidized Drug Benefits by Medicare Beneficiaries JAMA Intern Med 2013 doi101001jamainternmed2013845
38
La Monica PR ldquoUnitedHealthcare to Exit Most Obamacare Exchangesrdquo CNN Money April 19 2016 httpmoneycnncom20160419investingunitedhealthcare-obamacare-exchanges-acaindexhtml (Accessed April 20 2016) Madrian B C and D F Shea 2001 The Power of Suggestion Inertia in 401(k) Participation and Savings Behavior Quarterly Journal of Economics 1161149ndash87 McWilliams J M C C Afendulis T G McGuire and B E Landon 2011 Complex Medicare Advantage Choices May Overwhelm SeniorsmdashEspecially Those with Impaired Decision Making Health Affairs 30 (9) 1786ndash94 McWilliams J M J Hsu and J P Newhouse 2012 New Risk-adjustment System Was Associated with Reduced Favorable Selection in Medicare Advantage Health Affairs 31 (12) 2630ndash40 McWilliams JM Meara E Zaslavsky AM Ayanian JZ Use of health services by previously uninsured Medicare beneficiaries New England Journal of Medicine 2007a357143-53 PMID 17625126 Medicare Payment Advisory Commission 2000 Report to the Congress Improving Risk Adjustment in Medicare Washington DC Medicare Payment Advisory Commission Medicare Payment Advisory Commission 2007 Report to Congress Medicare Payment Policy Washington DC Medicare Payment Advisory Commission Medicare Payment Advisory Commission 2009 Report to the Congress Improving Incentives in the Medicare Program Washington DC Medicare Payment Advisory Commission Medicare Payment Advisory Commission 2010 Report to Congress Medicare Payment Policy Washington DC Medicare Payment Advisory Commission Medicare Payment Advisory Commission 2011 Report to Congress Medicare Payment Policy Washington DC Medicare Payment Advisory Commission Medicare Payment Advisory Commission 2016 Report to Congress Medicare Payment Policy Washington DC Medicare Payment Advisory Commission Newhouse J P M Price J Huang J M McWilliams and J Hsu 2012 Steps to Reduce Favorable Risk Selection in Medicare Advantage Largely Succeeded Boding Well for Health Insurance Exchanges Health Affairs 31 (12) 2618ndash28 Pear R Some Policies Get More Time in Health Shift The New York Times March 6 2014 p A1 Pear R Aetna to Pull Back From Public Health Care Exchanges The New York Times August 16 2016 Physician Payment Review Commission Annual Report to Congress 1996 Washington DC Physician Payment Review Commission
39
Riley G and C Zarabozo Trends in the Health Status of Medicare Risk Contract Enrollees Health Care Financing Review 2006 28 (2) 81ndash95 Samuelson W and R Zeckhauser Status Quo Bias in Decision Makingrdquo Journal of Risk and Uncertainty 1988 17ndash59 Sinaiko AD Afendulis CC and Frank RG Enrollment in Medicare Advantage Plans in Miami-Dade County Evidence of Status Quo Bias Inquiry 2013 Smith CN Goldstein D Johnson EJ Smart defaults From hidden persuaders to adaptive helpers (Working Paper INSEAD 2009) available at httppapersssrncomezp-prod1hulharvardedusol3paperscfmabstract_id=1116650 Thaler R and Sunstein C Nudge Improving Decisions about Health Wealth and Happiness (New York NY Penguin Books 2009) Zhang Y Baik SH and Newhouse JP Use of Intelligent Assignment to Medicare Part D Plans for People With Schizophrenia Could Produce Substantial Savings Health Affairs 2015 34(3) 455-460 Zhang Y Donohue JM Lave JR ODonnel G Newhouse JP The Effect of Medicare Part D on Drug and Medical Spending N Engl J Med 2009 36152-61
40
Appendix A1 Medicare Advantage contract-level out-of-pocket cost data We obtained previously determined estimates of the out-of-pocket costs (OOPC) including premiums associated with each MA-PD plan option The Centers for Medicare and Medicaid Services (CMS) calculated these estimates by taking medical utilization data for a standard population of Medicare beneficiaries and applying the coverage and cost-sharing rules specific to each plan to these utilization data to determine the average monthly out-of-pocket costs expected for a beneficiary enrolling in that plan21 These calculations were conducted separately for five self-reported health-status groups and for six age groups To merge these estimates with our contract-level enrollment data for each age group in each county in a given year we averaged OOPC estimates for the five health-status groups within plans and then averaged the OOPC plan estimates for all plans under a given MA-PD contract We applied county contract-level enrollment data to calculate an enrollment-weighted average OOPC of being in an MA-PD contract for each age group and year for all contracts available in each county
21
The standard population was a two-year sample of TM-enrolled respondents to the Medicare Current Beneficiary Survey This estimate assumes that the quantity of services consumed does not vary with the differing cost-sharing rules across the MA plans
41
A2 Demographic Characteristics of Terminated and Non-Terminated Choosers
2006 HMO
Unweighted Weighted Non-Terminated Terminated Non-Terminated Terminated
N 2723831 21953 2723831 21953 black 80 25 24 25 male 414 393 389 393
a7074 273 303 302 303
a7579 231 252 253 252 a8084 152 147 150 147
a85 90 86 87 86 a7074male 118 123 121 123 a7074black 24 07 06 07 a7579male 97 104 103 104 a7579black 17 07 07 07 a8084male 59 54 54 54 a8084black 10 04 04 04
a85male 31 28 28 28 a85black 06 02 02 02
2009 HMO
Unweighted Weighted Non-Terminated Terminated Non-Terminated Terminated
N 3133379 3919 3199973 3919 black 85 125 123 125
male 417 443 445 443 a7074 252 255 256 255 a7579 219 190 189 190 a8084 152 120 120 120
a85 101 73 73 73 a7074male 109 115 116 115 a7074black 24 31 31 31 a7579male 93 81 80 81 a7579black 18 25 25 25 a8084male 61 52 52 52 a8084black 11 10 10 10
a85male 35 26 26 26 a85black 07 06 06 06
42
2009 PFFS
Unweighted Weighted Non-Terminated Terminated Non-Terminated Terminated
N 148736 17852 148736 17852 black 65 73 70 73 male 424 433 437 433
a7074 242 249 249 249 a7579 193 163 161 163
a8084 135 106 105 106 a85 85 62 61 62
a7074male 107 110 111 110 a7074black 17 21 20 21 a7579male 82 71 71 71 a7579black 13 12 12 12 a8084male 54 41 41 41 a8084black 08 07 07 07
a85male 28 20 20 20 a85black 05 04 04 04
10
them to avoid learning that that choice was poor They may weight errors of commission
(switching plans when they should not) far more than errors of omission (failing to switch when
they should) (Samuelson and Zeckhauser 1988)
In health insurance marketplaces a terminated chooser has already made a prior
choice When that choice differs substantially from the default a tug-of-war ensues for TCs
Tugging on one side is the combination of status quo bias and the persistence of the individualrsquos
original revealed preference for their health plan tugging on the other side is the default eg
the nudge The outcome is a matter of both theoretical and policy interest Moreover a nudge
that goes against an individualrsquos deliberate past choice has little normative justification We now
move from the specific to the general and present a stylized model of an optimal nudge
3 An Optimal Nudge When Preferences Vary
In the following the socially concerned nudger is taken to be male the nudgee female
Preferences Each individual has a preference between two alternatives A and B Her
preference ranges on a scale from -1 to 1 At 1 she strongly prefers A At -1 she strongly
prefers B Thus -02 would be a mild preference for B Denote the preference value by p
Nudges A nudge pushes an individual toward one alternative or the other A nudge is
calibrated on the same scale Thus a 1 is a strong nudge toward A a -1 is a strong nudge
toward B Denote the nudge value by n
Susceptibility Individuals are more or less susceptible to nudges The opposite of
susceptibility is resistance Susceptibility is measured from 0 to 1 This gives the weight to be
placed on the nudge versus the preference Denote the susceptibility value by s
The choice value C is given by
C = p(1-s) + ns (1)
Thus if s is small preference plays the predominant role if s is large n plays a major
role If C is positive then the individual picks A If it is negative she picks B In a more
11
elaborate model an error term would be added to C to represent for example behavioral
factors
Distributions in the Population Individuals differ in their preferences and their
susceptibilities to nudges For expositional ease assume independence on these two
variables though in real life that will often not be the case
The distribution of preferences is f(p) The distribution of susceptibilities is g(s)
The central question for the nudger who is seeking to maximize expected welfare taking
both direct individual utilities and societal resources into account5 is the magnitude of nudge to
use Posit that it is to be applied to the general society and that nudges must be general they
cannot be tailored to specific individuals Thus the nudger may be the government choosing a
default between Medicare and Medicare Advantage or a commercial firm trying to nudge
people on its product offerings
For expositional ease assume that the individualrsquos preference is for A but the nudger
wishes to push him toward B There are two prime cases to consider Case I occurs when
there is straight paternalism Thus the government may find that people tend to eat unhealthy
product A rather than healthier product B Representative examples would be requiring
restaurants to publish their calorie counts imposing a tax on sugar or prohibiting the sale of soft
drinks in schools
Case II occurs when the nudger has a private preference interest in the outcome quite
apart from the preferences of the individual Thus it might be a commercial company trying to
increase profits or the government trying to shuttle individuals to a health plan that is less
expensive for it to provide Under Case II the nudgers may have a further divide depending on
who is doing the nudging Presumably the commercial company would be interested solely in
its profits though it would take customer satisfaction into account to the extent that it affected
5 Of course societal resources can only come from individuals and resource expenditures would
ultimately reduce individualsrsquo utilities
12
long-term profits The government presumably would have dual goals individual satisfaction
as well as government costs Thus the government would not wish to have its nudge override
strong consumer preferences Our presentation focuses on the case where the nudger who is
seeking to maximize expected welfare has some concern with catering to consumer
preferences
Some nudges can be resisted by individuals merely by mildly resisting them Thus an
individual who has a strong preference for product A may stick with it even if advertising or
advisories or a salesman pushes them strongly towards B However to overcome some
nudges may entail an actual cost This happens frequently with defaults when for example to
overcome a default one need merely check a different box or make a single brief phone call
In other cases the process to overcome requires substantial time and effort Difficulty
overcoming a default also occurs when one has no idea of how to do so or because the time to
do so is far in the future so people do not take notice when they are defaulted (Introductory
subscriptions to a magazine which renew automatically unless you call to cancel represent a
prime example of this latter case) The costs involved in overcoming a default nudge represent
dead weight losses
Consider now the nudger who seeks the optimal nudge n to maximize expected
welfare For this illustration it will be the government The nudger knows f(p) and g(s) It also
knows that there is an unrecognized loss of k for every individual who chooses A Note k may
arise because individuals incur a health cost they ignore or because the government incurs a
financial cost if A is chosen rather than B and individuals do not internalize that cost Finally
there is a deadweight loss of d for every individual who is subjected to the nudge but still
chooses A Thus d is the cost of overcoming the nudge Both k and d are calibrated in the
same units as p The government as stated would like to maximize expected net benefits
To reiterate an individual will choose A if their C value C = p(1-s) + ns is strictly
positive (Assume that indifferent people C = 0 follow the nudge)
13
Total welfare is given by
int int (119901 minus 119896 minus 119889)119891(119901)119889119901 + int (minus119901)119891(119901) 119889119901119862lt0119862ge0
119892(119904) 119889119904119904
(2)
Thus the government will pick n to maximize (2) the expected payoff to a randomly
chosen individual
Fuller presentations will examine how n changes depending on f(p) g(s) the values of
k and d etc For example if f(p) has considerable density at high values that is lots of people
strongly like A g(s) takes on mostly modest values and if d is consequential then a strong
nudge indeed any nudge may diminish welfare This is because a large fraction of the
population will overcome the nudge and thus incur consequential cost d
Many additional factors would enter an optimal nudge model For example it would
seem plausible of course that the cost of overcoming a nudge would depend on the magnitude
of the nudge that d would be an increasing function of |n| If so as d increases the optimal
nudge would diminish6
An optimal nudge might change over time Say that you nudge a population once
Some people follow the nudge Others do not Presumably nudge followers are
disproportionately individuals with low values of p though some with higher values of p but also
high values of s will also be nudged
If nothing changed of course a second nudge of the same value would have no effect
This would not be the case if there is error in computing C7 so that an individual who usually
would have switched did not do so the first time Alternatively p and s might drift around a bit
say following a random walk so a second-round nudge would change behavior Even in light of
6 Two factors lead to this result First as d increases the benefits of switching the marginal individual
diminish Second the cost to those not switching increases A reduction in nudge is beneficial on both grounds 7 If the nudge were a default for example the individual might have missed the opportunity to ldquocorrectrdquo it
Thatrsquos how magazines make money by offering really cheap introductory subscriptions
14
these possibilities we would still expect those who resisted the nudge initially to be
disproportionately high in p
Under reasonable regularity conditions this high p result for initial resisters would imply
that for this group the optimal nudge would be weaker the second time around A greater
percentage of the folks who would be subject to it would optimally stick with choice A The
converse also applies In a situation where people had to choose a second time the optimal
nudge for those who initially succumbed would be increased
We now turn to apply this broad framework for nudges to the particular empirical
problem of defaults for TCs in health insurance markets We examine the results of a nudge of
TCs from Medicare Advantage through a default to Traditional Medicare where TCs can only
overcome that nudge if they make an active choice back to MA We first describe Medicare
Advantage in more detail and then examine that problem empirically
4 Study Context Data and Methods
41 Medicare Advantage
One of the most consequential choices an elderly person can make is whether to enroll
in traditional Medicare which provides fee-for-service health insurance or in a Medicare
Advantage plan which gives beneficiaries a choice among private health plans that offer
benefits that are at least actuarially equivalent to traditional Medicare89 The Medicare
enrollment process typically favors traditional Medicare as evidenced by the way beneficiaries
8 During the initial enrollment period of seven months around onersquos 65
th birthday beneficiaries who
choose to join traditional Medicare are defaulted into Part A (hospital insurance) they have the options to enroll in Part B (physician services) and Part D (prescription drug coverage) Delaying enrollment in Part B andor Part D results in late-enrollment penalties The majority of beneficiaries in traditional Medicare also enroll in a private Medicare supplemental plan during this period (for example Medigap) thus covering the co-pays and deductibles that are not covered by traditional Medicare 9 Beneficiaries choose among MA plans offered in the service area in which they live usually their county
There are some exceptions for enrollees in MA plans who either move temporarily or move into a planrsquos designated ldquocontinuation areardquo
15
are defaulted into the hospital insurance component of the program (known as Part A) and by
the way information is presented in the Medicare and You package10 Unlike traditional
Medicare most MA plans are managed-care plans in which beneficiaries accept access to a
limited physician network and also accept having their care managed (through prior
authorization and gatekeeping) in exchange for more generous benefits However some MA
plans are private fee-for-service plans MA plans can offer prescription drug coverage through
Medicare Part D (MA-PD plans) or not (MA-only plans)
The availability of MA plans has ebbed and flowed over the programrsquos history Prior to
2003 most MA plans were offered by Health Maintenance Organizations (HMOs) From 1997-
2003 following the passage of Balanced Budget Act of 1997 many plans were terminated
Enrollment in MA fell dramatically from 16 of Medicare beneficiaries in 1999 to 12 in 2002
In many cases a return to traditional Medicare was the only option facing these TCs as
approximately 20 of TCs in during this time had no other MA plan available after their plan
exited (Gold et al 2004)
In 2003 the Medicare Modernization and Improvement Act increased payment rates
paid to MA plans The result was that for the rest of the decade the average MA plan payment
was 12 to 14 percent higher per beneficiary than the estimated cost of coverage for similar
people in traditional Medicare (MedPAC 2010) From 2003-2008 these higher payments
coupled with regulatory provisions led to the establishment of plans offering richer benefit
packages than traditional Medicare These more favorable plans offered reduced out-of-pocket
costs (OOPC) alongside extra benefits (MedPAC 2007 MedPAC 2009) As would be expected
the supply of MA plans in terms of the number and variety of options such as Preferred
10
For example the 2015 materials explain that there is a choice between traditional Medicare and Medicare Advantage in Section 1 titled ldquoLearn how Medicare Worksrdquo However information about Medicare Advantage and its plans doesnrsquot come until page 75 of the Medicare and You booklet (which is Section 5) after ldquoSigning Up for Medicare Parts A amp Brdquo (Section 2) ldquoFind out if Medicare covers your test service or itemrdquo (Section 3) and ldquoWhatrsquos Original Medicarerdquo (Section 4)
16
Provider Organization (PPO) plans and Private Fee-for-Service (PFFS) plans expanded
substantially Like HMOs PPOs are managed-care plans that restrict physician networks
PFFS plans from the period of 2003-2008 were very similar to traditional Medicare offering fee-
for-service coverage but without imposing any provider restrictions In the most recent era of
the Medicare program (since 2006) beneficiaries have been able to switch their coverage
options during the open enrollment period each year (typically starting in mid-October and
lasting six weeks) Beneficiaries in traditional Medicare can elect to switch their prescription
drug plans within traditional Medicare or to switch from traditional Medicare into MA
Beneficiaries in MA can shift across MA plans or switch into traditional Medicare
From 2008 forward the total number of MA plans decreased for a few reasons The
Patient Protection and Affordable Care Act (ACA) of 2010 reduced payments to MA plans
relative to traditional Medicare This legislative measure led some HMO and PPO plans to exit
the market (Afendulis et al 2012) The anticipated payment reductions along with provisions in
the Medicare Improvements for Patients and Providers Act (MIPPA) of 2008 that imposed a
network requirement on PFFS plans made such plans less attractive fewer were offered
Some counties experienced much greater rates of MA plan exits than others though in contrast
to the earlier era in the late 1990s beneficiaries in all counties continued to have access to at
least one MA plan of each plan type from 2007-2010 (MedPAC 2011) Importantly for the
purposes of our study these plan exits were not likely to have been driven by demand-side
behavior (for example by lack of beneficiary demand for MA) In fact MA enrollment continued
to grow steadily through November 2015 (MedPAC 2016) the latest date available
42 Medicare Beneficiary Plan Choice
A growing body of evidence reveals behavior suggesting that some Medicare
beneficiaries enroll in a plan that is suboptimal for them A significant example is status quo
bias in the Medicare market Individuals who decide to enroll in MA tend to remain in the
program over long periods of time Yet few enrollees in traditional Medicare switch into MA
17
(Sinaiko et al 2013 Afendulis et al 2014) In theory this could merely be because the enrollees
in MA and traditional Medicare had different preferences or health risks However the Sinaiko
analysis shows that beneficiaries who remain in traditional Medicare forgo significant savings in
the sum of premiums and out-of-pocket costs an example of what we label ldquomoney-wasting
Medicare beneficiaries being elderly and often unhealthy may often face diminished decision-
making and cognitive capabilities (Hanoch and Rice 2006 Agarwal et al 2008) placing them at
higher risk for biased or inadvertent and therefore possibly poor choices In a changing world
such as the medical marketplace the simplest poor choice to make with an expensive
purchase such as medical insurance is to fail to contemplate the choices and simply to
continue with the current plan
Choice can be impaired in other ways McWilliams et al (2011) find evidence consistent
with ldquochoice overloadrdquo They show that rates of enrollment in MA increased as plan choices
increased up to 15 then plateaued with 16 to 30 plan choices and then declined when
beneficiaries had more than 30 choices available The current authors find as well that
beneficiaries with reduced cognitive function as would be expected were less responsive than
their peers to the generosity of MA benefits when choosing between traditional Medicare and
MA
In the Medicare Part D program a beneficiary chooses among prescription drug plans in
an exchange setting Ketcham et al (2012) and Ketcham et al (2015) use longitudinal data to
demonstrate that at least some Part D enrollees were able to improve their choices in their
second third and fourth year of the program particularly when the potential gains from
switching plans were high They identify this evidence in a complex choice environment which
suggests that these beneficiaries had strong existing preferences for Part D plans However
money-wasting choices in Part D defined as plans that do not roughly minimize the sum of a
beneficiaryrsquos premiums plus out-of-pocket costs for a given level of risk have been observed in
significant numbers among all enrollees and among TCs specifically These inferior choices
18
arise in part because beneficiaries over-value plan premiums relative to all out-of-pocket costs
when making their selections (Abaluck and Gruber 2011 Abaluck and Gruber 2013) Low rates
of Part D enrollment by those eligible to enroll and receive the low-income subsidy a program
that makes this drug coverage and prescription drugs essentially free to beneficiaries reflect
obvious and extreme money-wasting choices (Kuye et al 2013)
The existing literature on Medicare describes a variety of factors that interfere with plan
selection and switching including status quo bias choice overload strongly disparate weighting
of different elements of cost and straightforward money-wasting It also discusses beneficiary
characteristics that make them susceptible to these behavioral biases In this regard the
evidence suggests that TCs are among those making the most effective choices in the Medicare
program First TCs consciously chose to enroll in MA in at the outset rather than accept the
traditional Medicare default thereby demonstrating their preference for receiving health
insurance through a MA plan Second a higher proportion of MA as opposed to traditional
Medicare clients enroll in Medicare Part D which offers prescription drug coverage at heavily
subsidized rates and thus reflects an effective choice Given these facts we would expect TCs
to be less susceptible than most to a default into TM
43 Data
We obtained data from the Centers for Medicare and Medicaid services (CMS) on the
entire population of elderly (age 65+) Medicare beneficiaries in the United States who were
enrolled in an MA plan that included prescription drug coverage (known as an MA-PD plan) for
the years 2006-201111 Henceforth for ease of exposition when we refer to Medicare
Advantage or MA plans or clients we mean MA-PD enrollees
11
Due to data limitations (described in more detail below) we were only able to distinguish a plan exit from a plan merger or a consolidation in MA-PD plans Therefore we excluded MA-only plans from this analysis
19
We excluded beneficiaries who became eligible for Medicare due to disability those
dually eligible for Medicaid the long-term institutionalized and those enrolled with an insurer
outside of their county of residence We also excluded enrollees in Medicare Advantage -
employer plans and Special Needs Plans (SNPs) because these beneficiaries face significantly
different enrollment choices and incentives Finally to focus the analysis on the plan choices
and outcomes in locales with robust MA marketplaces we restricted the analysis to
beneficiaries who lived in the 200 US counties with the largest elderly populations and who were
enrolled in the three most common types of MA contracts HMOs PPOs and PFFS This
sample included 17651389 elderly-person-year observations The data included information
on beneficiariesrsquo dates of birth genders races (black or non-black) zip codes of residence the
MA contracts in which they were enrolled and whether they continued to be enrolled in MA or
switched to traditional Medicare in each month of the study period
Generally insurers contract with Medicare to offer a specific type of plan (HMO PPO or
PFFS) in a county but many insurers offer multiple plans with different names and variable
benefits under each contract Our data included identifiable contract-level but not plan-level
enrollment information for each beneficiary The data also included an encrypted plan-level ID
for each beneficiary which importantly for this study allowed us to link to information on market-
level plan changes at the county level (such as consolidations mergers exits or no change)
Because we did not have information on the default options for beneficiaries whose MA plans
went through a merger or consolidation we dropped these beneficiaries (24 of observations)
from our analysis Our final study sample following this exclusion included 17226866 person-
year observations
44 Cohorts
We analyzed the characteristics and transitions of TCs over three pairs of years 2006-
2007 2009-2010 and 2010-2011 We did not examine transitions in 2007-2008 or 2008-2009
20
because very few MA contracts terminated in those intermediate years as a consequence they
provided too few TCs to study
Our study group of TCs includes all beneficiaries in our sample who were enrolled in a
plan and MA-PD contract that was offered in their county of residence in the first year of the
period but that was no longer offered in the second year12 We conducted this analysis at the
contract level for two reasons First contract exits often leave beneficiaries without a substitute
nearly identical to the terminated plan which is not the case with plan exits13 Second we know
the default for these clients namely enrollment in traditional Medicare
We analyzed the choices of two other types of MA beneficiaries in our sample voluntary
switchers and stayers Voluntary switchers are those who chose to either switch to a new MA
contract or switch into traditional Medicare although their prior MA contract continued to be
available had they wanted to stay enrolled in it Stayers are beneficiaries who did not act during
open enrollment and therefore by choice or by inaction were re-enrolled the following year in
their existing plan Both voluntary switchers and stayers faced circumstances different from
those of terminated choosers given that TCs had no choice but to switch plans Finally we
also examined the choices of original choosers who were beneficiaries who turned 65 in the
12
MA plans that are exiting a market must notify beneficiaries 60 days before the end of the year that their coverage will end on December 31
st of that year Exiting plans must inform beneficiaries that they
can change to TM or choose another MA plan from a provided list of plans available in the service area The beneficiaries remain in the Medicare program regardless of what they choose Beneficiaries have from the time they are notified until approximately two months after their coverage ends to make these elections though enrolling by December 31
st ensures no interruption in coverage Beneficiaries electing
to return to traditional Medicare will have neither prescription drug coverage nor any Medicare supplemental coverage (Medigap) to pay the costs that traditional Medicare doesnrsquot cover unless they actively choose to enroll in those plans at that time Beneficiaries who do not enroll in Part D at that time will incur a financial penalty if they later choose to do so 13
When a single plan within a contract exits a beneficiary may have a choice of another plan offered by the same carrier under the same contract that offers covered benefits cost-sharing requirements and physician networks strikingly similar to the exiting plan We would expect choices made by these TCs who have very similar alternatives available to consciously choose MA more than others Unfortunately we cannot observe when this circumstance occurs in our data Moreover in some cases these TCs might be defaulted into the similar plan alternative still available within their existing contract We thus restrict the analysis to TCs in plans for which the entire contract is terminated where staying in MA requires that these TCs select a plan in a new contract and where the default if they fail to make a choice is to be enrolled in traditional Medicare
21
second year of the two-year period and who then enrolled in MA or traditional Medicare for the
first time the latter perhaps due to a default into traditional Medicare
45 Descriptive Analyses
First we present descriptive statistics on the enrollment outcomes for these four groups
TCs voluntary switchers stayers and original choosers and their rates of switching into
traditional Medicare and their rates of switching into different types of MA contracts for HMO
enrollees in 2006-07 for HMO enrollees in 2009-10 and for PFFS enrollees in 2009-10 In
2010 the widespread exit of PFFS contracts created many TCs However due to data
limitations we could not observe the types of MA contracts in which voluntary switchers and
TCs enrolled in 2011 neither could we examine the choices across plans for beneficiaries who
remained in MA in 2011 Therefore we only examined transitions from MA to traditional
Medicare during the 2010-2011 period both by TCs and by voluntary switchers
46 Statistical Analyses
Terminated choosers differ from voluntary switchers and from stayers because TCs but
for the termination of their plan would have included both stayers and voluntary switchers
Given the termination we cannot distinguish between these two types in enrollment claims data
Comparing TCs to either group alone would be an unfair comparison
To identify as best possible appropriate comparisons for the choices of terminated
choosers and to bring balance to our terminated and comparison populations we used a
weighting approach that uses a propensity score approach (Hirano and Imbens 2001 and Kurth
et al 2006) to account for observable differences between terminated choosers and non-
terminated choosers (including both voluntary switchers and stayers) and to bring the non-
terminated chooser population into balance with the terminated choosers We then analyzed
differences in plan outcomes between this weighted comparison group of non-terminated
choosers and the outcomes for terminated choosers
22
This approach first employs a logit model to estimate the propensity for being a
terminated chooser on the basis of age gender race (black or not) and county We control for
county because plan payment rates are set at the county level and thus could affect a health
planrsquos propensity to withdraw and therefore a beneficiaryrsquos probability of being a terminated
chooser Moreover because all residents within a county face the same plan choices our
results are not driven by differences in underlying plan choice sets facing TCs and non-TCs14
To account for changes in payments and differences in preferences for insurance plan types
models were run separately by year and MA plan type (HMO or PFFS) We applied the
coefficients from this model to the data to estimate the probability p that each beneficiary in a
non-terminated contract would be a terminated chooser We then generate a set of weights
where each terminated chooser was assigned a weight equal to 1 and non-terminated
choosers were assigned a weight of (p1-p) (Hirano and Imbens 2001 and Kurth et al 2006) 15
The weighted distributions of characteristics of terminated and non-terminated choosers are
identical (see Appendix) and weighted analyses therefore adjust for potential confounding due
to the individual characteristics included in the propensity score models16
We compared weighted rates of enrollment into traditional Medicare and into MA overall
Among beneficiaries who remained in MA we compared rates of enrollment across types of MA
plans (MA-HMO MA-PPO and MA-PFFS) Statistical significance was assessed using
Pearsonrsquos chi-square test We also compared differences in rates of enrollment in Part D plans
among beneficiaries who switched into traditional Medicare
14
Beneficiaries in counties that did not experience any plan terminations were excluded from the analysis 15
In instances where the number of terminated choosers (the treatment population) was greater than the number of non-terminated choosers (the control population) estimating propensity-score weights in this population would result in a loss in efficiency Due to the dramatic changes in the PFFS market that began in 2009 this circumstance arose for the PFFS market in a subset of our study counties during the 2009-2010 study period Therefore we restricted the 2009 PFFS models to include only counties where there were at least as many non-terminated choosers as terminated choosers 16
Others have applied this methodology to analyze the impact of health insurance on health care utilization and on health care spending (see for example McWilliams et al 2007 Zhang et al 2009)
23
5 Results
51 Beneficiary switching and descriptive transitions
Over the period 2006-2010 nearly 233000 beneficiaries in MA plans became TCs17
TCs were similar in age gender and race to both voluntary switchers and stayers but were
much more likely to have been enrolled in their MA contracts for a shorter duration one year or
less (Table 1) The vast majority of the MA contract exits examined occurred in 2006 2009 and
2010 The yearly proportion of MA enrollees who switched out their plan increased over the
study period from 88 to 138 and the majority of switchers each year were voluntary
switchers (Table 2) Voluntary switchers were more likely than TCs to transition from MA to
traditional Medicare following each of those years (Table 3)
Tables 4a and 4b present unadjusted descriptive data on the transitions of TCs and all
other types of beneficiaries voluntary switchers stayers and original choosers Considering
transitions in 2006-2007 (Table 4a) TCs in all plan types were much less likely to transition to
traditional Medicare than were voluntary switchers moving out of the same plan types The
transition numbers are 52 vs 195 for HMO enrollees 150 vs 249 for PPO enrollees
25 vs 416 for PFFS enrollees--though this last category had a very small sample size
Among beneficiaries who were in an MA-HMO in 2006 TCs were more likely to enroll in a PFFS
plan than were voluntary switchers Together voluntary switchers and TCs who stayed in MA
were more likely to enroll in a non-HMO plan than were either stayers (column 7) or original
choosers who chose MA (column 8)
By contrast in 2009 when significant numbers of PFFS plans first exited from MA
markets TCsrsquo higher rate of remaining in MA as compared to voluntary switchers was driven by
terminated choosers in PFFS plans In 2009 a large proportion of terminated choosers had
17
This figure includes TCs created in all five years of the entire period though 98 occurred in 2006 2009 and 2010
24
originally enrolled in PFFS plans In comparison with voluntary switchers from PFFS in 2009
TCs were dramatically more likely to stay in MA in 2010 (850 vs 418 Table 4b column 5
vs 6) Another large group of terminated choosers in 2009 had originally enrolled in a PPO
plan Here we observe the one instance in which a larger proportion of these beneficiaries
transitioned to traditional Medicare than did voluntary switchers from this plan type (353 vs
161 Table 4b column 3 vs 4) TCs in MA-HMO plans were slightly less likely to transition to
traditional Medicare than were voluntary switchers from MA-HMO plans (154 vs 172)
Again we observe from 2009-2010 as we did from 2006-2007 that both voluntary switchers
and TCs who stayed in MA were more likely to enroll in a non-HMO plan than were stayers
(column 7) and original choosers who chose MA (column 8)
52 Statistical Analyses
It is not possible to draw appropriate inferences about the impact of default policies and
the effects of terminated plans simply based on the results from Section 51 That is because
neither voluntary switchers nor stayers nor original choosers constitute an appropriate
comparison group for TCs This section presents results on plan enrollment outcomes of TCs
versus those for a sample of non-terminated choosers that includes both voluntary switchers
and stayers where members of that sample were weighted according to their propensity for
being in a terminated plan thereby creating balance between the two groups
TCs in our pooled sample were more likely to transition to traditional Medicare than were
non-terminated choosers (111 vs 26 plt0001) (Table 5) This pattern holds both among
TCs who were originally enrolled in HMOs and those originally enrolled in PFFS Medicare
Advantage plans TCs were three times more likely to move to traditional Medicare from MA-
HMO contracts in 2006 twelve times more likely to move to traditional Medicare from MA-HMO
contracts in 2009 and twice as likely to move to traditional Medicare from MA-PFFS contracts in
2009
25
Multiple forces could contribute to these dramatic disparities One possibility is that
status quo bias among individuals whose plans survived led them to stick with their plan going
forward A second is that some TCs were affected by the default into traditional Medicare when
traditional Medicare may or may not have been their second choice We incline to status quo
bias of the non-terminated choosers being the principal explanation as that grouprsquos members
only switched to traditional Medicare 26 of the time The switch percentage for TCs to
traditional Medicare was 111 implying that the default was hardly determinative
53 Further analysis of quality of choices and susceptibility to nudges
TCs who transitioned from MA to traditional Medicare were a distinct minority No doubt
some of these transitions were voluntary but some may have been influenced by the default
into traditional Medicare If so this should be reflected in the differential likelihood that these
two groups of TCs chose to enroll in a plan with prescription drug coverage That is because
prior to their plan termination all TCs in our sample had selected a Medicare Advantage plan
that included a prescription drug plan Traditional Medicare with Part D or a new Medicare
Advantage plan with Part D is much closer to being actuarially equivalent to their plan prior to
their termination than is traditional Medicare without Part D However traditional Medicare
without Part D is the default TCs who move into Traditional Medicare must actively enroll in a
Part D plan if they are to have prescription drug coverage Given their original choices and the
heavy subsidies of Part D we conclude that those TCs transitioning to traditional Medicare
without Part D probably made a mistake and suffered expected monetary losses
We compared the rates of enrollment in a Part D plan among TCs (Table 6) First the
top panel shows that among all TCs those moving to traditional Medicare were significantly
more likely to fail to enroll in a Part D plan than were their peers who actively chose to stay in
MA (206 vs 17)
The second panel shows the population of TCs who transitioned to Traditional Medicare
Beneficiaries who were male were more likely to fail to enroll in Part D than were women (240
26
vs 192 plt0001) as were beneficiaries who were black vs non-black (387 vs 202
plt0001) Failing to enroll in a Part D plan decreases with age and with median household
income of the zip code in which beneficiaries reside
6 Discussion
This study investigates the phenomenon of a policy-imposed default versus the forces
promoting consistent choices among terminated choosers in health insurance markets The
evidence shows that the default policy associated with contract terminations in Medicare
Advantage had a moderate impact on the transitions of beneficiaries in terminated plans from
MA to traditional Medicare TCs were more likely to be enrolled in traditional Medicare in the
year following their plan terminations than were non-terminated choosers However a very
large percentage of TCs took specific action to select new MA plans following their initial planrsquos
termination Their active choices to remain in MA likely stemmed from the same preferences
that were operating when they originally reviewed the available plans and deliberately chose
MA The persistent preferences of these individuals were perhaps reinforced by status quo
bias which has been shown to exist for some combination of rational and irrational reasons
among Medicare beneficiaries
The majority of TCs who transitioned into traditional Medicare from 2009-2010 also
showed their ability to choose contrary to a default Roughly three quarters of them took the
active step to enroll in the Part D benefit The remaining quarter of TCs transitioning to
traditional Medicare following their plan termination failed to take up a Part D plan an outcome
in contrast to their prior selection of a MA plan with Part D suggesting some susceptibility to
nudges Those most susceptible were more likely to be black male younger and to live in a zip
code with lower median household income The finding that susceptibility decreases with age is
a bit surprising given that aging is associated with cognitive decline which inhibits decision-
making However working in opposition and presumably prevailing is the fact that older
27
beneficiaries presumably are more likely to need more prescription drugs and thus benefit more
from Part D coverage
Typically default rules are used to nudge people away from making errors that might
otherwise occur in complex high-stakes choice environments (for example with 401K plan
enrollment) and where the experts are in relatively widespread agreement on which alternative
is superior The default nudge studied here differs dramatically from more traditional policy
nudges for two reasons First there is no evidence that it was actively designed to promote
superior choices for individuals In fact the lack of automatic enrollment in Part D leaves
beneficiaries who accepted the default substantially worse off in expectation than they would be
if they had been able to stay in their prior plan Second this nudge pushes individuals towards
an option that is quite different than what they had chosen in a prior period These two features
of the default and therefore their implications for consumer welfare differ from the vast majority
of nudges reported in previous literature
Why does Medicare include this default Given that Medicare Advantage costs the
government more and that Part D coverage is heavily subsidized one possible justification
would be that a successful nudge would save the government money But surely that
consideration should be weighed against having beneficiaries choose against their preferred
plans And any government that gets into the business of such nudges has to worry about
hurting its overall legitimacy Rather the specified default for TCs in Medicare Advantage is
likely in place because it mirrors the default for original choosers in the Medicare program
which is traditional Medicare and it is the most administratively simple to implement
However the specified default of TCs to traditional Medicare fails to make use of
information about beneficiariesrsquo revealed preferences among plans A second MA plan is likely
28
more similar to the original choice than TM in several consequential ways (eg covered
benefits cost-sharing requirements) hence likely to be better suited to the client18
Smart defaults which take into account individual starting positions preferences or
expected needs have been suggested as an alternative to the ldquobenignrdquo default discussed thus
far in this paper (Smith et al 2009) Smart defaults have begun to be used in other public
programs19 and have been shown to have the potential to achieve large savings for enrollees in
Medicare Part D (Zhang et al 2015)20
Because of differences in physician networks across health plans smart defaults would
add administrative complexity but they would be feasible For example in Medicare a smart
default system could analyze the degree of overlap in physician networks across MA plans in an
area it could then use MA as the default if the overlap reached a certain threshold below the
threshold the default would be TM An even more sophisticated algorithm could consider the
physicians the individual has previously used and at a more advanced level could even include
information about recent diagnoses and the implications for appropriate health-care coverage
The success of these default alternatives would be revealed if we observed that relatively few
TCs chose against them
More generally the outcomes for terminated choosers in other health-insurance
exchange settings should be examined Nearly 13 million individuals have enrolled in health
plans through state or federal health-insurance marketplaces created under the ACA These
18
By analogy consider if one had to choose a new car default for an individual who was trading in an SUV that was no longer made An SUV default would more likely meet his preferences than a sedan 19
For example the California demonstration project to Integrate Care for Dual Eligible Beneficiaries (the Cal MediConnect program) is passively enrolling individuals into health plans using an ldquointelligent assignmentrdquo process that analyzes the individualrsquos recently used providers and matches those providers to the physician networks of participating plans Individuals will be passively enrolled in the plan that best meets their current circumstances prioritizing continuity of care There is a 90-day period when individuals can change plans or opt-out (California Department of Health Care Services 2014) 20
Zhang et al simulate an ldquointelligent assignmentrdquo algorithm that would assigning Medicare beneficiaries with schizophrenia who are eligible for a low-income subsidy to the least expensive Part D prescription drug plan based on their prior year drug use instead of random assignment to any plan (the current policy) and project savings on average of $387 per beneficiary
29
include many different types of clients those who were previously insured in individual
insurance plans and who presumably have considerable experience selecting plans and
navigating the market and those who were previously uninsured and who likely have very little
experience with health insurance The effects of default policies following plan terminations
across these different types of enrollees could differ dramatically In some ACA marketplaces
TCs who fail to select a new option for coverage lose their health insurance coverage
altogether an outcome that is clearly sub-optimal relative to their prior choice In 2017
enrollees in terminated plans purchased through federally-facilitated marketplaces may be
automatically enrolled in a new plan (generally the lowest-cost plan of the same product network
type) if they donrsquot choose a new plan or actively opt-out of the marketplace (Jost 2016)
Plan enrollment decisions are very consequential for individuals Increasing numbers of
Americans are choosing plans in health insurance exchange settings such as Medicare the
Affordable Care Act (ACA) and private exchanges and turmoil and large numbers of TCs are
inevitable Whether terminated choosers in these exchanges select and enroll in new plans and
how their responses vary based on default policy and previous insurance status health status
and other characteristics are matters of great policy consequence Any guidance and defaults
provided for TCs should attend to their past revealed preferences
30
Table 1 Characteristics of Stayers vs Terminated Choosers vs Voluntary switchers
MA-PD enrollees in the 200 largest counties in the US 2006 ndash 2010
Stayers Terminated Choosers Voluntary Switchers
n (person-years) 15590641 232538 1403687
Female 584 573 558
Black (vs non-black) 79 77 91
Age
65-69 279 353 318
70-74 257 253 251
75-79 219 185 199
80-84 149 124 135
85+ 97 86 98
Years enrolled in plan (prior to switch)
lt1 131 408 270
1 135 184 191
2 106 124 145
3+ 627 285 389
Expected OOPC $284 $350 $279
Premium $135 $171 $132
Base year
2006 2684837 29283 194292
2007 2888710 3184 193470
2008 3217796 1745 207787
2009 3280679 57591 388048
2010 3518619 140735 420090
Source Authors analysis of Medicare enrollment data Sample includes beneficiaries who gained eligibility
and were not disabled Excludes beneficiaries in employer-sponsored plans and non-HMO PPO and PFFS plans
Excludes beneficiaries in contracts that experienced a merger or consolidation
Stayer = did not switch out of MA-PD contract
Terminated chooser = switched out of MA-PD contract not offered in county in subsequent year
Voluntary switchers = switched out of MA-PD contract offered in county in subsequent year
In contract switching from Excludes 2006 (data not available)
31
Table 2 MA-PD switching rates 2006-2010
Switchers who are Switch Terminated Voluntary Year Beneficiaries Contracts Choosers Switchers
2006 2908412 88 114 886 2007 3085364 66 16 984 2008 3427328 63 08 992 2009 3726318 122 132 869
2010 4079444 138 251 749
Authorsrsquo analysis of Medicare enrollment data in the 200 US counties with the largest elderly populations
Sample = 17226866 person-years
32
Table 3 Transitions from MA-PD to TM
Among beneficiaries Percent moving to TM
Year Terminated Choosers Voluntary Switchers
2006-07 67 202 2009-10 238 257
2010-11 221 456
Source Authors analysis of Medicare enrollment data
33
Table 4a Beneficiary transitions and enrollment outcomes 2006-07
MA-HMO MA-PPO MA-PFFS
Original Choosers
Terminated choosers
Voluntary switchers
Terminated choosers
Voluntary switchers
Terminated choosers
Voluntary switchers Stayers
(age 65) in 2007
(1) (2) (3) (4) (5) (6) (7) (8)
N 25040 171167 4239 22406 4 719 2684837 164857
Into TM in 2007 52 195 150 249 250 416 00 na
In MA in 2007 948 805 850 751 750 584 1000 na
Within MA
MA-HMO 618 598 341 442 00 417 951 819
MA-PPO 13 176 558 259 00 76 44 131
MA-PFFS 369 142 93 274 1000 445 05 50
MA-Other 00 84 08 25 00 62 00
Table 4b Beneficiary transitions and enrollment outcomes 2009-10
MA-HMO MA-PPO MA-PFFS
Original choosers
Terminated
choosers Voluntary switchers
Terminated choosers
Voluntary switchers
Terminated choosers
Voluntary switchers Stayers
(age 65) in 2010
N 3919 238793 24986 66605 28686 82650 3280679 229608
Into TM in 2010 154 172 353 161 150 582 00 na
In MA in 2010 846 828 647 839 850 418 1000 na
Within MA
MA-HMO 620 687 564 504 308 440 883 761
MA-PPO 218 256 373 420 366 477 96 205
MA-PFFS 158 31 54 68 325 82 22 34
MA-Other 04 26 92 77 01 02 00
34
Table 5 Enrollment outcomes for terminated choosers vs weighted comparison group1
Terminated Weighted
choosers comparison group
Enrollment in next year
Study Sample overall TM 111 26
MA-HMO 464 838
MA-PPO 128 25
MA-PFFS 295 110
Stratified by year and plan type
Enrollment in 2007
TM 52 13
MA-HMO in 2006 MA-HMO 582 968
MA-PPO 13 02
MA-PFFS 352 16
Enrollment in 2010
TM 154 13
MA-HMO in 2009 MA-HMO 524 963
MA-PPO 185 18
MA-PFFS 133 06
Enrollment in 2010
TM 175 79
MA-PFFS in 2009 MA-HMO 305 152
MA-PPO 258 120
MA-PFFS 261 650
Notes Study sample includes terminated choosers (enrollees in terminated HMO plans in 2006
or 2009 or in terminated PFFS plans in 2009) and propensity-score based weighted
comparison group of non-terminated choosers) 1
All differences in distribution of enrollment across plan types are statistically significant
at plt0001
35
Table 6 Susceptibility to nudges Proportion of Terminated Choosers (TCs)
who did NOT select a Part D plan
Did not enroll in Part D
()
All TCs with plan termination in 2009 TCs who chose a new MA plan 17 TCs who went into traditional Medicare 206
Did not enroll in Part D
()
TCs with plan termination in 2009 or 2010 who went into traditional Medicare
Male 240 Female 192
Black 387 Non-Black 202
Age group 65-69 238
70-74 207
75-79 206 80-84 198 85+ 164
Distribution of Median HH income in zip code First quartile (lowest median HH income) 245 Second quartile 206
Third quartile 204
Fourth quartile (highest median HH income) 192
Source Authors analysis of Medicare enrollment data
Predicted enrollment based on logistic regression model controlling for age gender race (black or non-black) median HH income in
zip code of residence and year Sample size 44286 TC=terminated chooser
36
References Abaluck J and J Gruber Choice Inconsistencies among the Elderly Evidence from Plan Choice in the Medicare Part D Program American Economic Review 2011 101 (4) 1180ndash210 Abaluck J and Gruber J Evolving Choice Inconsistencies in Choice of Prescription Drug Insurance NBER Working Paper 19163 June 2013 Afendulis CC Landrum MB Chernew ME The Impact of the Affordable Care Act on Medicare Advantage Plan Availability and Enrollment Health Services Research 2012 47(6) 2339-2352 Afendulis CC Sinaiko AD Frank RG Dominated Choices and Medicare Advantage Enrollment NBER Working Paper no20181 2014 Agarwal S Driscoll J Gabaix X and Laibson D The age of reason Financial decisions over the lifecycle In American Law and Economic Association Annual Meetings 2008 Armour S Republicans Question Viability of Co-Ops Wall Street Journal (online) [New York NY] 25 Feb 2016 Arrow K Uncertainty and the welfare economics of medical care American Economic Review 1963 53(5) 941-973 Beshears J J J Choi D Laibson and B C Madrian 2008 How Are Preferences Revealed Journal of Public Economics 92 (8ndash9) 1787ndash94 Beshears J J J Choi D Laibson and B C Madrian The Importance of Default Options for Retirement Savings Options In Brown Liebman and Wise eds Social Security Policy in a Changing Environment Chicago IL University of Chicago Press 2009 p 167-195 Camerer C Loewenstein G and Prelec D Neuroeconomics How Neuroscience can Inform Economics Journal of Economic Literature 2005 43(1)9-64 Cox C Claxton G Levitt L ldquoAnalysis of Insurer Participation in 2016 Marketplacesrdquo Kaiser Family Foundation Issue Brief Nov 03 2015 httpkfforghealth-reformissue-briefanalysis-of-insurer-participation-in-2016-marketplaces (Accessed on Apr 20 2015) Cox C and Semanskee A ldquoAnalysis of UnitedHealth Grouprsquos Premiums and Participation in ACA Marketplacesrdquo Kaiser Family Foundation Issue Brief April 18 2016 Cox C and Semanskee A ldquoPreliminary Data on Insurer Exits and Entrants in 2017 Affordable Care Act Marketplacesrdquo Kaiser Family Foundation Data Note August 2016 Cutler D and Reber S Paying for health insurance the trade-off between competition and adverse selection Quarterly Journal of Economics 1998 113(2) 443-466 Dafny L Hendel I and Wilson N ldquoNarrow Networks on the Health Insurance Exchanges What Do They Look Like and How Do They Affect Pricingrdquo The American Economic Review 105(5) 110-114 Dafny L Gruber J and Ody C ldquoMore Insurers Lower Premiums Evidence from Initial Pricing in the Health Insurance Marketplacesrdquo The American Journal of Health Economics 2015 1(1) 53-81
37
Frank RG (2007) Behavioral Economics and Health Economics In Behavioral Economics and Its Applications Diamond P and Vartiainen H (Eds) Princeton Princeton University Press Gabel JR Whitmore H Stromberg S et al ldquoAnalysis Finds No Nationwide Increase in Health Insurance Marketplace Premiumsrdquo Commonwealth Fund Blog [blog on the Internet] 2014 Dec 22 [cited 2016 Apr 20] Available from httpwwwcommonwealthfundorgpublicationsblog2014deczero-inflation-nationwide-for-marketplace-premiums Gold M Achman L Mittler J and Stevens B 2004 ldquoMonitoring Medicare+Choice What Have We Learned Findings and Operational Lessons for Medicare Advantagerdquo Washington DC Mathematica Policy Research Doct No PR04-43 Goldstein D G E J Johnson A Herrmann and M Heitman ldquoNudge Your Customers Toward Better Choicesrdquo Harvard Business Review December 2008 99-105 Hanoch Y and T Rice Can Limiting Choice Increase Social Welfare The Elderly and Health Insurance Milbank Quarterly 2006 84 (1) 37ndash73 Hirano Keisuke and Imbens Guido W Estimation of causal effects using propensity score weighting An application to data on right heart catheterization Health Services and Outcomes Research Methodology 2001 2259-278 Johnson EJ and Goldstein DG Do Defaults Save Lives Science 2003 3021338-1339 Jost T Updated Renewal and Discontinuation Notices Auto-Reenrollment And Other ACA Developments Health Affairs Blog September 5 2016 wwwhealthaffairsorg (accessed December 4 2016) Keeney RL and Raiffa H Decisions with Multiple Objectives Preferences and Value Trade-offs Cambridge [England] New York NY Cambridge University Press 1976 Ketcham JD Lucarelli C Miravete EJ and Roebuck MC Sinking Swimming or Learning to Swim in Medicare Part D American Economic Review 2012 102(6) 2639-2673 Ketcham JD Lucarelli C and Powers CA Paying Attention or Paying Too Much in Medicare Part D American Economic Review 2015 105(1) 204-233 King R Colorado to Close Obamacare Co-Op Washington Examiner (online) October 16 2015 Kowalski A The Early Impact of the Affordable Care Act State by State Brookings Papers on Economic Activity Economic Studies Program The Brookings Institution vol 49(2 (Fall 2014)) pages 277-355 Kurth T Walker AM Glynn RJ et al Results of multivariable logistic regression propensity matching propensity adjustment and propensity-based weighting under conditions of nonuniform effect Am J Epidemiol 163262-270 2006 Kuye IO Frank RG McWilliams JM Cognition and Take-Up of Subsidized Drug Benefits by Medicare Beneficiaries JAMA Intern Med 2013 doi101001jamainternmed2013845
38
La Monica PR ldquoUnitedHealthcare to Exit Most Obamacare Exchangesrdquo CNN Money April 19 2016 httpmoneycnncom20160419investingunitedhealthcare-obamacare-exchanges-acaindexhtml (Accessed April 20 2016) Madrian B C and D F Shea 2001 The Power of Suggestion Inertia in 401(k) Participation and Savings Behavior Quarterly Journal of Economics 1161149ndash87 McWilliams J M C C Afendulis T G McGuire and B E Landon 2011 Complex Medicare Advantage Choices May Overwhelm SeniorsmdashEspecially Those with Impaired Decision Making Health Affairs 30 (9) 1786ndash94 McWilliams J M J Hsu and J P Newhouse 2012 New Risk-adjustment System Was Associated with Reduced Favorable Selection in Medicare Advantage Health Affairs 31 (12) 2630ndash40 McWilliams JM Meara E Zaslavsky AM Ayanian JZ Use of health services by previously uninsured Medicare beneficiaries New England Journal of Medicine 2007a357143-53 PMID 17625126 Medicare Payment Advisory Commission 2000 Report to the Congress Improving Risk Adjustment in Medicare Washington DC Medicare Payment Advisory Commission Medicare Payment Advisory Commission 2007 Report to Congress Medicare Payment Policy Washington DC Medicare Payment Advisory Commission Medicare Payment Advisory Commission 2009 Report to the Congress Improving Incentives in the Medicare Program Washington DC Medicare Payment Advisory Commission Medicare Payment Advisory Commission 2010 Report to Congress Medicare Payment Policy Washington DC Medicare Payment Advisory Commission Medicare Payment Advisory Commission 2011 Report to Congress Medicare Payment Policy Washington DC Medicare Payment Advisory Commission Medicare Payment Advisory Commission 2016 Report to Congress Medicare Payment Policy Washington DC Medicare Payment Advisory Commission Newhouse J P M Price J Huang J M McWilliams and J Hsu 2012 Steps to Reduce Favorable Risk Selection in Medicare Advantage Largely Succeeded Boding Well for Health Insurance Exchanges Health Affairs 31 (12) 2618ndash28 Pear R Some Policies Get More Time in Health Shift The New York Times March 6 2014 p A1 Pear R Aetna to Pull Back From Public Health Care Exchanges The New York Times August 16 2016 Physician Payment Review Commission Annual Report to Congress 1996 Washington DC Physician Payment Review Commission
39
Riley G and C Zarabozo Trends in the Health Status of Medicare Risk Contract Enrollees Health Care Financing Review 2006 28 (2) 81ndash95 Samuelson W and R Zeckhauser Status Quo Bias in Decision Makingrdquo Journal of Risk and Uncertainty 1988 17ndash59 Sinaiko AD Afendulis CC and Frank RG Enrollment in Medicare Advantage Plans in Miami-Dade County Evidence of Status Quo Bias Inquiry 2013 Smith CN Goldstein D Johnson EJ Smart defaults From hidden persuaders to adaptive helpers (Working Paper INSEAD 2009) available at httppapersssrncomezp-prod1hulharvardedusol3paperscfmabstract_id=1116650 Thaler R and Sunstein C Nudge Improving Decisions about Health Wealth and Happiness (New York NY Penguin Books 2009) Zhang Y Baik SH and Newhouse JP Use of Intelligent Assignment to Medicare Part D Plans for People With Schizophrenia Could Produce Substantial Savings Health Affairs 2015 34(3) 455-460 Zhang Y Donohue JM Lave JR ODonnel G Newhouse JP The Effect of Medicare Part D on Drug and Medical Spending N Engl J Med 2009 36152-61
40
Appendix A1 Medicare Advantage contract-level out-of-pocket cost data We obtained previously determined estimates of the out-of-pocket costs (OOPC) including premiums associated with each MA-PD plan option The Centers for Medicare and Medicaid Services (CMS) calculated these estimates by taking medical utilization data for a standard population of Medicare beneficiaries and applying the coverage and cost-sharing rules specific to each plan to these utilization data to determine the average monthly out-of-pocket costs expected for a beneficiary enrolling in that plan21 These calculations were conducted separately for five self-reported health-status groups and for six age groups To merge these estimates with our contract-level enrollment data for each age group in each county in a given year we averaged OOPC estimates for the five health-status groups within plans and then averaged the OOPC plan estimates for all plans under a given MA-PD contract We applied county contract-level enrollment data to calculate an enrollment-weighted average OOPC of being in an MA-PD contract for each age group and year for all contracts available in each county
21
The standard population was a two-year sample of TM-enrolled respondents to the Medicare Current Beneficiary Survey This estimate assumes that the quantity of services consumed does not vary with the differing cost-sharing rules across the MA plans
41
A2 Demographic Characteristics of Terminated and Non-Terminated Choosers
2006 HMO
Unweighted Weighted Non-Terminated Terminated Non-Terminated Terminated
N 2723831 21953 2723831 21953 black 80 25 24 25 male 414 393 389 393
a7074 273 303 302 303
a7579 231 252 253 252 a8084 152 147 150 147
a85 90 86 87 86 a7074male 118 123 121 123 a7074black 24 07 06 07 a7579male 97 104 103 104 a7579black 17 07 07 07 a8084male 59 54 54 54 a8084black 10 04 04 04
a85male 31 28 28 28 a85black 06 02 02 02
2009 HMO
Unweighted Weighted Non-Terminated Terminated Non-Terminated Terminated
N 3133379 3919 3199973 3919 black 85 125 123 125
male 417 443 445 443 a7074 252 255 256 255 a7579 219 190 189 190 a8084 152 120 120 120
a85 101 73 73 73 a7074male 109 115 116 115 a7074black 24 31 31 31 a7579male 93 81 80 81 a7579black 18 25 25 25 a8084male 61 52 52 52 a8084black 11 10 10 10
a85male 35 26 26 26 a85black 07 06 06 06
42
2009 PFFS
Unweighted Weighted Non-Terminated Terminated Non-Terminated Terminated
N 148736 17852 148736 17852 black 65 73 70 73 male 424 433 437 433
a7074 242 249 249 249 a7579 193 163 161 163
a8084 135 106 105 106 a85 85 62 61 62
a7074male 107 110 111 110 a7074black 17 21 20 21 a7579male 82 71 71 71 a7579black 13 12 12 12 a8084male 54 41 41 41 a8084black 08 07 07 07
a85male 28 20 20 20 a85black 05 04 04 04
11
elaborate model an error term would be added to C to represent for example behavioral
factors
Distributions in the Population Individuals differ in their preferences and their
susceptibilities to nudges For expositional ease assume independence on these two
variables though in real life that will often not be the case
The distribution of preferences is f(p) The distribution of susceptibilities is g(s)
The central question for the nudger who is seeking to maximize expected welfare taking
both direct individual utilities and societal resources into account5 is the magnitude of nudge to
use Posit that it is to be applied to the general society and that nudges must be general they
cannot be tailored to specific individuals Thus the nudger may be the government choosing a
default between Medicare and Medicare Advantage or a commercial firm trying to nudge
people on its product offerings
For expositional ease assume that the individualrsquos preference is for A but the nudger
wishes to push him toward B There are two prime cases to consider Case I occurs when
there is straight paternalism Thus the government may find that people tend to eat unhealthy
product A rather than healthier product B Representative examples would be requiring
restaurants to publish their calorie counts imposing a tax on sugar or prohibiting the sale of soft
drinks in schools
Case II occurs when the nudger has a private preference interest in the outcome quite
apart from the preferences of the individual Thus it might be a commercial company trying to
increase profits or the government trying to shuttle individuals to a health plan that is less
expensive for it to provide Under Case II the nudgers may have a further divide depending on
who is doing the nudging Presumably the commercial company would be interested solely in
its profits though it would take customer satisfaction into account to the extent that it affected
5 Of course societal resources can only come from individuals and resource expenditures would
ultimately reduce individualsrsquo utilities
12
long-term profits The government presumably would have dual goals individual satisfaction
as well as government costs Thus the government would not wish to have its nudge override
strong consumer preferences Our presentation focuses on the case where the nudger who is
seeking to maximize expected welfare has some concern with catering to consumer
preferences
Some nudges can be resisted by individuals merely by mildly resisting them Thus an
individual who has a strong preference for product A may stick with it even if advertising or
advisories or a salesman pushes them strongly towards B However to overcome some
nudges may entail an actual cost This happens frequently with defaults when for example to
overcome a default one need merely check a different box or make a single brief phone call
In other cases the process to overcome requires substantial time and effort Difficulty
overcoming a default also occurs when one has no idea of how to do so or because the time to
do so is far in the future so people do not take notice when they are defaulted (Introductory
subscriptions to a magazine which renew automatically unless you call to cancel represent a
prime example of this latter case) The costs involved in overcoming a default nudge represent
dead weight losses
Consider now the nudger who seeks the optimal nudge n to maximize expected
welfare For this illustration it will be the government The nudger knows f(p) and g(s) It also
knows that there is an unrecognized loss of k for every individual who chooses A Note k may
arise because individuals incur a health cost they ignore or because the government incurs a
financial cost if A is chosen rather than B and individuals do not internalize that cost Finally
there is a deadweight loss of d for every individual who is subjected to the nudge but still
chooses A Thus d is the cost of overcoming the nudge Both k and d are calibrated in the
same units as p The government as stated would like to maximize expected net benefits
To reiterate an individual will choose A if their C value C = p(1-s) + ns is strictly
positive (Assume that indifferent people C = 0 follow the nudge)
13
Total welfare is given by
int int (119901 minus 119896 minus 119889)119891(119901)119889119901 + int (minus119901)119891(119901) 119889119901119862lt0119862ge0
119892(119904) 119889119904119904
(2)
Thus the government will pick n to maximize (2) the expected payoff to a randomly
chosen individual
Fuller presentations will examine how n changes depending on f(p) g(s) the values of
k and d etc For example if f(p) has considerable density at high values that is lots of people
strongly like A g(s) takes on mostly modest values and if d is consequential then a strong
nudge indeed any nudge may diminish welfare This is because a large fraction of the
population will overcome the nudge and thus incur consequential cost d
Many additional factors would enter an optimal nudge model For example it would
seem plausible of course that the cost of overcoming a nudge would depend on the magnitude
of the nudge that d would be an increasing function of |n| If so as d increases the optimal
nudge would diminish6
An optimal nudge might change over time Say that you nudge a population once
Some people follow the nudge Others do not Presumably nudge followers are
disproportionately individuals with low values of p though some with higher values of p but also
high values of s will also be nudged
If nothing changed of course a second nudge of the same value would have no effect
This would not be the case if there is error in computing C7 so that an individual who usually
would have switched did not do so the first time Alternatively p and s might drift around a bit
say following a random walk so a second-round nudge would change behavior Even in light of
6 Two factors lead to this result First as d increases the benefits of switching the marginal individual
diminish Second the cost to those not switching increases A reduction in nudge is beneficial on both grounds 7 If the nudge were a default for example the individual might have missed the opportunity to ldquocorrectrdquo it
Thatrsquos how magazines make money by offering really cheap introductory subscriptions
14
these possibilities we would still expect those who resisted the nudge initially to be
disproportionately high in p
Under reasonable regularity conditions this high p result for initial resisters would imply
that for this group the optimal nudge would be weaker the second time around A greater
percentage of the folks who would be subject to it would optimally stick with choice A The
converse also applies In a situation where people had to choose a second time the optimal
nudge for those who initially succumbed would be increased
We now turn to apply this broad framework for nudges to the particular empirical
problem of defaults for TCs in health insurance markets We examine the results of a nudge of
TCs from Medicare Advantage through a default to Traditional Medicare where TCs can only
overcome that nudge if they make an active choice back to MA We first describe Medicare
Advantage in more detail and then examine that problem empirically
4 Study Context Data and Methods
41 Medicare Advantage
One of the most consequential choices an elderly person can make is whether to enroll
in traditional Medicare which provides fee-for-service health insurance or in a Medicare
Advantage plan which gives beneficiaries a choice among private health plans that offer
benefits that are at least actuarially equivalent to traditional Medicare89 The Medicare
enrollment process typically favors traditional Medicare as evidenced by the way beneficiaries
8 During the initial enrollment period of seven months around onersquos 65
th birthday beneficiaries who
choose to join traditional Medicare are defaulted into Part A (hospital insurance) they have the options to enroll in Part B (physician services) and Part D (prescription drug coverage) Delaying enrollment in Part B andor Part D results in late-enrollment penalties The majority of beneficiaries in traditional Medicare also enroll in a private Medicare supplemental plan during this period (for example Medigap) thus covering the co-pays and deductibles that are not covered by traditional Medicare 9 Beneficiaries choose among MA plans offered in the service area in which they live usually their county
There are some exceptions for enrollees in MA plans who either move temporarily or move into a planrsquos designated ldquocontinuation areardquo
15
are defaulted into the hospital insurance component of the program (known as Part A) and by
the way information is presented in the Medicare and You package10 Unlike traditional
Medicare most MA plans are managed-care plans in which beneficiaries accept access to a
limited physician network and also accept having their care managed (through prior
authorization and gatekeeping) in exchange for more generous benefits However some MA
plans are private fee-for-service plans MA plans can offer prescription drug coverage through
Medicare Part D (MA-PD plans) or not (MA-only plans)
The availability of MA plans has ebbed and flowed over the programrsquos history Prior to
2003 most MA plans were offered by Health Maintenance Organizations (HMOs) From 1997-
2003 following the passage of Balanced Budget Act of 1997 many plans were terminated
Enrollment in MA fell dramatically from 16 of Medicare beneficiaries in 1999 to 12 in 2002
In many cases a return to traditional Medicare was the only option facing these TCs as
approximately 20 of TCs in during this time had no other MA plan available after their plan
exited (Gold et al 2004)
In 2003 the Medicare Modernization and Improvement Act increased payment rates
paid to MA plans The result was that for the rest of the decade the average MA plan payment
was 12 to 14 percent higher per beneficiary than the estimated cost of coverage for similar
people in traditional Medicare (MedPAC 2010) From 2003-2008 these higher payments
coupled with regulatory provisions led to the establishment of plans offering richer benefit
packages than traditional Medicare These more favorable plans offered reduced out-of-pocket
costs (OOPC) alongside extra benefits (MedPAC 2007 MedPAC 2009) As would be expected
the supply of MA plans in terms of the number and variety of options such as Preferred
10
For example the 2015 materials explain that there is a choice between traditional Medicare and Medicare Advantage in Section 1 titled ldquoLearn how Medicare Worksrdquo However information about Medicare Advantage and its plans doesnrsquot come until page 75 of the Medicare and You booklet (which is Section 5) after ldquoSigning Up for Medicare Parts A amp Brdquo (Section 2) ldquoFind out if Medicare covers your test service or itemrdquo (Section 3) and ldquoWhatrsquos Original Medicarerdquo (Section 4)
16
Provider Organization (PPO) plans and Private Fee-for-Service (PFFS) plans expanded
substantially Like HMOs PPOs are managed-care plans that restrict physician networks
PFFS plans from the period of 2003-2008 were very similar to traditional Medicare offering fee-
for-service coverage but without imposing any provider restrictions In the most recent era of
the Medicare program (since 2006) beneficiaries have been able to switch their coverage
options during the open enrollment period each year (typically starting in mid-October and
lasting six weeks) Beneficiaries in traditional Medicare can elect to switch their prescription
drug plans within traditional Medicare or to switch from traditional Medicare into MA
Beneficiaries in MA can shift across MA plans or switch into traditional Medicare
From 2008 forward the total number of MA plans decreased for a few reasons The
Patient Protection and Affordable Care Act (ACA) of 2010 reduced payments to MA plans
relative to traditional Medicare This legislative measure led some HMO and PPO plans to exit
the market (Afendulis et al 2012) The anticipated payment reductions along with provisions in
the Medicare Improvements for Patients and Providers Act (MIPPA) of 2008 that imposed a
network requirement on PFFS plans made such plans less attractive fewer were offered
Some counties experienced much greater rates of MA plan exits than others though in contrast
to the earlier era in the late 1990s beneficiaries in all counties continued to have access to at
least one MA plan of each plan type from 2007-2010 (MedPAC 2011) Importantly for the
purposes of our study these plan exits were not likely to have been driven by demand-side
behavior (for example by lack of beneficiary demand for MA) In fact MA enrollment continued
to grow steadily through November 2015 (MedPAC 2016) the latest date available
42 Medicare Beneficiary Plan Choice
A growing body of evidence reveals behavior suggesting that some Medicare
beneficiaries enroll in a plan that is suboptimal for them A significant example is status quo
bias in the Medicare market Individuals who decide to enroll in MA tend to remain in the
program over long periods of time Yet few enrollees in traditional Medicare switch into MA
17
(Sinaiko et al 2013 Afendulis et al 2014) In theory this could merely be because the enrollees
in MA and traditional Medicare had different preferences or health risks However the Sinaiko
analysis shows that beneficiaries who remain in traditional Medicare forgo significant savings in
the sum of premiums and out-of-pocket costs an example of what we label ldquomoney-wasting
Medicare beneficiaries being elderly and often unhealthy may often face diminished decision-
making and cognitive capabilities (Hanoch and Rice 2006 Agarwal et al 2008) placing them at
higher risk for biased or inadvertent and therefore possibly poor choices In a changing world
such as the medical marketplace the simplest poor choice to make with an expensive
purchase such as medical insurance is to fail to contemplate the choices and simply to
continue with the current plan
Choice can be impaired in other ways McWilliams et al (2011) find evidence consistent
with ldquochoice overloadrdquo They show that rates of enrollment in MA increased as plan choices
increased up to 15 then plateaued with 16 to 30 plan choices and then declined when
beneficiaries had more than 30 choices available The current authors find as well that
beneficiaries with reduced cognitive function as would be expected were less responsive than
their peers to the generosity of MA benefits when choosing between traditional Medicare and
MA
In the Medicare Part D program a beneficiary chooses among prescription drug plans in
an exchange setting Ketcham et al (2012) and Ketcham et al (2015) use longitudinal data to
demonstrate that at least some Part D enrollees were able to improve their choices in their
second third and fourth year of the program particularly when the potential gains from
switching plans were high They identify this evidence in a complex choice environment which
suggests that these beneficiaries had strong existing preferences for Part D plans However
money-wasting choices in Part D defined as plans that do not roughly minimize the sum of a
beneficiaryrsquos premiums plus out-of-pocket costs for a given level of risk have been observed in
significant numbers among all enrollees and among TCs specifically These inferior choices
18
arise in part because beneficiaries over-value plan premiums relative to all out-of-pocket costs
when making their selections (Abaluck and Gruber 2011 Abaluck and Gruber 2013) Low rates
of Part D enrollment by those eligible to enroll and receive the low-income subsidy a program
that makes this drug coverage and prescription drugs essentially free to beneficiaries reflect
obvious and extreme money-wasting choices (Kuye et al 2013)
The existing literature on Medicare describes a variety of factors that interfere with plan
selection and switching including status quo bias choice overload strongly disparate weighting
of different elements of cost and straightforward money-wasting It also discusses beneficiary
characteristics that make them susceptible to these behavioral biases In this regard the
evidence suggests that TCs are among those making the most effective choices in the Medicare
program First TCs consciously chose to enroll in MA in at the outset rather than accept the
traditional Medicare default thereby demonstrating their preference for receiving health
insurance through a MA plan Second a higher proportion of MA as opposed to traditional
Medicare clients enroll in Medicare Part D which offers prescription drug coverage at heavily
subsidized rates and thus reflects an effective choice Given these facts we would expect TCs
to be less susceptible than most to a default into TM
43 Data
We obtained data from the Centers for Medicare and Medicaid services (CMS) on the
entire population of elderly (age 65+) Medicare beneficiaries in the United States who were
enrolled in an MA plan that included prescription drug coverage (known as an MA-PD plan) for
the years 2006-201111 Henceforth for ease of exposition when we refer to Medicare
Advantage or MA plans or clients we mean MA-PD enrollees
11
Due to data limitations (described in more detail below) we were only able to distinguish a plan exit from a plan merger or a consolidation in MA-PD plans Therefore we excluded MA-only plans from this analysis
19
We excluded beneficiaries who became eligible for Medicare due to disability those
dually eligible for Medicaid the long-term institutionalized and those enrolled with an insurer
outside of their county of residence We also excluded enrollees in Medicare Advantage -
employer plans and Special Needs Plans (SNPs) because these beneficiaries face significantly
different enrollment choices and incentives Finally to focus the analysis on the plan choices
and outcomes in locales with robust MA marketplaces we restricted the analysis to
beneficiaries who lived in the 200 US counties with the largest elderly populations and who were
enrolled in the three most common types of MA contracts HMOs PPOs and PFFS This
sample included 17651389 elderly-person-year observations The data included information
on beneficiariesrsquo dates of birth genders races (black or non-black) zip codes of residence the
MA contracts in which they were enrolled and whether they continued to be enrolled in MA or
switched to traditional Medicare in each month of the study period
Generally insurers contract with Medicare to offer a specific type of plan (HMO PPO or
PFFS) in a county but many insurers offer multiple plans with different names and variable
benefits under each contract Our data included identifiable contract-level but not plan-level
enrollment information for each beneficiary The data also included an encrypted plan-level ID
for each beneficiary which importantly for this study allowed us to link to information on market-
level plan changes at the county level (such as consolidations mergers exits or no change)
Because we did not have information on the default options for beneficiaries whose MA plans
went through a merger or consolidation we dropped these beneficiaries (24 of observations)
from our analysis Our final study sample following this exclusion included 17226866 person-
year observations
44 Cohorts
We analyzed the characteristics and transitions of TCs over three pairs of years 2006-
2007 2009-2010 and 2010-2011 We did not examine transitions in 2007-2008 or 2008-2009
20
because very few MA contracts terminated in those intermediate years as a consequence they
provided too few TCs to study
Our study group of TCs includes all beneficiaries in our sample who were enrolled in a
plan and MA-PD contract that was offered in their county of residence in the first year of the
period but that was no longer offered in the second year12 We conducted this analysis at the
contract level for two reasons First contract exits often leave beneficiaries without a substitute
nearly identical to the terminated plan which is not the case with plan exits13 Second we know
the default for these clients namely enrollment in traditional Medicare
We analyzed the choices of two other types of MA beneficiaries in our sample voluntary
switchers and stayers Voluntary switchers are those who chose to either switch to a new MA
contract or switch into traditional Medicare although their prior MA contract continued to be
available had they wanted to stay enrolled in it Stayers are beneficiaries who did not act during
open enrollment and therefore by choice or by inaction were re-enrolled the following year in
their existing plan Both voluntary switchers and stayers faced circumstances different from
those of terminated choosers given that TCs had no choice but to switch plans Finally we
also examined the choices of original choosers who were beneficiaries who turned 65 in the
12
MA plans that are exiting a market must notify beneficiaries 60 days before the end of the year that their coverage will end on December 31
st of that year Exiting plans must inform beneficiaries that they
can change to TM or choose another MA plan from a provided list of plans available in the service area The beneficiaries remain in the Medicare program regardless of what they choose Beneficiaries have from the time they are notified until approximately two months after their coverage ends to make these elections though enrolling by December 31
st ensures no interruption in coverage Beneficiaries electing
to return to traditional Medicare will have neither prescription drug coverage nor any Medicare supplemental coverage (Medigap) to pay the costs that traditional Medicare doesnrsquot cover unless they actively choose to enroll in those plans at that time Beneficiaries who do not enroll in Part D at that time will incur a financial penalty if they later choose to do so 13
When a single plan within a contract exits a beneficiary may have a choice of another plan offered by the same carrier under the same contract that offers covered benefits cost-sharing requirements and physician networks strikingly similar to the exiting plan We would expect choices made by these TCs who have very similar alternatives available to consciously choose MA more than others Unfortunately we cannot observe when this circumstance occurs in our data Moreover in some cases these TCs might be defaulted into the similar plan alternative still available within their existing contract We thus restrict the analysis to TCs in plans for which the entire contract is terminated where staying in MA requires that these TCs select a plan in a new contract and where the default if they fail to make a choice is to be enrolled in traditional Medicare
21
second year of the two-year period and who then enrolled in MA or traditional Medicare for the
first time the latter perhaps due to a default into traditional Medicare
45 Descriptive Analyses
First we present descriptive statistics on the enrollment outcomes for these four groups
TCs voluntary switchers stayers and original choosers and their rates of switching into
traditional Medicare and their rates of switching into different types of MA contracts for HMO
enrollees in 2006-07 for HMO enrollees in 2009-10 and for PFFS enrollees in 2009-10 In
2010 the widespread exit of PFFS contracts created many TCs However due to data
limitations we could not observe the types of MA contracts in which voluntary switchers and
TCs enrolled in 2011 neither could we examine the choices across plans for beneficiaries who
remained in MA in 2011 Therefore we only examined transitions from MA to traditional
Medicare during the 2010-2011 period both by TCs and by voluntary switchers
46 Statistical Analyses
Terminated choosers differ from voluntary switchers and from stayers because TCs but
for the termination of their plan would have included both stayers and voluntary switchers
Given the termination we cannot distinguish between these two types in enrollment claims data
Comparing TCs to either group alone would be an unfair comparison
To identify as best possible appropriate comparisons for the choices of terminated
choosers and to bring balance to our terminated and comparison populations we used a
weighting approach that uses a propensity score approach (Hirano and Imbens 2001 and Kurth
et al 2006) to account for observable differences between terminated choosers and non-
terminated choosers (including both voluntary switchers and stayers) and to bring the non-
terminated chooser population into balance with the terminated choosers We then analyzed
differences in plan outcomes between this weighted comparison group of non-terminated
choosers and the outcomes for terminated choosers
22
This approach first employs a logit model to estimate the propensity for being a
terminated chooser on the basis of age gender race (black or not) and county We control for
county because plan payment rates are set at the county level and thus could affect a health
planrsquos propensity to withdraw and therefore a beneficiaryrsquos probability of being a terminated
chooser Moreover because all residents within a county face the same plan choices our
results are not driven by differences in underlying plan choice sets facing TCs and non-TCs14
To account for changes in payments and differences in preferences for insurance plan types
models were run separately by year and MA plan type (HMO or PFFS) We applied the
coefficients from this model to the data to estimate the probability p that each beneficiary in a
non-terminated contract would be a terminated chooser We then generate a set of weights
where each terminated chooser was assigned a weight equal to 1 and non-terminated
choosers were assigned a weight of (p1-p) (Hirano and Imbens 2001 and Kurth et al 2006) 15
The weighted distributions of characteristics of terminated and non-terminated choosers are
identical (see Appendix) and weighted analyses therefore adjust for potential confounding due
to the individual characteristics included in the propensity score models16
We compared weighted rates of enrollment into traditional Medicare and into MA overall
Among beneficiaries who remained in MA we compared rates of enrollment across types of MA
plans (MA-HMO MA-PPO and MA-PFFS) Statistical significance was assessed using
Pearsonrsquos chi-square test We also compared differences in rates of enrollment in Part D plans
among beneficiaries who switched into traditional Medicare
14
Beneficiaries in counties that did not experience any plan terminations were excluded from the analysis 15
In instances where the number of terminated choosers (the treatment population) was greater than the number of non-terminated choosers (the control population) estimating propensity-score weights in this population would result in a loss in efficiency Due to the dramatic changes in the PFFS market that began in 2009 this circumstance arose for the PFFS market in a subset of our study counties during the 2009-2010 study period Therefore we restricted the 2009 PFFS models to include only counties where there were at least as many non-terminated choosers as terminated choosers 16
Others have applied this methodology to analyze the impact of health insurance on health care utilization and on health care spending (see for example McWilliams et al 2007 Zhang et al 2009)
23
5 Results
51 Beneficiary switching and descriptive transitions
Over the period 2006-2010 nearly 233000 beneficiaries in MA plans became TCs17
TCs were similar in age gender and race to both voluntary switchers and stayers but were
much more likely to have been enrolled in their MA contracts for a shorter duration one year or
less (Table 1) The vast majority of the MA contract exits examined occurred in 2006 2009 and
2010 The yearly proportion of MA enrollees who switched out their plan increased over the
study period from 88 to 138 and the majority of switchers each year were voluntary
switchers (Table 2) Voluntary switchers were more likely than TCs to transition from MA to
traditional Medicare following each of those years (Table 3)
Tables 4a and 4b present unadjusted descriptive data on the transitions of TCs and all
other types of beneficiaries voluntary switchers stayers and original choosers Considering
transitions in 2006-2007 (Table 4a) TCs in all plan types were much less likely to transition to
traditional Medicare than were voluntary switchers moving out of the same plan types The
transition numbers are 52 vs 195 for HMO enrollees 150 vs 249 for PPO enrollees
25 vs 416 for PFFS enrollees--though this last category had a very small sample size
Among beneficiaries who were in an MA-HMO in 2006 TCs were more likely to enroll in a PFFS
plan than were voluntary switchers Together voluntary switchers and TCs who stayed in MA
were more likely to enroll in a non-HMO plan than were either stayers (column 7) or original
choosers who chose MA (column 8)
By contrast in 2009 when significant numbers of PFFS plans first exited from MA
markets TCsrsquo higher rate of remaining in MA as compared to voluntary switchers was driven by
terminated choosers in PFFS plans In 2009 a large proportion of terminated choosers had
17
This figure includes TCs created in all five years of the entire period though 98 occurred in 2006 2009 and 2010
24
originally enrolled in PFFS plans In comparison with voluntary switchers from PFFS in 2009
TCs were dramatically more likely to stay in MA in 2010 (850 vs 418 Table 4b column 5
vs 6) Another large group of terminated choosers in 2009 had originally enrolled in a PPO
plan Here we observe the one instance in which a larger proportion of these beneficiaries
transitioned to traditional Medicare than did voluntary switchers from this plan type (353 vs
161 Table 4b column 3 vs 4) TCs in MA-HMO plans were slightly less likely to transition to
traditional Medicare than were voluntary switchers from MA-HMO plans (154 vs 172)
Again we observe from 2009-2010 as we did from 2006-2007 that both voluntary switchers
and TCs who stayed in MA were more likely to enroll in a non-HMO plan than were stayers
(column 7) and original choosers who chose MA (column 8)
52 Statistical Analyses
It is not possible to draw appropriate inferences about the impact of default policies and
the effects of terminated plans simply based on the results from Section 51 That is because
neither voluntary switchers nor stayers nor original choosers constitute an appropriate
comparison group for TCs This section presents results on plan enrollment outcomes of TCs
versus those for a sample of non-terminated choosers that includes both voluntary switchers
and stayers where members of that sample were weighted according to their propensity for
being in a terminated plan thereby creating balance between the two groups
TCs in our pooled sample were more likely to transition to traditional Medicare than were
non-terminated choosers (111 vs 26 plt0001) (Table 5) This pattern holds both among
TCs who were originally enrolled in HMOs and those originally enrolled in PFFS Medicare
Advantage plans TCs were three times more likely to move to traditional Medicare from MA-
HMO contracts in 2006 twelve times more likely to move to traditional Medicare from MA-HMO
contracts in 2009 and twice as likely to move to traditional Medicare from MA-PFFS contracts in
2009
25
Multiple forces could contribute to these dramatic disparities One possibility is that
status quo bias among individuals whose plans survived led them to stick with their plan going
forward A second is that some TCs were affected by the default into traditional Medicare when
traditional Medicare may or may not have been their second choice We incline to status quo
bias of the non-terminated choosers being the principal explanation as that grouprsquos members
only switched to traditional Medicare 26 of the time The switch percentage for TCs to
traditional Medicare was 111 implying that the default was hardly determinative
53 Further analysis of quality of choices and susceptibility to nudges
TCs who transitioned from MA to traditional Medicare were a distinct minority No doubt
some of these transitions were voluntary but some may have been influenced by the default
into traditional Medicare If so this should be reflected in the differential likelihood that these
two groups of TCs chose to enroll in a plan with prescription drug coverage That is because
prior to their plan termination all TCs in our sample had selected a Medicare Advantage plan
that included a prescription drug plan Traditional Medicare with Part D or a new Medicare
Advantage plan with Part D is much closer to being actuarially equivalent to their plan prior to
their termination than is traditional Medicare without Part D However traditional Medicare
without Part D is the default TCs who move into Traditional Medicare must actively enroll in a
Part D plan if they are to have prescription drug coverage Given their original choices and the
heavy subsidies of Part D we conclude that those TCs transitioning to traditional Medicare
without Part D probably made a mistake and suffered expected monetary losses
We compared the rates of enrollment in a Part D plan among TCs (Table 6) First the
top panel shows that among all TCs those moving to traditional Medicare were significantly
more likely to fail to enroll in a Part D plan than were their peers who actively chose to stay in
MA (206 vs 17)
The second panel shows the population of TCs who transitioned to Traditional Medicare
Beneficiaries who were male were more likely to fail to enroll in Part D than were women (240
26
vs 192 plt0001) as were beneficiaries who were black vs non-black (387 vs 202
plt0001) Failing to enroll in a Part D plan decreases with age and with median household
income of the zip code in which beneficiaries reside
6 Discussion
This study investigates the phenomenon of a policy-imposed default versus the forces
promoting consistent choices among terminated choosers in health insurance markets The
evidence shows that the default policy associated with contract terminations in Medicare
Advantage had a moderate impact on the transitions of beneficiaries in terminated plans from
MA to traditional Medicare TCs were more likely to be enrolled in traditional Medicare in the
year following their plan terminations than were non-terminated choosers However a very
large percentage of TCs took specific action to select new MA plans following their initial planrsquos
termination Their active choices to remain in MA likely stemmed from the same preferences
that were operating when they originally reviewed the available plans and deliberately chose
MA The persistent preferences of these individuals were perhaps reinforced by status quo
bias which has been shown to exist for some combination of rational and irrational reasons
among Medicare beneficiaries
The majority of TCs who transitioned into traditional Medicare from 2009-2010 also
showed their ability to choose contrary to a default Roughly three quarters of them took the
active step to enroll in the Part D benefit The remaining quarter of TCs transitioning to
traditional Medicare following their plan termination failed to take up a Part D plan an outcome
in contrast to their prior selection of a MA plan with Part D suggesting some susceptibility to
nudges Those most susceptible were more likely to be black male younger and to live in a zip
code with lower median household income The finding that susceptibility decreases with age is
a bit surprising given that aging is associated with cognitive decline which inhibits decision-
making However working in opposition and presumably prevailing is the fact that older
27
beneficiaries presumably are more likely to need more prescription drugs and thus benefit more
from Part D coverage
Typically default rules are used to nudge people away from making errors that might
otherwise occur in complex high-stakes choice environments (for example with 401K plan
enrollment) and where the experts are in relatively widespread agreement on which alternative
is superior The default nudge studied here differs dramatically from more traditional policy
nudges for two reasons First there is no evidence that it was actively designed to promote
superior choices for individuals In fact the lack of automatic enrollment in Part D leaves
beneficiaries who accepted the default substantially worse off in expectation than they would be
if they had been able to stay in their prior plan Second this nudge pushes individuals towards
an option that is quite different than what they had chosen in a prior period These two features
of the default and therefore their implications for consumer welfare differ from the vast majority
of nudges reported in previous literature
Why does Medicare include this default Given that Medicare Advantage costs the
government more and that Part D coverage is heavily subsidized one possible justification
would be that a successful nudge would save the government money But surely that
consideration should be weighed against having beneficiaries choose against their preferred
plans And any government that gets into the business of such nudges has to worry about
hurting its overall legitimacy Rather the specified default for TCs in Medicare Advantage is
likely in place because it mirrors the default for original choosers in the Medicare program
which is traditional Medicare and it is the most administratively simple to implement
However the specified default of TCs to traditional Medicare fails to make use of
information about beneficiariesrsquo revealed preferences among plans A second MA plan is likely
28
more similar to the original choice than TM in several consequential ways (eg covered
benefits cost-sharing requirements) hence likely to be better suited to the client18
Smart defaults which take into account individual starting positions preferences or
expected needs have been suggested as an alternative to the ldquobenignrdquo default discussed thus
far in this paper (Smith et al 2009) Smart defaults have begun to be used in other public
programs19 and have been shown to have the potential to achieve large savings for enrollees in
Medicare Part D (Zhang et al 2015)20
Because of differences in physician networks across health plans smart defaults would
add administrative complexity but they would be feasible For example in Medicare a smart
default system could analyze the degree of overlap in physician networks across MA plans in an
area it could then use MA as the default if the overlap reached a certain threshold below the
threshold the default would be TM An even more sophisticated algorithm could consider the
physicians the individual has previously used and at a more advanced level could even include
information about recent diagnoses and the implications for appropriate health-care coverage
The success of these default alternatives would be revealed if we observed that relatively few
TCs chose against them
More generally the outcomes for terminated choosers in other health-insurance
exchange settings should be examined Nearly 13 million individuals have enrolled in health
plans through state or federal health-insurance marketplaces created under the ACA These
18
By analogy consider if one had to choose a new car default for an individual who was trading in an SUV that was no longer made An SUV default would more likely meet his preferences than a sedan 19
For example the California demonstration project to Integrate Care for Dual Eligible Beneficiaries (the Cal MediConnect program) is passively enrolling individuals into health plans using an ldquointelligent assignmentrdquo process that analyzes the individualrsquos recently used providers and matches those providers to the physician networks of participating plans Individuals will be passively enrolled in the plan that best meets their current circumstances prioritizing continuity of care There is a 90-day period when individuals can change plans or opt-out (California Department of Health Care Services 2014) 20
Zhang et al simulate an ldquointelligent assignmentrdquo algorithm that would assigning Medicare beneficiaries with schizophrenia who are eligible for a low-income subsidy to the least expensive Part D prescription drug plan based on their prior year drug use instead of random assignment to any plan (the current policy) and project savings on average of $387 per beneficiary
29
include many different types of clients those who were previously insured in individual
insurance plans and who presumably have considerable experience selecting plans and
navigating the market and those who were previously uninsured and who likely have very little
experience with health insurance The effects of default policies following plan terminations
across these different types of enrollees could differ dramatically In some ACA marketplaces
TCs who fail to select a new option for coverage lose their health insurance coverage
altogether an outcome that is clearly sub-optimal relative to their prior choice In 2017
enrollees in terminated plans purchased through federally-facilitated marketplaces may be
automatically enrolled in a new plan (generally the lowest-cost plan of the same product network
type) if they donrsquot choose a new plan or actively opt-out of the marketplace (Jost 2016)
Plan enrollment decisions are very consequential for individuals Increasing numbers of
Americans are choosing plans in health insurance exchange settings such as Medicare the
Affordable Care Act (ACA) and private exchanges and turmoil and large numbers of TCs are
inevitable Whether terminated choosers in these exchanges select and enroll in new plans and
how their responses vary based on default policy and previous insurance status health status
and other characteristics are matters of great policy consequence Any guidance and defaults
provided for TCs should attend to their past revealed preferences
30
Table 1 Characteristics of Stayers vs Terminated Choosers vs Voluntary switchers
MA-PD enrollees in the 200 largest counties in the US 2006 ndash 2010
Stayers Terminated Choosers Voluntary Switchers
n (person-years) 15590641 232538 1403687
Female 584 573 558
Black (vs non-black) 79 77 91
Age
65-69 279 353 318
70-74 257 253 251
75-79 219 185 199
80-84 149 124 135
85+ 97 86 98
Years enrolled in plan (prior to switch)
lt1 131 408 270
1 135 184 191
2 106 124 145
3+ 627 285 389
Expected OOPC $284 $350 $279
Premium $135 $171 $132
Base year
2006 2684837 29283 194292
2007 2888710 3184 193470
2008 3217796 1745 207787
2009 3280679 57591 388048
2010 3518619 140735 420090
Source Authors analysis of Medicare enrollment data Sample includes beneficiaries who gained eligibility
and were not disabled Excludes beneficiaries in employer-sponsored plans and non-HMO PPO and PFFS plans
Excludes beneficiaries in contracts that experienced a merger or consolidation
Stayer = did not switch out of MA-PD contract
Terminated chooser = switched out of MA-PD contract not offered in county in subsequent year
Voluntary switchers = switched out of MA-PD contract offered in county in subsequent year
In contract switching from Excludes 2006 (data not available)
31
Table 2 MA-PD switching rates 2006-2010
Switchers who are Switch Terminated Voluntary Year Beneficiaries Contracts Choosers Switchers
2006 2908412 88 114 886 2007 3085364 66 16 984 2008 3427328 63 08 992 2009 3726318 122 132 869
2010 4079444 138 251 749
Authorsrsquo analysis of Medicare enrollment data in the 200 US counties with the largest elderly populations
Sample = 17226866 person-years
32
Table 3 Transitions from MA-PD to TM
Among beneficiaries Percent moving to TM
Year Terminated Choosers Voluntary Switchers
2006-07 67 202 2009-10 238 257
2010-11 221 456
Source Authors analysis of Medicare enrollment data
33
Table 4a Beneficiary transitions and enrollment outcomes 2006-07
MA-HMO MA-PPO MA-PFFS
Original Choosers
Terminated choosers
Voluntary switchers
Terminated choosers
Voluntary switchers
Terminated choosers
Voluntary switchers Stayers
(age 65) in 2007
(1) (2) (3) (4) (5) (6) (7) (8)
N 25040 171167 4239 22406 4 719 2684837 164857
Into TM in 2007 52 195 150 249 250 416 00 na
In MA in 2007 948 805 850 751 750 584 1000 na
Within MA
MA-HMO 618 598 341 442 00 417 951 819
MA-PPO 13 176 558 259 00 76 44 131
MA-PFFS 369 142 93 274 1000 445 05 50
MA-Other 00 84 08 25 00 62 00
Table 4b Beneficiary transitions and enrollment outcomes 2009-10
MA-HMO MA-PPO MA-PFFS
Original choosers
Terminated
choosers Voluntary switchers
Terminated choosers
Voluntary switchers
Terminated choosers
Voluntary switchers Stayers
(age 65) in 2010
N 3919 238793 24986 66605 28686 82650 3280679 229608
Into TM in 2010 154 172 353 161 150 582 00 na
In MA in 2010 846 828 647 839 850 418 1000 na
Within MA
MA-HMO 620 687 564 504 308 440 883 761
MA-PPO 218 256 373 420 366 477 96 205
MA-PFFS 158 31 54 68 325 82 22 34
MA-Other 04 26 92 77 01 02 00
34
Table 5 Enrollment outcomes for terminated choosers vs weighted comparison group1
Terminated Weighted
choosers comparison group
Enrollment in next year
Study Sample overall TM 111 26
MA-HMO 464 838
MA-PPO 128 25
MA-PFFS 295 110
Stratified by year and plan type
Enrollment in 2007
TM 52 13
MA-HMO in 2006 MA-HMO 582 968
MA-PPO 13 02
MA-PFFS 352 16
Enrollment in 2010
TM 154 13
MA-HMO in 2009 MA-HMO 524 963
MA-PPO 185 18
MA-PFFS 133 06
Enrollment in 2010
TM 175 79
MA-PFFS in 2009 MA-HMO 305 152
MA-PPO 258 120
MA-PFFS 261 650
Notes Study sample includes terminated choosers (enrollees in terminated HMO plans in 2006
or 2009 or in terminated PFFS plans in 2009) and propensity-score based weighted
comparison group of non-terminated choosers) 1
All differences in distribution of enrollment across plan types are statistically significant
at plt0001
35
Table 6 Susceptibility to nudges Proportion of Terminated Choosers (TCs)
who did NOT select a Part D plan
Did not enroll in Part D
()
All TCs with plan termination in 2009 TCs who chose a new MA plan 17 TCs who went into traditional Medicare 206
Did not enroll in Part D
()
TCs with plan termination in 2009 or 2010 who went into traditional Medicare
Male 240 Female 192
Black 387 Non-Black 202
Age group 65-69 238
70-74 207
75-79 206 80-84 198 85+ 164
Distribution of Median HH income in zip code First quartile (lowest median HH income) 245 Second quartile 206
Third quartile 204
Fourth quartile (highest median HH income) 192
Source Authors analysis of Medicare enrollment data
Predicted enrollment based on logistic regression model controlling for age gender race (black or non-black) median HH income in
zip code of residence and year Sample size 44286 TC=terminated chooser
36
References Abaluck J and J Gruber Choice Inconsistencies among the Elderly Evidence from Plan Choice in the Medicare Part D Program American Economic Review 2011 101 (4) 1180ndash210 Abaluck J and Gruber J Evolving Choice Inconsistencies in Choice of Prescription Drug Insurance NBER Working Paper 19163 June 2013 Afendulis CC Landrum MB Chernew ME The Impact of the Affordable Care Act on Medicare Advantage Plan Availability and Enrollment Health Services Research 2012 47(6) 2339-2352 Afendulis CC Sinaiko AD Frank RG Dominated Choices and Medicare Advantage Enrollment NBER Working Paper no20181 2014 Agarwal S Driscoll J Gabaix X and Laibson D The age of reason Financial decisions over the lifecycle In American Law and Economic Association Annual Meetings 2008 Armour S Republicans Question Viability of Co-Ops Wall Street Journal (online) [New York NY] 25 Feb 2016 Arrow K Uncertainty and the welfare economics of medical care American Economic Review 1963 53(5) 941-973 Beshears J J J Choi D Laibson and B C Madrian 2008 How Are Preferences Revealed Journal of Public Economics 92 (8ndash9) 1787ndash94 Beshears J J J Choi D Laibson and B C Madrian The Importance of Default Options for Retirement Savings Options In Brown Liebman and Wise eds Social Security Policy in a Changing Environment Chicago IL University of Chicago Press 2009 p 167-195 Camerer C Loewenstein G and Prelec D Neuroeconomics How Neuroscience can Inform Economics Journal of Economic Literature 2005 43(1)9-64 Cox C Claxton G Levitt L ldquoAnalysis of Insurer Participation in 2016 Marketplacesrdquo Kaiser Family Foundation Issue Brief Nov 03 2015 httpkfforghealth-reformissue-briefanalysis-of-insurer-participation-in-2016-marketplaces (Accessed on Apr 20 2015) Cox C and Semanskee A ldquoAnalysis of UnitedHealth Grouprsquos Premiums and Participation in ACA Marketplacesrdquo Kaiser Family Foundation Issue Brief April 18 2016 Cox C and Semanskee A ldquoPreliminary Data on Insurer Exits and Entrants in 2017 Affordable Care Act Marketplacesrdquo Kaiser Family Foundation Data Note August 2016 Cutler D and Reber S Paying for health insurance the trade-off between competition and adverse selection Quarterly Journal of Economics 1998 113(2) 443-466 Dafny L Hendel I and Wilson N ldquoNarrow Networks on the Health Insurance Exchanges What Do They Look Like and How Do They Affect Pricingrdquo The American Economic Review 105(5) 110-114 Dafny L Gruber J and Ody C ldquoMore Insurers Lower Premiums Evidence from Initial Pricing in the Health Insurance Marketplacesrdquo The American Journal of Health Economics 2015 1(1) 53-81
37
Frank RG (2007) Behavioral Economics and Health Economics In Behavioral Economics and Its Applications Diamond P and Vartiainen H (Eds) Princeton Princeton University Press Gabel JR Whitmore H Stromberg S et al ldquoAnalysis Finds No Nationwide Increase in Health Insurance Marketplace Premiumsrdquo Commonwealth Fund Blog [blog on the Internet] 2014 Dec 22 [cited 2016 Apr 20] Available from httpwwwcommonwealthfundorgpublicationsblog2014deczero-inflation-nationwide-for-marketplace-premiums Gold M Achman L Mittler J and Stevens B 2004 ldquoMonitoring Medicare+Choice What Have We Learned Findings and Operational Lessons for Medicare Advantagerdquo Washington DC Mathematica Policy Research Doct No PR04-43 Goldstein D G E J Johnson A Herrmann and M Heitman ldquoNudge Your Customers Toward Better Choicesrdquo Harvard Business Review December 2008 99-105 Hanoch Y and T Rice Can Limiting Choice Increase Social Welfare The Elderly and Health Insurance Milbank Quarterly 2006 84 (1) 37ndash73 Hirano Keisuke and Imbens Guido W Estimation of causal effects using propensity score weighting An application to data on right heart catheterization Health Services and Outcomes Research Methodology 2001 2259-278 Johnson EJ and Goldstein DG Do Defaults Save Lives Science 2003 3021338-1339 Jost T Updated Renewal and Discontinuation Notices Auto-Reenrollment And Other ACA Developments Health Affairs Blog September 5 2016 wwwhealthaffairsorg (accessed December 4 2016) Keeney RL and Raiffa H Decisions with Multiple Objectives Preferences and Value Trade-offs Cambridge [England] New York NY Cambridge University Press 1976 Ketcham JD Lucarelli C Miravete EJ and Roebuck MC Sinking Swimming or Learning to Swim in Medicare Part D American Economic Review 2012 102(6) 2639-2673 Ketcham JD Lucarelli C and Powers CA Paying Attention or Paying Too Much in Medicare Part D American Economic Review 2015 105(1) 204-233 King R Colorado to Close Obamacare Co-Op Washington Examiner (online) October 16 2015 Kowalski A The Early Impact of the Affordable Care Act State by State Brookings Papers on Economic Activity Economic Studies Program The Brookings Institution vol 49(2 (Fall 2014)) pages 277-355 Kurth T Walker AM Glynn RJ et al Results of multivariable logistic regression propensity matching propensity adjustment and propensity-based weighting under conditions of nonuniform effect Am J Epidemiol 163262-270 2006 Kuye IO Frank RG McWilliams JM Cognition and Take-Up of Subsidized Drug Benefits by Medicare Beneficiaries JAMA Intern Med 2013 doi101001jamainternmed2013845
38
La Monica PR ldquoUnitedHealthcare to Exit Most Obamacare Exchangesrdquo CNN Money April 19 2016 httpmoneycnncom20160419investingunitedhealthcare-obamacare-exchanges-acaindexhtml (Accessed April 20 2016) Madrian B C and D F Shea 2001 The Power of Suggestion Inertia in 401(k) Participation and Savings Behavior Quarterly Journal of Economics 1161149ndash87 McWilliams J M C C Afendulis T G McGuire and B E Landon 2011 Complex Medicare Advantage Choices May Overwhelm SeniorsmdashEspecially Those with Impaired Decision Making Health Affairs 30 (9) 1786ndash94 McWilliams J M J Hsu and J P Newhouse 2012 New Risk-adjustment System Was Associated with Reduced Favorable Selection in Medicare Advantage Health Affairs 31 (12) 2630ndash40 McWilliams JM Meara E Zaslavsky AM Ayanian JZ Use of health services by previously uninsured Medicare beneficiaries New England Journal of Medicine 2007a357143-53 PMID 17625126 Medicare Payment Advisory Commission 2000 Report to the Congress Improving Risk Adjustment in Medicare Washington DC Medicare Payment Advisory Commission Medicare Payment Advisory Commission 2007 Report to Congress Medicare Payment Policy Washington DC Medicare Payment Advisory Commission Medicare Payment Advisory Commission 2009 Report to the Congress Improving Incentives in the Medicare Program Washington DC Medicare Payment Advisory Commission Medicare Payment Advisory Commission 2010 Report to Congress Medicare Payment Policy Washington DC Medicare Payment Advisory Commission Medicare Payment Advisory Commission 2011 Report to Congress Medicare Payment Policy Washington DC Medicare Payment Advisory Commission Medicare Payment Advisory Commission 2016 Report to Congress Medicare Payment Policy Washington DC Medicare Payment Advisory Commission Newhouse J P M Price J Huang J M McWilliams and J Hsu 2012 Steps to Reduce Favorable Risk Selection in Medicare Advantage Largely Succeeded Boding Well for Health Insurance Exchanges Health Affairs 31 (12) 2618ndash28 Pear R Some Policies Get More Time in Health Shift The New York Times March 6 2014 p A1 Pear R Aetna to Pull Back From Public Health Care Exchanges The New York Times August 16 2016 Physician Payment Review Commission Annual Report to Congress 1996 Washington DC Physician Payment Review Commission
39
Riley G and C Zarabozo Trends in the Health Status of Medicare Risk Contract Enrollees Health Care Financing Review 2006 28 (2) 81ndash95 Samuelson W and R Zeckhauser Status Quo Bias in Decision Makingrdquo Journal of Risk and Uncertainty 1988 17ndash59 Sinaiko AD Afendulis CC and Frank RG Enrollment in Medicare Advantage Plans in Miami-Dade County Evidence of Status Quo Bias Inquiry 2013 Smith CN Goldstein D Johnson EJ Smart defaults From hidden persuaders to adaptive helpers (Working Paper INSEAD 2009) available at httppapersssrncomezp-prod1hulharvardedusol3paperscfmabstract_id=1116650 Thaler R and Sunstein C Nudge Improving Decisions about Health Wealth and Happiness (New York NY Penguin Books 2009) Zhang Y Baik SH and Newhouse JP Use of Intelligent Assignment to Medicare Part D Plans for People With Schizophrenia Could Produce Substantial Savings Health Affairs 2015 34(3) 455-460 Zhang Y Donohue JM Lave JR ODonnel G Newhouse JP The Effect of Medicare Part D on Drug and Medical Spending N Engl J Med 2009 36152-61
40
Appendix A1 Medicare Advantage contract-level out-of-pocket cost data We obtained previously determined estimates of the out-of-pocket costs (OOPC) including premiums associated with each MA-PD plan option The Centers for Medicare and Medicaid Services (CMS) calculated these estimates by taking medical utilization data for a standard population of Medicare beneficiaries and applying the coverage and cost-sharing rules specific to each plan to these utilization data to determine the average monthly out-of-pocket costs expected for a beneficiary enrolling in that plan21 These calculations were conducted separately for five self-reported health-status groups and for six age groups To merge these estimates with our contract-level enrollment data for each age group in each county in a given year we averaged OOPC estimates for the five health-status groups within plans and then averaged the OOPC plan estimates for all plans under a given MA-PD contract We applied county contract-level enrollment data to calculate an enrollment-weighted average OOPC of being in an MA-PD contract for each age group and year for all contracts available in each county
21
The standard population was a two-year sample of TM-enrolled respondents to the Medicare Current Beneficiary Survey This estimate assumes that the quantity of services consumed does not vary with the differing cost-sharing rules across the MA plans
41
A2 Demographic Characteristics of Terminated and Non-Terminated Choosers
2006 HMO
Unweighted Weighted Non-Terminated Terminated Non-Terminated Terminated
N 2723831 21953 2723831 21953 black 80 25 24 25 male 414 393 389 393
a7074 273 303 302 303
a7579 231 252 253 252 a8084 152 147 150 147
a85 90 86 87 86 a7074male 118 123 121 123 a7074black 24 07 06 07 a7579male 97 104 103 104 a7579black 17 07 07 07 a8084male 59 54 54 54 a8084black 10 04 04 04
a85male 31 28 28 28 a85black 06 02 02 02
2009 HMO
Unweighted Weighted Non-Terminated Terminated Non-Terminated Terminated
N 3133379 3919 3199973 3919 black 85 125 123 125
male 417 443 445 443 a7074 252 255 256 255 a7579 219 190 189 190 a8084 152 120 120 120
a85 101 73 73 73 a7074male 109 115 116 115 a7074black 24 31 31 31 a7579male 93 81 80 81 a7579black 18 25 25 25 a8084male 61 52 52 52 a8084black 11 10 10 10
a85male 35 26 26 26 a85black 07 06 06 06
42
2009 PFFS
Unweighted Weighted Non-Terminated Terminated Non-Terminated Terminated
N 148736 17852 148736 17852 black 65 73 70 73 male 424 433 437 433
a7074 242 249 249 249 a7579 193 163 161 163
a8084 135 106 105 106 a85 85 62 61 62
a7074male 107 110 111 110 a7074black 17 21 20 21 a7579male 82 71 71 71 a7579black 13 12 12 12 a8084male 54 41 41 41 a8084black 08 07 07 07
a85male 28 20 20 20 a85black 05 04 04 04
12
long-term profits The government presumably would have dual goals individual satisfaction
as well as government costs Thus the government would not wish to have its nudge override
strong consumer preferences Our presentation focuses on the case where the nudger who is
seeking to maximize expected welfare has some concern with catering to consumer
preferences
Some nudges can be resisted by individuals merely by mildly resisting them Thus an
individual who has a strong preference for product A may stick with it even if advertising or
advisories or a salesman pushes them strongly towards B However to overcome some
nudges may entail an actual cost This happens frequently with defaults when for example to
overcome a default one need merely check a different box or make a single brief phone call
In other cases the process to overcome requires substantial time and effort Difficulty
overcoming a default also occurs when one has no idea of how to do so or because the time to
do so is far in the future so people do not take notice when they are defaulted (Introductory
subscriptions to a magazine which renew automatically unless you call to cancel represent a
prime example of this latter case) The costs involved in overcoming a default nudge represent
dead weight losses
Consider now the nudger who seeks the optimal nudge n to maximize expected
welfare For this illustration it will be the government The nudger knows f(p) and g(s) It also
knows that there is an unrecognized loss of k for every individual who chooses A Note k may
arise because individuals incur a health cost they ignore or because the government incurs a
financial cost if A is chosen rather than B and individuals do not internalize that cost Finally
there is a deadweight loss of d for every individual who is subjected to the nudge but still
chooses A Thus d is the cost of overcoming the nudge Both k and d are calibrated in the
same units as p The government as stated would like to maximize expected net benefits
To reiterate an individual will choose A if their C value C = p(1-s) + ns is strictly
positive (Assume that indifferent people C = 0 follow the nudge)
13
Total welfare is given by
int int (119901 minus 119896 minus 119889)119891(119901)119889119901 + int (minus119901)119891(119901) 119889119901119862lt0119862ge0
119892(119904) 119889119904119904
(2)
Thus the government will pick n to maximize (2) the expected payoff to a randomly
chosen individual
Fuller presentations will examine how n changes depending on f(p) g(s) the values of
k and d etc For example if f(p) has considerable density at high values that is lots of people
strongly like A g(s) takes on mostly modest values and if d is consequential then a strong
nudge indeed any nudge may diminish welfare This is because a large fraction of the
population will overcome the nudge and thus incur consequential cost d
Many additional factors would enter an optimal nudge model For example it would
seem plausible of course that the cost of overcoming a nudge would depend on the magnitude
of the nudge that d would be an increasing function of |n| If so as d increases the optimal
nudge would diminish6
An optimal nudge might change over time Say that you nudge a population once
Some people follow the nudge Others do not Presumably nudge followers are
disproportionately individuals with low values of p though some with higher values of p but also
high values of s will also be nudged
If nothing changed of course a second nudge of the same value would have no effect
This would not be the case if there is error in computing C7 so that an individual who usually
would have switched did not do so the first time Alternatively p and s might drift around a bit
say following a random walk so a second-round nudge would change behavior Even in light of
6 Two factors lead to this result First as d increases the benefits of switching the marginal individual
diminish Second the cost to those not switching increases A reduction in nudge is beneficial on both grounds 7 If the nudge were a default for example the individual might have missed the opportunity to ldquocorrectrdquo it
Thatrsquos how magazines make money by offering really cheap introductory subscriptions
14
these possibilities we would still expect those who resisted the nudge initially to be
disproportionately high in p
Under reasonable regularity conditions this high p result for initial resisters would imply
that for this group the optimal nudge would be weaker the second time around A greater
percentage of the folks who would be subject to it would optimally stick with choice A The
converse also applies In a situation where people had to choose a second time the optimal
nudge for those who initially succumbed would be increased
We now turn to apply this broad framework for nudges to the particular empirical
problem of defaults for TCs in health insurance markets We examine the results of a nudge of
TCs from Medicare Advantage through a default to Traditional Medicare where TCs can only
overcome that nudge if they make an active choice back to MA We first describe Medicare
Advantage in more detail and then examine that problem empirically
4 Study Context Data and Methods
41 Medicare Advantage
One of the most consequential choices an elderly person can make is whether to enroll
in traditional Medicare which provides fee-for-service health insurance or in a Medicare
Advantage plan which gives beneficiaries a choice among private health plans that offer
benefits that are at least actuarially equivalent to traditional Medicare89 The Medicare
enrollment process typically favors traditional Medicare as evidenced by the way beneficiaries
8 During the initial enrollment period of seven months around onersquos 65
th birthday beneficiaries who
choose to join traditional Medicare are defaulted into Part A (hospital insurance) they have the options to enroll in Part B (physician services) and Part D (prescription drug coverage) Delaying enrollment in Part B andor Part D results in late-enrollment penalties The majority of beneficiaries in traditional Medicare also enroll in a private Medicare supplemental plan during this period (for example Medigap) thus covering the co-pays and deductibles that are not covered by traditional Medicare 9 Beneficiaries choose among MA plans offered in the service area in which they live usually their county
There are some exceptions for enrollees in MA plans who either move temporarily or move into a planrsquos designated ldquocontinuation areardquo
15
are defaulted into the hospital insurance component of the program (known as Part A) and by
the way information is presented in the Medicare and You package10 Unlike traditional
Medicare most MA plans are managed-care plans in which beneficiaries accept access to a
limited physician network and also accept having their care managed (through prior
authorization and gatekeeping) in exchange for more generous benefits However some MA
plans are private fee-for-service plans MA plans can offer prescription drug coverage through
Medicare Part D (MA-PD plans) or not (MA-only plans)
The availability of MA plans has ebbed and flowed over the programrsquos history Prior to
2003 most MA plans were offered by Health Maintenance Organizations (HMOs) From 1997-
2003 following the passage of Balanced Budget Act of 1997 many plans were terminated
Enrollment in MA fell dramatically from 16 of Medicare beneficiaries in 1999 to 12 in 2002
In many cases a return to traditional Medicare was the only option facing these TCs as
approximately 20 of TCs in during this time had no other MA plan available after their plan
exited (Gold et al 2004)
In 2003 the Medicare Modernization and Improvement Act increased payment rates
paid to MA plans The result was that for the rest of the decade the average MA plan payment
was 12 to 14 percent higher per beneficiary than the estimated cost of coverage for similar
people in traditional Medicare (MedPAC 2010) From 2003-2008 these higher payments
coupled with regulatory provisions led to the establishment of plans offering richer benefit
packages than traditional Medicare These more favorable plans offered reduced out-of-pocket
costs (OOPC) alongside extra benefits (MedPAC 2007 MedPAC 2009) As would be expected
the supply of MA plans in terms of the number and variety of options such as Preferred
10
For example the 2015 materials explain that there is a choice between traditional Medicare and Medicare Advantage in Section 1 titled ldquoLearn how Medicare Worksrdquo However information about Medicare Advantage and its plans doesnrsquot come until page 75 of the Medicare and You booklet (which is Section 5) after ldquoSigning Up for Medicare Parts A amp Brdquo (Section 2) ldquoFind out if Medicare covers your test service or itemrdquo (Section 3) and ldquoWhatrsquos Original Medicarerdquo (Section 4)
16
Provider Organization (PPO) plans and Private Fee-for-Service (PFFS) plans expanded
substantially Like HMOs PPOs are managed-care plans that restrict physician networks
PFFS plans from the period of 2003-2008 were very similar to traditional Medicare offering fee-
for-service coverage but without imposing any provider restrictions In the most recent era of
the Medicare program (since 2006) beneficiaries have been able to switch their coverage
options during the open enrollment period each year (typically starting in mid-October and
lasting six weeks) Beneficiaries in traditional Medicare can elect to switch their prescription
drug plans within traditional Medicare or to switch from traditional Medicare into MA
Beneficiaries in MA can shift across MA plans or switch into traditional Medicare
From 2008 forward the total number of MA plans decreased for a few reasons The
Patient Protection and Affordable Care Act (ACA) of 2010 reduced payments to MA plans
relative to traditional Medicare This legislative measure led some HMO and PPO plans to exit
the market (Afendulis et al 2012) The anticipated payment reductions along with provisions in
the Medicare Improvements for Patients and Providers Act (MIPPA) of 2008 that imposed a
network requirement on PFFS plans made such plans less attractive fewer were offered
Some counties experienced much greater rates of MA plan exits than others though in contrast
to the earlier era in the late 1990s beneficiaries in all counties continued to have access to at
least one MA plan of each plan type from 2007-2010 (MedPAC 2011) Importantly for the
purposes of our study these plan exits were not likely to have been driven by demand-side
behavior (for example by lack of beneficiary demand for MA) In fact MA enrollment continued
to grow steadily through November 2015 (MedPAC 2016) the latest date available
42 Medicare Beneficiary Plan Choice
A growing body of evidence reveals behavior suggesting that some Medicare
beneficiaries enroll in a plan that is suboptimal for them A significant example is status quo
bias in the Medicare market Individuals who decide to enroll in MA tend to remain in the
program over long periods of time Yet few enrollees in traditional Medicare switch into MA
17
(Sinaiko et al 2013 Afendulis et al 2014) In theory this could merely be because the enrollees
in MA and traditional Medicare had different preferences or health risks However the Sinaiko
analysis shows that beneficiaries who remain in traditional Medicare forgo significant savings in
the sum of premiums and out-of-pocket costs an example of what we label ldquomoney-wasting
Medicare beneficiaries being elderly and often unhealthy may often face diminished decision-
making and cognitive capabilities (Hanoch and Rice 2006 Agarwal et al 2008) placing them at
higher risk for biased or inadvertent and therefore possibly poor choices In a changing world
such as the medical marketplace the simplest poor choice to make with an expensive
purchase such as medical insurance is to fail to contemplate the choices and simply to
continue with the current plan
Choice can be impaired in other ways McWilliams et al (2011) find evidence consistent
with ldquochoice overloadrdquo They show that rates of enrollment in MA increased as plan choices
increased up to 15 then plateaued with 16 to 30 plan choices and then declined when
beneficiaries had more than 30 choices available The current authors find as well that
beneficiaries with reduced cognitive function as would be expected were less responsive than
their peers to the generosity of MA benefits when choosing between traditional Medicare and
MA
In the Medicare Part D program a beneficiary chooses among prescription drug plans in
an exchange setting Ketcham et al (2012) and Ketcham et al (2015) use longitudinal data to
demonstrate that at least some Part D enrollees were able to improve their choices in their
second third and fourth year of the program particularly when the potential gains from
switching plans were high They identify this evidence in a complex choice environment which
suggests that these beneficiaries had strong existing preferences for Part D plans However
money-wasting choices in Part D defined as plans that do not roughly minimize the sum of a
beneficiaryrsquos premiums plus out-of-pocket costs for a given level of risk have been observed in
significant numbers among all enrollees and among TCs specifically These inferior choices
18
arise in part because beneficiaries over-value plan premiums relative to all out-of-pocket costs
when making their selections (Abaluck and Gruber 2011 Abaluck and Gruber 2013) Low rates
of Part D enrollment by those eligible to enroll and receive the low-income subsidy a program
that makes this drug coverage and prescription drugs essentially free to beneficiaries reflect
obvious and extreme money-wasting choices (Kuye et al 2013)
The existing literature on Medicare describes a variety of factors that interfere with plan
selection and switching including status quo bias choice overload strongly disparate weighting
of different elements of cost and straightforward money-wasting It also discusses beneficiary
characteristics that make them susceptible to these behavioral biases In this regard the
evidence suggests that TCs are among those making the most effective choices in the Medicare
program First TCs consciously chose to enroll in MA in at the outset rather than accept the
traditional Medicare default thereby demonstrating their preference for receiving health
insurance through a MA plan Second a higher proportion of MA as opposed to traditional
Medicare clients enroll in Medicare Part D which offers prescription drug coverage at heavily
subsidized rates and thus reflects an effective choice Given these facts we would expect TCs
to be less susceptible than most to a default into TM
43 Data
We obtained data from the Centers for Medicare and Medicaid services (CMS) on the
entire population of elderly (age 65+) Medicare beneficiaries in the United States who were
enrolled in an MA plan that included prescription drug coverage (known as an MA-PD plan) for
the years 2006-201111 Henceforth for ease of exposition when we refer to Medicare
Advantage or MA plans or clients we mean MA-PD enrollees
11
Due to data limitations (described in more detail below) we were only able to distinguish a plan exit from a plan merger or a consolidation in MA-PD plans Therefore we excluded MA-only plans from this analysis
19
We excluded beneficiaries who became eligible for Medicare due to disability those
dually eligible for Medicaid the long-term institutionalized and those enrolled with an insurer
outside of their county of residence We also excluded enrollees in Medicare Advantage -
employer plans and Special Needs Plans (SNPs) because these beneficiaries face significantly
different enrollment choices and incentives Finally to focus the analysis on the plan choices
and outcomes in locales with robust MA marketplaces we restricted the analysis to
beneficiaries who lived in the 200 US counties with the largest elderly populations and who were
enrolled in the three most common types of MA contracts HMOs PPOs and PFFS This
sample included 17651389 elderly-person-year observations The data included information
on beneficiariesrsquo dates of birth genders races (black or non-black) zip codes of residence the
MA contracts in which they were enrolled and whether they continued to be enrolled in MA or
switched to traditional Medicare in each month of the study period
Generally insurers contract with Medicare to offer a specific type of plan (HMO PPO or
PFFS) in a county but many insurers offer multiple plans with different names and variable
benefits under each contract Our data included identifiable contract-level but not plan-level
enrollment information for each beneficiary The data also included an encrypted plan-level ID
for each beneficiary which importantly for this study allowed us to link to information on market-
level plan changes at the county level (such as consolidations mergers exits or no change)
Because we did not have information on the default options for beneficiaries whose MA plans
went through a merger or consolidation we dropped these beneficiaries (24 of observations)
from our analysis Our final study sample following this exclusion included 17226866 person-
year observations
44 Cohorts
We analyzed the characteristics and transitions of TCs over three pairs of years 2006-
2007 2009-2010 and 2010-2011 We did not examine transitions in 2007-2008 or 2008-2009
20
because very few MA contracts terminated in those intermediate years as a consequence they
provided too few TCs to study
Our study group of TCs includes all beneficiaries in our sample who were enrolled in a
plan and MA-PD contract that was offered in their county of residence in the first year of the
period but that was no longer offered in the second year12 We conducted this analysis at the
contract level for two reasons First contract exits often leave beneficiaries without a substitute
nearly identical to the terminated plan which is not the case with plan exits13 Second we know
the default for these clients namely enrollment in traditional Medicare
We analyzed the choices of two other types of MA beneficiaries in our sample voluntary
switchers and stayers Voluntary switchers are those who chose to either switch to a new MA
contract or switch into traditional Medicare although their prior MA contract continued to be
available had they wanted to stay enrolled in it Stayers are beneficiaries who did not act during
open enrollment and therefore by choice or by inaction were re-enrolled the following year in
their existing plan Both voluntary switchers and stayers faced circumstances different from
those of terminated choosers given that TCs had no choice but to switch plans Finally we
also examined the choices of original choosers who were beneficiaries who turned 65 in the
12
MA plans that are exiting a market must notify beneficiaries 60 days before the end of the year that their coverage will end on December 31
st of that year Exiting plans must inform beneficiaries that they
can change to TM or choose another MA plan from a provided list of plans available in the service area The beneficiaries remain in the Medicare program regardless of what they choose Beneficiaries have from the time they are notified until approximately two months after their coverage ends to make these elections though enrolling by December 31
st ensures no interruption in coverage Beneficiaries electing
to return to traditional Medicare will have neither prescription drug coverage nor any Medicare supplemental coverage (Medigap) to pay the costs that traditional Medicare doesnrsquot cover unless they actively choose to enroll in those plans at that time Beneficiaries who do not enroll in Part D at that time will incur a financial penalty if they later choose to do so 13
When a single plan within a contract exits a beneficiary may have a choice of another plan offered by the same carrier under the same contract that offers covered benefits cost-sharing requirements and physician networks strikingly similar to the exiting plan We would expect choices made by these TCs who have very similar alternatives available to consciously choose MA more than others Unfortunately we cannot observe when this circumstance occurs in our data Moreover in some cases these TCs might be defaulted into the similar plan alternative still available within their existing contract We thus restrict the analysis to TCs in plans for which the entire contract is terminated where staying in MA requires that these TCs select a plan in a new contract and where the default if they fail to make a choice is to be enrolled in traditional Medicare
21
second year of the two-year period and who then enrolled in MA or traditional Medicare for the
first time the latter perhaps due to a default into traditional Medicare
45 Descriptive Analyses
First we present descriptive statistics on the enrollment outcomes for these four groups
TCs voluntary switchers stayers and original choosers and their rates of switching into
traditional Medicare and their rates of switching into different types of MA contracts for HMO
enrollees in 2006-07 for HMO enrollees in 2009-10 and for PFFS enrollees in 2009-10 In
2010 the widespread exit of PFFS contracts created many TCs However due to data
limitations we could not observe the types of MA contracts in which voluntary switchers and
TCs enrolled in 2011 neither could we examine the choices across plans for beneficiaries who
remained in MA in 2011 Therefore we only examined transitions from MA to traditional
Medicare during the 2010-2011 period both by TCs and by voluntary switchers
46 Statistical Analyses
Terminated choosers differ from voluntary switchers and from stayers because TCs but
for the termination of their plan would have included both stayers and voluntary switchers
Given the termination we cannot distinguish between these two types in enrollment claims data
Comparing TCs to either group alone would be an unfair comparison
To identify as best possible appropriate comparisons for the choices of terminated
choosers and to bring balance to our terminated and comparison populations we used a
weighting approach that uses a propensity score approach (Hirano and Imbens 2001 and Kurth
et al 2006) to account for observable differences between terminated choosers and non-
terminated choosers (including both voluntary switchers and stayers) and to bring the non-
terminated chooser population into balance with the terminated choosers We then analyzed
differences in plan outcomes between this weighted comparison group of non-terminated
choosers and the outcomes for terminated choosers
22
This approach first employs a logit model to estimate the propensity for being a
terminated chooser on the basis of age gender race (black or not) and county We control for
county because plan payment rates are set at the county level and thus could affect a health
planrsquos propensity to withdraw and therefore a beneficiaryrsquos probability of being a terminated
chooser Moreover because all residents within a county face the same plan choices our
results are not driven by differences in underlying plan choice sets facing TCs and non-TCs14
To account for changes in payments and differences in preferences for insurance plan types
models were run separately by year and MA plan type (HMO or PFFS) We applied the
coefficients from this model to the data to estimate the probability p that each beneficiary in a
non-terminated contract would be a terminated chooser We then generate a set of weights
where each terminated chooser was assigned a weight equal to 1 and non-terminated
choosers were assigned a weight of (p1-p) (Hirano and Imbens 2001 and Kurth et al 2006) 15
The weighted distributions of characteristics of terminated and non-terminated choosers are
identical (see Appendix) and weighted analyses therefore adjust for potential confounding due
to the individual characteristics included in the propensity score models16
We compared weighted rates of enrollment into traditional Medicare and into MA overall
Among beneficiaries who remained in MA we compared rates of enrollment across types of MA
plans (MA-HMO MA-PPO and MA-PFFS) Statistical significance was assessed using
Pearsonrsquos chi-square test We also compared differences in rates of enrollment in Part D plans
among beneficiaries who switched into traditional Medicare
14
Beneficiaries in counties that did not experience any plan terminations were excluded from the analysis 15
In instances where the number of terminated choosers (the treatment population) was greater than the number of non-terminated choosers (the control population) estimating propensity-score weights in this population would result in a loss in efficiency Due to the dramatic changes in the PFFS market that began in 2009 this circumstance arose for the PFFS market in a subset of our study counties during the 2009-2010 study period Therefore we restricted the 2009 PFFS models to include only counties where there were at least as many non-terminated choosers as terminated choosers 16
Others have applied this methodology to analyze the impact of health insurance on health care utilization and on health care spending (see for example McWilliams et al 2007 Zhang et al 2009)
23
5 Results
51 Beneficiary switching and descriptive transitions
Over the period 2006-2010 nearly 233000 beneficiaries in MA plans became TCs17
TCs were similar in age gender and race to both voluntary switchers and stayers but were
much more likely to have been enrolled in their MA contracts for a shorter duration one year or
less (Table 1) The vast majority of the MA contract exits examined occurred in 2006 2009 and
2010 The yearly proportion of MA enrollees who switched out their plan increased over the
study period from 88 to 138 and the majority of switchers each year were voluntary
switchers (Table 2) Voluntary switchers were more likely than TCs to transition from MA to
traditional Medicare following each of those years (Table 3)
Tables 4a and 4b present unadjusted descriptive data on the transitions of TCs and all
other types of beneficiaries voluntary switchers stayers and original choosers Considering
transitions in 2006-2007 (Table 4a) TCs in all plan types were much less likely to transition to
traditional Medicare than were voluntary switchers moving out of the same plan types The
transition numbers are 52 vs 195 for HMO enrollees 150 vs 249 for PPO enrollees
25 vs 416 for PFFS enrollees--though this last category had a very small sample size
Among beneficiaries who were in an MA-HMO in 2006 TCs were more likely to enroll in a PFFS
plan than were voluntary switchers Together voluntary switchers and TCs who stayed in MA
were more likely to enroll in a non-HMO plan than were either stayers (column 7) or original
choosers who chose MA (column 8)
By contrast in 2009 when significant numbers of PFFS plans first exited from MA
markets TCsrsquo higher rate of remaining in MA as compared to voluntary switchers was driven by
terminated choosers in PFFS plans In 2009 a large proportion of terminated choosers had
17
This figure includes TCs created in all five years of the entire period though 98 occurred in 2006 2009 and 2010
24
originally enrolled in PFFS plans In comparison with voluntary switchers from PFFS in 2009
TCs were dramatically more likely to stay in MA in 2010 (850 vs 418 Table 4b column 5
vs 6) Another large group of terminated choosers in 2009 had originally enrolled in a PPO
plan Here we observe the one instance in which a larger proportion of these beneficiaries
transitioned to traditional Medicare than did voluntary switchers from this plan type (353 vs
161 Table 4b column 3 vs 4) TCs in MA-HMO plans were slightly less likely to transition to
traditional Medicare than were voluntary switchers from MA-HMO plans (154 vs 172)
Again we observe from 2009-2010 as we did from 2006-2007 that both voluntary switchers
and TCs who stayed in MA were more likely to enroll in a non-HMO plan than were stayers
(column 7) and original choosers who chose MA (column 8)
52 Statistical Analyses
It is not possible to draw appropriate inferences about the impact of default policies and
the effects of terminated plans simply based on the results from Section 51 That is because
neither voluntary switchers nor stayers nor original choosers constitute an appropriate
comparison group for TCs This section presents results on plan enrollment outcomes of TCs
versus those for a sample of non-terminated choosers that includes both voluntary switchers
and stayers where members of that sample were weighted according to their propensity for
being in a terminated plan thereby creating balance between the two groups
TCs in our pooled sample were more likely to transition to traditional Medicare than were
non-terminated choosers (111 vs 26 plt0001) (Table 5) This pattern holds both among
TCs who were originally enrolled in HMOs and those originally enrolled in PFFS Medicare
Advantage plans TCs were three times more likely to move to traditional Medicare from MA-
HMO contracts in 2006 twelve times more likely to move to traditional Medicare from MA-HMO
contracts in 2009 and twice as likely to move to traditional Medicare from MA-PFFS contracts in
2009
25
Multiple forces could contribute to these dramatic disparities One possibility is that
status quo bias among individuals whose plans survived led them to stick with their plan going
forward A second is that some TCs were affected by the default into traditional Medicare when
traditional Medicare may or may not have been their second choice We incline to status quo
bias of the non-terminated choosers being the principal explanation as that grouprsquos members
only switched to traditional Medicare 26 of the time The switch percentage for TCs to
traditional Medicare was 111 implying that the default was hardly determinative
53 Further analysis of quality of choices and susceptibility to nudges
TCs who transitioned from MA to traditional Medicare were a distinct minority No doubt
some of these transitions were voluntary but some may have been influenced by the default
into traditional Medicare If so this should be reflected in the differential likelihood that these
two groups of TCs chose to enroll in a plan with prescription drug coverage That is because
prior to their plan termination all TCs in our sample had selected a Medicare Advantage plan
that included a prescription drug plan Traditional Medicare with Part D or a new Medicare
Advantage plan with Part D is much closer to being actuarially equivalent to their plan prior to
their termination than is traditional Medicare without Part D However traditional Medicare
without Part D is the default TCs who move into Traditional Medicare must actively enroll in a
Part D plan if they are to have prescription drug coverage Given their original choices and the
heavy subsidies of Part D we conclude that those TCs transitioning to traditional Medicare
without Part D probably made a mistake and suffered expected monetary losses
We compared the rates of enrollment in a Part D plan among TCs (Table 6) First the
top panel shows that among all TCs those moving to traditional Medicare were significantly
more likely to fail to enroll in a Part D plan than were their peers who actively chose to stay in
MA (206 vs 17)
The second panel shows the population of TCs who transitioned to Traditional Medicare
Beneficiaries who were male were more likely to fail to enroll in Part D than were women (240
26
vs 192 plt0001) as were beneficiaries who were black vs non-black (387 vs 202
plt0001) Failing to enroll in a Part D plan decreases with age and with median household
income of the zip code in which beneficiaries reside
6 Discussion
This study investigates the phenomenon of a policy-imposed default versus the forces
promoting consistent choices among terminated choosers in health insurance markets The
evidence shows that the default policy associated with contract terminations in Medicare
Advantage had a moderate impact on the transitions of beneficiaries in terminated plans from
MA to traditional Medicare TCs were more likely to be enrolled in traditional Medicare in the
year following their plan terminations than were non-terminated choosers However a very
large percentage of TCs took specific action to select new MA plans following their initial planrsquos
termination Their active choices to remain in MA likely stemmed from the same preferences
that were operating when they originally reviewed the available plans and deliberately chose
MA The persistent preferences of these individuals were perhaps reinforced by status quo
bias which has been shown to exist for some combination of rational and irrational reasons
among Medicare beneficiaries
The majority of TCs who transitioned into traditional Medicare from 2009-2010 also
showed their ability to choose contrary to a default Roughly three quarters of them took the
active step to enroll in the Part D benefit The remaining quarter of TCs transitioning to
traditional Medicare following their plan termination failed to take up a Part D plan an outcome
in contrast to their prior selection of a MA plan with Part D suggesting some susceptibility to
nudges Those most susceptible were more likely to be black male younger and to live in a zip
code with lower median household income The finding that susceptibility decreases with age is
a bit surprising given that aging is associated with cognitive decline which inhibits decision-
making However working in opposition and presumably prevailing is the fact that older
27
beneficiaries presumably are more likely to need more prescription drugs and thus benefit more
from Part D coverage
Typically default rules are used to nudge people away from making errors that might
otherwise occur in complex high-stakes choice environments (for example with 401K plan
enrollment) and where the experts are in relatively widespread agreement on which alternative
is superior The default nudge studied here differs dramatically from more traditional policy
nudges for two reasons First there is no evidence that it was actively designed to promote
superior choices for individuals In fact the lack of automatic enrollment in Part D leaves
beneficiaries who accepted the default substantially worse off in expectation than they would be
if they had been able to stay in their prior plan Second this nudge pushes individuals towards
an option that is quite different than what they had chosen in a prior period These two features
of the default and therefore their implications for consumer welfare differ from the vast majority
of nudges reported in previous literature
Why does Medicare include this default Given that Medicare Advantage costs the
government more and that Part D coverage is heavily subsidized one possible justification
would be that a successful nudge would save the government money But surely that
consideration should be weighed against having beneficiaries choose against their preferred
plans And any government that gets into the business of such nudges has to worry about
hurting its overall legitimacy Rather the specified default for TCs in Medicare Advantage is
likely in place because it mirrors the default for original choosers in the Medicare program
which is traditional Medicare and it is the most administratively simple to implement
However the specified default of TCs to traditional Medicare fails to make use of
information about beneficiariesrsquo revealed preferences among plans A second MA plan is likely
28
more similar to the original choice than TM in several consequential ways (eg covered
benefits cost-sharing requirements) hence likely to be better suited to the client18
Smart defaults which take into account individual starting positions preferences or
expected needs have been suggested as an alternative to the ldquobenignrdquo default discussed thus
far in this paper (Smith et al 2009) Smart defaults have begun to be used in other public
programs19 and have been shown to have the potential to achieve large savings for enrollees in
Medicare Part D (Zhang et al 2015)20
Because of differences in physician networks across health plans smart defaults would
add administrative complexity but they would be feasible For example in Medicare a smart
default system could analyze the degree of overlap in physician networks across MA plans in an
area it could then use MA as the default if the overlap reached a certain threshold below the
threshold the default would be TM An even more sophisticated algorithm could consider the
physicians the individual has previously used and at a more advanced level could even include
information about recent diagnoses and the implications for appropriate health-care coverage
The success of these default alternatives would be revealed if we observed that relatively few
TCs chose against them
More generally the outcomes for terminated choosers in other health-insurance
exchange settings should be examined Nearly 13 million individuals have enrolled in health
plans through state or federal health-insurance marketplaces created under the ACA These
18
By analogy consider if one had to choose a new car default for an individual who was trading in an SUV that was no longer made An SUV default would more likely meet his preferences than a sedan 19
For example the California demonstration project to Integrate Care for Dual Eligible Beneficiaries (the Cal MediConnect program) is passively enrolling individuals into health plans using an ldquointelligent assignmentrdquo process that analyzes the individualrsquos recently used providers and matches those providers to the physician networks of participating plans Individuals will be passively enrolled in the plan that best meets their current circumstances prioritizing continuity of care There is a 90-day period when individuals can change plans or opt-out (California Department of Health Care Services 2014) 20
Zhang et al simulate an ldquointelligent assignmentrdquo algorithm that would assigning Medicare beneficiaries with schizophrenia who are eligible for a low-income subsidy to the least expensive Part D prescription drug plan based on their prior year drug use instead of random assignment to any plan (the current policy) and project savings on average of $387 per beneficiary
29
include many different types of clients those who were previously insured in individual
insurance plans and who presumably have considerable experience selecting plans and
navigating the market and those who were previously uninsured and who likely have very little
experience with health insurance The effects of default policies following plan terminations
across these different types of enrollees could differ dramatically In some ACA marketplaces
TCs who fail to select a new option for coverage lose their health insurance coverage
altogether an outcome that is clearly sub-optimal relative to their prior choice In 2017
enrollees in terminated plans purchased through federally-facilitated marketplaces may be
automatically enrolled in a new plan (generally the lowest-cost plan of the same product network
type) if they donrsquot choose a new plan or actively opt-out of the marketplace (Jost 2016)
Plan enrollment decisions are very consequential for individuals Increasing numbers of
Americans are choosing plans in health insurance exchange settings such as Medicare the
Affordable Care Act (ACA) and private exchanges and turmoil and large numbers of TCs are
inevitable Whether terminated choosers in these exchanges select and enroll in new plans and
how their responses vary based on default policy and previous insurance status health status
and other characteristics are matters of great policy consequence Any guidance and defaults
provided for TCs should attend to their past revealed preferences
30
Table 1 Characteristics of Stayers vs Terminated Choosers vs Voluntary switchers
MA-PD enrollees in the 200 largest counties in the US 2006 ndash 2010
Stayers Terminated Choosers Voluntary Switchers
n (person-years) 15590641 232538 1403687
Female 584 573 558
Black (vs non-black) 79 77 91
Age
65-69 279 353 318
70-74 257 253 251
75-79 219 185 199
80-84 149 124 135
85+ 97 86 98
Years enrolled in plan (prior to switch)
lt1 131 408 270
1 135 184 191
2 106 124 145
3+ 627 285 389
Expected OOPC $284 $350 $279
Premium $135 $171 $132
Base year
2006 2684837 29283 194292
2007 2888710 3184 193470
2008 3217796 1745 207787
2009 3280679 57591 388048
2010 3518619 140735 420090
Source Authors analysis of Medicare enrollment data Sample includes beneficiaries who gained eligibility
and were not disabled Excludes beneficiaries in employer-sponsored plans and non-HMO PPO and PFFS plans
Excludes beneficiaries in contracts that experienced a merger or consolidation
Stayer = did not switch out of MA-PD contract
Terminated chooser = switched out of MA-PD contract not offered in county in subsequent year
Voluntary switchers = switched out of MA-PD contract offered in county in subsequent year
In contract switching from Excludes 2006 (data not available)
31
Table 2 MA-PD switching rates 2006-2010
Switchers who are Switch Terminated Voluntary Year Beneficiaries Contracts Choosers Switchers
2006 2908412 88 114 886 2007 3085364 66 16 984 2008 3427328 63 08 992 2009 3726318 122 132 869
2010 4079444 138 251 749
Authorsrsquo analysis of Medicare enrollment data in the 200 US counties with the largest elderly populations
Sample = 17226866 person-years
32
Table 3 Transitions from MA-PD to TM
Among beneficiaries Percent moving to TM
Year Terminated Choosers Voluntary Switchers
2006-07 67 202 2009-10 238 257
2010-11 221 456
Source Authors analysis of Medicare enrollment data
33
Table 4a Beneficiary transitions and enrollment outcomes 2006-07
MA-HMO MA-PPO MA-PFFS
Original Choosers
Terminated choosers
Voluntary switchers
Terminated choosers
Voluntary switchers
Terminated choosers
Voluntary switchers Stayers
(age 65) in 2007
(1) (2) (3) (4) (5) (6) (7) (8)
N 25040 171167 4239 22406 4 719 2684837 164857
Into TM in 2007 52 195 150 249 250 416 00 na
In MA in 2007 948 805 850 751 750 584 1000 na
Within MA
MA-HMO 618 598 341 442 00 417 951 819
MA-PPO 13 176 558 259 00 76 44 131
MA-PFFS 369 142 93 274 1000 445 05 50
MA-Other 00 84 08 25 00 62 00
Table 4b Beneficiary transitions and enrollment outcomes 2009-10
MA-HMO MA-PPO MA-PFFS
Original choosers
Terminated
choosers Voluntary switchers
Terminated choosers
Voluntary switchers
Terminated choosers
Voluntary switchers Stayers
(age 65) in 2010
N 3919 238793 24986 66605 28686 82650 3280679 229608
Into TM in 2010 154 172 353 161 150 582 00 na
In MA in 2010 846 828 647 839 850 418 1000 na
Within MA
MA-HMO 620 687 564 504 308 440 883 761
MA-PPO 218 256 373 420 366 477 96 205
MA-PFFS 158 31 54 68 325 82 22 34
MA-Other 04 26 92 77 01 02 00
34
Table 5 Enrollment outcomes for terminated choosers vs weighted comparison group1
Terminated Weighted
choosers comparison group
Enrollment in next year
Study Sample overall TM 111 26
MA-HMO 464 838
MA-PPO 128 25
MA-PFFS 295 110
Stratified by year and plan type
Enrollment in 2007
TM 52 13
MA-HMO in 2006 MA-HMO 582 968
MA-PPO 13 02
MA-PFFS 352 16
Enrollment in 2010
TM 154 13
MA-HMO in 2009 MA-HMO 524 963
MA-PPO 185 18
MA-PFFS 133 06
Enrollment in 2010
TM 175 79
MA-PFFS in 2009 MA-HMO 305 152
MA-PPO 258 120
MA-PFFS 261 650
Notes Study sample includes terminated choosers (enrollees in terminated HMO plans in 2006
or 2009 or in terminated PFFS plans in 2009) and propensity-score based weighted
comparison group of non-terminated choosers) 1
All differences in distribution of enrollment across plan types are statistically significant
at plt0001
35
Table 6 Susceptibility to nudges Proportion of Terminated Choosers (TCs)
who did NOT select a Part D plan
Did not enroll in Part D
()
All TCs with plan termination in 2009 TCs who chose a new MA plan 17 TCs who went into traditional Medicare 206
Did not enroll in Part D
()
TCs with plan termination in 2009 or 2010 who went into traditional Medicare
Male 240 Female 192
Black 387 Non-Black 202
Age group 65-69 238
70-74 207
75-79 206 80-84 198 85+ 164
Distribution of Median HH income in zip code First quartile (lowest median HH income) 245 Second quartile 206
Third quartile 204
Fourth quartile (highest median HH income) 192
Source Authors analysis of Medicare enrollment data
Predicted enrollment based on logistic regression model controlling for age gender race (black or non-black) median HH income in
zip code of residence and year Sample size 44286 TC=terminated chooser
36
References Abaluck J and J Gruber Choice Inconsistencies among the Elderly Evidence from Plan Choice in the Medicare Part D Program American Economic Review 2011 101 (4) 1180ndash210 Abaluck J and Gruber J Evolving Choice Inconsistencies in Choice of Prescription Drug Insurance NBER Working Paper 19163 June 2013 Afendulis CC Landrum MB Chernew ME The Impact of the Affordable Care Act on Medicare Advantage Plan Availability and Enrollment Health Services Research 2012 47(6) 2339-2352 Afendulis CC Sinaiko AD Frank RG Dominated Choices and Medicare Advantage Enrollment NBER Working Paper no20181 2014 Agarwal S Driscoll J Gabaix X and Laibson D The age of reason Financial decisions over the lifecycle In American Law and Economic Association Annual Meetings 2008 Armour S Republicans Question Viability of Co-Ops Wall Street Journal (online) [New York NY] 25 Feb 2016 Arrow K Uncertainty and the welfare economics of medical care American Economic Review 1963 53(5) 941-973 Beshears J J J Choi D Laibson and B C Madrian 2008 How Are Preferences Revealed Journal of Public Economics 92 (8ndash9) 1787ndash94 Beshears J J J Choi D Laibson and B C Madrian The Importance of Default Options for Retirement Savings Options In Brown Liebman and Wise eds Social Security Policy in a Changing Environment Chicago IL University of Chicago Press 2009 p 167-195 Camerer C Loewenstein G and Prelec D Neuroeconomics How Neuroscience can Inform Economics Journal of Economic Literature 2005 43(1)9-64 Cox C Claxton G Levitt L ldquoAnalysis of Insurer Participation in 2016 Marketplacesrdquo Kaiser Family Foundation Issue Brief Nov 03 2015 httpkfforghealth-reformissue-briefanalysis-of-insurer-participation-in-2016-marketplaces (Accessed on Apr 20 2015) Cox C and Semanskee A ldquoAnalysis of UnitedHealth Grouprsquos Premiums and Participation in ACA Marketplacesrdquo Kaiser Family Foundation Issue Brief April 18 2016 Cox C and Semanskee A ldquoPreliminary Data on Insurer Exits and Entrants in 2017 Affordable Care Act Marketplacesrdquo Kaiser Family Foundation Data Note August 2016 Cutler D and Reber S Paying for health insurance the trade-off between competition and adverse selection Quarterly Journal of Economics 1998 113(2) 443-466 Dafny L Hendel I and Wilson N ldquoNarrow Networks on the Health Insurance Exchanges What Do They Look Like and How Do They Affect Pricingrdquo The American Economic Review 105(5) 110-114 Dafny L Gruber J and Ody C ldquoMore Insurers Lower Premiums Evidence from Initial Pricing in the Health Insurance Marketplacesrdquo The American Journal of Health Economics 2015 1(1) 53-81
37
Frank RG (2007) Behavioral Economics and Health Economics In Behavioral Economics and Its Applications Diamond P and Vartiainen H (Eds) Princeton Princeton University Press Gabel JR Whitmore H Stromberg S et al ldquoAnalysis Finds No Nationwide Increase in Health Insurance Marketplace Premiumsrdquo Commonwealth Fund Blog [blog on the Internet] 2014 Dec 22 [cited 2016 Apr 20] Available from httpwwwcommonwealthfundorgpublicationsblog2014deczero-inflation-nationwide-for-marketplace-premiums Gold M Achman L Mittler J and Stevens B 2004 ldquoMonitoring Medicare+Choice What Have We Learned Findings and Operational Lessons for Medicare Advantagerdquo Washington DC Mathematica Policy Research Doct No PR04-43 Goldstein D G E J Johnson A Herrmann and M Heitman ldquoNudge Your Customers Toward Better Choicesrdquo Harvard Business Review December 2008 99-105 Hanoch Y and T Rice Can Limiting Choice Increase Social Welfare The Elderly and Health Insurance Milbank Quarterly 2006 84 (1) 37ndash73 Hirano Keisuke and Imbens Guido W Estimation of causal effects using propensity score weighting An application to data on right heart catheterization Health Services and Outcomes Research Methodology 2001 2259-278 Johnson EJ and Goldstein DG Do Defaults Save Lives Science 2003 3021338-1339 Jost T Updated Renewal and Discontinuation Notices Auto-Reenrollment And Other ACA Developments Health Affairs Blog September 5 2016 wwwhealthaffairsorg (accessed December 4 2016) Keeney RL and Raiffa H Decisions with Multiple Objectives Preferences and Value Trade-offs Cambridge [England] New York NY Cambridge University Press 1976 Ketcham JD Lucarelli C Miravete EJ and Roebuck MC Sinking Swimming or Learning to Swim in Medicare Part D American Economic Review 2012 102(6) 2639-2673 Ketcham JD Lucarelli C and Powers CA Paying Attention or Paying Too Much in Medicare Part D American Economic Review 2015 105(1) 204-233 King R Colorado to Close Obamacare Co-Op Washington Examiner (online) October 16 2015 Kowalski A The Early Impact of the Affordable Care Act State by State Brookings Papers on Economic Activity Economic Studies Program The Brookings Institution vol 49(2 (Fall 2014)) pages 277-355 Kurth T Walker AM Glynn RJ et al Results of multivariable logistic regression propensity matching propensity adjustment and propensity-based weighting under conditions of nonuniform effect Am J Epidemiol 163262-270 2006 Kuye IO Frank RG McWilliams JM Cognition and Take-Up of Subsidized Drug Benefits by Medicare Beneficiaries JAMA Intern Med 2013 doi101001jamainternmed2013845
38
La Monica PR ldquoUnitedHealthcare to Exit Most Obamacare Exchangesrdquo CNN Money April 19 2016 httpmoneycnncom20160419investingunitedhealthcare-obamacare-exchanges-acaindexhtml (Accessed April 20 2016) Madrian B C and D F Shea 2001 The Power of Suggestion Inertia in 401(k) Participation and Savings Behavior Quarterly Journal of Economics 1161149ndash87 McWilliams J M C C Afendulis T G McGuire and B E Landon 2011 Complex Medicare Advantage Choices May Overwhelm SeniorsmdashEspecially Those with Impaired Decision Making Health Affairs 30 (9) 1786ndash94 McWilliams J M J Hsu and J P Newhouse 2012 New Risk-adjustment System Was Associated with Reduced Favorable Selection in Medicare Advantage Health Affairs 31 (12) 2630ndash40 McWilliams JM Meara E Zaslavsky AM Ayanian JZ Use of health services by previously uninsured Medicare beneficiaries New England Journal of Medicine 2007a357143-53 PMID 17625126 Medicare Payment Advisory Commission 2000 Report to the Congress Improving Risk Adjustment in Medicare Washington DC Medicare Payment Advisory Commission Medicare Payment Advisory Commission 2007 Report to Congress Medicare Payment Policy Washington DC Medicare Payment Advisory Commission Medicare Payment Advisory Commission 2009 Report to the Congress Improving Incentives in the Medicare Program Washington DC Medicare Payment Advisory Commission Medicare Payment Advisory Commission 2010 Report to Congress Medicare Payment Policy Washington DC Medicare Payment Advisory Commission Medicare Payment Advisory Commission 2011 Report to Congress Medicare Payment Policy Washington DC Medicare Payment Advisory Commission Medicare Payment Advisory Commission 2016 Report to Congress Medicare Payment Policy Washington DC Medicare Payment Advisory Commission Newhouse J P M Price J Huang J M McWilliams and J Hsu 2012 Steps to Reduce Favorable Risk Selection in Medicare Advantage Largely Succeeded Boding Well for Health Insurance Exchanges Health Affairs 31 (12) 2618ndash28 Pear R Some Policies Get More Time in Health Shift The New York Times March 6 2014 p A1 Pear R Aetna to Pull Back From Public Health Care Exchanges The New York Times August 16 2016 Physician Payment Review Commission Annual Report to Congress 1996 Washington DC Physician Payment Review Commission
39
Riley G and C Zarabozo Trends in the Health Status of Medicare Risk Contract Enrollees Health Care Financing Review 2006 28 (2) 81ndash95 Samuelson W and R Zeckhauser Status Quo Bias in Decision Makingrdquo Journal of Risk and Uncertainty 1988 17ndash59 Sinaiko AD Afendulis CC and Frank RG Enrollment in Medicare Advantage Plans in Miami-Dade County Evidence of Status Quo Bias Inquiry 2013 Smith CN Goldstein D Johnson EJ Smart defaults From hidden persuaders to adaptive helpers (Working Paper INSEAD 2009) available at httppapersssrncomezp-prod1hulharvardedusol3paperscfmabstract_id=1116650 Thaler R and Sunstein C Nudge Improving Decisions about Health Wealth and Happiness (New York NY Penguin Books 2009) Zhang Y Baik SH and Newhouse JP Use of Intelligent Assignment to Medicare Part D Plans for People With Schizophrenia Could Produce Substantial Savings Health Affairs 2015 34(3) 455-460 Zhang Y Donohue JM Lave JR ODonnel G Newhouse JP The Effect of Medicare Part D on Drug and Medical Spending N Engl J Med 2009 36152-61
40
Appendix A1 Medicare Advantage contract-level out-of-pocket cost data We obtained previously determined estimates of the out-of-pocket costs (OOPC) including premiums associated with each MA-PD plan option The Centers for Medicare and Medicaid Services (CMS) calculated these estimates by taking medical utilization data for a standard population of Medicare beneficiaries and applying the coverage and cost-sharing rules specific to each plan to these utilization data to determine the average monthly out-of-pocket costs expected for a beneficiary enrolling in that plan21 These calculations were conducted separately for five self-reported health-status groups and for six age groups To merge these estimates with our contract-level enrollment data for each age group in each county in a given year we averaged OOPC estimates for the five health-status groups within plans and then averaged the OOPC plan estimates for all plans under a given MA-PD contract We applied county contract-level enrollment data to calculate an enrollment-weighted average OOPC of being in an MA-PD contract for each age group and year for all contracts available in each county
21
The standard population was a two-year sample of TM-enrolled respondents to the Medicare Current Beneficiary Survey This estimate assumes that the quantity of services consumed does not vary with the differing cost-sharing rules across the MA plans
41
A2 Demographic Characteristics of Terminated and Non-Terminated Choosers
2006 HMO
Unweighted Weighted Non-Terminated Terminated Non-Terminated Terminated
N 2723831 21953 2723831 21953 black 80 25 24 25 male 414 393 389 393
a7074 273 303 302 303
a7579 231 252 253 252 a8084 152 147 150 147
a85 90 86 87 86 a7074male 118 123 121 123 a7074black 24 07 06 07 a7579male 97 104 103 104 a7579black 17 07 07 07 a8084male 59 54 54 54 a8084black 10 04 04 04
a85male 31 28 28 28 a85black 06 02 02 02
2009 HMO
Unweighted Weighted Non-Terminated Terminated Non-Terminated Terminated
N 3133379 3919 3199973 3919 black 85 125 123 125
male 417 443 445 443 a7074 252 255 256 255 a7579 219 190 189 190 a8084 152 120 120 120
a85 101 73 73 73 a7074male 109 115 116 115 a7074black 24 31 31 31 a7579male 93 81 80 81 a7579black 18 25 25 25 a8084male 61 52 52 52 a8084black 11 10 10 10
a85male 35 26 26 26 a85black 07 06 06 06
42
2009 PFFS
Unweighted Weighted Non-Terminated Terminated Non-Terminated Terminated
N 148736 17852 148736 17852 black 65 73 70 73 male 424 433 437 433
a7074 242 249 249 249 a7579 193 163 161 163
a8084 135 106 105 106 a85 85 62 61 62
a7074male 107 110 111 110 a7074black 17 21 20 21 a7579male 82 71 71 71 a7579black 13 12 12 12 a8084male 54 41 41 41 a8084black 08 07 07 07
a85male 28 20 20 20 a85black 05 04 04 04
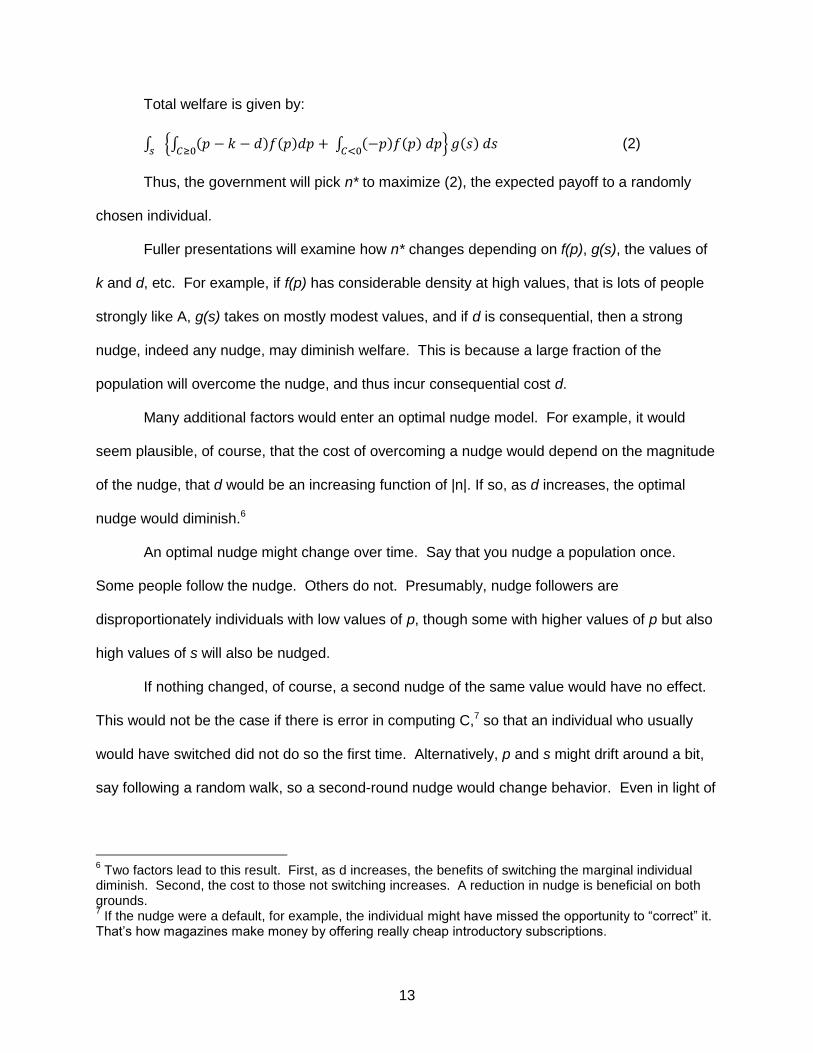
14
these possibilities we would still expect those who resisted the nudge initially to be
disproportionately high in p
Under reasonable regularity conditions this high p result for initial resisters would imply
that for this group the optimal nudge would be weaker the second time around A greater
percentage of the folks who would be subject to it would optimally stick with choice A The
converse also applies In a situation where people had to choose a second time the optimal
nudge for those who initially succumbed would be increased
We now turn to apply this broad framework for nudges to the particular empirical
problem of defaults for TCs in health insurance markets We examine the results of a nudge of
TCs from Medicare Advantage through a default to Traditional Medicare where TCs can only
overcome that nudge if they make an active choice back to MA We first describe Medicare
Advantage in more detail and then examine that problem empirically
4 Study Context Data and Methods
41 Medicare Advantage
One of the most consequential choices an elderly person can make is whether to enroll
in traditional Medicare which provides fee-for-service health insurance or in a Medicare
Advantage plan which gives beneficiaries a choice among private health plans that offer
benefits that are at least actuarially equivalent to traditional Medicare89 The Medicare
enrollment process typically favors traditional Medicare as evidenced by the way beneficiaries
8 During the initial enrollment period of seven months around onersquos 65
th birthday beneficiaries who
choose to join traditional Medicare are defaulted into Part A (hospital insurance) they have the options to enroll in Part B (physician services) and Part D (prescription drug coverage) Delaying enrollment in Part B andor Part D results in late-enrollment penalties The majority of beneficiaries in traditional Medicare also enroll in a private Medicare supplemental plan during this period (for example Medigap) thus covering the co-pays and deductibles that are not covered by traditional Medicare 9 Beneficiaries choose among MA plans offered in the service area in which they live usually their county
There are some exceptions for enrollees in MA plans who either move temporarily or move into a planrsquos designated ldquocontinuation areardquo
15
are defaulted into the hospital insurance component of the program (known as Part A) and by
the way information is presented in the Medicare and You package10 Unlike traditional
Medicare most MA plans are managed-care plans in which beneficiaries accept access to a
limited physician network and also accept having their care managed (through prior
authorization and gatekeeping) in exchange for more generous benefits However some MA
plans are private fee-for-service plans MA plans can offer prescription drug coverage through
Medicare Part D (MA-PD plans) or not (MA-only plans)
The availability of MA plans has ebbed and flowed over the programrsquos history Prior to
2003 most MA plans were offered by Health Maintenance Organizations (HMOs) From 1997-
2003 following the passage of Balanced Budget Act of 1997 many plans were terminated
Enrollment in MA fell dramatically from 16 of Medicare beneficiaries in 1999 to 12 in 2002
In many cases a return to traditional Medicare was the only option facing these TCs as
approximately 20 of TCs in during this time had no other MA plan available after their plan
exited (Gold et al 2004)
In 2003 the Medicare Modernization and Improvement Act increased payment rates
paid to MA plans The result was that for the rest of the decade the average MA plan payment
was 12 to 14 percent higher per beneficiary than the estimated cost of coverage for similar
people in traditional Medicare (MedPAC 2010) From 2003-2008 these higher payments
coupled with regulatory provisions led to the establishment of plans offering richer benefit
packages than traditional Medicare These more favorable plans offered reduced out-of-pocket
costs (OOPC) alongside extra benefits (MedPAC 2007 MedPAC 2009) As would be expected
the supply of MA plans in terms of the number and variety of options such as Preferred
10
For example the 2015 materials explain that there is a choice between traditional Medicare and Medicare Advantage in Section 1 titled ldquoLearn how Medicare Worksrdquo However information about Medicare Advantage and its plans doesnrsquot come until page 75 of the Medicare and You booklet (which is Section 5) after ldquoSigning Up for Medicare Parts A amp Brdquo (Section 2) ldquoFind out if Medicare covers your test service or itemrdquo (Section 3) and ldquoWhatrsquos Original Medicarerdquo (Section 4)
16
Provider Organization (PPO) plans and Private Fee-for-Service (PFFS) plans expanded
substantially Like HMOs PPOs are managed-care plans that restrict physician networks
PFFS plans from the period of 2003-2008 were very similar to traditional Medicare offering fee-
for-service coverage but without imposing any provider restrictions In the most recent era of
the Medicare program (since 2006) beneficiaries have been able to switch their coverage
options during the open enrollment period each year (typically starting in mid-October and
lasting six weeks) Beneficiaries in traditional Medicare can elect to switch their prescription
drug plans within traditional Medicare or to switch from traditional Medicare into MA
Beneficiaries in MA can shift across MA plans or switch into traditional Medicare
From 2008 forward the total number of MA plans decreased for a few reasons The
Patient Protection and Affordable Care Act (ACA) of 2010 reduced payments to MA plans
relative to traditional Medicare This legislative measure led some HMO and PPO plans to exit
the market (Afendulis et al 2012) The anticipated payment reductions along with provisions in
the Medicare Improvements for Patients and Providers Act (MIPPA) of 2008 that imposed a
network requirement on PFFS plans made such plans less attractive fewer were offered
Some counties experienced much greater rates of MA plan exits than others though in contrast
to the earlier era in the late 1990s beneficiaries in all counties continued to have access to at
least one MA plan of each plan type from 2007-2010 (MedPAC 2011) Importantly for the
purposes of our study these plan exits were not likely to have been driven by demand-side
behavior (for example by lack of beneficiary demand for MA) In fact MA enrollment continued
to grow steadily through November 2015 (MedPAC 2016) the latest date available
42 Medicare Beneficiary Plan Choice
A growing body of evidence reveals behavior suggesting that some Medicare
beneficiaries enroll in a plan that is suboptimal for them A significant example is status quo
bias in the Medicare market Individuals who decide to enroll in MA tend to remain in the
program over long periods of time Yet few enrollees in traditional Medicare switch into MA
17
(Sinaiko et al 2013 Afendulis et al 2014) In theory this could merely be because the enrollees
in MA and traditional Medicare had different preferences or health risks However the Sinaiko
analysis shows that beneficiaries who remain in traditional Medicare forgo significant savings in
the sum of premiums and out-of-pocket costs an example of what we label ldquomoney-wasting
Medicare beneficiaries being elderly and often unhealthy may often face diminished decision-
making and cognitive capabilities (Hanoch and Rice 2006 Agarwal et al 2008) placing them at
higher risk for biased or inadvertent and therefore possibly poor choices In a changing world
such as the medical marketplace the simplest poor choice to make with an expensive
purchase such as medical insurance is to fail to contemplate the choices and simply to
continue with the current plan
Choice can be impaired in other ways McWilliams et al (2011) find evidence consistent
with ldquochoice overloadrdquo They show that rates of enrollment in MA increased as plan choices
increased up to 15 then plateaued with 16 to 30 plan choices and then declined when
beneficiaries had more than 30 choices available The current authors find as well that
beneficiaries with reduced cognitive function as would be expected were less responsive than
their peers to the generosity of MA benefits when choosing between traditional Medicare and
MA
In the Medicare Part D program a beneficiary chooses among prescription drug plans in
an exchange setting Ketcham et al (2012) and Ketcham et al (2015) use longitudinal data to
demonstrate that at least some Part D enrollees were able to improve their choices in their
second third and fourth year of the program particularly when the potential gains from
switching plans were high They identify this evidence in a complex choice environment which
suggests that these beneficiaries had strong existing preferences for Part D plans However
money-wasting choices in Part D defined as plans that do not roughly minimize the sum of a
beneficiaryrsquos premiums plus out-of-pocket costs for a given level of risk have been observed in
significant numbers among all enrollees and among TCs specifically These inferior choices
18
arise in part because beneficiaries over-value plan premiums relative to all out-of-pocket costs
when making their selections (Abaluck and Gruber 2011 Abaluck and Gruber 2013) Low rates
of Part D enrollment by those eligible to enroll and receive the low-income subsidy a program
that makes this drug coverage and prescription drugs essentially free to beneficiaries reflect
obvious and extreme money-wasting choices (Kuye et al 2013)
The existing literature on Medicare describes a variety of factors that interfere with plan
selection and switching including status quo bias choice overload strongly disparate weighting
of different elements of cost and straightforward money-wasting It also discusses beneficiary
characteristics that make them susceptible to these behavioral biases In this regard the
evidence suggests that TCs are among those making the most effective choices in the Medicare
program First TCs consciously chose to enroll in MA in at the outset rather than accept the
traditional Medicare default thereby demonstrating their preference for receiving health
insurance through a MA plan Second a higher proportion of MA as opposed to traditional
Medicare clients enroll in Medicare Part D which offers prescription drug coverage at heavily
subsidized rates and thus reflects an effective choice Given these facts we would expect TCs
to be less susceptible than most to a default into TM
43 Data
We obtained data from the Centers for Medicare and Medicaid services (CMS) on the
entire population of elderly (age 65+) Medicare beneficiaries in the United States who were
enrolled in an MA plan that included prescription drug coverage (known as an MA-PD plan) for
the years 2006-201111 Henceforth for ease of exposition when we refer to Medicare
Advantage or MA plans or clients we mean MA-PD enrollees
11
Due to data limitations (described in more detail below) we were only able to distinguish a plan exit from a plan merger or a consolidation in MA-PD plans Therefore we excluded MA-only plans from this analysis
19
We excluded beneficiaries who became eligible for Medicare due to disability those
dually eligible for Medicaid the long-term institutionalized and those enrolled with an insurer
outside of their county of residence We also excluded enrollees in Medicare Advantage -
employer plans and Special Needs Plans (SNPs) because these beneficiaries face significantly
different enrollment choices and incentives Finally to focus the analysis on the plan choices
and outcomes in locales with robust MA marketplaces we restricted the analysis to
beneficiaries who lived in the 200 US counties with the largest elderly populations and who were
enrolled in the three most common types of MA contracts HMOs PPOs and PFFS This
sample included 17651389 elderly-person-year observations The data included information
on beneficiariesrsquo dates of birth genders races (black or non-black) zip codes of residence the
MA contracts in which they were enrolled and whether they continued to be enrolled in MA or
switched to traditional Medicare in each month of the study period
Generally insurers contract with Medicare to offer a specific type of plan (HMO PPO or
PFFS) in a county but many insurers offer multiple plans with different names and variable
benefits under each contract Our data included identifiable contract-level but not plan-level
enrollment information for each beneficiary The data also included an encrypted plan-level ID
for each beneficiary which importantly for this study allowed us to link to information on market-
level plan changes at the county level (such as consolidations mergers exits or no change)
Because we did not have information on the default options for beneficiaries whose MA plans
went through a merger or consolidation we dropped these beneficiaries (24 of observations)
from our analysis Our final study sample following this exclusion included 17226866 person-
year observations
44 Cohorts
We analyzed the characteristics and transitions of TCs over three pairs of years 2006-
2007 2009-2010 and 2010-2011 We did not examine transitions in 2007-2008 or 2008-2009
20
because very few MA contracts terminated in those intermediate years as a consequence they
provided too few TCs to study
Our study group of TCs includes all beneficiaries in our sample who were enrolled in a
plan and MA-PD contract that was offered in their county of residence in the first year of the
period but that was no longer offered in the second year12 We conducted this analysis at the
contract level for two reasons First contract exits often leave beneficiaries without a substitute
nearly identical to the terminated plan which is not the case with plan exits13 Second we know
the default for these clients namely enrollment in traditional Medicare
We analyzed the choices of two other types of MA beneficiaries in our sample voluntary
switchers and stayers Voluntary switchers are those who chose to either switch to a new MA
contract or switch into traditional Medicare although their prior MA contract continued to be
available had they wanted to stay enrolled in it Stayers are beneficiaries who did not act during
open enrollment and therefore by choice or by inaction were re-enrolled the following year in
their existing plan Both voluntary switchers and stayers faced circumstances different from
those of terminated choosers given that TCs had no choice but to switch plans Finally we
also examined the choices of original choosers who were beneficiaries who turned 65 in the
12
MA plans that are exiting a market must notify beneficiaries 60 days before the end of the year that their coverage will end on December 31
st of that year Exiting plans must inform beneficiaries that they
can change to TM or choose another MA plan from a provided list of plans available in the service area The beneficiaries remain in the Medicare program regardless of what they choose Beneficiaries have from the time they are notified until approximately two months after their coverage ends to make these elections though enrolling by December 31
st ensures no interruption in coverage Beneficiaries electing
to return to traditional Medicare will have neither prescription drug coverage nor any Medicare supplemental coverage (Medigap) to pay the costs that traditional Medicare doesnrsquot cover unless they actively choose to enroll in those plans at that time Beneficiaries who do not enroll in Part D at that time will incur a financial penalty if they later choose to do so 13
When a single plan within a contract exits a beneficiary may have a choice of another plan offered by the same carrier under the same contract that offers covered benefits cost-sharing requirements and physician networks strikingly similar to the exiting plan We would expect choices made by these TCs who have very similar alternatives available to consciously choose MA more than others Unfortunately we cannot observe when this circumstance occurs in our data Moreover in some cases these TCs might be defaulted into the similar plan alternative still available within their existing contract We thus restrict the analysis to TCs in plans for which the entire contract is terminated where staying in MA requires that these TCs select a plan in a new contract and where the default if they fail to make a choice is to be enrolled in traditional Medicare
21
second year of the two-year period and who then enrolled in MA or traditional Medicare for the
first time the latter perhaps due to a default into traditional Medicare
45 Descriptive Analyses
First we present descriptive statistics on the enrollment outcomes for these four groups
TCs voluntary switchers stayers and original choosers and their rates of switching into
traditional Medicare and their rates of switching into different types of MA contracts for HMO
enrollees in 2006-07 for HMO enrollees in 2009-10 and for PFFS enrollees in 2009-10 In
2010 the widespread exit of PFFS contracts created many TCs However due to data
limitations we could not observe the types of MA contracts in which voluntary switchers and
TCs enrolled in 2011 neither could we examine the choices across plans for beneficiaries who
remained in MA in 2011 Therefore we only examined transitions from MA to traditional
Medicare during the 2010-2011 period both by TCs and by voluntary switchers
46 Statistical Analyses
Terminated choosers differ from voluntary switchers and from stayers because TCs but
for the termination of their plan would have included both stayers and voluntary switchers
Given the termination we cannot distinguish between these two types in enrollment claims data
Comparing TCs to either group alone would be an unfair comparison
To identify as best possible appropriate comparisons for the choices of terminated
choosers and to bring balance to our terminated and comparison populations we used a
weighting approach that uses a propensity score approach (Hirano and Imbens 2001 and Kurth
et al 2006) to account for observable differences between terminated choosers and non-
terminated choosers (including both voluntary switchers and stayers) and to bring the non-
terminated chooser population into balance with the terminated choosers We then analyzed
differences in plan outcomes between this weighted comparison group of non-terminated
choosers and the outcomes for terminated choosers
22
This approach first employs a logit model to estimate the propensity for being a
terminated chooser on the basis of age gender race (black or not) and county We control for
county because plan payment rates are set at the county level and thus could affect a health
planrsquos propensity to withdraw and therefore a beneficiaryrsquos probability of being a terminated
chooser Moreover because all residents within a county face the same plan choices our
results are not driven by differences in underlying plan choice sets facing TCs and non-TCs14
To account for changes in payments and differences in preferences for insurance plan types
models were run separately by year and MA plan type (HMO or PFFS) We applied the
coefficients from this model to the data to estimate the probability p that each beneficiary in a
non-terminated contract would be a terminated chooser We then generate a set of weights
where each terminated chooser was assigned a weight equal to 1 and non-terminated
choosers were assigned a weight of (p1-p) (Hirano and Imbens 2001 and Kurth et al 2006) 15
The weighted distributions of characteristics of terminated and non-terminated choosers are
identical (see Appendix) and weighted analyses therefore adjust for potential confounding due
to the individual characteristics included in the propensity score models16
We compared weighted rates of enrollment into traditional Medicare and into MA overall
Among beneficiaries who remained in MA we compared rates of enrollment across types of MA
plans (MA-HMO MA-PPO and MA-PFFS) Statistical significance was assessed using
Pearsonrsquos chi-square test We also compared differences in rates of enrollment in Part D plans
among beneficiaries who switched into traditional Medicare
14
Beneficiaries in counties that did not experience any plan terminations were excluded from the analysis 15
In instances where the number of terminated choosers (the treatment population) was greater than the number of non-terminated choosers (the control population) estimating propensity-score weights in this population would result in a loss in efficiency Due to the dramatic changes in the PFFS market that began in 2009 this circumstance arose for the PFFS market in a subset of our study counties during the 2009-2010 study period Therefore we restricted the 2009 PFFS models to include only counties where there were at least as many non-terminated choosers as terminated choosers 16
Others have applied this methodology to analyze the impact of health insurance on health care utilization and on health care spending (see for example McWilliams et al 2007 Zhang et al 2009)
23
5 Results
51 Beneficiary switching and descriptive transitions
Over the period 2006-2010 nearly 233000 beneficiaries in MA plans became TCs17
TCs were similar in age gender and race to both voluntary switchers and stayers but were
much more likely to have been enrolled in their MA contracts for a shorter duration one year or
less (Table 1) The vast majority of the MA contract exits examined occurred in 2006 2009 and
2010 The yearly proportion of MA enrollees who switched out their plan increased over the
study period from 88 to 138 and the majority of switchers each year were voluntary
switchers (Table 2) Voluntary switchers were more likely than TCs to transition from MA to
traditional Medicare following each of those years (Table 3)
Tables 4a and 4b present unadjusted descriptive data on the transitions of TCs and all
other types of beneficiaries voluntary switchers stayers and original choosers Considering
transitions in 2006-2007 (Table 4a) TCs in all plan types were much less likely to transition to
traditional Medicare than were voluntary switchers moving out of the same plan types The
transition numbers are 52 vs 195 for HMO enrollees 150 vs 249 for PPO enrollees
25 vs 416 for PFFS enrollees--though this last category had a very small sample size
Among beneficiaries who were in an MA-HMO in 2006 TCs were more likely to enroll in a PFFS
plan than were voluntary switchers Together voluntary switchers and TCs who stayed in MA
were more likely to enroll in a non-HMO plan than were either stayers (column 7) or original
choosers who chose MA (column 8)
By contrast in 2009 when significant numbers of PFFS plans first exited from MA
markets TCsrsquo higher rate of remaining in MA as compared to voluntary switchers was driven by
terminated choosers in PFFS plans In 2009 a large proportion of terminated choosers had
17
This figure includes TCs created in all five years of the entire period though 98 occurred in 2006 2009 and 2010
24
originally enrolled in PFFS plans In comparison with voluntary switchers from PFFS in 2009
TCs were dramatically more likely to stay in MA in 2010 (850 vs 418 Table 4b column 5
vs 6) Another large group of terminated choosers in 2009 had originally enrolled in a PPO
plan Here we observe the one instance in which a larger proportion of these beneficiaries
transitioned to traditional Medicare than did voluntary switchers from this plan type (353 vs
161 Table 4b column 3 vs 4) TCs in MA-HMO plans were slightly less likely to transition to
traditional Medicare than were voluntary switchers from MA-HMO plans (154 vs 172)
Again we observe from 2009-2010 as we did from 2006-2007 that both voluntary switchers
and TCs who stayed in MA were more likely to enroll in a non-HMO plan than were stayers
(column 7) and original choosers who chose MA (column 8)
52 Statistical Analyses
It is not possible to draw appropriate inferences about the impact of default policies and
the effects of terminated plans simply based on the results from Section 51 That is because
neither voluntary switchers nor stayers nor original choosers constitute an appropriate
comparison group for TCs This section presents results on plan enrollment outcomes of TCs
versus those for a sample of non-terminated choosers that includes both voluntary switchers
and stayers where members of that sample were weighted according to their propensity for
being in a terminated plan thereby creating balance between the two groups
TCs in our pooled sample were more likely to transition to traditional Medicare than were
non-terminated choosers (111 vs 26 plt0001) (Table 5) This pattern holds both among
TCs who were originally enrolled in HMOs and those originally enrolled in PFFS Medicare
Advantage plans TCs were three times more likely to move to traditional Medicare from MA-
HMO contracts in 2006 twelve times more likely to move to traditional Medicare from MA-HMO
contracts in 2009 and twice as likely to move to traditional Medicare from MA-PFFS contracts in
2009
25
Multiple forces could contribute to these dramatic disparities One possibility is that
status quo bias among individuals whose plans survived led them to stick with their plan going
forward A second is that some TCs were affected by the default into traditional Medicare when
traditional Medicare may or may not have been their second choice We incline to status quo
bias of the non-terminated choosers being the principal explanation as that grouprsquos members
only switched to traditional Medicare 26 of the time The switch percentage for TCs to
traditional Medicare was 111 implying that the default was hardly determinative
53 Further analysis of quality of choices and susceptibility to nudges
TCs who transitioned from MA to traditional Medicare were a distinct minority No doubt
some of these transitions were voluntary but some may have been influenced by the default
into traditional Medicare If so this should be reflected in the differential likelihood that these
two groups of TCs chose to enroll in a plan with prescription drug coverage That is because
prior to their plan termination all TCs in our sample had selected a Medicare Advantage plan
that included a prescription drug plan Traditional Medicare with Part D or a new Medicare
Advantage plan with Part D is much closer to being actuarially equivalent to their plan prior to
their termination than is traditional Medicare without Part D However traditional Medicare
without Part D is the default TCs who move into Traditional Medicare must actively enroll in a
Part D plan if they are to have prescription drug coverage Given their original choices and the
heavy subsidies of Part D we conclude that those TCs transitioning to traditional Medicare
without Part D probably made a mistake and suffered expected monetary losses
We compared the rates of enrollment in a Part D plan among TCs (Table 6) First the
top panel shows that among all TCs those moving to traditional Medicare were significantly
more likely to fail to enroll in a Part D plan than were their peers who actively chose to stay in
MA (206 vs 17)
The second panel shows the population of TCs who transitioned to Traditional Medicare
Beneficiaries who were male were more likely to fail to enroll in Part D than were women (240
26
vs 192 plt0001) as were beneficiaries who were black vs non-black (387 vs 202
plt0001) Failing to enroll in a Part D plan decreases with age and with median household
income of the zip code in which beneficiaries reside
6 Discussion
This study investigates the phenomenon of a policy-imposed default versus the forces
promoting consistent choices among terminated choosers in health insurance markets The
evidence shows that the default policy associated with contract terminations in Medicare
Advantage had a moderate impact on the transitions of beneficiaries in terminated plans from
MA to traditional Medicare TCs were more likely to be enrolled in traditional Medicare in the
year following their plan terminations than were non-terminated choosers However a very
large percentage of TCs took specific action to select new MA plans following their initial planrsquos
termination Their active choices to remain in MA likely stemmed from the same preferences
that were operating when they originally reviewed the available plans and deliberately chose
MA The persistent preferences of these individuals were perhaps reinforced by status quo
bias which has been shown to exist for some combination of rational and irrational reasons
among Medicare beneficiaries
The majority of TCs who transitioned into traditional Medicare from 2009-2010 also
showed their ability to choose contrary to a default Roughly three quarters of them took the
active step to enroll in the Part D benefit The remaining quarter of TCs transitioning to
traditional Medicare following their plan termination failed to take up a Part D plan an outcome
in contrast to their prior selection of a MA plan with Part D suggesting some susceptibility to
nudges Those most susceptible were more likely to be black male younger and to live in a zip
code with lower median household income The finding that susceptibility decreases with age is
a bit surprising given that aging is associated with cognitive decline which inhibits decision-
making However working in opposition and presumably prevailing is the fact that older
27
beneficiaries presumably are more likely to need more prescription drugs and thus benefit more
from Part D coverage
Typically default rules are used to nudge people away from making errors that might
otherwise occur in complex high-stakes choice environments (for example with 401K plan
enrollment) and where the experts are in relatively widespread agreement on which alternative
is superior The default nudge studied here differs dramatically from more traditional policy
nudges for two reasons First there is no evidence that it was actively designed to promote
superior choices for individuals In fact the lack of automatic enrollment in Part D leaves
beneficiaries who accepted the default substantially worse off in expectation than they would be
if they had been able to stay in their prior plan Second this nudge pushes individuals towards
an option that is quite different than what they had chosen in a prior period These two features
of the default and therefore their implications for consumer welfare differ from the vast majority
of nudges reported in previous literature
Why does Medicare include this default Given that Medicare Advantage costs the
government more and that Part D coverage is heavily subsidized one possible justification
would be that a successful nudge would save the government money But surely that
consideration should be weighed against having beneficiaries choose against their preferred
plans And any government that gets into the business of such nudges has to worry about
hurting its overall legitimacy Rather the specified default for TCs in Medicare Advantage is
likely in place because it mirrors the default for original choosers in the Medicare program
which is traditional Medicare and it is the most administratively simple to implement
However the specified default of TCs to traditional Medicare fails to make use of
information about beneficiariesrsquo revealed preferences among plans A second MA plan is likely
28
more similar to the original choice than TM in several consequential ways (eg covered
benefits cost-sharing requirements) hence likely to be better suited to the client18
Smart defaults which take into account individual starting positions preferences or
expected needs have been suggested as an alternative to the ldquobenignrdquo default discussed thus
far in this paper (Smith et al 2009) Smart defaults have begun to be used in other public
programs19 and have been shown to have the potential to achieve large savings for enrollees in
Medicare Part D (Zhang et al 2015)20
Because of differences in physician networks across health plans smart defaults would
add administrative complexity but they would be feasible For example in Medicare a smart
default system could analyze the degree of overlap in physician networks across MA plans in an
area it could then use MA as the default if the overlap reached a certain threshold below the
threshold the default would be TM An even more sophisticated algorithm could consider the
physicians the individual has previously used and at a more advanced level could even include
information about recent diagnoses and the implications for appropriate health-care coverage
The success of these default alternatives would be revealed if we observed that relatively few
TCs chose against them
More generally the outcomes for terminated choosers in other health-insurance
exchange settings should be examined Nearly 13 million individuals have enrolled in health
plans through state or federal health-insurance marketplaces created under the ACA These
18
By analogy consider if one had to choose a new car default for an individual who was trading in an SUV that was no longer made An SUV default would more likely meet his preferences than a sedan 19
For example the California demonstration project to Integrate Care for Dual Eligible Beneficiaries (the Cal MediConnect program) is passively enrolling individuals into health plans using an ldquointelligent assignmentrdquo process that analyzes the individualrsquos recently used providers and matches those providers to the physician networks of participating plans Individuals will be passively enrolled in the plan that best meets their current circumstances prioritizing continuity of care There is a 90-day period when individuals can change plans or opt-out (California Department of Health Care Services 2014) 20
Zhang et al simulate an ldquointelligent assignmentrdquo algorithm that would assigning Medicare beneficiaries with schizophrenia who are eligible for a low-income subsidy to the least expensive Part D prescription drug plan based on their prior year drug use instead of random assignment to any plan (the current policy) and project savings on average of $387 per beneficiary
29
include many different types of clients those who were previously insured in individual
insurance plans and who presumably have considerable experience selecting plans and
navigating the market and those who were previously uninsured and who likely have very little
experience with health insurance The effects of default policies following plan terminations
across these different types of enrollees could differ dramatically In some ACA marketplaces
TCs who fail to select a new option for coverage lose their health insurance coverage
altogether an outcome that is clearly sub-optimal relative to their prior choice In 2017
enrollees in terminated plans purchased through federally-facilitated marketplaces may be
automatically enrolled in a new plan (generally the lowest-cost plan of the same product network
type) if they donrsquot choose a new plan or actively opt-out of the marketplace (Jost 2016)
Plan enrollment decisions are very consequential for individuals Increasing numbers of
Americans are choosing plans in health insurance exchange settings such as Medicare the
Affordable Care Act (ACA) and private exchanges and turmoil and large numbers of TCs are
inevitable Whether terminated choosers in these exchanges select and enroll in new plans and
how their responses vary based on default policy and previous insurance status health status
and other characteristics are matters of great policy consequence Any guidance and defaults
provided for TCs should attend to their past revealed preferences
30
Table 1 Characteristics of Stayers vs Terminated Choosers vs Voluntary switchers
MA-PD enrollees in the 200 largest counties in the US 2006 ndash 2010
Stayers Terminated Choosers Voluntary Switchers
n (person-years) 15590641 232538 1403687
Female 584 573 558
Black (vs non-black) 79 77 91
Age
65-69 279 353 318
70-74 257 253 251
75-79 219 185 199
80-84 149 124 135
85+ 97 86 98
Years enrolled in plan (prior to switch)
lt1 131 408 270
1 135 184 191
2 106 124 145
3+ 627 285 389
Expected OOPC $284 $350 $279
Premium $135 $171 $132
Base year
2006 2684837 29283 194292
2007 2888710 3184 193470
2008 3217796 1745 207787
2009 3280679 57591 388048
2010 3518619 140735 420090
Source Authors analysis of Medicare enrollment data Sample includes beneficiaries who gained eligibility
and were not disabled Excludes beneficiaries in employer-sponsored plans and non-HMO PPO and PFFS plans
Excludes beneficiaries in contracts that experienced a merger or consolidation
Stayer = did not switch out of MA-PD contract
Terminated chooser = switched out of MA-PD contract not offered in county in subsequent year
Voluntary switchers = switched out of MA-PD contract offered in county in subsequent year
In contract switching from Excludes 2006 (data not available)
31
Table 2 MA-PD switching rates 2006-2010
Switchers who are Switch Terminated Voluntary Year Beneficiaries Contracts Choosers Switchers
2006 2908412 88 114 886 2007 3085364 66 16 984 2008 3427328 63 08 992 2009 3726318 122 132 869
2010 4079444 138 251 749
Authorsrsquo analysis of Medicare enrollment data in the 200 US counties with the largest elderly populations
Sample = 17226866 person-years
32
Table 3 Transitions from MA-PD to TM
Among beneficiaries Percent moving to TM
Year Terminated Choosers Voluntary Switchers
2006-07 67 202 2009-10 238 257
2010-11 221 456
Source Authors analysis of Medicare enrollment data
33
Table 4a Beneficiary transitions and enrollment outcomes 2006-07
MA-HMO MA-PPO MA-PFFS
Original Choosers
Terminated choosers
Voluntary switchers
Terminated choosers
Voluntary switchers
Terminated choosers
Voluntary switchers Stayers
(age 65) in 2007
(1) (2) (3) (4) (5) (6) (7) (8)
N 25040 171167 4239 22406 4 719 2684837 164857
Into TM in 2007 52 195 150 249 250 416 00 na
In MA in 2007 948 805 850 751 750 584 1000 na
Within MA
MA-HMO 618 598 341 442 00 417 951 819
MA-PPO 13 176 558 259 00 76 44 131
MA-PFFS 369 142 93 274 1000 445 05 50
MA-Other 00 84 08 25 00 62 00
Table 4b Beneficiary transitions and enrollment outcomes 2009-10
MA-HMO MA-PPO MA-PFFS
Original choosers
Terminated
choosers Voluntary switchers
Terminated choosers
Voluntary switchers
Terminated choosers
Voluntary switchers Stayers
(age 65) in 2010
N 3919 238793 24986 66605 28686 82650 3280679 229608
Into TM in 2010 154 172 353 161 150 582 00 na
In MA in 2010 846 828 647 839 850 418 1000 na
Within MA
MA-HMO 620 687 564 504 308 440 883 761
MA-PPO 218 256 373 420 366 477 96 205
MA-PFFS 158 31 54 68 325 82 22 34
MA-Other 04 26 92 77 01 02 00
34
Table 5 Enrollment outcomes for terminated choosers vs weighted comparison group1
Terminated Weighted
choosers comparison group
Enrollment in next year
Study Sample overall TM 111 26
MA-HMO 464 838
MA-PPO 128 25
MA-PFFS 295 110
Stratified by year and plan type
Enrollment in 2007
TM 52 13
MA-HMO in 2006 MA-HMO 582 968
MA-PPO 13 02
MA-PFFS 352 16
Enrollment in 2010
TM 154 13
MA-HMO in 2009 MA-HMO 524 963
MA-PPO 185 18
MA-PFFS 133 06
Enrollment in 2010
TM 175 79
MA-PFFS in 2009 MA-HMO 305 152
MA-PPO 258 120
MA-PFFS 261 650
Notes Study sample includes terminated choosers (enrollees in terminated HMO plans in 2006
or 2009 or in terminated PFFS plans in 2009) and propensity-score based weighted
comparison group of non-terminated choosers) 1
All differences in distribution of enrollment across plan types are statistically significant
at plt0001
35
Table 6 Susceptibility to nudges Proportion of Terminated Choosers (TCs)
who did NOT select a Part D plan
Did not enroll in Part D
()
All TCs with plan termination in 2009 TCs who chose a new MA plan 17 TCs who went into traditional Medicare 206
Did not enroll in Part D
()
TCs with plan termination in 2009 or 2010 who went into traditional Medicare
Male 240 Female 192
Black 387 Non-Black 202
Age group 65-69 238
70-74 207
75-79 206 80-84 198 85+ 164
Distribution of Median HH income in zip code First quartile (lowest median HH income) 245 Second quartile 206
Third quartile 204
Fourth quartile (highest median HH income) 192
Source Authors analysis of Medicare enrollment data
Predicted enrollment based on logistic regression model controlling for age gender race (black or non-black) median HH income in
zip code of residence and year Sample size 44286 TC=terminated chooser
36
References Abaluck J and J Gruber Choice Inconsistencies among the Elderly Evidence from Plan Choice in the Medicare Part D Program American Economic Review 2011 101 (4) 1180ndash210 Abaluck J and Gruber J Evolving Choice Inconsistencies in Choice of Prescription Drug Insurance NBER Working Paper 19163 June 2013 Afendulis CC Landrum MB Chernew ME The Impact of the Affordable Care Act on Medicare Advantage Plan Availability and Enrollment Health Services Research 2012 47(6) 2339-2352 Afendulis CC Sinaiko AD Frank RG Dominated Choices and Medicare Advantage Enrollment NBER Working Paper no20181 2014 Agarwal S Driscoll J Gabaix X and Laibson D The age of reason Financial decisions over the lifecycle In American Law and Economic Association Annual Meetings 2008 Armour S Republicans Question Viability of Co-Ops Wall Street Journal (online) [New York NY] 25 Feb 2016 Arrow K Uncertainty and the welfare economics of medical care American Economic Review 1963 53(5) 941-973 Beshears J J J Choi D Laibson and B C Madrian 2008 How Are Preferences Revealed Journal of Public Economics 92 (8ndash9) 1787ndash94 Beshears J J J Choi D Laibson and B C Madrian The Importance of Default Options for Retirement Savings Options In Brown Liebman and Wise eds Social Security Policy in a Changing Environment Chicago IL University of Chicago Press 2009 p 167-195 Camerer C Loewenstein G and Prelec D Neuroeconomics How Neuroscience can Inform Economics Journal of Economic Literature 2005 43(1)9-64 Cox C Claxton G Levitt L ldquoAnalysis of Insurer Participation in 2016 Marketplacesrdquo Kaiser Family Foundation Issue Brief Nov 03 2015 httpkfforghealth-reformissue-briefanalysis-of-insurer-participation-in-2016-marketplaces (Accessed on Apr 20 2015) Cox C and Semanskee A ldquoAnalysis of UnitedHealth Grouprsquos Premiums and Participation in ACA Marketplacesrdquo Kaiser Family Foundation Issue Brief April 18 2016 Cox C and Semanskee A ldquoPreliminary Data on Insurer Exits and Entrants in 2017 Affordable Care Act Marketplacesrdquo Kaiser Family Foundation Data Note August 2016 Cutler D and Reber S Paying for health insurance the trade-off between competition and adverse selection Quarterly Journal of Economics 1998 113(2) 443-466 Dafny L Hendel I and Wilson N ldquoNarrow Networks on the Health Insurance Exchanges What Do They Look Like and How Do They Affect Pricingrdquo The American Economic Review 105(5) 110-114 Dafny L Gruber J and Ody C ldquoMore Insurers Lower Premiums Evidence from Initial Pricing in the Health Insurance Marketplacesrdquo The American Journal of Health Economics 2015 1(1) 53-81
37
Frank RG (2007) Behavioral Economics and Health Economics In Behavioral Economics and Its Applications Diamond P and Vartiainen H (Eds) Princeton Princeton University Press Gabel JR Whitmore H Stromberg S et al ldquoAnalysis Finds No Nationwide Increase in Health Insurance Marketplace Premiumsrdquo Commonwealth Fund Blog [blog on the Internet] 2014 Dec 22 [cited 2016 Apr 20] Available from httpwwwcommonwealthfundorgpublicationsblog2014deczero-inflation-nationwide-for-marketplace-premiums Gold M Achman L Mittler J and Stevens B 2004 ldquoMonitoring Medicare+Choice What Have We Learned Findings and Operational Lessons for Medicare Advantagerdquo Washington DC Mathematica Policy Research Doct No PR04-43 Goldstein D G E J Johnson A Herrmann and M Heitman ldquoNudge Your Customers Toward Better Choicesrdquo Harvard Business Review December 2008 99-105 Hanoch Y and T Rice Can Limiting Choice Increase Social Welfare The Elderly and Health Insurance Milbank Quarterly 2006 84 (1) 37ndash73 Hirano Keisuke and Imbens Guido W Estimation of causal effects using propensity score weighting An application to data on right heart catheterization Health Services and Outcomes Research Methodology 2001 2259-278 Johnson EJ and Goldstein DG Do Defaults Save Lives Science 2003 3021338-1339 Jost T Updated Renewal and Discontinuation Notices Auto-Reenrollment And Other ACA Developments Health Affairs Blog September 5 2016 wwwhealthaffairsorg (accessed December 4 2016) Keeney RL and Raiffa H Decisions with Multiple Objectives Preferences and Value Trade-offs Cambridge [England] New York NY Cambridge University Press 1976 Ketcham JD Lucarelli C Miravete EJ and Roebuck MC Sinking Swimming or Learning to Swim in Medicare Part D American Economic Review 2012 102(6) 2639-2673 Ketcham JD Lucarelli C and Powers CA Paying Attention or Paying Too Much in Medicare Part D American Economic Review 2015 105(1) 204-233 King R Colorado to Close Obamacare Co-Op Washington Examiner (online) October 16 2015 Kowalski A The Early Impact of the Affordable Care Act State by State Brookings Papers on Economic Activity Economic Studies Program The Brookings Institution vol 49(2 (Fall 2014)) pages 277-355 Kurth T Walker AM Glynn RJ et al Results of multivariable logistic regression propensity matching propensity adjustment and propensity-based weighting under conditions of nonuniform effect Am J Epidemiol 163262-270 2006 Kuye IO Frank RG McWilliams JM Cognition and Take-Up of Subsidized Drug Benefits by Medicare Beneficiaries JAMA Intern Med 2013 doi101001jamainternmed2013845
38
La Monica PR ldquoUnitedHealthcare to Exit Most Obamacare Exchangesrdquo CNN Money April 19 2016 httpmoneycnncom20160419investingunitedhealthcare-obamacare-exchanges-acaindexhtml (Accessed April 20 2016) Madrian B C and D F Shea 2001 The Power of Suggestion Inertia in 401(k) Participation and Savings Behavior Quarterly Journal of Economics 1161149ndash87 McWilliams J M C C Afendulis T G McGuire and B E Landon 2011 Complex Medicare Advantage Choices May Overwhelm SeniorsmdashEspecially Those with Impaired Decision Making Health Affairs 30 (9) 1786ndash94 McWilliams J M J Hsu and J P Newhouse 2012 New Risk-adjustment System Was Associated with Reduced Favorable Selection in Medicare Advantage Health Affairs 31 (12) 2630ndash40 McWilliams JM Meara E Zaslavsky AM Ayanian JZ Use of health services by previously uninsured Medicare beneficiaries New England Journal of Medicine 2007a357143-53 PMID 17625126 Medicare Payment Advisory Commission 2000 Report to the Congress Improving Risk Adjustment in Medicare Washington DC Medicare Payment Advisory Commission Medicare Payment Advisory Commission 2007 Report to Congress Medicare Payment Policy Washington DC Medicare Payment Advisory Commission Medicare Payment Advisory Commission 2009 Report to the Congress Improving Incentives in the Medicare Program Washington DC Medicare Payment Advisory Commission Medicare Payment Advisory Commission 2010 Report to Congress Medicare Payment Policy Washington DC Medicare Payment Advisory Commission Medicare Payment Advisory Commission 2011 Report to Congress Medicare Payment Policy Washington DC Medicare Payment Advisory Commission Medicare Payment Advisory Commission 2016 Report to Congress Medicare Payment Policy Washington DC Medicare Payment Advisory Commission Newhouse J P M Price J Huang J M McWilliams and J Hsu 2012 Steps to Reduce Favorable Risk Selection in Medicare Advantage Largely Succeeded Boding Well for Health Insurance Exchanges Health Affairs 31 (12) 2618ndash28 Pear R Some Policies Get More Time in Health Shift The New York Times March 6 2014 p A1 Pear R Aetna to Pull Back From Public Health Care Exchanges The New York Times August 16 2016 Physician Payment Review Commission Annual Report to Congress 1996 Washington DC Physician Payment Review Commission
39
Riley G and C Zarabozo Trends in the Health Status of Medicare Risk Contract Enrollees Health Care Financing Review 2006 28 (2) 81ndash95 Samuelson W and R Zeckhauser Status Quo Bias in Decision Makingrdquo Journal of Risk and Uncertainty 1988 17ndash59 Sinaiko AD Afendulis CC and Frank RG Enrollment in Medicare Advantage Plans in Miami-Dade County Evidence of Status Quo Bias Inquiry 2013 Smith CN Goldstein D Johnson EJ Smart defaults From hidden persuaders to adaptive helpers (Working Paper INSEAD 2009) available at httppapersssrncomezp-prod1hulharvardedusol3paperscfmabstract_id=1116650 Thaler R and Sunstein C Nudge Improving Decisions about Health Wealth and Happiness (New York NY Penguin Books 2009) Zhang Y Baik SH and Newhouse JP Use of Intelligent Assignment to Medicare Part D Plans for People With Schizophrenia Could Produce Substantial Savings Health Affairs 2015 34(3) 455-460 Zhang Y Donohue JM Lave JR ODonnel G Newhouse JP The Effect of Medicare Part D on Drug and Medical Spending N Engl J Med 2009 36152-61
40
Appendix A1 Medicare Advantage contract-level out-of-pocket cost data We obtained previously determined estimates of the out-of-pocket costs (OOPC) including premiums associated with each MA-PD plan option The Centers for Medicare and Medicaid Services (CMS) calculated these estimates by taking medical utilization data for a standard population of Medicare beneficiaries and applying the coverage and cost-sharing rules specific to each plan to these utilization data to determine the average monthly out-of-pocket costs expected for a beneficiary enrolling in that plan21 These calculations were conducted separately for five self-reported health-status groups and for six age groups To merge these estimates with our contract-level enrollment data for each age group in each county in a given year we averaged OOPC estimates for the five health-status groups within plans and then averaged the OOPC plan estimates for all plans under a given MA-PD contract We applied county contract-level enrollment data to calculate an enrollment-weighted average OOPC of being in an MA-PD contract for each age group and year for all contracts available in each county
21
The standard population was a two-year sample of TM-enrolled respondents to the Medicare Current Beneficiary Survey This estimate assumes that the quantity of services consumed does not vary with the differing cost-sharing rules across the MA plans
41
A2 Demographic Characteristics of Terminated and Non-Terminated Choosers
2006 HMO
Unweighted Weighted Non-Terminated Terminated Non-Terminated Terminated
N 2723831 21953 2723831 21953 black 80 25 24 25 male 414 393 389 393
a7074 273 303 302 303
a7579 231 252 253 252 a8084 152 147 150 147
a85 90 86 87 86 a7074male 118 123 121 123 a7074black 24 07 06 07 a7579male 97 104 103 104 a7579black 17 07 07 07 a8084male 59 54 54 54 a8084black 10 04 04 04
a85male 31 28 28 28 a85black 06 02 02 02
2009 HMO
Unweighted Weighted Non-Terminated Terminated Non-Terminated Terminated
N 3133379 3919 3199973 3919 black 85 125 123 125
male 417 443 445 443 a7074 252 255 256 255 a7579 219 190 189 190 a8084 152 120 120 120
a85 101 73 73 73 a7074male 109 115 116 115 a7074black 24 31 31 31 a7579male 93 81 80 81 a7579black 18 25 25 25 a8084male 61 52 52 52 a8084black 11 10 10 10
a85male 35 26 26 26 a85black 07 06 06 06
42
2009 PFFS
Unweighted Weighted Non-Terminated Terminated Non-Terminated Terminated
N 148736 17852 148736 17852 black 65 73 70 73 male 424 433 437 433
a7074 242 249 249 249 a7579 193 163 161 163
a8084 135 106 105 106 a85 85 62 61 62
a7074male 107 110 111 110 a7074black 17 21 20 21 a7579male 82 71 71 71 a7579black 13 12 12 12 a8084male 54 41 41 41 a8084black 08 07 07 07
a85male 28 20 20 20 a85black 05 04 04 04
17
(Sinaiko et al 2013 Afendulis et al 2014) In theory this could merely be because the enrollees
in MA and traditional Medicare had different preferences or health risks However the Sinaiko
analysis shows that beneficiaries who remain in traditional Medicare forgo significant savings in
the sum of premiums and out-of-pocket costs an example of what we label ldquomoney-wasting
Medicare beneficiaries being elderly and often unhealthy may often face diminished decision-
making and cognitive capabilities (Hanoch and Rice 2006 Agarwal et al 2008) placing them at
higher risk for biased or inadvertent and therefore possibly poor choices In a changing world
such as the medical marketplace the simplest poor choice to make with an expensive
purchase such as medical insurance is to fail to contemplate the choices and simply to
continue with the current plan
Choice can be impaired in other ways McWilliams et al (2011) find evidence consistent
with ldquochoice overloadrdquo They show that rates of enrollment in MA increased as plan choices
increased up to 15 then plateaued with 16 to 30 plan choices and then declined when
beneficiaries had more than 30 choices available The current authors find as well that
beneficiaries with reduced cognitive function as would be expected were less responsive than
their peers to the generosity of MA benefits when choosing between traditional Medicare and
MA
In the Medicare Part D program a beneficiary chooses among prescription drug plans in
an exchange setting Ketcham et al (2012) and Ketcham et al (2015) use longitudinal data to
demonstrate that at least some Part D enrollees were able to improve their choices in their
second third and fourth year of the program particularly when the potential gains from
switching plans were high They identify this evidence in a complex choice environment which
suggests that these beneficiaries had strong existing preferences for Part D plans However
money-wasting choices in Part D defined as plans that do not roughly minimize the sum of a
beneficiaryrsquos premiums plus out-of-pocket costs for a given level of risk have been observed in
significant numbers among all enrollees and among TCs specifically These inferior choices
18
arise in part because beneficiaries over-value plan premiums relative to all out-of-pocket costs
when making their selections (Abaluck and Gruber 2011 Abaluck and Gruber 2013) Low rates
of Part D enrollment by those eligible to enroll and receive the low-income subsidy a program
that makes this drug coverage and prescription drugs essentially free to beneficiaries reflect
obvious and extreme money-wasting choices (Kuye et al 2013)
The existing literature on Medicare describes a variety of factors that interfere with plan
selection and switching including status quo bias choice overload strongly disparate weighting
of different elements of cost and straightforward money-wasting It also discusses beneficiary
characteristics that make them susceptible to these behavioral biases In this regard the
evidence suggests that TCs are among those making the most effective choices in the Medicare
program First TCs consciously chose to enroll in MA in at the outset rather than accept the
traditional Medicare default thereby demonstrating their preference for receiving health
insurance through a MA plan Second a higher proportion of MA as opposed to traditional
Medicare clients enroll in Medicare Part D which offers prescription drug coverage at heavily
subsidized rates and thus reflects an effective choice Given these facts we would expect TCs
to be less susceptible than most to a default into TM
43 Data
We obtained data from the Centers for Medicare and Medicaid services (CMS) on the
entire population of elderly (age 65+) Medicare beneficiaries in the United States who were
enrolled in an MA plan that included prescription drug coverage (known as an MA-PD plan) for
the years 2006-201111 Henceforth for ease of exposition when we refer to Medicare
Advantage or MA plans or clients we mean MA-PD enrollees
11
Due to data limitations (described in more detail below) we were only able to distinguish a plan exit from a plan merger or a consolidation in MA-PD plans Therefore we excluded MA-only plans from this analysis
19
We excluded beneficiaries who became eligible for Medicare due to disability those
dually eligible for Medicaid the long-term institutionalized and those enrolled with an insurer
outside of their county of residence We also excluded enrollees in Medicare Advantage -
employer plans and Special Needs Plans (SNPs) because these beneficiaries face significantly
different enrollment choices and incentives Finally to focus the analysis on the plan choices
and outcomes in locales with robust MA marketplaces we restricted the analysis to
beneficiaries who lived in the 200 US counties with the largest elderly populations and who were
enrolled in the three most common types of MA contracts HMOs PPOs and PFFS This
sample included 17651389 elderly-person-year observations The data included information
on beneficiariesrsquo dates of birth genders races (black or non-black) zip codes of residence the
MA contracts in which they were enrolled and whether they continued to be enrolled in MA or
switched to traditional Medicare in each month of the study period
Generally insurers contract with Medicare to offer a specific type of plan (HMO PPO or
PFFS) in a county but many insurers offer multiple plans with different names and variable
benefits under each contract Our data included identifiable contract-level but not plan-level
enrollment information for each beneficiary The data also included an encrypted plan-level ID
for each beneficiary which importantly for this study allowed us to link to information on market-
level plan changes at the county level (such as consolidations mergers exits or no change)
Because we did not have information on the default options for beneficiaries whose MA plans
went through a merger or consolidation we dropped these beneficiaries (24 of observations)
from our analysis Our final study sample following this exclusion included 17226866 person-
year observations
44 Cohorts
We analyzed the characteristics and transitions of TCs over three pairs of years 2006-
2007 2009-2010 and 2010-2011 We did not examine transitions in 2007-2008 or 2008-2009
20
because very few MA contracts terminated in those intermediate years as a consequence they
provided too few TCs to study
Our study group of TCs includes all beneficiaries in our sample who were enrolled in a
plan and MA-PD contract that was offered in their county of residence in the first year of the
period but that was no longer offered in the second year12 We conducted this analysis at the
contract level for two reasons First contract exits often leave beneficiaries without a substitute
nearly identical to the terminated plan which is not the case with plan exits13 Second we know
the default for these clients namely enrollment in traditional Medicare
We analyzed the choices of two other types of MA beneficiaries in our sample voluntary
switchers and stayers Voluntary switchers are those who chose to either switch to a new MA
contract or switch into traditional Medicare although their prior MA contract continued to be
available had they wanted to stay enrolled in it Stayers are beneficiaries who did not act during
open enrollment and therefore by choice or by inaction were re-enrolled the following year in
their existing plan Both voluntary switchers and stayers faced circumstances different from
those of terminated choosers given that TCs had no choice but to switch plans Finally we
also examined the choices of original choosers who were beneficiaries who turned 65 in the
12
MA plans that are exiting a market must notify beneficiaries 60 days before the end of the year that their coverage will end on December 31
st of that year Exiting plans must inform beneficiaries that they
can change to TM or choose another MA plan from a provided list of plans available in the service area The beneficiaries remain in the Medicare program regardless of what they choose Beneficiaries have from the time they are notified until approximately two months after their coverage ends to make these elections though enrolling by December 31
st ensures no interruption in coverage Beneficiaries electing
to return to traditional Medicare will have neither prescription drug coverage nor any Medicare supplemental coverage (Medigap) to pay the costs that traditional Medicare doesnrsquot cover unless they actively choose to enroll in those plans at that time Beneficiaries who do not enroll in Part D at that time will incur a financial penalty if they later choose to do so 13
When a single plan within a contract exits a beneficiary may have a choice of another plan offered by the same carrier under the same contract that offers covered benefits cost-sharing requirements and physician networks strikingly similar to the exiting plan We would expect choices made by these TCs who have very similar alternatives available to consciously choose MA more than others Unfortunately we cannot observe when this circumstance occurs in our data Moreover in some cases these TCs might be defaulted into the similar plan alternative still available within their existing contract We thus restrict the analysis to TCs in plans for which the entire contract is terminated where staying in MA requires that these TCs select a plan in a new contract and where the default if they fail to make a choice is to be enrolled in traditional Medicare
21
second year of the two-year period and who then enrolled in MA or traditional Medicare for the
first time the latter perhaps due to a default into traditional Medicare
45 Descriptive Analyses
First we present descriptive statistics on the enrollment outcomes for these four groups
TCs voluntary switchers stayers and original choosers and their rates of switching into
traditional Medicare and their rates of switching into different types of MA contracts for HMO
enrollees in 2006-07 for HMO enrollees in 2009-10 and for PFFS enrollees in 2009-10 In
2010 the widespread exit of PFFS contracts created many TCs However due to data
limitations we could not observe the types of MA contracts in which voluntary switchers and
TCs enrolled in 2011 neither could we examine the choices across plans for beneficiaries who
remained in MA in 2011 Therefore we only examined transitions from MA to traditional
Medicare during the 2010-2011 period both by TCs and by voluntary switchers
46 Statistical Analyses
Terminated choosers differ from voluntary switchers and from stayers because TCs but
for the termination of their plan would have included both stayers and voluntary switchers
Given the termination we cannot distinguish between these two types in enrollment claims data
Comparing TCs to either group alone would be an unfair comparison
To identify as best possible appropriate comparisons for the choices of terminated
choosers and to bring balance to our terminated and comparison populations we used a
weighting approach that uses a propensity score approach (Hirano and Imbens 2001 and Kurth
et al 2006) to account for observable differences between terminated choosers and non-
terminated choosers (including both voluntary switchers and stayers) and to bring the non-
terminated chooser population into balance with the terminated choosers We then analyzed
differences in plan outcomes between this weighted comparison group of non-terminated
choosers and the outcomes for terminated choosers
22
This approach first employs a logit model to estimate the propensity for being a
terminated chooser on the basis of age gender race (black or not) and county We control for
county because plan payment rates are set at the county level and thus could affect a health
planrsquos propensity to withdraw and therefore a beneficiaryrsquos probability of being a terminated
chooser Moreover because all residents within a county face the same plan choices our
results are not driven by differences in underlying plan choice sets facing TCs and non-TCs14
To account for changes in payments and differences in preferences for insurance plan types
models were run separately by year and MA plan type (HMO or PFFS) We applied the
coefficients from this model to the data to estimate the probability p that each beneficiary in a
non-terminated contract would be a terminated chooser We then generate a set of weights
where each terminated chooser was assigned a weight equal to 1 and non-terminated
choosers were assigned a weight of (p1-p) (Hirano and Imbens 2001 and Kurth et al 2006) 15
The weighted distributions of characteristics of terminated and non-terminated choosers are
identical (see Appendix) and weighted analyses therefore adjust for potential confounding due
to the individual characteristics included in the propensity score models16
We compared weighted rates of enrollment into traditional Medicare and into MA overall
Among beneficiaries who remained in MA we compared rates of enrollment across types of MA
plans (MA-HMO MA-PPO and MA-PFFS) Statistical significance was assessed using
Pearsonrsquos chi-square test We also compared differences in rates of enrollment in Part D plans
among beneficiaries who switched into traditional Medicare
14
Beneficiaries in counties that did not experience any plan terminations were excluded from the analysis 15
In instances where the number of terminated choosers (the treatment population) was greater than the number of non-terminated choosers (the control population) estimating propensity-score weights in this population would result in a loss in efficiency Due to the dramatic changes in the PFFS market that began in 2009 this circumstance arose for the PFFS market in a subset of our study counties during the 2009-2010 study period Therefore we restricted the 2009 PFFS models to include only counties where there were at least as many non-terminated choosers as terminated choosers 16
Others have applied this methodology to analyze the impact of health insurance on health care utilization and on health care spending (see for example McWilliams et al 2007 Zhang et al 2009)
23
5 Results
51 Beneficiary switching and descriptive transitions
Over the period 2006-2010 nearly 233000 beneficiaries in MA plans became TCs17
TCs were similar in age gender and race to both voluntary switchers and stayers but were
much more likely to have been enrolled in their MA contracts for a shorter duration one year or
less (Table 1) The vast majority of the MA contract exits examined occurred in 2006 2009 and
2010 The yearly proportion of MA enrollees who switched out their plan increased over the
study period from 88 to 138 and the majority of switchers each year were voluntary
switchers (Table 2) Voluntary switchers were more likely than TCs to transition from MA to
traditional Medicare following each of those years (Table 3)
Tables 4a and 4b present unadjusted descriptive data on the transitions of TCs and all
other types of beneficiaries voluntary switchers stayers and original choosers Considering
transitions in 2006-2007 (Table 4a) TCs in all plan types were much less likely to transition to
traditional Medicare than were voluntary switchers moving out of the same plan types The
transition numbers are 52 vs 195 for HMO enrollees 150 vs 249 for PPO enrollees
25 vs 416 for PFFS enrollees--though this last category had a very small sample size
Among beneficiaries who were in an MA-HMO in 2006 TCs were more likely to enroll in a PFFS
plan than were voluntary switchers Together voluntary switchers and TCs who stayed in MA
were more likely to enroll in a non-HMO plan than were either stayers (column 7) or original
choosers who chose MA (column 8)
By contrast in 2009 when significant numbers of PFFS plans first exited from MA
markets TCsrsquo higher rate of remaining in MA as compared to voluntary switchers was driven by
terminated choosers in PFFS plans In 2009 a large proportion of terminated choosers had
17
This figure includes TCs created in all five years of the entire period though 98 occurred in 2006 2009 and 2010
24
originally enrolled in PFFS plans In comparison with voluntary switchers from PFFS in 2009
TCs were dramatically more likely to stay in MA in 2010 (850 vs 418 Table 4b column 5
vs 6) Another large group of terminated choosers in 2009 had originally enrolled in a PPO
plan Here we observe the one instance in which a larger proportion of these beneficiaries
transitioned to traditional Medicare than did voluntary switchers from this plan type (353 vs
161 Table 4b column 3 vs 4) TCs in MA-HMO plans were slightly less likely to transition to
traditional Medicare than were voluntary switchers from MA-HMO plans (154 vs 172)
Again we observe from 2009-2010 as we did from 2006-2007 that both voluntary switchers
and TCs who stayed in MA were more likely to enroll in a non-HMO plan than were stayers
(column 7) and original choosers who chose MA (column 8)
52 Statistical Analyses
It is not possible to draw appropriate inferences about the impact of default policies and
the effects of terminated plans simply based on the results from Section 51 That is because
neither voluntary switchers nor stayers nor original choosers constitute an appropriate
comparison group for TCs This section presents results on plan enrollment outcomes of TCs
versus those for a sample of non-terminated choosers that includes both voluntary switchers
and stayers where members of that sample were weighted according to their propensity for
being in a terminated plan thereby creating balance between the two groups
TCs in our pooled sample were more likely to transition to traditional Medicare than were
non-terminated choosers (111 vs 26 plt0001) (Table 5) This pattern holds both among
TCs who were originally enrolled in HMOs and those originally enrolled in PFFS Medicare
Advantage plans TCs were three times more likely to move to traditional Medicare from MA-
HMO contracts in 2006 twelve times more likely to move to traditional Medicare from MA-HMO
contracts in 2009 and twice as likely to move to traditional Medicare from MA-PFFS contracts in
2009
25
Multiple forces could contribute to these dramatic disparities One possibility is that
status quo bias among individuals whose plans survived led them to stick with their plan going
forward A second is that some TCs were affected by the default into traditional Medicare when
traditional Medicare may or may not have been their second choice We incline to status quo
bias of the non-terminated choosers being the principal explanation as that grouprsquos members
only switched to traditional Medicare 26 of the time The switch percentage for TCs to
traditional Medicare was 111 implying that the default was hardly determinative
53 Further analysis of quality of choices and susceptibility to nudges
TCs who transitioned from MA to traditional Medicare were a distinct minority No doubt
some of these transitions were voluntary but some may have been influenced by the default
into traditional Medicare If so this should be reflected in the differential likelihood that these
two groups of TCs chose to enroll in a plan with prescription drug coverage That is because
prior to their plan termination all TCs in our sample had selected a Medicare Advantage plan
that included a prescription drug plan Traditional Medicare with Part D or a new Medicare
Advantage plan with Part D is much closer to being actuarially equivalent to their plan prior to
their termination than is traditional Medicare without Part D However traditional Medicare
without Part D is the default TCs who move into Traditional Medicare must actively enroll in a
Part D plan if they are to have prescription drug coverage Given their original choices and the
heavy subsidies of Part D we conclude that those TCs transitioning to traditional Medicare
without Part D probably made a mistake and suffered expected monetary losses
We compared the rates of enrollment in a Part D plan among TCs (Table 6) First the
top panel shows that among all TCs those moving to traditional Medicare were significantly
more likely to fail to enroll in a Part D plan than were their peers who actively chose to stay in
MA (206 vs 17)
The second panel shows the population of TCs who transitioned to Traditional Medicare
Beneficiaries who were male were more likely to fail to enroll in Part D than were women (240
26
vs 192 plt0001) as were beneficiaries who were black vs non-black (387 vs 202
plt0001) Failing to enroll in a Part D plan decreases with age and with median household
income of the zip code in which beneficiaries reside
6 Discussion
This study investigates the phenomenon of a policy-imposed default versus the forces
promoting consistent choices among terminated choosers in health insurance markets The
evidence shows that the default policy associated with contract terminations in Medicare
Advantage had a moderate impact on the transitions of beneficiaries in terminated plans from
MA to traditional Medicare TCs were more likely to be enrolled in traditional Medicare in the
year following their plan terminations than were non-terminated choosers However a very
large percentage of TCs took specific action to select new MA plans following their initial planrsquos
termination Their active choices to remain in MA likely stemmed from the same preferences
that were operating when they originally reviewed the available plans and deliberately chose
MA The persistent preferences of these individuals were perhaps reinforced by status quo
bias which has been shown to exist for some combination of rational and irrational reasons
among Medicare beneficiaries
The majority of TCs who transitioned into traditional Medicare from 2009-2010 also
showed their ability to choose contrary to a default Roughly three quarters of them took the
active step to enroll in the Part D benefit The remaining quarter of TCs transitioning to
traditional Medicare following their plan termination failed to take up a Part D plan an outcome
in contrast to their prior selection of a MA plan with Part D suggesting some susceptibility to
nudges Those most susceptible were more likely to be black male younger and to live in a zip
code with lower median household income The finding that susceptibility decreases with age is
a bit surprising given that aging is associated with cognitive decline which inhibits decision-
making However working in opposition and presumably prevailing is the fact that older
27
beneficiaries presumably are more likely to need more prescription drugs and thus benefit more
from Part D coverage
Typically default rules are used to nudge people away from making errors that might
otherwise occur in complex high-stakes choice environments (for example with 401K plan
enrollment) and where the experts are in relatively widespread agreement on which alternative
is superior The default nudge studied here differs dramatically from more traditional policy
nudges for two reasons First there is no evidence that it was actively designed to promote
superior choices for individuals In fact the lack of automatic enrollment in Part D leaves
beneficiaries who accepted the default substantially worse off in expectation than they would be
if they had been able to stay in their prior plan Second this nudge pushes individuals towards
an option that is quite different than what they had chosen in a prior period These two features
of the default and therefore their implications for consumer welfare differ from the vast majority
of nudges reported in previous literature
Why does Medicare include this default Given that Medicare Advantage costs the
government more and that Part D coverage is heavily subsidized one possible justification
would be that a successful nudge would save the government money But surely that
consideration should be weighed against having beneficiaries choose against their preferred
plans And any government that gets into the business of such nudges has to worry about
hurting its overall legitimacy Rather the specified default for TCs in Medicare Advantage is
likely in place because it mirrors the default for original choosers in the Medicare program
which is traditional Medicare and it is the most administratively simple to implement
However the specified default of TCs to traditional Medicare fails to make use of
information about beneficiariesrsquo revealed preferences among plans A second MA plan is likely
28
more similar to the original choice than TM in several consequential ways (eg covered
benefits cost-sharing requirements) hence likely to be better suited to the client18
Smart defaults which take into account individual starting positions preferences or
expected needs have been suggested as an alternative to the ldquobenignrdquo default discussed thus
far in this paper (Smith et al 2009) Smart defaults have begun to be used in other public
programs19 and have been shown to have the potential to achieve large savings for enrollees in
Medicare Part D (Zhang et al 2015)20
Because of differences in physician networks across health plans smart defaults would
add administrative complexity but they would be feasible For example in Medicare a smart
default system could analyze the degree of overlap in physician networks across MA plans in an
area it could then use MA as the default if the overlap reached a certain threshold below the
threshold the default would be TM An even more sophisticated algorithm could consider the
physicians the individual has previously used and at a more advanced level could even include
information about recent diagnoses and the implications for appropriate health-care coverage
The success of these default alternatives would be revealed if we observed that relatively few
TCs chose against them
More generally the outcomes for terminated choosers in other health-insurance
exchange settings should be examined Nearly 13 million individuals have enrolled in health
plans through state or federal health-insurance marketplaces created under the ACA These
18
By analogy consider if one had to choose a new car default for an individual who was trading in an SUV that was no longer made An SUV default would more likely meet his preferences than a sedan 19
For example the California demonstration project to Integrate Care for Dual Eligible Beneficiaries (the Cal MediConnect program) is passively enrolling individuals into health plans using an ldquointelligent assignmentrdquo process that analyzes the individualrsquos recently used providers and matches those providers to the physician networks of participating plans Individuals will be passively enrolled in the plan that best meets their current circumstances prioritizing continuity of care There is a 90-day period when individuals can change plans or opt-out (California Department of Health Care Services 2014) 20
Zhang et al simulate an ldquointelligent assignmentrdquo algorithm that would assigning Medicare beneficiaries with schizophrenia who are eligible for a low-income subsidy to the least expensive Part D prescription drug plan based on their prior year drug use instead of random assignment to any plan (the current policy) and project savings on average of $387 per beneficiary
29
include many different types of clients those who were previously insured in individual
insurance plans and who presumably have considerable experience selecting plans and
navigating the market and those who were previously uninsured and who likely have very little
experience with health insurance The effects of default policies following plan terminations
across these different types of enrollees could differ dramatically In some ACA marketplaces
TCs who fail to select a new option for coverage lose their health insurance coverage
altogether an outcome that is clearly sub-optimal relative to their prior choice In 2017
enrollees in terminated plans purchased through federally-facilitated marketplaces may be
automatically enrolled in a new plan (generally the lowest-cost plan of the same product network
type) if they donrsquot choose a new plan or actively opt-out of the marketplace (Jost 2016)
Plan enrollment decisions are very consequential for individuals Increasing numbers of
Americans are choosing plans in health insurance exchange settings such as Medicare the
Affordable Care Act (ACA) and private exchanges and turmoil and large numbers of TCs are
inevitable Whether terminated choosers in these exchanges select and enroll in new plans and
how their responses vary based on default policy and previous insurance status health status
and other characteristics are matters of great policy consequence Any guidance and defaults
provided for TCs should attend to their past revealed preferences
30
Table 1 Characteristics of Stayers vs Terminated Choosers vs Voluntary switchers
MA-PD enrollees in the 200 largest counties in the US 2006 ndash 2010
Stayers Terminated Choosers Voluntary Switchers
n (person-years) 15590641 232538 1403687
Female 584 573 558
Black (vs non-black) 79 77 91
Age
65-69 279 353 318
70-74 257 253 251
75-79 219 185 199
80-84 149 124 135
85+ 97 86 98
Years enrolled in plan (prior to switch)
lt1 131 408 270
1 135 184 191
2 106 124 145
3+ 627 285 389
Expected OOPC $284 $350 $279
Premium $135 $171 $132
Base year
2006 2684837 29283 194292
2007 2888710 3184 193470
2008 3217796 1745 207787
2009 3280679 57591 388048
2010 3518619 140735 420090
Source Authors analysis of Medicare enrollment data Sample includes beneficiaries who gained eligibility
and were not disabled Excludes beneficiaries in employer-sponsored plans and non-HMO PPO and PFFS plans
Excludes beneficiaries in contracts that experienced a merger or consolidation
Stayer = did not switch out of MA-PD contract
Terminated chooser = switched out of MA-PD contract not offered in county in subsequent year
Voluntary switchers = switched out of MA-PD contract offered in county in subsequent year
In contract switching from Excludes 2006 (data not available)
31
Table 2 MA-PD switching rates 2006-2010
Switchers who are Switch Terminated Voluntary Year Beneficiaries Contracts Choosers Switchers
2006 2908412 88 114 886 2007 3085364 66 16 984 2008 3427328 63 08 992 2009 3726318 122 132 869
2010 4079444 138 251 749
Authorsrsquo analysis of Medicare enrollment data in the 200 US counties with the largest elderly populations
Sample = 17226866 person-years
32
Table 3 Transitions from MA-PD to TM
Among beneficiaries Percent moving to TM
Year Terminated Choosers Voluntary Switchers
2006-07 67 202 2009-10 238 257
2010-11 221 456
Source Authors analysis of Medicare enrollment data
33
Table 4a Beneficiary transitions and enrollment outcomes 2006-07
MA-HMO MA-PPO MA-PFFS
Original Choosers
Terminated choosers
Voluntary switchers
Terminated choosers
Voluntary switchers
Terminated choosers
Voluntary switchers Stayers
(age 65) in 2007
(1) (2) (3) (4) (5) (6) (7) (8)
N 25040 171167 4239 22406 4 719 2684837 164857
Into TM in 2007 52 195 150 249 250 416 00 na
In MA in 2007 948 805 850 751 750 584 1000 na
Within MA
MA-HMO 618 598 341 442 00 417 951 819
MA-PPO 13 176 558 259 00 76 44 131
MA-PFFS 369 142 93 274 1000 445 05 50
MA-Other 00 84 08 25 00 62 00
Table 4b Beneficiary transitions and enrollment outcomes 2009-10
MA-HMO MA-PPO MA-PFFS
Original choosers
Terminated
choosers Voluntary switchers
Terminated choosers
Voluntary switchers
Terminated choosers
Voluntary switchers Stayers
(age 65) in 2010
N 3919 238793 24986 66605 28686 82650 3280679 229608
Into TM in 2010 154 172 353 161 150 582 00 na
In MA in 2010 846 828 647 839 850 418 1000 na
Within MA
MA-HMO 620 687 564 504 308 440 883 761
MA-PPO 218 256 373 420 366 477 96 205
MA-PFFS 158 31 54 68 325 82 22 34
MA-Other 04 26 92 77 01 02 00
34
Table 5 Enrollment outcomes for terminated choosers vs weighted comparison group1
Terminated Weighted
choosers comparison group
Enrollment in next year
Study Sample overall TM 111 26
MA-HMO 464 838
MA-PPO 128 25
MA-PFFS 295 110
Stratified by year and plan type
Enrollment in 2007
TM 52 13
MA-HMO in 2006 MA-HMO 582 968
MA-PPO 13 02
MA-PFFS 352 16
Enrollment in 2010
TM 154 13
MA-HMO in 2009 MA-HMO 524 963
MA-PPO 185 18
MA-PFFS 133 06
Enrollment in 2010
TM 175 79
MA-PFFS in 2009 MA-HMO 305 152
MA-PPO 258 120
MA-PFFS 261 650
Notes Study sample includes terminated choosers (enrollees in terminated HMO plans in 2006
or 2009 or in terminated PFFS plans in 2009) and propensity-score based weighted
comparison group of non-terminated choosers) 1
All differences in distribution of enrollment across plan types are statistically significant
at plt0001
35
Table 6 Susceptibility to nudges Proportion of Terminated Choosers (TCs)
who did NOT select a Part D plan
Did not enroll in Part D
()
All TCs with plan termination in 2009 TCs who chose a new MA plan 17 TCs who went into traditional Medicare 206
Did not enroll in Part D
()
TCs with plan termination in 2009 or 2010 who went into traditional Medicare
Male 240 Female 192
Black 387 Non-Black 202
Age group 65-69 238
70-74 207
75-79 206 80-84 198 85+ 164
Distribution of Median HH income in zip code First quartile (lowest median HH income) 245 Second quartile 206
Third quartile 204
Fourth quartile (highest median HH income) 192
Source Authors analysis of Medicare enrollment data
Predicted enrollment based on logistic regression model controlling for age gender race (black or non-black) median HH income in
zip code of residence and year Sample size 44286 TC=terminated chooser
36
References Abaluck J and J Gruber Choice Inconsistencies among the Elderly Evidence from Plan Choice in the Medicare Part D Program American Economic Review 2011 101 (4) 1180ndash210 Abaluck J and Gruber J Evolving Choice Inconsistencies in Choice of Prescription Drug Insurance NBER Working Paper 19163 June 2013 Afendulis CC Landrum MB Chernew ME The Impact of the Affordable Care Act on Medicare Advantage Plan Availability and Enrollment Health Services Research 2012 47(6) 2339-2352 Afendulis CC Sinaiko AD Frank RG Dominated Choices and Medicare Advantage Enrollment NBER Working Paper no20181 2014 Agarwal S Driscoll J Gabaix X and Laibson D The age of reason Financial decisions over the lifecycle In American Law and Economic Association Annual Meetings 2008 Armour S Republicans Question Viability of Co-Ops Wall Street Journal (online) [New York NY] 25 Feb 2016 Arrow K Uncertainty and the welfare economics of medical care American Economic Review 1963 53(5) 941-973 Beshears J J J Choi D Laibson and B C Madrian 2008 How Are Preferences Revealed Journal of Public Economics 92 (8ndash9) 1787ndash94 Beshears J J J Choi D Laibson and B C Madrian The Importance of Default Options for Retirement Savings Options In Brown Liebman and Wise eds Social Security Policy in a Changing Environment Chicago IL University of Chicago Press 2009 p 167-195 Camerer C Loewenstein G and Prelec D Neuroeconomics How Neuroscience can Inform Economics Journal of Economic Literature 2005 43(1)9-64 Cox C Claxton G Levitt L ldquoAnalysis of Insurer Participation in 2016 Marketplacesrdquo Kaiser Family Foundation Issue Brief Nov 03 2015 httpkfforghealth-reformissue-briefanalysis-of-insurer-participation-in-2016-marketplaces (Accessed on Apr 20 2015) Cox C and Semanskee A ldquoAnalysis of UnitedHealth Grouprsquos Premiums and Participation in ACA Marketplacesrdquo Kaiser Family Foundation Issue Brief April 18 2016 Cox C and Semanskee A ldquoPreliminary Data on Insurer Exits and Entrants in 2017 Affordable Care Act Marketplacesrdquo Kaiser Family Foundation Data Note August 2016 Cutler D and Reber S Paying for health insurance the trade-off between competition and adverse selection Quarterly Journal of Economics 1998 113(2) 443-466 Dafny L Hendel I and Wilson N ldquoNarrow Networks on the Health Insurance Exchanges What Do They Look Like and How Do They Affect Pricingrdquo The American Economic Review 105(5) 110-114 Dafny L Gruber J and Ody C ldquoMore Insurers Lower Premiums Evidence from Initial Pricing in the Health Insurance Marketplacesrdquo The American Journal of Health Economics 2015 1(1) 53-81
37
Frank RG (2007) Behavioral Economics and Health Economics In Behavioral Economics and Its Applications Diamond P and Vartiainen H (Eds) Princeton Princeton University Press Gabel JR Whitmore H Stromberg S et al ldquoAnalysis Finds No Nationwide Increase in Health Insurance Marketplace Premiumsrdquo Commonwealth Fund Blog [blog on the Internet] 2014 Dec 22 [cited 2016 Apr 20] Available from httpwwwcommonwealthfundorgpublicationsblog2014deczero-inflation-nationwide-for-marketplace-premiums Gold M Achman L Mittler J and Stevens B 2004 ldquoMonitoring Medicare+Choice What Have We Learned Findings and Operational Lessons for Medicare Advantagerdquo Washington DC Mathematica Policy Research Doct No PR04-43 Goldstein D G E J Johnson A Herrmann and M Heitman ldquoNudge Your Customers Toward Better Choicesrdquo Harvard Business Review December 2008 99-105 Hanoch Y and T Rice Can Limiting Choice Increase Social Welfare The Elderly and Health Insurance Milbank Quarterly 2006 84 (1) 37ndash73 Hirano Keisuke and Imbens Guido W Estimation of causal effects using propensity score weighting An application to data on right heart catheterization Health Services and Outcomes Research Methodology 2001 2259-278 Johnson EJ and Goldstein DG Do Defaults Save Lives Science 2003 3021338-1339 Jost T Updated Renewal and Discontinuation Notices Auto-Reenrollment And Other ACA Developments Health Affairs Blog September 5 2016 wwwhealthaffairsorg (accessed December 4 2016) Keeney RL and Raiffa H Decisions with Multiple Objectives Preferences and Value Trade-offs Cambridge [England] New York NY Cambridge University Press 1976 Ketcham JD Lucarelli C Miravete EJ and Roebuck MC Sinking Swimming or Learning to Swim in Medicare Part D American Economic Review 2012 102(6) 2639-2673 Ketcham JD Lucarelli C and Powers CA Paying Attention or Paying Too Much in Medicare Part D American Economic Review 2015 105(1) 204-233 King R Colorado to Close Obamacare Co-Op Washington Examiner (online) October 16 2015 Kowalski A The Early Impact of the Affordable Care Act State by State Brookings Papers on Economic Activity Economic Studies Program The Brookings Institution vol 49(2 (Fall 2014)) pages 277-355 Kurth T Walker AM Glynn RJ et al Results of multivariable logistic regression propensity matching propensity adjustment and propensity-based weighting under conditions of nonuniform effect Am J Epidemiol 163262-270 2006 Kuye IO Frank RG McWilliams JM Cognition and Take-Up of Subsidized Drug Benefits by Medicare Beneficiaries JAMA Intern Med 2013 doi101001jamainternmed2013845
38
La Monica PR ldquoUnitedHealthcare to Exit Most Obamacare Exchangesrdquo CNN Money April 19 2016 httpmoneycnncom20160419investingunitedhealthcare-obamacare-exchanges-acaindexhtml (Accessed April 20 2016) Madrian B C and D F Shea 2001 The Power of Suggestion Inertia in 401(k) Participation and Savings Behavior Quarterly Journal of Economics 1161149ndash87 McWilliams J M C C Afendulis T G McGuire and B E Landon 2011 Complex Medicare Advantage Choices May Overwhelm SeniorsmdashEspecially Those with Impaired Decision Making Health Affairs 30 (9) 1786ndash94 McWilliams J M J Hsu and J P Newhouse 2012 New Risk-adjustment System Was Associated with Reduced Favorable Selection in Medicare Advantage Health Affairs 31 (12) 2630ndash40 McWilliams JM Meara E Zaslavsky AM Ayanian JZ Use of health services by previously uninsured Medicare beneficiaries New England Journal of Medicine 2007a357143-53 PMID 17625126 Medicare Payment Advisory Commission 2000 Report to the Congress Improving Risk Adjustment in Medicare Washington DC Medicare Payment Advisory Commission Medicare Payment Advisory Commission 2007 Report to Congress Medicare Payment Policy Washington DC Medicare Payment Advisory Commission Medicare Payment Advisory Commission 2009 Report to the Congress Improving Incentives in the Medicare Program Washington DC Medicare Payment Advisory Commission Medicare Payment Advisory Commission 2010 Report to Congress Medicare Payment Policy Washington DC Medicare Payment Advisory Commission Medicare Payment Advisory Commission 2011 Report to Congress Medicare Payment Policy Washington DC Medicare Payment Advisory Commission Medicare Payment Advisory Commission 2016 Report to Congress Medicare Payment Policy Washington DC Medicare Payment Advisory Commission Newhouse J P M Price J Huang J M McWilliams and J Hsu 2012 Steps to Reduce Favorable Risk Selection in Medicare Advantage Largely Succeeded Boding Well for Health Insurance Exchanges Health Affairs 31 (12) 2618ndash28 Pear R Some Policies Get More Time in Health Shift The New York Times March 6 2014 p A1 Pear R Aetna to Pull Back From Public Health Care Exchanges The New York Times August 16 2016 Physician Payment Review Commission Annual Report to Congress 1996 Washington DC Physician Payment Review Commission
39
Riley G and C Zarabozo Trends in the Health Status of Medicare Risk Contract Enrollees Health Care Financing Review 2006 28 (2) 81ndash95 Samuelson W and R Zeckhauser Status Quo Bias in Decision Makingrdquo Journal of Risk and Uncertainty 1988 17ndash59 Sinaiko AD Afendulis CC and Frank RG Enrollment in Medicare Advantage Plans in Miami-Dade County Evidence of Status Quo Bias Inquiry 2013 Smith CN Goldstein D Johnson EJ Smart defaults From hidden persuaders to adaptive helpers (Working Paper INSEAD 2009) available at httppapersssrncomezp-prod1hulharvardedusol3paperscfmabstract_id=1116650 Thaler R and Sunstein C Nudge Improving Decisions about Health Wealth and Happiness (New York NY Penguin Books 2009) Zhang Y Baik SH and Newhouse JP Use of Intelligent Assignment to Medicare Part D Plans for People With Schizophrenia Could Produce Substantial Savings Health Affairs 2015 34(3) 455-460 Zhang Y Donohue JM Lave JR ODonnel G Newhouse JP The Effect of Medicare Part D on Drug and Medical Spending N Engl J Med 2009 36152-61
40
Appendix A1 Medicare Advantage contract-level out-of-pocket cost data We obtained previously determined estimates of the out-of-pocket costs (OOPC) including premiums associated with each MA-PD plan option The Centers for Medicare and Medicaid Services (CMS) calculated these estimates by taking medical utilization data for a standard population of Medicare beneficiaries and applying the coverage and cost-sharing rules specific to each plan to these utilization data to determine the average monthly out-of-pocket costs expected for a beneficiary enrolling in that plan21 These calculations were conducted separately for five self-reported health-status groups and for six age groups To merge these estimates with our contract-level enrollment data for each age group in each county in a given year we averaged OOPC estimates for the five health-status groups within plans and then averaged the OOPC plan estimates for all plans under a given MA-PD contract We applied county contract-level enrollment data to calculate an enrollment-weighted average OOPC of being in an MA-PD contract for each age group and year for all contracts available in each county
21
The standard population was a two-year sample of TM-enrolled respondents to the Medicare Current Beneficiary Survey This estimate assumes that the quantity of services consumed does not vary with the differing cost-sharing rules across the MA plans
41
A2 Demographic Characteristics of Terminated and Non-Terminated Choosers
2006 HMO
Unweighted Weighted Non-Terminated Terminated Non-Terminated Terminated
N 2723831 21953 2723831 21953 black 80 25 24 25 male 414 393 389 393
a7074 273 303 302 303
a7579 231 252 253 252 a8084 152 147 150 147
a85 90 86 87 86 a7074male 118 123 121 123 a7074black 24 07 06 07 a7579male 97 104 103 104 a7579black 17 07 07 07 a8084male 59 54 54 54 a8084black 10 04 04 04
a85male 31 28 28 28 a85black 06 02 02 02
2009 HMO
Unweighted Weighted Non-Terminated Terminated Non-Terminated Terminated
N 3133379 3919 3199973 3919 black 85 125 123 125
male 417 443 445 443 a7074 252 255 256 255 a7579 219 190 189 190 a8084 152 120 120 120
a85 101 73 73 73 a7074male 109 115 116 115 a7074black 24 31 31 31 a7579male 93 81 80 81 a7579black 18 25 25 25 a8084male 61 52 52 52 a8084black 11 10 10 10
a85male 35 26 26 26 a85black 07 06 06 06
42
2009 PFFS
Unweighted Weighted Non-Terminated Terminated Non-Terminated Terminated
N 148736 17852 148736 17852 black 65 73 70 73 male 424 433 437 433
a7074 242 249 249 249 a7579 193 163 161 163
a8084 135 106 105 106 a85 85 62 61 62
a7074male 107 110 111 110 a7074black 17 21 20 21 a7579male 82 71 71 71 a7579black 13 12 12 12 a8084male 54 41 41 41 a8084black 08 07 07 07
a85male 28 20 20 20 a85black 05 04 04 04
18
arise in part because beneficiaries over-value plan premiums relative to all out-of-pocket costs
when making their selections (Abaluck and Gruber 2011 Abaluck and Gruber 2013) Low rates
of Part D enrollment by those eligible to enroll and receive the low-income subsidy a program
that makes this drug coverage and prescription drugs essentially free to beneficiaries reflect
obvious and extreme money-wasting choices (Kuye et al 2013)
The existing literature on Medicare describes a variety of factors that interfere with plan
selection and switching including status quo bias choice overload strongly disparate weighting
of different elements of cost and straightforward money-wasting It also discusses beneficiary
characteristics that make them susceptible to these behavioral biases In this regard the
evidence suggests that TCs are among those making the most effective choices in the Medicare
program First TCs consciously chose to enroll in MA in at the outset rather than accept the
traditional Medicare default thereby demonstrating their preference for receiving health
insurance through a MA plan Second a higher proportion of MA as opposed to traditional
Medicare clients enroll in Medicare Part D which offers prescription drug coverage at heavily
subsidized rates and thus reflects an effective choice Given these facts we would expect TCs
to be less susceptible than most to a default into TM
43 Data
We obtained data from the Centers for Medicare and Medicaid services (CMS) on the
entire population of elderly (age 65+) Medicare beneficiaries in the United States who were
enrolled in an MA plan that included prescription drug coverage (known as an MA-PD plan) for
the years 2006-201111 Henceforth for ease of exposition when we refer to Medicare
Advantage or MA plans or clients we mean MA-PD enrollees
11
Due to data limitations (described in more detail below) we were only able to distinguish a plan exit from a plan merger or a consolidation in MA-PD plans Therefore we excluded MA-only plans from this analysis
19
We excluded beneficiaries who became eligible for Medicare due to disability those
dually eligible for Medicaid the long-term institutionalized and those enrolled with an insurer
outside of their county of residence We also excluded enrollees in Medicare Advantage -
employer plans and Special Needs Plans (SNPs) because these beneficiaries face significantly
different enrollment choices and incentives Finally to focus the analysis on the plan choices
and outcomes in locales with robust MA marketplaces we restricted the analysis to
beneficiaries who lived in the 200 US counties with the largest elderly populations and who were
enrolled in the three most common types of MA contracts HMOs PPOs and PFFS This
sample included 17651389 elderly-person-year observations The data included information
on beneficiariesrsquo dates of birth genders races (black or non-black) zip codes of residence the
MA contracts in which they were enrolled and whether they continued to be enrolled in MA or
switched to traditional Medicare in each month of the study period
Generally insurers contract with Medicare to offer a specific type of plan (HMO PPO or
PFFS) in a county but many insurers offer multiple plans with different names and variable
benefits under each contract Our data included identifiable contract-level but not plan-level
enrollment information for each beneficiary The data also included an encrypted plan-level ID
for each beneficiary which importantly for this study allowed us to link to information on market-
level plan changes at the county level (such as consolidations mergers exits or no change)
Because we did not have information on the default options for beneficiaries whose MA plans
went through a merger or consolidation we dropped these beneficiaries (24 of observations)
from our analysis Our final study sample following this exclusion included 17226866 person-
year observations
44 Cohorts
We analyzed the characteristics and transitions of TCs over three pairs of years 2006-
2007 2009-2010 and 2010-2011 We did not examine transitions in 2007-2008 or 2008-2009
20
because very few MA contracts terminated in those intermediate years as a consequence they
provided too few TCs to study
Our study group of TCs includes all beneficiaries in our sample who were enrolled in a
plan and MA-PD contract that was offered in their county of residence in the first year of the
period but that was no longer offered in the second year12 We conducted this analysis at the
contract level for two reasons First contract exits often leave beneficiaries without a substitute
nearly identical to the terminated plan which is not the case with plan exits13 Second we know
the default for these clients namely enrollment in traditional Medicare
We analyzed the choices of two other types of MA beneficiaries in our sample voluntary
switchers and stayers Voluntary switchers are those who chose to either switch to a new MA
contract or switch into traditional Medicare although their prior MA contract continued to be
available had they wanted to stay enrolled in it Stayers are beneficiaries who did not act during
open enrollment and therefore by choice or by inaction were re-enrolled the following year in
their existing plan Both voluntary switchers and stayers faced circumstances different from
those of terminated choosers given that TCs had no choice but to switch plans Finally we
also examined the choices of original choosers who were beneficiaries who turned 65 in the
12
MA plans that are exiting a market must notify beneficiaries 60 days before the end of the year that their coverage will end on December 31
st of that year Exiting plans must inform beneficiaries that they
can change to TM or choose another MA plan from a provided list of plans available in the service area The beneficiaries remain in the Medicare program regardless of what they choose Beneficiaries have from the time they are notified until approximately two months after their coverage ends to make these elections though enrolling by December 31
st ensures no interruption in coverage Beneficiaries electing
to return to traditional Medicare will have neither prescription drug coverage nor any Medicare supplemental coverage (Medigap) to pay the costs that traditional Medicare doesnrsquot cover unless they actively choose to enroll in those plans at that time Beneficiaries who do not enroll in Part D at that time will incur a financial penalty if they later choose to do so 13
When a single plan within a contract exits a beneficiary may have a choice of another plan offered by the same carrier under the same contract that offers covered benefits cost-sharing requirements and physician networks strikingly similar to the exiting plan We would expect choices made by these TCs who have very similar alternatives available to consciously choose MA more than others Unfortunately we cannot observe when this circumstance occurs in our data Moreover in some cases these TCs might be defaulted into the similar plan alternative still available within their existing contract We thus restrict the analysis to TCs in plans for which the entire contract is terminated where staying in MA requires that these TCs select a plan in a new contract and where the default if they fail to make a choice is to be enrolled in traditional Medicare
21
second year of the two-year period and who then enrolled in MA or traditional Medicare for the
first time the latter perhaps due to a default into traditional Medicare
45 Descriptive Analyses
First we present descriptive statistics on the enrollment outcomes for these four groups
TCs voluntary switchers stayers and original choosers and their rates of switching into
traditional Medicare and their rates of switching into different types of MA contracts for HMO
enrollees in 2006-07 for HMO enrollees in 2009-10 and for PFFS enrollees in 2009-10 In
2010 the widespread exit of PFFS contracts created many TCs However due to data
limitations we could not observe the types of MA contracts in which voluntary switchers and
TCs enrolled in 2011 neither could we examine the choices across plans for beneficiaries who
remained in MA in 2011 Therefore we only examined transitions from MA to traditional
Medicare during the 2010-2011 period both by TCs and by voluntary switchers
46 Statistical Analyses
Terminated choosers differ from voluntary switchers and from stayers because TCs but
for the termination of their plan would have included both stayers and voluntary switchers
Given the termination we cannot distinguish between these two types in enrollment claims data
Comparing TCs to either group alone would be an unfair comparison
To identify as best possible appropriate comparisons for the choices of terminated
choosers and to bring balance to our terminated and comparison populations we used a
weighting approach that uses a propensity score approach (Hirano and Imbens 2001 and Kurth
et al 2006) to account for observable differences between terminated choosers and non-
terminated choosers (including both voluntary switchers and stayers) and to bring the non-
terminated chooser population into balance with the terminated choosers We then analyzed
differences in plan outcomes between this weighted comparison group of non-terminated
choosers and the outcomes for terminated choosers
22
This approach first employs a logit model to estimate the propensity for being a
terminated chooser on the basis of age gender race (black or not) and county We control for
county because plan payment rates are set at the county level and thus could affect a health
planrsquos propensity to withdraw and therefore a beneficiaryrsquos probability of being a terminated
chooser Moreover because all residents within a county face the same plan choices our
results are not driven by differences in underlying plan choice sets facing TCs and non-TCs14
To account for changes in payments and differences in preferences for insurance plan types
models were run separately by year and MA plan type (HMO or PFFS) We applied the
coefficients from this model to the data to estimate the probability p that each beneficiary in a
non-terminated contract would be a terminated chooser We then generate a set of weights
where each terminated chooser was assigned a weight equal to 1 and non-terminated
choosers were assigned a weight of (p1-p) (Hirano and Imbens 2001 and Kurth et al 2006) 15
The weighted distributions of characteristics of terminated and non-terminated choosers are
identical (see Appendix) and weighted analyses therefore adjust for potential confounding due
to the individual characteristics included in the propensity score models16
We compared weighted rates of enrollment into traditional Medicare and into MA overall
Among beneficiaries who remained in MA we compared rates of enrollment across types of MA
plans (MA-HMO MA-PPO and MA-PFFS) Statistical significance was assessed using
Pearsonrsquos chi-square test We also compared differences in rates of enrollment in Part D plans
among beneficiaries who switched into traditional Medicare
14
Beneficiaries in counties that did not experience any plan terminations were excluded from the analysis 15
In instances where the number of terminated choosers (the treatment population) was greater than the number of non-terminated choosers (the control population) estimating propensity-score weights in this population would result in a loss in efficiency Due to the dramatic changes in the PFFS market that began in 2009 this circumstance arose for the PFFS market in a subset of our study counties during the 2009-2010 study period Therefore we restricted the 2009 PFFS models to include only counties where there were at least as many non-terminated choosers as terminated choosers 16
Others have applied this methodology to analyze the impact of health insurance on health care utilization and on health care spending (see for example McWilliams et al 2007 Zhang et al 2009)
23
5 Results
51 Beneficiary switching and descriptive transitions
Over the period 2006-2010 nearly 233000 beneficiaries in MA plans became TCs17
TCs were similar in age gender and race to both voluntary switchers and stayers but were
much more likely to have been enrolled in their MA contracts for a shorter duration one year or
less (Table 1) The vast majority of the MA contract exits examined occurred in 2006 2009 and
2010 The yearly proportion of MA enrollees who switched out their plan increased over the
study period from 88 to 138 and the majority of switchers each year were voluntary
switchers (Table 2) Voluntary switchers were more likely than TCs to transition from MA to
traditional Medicare following each of those years (Table 3)
Tables 4a and 4b present unadjusted descriptive data on the transitions of TCs and all
other types of beneficiaries voluntary switchers stayers and original choosers Considering
transitions in 2006-2007 (Table 4a) TCs in all plan types were much less likely to transition to
traditional Medicare than were voluntary switchers moving out of the same plan types The
transition numbers are 52 vs 195 for HMO enrollees 150 vs 249 for PPO enrollees
25 vs 416 for PFFS enrollees--though this last category had a very small sample size
Among beneficiaries who were in an MA-HMO in 2006 TCs were more likely to enroll in a PFFS
plan than were voluntary switchers Together voluntary switchers and TCs who stayed in MA
were more likely to enroll in a non-HMO plan than were either stayers (column 7) or original
choosers who chose MA (column 8)
By contrast in 2009 when significant numbers of PFFS plans first exited from MA
markets TCsrsquo higher rate of remaining in MA as compared to voluntary switchers was driven by
terminated choosers in PFFS plans In 2009 a large proportion of terminated choosers had
17
This figure includes TCs created in all five years of the entire period though 98 occurred in 2006 2009 and 2010
24
originally enrolled in PFFS plans In comparison with voluntary switchers from PFFS in 2009
TCs were dramatically more likely to stay in MA in 2010 (850 vs 418 Table 4b column 5
vs 6) Another large group of terminated choosers in 2009 had originally enrolled in a PPO
plan Here we observe the one instance in which a larger proportion of these beneficiaries
transitioned to traditional Medicare than did voluntary switchers from this plan type (353 vs
161 Table 4b column 3 vs 4) TCs in MA-HMO plans were slightly less likely to transition to
traditional Medicare than were voluntary switchers from MA-HMO plans (154 vs 172)
Again we observe from 2009-2010 as we did from 2006-2007 that both voluntary switchers
and TCs who stayed in MA were more likely to enroll in a non-HMO plan than were stayers
(column 7) and original choosers who chose MA (column 8)
52 Statistical Analyses
It is not possible to draw appropriate inferences about the impact of default policies and
the effects of terminated plans simply based on the results from Section 51 That is because
neither voluntary switchers nor stayers nor original choosers constitute an appropriate
comparison group for TCs This section presents results on plan enrollment outcomes of TCs
versus those for a sample of non-terminated choosers that includes both voluntary switchers
and stayers where members of that sample were weighted according to their propensity for
being in a terminated plan thereby creating balance between the two groups
TCs in our pooled sample were more likely to transition to traditional Medicare than were
non-terminated choosers (111 vs 26 plt0001) (Table 5) This pattern holds both among
TCs who were originally enrolled in HMOs and those originally enrolled in PFFS Medicare
Advantage plans TCs were three times more likely to move to traditional Medicare from MA-
HMO contracts in 2006 twelve times more likely to move to traditional Medicare from MA-HMO
contracts in 2009 and twice as likely to move to traditional Medicare from MA-PFFS contracts in
2009
25
Multiple forces could contribute to these dramatic disparities One possibility is that
status quo bias among individuals whose plans survived led them to stick with their plan going
forward A second is that some TCs were affected by the default into traditional Medicare when
traditional Medicare may or may not have been their second choice We incline to status quo
bias of the non-terminated choosers being the principal explanation as that grouprsquos members
only switched to traditional Medicare 26 of the time The switch percentage for TCs to
traditional Medicare was 111 implying that the default was hardly determinative
53 Further analysis of quality of choices and susceptibility to nudges
TCs who transitioned from MA to traditional Medicare were a distinct minority No doubt
some of these transitions were voluntary but some may have been influenced by the default
into traditional Medicare If so this should be reflected in the differential likelihood that these
two groups of TCs chose to enroll in a plan with prescription drug coverage That is because
prior to their plan termination all TCs in our sample had selected a Medicare Advantage plan
that included a prescription drug plan Traditional Medicare with Part D or a new Medicare
Advantage plan with Part D is much closer to being actuarially equivalent to their plan prior to
their termination than is traditional Medicare without Part D However traditional Medicare
without Part D is the default TCs who move into Traditional Medicare must actively enroll in a
Part D plan if they are to have prescription drug coverage Given their original choices and the
heavy subsidies of Part D we conclude that those TCs transitioning to traditional Medicare
without Part D probably made a mistake and suffered expected monetary losses
We compared the rates of enrollment in a Part D plan among TCs (Table 6) First the
top panel shows that among all TCs those moving to traditional Medicare were significantly
more likely to fail to enroll in a Part D plan than were their peers who actively chose to stay in
MA (206 vs 17)
The second panel shows the population of TCs who transitioned to Traditional Medicare
Beneficiaries who were male were more likely to fail to enroll in Part D than were women (240
26
vs 192 plt0001) as were beneficiaries who were black vs non-black (387 vs 202
plt0001) Failing to enroll in a Part D plan decreases with age and with median household
income of the zip code in which beneficiaries reside
6 Discussion
This study investigates the phenomenon of a policy-imposed default versus the forces
promoting consistent choices among terminated choosers in health insurance markets The
evidence shows that the default policy associated with contract terminations in Medicare
Advantage had a moderate impact on the transitions of beneficiaries in terminated plans from
MA to traditional Medicare TCs were more likely to be enrolled in traditional Medicare in the
year following their plan terminations than were non-terminated choosers However a very
large percentage of TCs took specific action to select new MA plans following their initial planrsquos
termination Their active choices to remain in MA likely stemmed from the same preferences
that were operating when they originally reviewed the available plans and deliberately chose
MA The persistent preferences of these individuals were perhaps reinforced by status quo
bias which has been shown to exist for some combination of rational and irrational reasons
among Medicare beneficiaries
The majority of TCs who transitioned into traditional Medicare from 2009-2010 also
showed their ability to choose contrary to a default Roughly three quarters of them took the
active step to enroll in the Part D benefit The remaining quarter of TCs transitioning to
traditional Medicare following their plan termination failed to take up a Part D plan an outcome
in contrast to their prior selection of a MA plan with Part D suggesting some susceptibility to
nudges Those most susceptible were more likely to be black male younger and to live in a zip
code with lower median household income The finding that susceptibility decreases with age is
a bit surprising given that aging is associated with cognitive decline which inhibits decision-
making However working in opposition and presumably prevailing is the fact that older
27
beneficiaries presumably are more likely to need more prescription drugs and thus benefit more
from Part D coverage
Typically default rules are used to nudge people away from making errors that might
otherwise occur in complex high-stakes choice environments (for example with 401K plan
enrollment) and where the experts are in relatively widespread agreement on which alternative
is superior The default nudge studied here differs dramatically from more traditional policy
nudges for two reasons First there is no evidence that it was actively designed to promote
superior choices for individuals In fact the lack of automatic enrollment in Part D leaves
beneficiaries who accepted the default substantially worse off in expectation than they would be
if they had been able to stay in their prior plan Second this nudge pushes individuals towards
an option that is quite different than what they had chosen in a prior period These two features
of the default and therefore their implications for consumer welfare differ from the vast majority
of nudges reported in previous literature
Why does Medicare include this default Given that Medicare Advantage costs the
government more and that Part D coverage is heavily subsidized one possible justification
would be that a successful nudge would save the government money But surely that
consideration should be weighed against having beneficiaries choose against their preferred
plans And any government that gets into the business of such nudges has to worry about
hurting its overall legitimacy Rather the specified default for TCs in Medicare Advantage is
likely in place because it mirrors the default for original choosers in the Medicare program
which is traditional Medicare and it is the most administratively simple to implement
However the specified default of TCs to traditional Medicare fails to make use of
information about beneficiariesrsquo revealed preferences among plans A second MA plan is likely
28
more similar to the original choice than TM in several consequential ways (eg covered
benefits cost-sharing requirements) hence likely to be better suited to the client18
Smart defaults which take into account individual starting positions preferences or
expected needs have been suggested as an alternative to the ldquobenignrdquo default discussed thus
far in this paper (Smith et al 2009) Smart defaults have begun to be used in other public
programs19 and have been shown to have the potential to achieve large savings for enrollees in
Medicare Part D (Zhang et al 2015)20
Because of differences in physician networks across health plans smart defaults would
add administrative complexity but they would be feasible For example in Medicare a smart
default system could analyze the degree of overlap in physician networks across MA plans in an
area it could then use MA as the default if the overlap reached a certain threshold below the
threshold the default would be TM An even more sophisticated algorithm could consider the
physicians the individual has previously used and at a more advanced level could even include
information about recent diagnoses and the implications for appropriate health-care coverage
The success of these default alternatives would be revealed if we observed that relatively few
TCs chose against them
More generally the outcomes for terminated choosers in other health-insurance
exchange settings should be examined Nearly 13 million individuals have enrolled in health
plans through state or federal health-insurance marketplaces created under the ACA These
18
By analogy consider if one had to choose a new car default for an individual who was trading in an SUV that was no longer made An SUV default would more likely meet his preferences than a sedan 19
For example the California demonstration project to Integrate Care for Dual Eligible Beneficiaries (the Cal MediConnect program) is passively enrolling individuals into health plans using an ldquointelligent assignmentrdquo process that analyzes the individualrsquos recently used providers and matches those providers to the physician networks of participating plans Individuals will be passively enrolled in the plan that best meets their current circumstances prioritizing continuity of care There is a 90-day period when individuals can change plans or opt-out (California Department of Health Care Services 2014) 20
Zhang et al simulate an ldquointelligent assignmentrdquo algorithm that would assigning Medicare beneficiaries with schizophrenia who are eligible for a low-income subsidy to the least expensive Part D prescription drug plan based on their prior year drug use instead of random assignment to any plan (the current policy) and project savings on average of $387 per beneficiary
29
include many different types of clients those who were previously insured in individual
insurance plans and who presumably have considerable experience selecting plans and
navigating the market and those who were previously uninsured and who likely have very little
experience with health insurance The effects of default policies following plan terminations
across these different types of enrollees could differ dramatically In some ACA marketplaces
TCs who fail to select a new option for coverage lose their health insurance coverage
altogether an outcome that is clearly sub-optimal relative to their prior choice In 2017
enrollees in terminated plans purchased through federally-facilitated marketplaces may be
automatically enrolled in a new plan (generally the lowest-cost plan of the same product network
type) if they donrsquot choose a new plan or actively opt-out of the marketplace (Jost 2016)
Plan enrollment decisions are very consequential for individuals Increasing numbers of
Americans are choosing plans in health insurance exchange settings such as Medicare the
Affordable Care Act (ACA) and private exchanges and turmoil and large numbers of TCs are
inevitable Whether terminated choosers in these exchanges select and enroll in new plans and
how their responses vary based on default policy and previous insurance status health status
and other characteristics are matters of great policy consequence Any guidance and defaults
provided for TCs should attend to their past revealed preferences
30
Table 1 Characteristics of Stayers vs Terminated Choosers vs Voluntary switchers
MA-PD enrollees in the 200 largest counties in the US 2006 ndash 2010
Stayers Terminated Choosers Voluntary Switchers
n (person-years) 15590641 232538 1403687
Female 584 573 558
Black (vs non-black) 79 77 91
Age
65-69 279 353 318
70-74 257 253 251
75-79 219 185 199
80-84 149 124 135
85+ 97 86 98
Years enrolled in plan (prior to switch)
lt1 131 408 270
1 135 184 191
2 106 124 145
3+ 627 285 389
Expected OOPC $284 $350 $279
Premium $135 $171 $132
Base year
2006 2684837 29283 194292
2007 2888710 3184 193470
2008 3217796 1745 207787
2009 3280679 57591 388048
2010 3518619 140735 420090
Source Authors analysis of Medicare enrollment data Sample includes beneficiaries who gained eligibility
and were not disabled Excludes beneficiaries in employer-sponsored plans and non-HMO PPO and PFFS plans
Excludes beneficiaries in contracts that experienced a merger or consolidation
Stayer = did not switch out of MA-PD contract
Terminated chooser = switched out of MA-PD contract not offered in county in subsequent year
Voluntary switchers = switched out of MA-PD contract offered in county in subsequent year
In contract switching from Excludes 2006 (data not available)
31
Table 2 MA-PD switching rates 2006-2010
Switchers who are Switch Terminated Voluntary Year Beneficiaries Contracts Choosers Switchers
2006 2908412 88 114 886 2007 3085364 66 16 984 2008 3427328 63 08 992 2009 3726318 122 132 869
2010 4079444 138 251 749
Authorsrsquo analysis of Medicare enrollment data in the 200 US counties with the largest elderly populations
Sample = 17226866 person-years
32
Table 3 Transitions from MA-PD to TM
Among beneficiaries Percent moving to TM
Year Terminated Choosers Voluntary Switchers
2006-07 67 202 2009-10 238 257
2010-11 221 456
Source Authors analysis of Medicare enrollment data
33
Table 4a Beneficiary transitions and enrollment outcomes 2006-07
MA-HMO MA-PPO MA-PFFS
Original Choosers
Terminated choosers
Voluntary switchers
Terminated choosers
Voluntary switchers
Terminated choosers
Voluntary switchers Stayers
(age 65) in 2007
(1) (2) (3) (4) (5) (6) (7) (8)
N 25040 171167 4239 22406 4 719 2684837 164857
Into TM in 2007 52 195 150 249 250 416 00 na
In MA in 2007 948 805 850 751 750 584 1000 na
Within MA
MA-HMO 618 598 341 442 00 417 951 819
MA-PPO 13 176 558 259 00 76 44 131
MA-PFFS 369 142 93 274 1000 445 05 50
MA-Other 00 84 08 25 00 62 00
Table 4b Beneficiary transitions and enrollment outcomes 2009-10
MA-HMO MA-PPO MA-PFFS
Original choosers
Terminated
choosers Voluntary switchers
Terminated choosers
Voluntary switchers
Terminated choosers
Voluntary switchers Stayers
(age 65) in 2010
N 3919 238793 24986 66605 28686 82650 3280679 229608
Into TM in 2010 154 172 353 161 150 582 00 na
In MA in 2010 846 828 647 839 850 418 1000 na
Within MA
MA-HMO 620 687 564 504 308 440 883 761
MA-PPO 218 256 373 420 366 477 96 205
MA-PFFS 158 31 54 68 325 82 22 34
MA-Other 04 26 92 77 01 02 00
34
Table 5 Enrollment outcomes for terminated choosers vs weighted comparison group1
Terminated Weighted
choosers comparison group
Enrollment in next year
Study Sample overall TM 111 26
MA-HMO 464 838
MA-PPO 128 25
MA-PFFS 295 110
Stratified by year and plan type
Enrollment in 2007
TM 52 13
MA-HMO in 2006 MA-HMO 582 968
MA-PPO 13 02
MA-PFFS 352 16
Enrollment in 2010
TM 154 13
MA-HMO in 2009 MA-HMO 524 963
MA-PPO 185 18
MA-PFFS 133 06
Enrollment in 2010
TM 175 79
MA-PFFS in 2009 MA-HMO 305 152
MA-PPO 258 120
MA-PFFS 261 650
Notes Study sample includes terminated choosers (enrollees in terminated HMO plans in 2006
or 2009 or in terminated PFFS plans in 2009) and propensity-score based weighted
comparison group of non-terminated choosers) 1
All differences in distribution of enrollment across plan types are statistically significant
at plt0001
35
Table 6 Susceptibility to nudges Proportion of Terminated Choosers (TCs)
who did NOT select a Part D plan
Did not enroll in Part D
()
All TCs with plan termination in 2009 TCs who chose a new MA plan 17 TCs who went into traditional Medicare 206
Did not enroll in Part D
()
TCs with plan termination in 2009 or 2010 who went into traditional Medicare
Male 240 Female 192
Black 387 Non-Black 202
Age group 65-69 238
70-74 207
75-79 206 80-84 198 85+ 164
Distribution of Median HH income in zip code First quartile (lowest median HH income) 245 Second quartile 206
Third quartile 204
Fourth quartile (highest median HH income) 192
Source Authors analysis of Medicare enrollment data
Predicted enrollment based on logistic regression model controlling for age gender race (black or non-black) median HH income in
zip code of residence and year Sample size 44286 TC=terminated chooser
36
References Abaluck J and J Gruber Choice Inconsistencies among the Elderly Evidence from Plan Choice in the Medicare Part D Program American Economic Review 2011 101 (4) 1180ndash210 Abaluck J and Gruber J Evolving Choice Inconsistencies in Choice of Prescription Drug Insurance NBER Working Paper 19163 June 2013 Afendulis CC Landrum MB Chernew ME The Impact of the Affordable Care Act on Medicare Advantage Plan Availability and Enrollment Health Services Research 2012 47(6) 2339-2352 Afendulis CC Sinaiko AD Frank RG Dominated Choices and Medicare Advantage Enrollment NBER Working Paper no20181 2014 Agarwal S Driscoll J Gabaix X and Laibson D The age of reason Financial decisions over the lifecycle In American Law and Economic Association Annual Meetings 2008 Armour S Republicans Question Viability of Co-Ops Wall Street Journal (online) [New York NY] 25 Feb 2016 Arrow K Uncertainty and the welfare economics of medical care American Economic Review 1963 53(5) 941-973 Beshears J J J Choi D Laibson and B C Madrian 2008 How Are Preferences Revealed Journal of Public Economics 92 (8ndash9) 1787ndash94 Beshears J J J Choi D Laibson and B C Madrian The Importance of Default Options for Retirement Savings Options In Brown Liebman and Wise eds Social Security Policy in a Changing Environment Chicago IL University of Chicago Press 2009 p 167-195 Camerer C Loewenstein G and Prelec D Neuroeconomics How Neuroscience can Inform Economics Journal of Economic Literature 2005 43(1)9-64 Cox C Claxton G Levitt L ldquoAnalysis of Insurer Participation in 2016 Marketplacesrdquo Kaiser Family Foundation Issue Brief Nov 03 2015 httpkfforghealth-reformissue-briefanalysis-of-insurer-participation-in-2016-marketplaces (Accessed on Apr 20 2015) Cox C and Semanskee A ldquoAnalysis of UnitedHealth Grouprsquos Premiums and Participation in ACA Marketplacesrdquo Kaiser Family Foundation Issue Brief April 18 2016 Cox C and Semanskee A ldquoPreliminary Data on Insurer Exits and Entrants in 2017 Affordable Care Act Marketplacesrdquo Kaiser Family Foundation Data Note August 2016 Cutler D and Reber S Paying for health insurance the trade-off between competition and adverse selection Quarterly Journal of Economics 1998 113(2) 443-466 Dafny L Hendel I and Wilson N ldquoNarrow Networks on the Health Insurance Exchanges What Do They Look Like and How Do They Affect Pricingrdquo The American Economic Review 105(5) 110-114 Dafny L Gruber J and Ody C ldquoMore Insurers Lower Premiums Evidence from Initial Pricing in the Health Insurance Marketplacesrdquo The American Journal of Health Economics 2015 1(1) 53-81
37
Frank RG (2007) Behavioral Economics and Health Economics In Behavioral Economics and Its Applications Diamond P and Vartiainen H (Eds) Princeton Princeton University Press Gabel JR Whitmore H Stromberg S et al ldquoAnalysis Finds No Nationwide Increase in Health Insurance Marketplace Premiumsrdquo Commonwealth Fund Blog [blog on the Internet] 2014 Dec 22 [cited 2016 Apr 20] Available from httpwwwcommonwealthfundorgpublicationsblog2014deczero-inflation-nationwide-for-marketplace-premiums Gold M Achman L Mittler J and Stevens B 2004 ldquoMonitoring Medicare+Choice What Have We Learned Findings and Operational Lessons for Medicare Advantagerdquo Washington DC Mathematica Policy Research Doct No PR04-43 Goldstein D G E J Johnson A Herrmann and M Heitman ldquoNudge Your Customers Toward Better Choicesrdquo Harvard Business Review December 2008 99-105 Hanoch Y and T Rice Can Limiting Choice Increase Social Welfare The Elderly and Health Insurance Milbank Quarterly 2006 84 (1) 37ndash73 Hirano Keisuke and Imbens Guido W Estimation of causal effects using propensity score weighting An application to data on right heart catheterization Health Services and Outcomes Research Methodology 2001 2259-278 Johnson EJ and Goldstein DG Do Defaults Save Lives Science 2003 3021338-1339 Jost T Updated Renewal and Discontinuation Notices Auto-Reenrollment And Other ACA Developments Health Affairs Blog September 5 2016 wwwhealthaffairsorg (accessed December 4 2016) Keeney RL and Raiffa H Decisions with Multiple Objectives Preferences and Value Trade-offs Cambridge [England] New York NY Cambridge University Press 1976 Ketcham JD Lucarelli C Miravete EJ and Roebuck MC Sinking Swimming or Learning to Swim in Medicare Part D American Economic Review 2012 102(6) 2639-2673 Ketcham JD Lucarelli C and Powers CA Paying Attention or Paying Too Much in Medicare Part D American Economic Review 2015 105(1) 204-233 King R Colorado to Close Obamacare Co-Op Washington Examiner (online) October 16 2015 Kowalski A The Early Impact of the Affordable Care Act State by State Brookings Papers on Economic Activity Economic Studies Program The Brookings Institution vol 49(2 (Fall 2014)) pages 277-355 Kurth T Walker AM Glynn RJ et al Results of multivariable logistic regression propensity matching propensity adjustment and propensity-based weighting under conditions of nonuniform effect Am J Epidemiol 163262-270 2006 Kuye IO Frank RG McWilliams JM Cognition and Take-Up of Subsidized Drug Benefits by Medicare Beneficiaries JAMA Intern Med 2013 doi101001jamainternmed2013845
38
La Monica PR ldquoUnitedHealthcare to Exit Most Obamacare Exchangesrdquo CNN Money April 19 2016 httpmoneycnncom20160419investingunitedhealthcare-obamacare-exchanges-acaindexhtml (Accessed April 20 2016) Madrian B C and D F Shea 2001 The Power of Suggestion Inertia in 401(k) Participation and Savings Behavior Quarterly Journal of Economics 1161149ndash87 McWilliams J M C C Afendulis T G McGuire and B E Landon 2011 Complex Medicare Advantage Choices May Overwhelm SeniorsmdashEspecially Those with Impaired Decision Making Health Affairs 30 (9) 1786ndash94 McWilliams J M J Hsu and J P Newhouse 2012 New Risk-adjustment System Was Associated with Reduced Favorable Selection in Medicare Advantage Health Affairs 31 (12) 2630ndash40 McWilliams JM Meara E Zaslavsky AM Ayanian JZ Use of health services by previously uninsured Medicare beneficiaries New England Journal of Medicine 2007a357143-53 PMID 17625126 Medicare Payment Advisory Commission 2000 Report to the Congress Improving Risk Adjustment in Medicare Washington DC Medicare Payment Advisory Commission Medicare Payment Advisory Commission 2007 Report to Congress Medicare Payment Policy Washington DC Medicare Payment Advisory Commission Medicare Payment Advisory Commission 2009 Report to the Congress Improving Incentives in the Medicare Program Washington DC Medicare Payment Advisory Commission Medicare Payment Advisory Commission 2010 Report to Congress Medicare Payment Policy Washington DC Medicare Payment Advisory Commission Medicare Payment Advisory Commission 2011 Report to Congress Medicare Payment Policy Washington DC Medicare Payment Advisory Commission Medicare Payment Advisory Commission 2016 Report to Congress Medicare Payment Policy Washington DC Medicare Payment Advisory Commission Newhouse J P M Price J Huang J M McWilliams and J Hsu 2012 Steps to Reduce Favorable Risk Selection in Medicare Advantage Largely Succeeded Boding Well for Health Insurance Exchanges Health Affairs 31 (12) 2618ndash28 Pear R Some Policies Get More Time in Health Shift The New York Times March 6 2014 p A1 Pear R Aetna to Pull Back From Public Health Care Exchanges The New York Times August 16 2016 Physician Payment Review Commission Annual Report to Congress 1996 Washington DC Physician Payment Review Commission
39
Riley G and C Zarabozo Trends in the Health Status of Medicare Risk Contract Enrollees Health Care Financing Review 2006 28 (2) 81ndash95 Samuelson W and R Zeckhauser Status Quo Bias in Decision Makingrdquo Journal of Risk and Uncertainty 1988 17ndash59 Sinaiko AD Afendulis CC and Frank RG Enrollment in Medicare Advantage Plans in Miami-Dade County Evidence of Status Quo Bias Inquiry 2013 Smith CN Goldstein D Johnson EJ Smart defaults From hidden persuaders to adaptive helpers (Working Paper INSEAD 2009) available at httppapersssrncomezp-prod1hulharvardedusol3paperscfmabstract_id=1116650 Thaler R and Sunstein C Nudge Improving Decisions about Health Wealth and Happiness (New York NY Penguin Books 2009) Zhang Y Baik SH and Newhouse JP Use of Intelligent Assignment to Medicare Part D Plans for People With Schizophrenia Could Produce Substantial Savings Health Affairs 2015 34(3) 455-460 Zhang Y Donohue JM Lave JR ODonnel G Newhouse JP The Effect of Medicare Part D on Drug and Medical Spending N Engl J Med 2009 36152-61
40
Appendix A1 Medicare Advantage contract-level out-of-pocket cost data We obtained previously determined estimates of the out-of-pocket costs (OOPC) including premiums associated with each MA-PD plan option The Centers for Medicare and Medicaid Services (CMS) calculated these estimates by taking medical utilization data for a standard population of Medicare beneficiaries and applying the coverage and cost-sharing rules specific to each plan to these utilization data to determine the average monthly out-of-pocket costs expected for a beneficiary enrolling in that plan21 These calculations were conducted separately for five self-reported health-status groups and for six age groups To merge these estimates with our contract-level enrollment data for each age group in each county in a given year we averaged OOPC estimates for the five health-status groups within plans and then averaged the OOPC plan estimates for all plans under a given MA-PD contract We applied county contract-level enrollment data to calculate an enrollment-weighted average OOPC of being in an MA-PD contract for each age group and year for all contracts available in each county
21
The standard population was a two-year sample of TM-enrolled respondents to the Medicare Current Beneficiary Survey This estimate assumes that the quantity of services consumed does not vary with the differing cost-sharing rules across the MA plans
41
A2 Demographic Characteristics of Terminated and Non-Terminated Choosers
2006 HMO
Unweighted Weighted Non-Terminated Terminated Non-Terminated Terminated
N 2723831 21953 2723831 21953 black 80 25 24 25 male 414 393 389 393
a7074 273 303 302 303
a7579 231 252 253 252 a8084 152 147 150 147
a85 90 86 87 86 a7074male 118 123 121 123 a7074black 24 07 06 07 a7579male 97 104 103 104 a7579black 17 07 07 07 a8084male 59 54 54 54 a8084black 10 04 04 04
a85male 31 28 28 28 a85black 06 02 02 02
2009 HMO
Unweighted Weighted Non-Terminated Terminated Non-Terminated Terminated
N 3133379 3919 3199973 3919 black 85 125 123 125
male 417 443 445 443 a7074 252 255 256 255 a7579 219 190 189 190 a8084 152 120 120 120
a85 101 73 73 73 a7074male 109 115 116 115 a7074black 24 31 31 31 a7579male 93 81 80 81 a7579black 18 25 25 25 a8084male 61 52 52 52 a8084black 11 10 10 10
a85male 35 26 26 26 a85black 07 06 06 06
42
2009 PFFS
Unweighted Weighted Non-Terminated Terminated Non-Terminated Terminated
N 148736 17852 148736 17852 black 65 73 70 73 male 424 433 437 433
a7074 242 249 249 249 a7579 193 163 161 163
a8084 135 106 105 106 a85 85 62 61 62
a7074male 107 110 111 110 a7074black 17 21 20 21 a7579male 82 71 71 71 a7579black 13 12 12 12 a8084male 54 41 41 41 a8084black 08 07 07 07
a85male 28 20 20 20 a85black 05 04 04 04
21
second year of the two-year period and who then enrolled in MA or traditional Medicare for the
first time the latter perhaps due to a default into traditional Medicare
45 Descriptive Analyses
First we present descriptive statistics on the enrollment outcomes for these four groups
TCs voluntary switchers stayers and original choosers and their rates of switching into
traditional Medicare and their rates of switching into different types of MA contracts for HMO
enrollees in 2006-07 for HMO enrollees in 2009-10 and for PFFS enrollees in 2009-10 In
2010 the widespread exit of PFFS contracts created many TCs However due to data
limitations we could not observe the types of MA contracts in which voluntary switchers and
TCs enrolled in 2011 neither could we examine the choices across plans for beneficiaries who
remained in MA in 2011 Therefore we only examined transitions from MA to traditional
Medicare during the 2010-2011 period both by TCs and by voluntary switchers
46 Statistical Analyses
Terminated choosers differ from voluntary switchers and from stayers because TCs but
for the termination of their plan would have included both stayers and voluntary switchers
Given the termination we cannot distinguish between these two types in enrollment claims data
Comparing TCs to either group alone would be an unfair comparison
To identify as best possible appropriate comparisons for the choices of terminated
choosers and to bring balance to our terminated and comparison populations we used a
weighting approach that uses a propensity score approach (Hirano and Imbens 2001 and Kurth
et al 2006) to account for observable differences between terminated choosers and non-
terminated choosers (including both voluntary switchers and stayers) and to bring the non-
terminated chooser population into balance with the terminated choosers We then analyzed
differences in plan outcomes between this weighted comparison group of non-terminated
choosers and the outcomes for terminated choosers
22
This approach first employs a logit model to estimate the propensity for being a
terminated chooser on the basis of age gender race (black or not) and county We control for
county because plan payment rates are set at the county level and thus could affect a health
planrsquos propensity to withdraw and therefore a beneficiaryrsquos probability of being a terminated
chooser Moreover because all residents within a county face the same plan choices our
results are not driven by differences in underlying plan choice sets facing TCs and non-TCs14
To account for changes in payments and differences in preferences for insurance plan types
models were run separately by year and MA plan type (HMO or PFFS) We applied the
coefficients from this model to the data to estimate the probability p that each beneficiary in a
non-terminated contract would be a terminated chooser We then generate a set of weights
where each terminated chooser was assigned a weight equal to 1 and non-terminated
choosers were assigned a weight of (p1-p) (Hirano and Imbens 2001 and Kurth et al 2006) 15
The weighted distributions of characteristics of terminated and non-terminated choosers are
identical (see Appendix) and weighted analyses therefore adjust for potential confounding due
to the individual characteristics included in the propensity score models16
We compared weighted rates of enrollment into traditional Medicare and into MA overall
Among beneficiaries who remained in MA we compared rates of enrollment across types of MA
plans (MA-HMO MA-PPO and MA-PFFS) Statistical significance was assessed using
Pearsonrsquos chi-square test We also compared differences in rates of enrollment in Part D plans
among beneficiaries who switched into traditional Medicare
14
Beneficiaries in counties that did not experience any plan terminations were excluded from the analysis 15
In instances where the number of terminated choosers (the treatment population) was greater than the number of non-terminated choosers (the control population) estimating propensity-score weights in this population would result in a loss in efficiency Due to the dramatic changes in the PFFS market that began in 2009 this circumstance arose for the PFFS market in a subset of our study counties during the 2009-2010 study period Therefore we restricted the 2009 PFFS models to include only counties where there were at least as many non-terminated choosers as terminated choosers 16
Others have applied this methodology to analyze the impact of health insurance on health care utilization and on health care spending (see for example McWilliams et al 2007 Zhang et al 2009)
23
5 Results
51 Beneficiary switching and descriptive transitions
Over the period 2006-2010 nearly 233000 beneficiaries in MA plans became TCs17
TCs were similar in age gender and race to both voluntary switchers and stayers but were
much more likely to have been enrolled in their MA contracts for a shorter duration one year or
less (Table 1) The vast majority of the MA contract exits examined occurred in 2006 2009 and
2010 The yearly proportion of MA enrollees who switched out their plan increased over the
study period from 88 to 138 and the majority of switchers each year were voluntary
switchers (Table 2) Voluntary switchers were more likely than TCs to transition from MA to
traditional Medicare following each of those years (Table 3)
Tables 4a and 4b present unadjusted descriptive data on the transitions of TCs and all
other types of beneficiaries voluntary switchers stayers and original choosers Considering
transitions in 2006-2007 (Table 4a) TCs in all plan types were much less likely to transition to
traditional Medicare than were voluntary switchers moving out of the same plan types The
transition numbers are 52 vs 195 for HMO enrollees 150 vs 249 for PPO enrollees
25 vs 416 for PFFS enrollees--though this last category had a very small sample size
Among beneficiaries who were in an MA-HMO in 2006 TCs were more likely to enroll in a PFFS
plan than were voluntary switchers Together voluntary switchers and TCs who stayed in MA
were more likely to enroll in a non-HMO plan than were either stayers (column 7) or original
choosers who chose MA (column 8)
By contrast in 2009 when significant numbers of PFFS plans first exited from MA
markets TCsrsquo higher rate of remaining in MA as compared to voluntary switchers was driven by
terminated choosers in PFFS plans In 2009 a large proportion of terminated choosers had
17
This figure includes TCs created in all five years of the entire period though 98 occurred in 2006 2009 and 2010
24
originally enrolled in PFFS plans In comparison with voluntary switchers from PFFS in 2009
TCs were dramatically more likely to stay in MA in 2010 (850 vs 418 Table 4b column 5
vs 6) Another large group of terminated choosers in 2009 had originally enrolled in a PPO
plan Here we observe the one instance in which a larger proportion of these beneficiaries
transitioned to traditional Medicare than did voluntary switchers from this plan type (353 vs
161 Table 4b column 3 vs 4) TCs in MA-HMO plans were slightly less likely to transition to
traditional Medicare than were voluntary switchers from MA-HMO plans (154 vs 172)
Again we observe from 2009-2010 as we did from 2006-2007 that both voluntary switchers
and TCs who stayed in MA were more likely to enroll in a non-HMO plan than were stayers
(column 7) and original choosers who chose MA (column 8)
52 Statistical Analyses
It is not possible to draw appropriate inferences about the impact of default policies and
the effects of terminated plans simply based on the results from Section 51 That is because
neither voluntary switchers nor stayers nor original choosers constitute an appropriate
comparison group for TCs This section presents results on plan enrollment outcomes of TCs
versus those for a sample of non-terminated choosers that includes both voluntary switchers
and stayers where members of that sample were weighted according to their propensity for
being in a terminated plan thereby creating balance between the two groups
TCs in our pooled sample were more likely to transition to traditional Medicare than were
non-terminated choosers (111 vs 26 plt0001) (Table 5) This pattern holds both among
TCs who were originally enrolled in HMOs and those originally enrolled in PFFS Medicare
Advantage plans TCs were three times more likely to move to traditional Medicare from MA-
HMO contracts in 2006 twelve times more likely to move to traditional Medicare from MA-HMO
contracts in 2009 and twice as likely to move to traditional Medicare from MA-PFFS contracts in
2009
25
Multiple forces could contribute to these dramatic disparities One possibility is that
status quo bias among individuals whose plans survived led them to stick with their plan going
forward A second is that some TCs were affected by the default into traditional Medicare when
traditional Medicare may or may not have been their second choice We incline to status quo
bias of the non-terminated choosers being the principal explanation as that grouprsquos members
only switched to traditional Medicare 26 of the time The switch percentage for TCs to
traditional Medicare was 111 implying that the default was hardly determinative
53 Further analysis of quality of choices and susceptibility to nudges
TCs who transitioned from MA to traditional Medicare were a distinct minority No doubt
some of these transitions were voluntary but some may have been influenced by the default
into traditional Medicare If so this should be reflected in the differential likelihood that these
two groups of TCs chose to enroll in a plan with prescription drug coverage That is because
prior to their plan termination all TCs in our sample had selected a Medicare Advantage plan
that included a prescription drug plan Traditional Medicare with Part D or a new Medicare
Advantage plan with Part D is much closer to being actuarially equivalent to their plan prior to
their termination than is traditional Medicare without Part D However traditional Medicare
without Part D is the default TCs who move into Traditional Medicare must actively enroll in a
Part D plan if they are to have prescription drug coverage Given their original choices and the
heavy subsidies of Part D we conclude that those TCs transitioning to traditional Medicare
without Part D probably made a mistake and suffered expected monetary losses
We compared the rates of enrollment in a Part D plan among TCs (Table 6) First the
top panel shows that among all TCs those moving to traditional Medicare were significantly
more likely to fail to enroll in a Part D plan than were their peers who actively chose to stay in
MA (206 vs 17)
The second panel shows the population of TCs who transitioned to Traditional Medicare
Beneficiaries who were male were more likely to fail to enroll in Part D than were women (240
26
vs 192 plt0001) as were beneficiaries who were black vs non-black (387 vs 202
plt0001) Failing to enroll in a Part D plan decreases with age and with median household
income of the zip code in which beneficiaries reside
6 Discussion
This study investigates the phenomenon of a policy-imposed default versus the forces
promoting consistent choices among terminated choosers in health insurance markets The
evidence shows that the default policy associated with contract terminations in Medicare
Advantage had a moderate impact on the transitions of beneficiaries in terminated plans from
MA to traditional Medicare TCs were more likely to be enrolled in traditional Medicare in the
year following their plan terminations than were non-terminated choosers However a very
large percentage of TCs took specific action to select new MA plans following their initial planrsquos
termination Their active choices to remain in MA likely stemmed from the same preferences
that were operating when they originally reviewed the available plans and deliberately chose
MA The persistent preferences of these individuals were perhaps reinforced by status quo
bias which has been shown to exist for some combination of rational and irrational reasons
among Medicare beneficiaries
The majority of TCs who transitioned into traditional Medicare from 2009-2010 also
showed their ability to choose contrary to a default Roughly three quarters of them took the
active step to enroll in the Part D benefit The remaining quarter of TCs transitioning to
traditional Medicare following their plan termination failed to take up a Part D plan an outcome
in contrast to their prior selection of a MA plan with Part D suggesting some susceptibility to
nudges Those most susceptible were more likely to be black male younger and to live in a zip
code with lower median household income The finding that susceptibility decreases with age is
a bit surprising given that aging is associated with cognitive decline which inhibits decision-
making However working in opposition and presumably prevailing is the fact that older
27
beneficiaries presumably are more likely to need more prescription drugs and thus benefit more
from Part D coverage
Typically default rules are used to nudge people away from making errors that might
otherwise occur in complex high-stakes choice environments (for example with 401K plan
enrollment) and where the experts are in relatively widespread agreement on which alternative
is superior The default nudge studied here differs dramatically from more traditional policy
nudges for two reasons First there is no evidence that it was actively designed to promote
superior choices for individuals In fact the lack of automatic enrollment in Part D leaves
beneficiaries who accepted the default substantially worse off in expectation than they would be
if they had been able to stay in their prior plan Second this nudge pushes individuals towards
an option that is quite different than what they had chosen in a prior period These two features
of the default and therefore their implications for consumer welfare differ from the vast majority
of nudges reported in previous literature
Why does Medicare include this default Given that Medicare Advantage costs the
government more and that Part D coverage is heavily subsidized one possible justification
would be that a successful nudge would save the government money But surely that
consideration should be weighed against having beneficiaries choose against their preferred
plans And any government that gets into the business of such nudges has to worry about
hurting its overall legitimacy Rather the specified default for TCs in Medicare Advantage is
likely in place because it mirrors the default for original choosers in the Medicare program
which is traditional Medicare and it is the most administratively simple to implement
However the specified default of TCs to traditional Medicare fails to make use of
information about beneficiariesrsquo revealed preferences among plans A second MA plan is likely
28
more similar to the original choice than TM in several consequential ways (eg covered
benefits cost-sharing requirements) hence likely to be better suited to the client18
Smart defaults which take into account individual starting positions preferences or
expected needs have been suggested as an alternative to the ldquobenignrdquo default discussed thus
far in this paper (Smith et al 2009) Smart defaults have begun to be used in other public
programs19 and have been shown to have the potential to achieve large savings for enrollees in
Medicare Part D (Zhang et al 2015)20
Because of differences in physician networks across health plans smart defaults would
add administrative complexity but they would be feasible For example in Medicare a smart
default system could analyze the degree of overlap in physician networks across MA plans in an
area it could then use MA as the default if the overlap reached a certain threshold below the
threshold the default would be TM An even more sophisticated algorithm could consider the
physicians the individual has previously used and at a more advanced level could even include
information about recent diagnoses and the implications for appropriate health-care coverage
The success of these default alternatives would be revealed if we observed that relatively few
TCs chose against them
More generally the outcomes for terminated choosers in other health-insurance
exchange settings should be examined Nearly 13 million individuals have enrolled in health
plans through state or federal health-insurance marketplaces created under the ACA These
18
By analogy consider if one had to choose a new car default for an individual who was trading in an SUV that was no longer made An SUV default would more likely meet his preferences than a sedan 19
For example the California demonstration project to Integrate Care for Dual Eligible Beneficiaries (the Cal MediConnect program) is passively enrolling individuals into health plans using an ldquointelligent assignmentrdquo process that analyzes the individualrsquos recently used providers and matches those providers to the physician networks of participating plans Individuals will be passively enrolled in the plan that best meets their current circumstances prioritizing continuity of care There is a 90-day period when individuals can change plans or opt-out (California Department of Health Care Services 2014) 20
Zhang et al simulate an ldquointelligent assignmentrdquo algorithm that would assigning Medicare beneficiaries with schizophrenia who are eligible for a low-income subsidy to the least expensive Part D prescription drug plan based on their prior year drug use instead of random assignment to any plan (the current policy) and project savings on average of $387 per beneficiary
29
include many different types of clients those who were previously insured in individual
insurance plans and who presumably have considerable experience selecting plans and
navigating the market and those who were previously uninsured and who likely have very little
experience with health insurance The effects of default policies following plan terminations
across these different types of enrollees could differ dramatically In some ACA marketplaces
TCs who fail to select a new option for coverage lose their health insurance coverage
altogether an outcome that is clearly sub-optimal relative to their prior choice In 2017
enrollees in terminated plans purchased through federally-facilitated marketplaces may be
automatically enrolled in a new plan (generally the lowest-cost plan of the same product network
type) if they donrsquot choose a new plan or actively opt-out of the marketplace (Jost 2016)
Plan enrollment decisions are very consequential for individuals Increasing numbers of
Americans are choosing plans in health insurance exchange settings such as Medicare the
Affordable Care Act (ACA) and private exchanges and turmoil and large numbers of TCs are
inevitable Whether terminated choosers in these exchanges select and enroll in new plans and
how their responses vary based on default policy and previous insurance status health status
and other characteristics are matters of great policy consequence Any guidance and defaults
provided for TCs should attend to their past revealed preferences
30
Table 1 Characteristics of Stayers vs Terminated Choosers vs Voluntary switchers
MA-PD enrollees in the 200 largest counties in the US 2006 ndash 2010
Stayers Terminated Choosers Voluntary Switchers
n (person-years) 15590641 232538 1403687
Female 584 573 558
Black (vs non-black) 79 77 91
Age
65-69 279 353 318
70-74 257 253 251
75-79 219 185 199
80-84 149 124 135
85+ 97 86 98
Years enrolled in plan (prior to switch)
lt1 131 408 270
1 135 184 191
2 106 124 145
3+ 627 285 389
Expected OOPC $284 $350 $279
Premium $135 $171 $132
Base year
2006 2684837 29283 194292
2007 2888710 3184 193470
2008 3217796 1745 207787
2009 3280679 57591 388048
2010 3518619 140735 420090
Source Authors analysis of Medicare enrollment data Sample includes beneficiaries who gained eligibility
and were not disabled Excludes beneficiaries in employer-sponsored plans and non-HMO PPO and PFFS plans
Excludes beneficiaries in contracts that experienced a merger or consolidation
Stayer = did not switch out of MA-PD contract
Terminated chooser = switched out of MA-PD contract not offered in county in subsequent year
Voluntary switchers = switched out of MA-PD contract offered in county in subsequent year
In contract switching from Excludes 2006 (data not available)
31
Table 2 MA-PD switching rates 2006-2010
Switchers who are Switch Terminated Voluntary Year Beneficiaries Contracts Choosers Switchers
2006 2908412 88 114 886 2007 3085364 66 16 984 2008 3427328 63 08 992 2009 3726318 122 132 869
2010 4079444 138 251 749
Authorsrsquo analysis of Medicare enrollment data in the 200 US counties with the largest elderly populations
Sample = 17226866 person-years
32
Table 3 Transitions from MA-PD to TM
Among beneficiaries Percent moving to TM
Year Terminated Choosers Voluntary Switchers
2006-07 67 202 2009-10 238 257
2010-11 221 456
Source Authors analysis of Medicare enrollment data
33
Table 4a Beneficiary transitions and enrollment outcomes 2006-07
MA-HMO MA-PPO MA-PFFS
Original Choosers
Terminated choosers
Voluntary switchers
Terminated choosers
Voluntary switchers
Terminated choosers
Voluntary switchers Stayers
(age 65) in 2007
(1) (2) (3) (4) (5) (6) (7) (8)
N 25040 171167 4239 22406 4 719 2684837 164857
Into TM in 2007 52 195 150 249 250 416 00 na
In MA in 2007 948 805 850 751 750 584 1000 na
Within MA
MA-HMO 618 598 341 442 00 417 951 819
MA-PPO 13 176 558 259 00 76 44 131
MA-PFFS 369 142 93 274 1000 445 05 50
MA-Other 00 84 08 25 00 62 00
Table 4b Beneficiary transitions and enrollment outcomes 2009-10
MA-HMO MA-PPO MA-PFFS
Original choosers
Terminated
choosers Voluntary switchers
Terminated choosers
Voluntary switchers
Terminated choosers
Voluntary switchers Stayers
(age 65) in 2010
N 3919 238793 24986 66605 28686 82650 3280679 229608
Into TM in 2010 154 172 353 161 150 582 00 na
In MA in 2010 846 828 647 839 850 418 1000 na
Within MA
MA-HMO 620 687 564 504 308 440 883 761
MA-PPO 218 256 373 420 366 477 96 205
MA-PFFS 158 31 54 68 325 82 22 34
MA-Other 04 26 92 77 01 02 00
34
Table 5 Enrollment outcomes for terminated choosers vs weighted comparison group1
Terminated Weighted
choosers comparison group
Enrollment in next year
Study Sample overall TM 111 26
MA-HMO 464 838
MA-PPO 128 25
MA-PFFS 295 110
Stratified by year and plan type
Enrollment in 2007
TM 52 13
MA-HMO in 2006 MA-HMO 582 968
MA-PPO 13 02
MA-PFFS 352 16
Enrollment in 2010
TM 154 13
MA-HMO in 2009 MA-HMO 524 963
MA-PPO 185 18
MA-PFFS 133 06
Enrollment in 2010
TM 175 79
MA-PFFS in 2009 MA-HMO 305 152
MA-PPO 258 120
MA-PFFS 261 650
Notes Study sample includes terminated choosers (enrollees in terminated HMO plans in 2006
or 2009 or in terminated PFFS plans in 2009) and propensity-score based weighted
comparison group of non-terminated choosers) 1
All differences in distribution of enrollment across plan types are statistically significant
at plt0001
35
Table 6 Susceptibility to nudges Proportion of Terminated Choosers (TCs)
who did NOT select a Part D plan
Did not enroll in Part D
()
All TCs with plan termination in 2009 TCs who chose a new MA plan 17 TCs who went into traditional Medicare 206
Did not enroll in Part D
()
TCs with plan termination in 2009 or 2010 who went into traditional Medicare
Male 240 Female 192
Black 387 Non-Black 202
Age group 65-69 238
70-74 207
75-79 206 80-84 198 85+ 164
Distribution of Median HH income in zip code First quartile (lowest median HH income) 245 Second quartile 206
Third quartile 204
Fourth quartile (highest median HH income) 192
Source Authors analysis of Medicare enrollment data
Predicted enrollment based on logistic regression model controlling for age gender race (black or non-black) median HH income in
zip code of residence and year Sample size 44286 TC=terminated chooser
36
References Abaluck J and J Gruber Choice Inconsistencies among the Elderly Evidence from Plan Choice in the Medicare Part D Program American Economic Review 2011 101 (4) 1180ndash210 Abaluck J and Gruber J Evolving Choice Inconsistencies in Choice of Prescription Drug Insurance NBER Working Paper 19163 June 2013 Afendulis CC Landrum MB Chernew ME The Impact of the Affordable Care Act on Medicare Advantage Plan Availability and Enrollment Health Services Research 2012 47(6) 2339-2352 Afendulis CC Sinaiko AD Frank RG Dominated Choices and Medicare Advantage Enrollment NBER Working Paper no20181 2014 Agarwal S Driscoll J Gabaix X and Laibson D The age of reason Financial decisions over the lifecycle In American Law and Economic Association Annual Meetings 2008 Armour S Republicans Question Viability of Co-Ops Wall Street Journal (online) [New York NY] 25 Feb 2016 Arrow K Uncertainty and the welfare economics of medical care American Economic Review 1963 53(5) 941-973 Beshears J J J Choi D Laibson and B C Madrian 2008 How Are Preferences Revealed Journal of Public Economics 92 (8ndash9) 1787ndash94 Beshears J J J Choi D Laibson and B C Madrian The Importance of Default Options for Retirement Savings Options In Brown Liebman and Wise eds Social Security Policy in a Changing Environment Chicago IL University of Chicago Press 2009 p 167-195 Camerer C Loewenstein G and Prelec D Neuroeconomics How Neuroscience can Inform Economics Journal of Economic Literature 2005 43(1)9-64 Cox C Claxton G Levitt L ldquoAnalysis of Insurer Participation in 2016 Marketplacesrdquo Kaiser Family Foundation Issue Brief Nov 03 2015 httpkfforghealth-reformissue-briefanalysis-of-insurer-participation-in-2016-marketplaces (Accessed on Apr 20 2015) Cox C and Semanskee A ldquoAnalysis of UnitedHealth Grouprsquos Premiums and Participation in ACA Marketplacesrdquo Kaiser Family Foundation Issue Brief April 18 2016 Cox C and Semanskee A ldquoPreliminary Data on Insurer Exits and Entrants in 2017 Affordable Care Act Marketplacesrdquo Kaiser Family Foundation Data Note August 2016 Cutler D and Reber S Paying for health insurance the trade-off between competition and adverse selection Quarterly Journal of Economics 1998 113(2) 443-466 Dafny L Hendel I and Wilson N ldquoNarrow Networks on the Health Insurance Exchanges What Do They Look Like and How Do They Affect Pricingrdquo The American Economic Review 105(5) 110-114 Dafny L Gruber J and Ody C ldquoMore Insurers Lower Premiums Evidence from Initial Pricing in the Health Insurance Marketplacesrdquo The American Journal of Health Economics 2015 1(1) 53-81
37
Frank RG (2007) Behavioral Economics and Health Economics In Behavioral Economics and Its Applications Diamond P and Vartiainen H (Eds) Princeton Princeton University Press Gabel JR Whitmore H Stromberg S et al ldquoAnalysis Finds No Nationwide Increase in Health Insurance Marketplace Premiumsrdquo Commonwealth Fund Blog [blog on the Internet] 2014 Dec 22 [cited 2016 Apr 20] Available from httpwwwcommonwealthfundorgpublicationsblog2014deczero-inflation-nationwide-for-marketplace-premiums Gold M Achman L Mittler J and Stevens B 2004 ldquoMonitoring Medicare+Choice What Have We Learned Findings and Operational Lessons for Medicare Advantagerdquo Washington DC Mathematica Policy Research Doct No PR04-43 Goldstein D G E J Johnson A Herrmann and M Heitman ldquoNudge Your Customers Toward Better Choicesrdquo Harvard Business Review December 2008 99-105 Hanoch Y and T Rice Can Limiting Choice Increase Social Welfare The Elderly and Health Insurance Milbank Quarterly 2006 84 (1) 37ndash73 Hirano Keisuke and Imbens Guido W Estimation of causal effects using propensity score weighting An application to data on right heart catheterization Health Services and Outcomes Research Methodology 2001 2259-278 Johnson EJ and Goldstein DG Do Defaults Save Lives Science 2003 3021338-1339 Jost T Updated Renewal and Discontinuation Notices Auto-Reenrollment And Other ACA Developments Health Affairs Blog September 5 2016 wwwhealthaffairsorg (accessed December 4 2016) Keeney RL and Raiffa H Decisions with Multiple Objectives Preferences and Value Trade-offs Cambridge [England] New York NY Cambridge University Press 1976 Ketcham JD Lucarelli C Miravete EJ and Roebuck MC Sinking Swimming or Learning to Swim in Medicare Part D American Economic Review 2012 102(6) 2639-2673 Ketcham JD Lucarelli C and Powers CA Paying Attention or Paying Too Much in Medicare Part D American Economic Review 2015 105(1) 204-233 King R Colorado to Close Obamacare Co-Op Washington Examiner (online) October 16 2015 Kowalski A The Early Impact of the Affordable Care Act State by State Brookings Papers on Economic Activity Economic Studies Program The Brookings Institution vol 49(2 (Fall 2014)) pages 277-355 Kurth T Walker AM Glynn RJ et al Results of multivariable logistic regression propensity matching propensity adjustment and propensity-based weighting under conditions of nonuniform effect Am J Epidemiol 163262-270 2006 Kuye IO Frank RG McWilliams JM Cognition and Take-Up of Subsidized Drug Benefits by Medicare Beneficiaries JAMA Intern Med 2013 doi101001jamainternmed2013845
38
La Monica PR ldquoUnitedHealthcare to Exit Most Obamacare Exchangesrdquo CNN Money April 19 2016 httpmoneycnncom20160419investingunitedhealthcare-obamacare-exchanges-acaindexhtml (Accessed April 20 2016) Madrian B C and D F Shea 2001 The Power of Suggestion Inertia in 401(k) Participation and Savings Behavior Quarterly Journal of Economics 1161149ndash87 McWilliams J M C C Afendulis T G McGuire and B E Landon 2011 Complex Medicare Advantage Choices May Overwhelm SeniorsmdashEspecially Those with Impaired Decision Making Health Affairs 30 (9) 1786ndash94 McWilliams J M J Hsu and J P Newhouse 2012 New Risk-adjustment System Was Associated with Reduced Favorable Selection in Medicare Advantage Health Affairs 31 (12) 2630ndash40 McWilliams JM Meara E Zaslavsky AM Ayanian JZ Use of health services by previously uninsured Medicare beneficiaries New England Journal of Medicine 2007a357143-53 PMID 17625126 Medicare Payment Advisory Commission 2000 Report to the Congress Improving Risk Adjustment in Medicare Washington DC Medicare Payment Advisory Commission Medicare Payment Advisory Commission 2007 Report to Congress Medicare Payment Policy Washington DC Medicare Payment Advisory Commission Medicare Payment Advisory Commission 2009 Report to the Congress Improving Incentives in the Medicare Program Washington DC Medicare Payment Advisory Commission Medicare Payment Advisory Commission 2010 Report to Congress Medicare Payment Policy Washington DC Medicare Payment Advisory Commission Medicare Payment Advisory Commission 2011 Report to Congress Medicare Payment Policy Washington DC Medicare Payment Advisory Commission Medicare Payment Advisory Commission 2016 Report to Congress Medicare Payment Policy Washington DC Medicare Payment Advisory Commission Newhouse J P M Price J Huang J M McWilliams and J Hsu 2012 Steps to Reduce Favorable Risk Selection in Medicare Advantage Largely Succeeded Boding Well for Health Insurance Exchanges Health Affairs 31 (12) 2618ndash28 Pear R Some Policies Get More Time in Health Shift The New York Times March 6 2014 p A1 Pear R Aetna to Pull Back From Public Health Care Exchanges The New York Times August 16 2016 Physician Payment Review Commission Annual Report to Congress 1996 Washington DC Physician Payment Review Commission
39
Riley G and C Zarabozo Trends in the Health Status of Medicare Risk Contract Enrollees Health Care Financing Review 2006 28 (2) 81ndash95 Samuelson W and R Zeckhauser Status Quo Bias in Decision Makingrdquo Journal of Risk and Uncertainty 1988 17ndash59 Sinaiko AD Afendulis CC and Frank RG Enrollment in Medicare Advantage Plans in Miami-Dade County Evidence of Status Quo Bias Inquiry 2013 Smith CN Goldstein D Johnson EJ Smart defaults From hidden persuaders to adaptive helpers (Working Paper INSEAD 2009) available at httppapersssrncomezp-prod1hulharvardedusol3paperscfmabstract_id=1116650 Thaler R and Sunstein C Nudge Improving Decisions about Health Wealth and Happiness (New York NY Penguin Books 2009) Zhang Y Baik SH and Newhouse JP Use of Intelligent Assignment to Medicare Part D Plans for People With Schizophrenia Could Produce Substantial Savings Health Affairs 2015 34(3) 455-460 Zhang Y Donohue JM Lave JR ODonnel G Newhouse JP The Effect of Medicare Part D on Drug and Medical Spending N Engl J Med 2009 36152-61
40
Appendix A1 Medicare Advantage contract-level out-of-pocket cost data We obtained previously determined estimates of the out-of-pocket costs (OOPC) including premiums associated with each MA-PD plan option The Centers for Medicare and Medicaid Services (CMS) calculated these estimates by taking medical utilization data for a standard population of Medicare beneficiaries and applying the coverage and cost-sharing rules specific to each plan to these utilization data to determine the average monthly out-of-pocket costs expected for a beneficiary enrolling in that plan21 These calculations were conducted separately for five self-reported health-status groups and for six age groups To merge these estimates with our contract-level enrollment data for each age group in each county in a given year we averaged OOPC estimates for the five health-status groups within plans and then averaged the OOPC plan estimates for all plans under a given MA-PD contract We applied county contract-level enrollment data to calculate an enrollment-weighted average OOPC of being in an MA-PD contract for each age group and year for all contracts available in each county
21
The standard population was a two-year sample of TM-enrolled respondents to the Medicare Current Beneficiary Survey This estimate assumes that the quantity of services consumed does not vary with the differing cost-sharing rules across the MA plans
41
A2 Demographic Characteristics of Terminated and Non-Terminated Choosers
2006 HMO
Unweighted Weighted Non-Terminated Terminated Non-Terminated Terminated
N 2723831 21953 2723831 21953 black 80 25 24 25 male 414 393 389 393
a7074 273 303 302 303
a7579 231 252 253 252 a8084 152 147 150 147
a85 90 86 87 86 a7074male 118 123 121 123 a7074black 24 07 06 07 a7579male 97 104 103 104 a7579black 17 07 07 07 a8084male 59 54 54 54 a8084black 10 04 04 04
a85male 31 28 28 28 a85black 06 02 02 02
2009 HMO
Unweighted Weighted Non-Terminated Terminated Non-Terminated Terminated
N 3133379 3919 3199973 3919 black 85 125 123 125
male 417 443 445 443 a7074 252 255 256 255 a7579 219 190 189 190 a8084 152 120 120 120
a85 101 73 73 73 a7074male 109 115 116 115 a7074black 24 31 31 31 a7579male 93 81 80 81 a7579black 18 25 25 25 a8084male 61 52 52 52 a8084black 11 10 10 10
a85male 35 26 26 26 a85black 07 06 06 06
42
2009 PFFS
Unweighted Weighted Non-Terminated Terminated Non-Terminated Terminated
N 148736 17852 148736 17852 black 65 73 70 73 male 424 433 437 433
a7074 242 249 249 249 a7579 193 163 161 163
a8084 135 106 105 106 a85 85 62 61 62
a7074male 107 110 111 110 a7074black 17 21 20 21 a7579male 82 71 71 71 a7579black 13 12 12 12 a8084male 54 41 41 41 a8084black 08 07 07 07
a85male 28 20 20 20 a85black 05 04 04 04
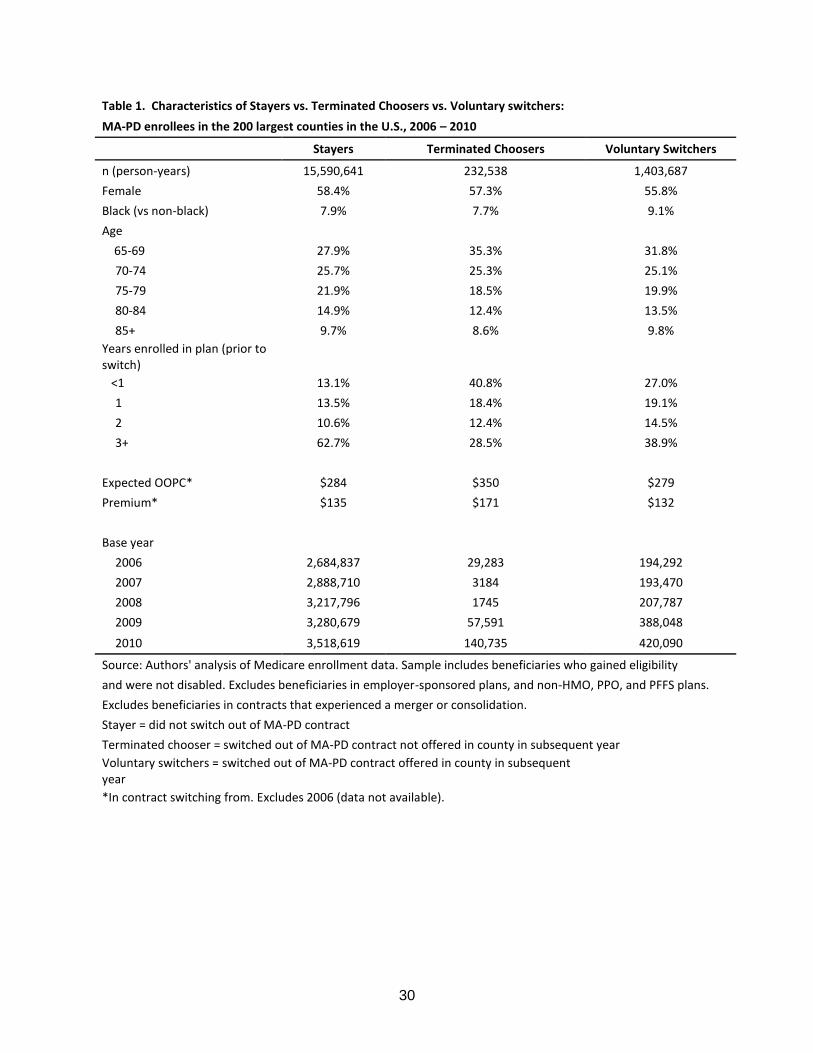
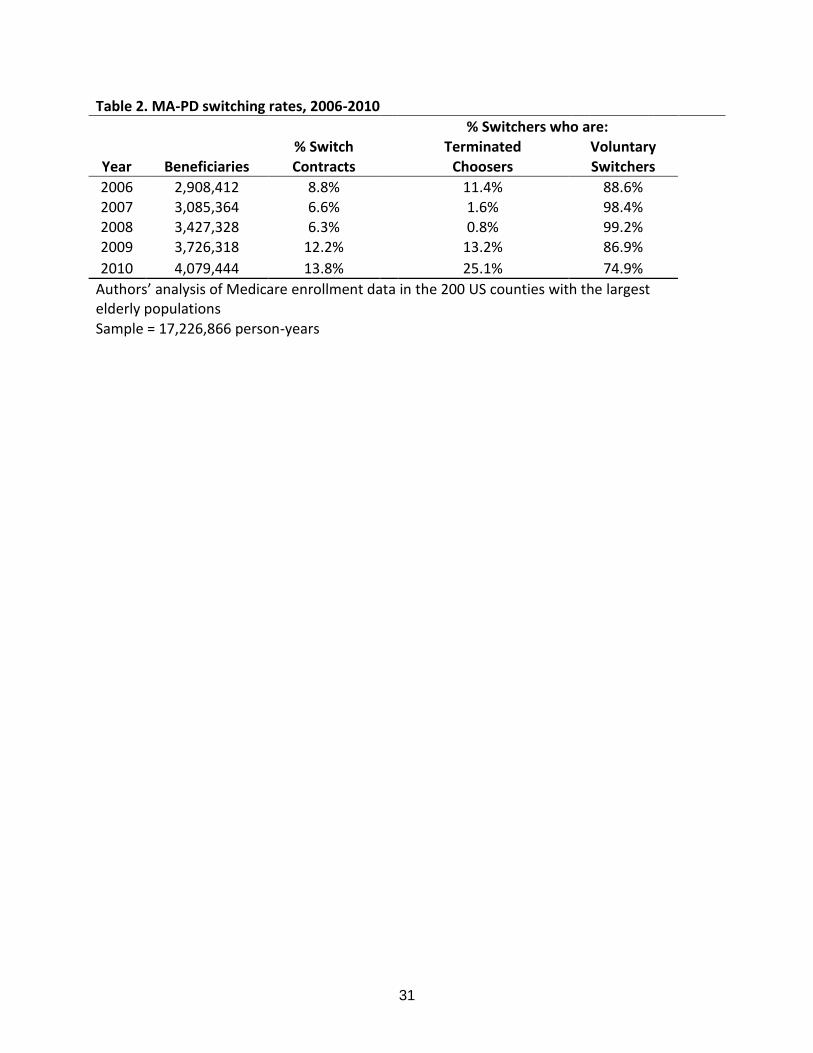
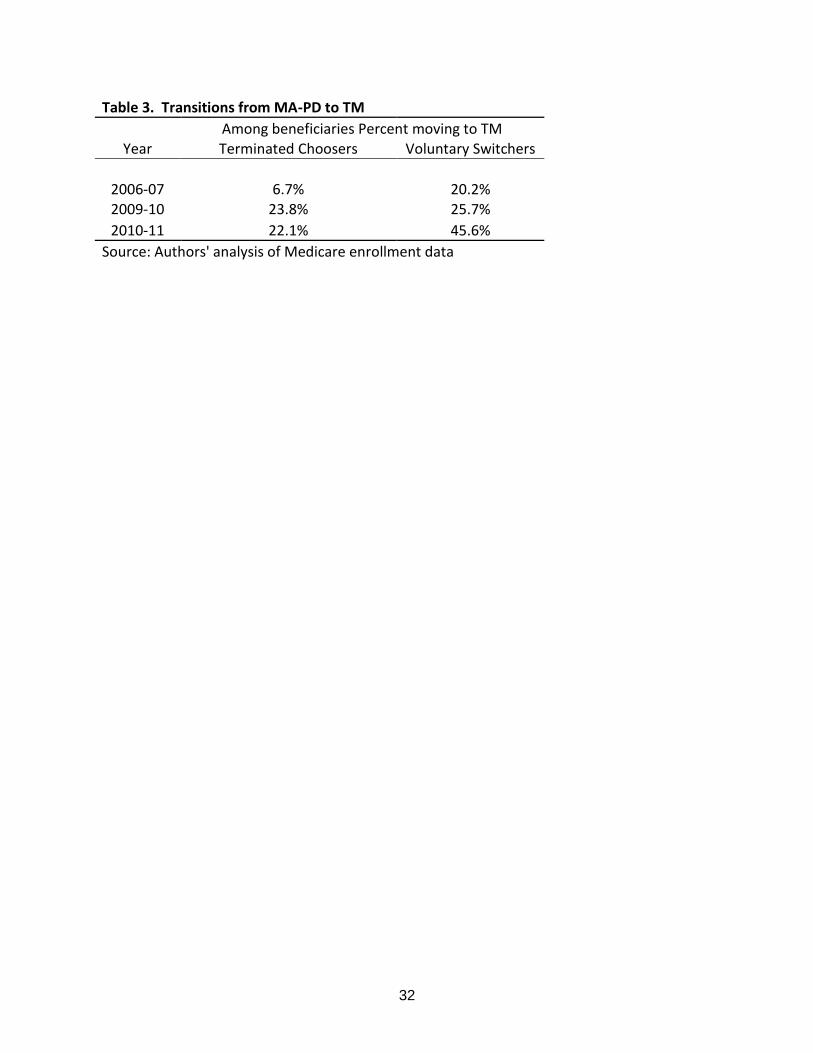
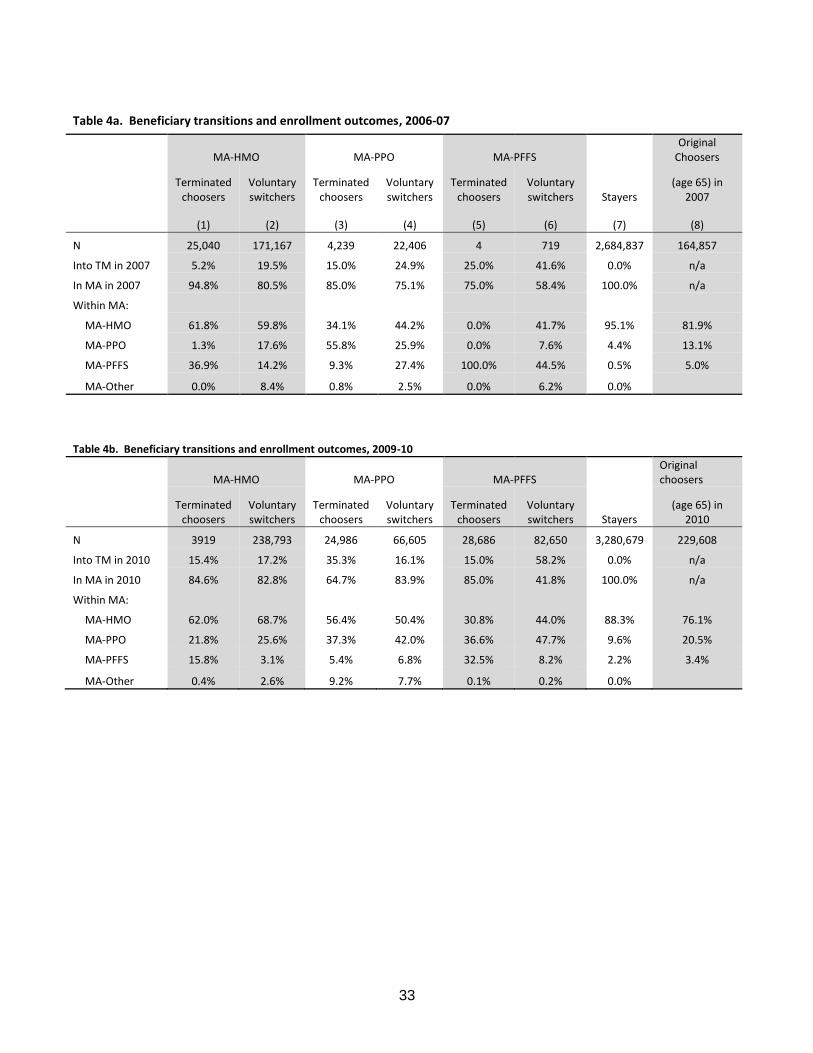
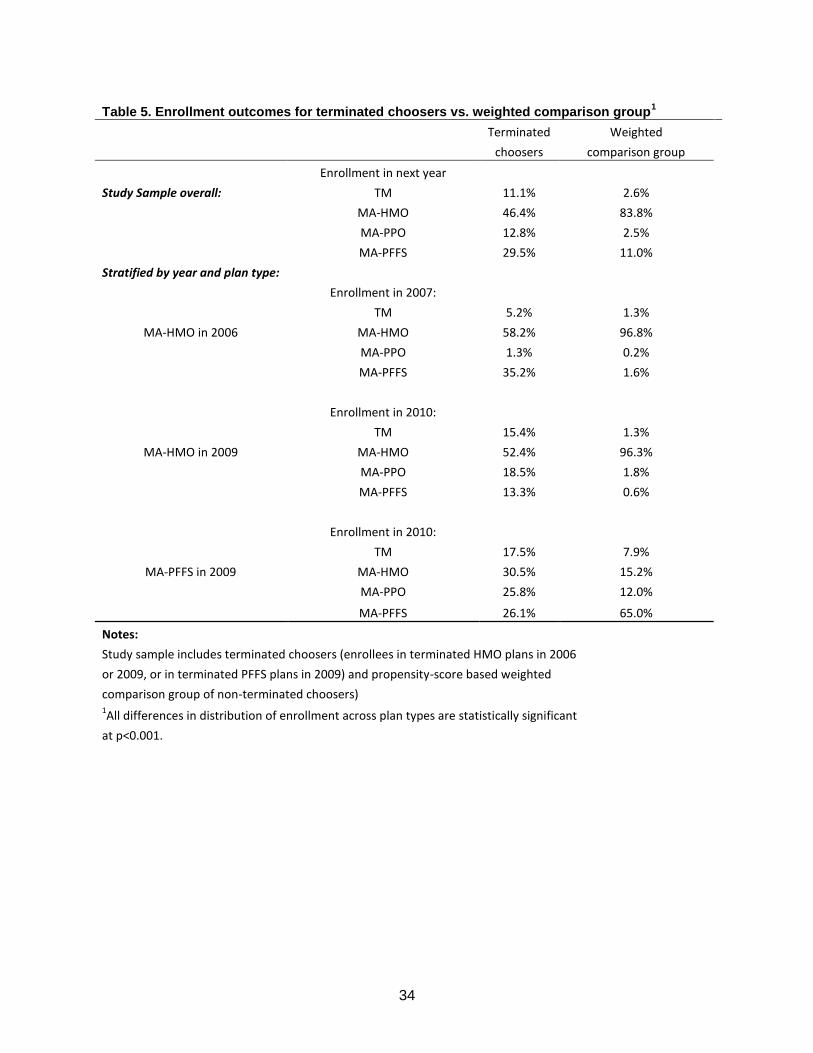
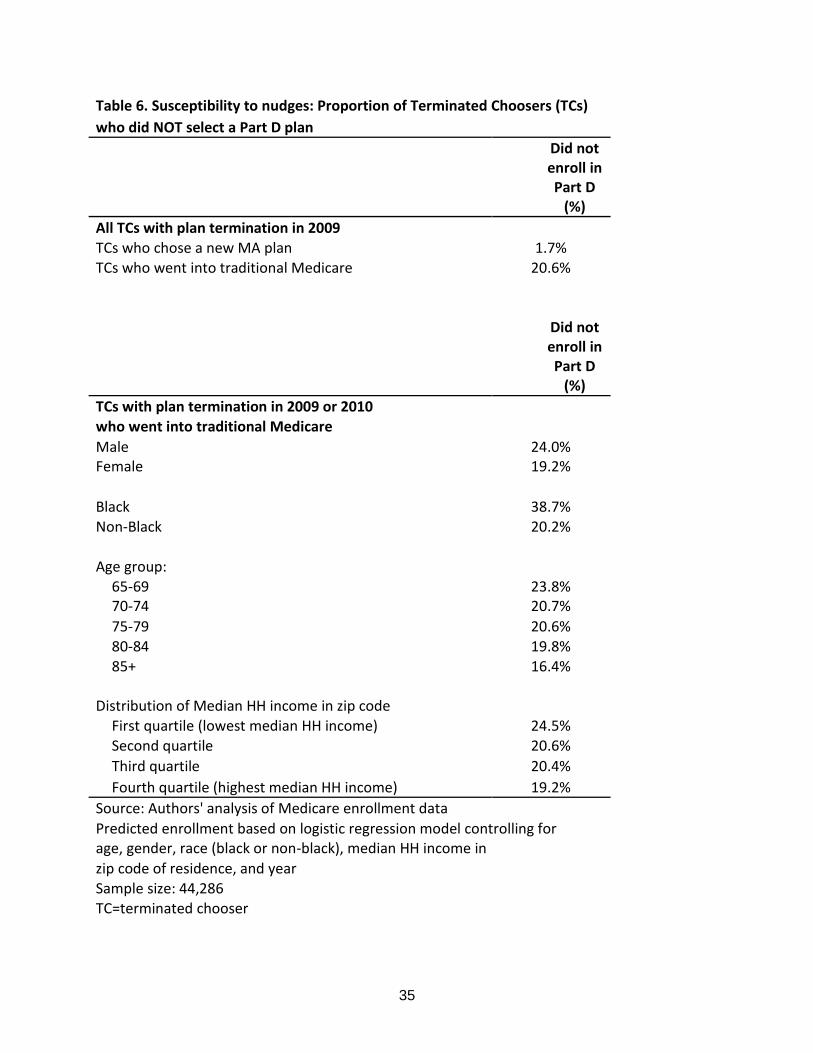
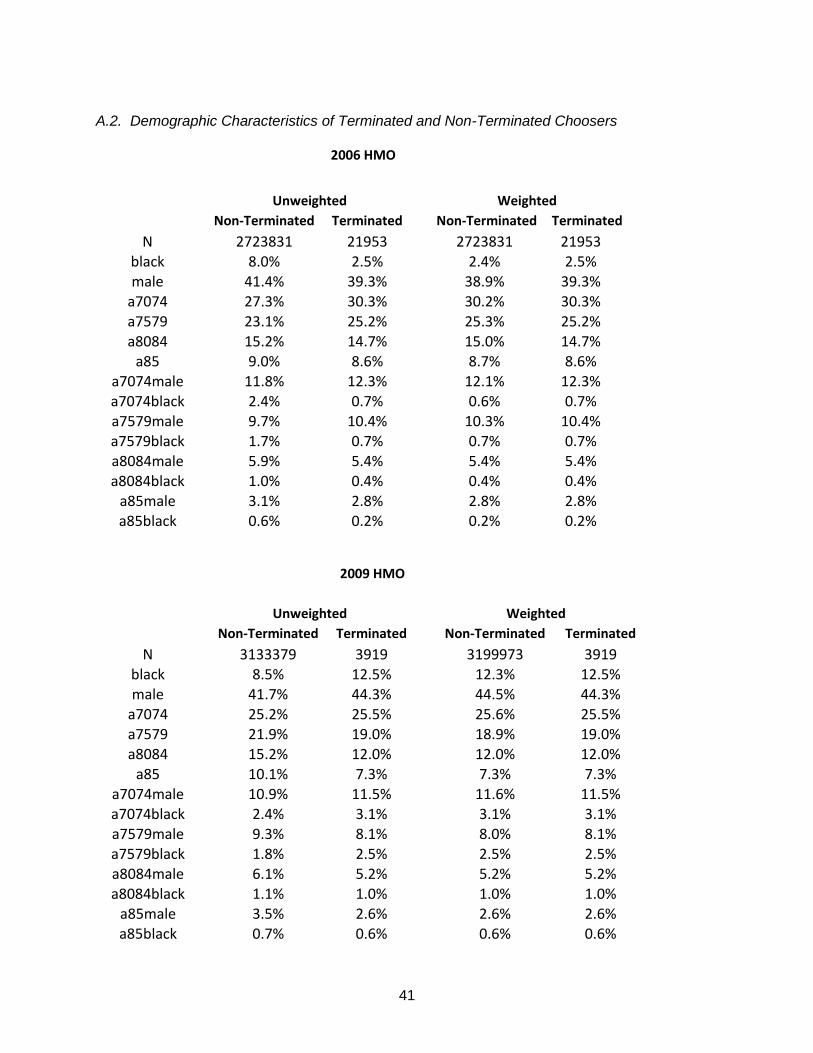
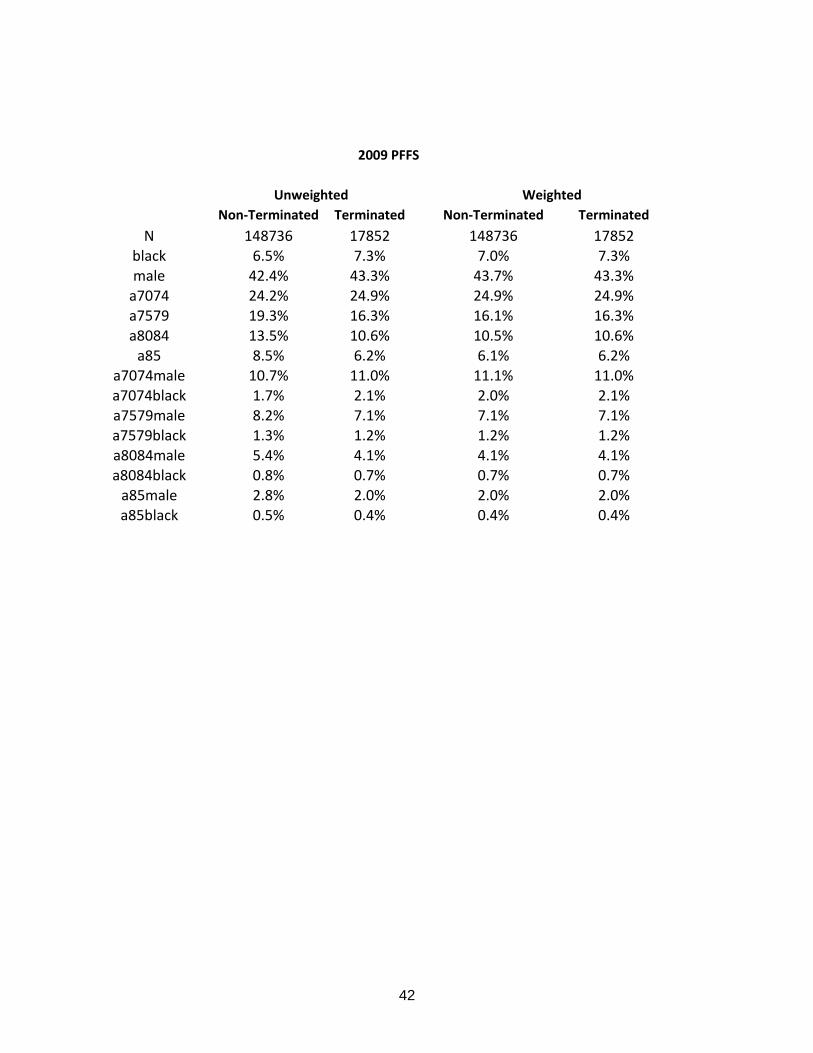


