Embed Size (px)
Citation preview
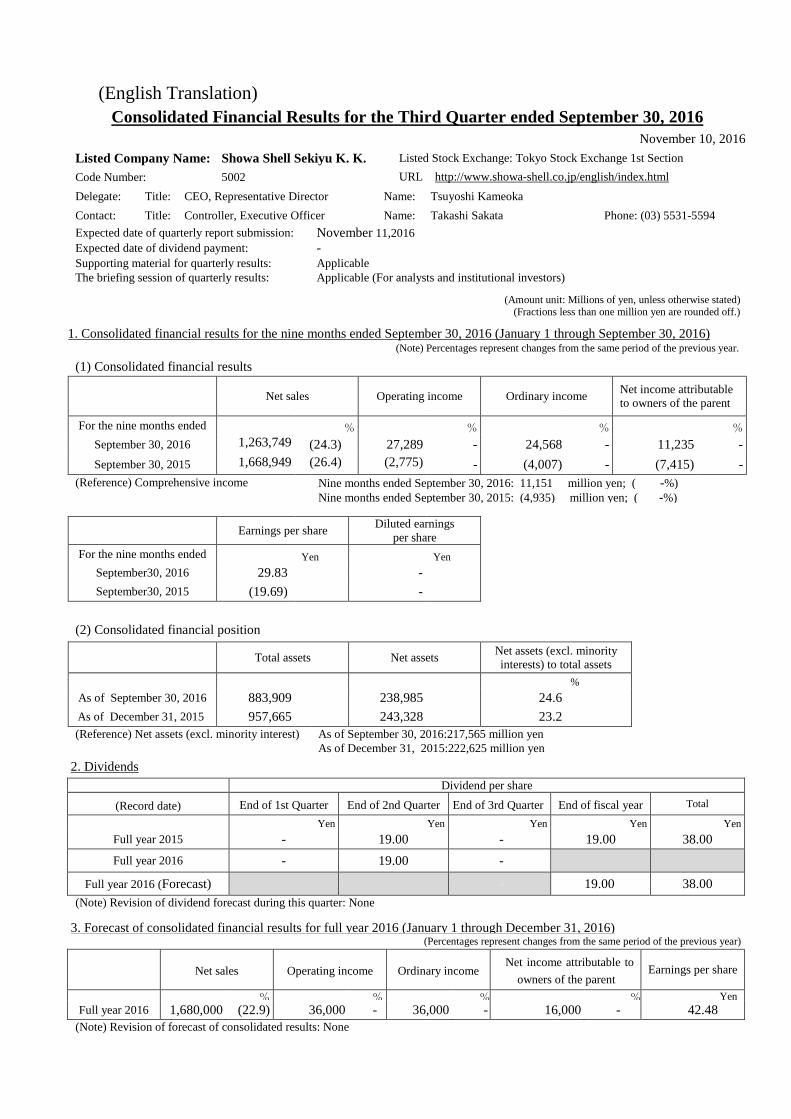
(English Translation) Consolidated Financial Results for the Third Quarter ended September 30, 2016
November 10, 2016 Listed Company Name: Showa Shell Sekiyu K. K. Listed Stock Exchange: Tokyo Stock Exchange 1st Section Code Number: 5002 URL http://www.showa-shell.co.jp/english/index.html Delegate: Title: CEO, Representative Director Name: Tsuyoshi Kameoka Contact: Title: Controller, Executive Officer Name: Takashi Sakata Phone: (03) 5531-5594 Expected date of quarterly report submission: November 11,2016 Expected date of dividend payment: - Supporting material for quarterly results: Applicable The briefing session of quarterly results: Applicable (For analysts and institutional investors)
(Amount unit: Millions of yen, unless otherwise stated) (Fractions less than one million yen are rounded off.)
1. Consolidated financial results for the nine months ended September 30, 2016 (January 1 through September 30, 2016)(Note) Percentages represent changes from the same period of the previous year.
(1) Consolidated financial results
Net sales Operating income Ordinary income Net income attributable to owners of the parent
For the nine months ended % % % %
September 30, 2016 1,263,749
(24.3) 27,289 - 24,568 - 11,235 - September 30, 2015 1,668,949 (26.4)
(2,775)
- (4,007) - (7,415) -
(Reference) Comprehensive income Nine months ended September 30, 2016: 11,151 million yen; ( -%) Nine months ended September 30, 2015: (4,935) million yen; ( -%)
Earnings per share Diluted earnings per share
For the nine months ended Yen Yen September30, 2016 29.83 - September30, 2015 (19.69) -
(2) Consolidated financial position
Total assets Net assets Net assets (excl. minority interests) to total assets
% As of September 30, 2016 883,909 238,985 24.6 As of December 31, 2015 957,665 243,328 23.2 (Reference) Net assets (excl. minority interest) As of September 30, 2016:217,565 million yen
As of December 31, 2015:222,625 million yen 2. Dividends
Dividend per share
(Record date) End of 1st Quarter End of 2nd Quarter End of 3rd Quarter End of fiscal year Total
Yen Yen Yen Yen Yen Full year 2015 - 19.00 - 19.00 38.00 Full year 2016 - 19.00 -
Full year 2016 (Forecast) - 19.00 38.00 (Note) Revision of dividend forecast during this quarter: None
3. Forecast of consolidated financial results for full year 2016 (January 1 through December 31, 2016)(Percentages represent changes from the same period of the previous year)
Net sales Operating income Ordinary income Net income attributable to
owners of the parent Earnings per share
% % % % YenFull year 2016 1,680,000 (22.9) 36,000 - 36,000 - 16,000 - 42.48
(Note) Revision of forecast of consolidated results: None
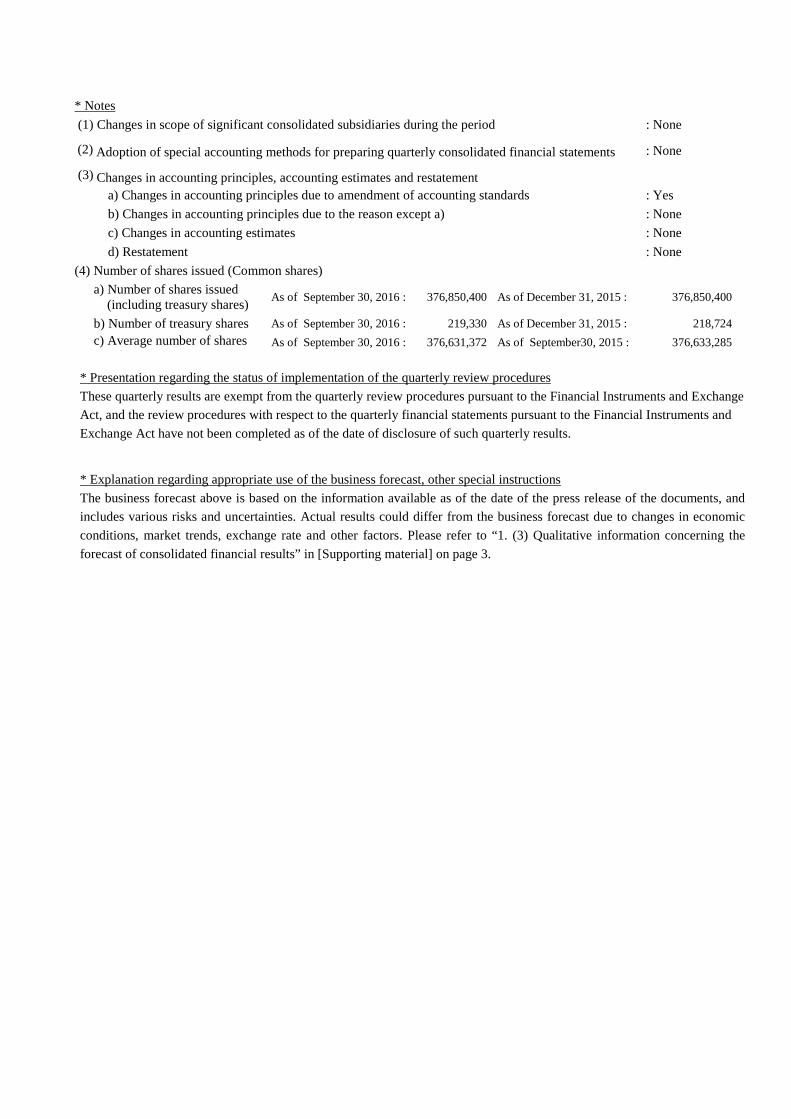
* Notes(1) Changes in scope of significant consolidated subsidiaries during the period : None
(2) Adoption of special accounting methods for preparing quarterly consolidated financial statements : None
(3) Changes in accounting principles, accounting estimates and restatementa) Changes in accounting principles due to amendment of accounting standards : Yes b) Changes in accounting principles due to the reason except a) : None c) Changes in accounting estimates : None d) Restatement : None
(4) Number of shares issued (Common shares)a) Number of shares issued
(including treasury shares) As of September 30, 2016 : 376,850,400 As of December 31, 2015 : 376,850,400
b) Number of treasury shares As of September 30, 2016 : 219,330 As of December 31, 2015 : 218,724
c) Average number of sharesi d
As of September 30, 2016 : 376,631,372 As of September30, 2015 : 376,633,285
* Presentation regarding the status of implementation of the quarterly review proceduresThese quarterly results are exempt from the quarterly review procedures pursuant to the Financial Instruments and Exchange Act, and the review procedures with respect to the quarterly financial statements pursuant to the Financial Instruments and Exchange Act have not been completed as of the date of disclosure of such quarterly results.
* Explanation regarding appropriate use of the business forecast, other special instructionsThe business forecast above is based on the information available as of the date of the press release of the documents, and includes various risks and uncertainties. Actual results could differ from the business forecast due to changes in economic conditions, market trends, exchange rate and other factors. Please refer to “1. (3) Qualitative information concerning the forecast of consolidated financial results” in [Supporting material] on page 3.
[Supporting material]
Contents
1. Qualitative information concerning consolidated financial statements etc. P.2(1) Qualitative information concerning consolidated financial results P.2(2) Qualitative information concerning consolidated financial position P.3(3) Qualitative information concerning the forecast of consolidated financial results P.3
2. Notes P.4(1) Changes in scope of significant consolidated subsidiaries during the period P.4(2) Adoption of special accounting methods for preparing quarterly consolidated financial statements P.4(3) Changes in accounting principles, accounting estimates and restatement P.4(4) Additional information P.4
3. Consolidated financial statements P.6(1) Consolidated balance sheet P.6(2) Consolidated statement of income and Consolidated statement of comprehensive income P.8
Consolidated statement of income (For the nine months ended September 30, 2016) P.8Consolidated statement of comprehensive income (For the nine months ended September 30, 2016) P.9
(3) Note for premises of going concern P.10(4) Note in case of significant changes in shareholders’ equity P.10(5) Segment information P.10
-1-
1. Qualitative information concerning consolidated financial statements etc.
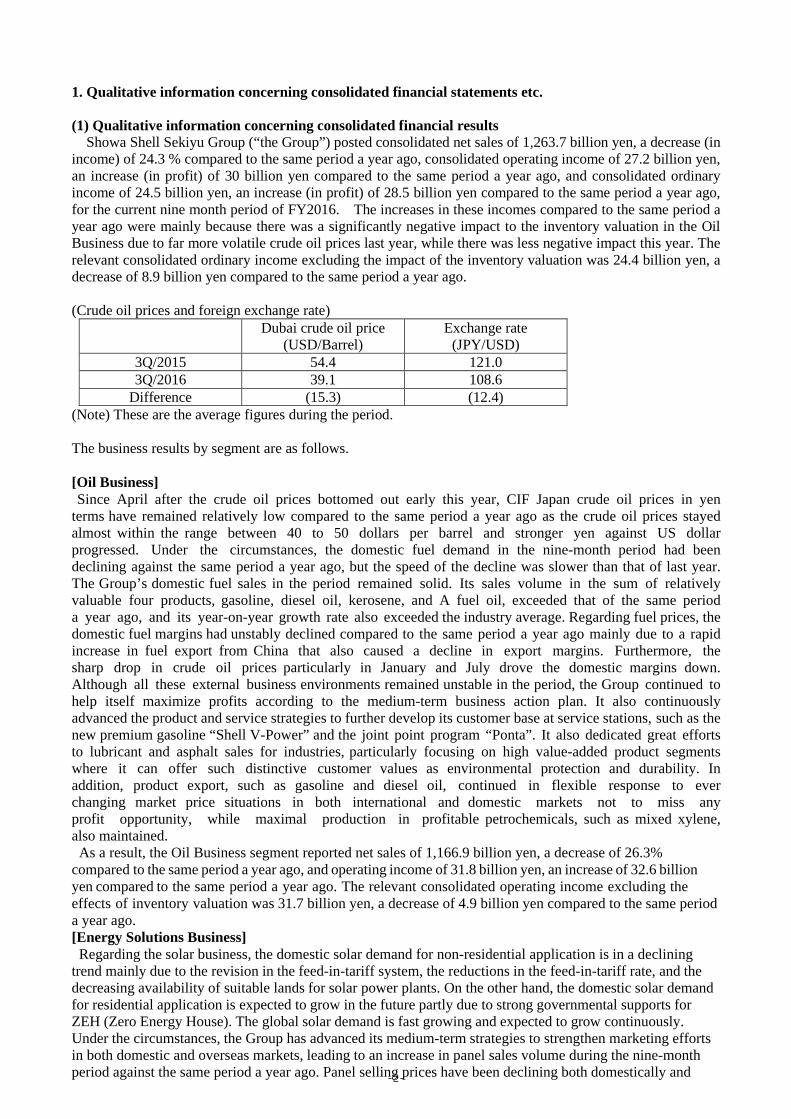
(1) Qualitative information concerning consolidated financial resultsShowa Shell Sekiyu Group (“the Group”) posted consolidated net sales of 1,263.7 billion yen, a decrease (in
income) of 24.3 % compared to the same period a year ago, consolidated operating income of 27.2 billion yen, an increase (in profit) of 30 billion yen compared to the same period a year ago, and consolidated ordinary income of 24.5 billion yen, an increase (in profit) of 28.5 billion yen compared to the same period a year ago, for the current nine month period of FY2016. The increases in these incomes compared to the same period a year ago were mainly because there was a significantly negative impact to the inventory valuation in the Oil Business due to far more volatile crude oil prices last year, while there was less negative impact this year. The relevant consolidated ordinary income excluding the impact of the inventory valuation was 24.4 billion yen, a decrease of 8.9 billion yen compared to the same period a year ago.
(Crude oil prices and foreign exchange rate) Dubai crude oil price
(USD/Barrel) Exchange rate
(JPY/USD) 3Q/2015 54.4 121.0 3Q/2016 39.1 108.6
Difference (15.3) (12.4) (Note) These are the average figures during the period.
The business results by segment are as follows.
[Oil Business] Since April after the crude oil prices bottomed out early this year, CIF Japan crude oil prices in yen terms have remained relatively low compared to the same period a year ago as the crude oil prices stayed almost within the range between 40 to 50 dollars per barrel and stronger yen against US dollar progressed. Under the circumstances, the domestic fuel demand in the nine-month period had been declining against the same period a year ago, but the speed of the decline was slower than that of last year. The Group’s domestic fuel sales in the period remained solid. Its sales volume in the sum of relatively valuable four products, gasoline, diesel oil, kerosene, and A fuel oil, exceeded that of the same period a year ago, and its year-on-year growth rate also exceeded the industry average. Regarding fuel prices, the domestic fuel margins had unstably declined compared to the same period a year ago mainly due to a rapid increase in fuel export from China that also caused a decline in export margins. Furthermore, the sharp drop in crude oil prices particularly in January and July drove the domestic margins down. Although all these external business environments remained unstable in the period, the Group continued to help itself maximize profits according to the medium-term business action plan. It also continuously advanced the product and service strategies to further develop its customer base at service stations, such as the new premium gasoline “Shell V-Power” and the joint point program “Ponta”. It also dedicated great efforts to lubricant and asphalt sales for industries, particularly focusing on high value-added product segments where it can offer such distinctive customer values as environmental protection and durability. In addition, product export, such as gasoline and diesel oil, continued in flexible response to ever changing market price situations in both international and domestic markets not to miss any profit opportunity, while maximal production in profitable petrochemicals, such as mixed xylene, also maintained.
As a result, the Oil Business segment reported net sales of 1,166.9 billion yen, a decrease of 26.3% compared to the same period a year ago, and operating income of 31.8 billion yen, an increase of 32.6 billion yen compared to the same period a year ago. The relevant consolidated operating income excluding the effects of inventory valuation was 31.7 billion yen, a decrease of 4.9 billion yen compared to the same period a year ago. [Energy Solutions Business] Regarding the solar business, the domestic solar demand for non-residential application is in a declining trend mainly due to the revision in the feed-in-tariff system, the reductions in the feed-in-tariff rate, and the decreasing availability of suitable lands for solar power plants. On the other hand, the domestic solar demand for residential application is expected to grow in the future partly due to strong governmental supports for ZEH (Zero Energy House). The global solar demand is fast growing and expected to grow continuously. Under the circumstances, the Group has advanced its medium-term strategies to strengthen marketing efforts in both domestic and overseas markets, leading to an increase in panel sales volume during the nine-month period against the same period a year ago. Panel selling prices have been declining both domestically and -2-
internationally. In particular, stronger yen has weighed on the profitability of the overseas sales. While panel selling prices went down, the Group continued its efforts to expand the residential sales in the domestic market and the BOT business in the overseas market. Regarding panel production, Kunitomi Plant, the flagship manufacturing plant, remained highly operational, while Tohoku Plant applying the newest CIS mass production technology turned into a commercial production in June. The new plant also started product shipments from August but still remained on the way to stable operations. Regarding cost reductions, production costs are coming down in line with the annual plan, including a contribution from stronger yen to reduce materials/parts procurement costs. The Group also extended its efforts to review sales and administration costs, helping itself keep up with the ongoing tough business environment. In the electric power business, the Group’s power plants maintained stably and highly operational almost throughout the nine-month period, including the two newly launched power plants of Keihin Biomass Power Plant (49 thousand kW) and Ohgishima Power Station Unit 3 (400 thousand kW, out of which 100 thousand kW is the Group’s equity). The Group continued its efforts to optimize the sales portfolio in search of better profitability as well as expand sales according to the power generation capacity additions. The sales volume for relatively profitable retail and wholesale segments has grown, and the intensified efforts to capture customers for household electricity supply continued in close tie with the Oil Business since the de-regulation in this market segment took place in April. As a result, the Energy Solutions Business reported net sales of 90.5 billion yen, an increase of 14.9% compared to the same period a year ago, and operating loss of 5.5 billion yen, a decrease of 2.4 billion yen compared to the same period a year ago.
[Other Business] Other Business segment reported net sales of 6.3 billion yen and an operating income of 1.0 billion yen for
the period.
(2) Qualitative information concerning consolidated financial positionTotal assets reached 883.9 billion yen at the end of the third quarter, a decrease of 73.7 billion yen from the
end of the previous year. Consolidated total liabilities were 644.9 billion yen, a decrease of 69.4 billion yen compared to the end of the
previous year. Short- and long-term interest-bearing liabilities (borrowing, CP, and bonds) were 147.7 billion yen, a decrease of 7.7 billion yen from the end of the previous year.
Net assets were 238.9 billion yen, a decrease of 4.3 billion yen from the end of the previous year. This was mainly attributable to the negative factors such as the final dividend payment for the current nine month period exceeded the positive factors such as the net income. As a result, capital adequacy stands at 24.6 % at the end of the third quarter.
(3) Qualitative information concerning the forecast of consolidated financial resultsThere has been no changes in the earnings forecast for the full year 2016, which is published on
10th February, 2016 and in the relevant consolidated ordinary income for the fiscal year 2016, excluding the effect of the inventory valuation, which is published on 10th August, 2016.
The earnings forecasts were prepared based on information available on the announcement date of this document. Actual results may differ from those included in the forecasts due to various factors.
-3-
2. Notes(1) Changes in scope of significant consolidated subsidiaries during the period
None
(2) Adoption of special accounting methods for preparing quarterly consolidated financial statementsNone
(3) Changes in accounting principles, accounting estimates and restatement(Accounting Changes)
Effective from the beginning of the first quarter of FY2016, Showa Shell Sekiyu Group (“the Group”) adoptedthe “Revised Accounting Standard for Business Combinations”(Accounting Standard Board of Japan (ASBJ) Statement No.21, issued on September13, 2013, hereinafter referred to as the “Accounting Standard for Business Combinations”), “Revised Accounting Standard for Consolidated Financial Statements”(ASBJ Statement No.22, issued on September 13, 2013, hereinafter referred to as the “Accounting Standard for Business Consolidation”) and “Revised Accounting Standard for Business Divestitures” (ASBJ Statement No.7, issued on September 13, 2013, hereinafter referred to as the “Accounting Standard for Business Divestitures”). In applying these revised accounting standards, the Company records any differences arising from changes in ownership interest in a subsidiary when it retains control as capital surplus and the corresponding acquisition-related costs are recognized as expenses when incurred. Also, regarding business combinations conducted after the beginning of the first quarter of FY2016, the disclosure method was revised with regard to the retrospective adjustment of purchase price allocation based on provisional accounting applicable to the quarterly consolidated financial statements of the fiscal period in which the business combination occurred. In addition, the presentation method of net income was amended and the reference to “minority interests” was changed to “non-controlling interests”. To reflect these changes in the presentation, the quarterly consolidated financial statements and consolidated financial statements in the previous fiscal year have been reclassified.
Concerning the application of the Accounting Standards for Business Combinations and others, based on the provisional treatment set out in Section 58-2(4) of the Accounting Standard for Business Combinations, in Section 44-5(4) of the Accounting Standard for Consolidation and in Section 57-4(4) of the Accounting Standard for Business Divestitures, these changes are effective from the beginning of the first quarter of FY 2016. This change has no impact on the quarterly consolidated financial statements.
(4) Additional informationBusiness Integration with Idemitsu Kosan Co., Ltd
The Company and Idemitsu Kosan Co., Ltd. (collectively, the “Companies”) entered into a Memorandum of Understanding (hereinafter the “MoU”) for the Business Integration based on a spirit of equal partnership (hereinafter the “Business Integration”), which shall not be legally binding, as of November 12, 2015. The Companies will discuss and formally enter into a legally binding definitive agreement (hereinafter the “Definitive Agreement”) through necessary procedures including a resolution by the Board of Directors.
(1) Objectives of the Business IntegrationThe Companies agreed, in the MoU, to create an industry-leading player unparalleled competitive positionby combining the strengths and the management resources of both companies. The new company (the“NewCo”) will lead the effort of solving the industry’s various structural issues with the aim at improvingthe lives of Japanese citizens through efficient and stable energy supply.
(2) Method of the Business IntegrationThe Companies have set a merger as the base structure of the Business Integration, subject to furtherdiscussions and an official agreement.
(3) Schedules of the Business IntegrationThe schedule of the Business Integration will be discussed further with the following target timeline:commencement of due diligence of the Companies and their subsidiaries upon signing of the MoU, followedby the signing of the Definitive Agreement incorporating the definitive details and terms, approval at theshareholders’ meetings of both parties, and the launch of the NewCo on April 1, 2017.
-4-
At this point, the date of the launch of the NewCo is undecided because the effective date of the Business Integration will be on April 1, 2017 after the shareholders’ meetings of both parties, in order for both parties to secure sufficient time for consultations with each stake holder. Another reason is because, at this point, it is judged that it is not appropriate to state the date of the Business Integration after changes.
(4) Name of the NewCo The name of the NewCo is currently undetermined and is scheduled to be decided upon further discussion between the Companies.
(5) Location of the head office of the NewCo
The Companies have yet to decide the location of the head office of the new company but are planning to find a location different from the current offices of the Companies by the effective date of or as soon as possible after the Business Integration.
(6) Structure of the Board of Directors
While the structure of the Board of Directors will be decided upon further discussions between the Companies, representative directors and executive directors will consist of an equal number of representatives from each company.
(Revision of the amount of deferred tax assets and deferred tax liabilities due to changes in corporation tax rate)
According to the enactment of the “Act on Partial Revision of the Income Tax Act” and the “Act on Partial Revision of the Local Tax Act” on March 31, 2016, the effective tax rate which the Company used for calculation of deferred tax assets and deferred tax liabilities for the third quarter has been changed from 33.1% and 32.3% for the previous fiscal year to 30.9% for those which are expected to be recovered or paid from January 1, 2017 to December 31, 2018 and to 30.6% for those which are expected to be recovered or paid from January 1, 2019, respectively.
As a result, deferred tax assets after deducting deferred tax liabilities decreased by 1,371 million yen and income tax-deferred increased by 1,242 million yen.
-5-
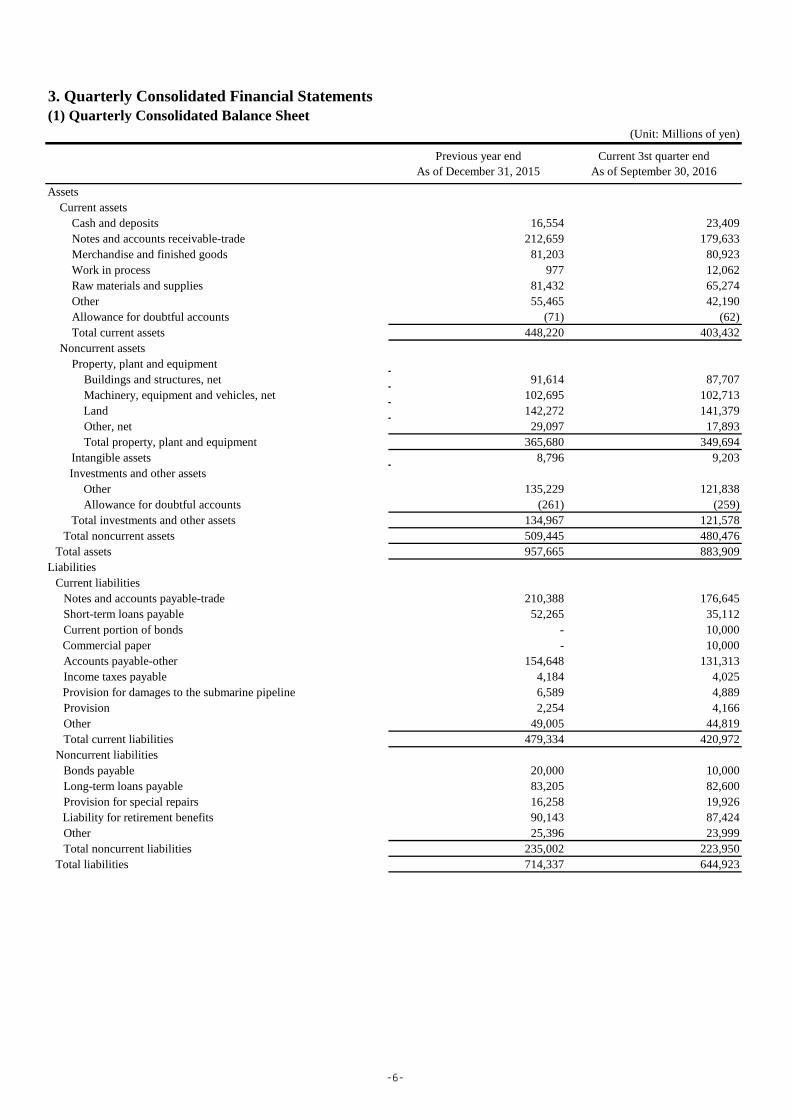
(1) Quarterly Consolidated Balance Sheet(Unit: Millions of yen)
Previous year endAs of December 31, 2015
Current 3st quarter endAs of September 30, 2016
Assets Current assets Cash and deposits 16,554 23,409 Notes and accounts receivable-trade 212,659 179,633 Merchandise and finished goods 81,203 80,923 Work in process 977 12,062 Raw materials and supplies 81,432 65,274 Other 55,465 42,190 Allowance for doubtful accounts (71) (62) Total current assets 448,220 403,432 Noncurrent assets Property, plant and equipment Buildings and structures, net 91,614 87,707 Machinery, equipment and vehicles, net 102,695 102,713 Land 142,272 141,379 Other, net 29,097 17,893 Total property, plant and equipment 365,680 349,694 Intangible assets 8,796 9,203 Investments and other assets Other 135,229 121,838 Allowance for doubtful accounts (261) (259) Total investments and other assets 134,967 121,578 Total noncurrent assets 509,445 480,476 Total assets 957,665 883,909Liabilities Current liabilities Notes and accounts payable-trade 210,388 176,645 Short-term loans payable 52,265 35,112 Current portion of bonds - 10,000 Commercial paper - 10,000 Accounts payable-other 154,648 131,313 Income taxes payable 4,184 4,025 Provision for damages to the submarine pipeline 6,589 4,889 Provision 2,254 4,166 Other 49,005 44,819 Total current liabilities 479,334 420,972 Noncurrent liabilities Bonds payable 20,000 10,000 Long-term loans payable 83,205 82,600 Provision for special repairs 16,258 19,926 Liability for retirement benefits 90,143 87,424 Other 25,396 23,999 Total noncurrent liabilities 235,002 223,950 Total liabilities 714,337 644,923
3. Quarterly Consolidated Financial Statements
-6-
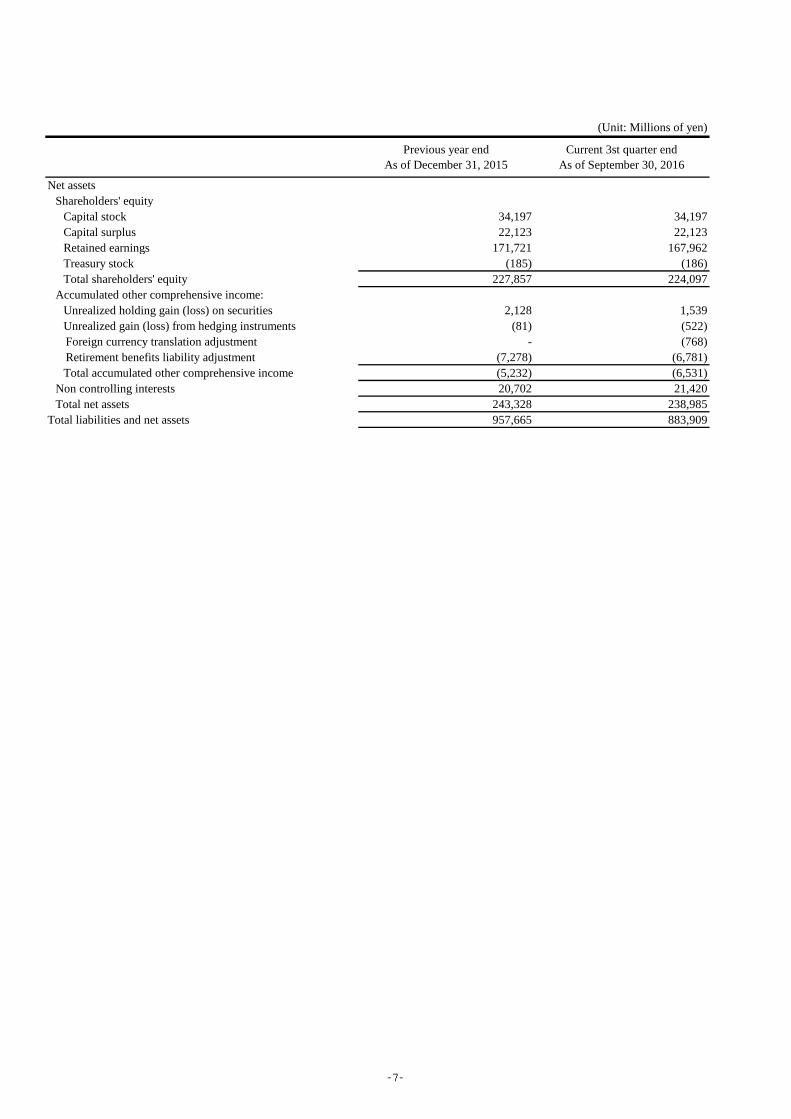
(Unit: Millions of yen)
Previous year endAs of December 31, 2015
Current 3st quarter endAs of September 30, 2016
Net assets Shareholders' equity Capital stock 34,197 34,197 Capital surplus 22,123 22,123 Retained earnings 171,721 167,962 Treasury stock (185) (186) Total shareholders' equity 227,857 224,097 Accumulated other comprehensive income: Unrealized holding gain (loss) on securities 2,128 1,539 Unrealized gain (loss) from hedging instruments (81) (522) Foreign currency translation adjustment - (768) Retirement benefits liability adjustment (7,278) (6,781) Total accumulated other comprehensive income (5,232) (6,531) Non controlling interests 20,702 21,420 Total net assets 243,328 238,985Total liabilities and net assets 957,665 883,909
-7-
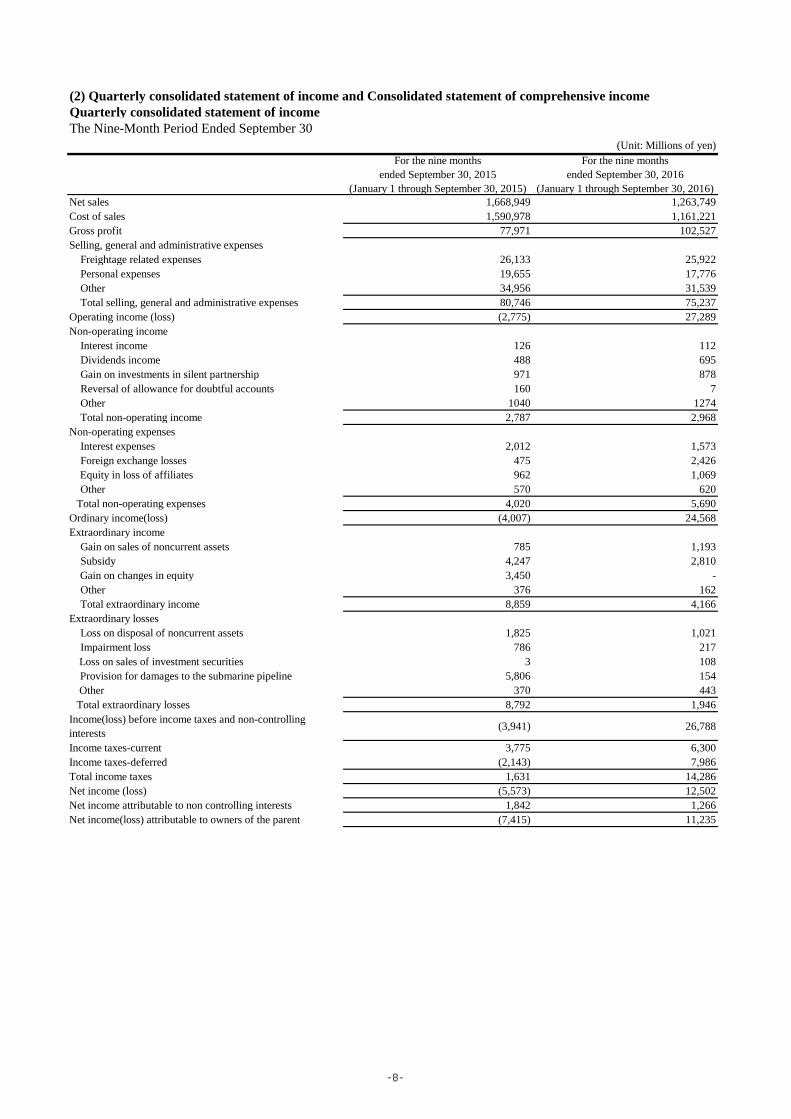
(2) Quarterly consolidated statement of income and Consolidated statement of comprehensive incomeQuarterly consolidated statement of incomeThe Nine-Month Period Ended September 30
(Unit: Millions of yen)For the nine months
ended September 30, 2015(January 1 through September 30, 2015)
For the nine monthsended September 30, 2016
(January 1 through September 30, 2016)Net sales 1,668,949 1,263,749Cost of sales 1,590,978 1,161,221Gross profit 77,971 102,527Selling, general and administrative expenses Freightage related expenses 26,133 25,922 Personal expenses 19,655 17,776 Other 34,956 31,539 Total selling, general and administrative expenses 80,746 75,237Operating income (loss) (2,775) 27,289Non-operating income Interest income 126 112 Dividends income 488 695 Gain on investments in silent partnership 971 878 Reversal of allowance for doubtful accounts 160 7 Other 1040 1274 Total non-operating income 2,787 2,968Non-operating expenses Interest expenses 2,012 1,573 Foreign exchange losses 475 2,426 Equity in loss of affiliates 962 1,069 Other 570 620 Total non-operating expenses 4,020 5,690Ordinary income(loss) (4,007) 24,568Extraordinary income Gain on sales of noncurrent assets 785 1,193 Subsidy 4,247 2,810 Gain on changes in equity 3,450 - Other 376 162 Total extraordinary income 8,859 4,166Extraordinary losses Loss on disposal of noncurrent assets 1,825 1,021 Impairment loss 786 217 Loss on sales of investment securities 3 108 Provision for damages to the submarine pipeline 5,806 154 Other 370 443 Total extraordinary losses 8,792 1,946Income(loss) before income taxes and non-controllinginterests (3,941) 26,788
Income taxes-current 3,775 6,300Income taxes-deferred (2,143) 7,986Total income taxes 1,631 14,286Net income (loss) (5,573) 12,502Net income attributable to non controlling interests 1,842 1,266Net income(loss) attributable to owners of the parent (7,415) 11,235
-8-
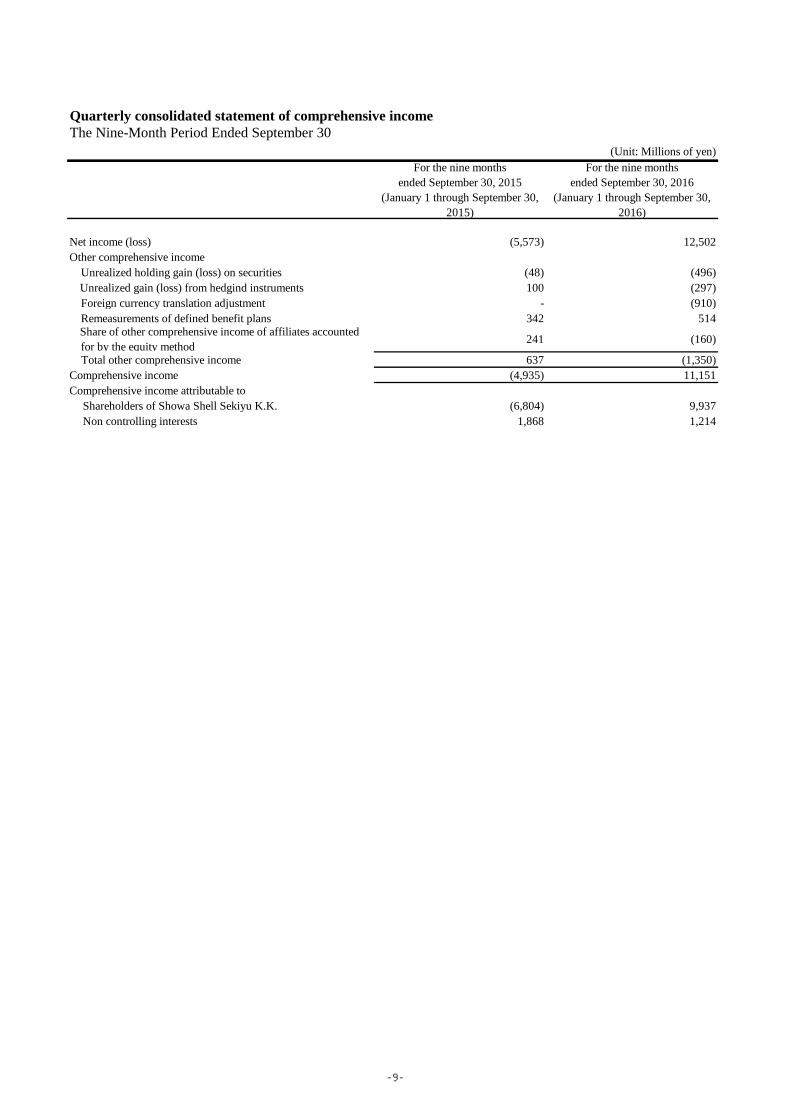
Quarterly consolidated statement of comprehensive income
(Unit: Millions of yen)For the nine months
ended September 30, 2015(January 1 through September 30,
2015)
For the nine monthsended September 30, 2016
(January 1 through September 30,2016)
Net income (loss) (5,573) 12,502Other comprehensive income Unrealized holding gain (loss) on securities (48) (496) Unrealized gain (loss) from hedgind instruments 100 (297) Foreign currency translation adjustment - (910) Remeasurements of defined benefit plans 342 514 Share of other comprehensive income of affiliates accounted for by the equity method 241 (160)
Total other comprehensive income 637 (1,350)Comprehensive income (4,935) 11,151Comprehensive income attributable to Shareholders of Showa Shell Sekiyu K.K. (6,804) 9,937 Non controlling interests 1,868 1,214
The Nine-Month Period Ended September 30
-9-
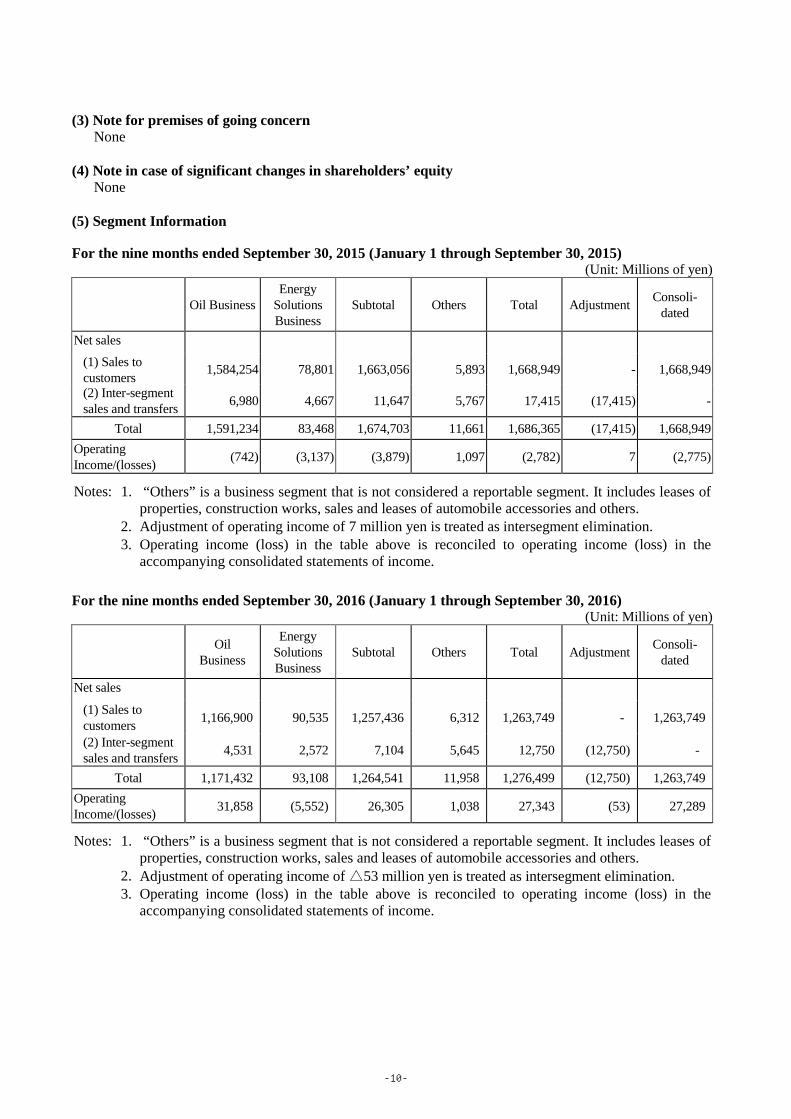
(3) Note for premises of going concern None (4) Note in case of significant changes in shareholders’ equity None (5) Segment Information For the nine months ended September 30, 2015 (January 1 through September 30, 2015)
(Unit: Millions of yen)
Oil Business Energy
Solutions Business
Subtotal Others Total Adjustment Consoli-dated
Net sales (1) Sales to
customers 1,584,254 78,801 1,663,056 5,893 1,668,949 - 1,668,949
(2) Inter-segment sales and transfers 6,980 4,667 11,647 5,767 17,415 (17,415) -
Total 1,591,234 83,468 1,674,703 11,661 1,686,365 (17,415) 1,668,949 Operating Income/(losses) (742) (3,137) (3,879) 1,097 (2,782) 7 (2,775)
Notes: 1. “Others” is a business segment that is not considered a reportable segment. It includes leases of properties, construction works, sales and leases of automobile accessories and others.
2. Adjustment of operating income of 7 million yen is treated as intersegment elimination.
3. Operating income (loss) in the table above is reconciled to operating income (loss) in the
accompanying consolidated statements of income. For the nine months ended September 30, 2016 (January 1 through September 30, 2016)
(Unit: Millions of yen)
Oil Business
Energy Solutions Business
Subtotal Others Total Adjustment Consoli-dated
Net sales (1) Sales to
customers 1,166,900 90,535 1,257,436 6,312 1,263,749 - 1,263,749
(2) Inter-segment sales and transfers 4,531 2,572 7,104 5,645 12,750 (12,750) -
Total 1,171,432 93,108 1,264,541 11,958 1,276,499 (12,750) 1,263,749 Operating Income/(losses) 31,858 (5,552) 26,305 1,038 27,343 (53) 27,289
Notes: 1. “Others” is a business segment that is not considered a reportable segment. It includes leases of properties, construction works, sales and leases of automobile accessories and others.
2. Adjustment of operating income of △53 million yen is treated as intersegment elimination.
3. Operating income (loss) in the table above is reconciled to operating income (loss) in the
accompanying consolidated statements of income.
-10-