Embed Size (px)
Citation preview
Ending Africa’s Poverty Trap
Africa’s development crisis is unique. Not only is Africa the poorestregion in the world, but it was also the only major developing region withnegative growth in income per capita during 1980–2000 (table 1). SomeAfrican countries grew during the 1990s, but for the most part this growthrecovered ground lost during the 1980s. Moreover, Africa’s health condi-tions are by far the worst on the planet. The AIDS pandemic is wreakinghavoc, as is the resurgence of malaria due to rising drug resistance andthe lack of effective public health systems. Africa’s population continuesto soar, adding ecological stresses to the economic strains. Policy-baseddevelopment lending to Africa over the past twenty years, known as struc-tural adjustment lending, did not solve the problem. A heavy debt burdenis evidenced by the 155 Paris Club restructurings of African countries’debt between 1980 and 2001, much more than for any other region. Ingeneral, Africa remains mired in poverty and debt.
This paper focuses on the tropical sub-Saharan African countries withpopulations of at least 2 million people in 2001. We leave out North Africa(Algeria, Egypt, Libya, Morocco, and Tunisia,), southernmost Africa(Botswana, Lesotho, Namibia, South Africa, and Swaziland), and a num-ber of very small economies (Cape Verde, Comoros, Djibouti, EquatorialGuinea, Gabon, The Gambia, Guinea-Bissau, Mauritius, São Tomé andPrincipe, and Seychelles). Both nontropical ends of Africa are much richer
117
J E F F R E Y D . S A C H SColumbia University and UN Millennium Project
J O H N W . M C A R T H U R , G U I D O S C H M I D T - T R A U B ,M A R G A R E T K R U K , C H A N D R I K A B A H A D U R ,M I C H A E L F A Y E , A N D G O R D O N M C C O R DUN Millennium Project
We would like to thank our colleagues in the UN Millennium Project, an advisoryproject to UN Secretary-General Kofi Annan, and especially the Task Force coordinatorsand members, for ample advice and consultations. We especially thank Vijay Modi forhis detailed assistance on issues regarding energy and transport infrastructure.
2259-02-Sachs.qxd 8/6/04 11:21 Page 117
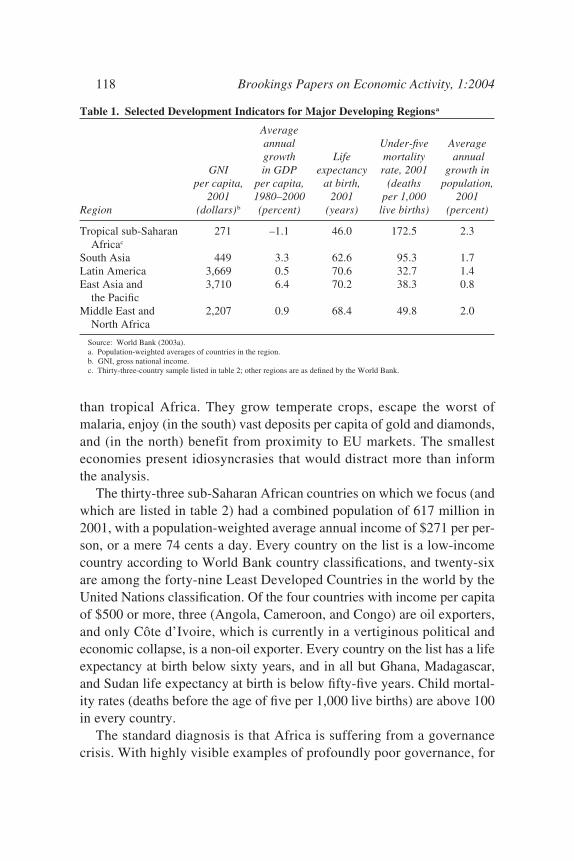
than tropical Africa. They grow temperate crops, escape the worst ofmalaria, enjoy (in the south) vast deposits per capita of gold and diamonds,and (in the north) benefit from proximity to EU markets. The smallesteconomies present idiosyncrasies that would distract more than informthe analysis.
The thirty-three sub-Saharan African countries on which we focus (andwhich are listed in table 2) had a combined population of 617 million in2001, with a population-weighted average annual income of $271 per per-son, or a mere 74 cents a day. Every country on the list is a low-incomecountry according to World Bank country classifications, and twenty-sixare among the forty-nine Least Developed Countries in the world by theUnited Nations classification. Of the four countries with income per capitaof $500 or more, three (Angola, Cameroon, and Congo) are oil exporters,and only Côte d’Ivoire, which is currently in a vertiginous political andeconomic collapse, is a non-oil exporter. Every country on the list has a lifeexpectancy at birth below sixty years, and in all but Ghana, Madagascar,and Sudan life expectancy at birth is below fifty-five years. Child mortal-ity rates (deaths before the age of five per 1,000 live births) are above 100in every country.
The standard diagnosis is that Africa is suffering from a governancecrisis. With highly visible examples of profoundly poor governance, for
118 Brookings Papers on Economic Activity, 1:2004
Table 1. Selected Development Indicators for Major Developing Regionsa
Averageannual Under-five Averagegrowth Life mortality annual
GNI in GDP expectancy rate, 2001 growth inper capita, per capita, at birth, (deaths population,
2001 1980–2000 2001 per 1,000 2001Region (dollars)b (percent) (years) live births) (percent)
Tropical sub-Saharan 271 –1.1 46.0 172.5 2.3Africac
South Asia 449 3.3 62.6 95.3 1.7Latin America 3,669 0.5 70.6 32.7 1.4East Asia and 3,710 6.4 70.2 38.3 0.8
the PacificMiddle East and 2,207 0.9 68.4 49.8 2.0
North Africa
Source: World Bank (2003a). a. Population-weighted averages of countries in the region.b. GNI, gross national income.c. Thirty-three-country sample listed in table 2; other regions are as defined by the World Bank.
2259-02-Sachs.qxd 8/6/04 11:21 Page 118
Sachs, McArthur, Schmidt-Traub, Kruk, Bahadur, Faye, and McCord 119
Table 2. Governance Ratings and Household Consumption in Tropical Sub-Saharan Africa
Rating Household based on Rating final
World Bank based on consumption governance Transparency Freedom expenditure indicators, International House per capita, 2000
Country 2002a index, 2003a rating, 2003 (1980 = 100)
Benin Good n.a. Free 98.9Burkina Faso Good n.a. Partly free 111.0Ghana Good Average Free 92.8Madagascar Good Good Partly free 64.0Malawi Good Good Partly free 111.2Mali Good Good Free 95.3Mauritania Good Good Partly free 104.8Senegal Good Good Free 99.6Cameroon Average Average Not free 102.5Central African Rep. Average n.a. Partly free n.a.Chad Average n.a. Not free n.a.Congo, Rep. of Average Average n.a. 80.5Côte d’Ivoire Average Average Not free 78.2Eritrea Average n.a. Not free n.a.Ethiopia Average Good Partly free n.a.Guinea Average n.a. Not free n.a.Kenya Average Average Partly free 100.7Mozambique Average Good Partly free 79.4Niger Average n.a. Partly free n.a.Nigeria Average Average Partly free n.a.Rwanda Average n.a. Not free 83.9Sierra Leone Average Good Partly free 43.9Tanzania Average Good Partly free n.a.Togo Average n.a. Not free 112.4Uganda Average Average Partly free n.a.Zambia Average Good Partly free 47.0Angola Poor Poor Not free n.a.Burundi Poor n.a. Not free 65.0Congo, Dem. Rep. of Poor n.a. Not free 45.1Sudan Poor Average Not free n.a.Zimbabwe Poor Average Not free 88.4Liberia n.a. n.a. Not free n.a.Somalia n.a. n.a. Not free n.a.
Sources: Kaufmann, Kraay, and Mastruzzi (2003); Radelet (2004); authors’ calculations using data in Transparency Inter-national (2004); Freedom House (2003); World Bank (2003a).
n.a., not available. a. Determined from the residuals of a regression of countries’ governance indicators or scores on income per capita (at pur-
chasing power parity); countries with residuals more than 1 standard deviation above or 1 standard deviation below the predictedvalue are categorized as “good” or “poor,” respectively, and those with residuals within 1 standard deviation as “average.” For thefirst column, the World Bank governance indicators are those calculated by Kaufmann, Kraay, and Mastruzzi (2003). For the sec-ond column, Transparency International’s Corruption Perceptions Index is used, which relates to the degree of corruption in thecountry as perceived by business people, academics, and risk analysts and ranges between 10 (highly clean) and 0 (highly corrupt).
2259-02-Sachs.qxd 8/6/04 11:21 Page 119
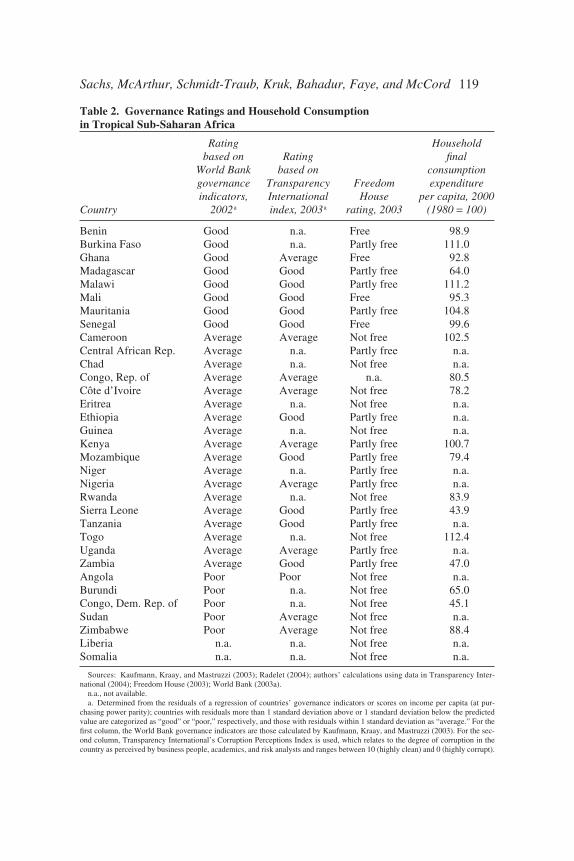
example in Zimbabwe, and widespread war and violence, as in Angola,the Democratic Republic of the Congo, Liberia, Sierra Leone, and Sudan,the impression of a continent-wide governance crisis is understandable.Yet it is wrong. Many parts of Africa are well governed even though stuckin poverty. Governance is a problem, but Africa’s development chal-lenges run much deeper.
Using our thirty-three-country sample, table 2 reports some commongovernance indicators that make this point. The first column presents aranking of African governance compiled by Steven Radelet,1 who regressesa set of widely used World Bank governance indicators due to DanielKaufmann, Aart Kraay, and Massimo Mastruzzi on GDP per capita,2 andranks countries according to the residuals from that regression, therebystandardizing the measurement of governance by level of income. Thisprocedure recognizes that poorer countries have systematically poorergovernance measures than richer countries, since good governance itselfrequires real resources. Well-governed African countries are defined asthose with residuals at least 1 standard error above, and poorly governedcountries as those with residuals at least 1 standard error below, theregression line. “Average” countries are those with residuals within1 standard error on either side of the regression line. The table showsthat, by this ranking, many countries are well governed. Nor is thereevidence that Africa’s governance, on average, is worse than elsewhereonce we control for income levels: a regression (not reported in thispaper) of several different governance indicators on the logarithm of GDPper capita (measured at purchasing power parity) and a dummy for trop-ical sub-Saharan Africa results in a statistically insignificant coefficientfor the dummy variable.
The second column of table 2 repeats the same procedure using the Cor-ruption Perceptions Index of Transparency International.3 All but one ofthe African countries in our sample for which scores are available receivescores of “good” (that is, low corruption) or “average” after we control forincome. The third column reminds us as well that many African countrieshave become democracies in recent years, and thus are scored as “free” or“partly free” by the well-known Freedom House ranking.4 The final col-
120 Brookings Papers on Economic Activity, 1:2004
1. Radelet (2004).2. Kaufmann, Kraay, and Mastruzzi (2003).3. Transparency International (2004).4. Freedom House (2003).
2259-02-Sachs.qxd 8/6/04 11:21 Page 120
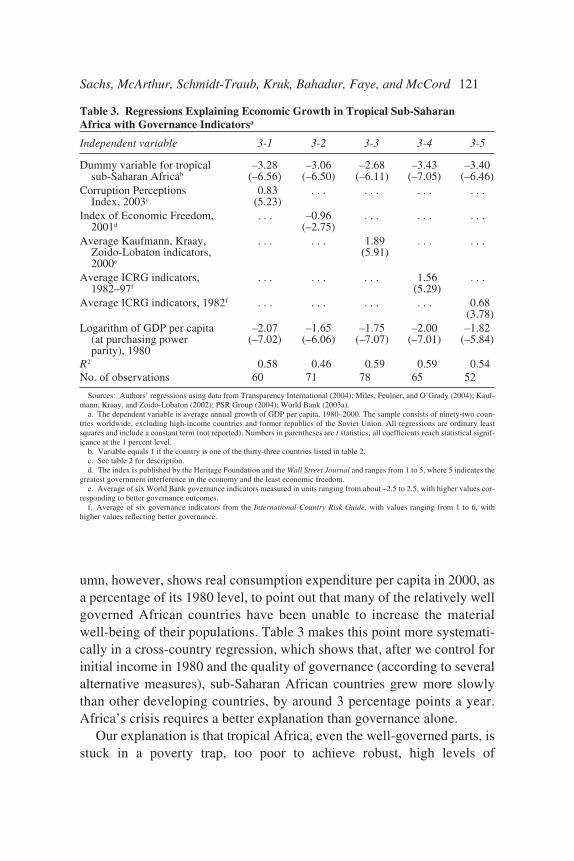
umn, however, shows real consumption expenditure per capita in 2000, asa percentage of its 1980 level, to point out that many of the relatively wellgoverned African countries have been unable to increase the materialwell-being of their populations. Table 3 makes this point more systemati-cally in a cross-country regression, which shows that, after we control forinitial income in 1980 and the quality of governance (according to severalalternative measures), sub-Saharan African countries grew more slowlythan other developing countries, by around 3 percentage points a year.Africa’s crisis requires a better explanation than governance alone.
Our explanation is that tropical Africa, even the well-governed parts, isstuck in a poverty trap, too poor to achieve robust, high levels of
Sachs, McArthur, Schmidt-Traub, Kruk, Bahadur, Faye, and McCord 121
Table 3. Regressions Explaining Economic Growth in Tropical Sub-Saharan Africa with Governance Indicatorsa
Independent variable 3-1 3-2 3-3 3-4 3-5
Dummy variable for tropical –3.28 –3.06 –2.68 –3.43 –3.40sub-Saharan Africab (–6.56) (–6.50) (–6.11) (–7.05) (–6.46)
Corruption Perceptions 0.83 . . . . . . . . . . . .Index, 2003c (5.23)
Index of Economic Freedom, . . . –0.96 . . . . . . . . .2001d (–2.75)
Average Kaufmann, Kraay, . . . . . . 1.89 . . . . . .Zoido-Lobaton indicators, (5.91)2000e
Average ICRG indicators, . . . . . . . . . 1.56 . . .1982–97f (5.29)
Average ICRG indicators, 1982f . . . . . . . . . . . . 0.68(3.78)
Logarithm of GDP per capita –2.07 –1.65 –1.75 –2.00 –1.82(at purchasing power (–7.02) (–6.06) (–7.07) (–7.01) (–5.84)parity), 1980
R2 0.58 0.46 0.59 0.59 0.54No. of observations 60 71 78 65 52
Sources: Authors’ regressions using data from Transparency International (2004); Miles, Feulner, and O’Grady (2004); Kauf-mann, Kraay, and Zoido-Lobaton (2002); PSR Group (2004); World Bank (2003a).
a. The dependent variable is average annual growth of GDP per capita, 1980–2000. The sample consists of ninety-two coun-tries worldwide, excluding high-income countries and former republics of the Soviet Union. All regressions are ordinary leastsquares and include a constant term (not reported). Numbers in parentheses are t statistics; all coefficients reach statistical signif-icance at the 1 percent level.
b. Variable equals 1 if the country is one of the thirty-three countries listed in table 2.c. See table 2 for description.d. The index is published by the Heritage Foundation and the Wall Street Journal and ranges from 1 to 5, where 5 indicates the
greatest government interference in the economy and the least economic freedom.e. Average of six World Bank governance indicators measured in units ranging from about –2.5 to 2.5, with higher values cor-
responding to better governance outcomes.f. Average of six governance indicators from the International Country Risk Guide, with values ranging from 1 to 6, with
higher values reflecting better governance.
2259-02-Sachs.qxd 8/6/04 11:21 Page 121
economic growth and, in many places, simply too poor to grow at all.5
More policy or governance reform, by itself, will not be sufficient to over-come this trap. Specifically, Africa’s extreme poverty leads to lownational saving rates, which in turn lead to low or negative economicgrowth rates. Low domestic saving is not offset by large inflows of privateforeign capital, for example foreign direct investment, because Africa’spoor infrastructure and weak human capital discourage such inflows.With very low domestic saving and low rates of market-based foreigncapital inflows, there is little in Africa’s current dynamics that promotesan escape from poverty. Something new is needed.
We argue that what is needed is a “big push” in public investments toproduce a rapid “step” increase in Africa’s underlying productivity, bothrural and urban. The intervention of foreign donors will be critical toachieving this step increase. In particular, we argue that well-governedAfrican countries should be offered a substantial increase in official de-velopment assistance (ODA) to enable them to achieve the MillenniumDevelopment Goals (MDGs), the internationally agreed targets for povertyreduction, by 2015.6 The goals are useful intermediate targets for break-ing Africa’s poverty trap, because they address the key sectors in whichmajor productivity improvements are both needed and achievable, andbecause the rich countries have repeatedly committed themselves to help-
122 Brookings Papers on Economic Activity, 1:2004
5. The concept of a low-level poverty trap is, of course, a long-standing hypothesis inthe theories of economic growth and development. The earliest mathematical formalizationwas by Nelson (1956). The theoretical possibility of poverty traps in the neoclassicalgrowth model is covered briefly in the economic growth textbook by Barro and Sala-i-Martin (1998), which also discusses briefly the possible case for large-scale developmentassistance to overcome such traps. The connection of a low-level trap to subsistence con-sumption needs is spelled out in Ben-David (1998), and connections to agriculture and edu-cation are described in the World Economic and Social Survey 2000. Two recent empiricalstudies claiming that such poverty traps exist in very poor countries are UNCTAD (2002)and Bloom, Canning, and Sevilla (2003).
6. Adopted by the world’s leaders in September 2000, the UN Millennium Declarationcommitted their nations to stronger global efforts to reduce poverty, improve health, andpromote peace, human rights, and environmental sustainability. The MDGs that emergedfrom the declaration are specific, measurable targets, summarized by the following eightgoals: eradicate extreme poverty and hunger; achieve universal primary education; pro-mote gender equality and empower women; reduce child mortality; improve maternalhealth; combat HIV/AIDS, malaria, and other diseases; ensure environmental sustainabil-ity; and develop a global partnership for development. More information is available atwww. unmillenniumproject.org and www.un.org/millenniumgoals.
2259-02-Sachs.qxd 8/6/04 11:21 Page 122
ing Africa achieve these goals, with more funding if necessary.7 However,the rich countries have not yet delivered on that promise.
We begin by outlining our theory of Africa’s poverty trap. This is fol-lowed by a discussion of the structural conditions and history that haveled the continent into such a trap. Following that, we identify how a bigpush in key investments could enable Africa to meet the MDGs, and howthat, in turn, would help to extricate Africa from its current developmenttrap. We then estimate the financial costs required to meet the MDGs, andwe suggest how those costs could be allocated between domestic resourcesin Africa (both public and private) and increased ODA. Finally, we pro-pose a new framework for donor-African relations to underpin a big pushdesigned to meet the MDGs.
The Theory of Africa’s Poverty Trap
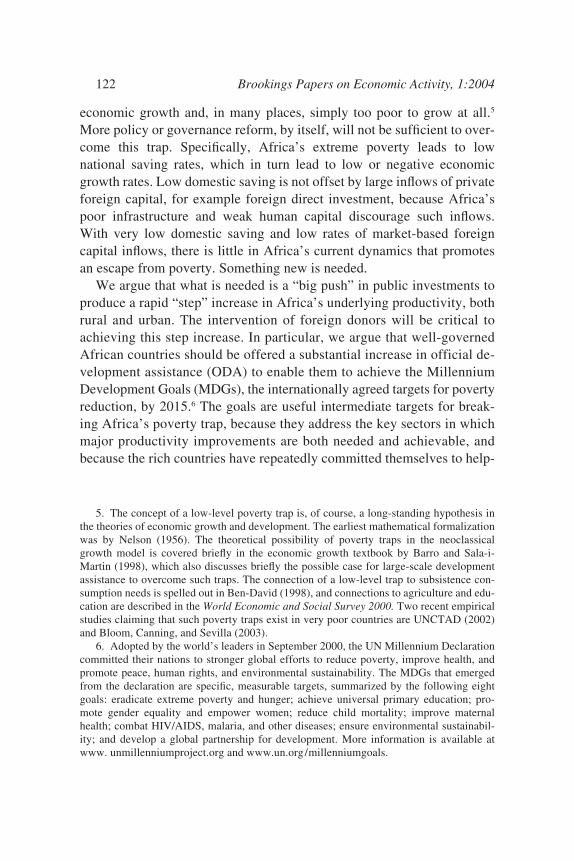
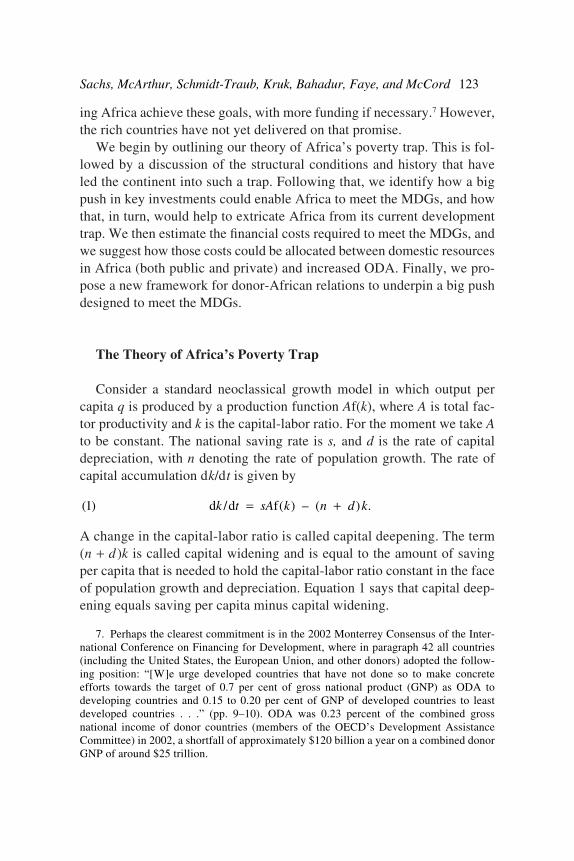
Consider a standard neoclassical growth model in which output percapita q is produced by a production function Af(k), where A is total fac-tor productivity and k is the capital-labor ratio. For the moment we take Ato be constant. The national saving rate is s, and d is the rate of capitaldepreciation, with n denoting the rate of population growth. The rate ofcapital accumulation dk/dt is given by
A change in the capital-labor ratio is called capital deepening. The term(n + d )k is called capital widening and is equal to the amount of savingper capita that is needed to hold the capital-labor ratio constant in the faceof population growth and depreciation. Equation 1 says that capital deep-ening equals saving per capita minus capital widening.
( ) / ( ) – ( ) .1 d d fk t sA k n d k= +
Sachs, McArthur, Schmidt-Traub, Kruk, Bahadur, Faye, and McCord 123
7. Perhaps the clearest commitment is in the 2002 Monterrey Consensus of the Inter-national Conference on Financing for Development, where in paragraph 42 all countries(including the United States, the European Union, and other donors) adopted the follow-ing position: “[W]e urge developed countries that have not done so to make concreteefforts towards the target of 0.7 per cent of gross national product (GNP) as ODA todeveloping countries and 0.15 to 0.20 per cent of GNP of developed countries to leastdeveloped countries . . .” (pp. 9–10). ODA was 0.23 percent of the combined grossnational income of donor countries (members of the OECD’s Development AssistanceCommittee) in 2002, a shortfall of approximately $120 billion a year on a combined donorGNP of around $25 trillion.
2259-02-Sachs.qxd 8/6/04 11:21 Page 123
124 Brookings Papers on Economic Activity, 1:2004
(n+d)k
Af(k)
sAf(k)
kECapital
Output units
Figure 1. Standard Neoclassical Growth Model
Source: Authors’ model described in the text.
The economy grows in per capita terms as long as saving per capitaexceeds capital widening. If saving is lower than capital widening, theeconomy experiences a decline in output per capita. The standard neo-classical model is typically presented as if the economy necessarily growswhen k is very low, in the famous diagram reproduced in figure 1. In thefigure, sAf(k) is assumed to be very steep at the origin and, in particular,steeper than the (n + d )k ray from the origin. In that case, when k is low,dk /dt is positive, since it is equal to the vertical distance between thesAf(k) curve and the (n + d )k ray. Indeed, starting at a very low capital-labor ratio, k and q rise asymptotically to a unique, positive steady-stateequilibrium at kE and qE = Af(kE ).
Actually, figure 1 is a special case, and a not very plausible one at that.When k is very low, two other things tend to be true. First, the marginal
2259-02-Sachs.qxd 8/6/04 11:21 Page 124
Sachs, McArthur, Schmidt-Traub, Kruk, Bahadur, Faye, and McCord 125
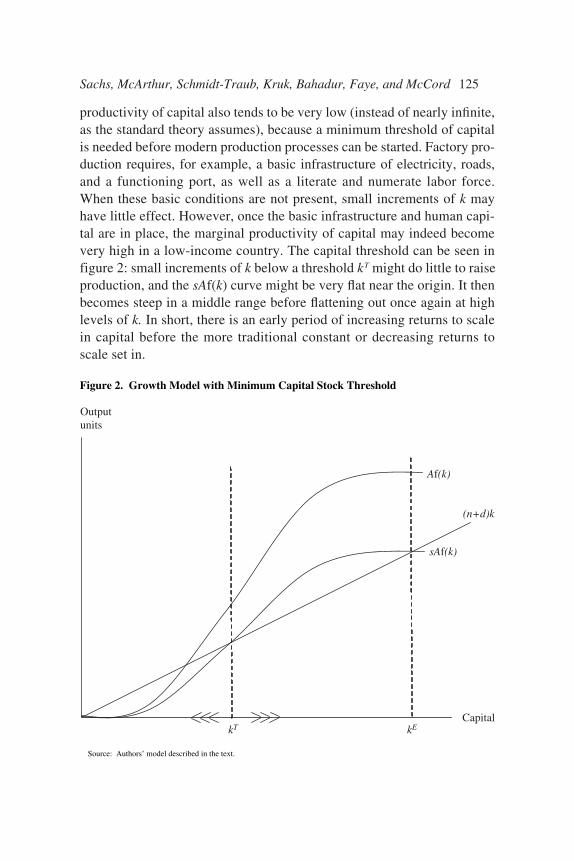
productivity of capital also tends to be very low (instead of nearly infinite,as the standard theory assumes), because a minimum threshold of capitalis needed before modern production processes can be started. Factory pro-duction requires, for example, a basic infrastructure of electricity, roads,and a functioning port, as well as a literate and numerate labor force.When these basic conditions are not present, small increments of k mayhave little effect. However, once the basic infrastructure and human capi-tal are in place, the marginal productivity of capital may indeed becomevery high in a low-income country. The capital threshold can be seen infigure 2: small increments of k below a threshold kT might do little to raiseproduction, and the sAf(k) curve might be very flat near the origin. It thenbecomes steep in a middle range before flattening out once again at highlevels of k. In short, there is an early period of increasing returns to scalein capital before the more traditional constant or decreasing returns toscale set in.
(n+d)k
Af(k)
sAf(k)
kT kECapital
Output units
Figure 2. Growth Model with Minimum Capital Stock Threshold
Source: Authors’ model described in the text.
2259-02-Sachs.qxd 8/6/04 11:21 Page 125
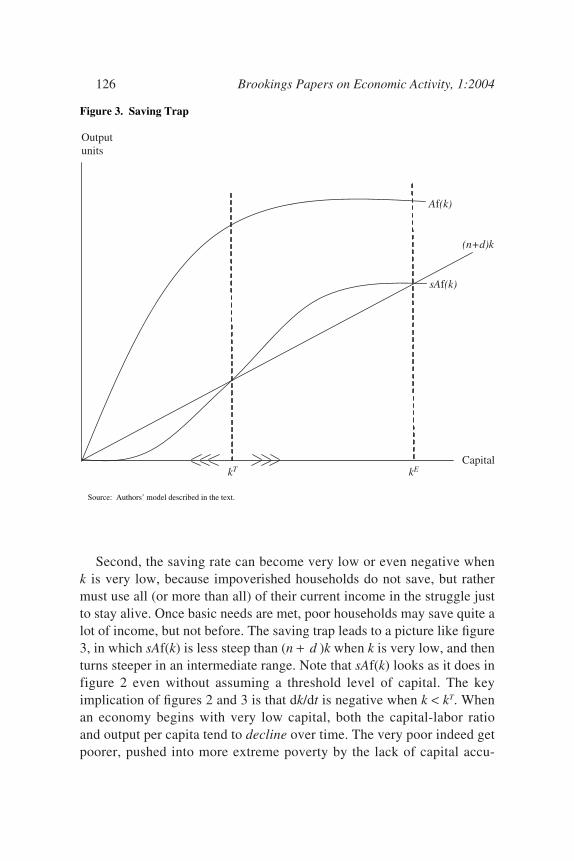
Second, the saving rate can become very low or even negative whenk is very low, because impoverished households do not save, but rathermust use all (or more than all) of their current income in the struggle justto stay alive. Once basic needs are met, poor households may save quite alot of income, but not before. The saving trap leads to a picture like figure3, in which sAf(k) is less steep than (n + d )k when k is very low, and thenturns steeper in an intermediate range. Note that sAf(k) looks as it does infigure 2 even without assuming a threshold level of capital. The keyimplication of figures 2 and 3 is that dk/dt is negative when k < kT. Whenan economy begins with very low capital, both the capital-labor ratioand output per capita tend to decline over time. The very poor indeed getpoorer, pushed into more extreme poverty by the lack of capital accu-
126 Brookings Papers on Economic Activity, 1:2004
(n+d)k
Af(k)
sAf(k)
kT kECapital
Output units
Figure 3. Saving Trap
Source: Authors’ model described in the text.
2259-02-Sachs.qxd 8/6/04 11:21 Page 126
mulation coupled with population growth. Only when an economy has acapital-labor ratio above a minimum threshold kT does it tend to achieveeconomic growth and converge to the steady-state kE and qE.
To formalize these ideas using the simplest version of the neoclassicalmodel, we can use the Harrod-Domar or AK model, in which q = Ak. Inthis case, equation 1 becomes
The proportionate growth rate of the economy is given by
The economy grows if sA > (n + d ) and declines if sA < (n + d ). As is wellknown, the AK model does not have a steady-state equilibrium. The econ-omy either grows or declines at a constant rate.
Let us now see how a poverty trap arises in the AK model, beginningwith a capital threshold. Suppose that A is low (AL) until a threshold levelof infrastructure capital kT (the minimum capital needed for roads, ports,electric power, and human capital) is reached, and then becomes high(AH > AL). If it is the case that sAL < n + d while sAH > n + d, the economycan get stuck in a poverty trap. Specifically, if the capital stock startsbelow kT, the economy shrinks at the rate sAL − (n + d ) < 0, whereas if kstarts above kT, the economy grows at the rate sAH − (n + d ) > 0. The pic-ture is similar to figure 2, with a relatively flat sAf(k) curve near the ori-gin, but with a vertical segment at k = kT as the economy transits from AL
to AH, and then a relatively steep segment for k > kT.Consider alternatively the case of the saving trap, in which the saving
rate is very low or negative when k is very low. As an illustration, supposethat households save a constant fraction σ not of total income but of dis-cretionary income, which we define as income after deducting the costs ofmeeting basic needs. Poor countries calculate basic needs according to anestimate of the minimum caloric intake necessary for a healthy and pro-ductive life, plus ancillary essential needs of clothing, shelter, cookingfuel, and a few other basic amenities. Let these minimum needs be repre-sented by the poverty line qP = AkP. Discretionary income is then qd = q −qP if q > qp and qd = 0 otherwise. We assume that saving per capita sq isequal to σqd. The saving function is therefore
( ) ( / ) / – ( ).3 γ = = +l q q t sA n dd d
( ) / – ( ) .2 d dk t sAk n d k= +
Sachs, McArthur, Schmidt-Traub, Kruk, Bahadur, Faye, and McCord 127
2259-02-Sachs.qxd 8/6/04 11:21 Page 127
This kind of saving function gives rise to a poverty trap. Specifically, inthe AK model, the capital stock must be greater than or equal to kT =σAkP/ [σA − (n + d)] to achieve positive economic growth. The growthrate is easily calculated to be as follows:
There is a long theoretical tradition and strong empirical evidence to sup-port the proposition that the saving rate is very low at low income levelsand rises as income rises above the poverty threshold. Simon Kuznetsremarked, in his classic study on Modern Economic Growth: Rate, Struc-ture, and Spread, that “It is hardly surprising that with the much lowerper capita product in the underdeveloped countries, their gross or net capi-tal formation proportions—which represent gross or net national savingrates—are distinctly lower than those of industrial countries.”8 NormanLoayza, Klaus Schmidt-Hebbel, and Luís Servén find that, in developingcountries, a doubling of private income raises the long-run private savingrate by 10 percentage points.9 Many other studies have shown that savingrates rise at low levels of income.10 In an interesting unpublished surveyof rural Ugandan households, only 23.8 percent indicated that they hadundertaken any saving, and “the most common reason given for not savingwas low income (85.4 percent), although a number of non-saving respon-dents also referred to the poor access to financial institutions.”11
A third factor that can push an economy into a poverty trap is veryrapid population growth at low levels of k. Very poor people do not savemuch, if anything, in the form of reproducible capital or even human cap-
( ) ,
,
, .
5
1 0
1 0
γ
γ σ
γ σ
= ( ) <
= −( ) − +( ) < < <
= −( ) − +( ) > >
− +n d k k
A k k n d k k k
A k k n d k k
P
P P T
P T
for
for
for
( )
.
4 0
1
s q q k k
s k k q q k k
P P
P P P
= < <( )= −( ) > >( )
for or
for orσ
128 Brookings Papers on Economic Activity, 1:2004
8. Kuznets (1966, p. 427).9. Loayza, Schmidt-Hebbel, and Servén (2000).
10. For example, Ogaki, Ostry, and Reinhart (1996).11. Musinguzi and Smith (2000, p. 9).
2259-02-Sachs.qxd 8/6/04 11:21 Page 128
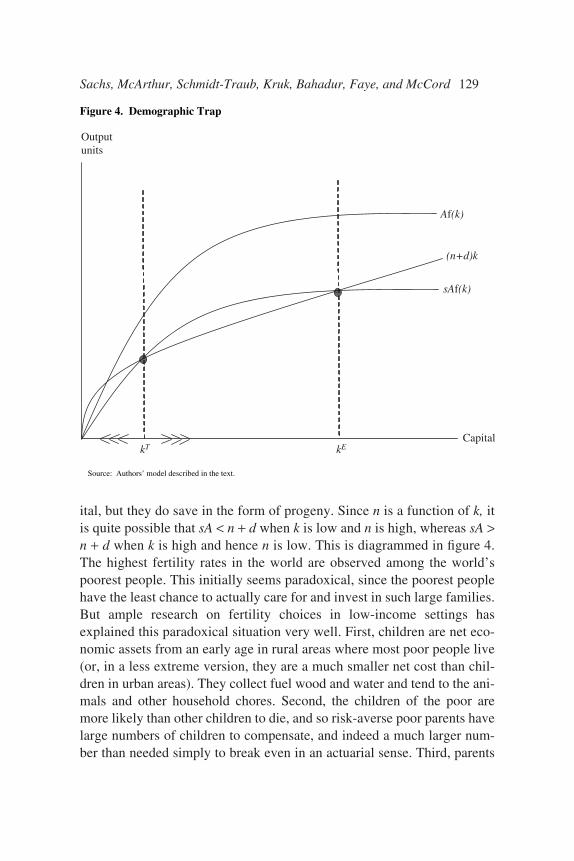
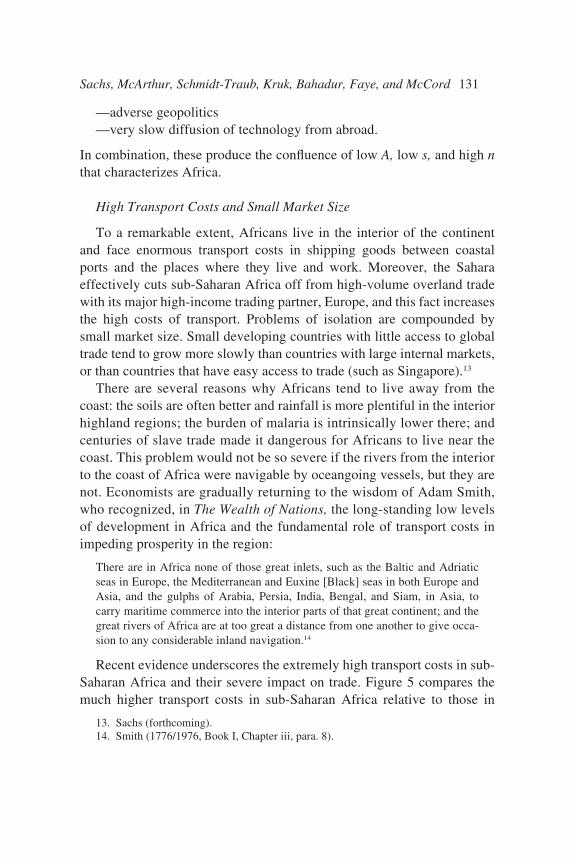
ital, but they do save in the form of progeny. Since n is a function of k, itis quite possible that sA < n + d when k is low and n is high, whereas sA >n + d when k is high and hence n is low. This is diagrammed in figure 4.The highest fertility rates in the world are observed among the world’spoorest people. This initially seems paradoxical, since the poorest peoplehave the least chance to actually care for and invest in such large families.But ample research on fertility choices in low-income settings hasexplained this paradoxical situation very well. First, children are net eco-nomic assets from an early age in rural areas where most poor people live(or, in a less extreme version, they are a much smaller net cost than chil-dren in urban areas). They collect fuel wood and water and tend to the ani-mals and other household chores. Second, the children of the poor aremore likely than other children to die, and so risk-averse poor parents havelarge numbers of children to compensate, and indeed a much larger num-ber than needed simply to break even in an actuarial sense. Third, parents
Sachs, McArthur, Schmidt-Traub, Kruk, Bahadur, Faye, and McCord 129
(n+d)k
Af(k)
sAf(k)
kT kECapital
Output units
Figure 4. Demographic Trap
Source: Authors’ model described in the text.
2259-02-Sachs.qxd 8/6/04 11:21 Page 129
view children as old-age security in the absence of a well-functioning andreliable private or public old-age financing scheme. Fourth, poor familieslack access to contraceptives and family planning services, so there isconsiderable unmet desire to limit childbearing: about 17 percent of mar-ried women in developing countries would prefer to avoid a pregnancybut are not using any form of family planning.12
These three factors—capital thresholds, saving traps, and demographictraps—all interact. It is quite possible that no one of them would be suffi-cient by itself to cause a poverty trap, but that they do so in combination.For example, a country with substandard infrastructure may find itself witha low level of productivity AL, which by itself would not create a trap, butdoes so when combined with the low saving rate and high populationgrowth rate caused by the low productivity.
In any case, positive growth in income per capita is more likely if thereis rapid technological change. When A is rising, the growth equation(equation 3) becomes
We shall see, alas, that Africa suffers not only from low A, low s, and highn, but also from very slow growth in total factor productivity. The slowrise or stagnation of A is mainly for structural rather than governance rea-sons, as we discuss later.
Why Has Africa Suffered the Most Persistent Poverty Trap?
The simple theory outlined above explains how a country or region canget stuck in a poverty trap. It does not explain, however, why sub-SaharanAfrica has been the region most prone to getting stuck. We propose fivestructural reasons that have made sub-Saharan Africa the most vulnerableregion in the world to a persistent poverty trap:
—very high transport costs and small market size—low-productivity agriculture—a very high disease burden
( ) .6 1γ = − +( ) + ( )( )sA n d A A td d
130 Brookings Papers on Economic Activity, 1:2004
12. Ross and Winfrey (2002), who estimate the corresponding figure to be highest insub-Saharan Africa, at 24 percent.
2259-02-Sachs.qxd 8/6/04 11:21 Page 130
—adverse geopolitics—very slow diffusion of technology from abroad.
In combination, these produce the confluence of low A, low s, and high nthat characterizes Africa.
High Transport Costs and Small Market Size
To a remarkable extent, Africans live in the interior of the continentand face enormous transport costs in shipping goods between coastalports and the places where they live and work. Moreover, the Saharaeffectively cuts sub-Saharan Africa off from high-volume overland tradewith its major high-income trading partner, Europe, and this fact increasesthe high costs of transport. Problems of isolation are compounded bysmall market size. Small developing countries with little access to globaltrade tend to grow more slowly than countries with large internal markets,or than countries that have easy access to trade (such as Singapore).13
There are several reasons why Africans tend to live away from thecoast: the soils are often better and rainfall is more plentiful in the interiorhighland regions; the burden of malaria is intrinsically lower there; andcenturies of slave trade made it dangerous for Africans to live near thecoast. This problem would not be so severe if the rivers from the interiorto the coast of Africa were navigable by oceangoing vessels, but they arenot. Economists are gradually returning to the wisdom of Adam Smith,who recognized, in The Wealth of Nations, the long-standing low levelsof development in Africa and the fundamental role of transport costs inimpeding prosperity in the region:
There are in Africa none of those great inlets, such as the Baltic and Adriaticseas in Europe, the Mediterranean and Euxine [Black] seas in both Europe andAsia, and the gulphs of Arabia, Persia, India, Bengal, and Siam, in Asia, tocarry maritime commerce into the interior parts of that great continent; and thegreat rivers of Africa are at too great a distance from one another to give occa-sion to any considerable inland navigation.14
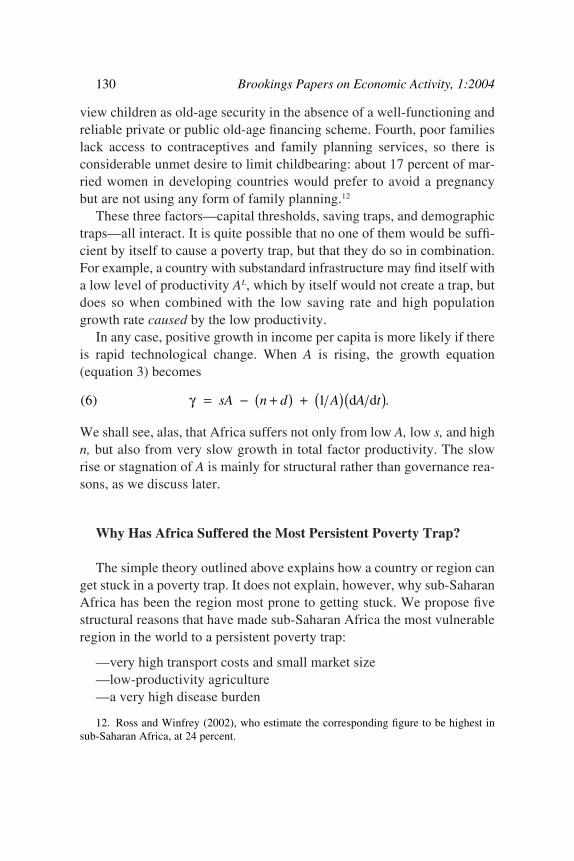
Recent evidence underscores the extremely high transport costs in sub-Saharan Africa and their severe impact on trade. Figure 5 compares themuch higher transport costs in sub-Saharan Africa relative to those in
Sachs, McArthur, Schmidt-Traub, Kruk, Bahadur, Faye, and McCord 131
13. Sachs (forthcoming). 14. Smith (1776/1976, Book I, Chapter iii, para. 8).
2259-02-Sachs.qxd 8/6/04 11:21 Page 131
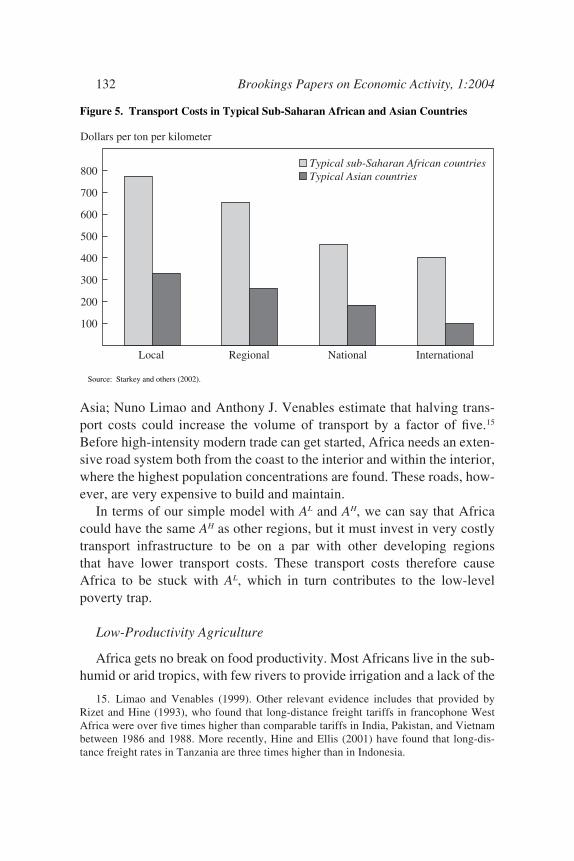
Asia; Nuno Limao and Anthony J. Venables estimate that halving trans-port costs could increase the volume of transport by a factor of five.15
Before high-intensity modern trade can get started, Africa needs an exten-sive road system both from the coast to the interior and within the interior,where the highest population concentrations are found. These roads, how-ever, are very expensive to build and maintain.
In terms of our simple model with AL and AH, we can say that Africacould have the same AH as other regions, but it must invest in very costlytransport infrastructure to be on a par with other developing regions that have lower transport costs. These transport costs therefore causeAfrica to be stuck with AL, which in turn contributes to the low-levelpoverty trap.
Low-Productivity Agriculture
Africa gets no break on food productivity. Most Africans live in the sub-humid or arid tropics, with few rivers to provide irrigation and a lack of the
132 Brookings Papers on Economic Activity, 1:2004
15. Limao and Venables (1999). Other relevant evidence includes that provided byRizet and Hine (1993), who found that long-distance freight tariffs in francophone WestAfrica were over five times higher than comparable tariffs in India, Pakistan, and Vietnambetween 1986 and 1988. More recently, Hine and Ellis (2001) have found that long-dis-tance freight rates in Tanzania are three times higher than in Indonesia.
Dollars per ton per kilometer
100
200
300
400
500
600
700
800
Local Regional National International
Typical sub-Saharan African countriesTypical Asian countries
Figure 5. Transport Costs in Typical Sub-Saharan African and Asian Countries
Source: Starkey and others (2002).
2259-02-Sachs.qxd 8/6/04 11:21 Page 132
large alluvial plains typical of much of South and East Asia that permitcheap irrigation. As a result, Africa has the lowest share of irrigated crop-land of any major region of the developing world.16 Moreover, rainfall inmuch of the continent is erratic, vulnerable to high seasonal and year-to-year fluctuations, and the land is subject to high rates of evapotranspira-tion, due also to high temperatures. Indeed, of all major regions, Africaloses the largest share of its precipitation to evapotranspiration.17 In addi-tion, rainfall in the Sahel (the semiarid region just south of the Sahara) hasbeen persistently low during the past thirty years, in a phenomenon thatmay be linked to long-term climate change and to rising sea-surface tem-peratures in the Indian Ocean. High transport costs also mean that Africanfarmers can afford little fertilizer, since by the time they cover the cost ofbringing fertilizer to their farms and farm output to market, fertilizers areno longer cost effective. Consequently, farmers are farming on soilsincreasingly depleted of nutrients, and without modern methods of watermanagement, in increasingly densely populated communities that are there-fore too impoverished to finance roads and water infrastructure that coulddramatically raise farm yields. Finally, as discussed below, the new seedvarieties that sparked the Green Revolution in Asia and Latin America arepoorly suited to African farming conditions.
Very High Disease Burden
Africa carries a disease burden that is unique in the world in its severity.In recent years the most prominent disease in the region has been HIV/AIDS. Tropical sub-Saharan Africa’s HIV prevalence in 2001 was 7.3 per-cent; in every other world region it is below 1 percent. Africa is also hometo numerous endemic tropical diseases, especially vector-borne diseases.Among these, malaria is by far the most consequential. Of the 1 million to3 million malaria-related deaths every year, it is estimated that 90 percentoccur in sub-Saharan Africa, the great majority of them among children.18
Many casual observers mistakenly assume that because the United Statesand Europe once were burdened by malaria and got rid of it, Africa’songoing malaria crisis is a symptom of its poverty and weak institutionsrather than a deep cause. In other words, many ask how malaria could have
Sachs, McArthur, Schmidt-Traub, Kruk, Bahadur, Faye, and McCord 133
16. World Bank (2003a).17. Global Environmental Monitoring and Research Center (1995).18. World Health Organization and United Nations Children’s Fund (2003).
2259-02-Sachs.qxd 8/6/04 11:21 Page 133
played any more of a causal and intractable role in Africa’s develop-ment than it did in the southern United States, southern Europe, and otherregions that have since eliminated the disease. The answer lies in thedisease’s ecology.
Africa’s malaria is much less tractable than that in other regions for acombination of climatic and biological reasons. The continent’s tempera-tures, mosquito species, and humidity give Africa the world’s highestmalaria burden, as captured in the malaria ecology index developed byAnthony Kiszewski, Jeffrey Sachs, and others; this index is a measureof the strength of malarial transmission based solely on ecological fac-tors.19 Unlike in other parts of the world, Africa’s malaria mosquitoesare almost exclusively human-biters, and this fact enhances the chain ofhuman-to-human transmission. Africa is also the only major world regionwhere the most malignant human malaria species, Plasmodium falci-parum, predominates.20 The combination of high year-round tempera-tures, adequate precipitation for mosquito breeding, and human-bitinganopheles mosquitoes has made Africa the global epicenter of malariafrom time immemorial. The genetic code of African populations providesevidence: the sickle-cell hemoglobin allele, which partially protects indi-viduals against malaria when inherited heterozygously, is extraordinarilyprevalent in Africa compared with other regions of the world.21
Malaria contributes to a classic poverty trap. With enough invest-ment, even Africa’s high malaria morbidity and mortality could be con-trolled, although not eliminated, with current technologies. But that wouldrequire substantially more money than Africa can afford. Thus Africa istoo poor to control malaria, and meanwhile malaria reduces productivity,frustrates foreign investment, and (by contributing to very high child mor-tality rates) delays or stops the demographic transition, thereby helping tokeep Africa poor.
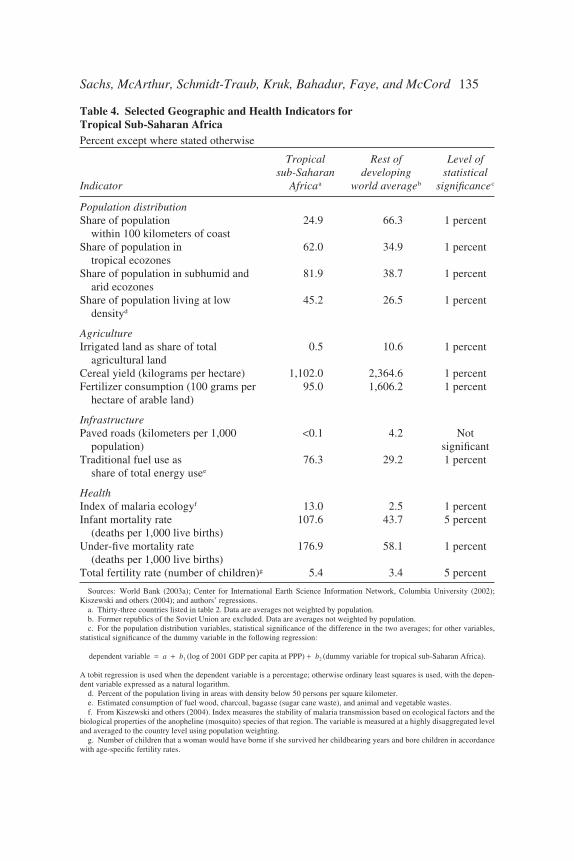
To highlight Africa’s unique challenges in terms of high transportcosts, low agricultural productivity, and high disease burden, table 4 pre-sents difference-of-means tests for a series of geographic variables andresults of simple regressions with agricultural productivity, infrastructure,
134 Brookings Papers on Economic Activity, 1:2004
19. Kiszewski and others (2004). 20. World Health Organization (1992).21. The Hardy-Weinberg equation can be used to link the high prevalence of the hemo-
globin S allele and the historically high death rates from malaria in Africa.
2259-02-Sachs.qxd 8/6/04 11:21 Page 134
Sachs, McArthur, Schmidt-Traub, Kruk, Bahadur, Faye, and McCord 135
Table 4. Selected Geographic and Health Indicators for Tropical Sub-Saharan AfricaPercent except where stated otherwise
Tropical Rest of Level ofsub-Saharan developing statistical
Indicator Africaa world averageb significancec
Population distributionShare of population 24.9 66.3 1 percent
within 100 kilometers of coastShare of population in 62.0 34.9 1 percent
tropical ecozonesShare of population in subhumid and 81.9 38.7 1 percent
arid ecozonesShare of population living at low 45.2 26.5 1 percent
densityd
AgricultureIrrigated land as share of total 0.5 10.6 1 percent
agricultural landCereal yield (kilograms per hectare) 1,102.0 2,364.6 1 percentFertilizer consumption (100 grams per 95.0 1,606.2 1 percent
hectare of arable land)
InfrastructurePaved roads (kilometers per 1,000 <0.1 4.2 Not
population) significantTraditional fuel use as 76.3 29.2 1 percent
share of total energy usee
HealthIndex of malaria ecologyf 13.0 2.5 1 percentInfant mortality rate 107.6 43.7 5 percent
(deaths per 1,000 live births)Under-five mortality rate 176.9 58.1 1 percent
(deaths per 1,000 live births)Total fertility rate (number of children)g 5.4 3.4 5 percent
Sources: World Bank (2003a); Center for International Earth Science Information Network, Columbia University (2002);Kiszewski and others (2004); and authors’ regressions.
a. Thirty-three countries listed in table 2. Data are averages not weighted by population.b. Former republics of the Soviet Union are excluded. Data are averages not weighted by population.c. For the population distribution variables, statistical significance of the difference in the two averages; for other variables,
statistical significance of the dummy variable in the following regression:
dependent variable = a + b1 (log of 2001 GDP per capita at PPP) + b2 (dummy variable for tropical sub-Saharan Africa).
A tobit regression is used when the dependent variable is a percentage; otherwise ordinary least squares is used, with the depen-dent variable expressed as a natural logarithm.
d. Percent of the population living in areas with density below 50 persons per square kilometer.e. Estimated consumption of fuel wood, charcoal, bagasse (sugar cane waste), and animal and vegetable wastes.f. From Kiszewski and others (2004). Index measures the stability of malaria transmission based on ecological factors and the
biological properties of the anopheline (mosquito) species of that region. The variable is measured at a highly disaggregated leveland averaged to the country level using population weighting.
g. Number of children that a woman would have borne if she survived her childbearing years and bore children in accordancewith age-specific fertility rates.
2259-02-Sachs.qxd 8/6/04 11:21 Page 135
and health measures as dependent variables. The geographic variablesshow a statistically significant difference of means between sub-SaharanAfrica and the rest of the developing world, and the agriculture, infra-structure, and health variables are significantly worse in Africa even aftercontrolling for income per capita.
Adverse Geopolitics
On top of the structural challenges already mentioned, Africa sufferedbrutally at the hands of European powers for almost five centuries, andthe record with Arab powers was little better. A massive slave tradehelped undermine the formation of nation-states and may have depopu-lated Africa’s coastal regions. In the nineteenth century the slave tradewas replaced by direct colonial rule and a century of exploitation by Euro-pean imperial powers. At the end of the colonial period, most of Africawas left with tragically little infrastructure and education, far less than inpostcolonial Asia.22 In contrast to much of Asia, Africa’s borders weredrawn up without regard to ethnic and political units, with little infra-structure connecting them. In addition, differences in colonial languagesand customs further fragmented many parts of Africa, particularly in WestAfrica. Independence, ironically, was followed by the continued manipu-lation of African countries as proxies in the cold war and continued depre-dations by rich countries in exploiting Africa’s natural resources. No doubtmany African leaders played into these abuses and exacerbated themthrough corrupt and authoritarian rule, but if it is true that these leadershanged themselves and their fellow citizens, the rich countries often pro-vided the rope.
136 Brookings Papers on Economic Activity, 1:2004
22. It is worth quoting at length an excellent paper by Torero and Chowdhury (2004,p. 4): “Unlike Asia and Latin America, Africa inherited a highly dispersed and unevenlydistributed infrastructure from its colonial past. There was little, if any, improvement ofinfrastructure during the colonial era, and, according to [Baland and] Platteau (1996), ‘insome important respects, it can even be said that colonial policy reinforced the handicaps ofSSA’ (p. 200). The limited infrastructure that was built during that era was driven by theobjective of connecting natural resources to export markets. For example, Platteau notedthat ‘two-thirds of the African railways built in the colonial period connected mines to acoastal harbor’ (p. 200). The rest of the continent was virtually ignored and, according toBoserup (1981), ‘only the Union of South Africa with mass immigration of Europeans hadmore than six meters of railways per square kilometer in 1970 and six countries had no rail-ways at all’ (p. 148).”
2259-02-Sachs.qxd 8/6/04 11:21 Page 136
Even when the major powers were not exploiting Africa, they wererarely helping it, or at least not very much. Africa is not a strategic focusof either the United States or Europe, in contradistinction, for example,to the United States’ relationships with East Asia, the Middle East, orLatin America, and Western Europe’s relationships with EasternEurope, the Middle East, and North Africa. Sub-Saharan Africa is too faraway and too negligible a market to elicit a priority concern. The result isthat whereas Europe, Asia, Latin America, and the Middle East have all,at times, been the object of U.S. financial largesse, Africa has not. Africahas also ranked as a low priority in both trade and debt negotiations. Fol-lowing the 1982 developing country debt crisis, Latin American coun-tries received debt cancellation well before Africa did, and tradediscrimination against Africa has persisted for decades despite repeatedpromises to remove limits on Africa’s access to U.S. and European mar-kets. Even new initiatives to expand access to the U.S. market, such asthe African Growth and Opportunity Act, remain heavily constrained byrules-of-origin and other limits to African exports.
Slow Diffusion of Technology from Abroad
Africa has been the world’s great laggard in technological advance,notably in the areas of agriculture and health. For instance, most of the devel-oping world experienced a Green Revolution—a surge in crop yields inthe 1970s through the 1990s as a result of scientific breeding that pro-duced high-yield varieties (HYVs), combined with increased use of fer-tilizers and irrigation. Africa’s uptake of HYVs was the lowest in thedeveloping world. The reasons are very clear. The Green Revolution HYVswere designed for the conditions of Latin America and Asia and did noteasily transfer to the agronomic and economic conditions of Africa’s rain-fed, fertilizer-scarce, subhumid and arid tropics. Whereas HYV researchfocused mainly on wheat, maize, and paddy rice, Africa produces maizebut little wheat and paddy rice. It depends much more on sorghum, millet,and tubers (cassava, coco yams, and sweet potatoes). As discussedabove, high transport costs and the combination of unfavorable geohy-drology and topography hindered increases in the use of fertilizers andirrigation. The absence of a Green Revolution in Africa had clear impli-cations for food productivity, as shown in table 5. Sub-Saharan Africa hasby far the lowest cereal yield per hectare of any major region and has
Sachs, McArthur, Schmidt-Traub, Kruk, Bahadur, Faye, and McCord 137
2259-02-Sachs.qxd 8/6/04 11:21 Page 137
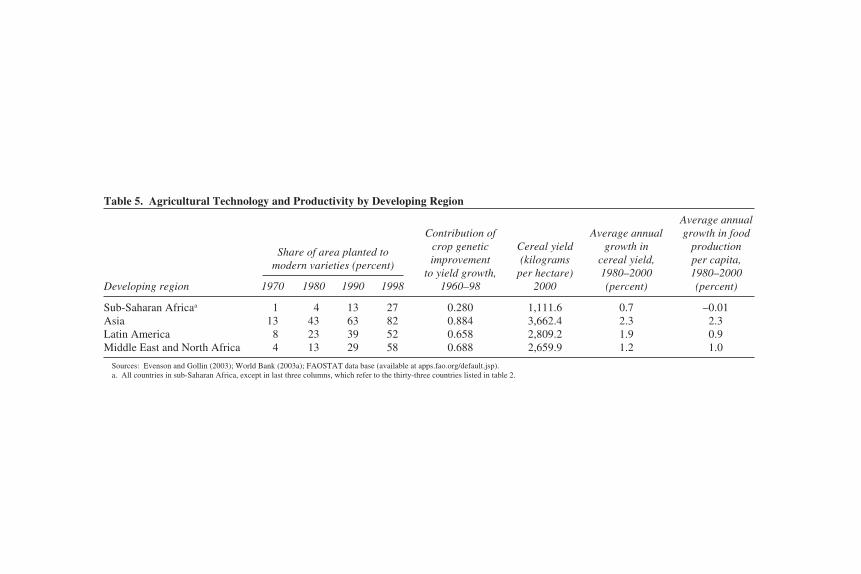
Table 5. Agricultural Technology and Productivity by Developing Region
Average annual Contribution of Average annual growth in food
crop genetic Cereal yield growth in production improvement (kilograms cereal yield, per capita,
to yield growth, per hectare) 1980–2000 1980–2000 Developing region 1970 1980 1990 1998 1960–98 2000 (percent) (percent)
Sub-Saharan Africaa 1 4 13 27 0.280 1,111.6 0.7 –0.01Asia 13 43 63 82 0.884 3,662.4 2.3 2.3Latin America 8 23 39 52 0.658 2,809.2 1.9 0.9Middle East and North Africa 4 13 29 58 0.688 2,659.9 1.2 1.0
Sources: Evenson and Gollin (2003); World Bank (2003a); FAOSTAT data base (available at apps.fao.org/default.jsp).a. All countries in sub-Saharan Africa, except in last three columns, which refer to the thirty-three countries listed in table 2.
Share of area planted tomodern varieties (percent)
2259-02-Sachs.qxd 8
/6/04 1
1:21 P
age 138
experienced the slowest gain in yields during the last two decades. Indeed, itis the only major region to have recorded a (slight) decline in food pro-duction per capita during 1980–2000.
In highlighting these points, we are certainly not arguing for any geographical determinism. Indeed, the whole point of the paper is theopposite: Africa’s structural impediments can be overcome, if they arecompensated by an intensive investment program that directly confrontsthe continent’s high transport costs, low agricultural productivity, heavydisease burden, colonial legacy of poor educational attainment, and thelike. We are arguing, however, that Africa’s structural problems help toaccount for its current trap. Each of the factors mentioned has made itmuch harder for Africa to lift itself up by its bootstraps. Rural and inlandAfrica, plagued by disease, huge transport costs, and low agricultural yields,was unable to generate enough of an economic surplus above survivallevels that could be invested sufficiently to overcome these conditions.Poor governance no doubt complicated the task—many natural resourcerents were squandered—but the poor governance itself was as much symp-tom as cause.23 To break out of the poverty trap, Africa needs help, and ithas not yet gotten it in the form and to the extent that is necessary.
The delay in getting this help, moreover, has greatly complicated thetask that lies ahead. Because the world has waited so long to help Africabreak free of its structural constraints, the situation is vastly more compli-cated today than even a generation ago. First, there is AIDS, a pandemicunrivaled in ferocity in modern history, which the rich countries haveallowed to run almost unabated in Africa since its recognition twenty-three years ago. Second, the massive population growth in rural areas hasled to a sharp fall in the size of the average household farm. In turn, theincreased population pressure has not led to agricultural intensification asEster Boserup predicted,24 but has caused massive environmental degra-
Sachs, McArthur, Schmidt-Traub, Kruk, Bahadur, Faye, and McCord 139
23. Even in clear cases of squandered wealth, such as Nigeria with its oil earnings, theextent of the loss is often exaggerated. Nigeria is not, contrary to popular view, a rich coun-try that squandered vast wealth. Rather, it is a poor country that squandered a modest inher-itance. A simple calculation explains why. Nigeria produces around 2 million barrels of oila day, at a price of roughly $25 per barrel in recent years, or $50 million a day. Perhaps60 percent of this, or $30 million a day, stays with Nigeria after production sharing withforeign companies and covering the costs of extraction. Given that there are approximately130 million Nigerians, oil revenue would be around 23 cents per Nigerian per day, oraround $84 a year. Nigeria, in short, is not oil rich on a per capita basis.
24. Boserup (1965).
2259-02-Sachs.qxd 8/6/04 11:21 Page 139
dation instead. In Boserup’s theory, higher population density should haveled to intensive cultivation, with large investments in fertilizers, watermanagement, seed breeding, and the like. Instead soil nutrients have beendepleted, with hardly any replacement by chemical fertilizers or nitrogen-fixing plants, and forests have been cut down, yet food production remainsat subsistence levels, with almost no modern inputs.
Some Growth Accounting
Africa’s poverty trap is evident empirically through simple growthaccounting. We look at this in two ways. The first is the standard Solowdecomposition of growth, as recently implemented on a cross-countrybasis by Barry Bosworth and Susan Collins.25 The second is the AK
140 Brookings Papers on Economic Activity, 1:2004
25. Bosworth and Collins (2003).
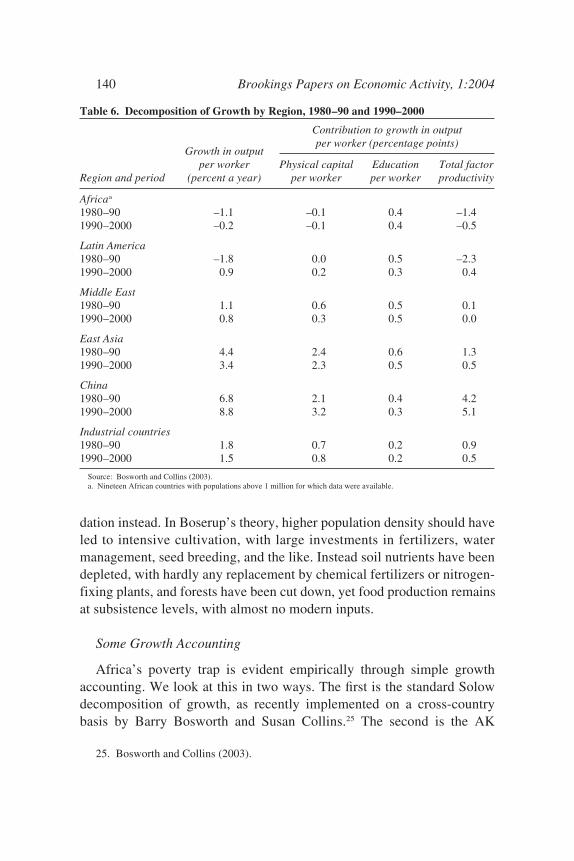
Table 6. Decomposition of Growth by Region, 1980–90 and 1990–2000
Contribution to growth in output
Growth in output per worker (percentage points)
per worker Physical capital Education Total factorRegion and period (percent a year) per worker per worker productivity
Africaa
1980–90 –1.1 –0.1 0.4 –1.41990–2000 –0.2 –0.1 0.4 –0.5
Latin America1980–90 –1.8 0.0 0.5 –2.31990–2000 0.9 0.2 0.3 0.4
Middle East1980–90 1.1 0.6 0.5 0.11990–2000 0.8 0.3 0.5 0.0
East Asia1980–90 4.4 2.4 0.6 1.31990–2000 3.4 2.3 0.5 0.5
China1980–90 6.8 2.1 0.4 4.21990–2000 8.8 3.2 0.3 5.1
Industrial countries1980–90 1.8 0.7 0.2 0.91990–2000 1.5 0.8 0.2 0.5
Source: Bosworth and Collins (2003). a. Nineteen African countries with populations above 1 million for which data were available.
2259-02-Sachs.qxd 8/6/04 11:21 Page 140
model approach, which assumes a fixed incremental capital-labor ratioand which does not require us to construct a capital stock. Both methodsgive the same result: Africa has not been saving enough to keep up withthe requirements of capital widening. The Bosworth-Collins decomposi-tion is shown in table 6. We see that Africa is the only region to haveexperienced two consecutive decades of declining output per worker.According to Bosworth and Collins, Africa’s shortfall is the result of botha declining capital-worker ratio and an outright decline in total factor pro-ductivity (which could reflect, for example, the effects of environmentaldegradation, not measured in the capital stock, on crop yields).26
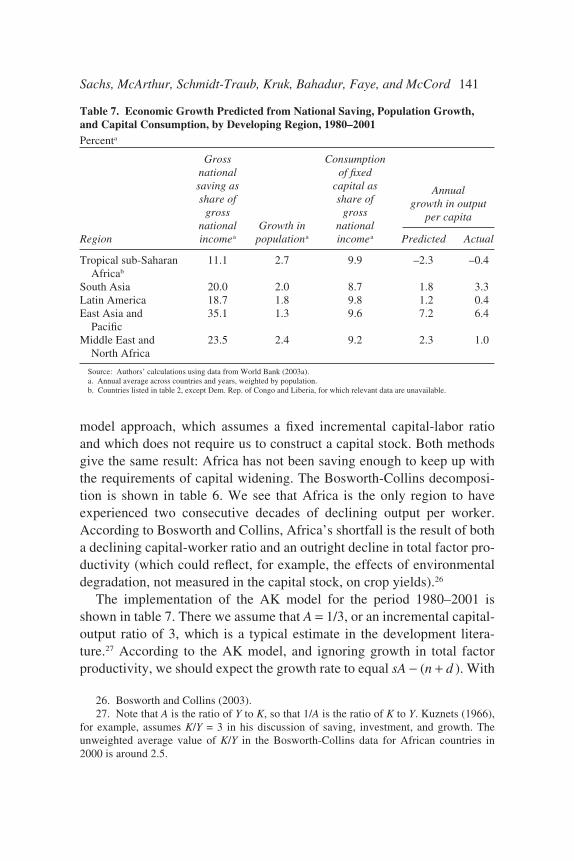
The implementation of the AK model for the period 1980–2001 isshown in table 7. There we assume that A = 1/3, or an incremental capital-output ratio of 3, which is a typical estimate in the development litera-ture.27 According to the AK model, and ignoring growth in total factorproductivity, we should expect the growth rate to equal sA − (n + d ). With
Sachs, McArthur, Schmidt-Traub, Kruk, Bahadur, Faye, and McCord 141
26. Bosworth and Collins (2003).27. Note that A is the ratio of Y to K, so that 1/A is the ratio of K to Y. Kuznets (1966),
for example, assumes K/Y = 3 in his discussion of saving, investment, and growth. Theunweighted average value of K/Y in the Bosworth-Collins data for African countries in2000 is around 2.5.
Table 7. Economic Growth Predicted from National Saving, Population Growth,and Capital Consumption, by Developing Region, 1980–2001Percenta
Gross Consumptionnational of fixed saving as capital asshare of share of
gross gross national Growth in national
Region incomea populationa incomea Predicted Actual
Tropical sub-Saharan 11.1 2.7 9.9 –2.3 –0.4Africab
South Asia 20.0 2.0 8.7 1.8 3.3Latin America 18.7 1.8 9.8 1.2 0.4East Asia and 35.1 1.3 9.6 7.2 6.4
PacificMiddle East and 23.5 2.4 9.2 2.3 1.0
North Africa
Source: Authors’ calculations using data from World Bank (2003a).a. Annual average across countries and years, weighted by population. b. Countries listed in table 2, except Dem. Rep. of Congo and Liberia, for which relevant data are unavailable.
Annualgrowth in output
per capita
2259-02-Sachs.qxd 8/6/04 11:21 Page 141
142 Brookings Papers on Economic Activity, 1:2004
y = 1.1128x – 0.3421R2 = 0.815
–2
0
2
4
6
Tropical Sub-Saharan Africa
Latin America
Middle East and North Africa
South Asia
East Asia and Pacific
Actual (percent a year)
Predicted (percent a year)
–2 0 2 4 6
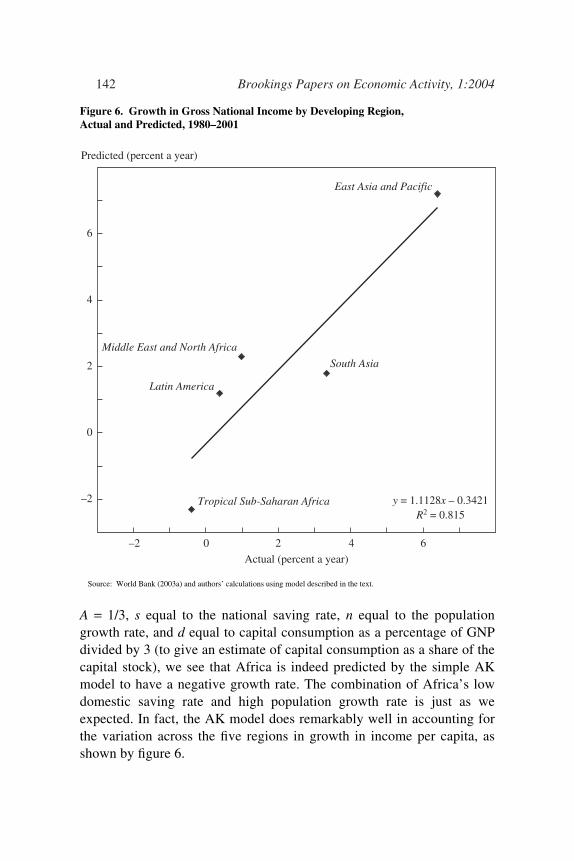
Figure 6. Growth in Gross National Income by Developing Region, Actual and Predicted, 1980–2001
Source: World Bank (2003a) and authors’ calculations using model described in the text.
A = 1/3, s equal to the national saving rate, n equal to the populationgrowth rate, and d equal to capital consumption as a percentage of GNPdivided by 3 (to give an estimate of capital consumption as a share of thecapital stock), we see that Africa is indeed predicted by the simple AKmodel to have a negative growth rate. The combination of Africa’s lowdomestic saving rate and high population growth rate is just as weexpected. In fact, the AK model does remarkably well in accounting forthe variation across the five regions in growth in income per capita, asshown by figure 6.
2259-02-Sachs.qxd 8/6/04 11:21 Page 142
The situation is even worse than it looks, however, because the nationalincome accounts data almost surely, and substantially, overestimate Africa’strue saving rate. To a significant extent, Africa is living off of its naturalcapital but counting the resource depletion as income. Africa has beencutting down its rainforests to make room for new farmland and to pro-vide fuel wood and timber, but the deforestation is not counted as a lossof natural capital. Farmers have been depleting the soils of nutrients by growing crops without fertilizers, but the loss of soil nutrients is notcounted as a loss of capital. Countries depleting their mineral reserves(for example, Zambia’s copper) are counted as earning income rather thanconverting one form of capital, mineral deposits, to another, financialassets. Sooner or later these forms of resource depletion will have to cometo an end, and African real consumption will fall, perhaps significantly.Put differently, Africa’s productive capital stock per person is falling evenfaster than was suspected once we take into account, even imperfectly, thedecline of a number of forms of natural capital.
There is no readily accepted practical methodology for correcting mea-sured national saving rates for resource depletion effects. We thereforeuse the World Bank’s valiant, but very preliminary, attempt, adding inone calculation of our own.28 In the World Bank’s corrected saving mea-sures, the saving rate taken from the national accounts is augmented byexpenditure on education (which is counted as consumption in thenational accounts but should be counted as investment in human capital),and then reduced according to estimates of the economic costs of defor-estation, energy depletion, and mineral depletion. This corrected savingrate is shown in the right-hand column of table 8. We then make one morecorrection for tropical sub-Saharan Africa, by measuring the estimatedannual loss to Africa’s soil of three macronutrients—nitrogen, phospho-rus, and potassium—which are currently being depleted with each har-vest. Sooner rather than later, this loss of soil nutrients will have to bemade up by the addition of nutrients through chemical or biologicalmeans. If we assume that the soil nutrients are replaced through inputs ofchemical fertilizers purchased at market value in Africa, the annual costof replacing the soil nutrients is around 2 percent of Africa’s grossnational income (GNI). We accordingly lower the measured saving rateby that amount. In sum, whereas Africa’s measured national saving rate is
Sachs, McArthur, Schmidt-Traub, Kruk, Bahadur, Faye, and McCord 143
28. Hamilton and Clemens (1999).
2259-02-Sachs.qxd 8/6/04 11:21 Page 143
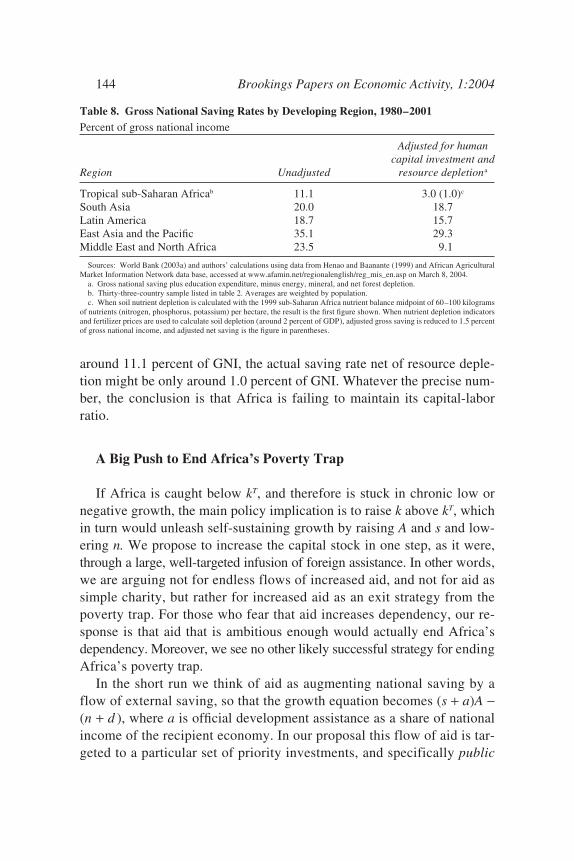
around 11.1 percent of GNI, the actual saving rate net of resource deple-tion might be only around 1.0 percent of GNI. Whatever the precise num-ber, the conclusion is that Africa is failing to maintain its capital-laborratio.
A Big Push to End Africa’s Poverty Trap
If Africa is caught below kT, and therefore is stuck in chronic low ornegative growth, the main policy implication is to raise k above kT, whichin turn would unleash self-sustaining growth by raising A and s and low-ering n. We propose to increase the capital stock in one step, as it were,through a large, well-targeted infusion of foreign assistance. In other words,we are arguing not for endless flows of increased aid, and not for aid assimple charity, but rather for increased aid as an exit strategy from thepoverty trap. For those who fear that aid increases dependency, our re-sponse is that aid that is ambitious enough would actually end Africa’sdependency. Moreover, we see no other likely successful strategy for endingAfrica’s poverty trap.
In the short run we think of aid as augmenting national saving by aflow of external saving, so that the growth equation becomes (s + a)A −(n + d ), where a is official development assistance as a share of nationalincome of the recipient economy. In our proposal this flow of aid is tar-geted to a particular set of priority investments, and specifically public
144 Brookings Papers on Economic Activity, 1:2004
Table 8. Gross National Saving Rates by Developing Region, 1980–2001Percent of gross national income
Adjusted for humancapital investment and
Region Unadjusted resource depletiona
Tropical sub-Saharan Africab 11.1 3.0 (1.0)c
South Asia 20.0 18.7Latin America 18.7 15.7East Asia and the Pacific 35.1 29.3Middle East and North Africa 23.5 9.1
Sources: World Bank (2003a) and authors’ calculations using data from Henao and Baanante (1999) and African AgriculturalMarket Information Network data base, accessed at www.afamin.net/regionalenglish/reg_mis_en.asp on March 8, 2004.
a. Gross national saving plus education expenditure, minus energy, mineral, and net forest depletion. b. Thirty-three-country sample listed in table 2. Averages are weighted by population.c. When soil nutrient depletion is calculated with the 1999 sub-Saharan Africa nutrient balance midpoint of 60–100 kilograms
of nutrients (nitrogen, phosphorus, potassium) per hectare, the result is the first figure shown. When nutrient depletion indicatorsand fertilizer prices are used to calculate soil depletion (around 2 percent of GDP), adjusted gross saving is reduced to 1.5 percentof gross national income, and adjusted net saving is the figure in parentheses.
2259-02-Sachs.qxd 8/6/04 11:21 Page 144
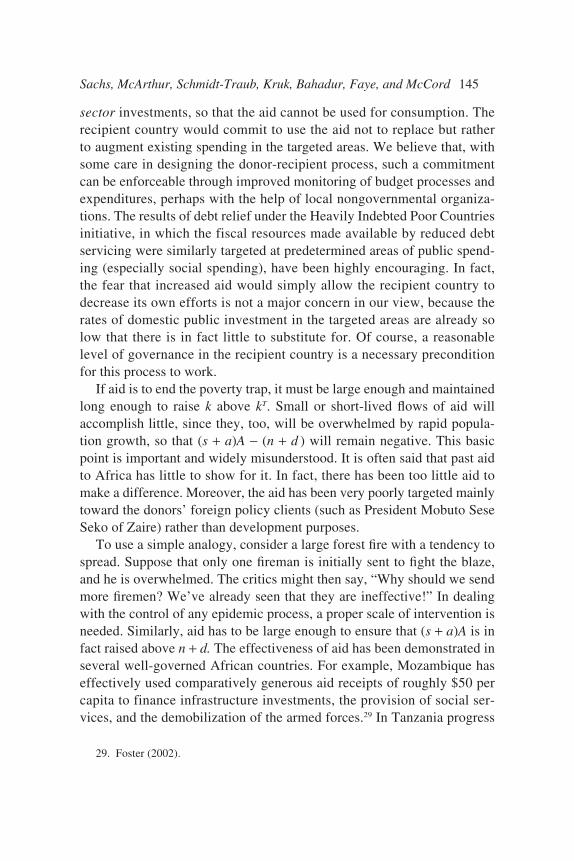
sector investments, so that the aid cannot be used for consumption. Therecipient country would commit to use the aid not to replace but ratherto augment existing spending in the targeted areas. We believe that, withsome care in designing the donor-recipient process, such a commitmentcan be enforceable through improved monitoring of budget processes andexpenditures, perhaps with the help of local nongovernmental organiza-tions. The results of debt relief under the Heavily Indebted Poor Countriesinitiative, in which the fiscal resources made available by reduced debtservicing were similarly targeted at predetermined areas of public spend-ing (especially social spending), have been highly encouraging. In fact,the fear that increased aid would simply allow the recipient country todecrease its own efforts is not a major concern in our view, because therates of domestic public investment in the targeted areas are already solow that there is in fact little to substitute for. Of course, a reasonablelevel of governance in the recipient country is a necessary preconditionfor this process to work.
If aid is to end the poverty trap, it must be large enough and maintainedlong enough to raise k above kT. Small or short-lived flows of aid willaccomplish little, since they, too, will be overwhelmed by rapid popula-tion growth, so that (s + a)A − (n + d ) will remain negative. This basicpoint is important and widely misunderstood. It is often said that past aidto Africa has little to show for it. In fact, there has been too little aid tomake a difference. Moreover, the aid has been very poorly targeted mainlytoward the donors’ foreign policy clients (such as President Mobuto SeseSeko of Zaire) rather than development purposes.
To use a simple analogy, consider a large forest fire with a tendency tospread. Suppose that only one fireman is initially sent to fight the blaze,and he is overwhelmed. The critics might then say, “Why should we sendmore firemen? We’ve already seen that they are ineffective!” In dealingwith the control of any epidemic process, a proper scale of intervention isneeded. Similarly, aid has to be large enough to ensure that (s + a)A is infact raised above n + d. The effectiveness of aid has been demonstrated inseveral well-governed African countries. For example, Mozambique haseffectively used comparatively generous aid receipts of roughly $50 percapita to finance infrastructure investments, the provision of social ser-vices, and the demobilization of the armed forces.29 In Tanzania progress
Sachs, McArthur, Schmidt-Traub, Kruk, Bahadur, Faye, and McCord 145
29. Foster (2002).
2259-02-Sachs.qxd 8/6/04 11:21 Page 145
in improving human and physical capital stalled after donors reduced theirhigh aid disbursements during the 1980s and early 1990s.30
Any aid strategy must confront many complexities, especially regardingthe conditions under which aid is provided. Unconstrained aid flows wouldprobably be consumed rather than invested. The strategy needs to bedesigned to ensure that the aid is properly invested, and there must be acredible mechanism for enforcing the strategy over a relatively long period.We first take up the design of the investment program and then, in the finalsection of the paper, consider the recipient-donor enforcement mechanisms.
Our specific recommendation is to use the Millennium DevelopmentGoals for 2015 as the intermediate targets for the investment program. Inother words, we argue that aid flows should be designed to enable other-wise well-governed African countries to meet the MDGs. There are bothpragmatic and substantive reasons for this choice. The pragmatic reasonis that the world has already promised to do just this. The MDGs are theonly international goals that can motivate a complicated internationalmachinery of intergovernmental cooperation and resource transfers. Butthere are deeper reasons as well. The MDGs in fact constitute a very rea-sonable balance of concerns and are the product of a decade or more ofinternational debate and deliberation on economic development. Theyreflect the fact, for example, that the escape from poverty requires invest-ments in both human capital and physical capital, and that poverty itself ismultidimensional, involving not only income but also lack of food secu-rity, health, education, gender equality, environmental management, andaccess to basic amenities. The MDGs are also flexible enough to supporta well-constructed growth strategy. For example, they call for halving therate of income poverty by 2015, but they do not specify exactly how thisis to be done. That leaves open the possibility for sound analysis of theunderlying growth dynamics and allows investment targets to be intro-duced in several areas (such as family planning, energy systems, and ruralroads) that the MDGs do not explicitly mention, but that are nonethelesskey inputs to a sound public investment strategy to end the poverty trap.
One final preliminary thought is important. The MDGs are an inter-mediate target, not a final goal. After all, even if met, they will still leavein place an enormous amount of extreme poverty. Indeed, it is quite likelythat, whatever is achieved in terms of the MDGs, many African coun-
146 Brookings Papers on Economic Activity, 1:2004
30. Foster and Keith (2003).
2259-02-Sachs.qxd 8/6/04 11:21 Page 146
tries will continue to require large-scale aid flows for another decade ormore beyond 2015, since they will not have reached the threshold for self-sustaining growth. We are not arguing that the MDGs are sufficient forescaping poverty. We are arguing that they are a sensible, internationallyagreed way station on the road to eliminating extreme poverty and endingAfrica’s poverty trap.
Designing a Strategy to Meet the MDGs
Ending the poverty trap in Africa and meeting the MDGs will require a comprehensive strategy for public investment in conjunction with im-proved governance. This section lays out such an investment strategyfocusing on specific interventions—defined broadly as the provision ofgoods, services, and infrastructure—which we have grouped into sevenareas in appendix A. A detailed background paper of the UN MillenniumProject offers more information on both the general strategy and the vari-ous sets of interventions.31
Most of the interventions are expected to have effects on several goals.For example, improved education leads to many benefits, including reduc-tions in income poverty, hunger, and child mortality. Conversely, meetingeach goal (poverty, hunger, education, health, and the others) requiresmultiple interventions. This point is stressed in appendix B, which sum-marizes how each goal is affected by multiple sets of interventions. Thecombination of appendixes A and B approximates an “MDG productionfunction,” describing the set of inputs needed to achieve the desired setof outputs. Of course, this is a purely qualitative depiction at this stage;we provide a quantification of the inputs in the later analysis.
In designing the recommended package, we have given careful consid-eration to the issue of gender equity, that is, to an improved economic andsocial status for Africa’s women. To a great extent, women are the farm-ers, caregivers, and child raisers of Africa. They perform an incredibleamount of physical labor every day merely to keep their households alive.Fetching fuel wood and water, caring for the farm animals, plowing thefields, and caring for the sick and dying in the AIDS pandemic are allbackbreaking tasks disproportionately borne by Africa’s women. Many
Sachs, McArthur, Schmidt-Traub, Kruk, Bahadur, Faye, and McCord 147
31. UN Millennium Project (2004).
2259-02-Sachs.qxd 8/6/04 11:21 Page 147
148 Brookings Papers on Economic Activity, 1:2004
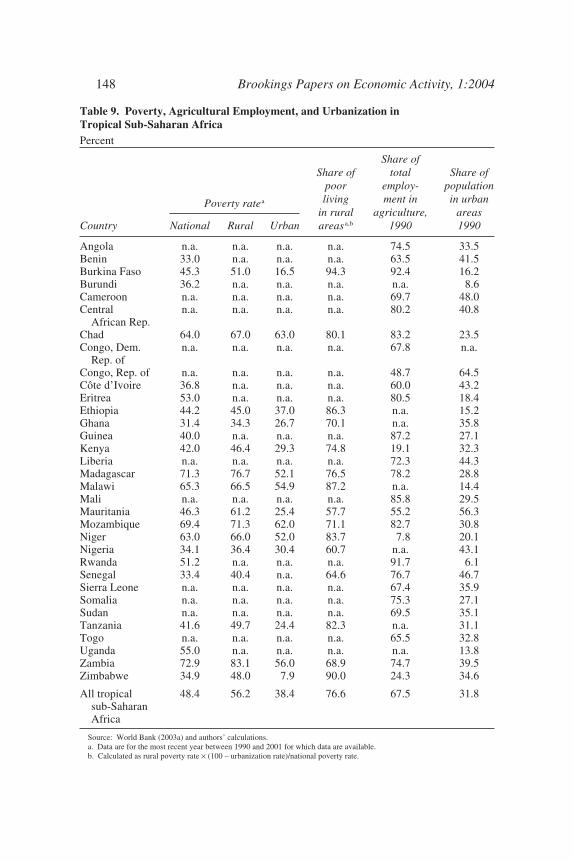
Table 9. Poverty, Agricultural Employment, and Urbanization in Tropical Sub-Saharan AfricaPercent
Share ofShare of total Share of
poor employ- populationliving ment in in urban
in rural agriculture, areasCountry National Rural Urban areas a,b 1990 1990
Angola n.a. n.a. n.a. n.a. 74.5 33.5Benin 33.0 n.a. n.a. n.a. 63.5 41.5Burkina Faso 45.3 51.0 16.5 94.3 92.4 16.2Burundi 36.2 n.a. n.a. n.a. n.a. 8.6Cameroon n.a. n.a. n.a. n.a. 69.7 48.0Central n.a. n.a. n.a. n.a. 80.2 40.8
African Rep.Chad 64.0 67.0 63.0 80.1 83.2 23.5Congo, Dem. n.a. n.a. n.a. n.a. 67.8 n.a.
Rep. ofCongo, Rep. of n.a. n.a. n.a. n.a. 48.7 64.5Côte d’Ivoire 36.8 n.a. n.a. n.a. 60.0 43.2Eritrea 53.0 n.a. n.a. n.a. 80.5 18.4Ethiopia 44.2 45.0 37.0 86.3 n.a. 15.2Ghana 31.4 34.3 26.7 70.1 n.a. 35.8Guinea 40.0 n.a. n.a. n.a. 87.2 27.1Kenya 42.0 46.4 29.3 74.8 19.1 32.3Liberia n.a. n.a. n.a. n.a. 72.3 44.3Madagascar 71.3 76.7 52.1 76.5 78.2 28.8Malawi 65.3 66.5 54.9 87.2 n.a. 14.4Mali n.a. n.a. n.a. n.a. 85.8 29.5Mauritania 46.3 61.2 25.4 57.7 55.2 56.3Mozambique 69.4 71.3 62.0 71.1 82.7 30.8Niger 63.0 66.0 52.0 83.7 7.8 20.1Nigeria 34.1 36.4 30.4 60.7 n.a. 43.1Rwanda 51.2 n.a. n.a. n.a. 91.7 6.1Senegal 33.4 40.4 n.a. 64.6 76.7 46.7Sierra Leone n.a. n.a. n.a. n.a. 67.4 35.9Somalia n.a. n.a. n.a. n.a. 75.3 27.1Sudan n.a. n.a. n.a. n.a. 69.5 35.1Tanzania 41.6 49.7 24.4 82.3 n.a. 31.1Togo n.a. n.a. n.a. n.a. 65.5 32.8Uganda 55.0 n.a. n.a. n.a. n.a. 13.8Zambia 72.9 83.1 56.0 68.9 74.7 39.5Zimbabwe 34.9 48.0 7.9 90.0 24.3 34.6
All tropical 48.4 56.2 38.4 76.6 67.5 31.8sub-SaharanAfrica
Source: World Bank (2003a) and authors’ calculations.a. Data are for the most recent year between 1990 and 2001 for which data are available.b. Calculated as rural poverty rate × (100 – urbanization rate)/national poverty rate.
Poverty ratea
2259-02-Sachs.qxd 8/6/04 11:21 Page 148
of the recommended investments, such as improved access to water sup-ply, modern cooking fuels, enhanced transport services, and improved soilnutrients, will have a special benefit for women.
The first area of interventions focuses on raising rural productivity,because three-quarters of Africa’s poor live in rural areas, and an over-whelming percentage are employed in agriculture, as shown in table 9. Inparticular, the investments in farm productivity will increase rural incomesand reduce chronic hunger, which in Africa is predominantly caused byinsufficient agricultural productivity. Additional interventions for roads,power, improved cooking fuels and stoves, and water and sanitation willprovide a basis for higher productive efficiency.
The second area addresses Africa’s extraordinary disease burden, wide-spread micronutrient deficiencies, and extremely high fertility rates byfocusing on health, nutrition, and family planning. This package of inter-ventions includes the medical interventions needed to improve child andmaternal health; prevent the transmission of and provide treatment forHIV/AIDS, tuberculosis, and malaria; improve nutrition; and provide fam-ily planning services. We include an entire package of family planningand reproductive health services, aimed at enabling a significant reductionin Africa’s very high total fertility rates. We believe that access to familyplanning, contraceptive services, girls’ education, women’s empowerment,and off-farm employment opportunities for young women can lead to adramatic reduction in the total fertility rate in just a few years.
The third area of interventions aims for universal completion of primaryeducation. In designing this package of interventions, particular attentionneeds to be paid to increasing girls’ completion rates through additionaldemand-side interventions such as incentive payments to poor householdsto encourage them to keep their daughters in school. We also argue thatsecondary school enrollment needs to be increased, because the returns toeducation now and especially in the future will increasingly depend on sec-ondary education. Moreover, large numbers of secondary school graduateswill be required to help deliver the other MDG intervention packages; forexample, secondary school graduates will be needed as community healthworkers and agricultural extension workers. Targeted adult literacy pro-grams that are designed to raise educational attainment among the adultpopulation will complete the investments in human capital.
The fourth area of interventions addresses challenges specific to urbanareas. Throughout sub-Saharan Africa the large cities have not yet gener-
Sachs, McArthur, Schmidt-Traub, Kruk, Bahadur, Faye, and McCord 149
2259-02-Sachs.qxd 8/6/04 11:21 Page 149
ated internationally competitive manufacturing or service-based indus-tries. In conjunction with abject rural poverty, which fuels rural-urbanmigration, the lack of urban jobs has led to extremely high levels of urbanpoverty, which are rising across much of the continent. An MDG-basedurban strategy focuses on urban infrastructure and services (electricity,transport, water and sanitation, waste disposal, and so forth) and slumupgrading. Successful urban development and the creation of viableexport industries across Africa are contingent on improving access to richcountries’ markets, particularly for apparel and light manufacturing, andthe flexibility to use targeted industrial policies as needed.
The fifth area of interventions focuses on the mobilization of scienceand technology. Currently, tropical sub-Saharan Africa produces roughlytwenty times fewer patents per capita than the average for the rest of thedeveloping world, and the region has only 18 scientists and engineers permillion population, compared with 69 in South Asia, 76 in the MiddleEast, 273 in Latin America, and 903 in East Asia. We stress the need forincreased investment in science advising, higher education, and researchand development targeted at Africa’s specific ecological challenges infood production, disease, nutrition, construction, energy, and other areas.
The sixth area focuses specifically on interventions for achieving gen-der equity that are not included as part of the other intervention areas. Thisincludes ensuring full reproductive health rights and access to services, aswell as the guarantee of equal property rights and access to work, backedup by affirmative action to increase political representation. Of particularconcern in many parts of sub-Saharan Africa are persistently high levelsof violence against women and girls; this violence needs to be confrontedwith legislative and administrative changes.
The seventh area of interventions focuses on regional integration as asine qua non for economic growth. The fifteen of the forty-nine countriesin sub-Saharan Africa that are landlocked have little chance to develop un-less they have ready access to the coast with efficient, low-cost infrastructure.Moreover, from a global perspective, the African countries taken individ-ually are very small markets. Regional integration will raise the interestof potential foreign investors by increasing the scope of the market thataccompanies an operating presence in Africa. Regional integration is alsoimportant in achieving scale economies in infrastructure networks, suchas power grids, large-scale electricity generation, road transport, rails, and
150 Brookings Papers on Economic Activity, 1:2004
2259-02-Sachs.qxd 8/6/04 11:21 Page 150
telecommunications, and in eliciting increased R&D on problems that arespecific to Africa’s ecology but that extend beyond any single country,such as public health, energy systems, and agronomy.
As an overarching matter affecting each of these seven categories ofinterventions, we note that Africa will require large numbers of teachers,nurses, doctors, agricultural extension officers, infrastructure specialists,scientists, and so forth—experts who are in very short supply across thecontinent. Hence each of the seven investment areas relies on a substantialscaling up of specialized human resources. In addition to expanding for-mal higher education, therefore, African countries need to focus on voca-tional training and short-term training courses. Already several countrieshave demonstrated that community health workers or agricultural exten-sion officers who have undergone one-year training courses can producesubstantial improvements in the communities where they work. For exam-ple, Ethiopia is currently training several thousand community health work-ers who will be able to carry out malaria control, offer simple treatment,and help improve households’ hygiene. If extended to other areas, this“barefoot doctor” approach could rapidly improve rural life at moderatecost. An additional advantage from the countries’ perspective is that thesevocationally trained experts are less likely to migrate abroad than theirmore highly trained colleagues.
Specific Interventions to Achieve the MDGs
A full discussion of these proposed interventions is far beyond thescope of this paper but is available from the UN Millennium Project.32
For purposes of illustration we describe here only two categories ofinterventions: investments in rural productivity and in reducing childmortality. Our aim is to show that specific investments exist that couldmake enormous changes in productivity at rather low cost.
increasing rural productivity. As already mentioned, sub-SaharanAfrica is the world’s only major region where food output per capita hasbeen stagnant since 1980.33 Reversing this trend lies at the heart of anystrategy to achieve the MDGs in Africa. One key factor in this stagnationis the declining availability of arable land per capita, which has shrunk
Sachs, McArthur, Schmidt-Traub, Kruk, Bahadur, Faye, and McCord 151
32. UN Millennium Project (2004). 33. World Bank (2003a).
2259-02-Sachs.qxd 8/6/04 11:21 Page 151
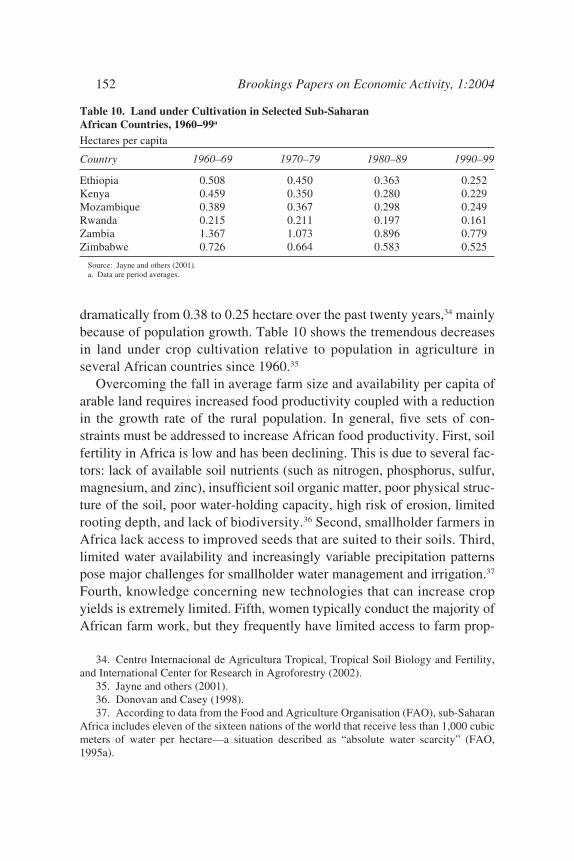
dramatically from 0.38 to 0.25 hectare over the past twenty years,34 mainlybecause of population growth. Table 10 shows the tremendous decreasesin land under crop cultivation relative to population in agriculture inseveral African countries since 1960.35
Overcoming the fall in average farm size and availability per capita ofarable land requires increased food productivity coupled with a reductionin the growth rate of the rural population. In general, five sets of con-straints must be addressed to increase African food productivity. First, soilfertility in Africa is low and has been declining. This is due to several fac-tors: lack of available soil nutrients (such as nitrogen, phosphorus, sulfur,magnesium, and zinc), insufficient soil organic matter, poor physical struc-ture of the soil, poor water-holding capacity, high risk of erosion, limitedrooting depth, and lack of biodiversity.36 Second, smallholder farmers inAfrica lack access to improved seeds that are suited to their soils. Third,limited water availability and increasingly variable precipitation patternspose major challenges for smallholder water management and irrigation.37
Fourth, knowledge concerning new technologies that can increase cropyields is extremely limited. Fifth, women typically conduct the majority ofAfrican farm work, but they frequently have limited access to farm prop-
152 Brookings Papers on Economic Activity, 1:2004
34. Centro Internacional de Agricultura Tropical, Tropical Soil Biology and Fertility,and International Center for Research in Agroforestry (2002).
35. Jayne and others (2001). 36. Donovan and Casey (1998).37. According to data from the Food and Agriculture Organisation (FAO), sub-Saharan
Africa includes eleven of the sixteen nations of the world that receive less than 1,000 cubicmeters of water per hectare—a situation described as “absolute water scarcity” (FAO,1995a).
Table 10. Land under Cultivation in Selected Sub-Saharan African Countries, 1960–99a
Hectares per capita
Country 1960–69 1970–79 1980–89 1990–99
Ethiopia 0.508 0.450 0.363 0.252Kenya 0.459 0.350 0.280 0.229Mozambique 0.389 0.367 0.298 0.249Rwanda 0.215 0.211 0.197 0.161Zambia 1.367 1.073 0.896 0.779Zimbabwe 0.726 0.664 0.583 0.525
Source: Jayne and others (2001).a. Data are period averages.
2259-02-Sachs.qxd 8/6/04 11:21 Page 152
erty rights, face barriers to generating and controlling their own incomes,and have limited access to improved agricultural technologies.
These constraints on raising rural productivity can be overcomethrough a series of well-targeted interventions. Soil nutrient deficienciescan be addressed through chemical fertilizers that help to increase cropyields and through agroforestry techniques that use nitrogen-fixingtrees.38 One approach is to interplant such trees in young maize fields andallow them to grow as fallows during dry seasons, accumulating 100 to200 kilograms of nitrogen per hectare in six months to two years. In thesubhumid regions of eastern and southern Africa, this technology candouble or more the yields of maize, a staple crop.39 It can be supple-mented with investments in improved seeds adapted to African farmingenvironments. Suitable seeds can raise yields, reduce the time to harvest,improve germination, reduce labor requirements, reduce vulnerability todiseases, and improve cooking, processing, and storage qualities.
To improve crop irrigation in the arid and subhumid regions wheremost Africans live, it is generally acknowledged that small-scale andtechnically simple water management systems are most appropriatebecause of their low cost and ease of operation and maintenance. Optionsinclude water harvesting through the use of embankments, check damsand small impoundment dams, shallow wells, drip irrigation, and treadleor diesel pumps. Experience in Burkina Faso, Kenya, and Sudan showsthat rain harvested from one hectare for supplementary irrigation ofanother can triple or even quadruple production.40
These physical interventions need to be augmented by agricultural exten-sion services that provide farmers with technical support and training.41
Although debate continues over the most appropriate model for extensionservices, there is consensus on the need for increased human resourcesand research programs, and particularly on the need to improve the tech-nical qualifications of extension workers.42
Sachs, McArthur, Schmidt-Traub, Kruk, Bahadur, Faye, and McCord 153
38. Such trees include leguminous trees of the genera Sesbania, Tephrosia, Crotalaria,and Glyricidia.
39. Sanchez (2002). 40. FAO (1996). 41. Birkhaeuser, Evenson, and Feder (1991). 42. Sasakawa Africa Association (2000). The Green Revolution relied mainly on the
training and visitation (T&V) model, whereby extension served as a transmission beltbetween research centers and farmers through cadres of field-based, professional trainers.However, this model had its limitations, including poor linkages of the research undertaken
2259-02-Sachs.qxd 8/6/04 11:21 Page 153
A central theme throughout the rural productivity strategy is the need forspecial attention to the critical role that women play in African agriculture.Africa’s women contribute 60 to 80 percent of the labor used to producefood both for household consumption and for sale, yet they face enormouscultural and legal inequities.43 Special interventions are needed to reachthem through extension services and to provide them with access to tech-nologies and skills that they can use to reduce the time spent in the fieldand increase production. Christopher Udry, John Hoddinott, and LawrenceHaddad show that merely allocating factors of production evenly acrossplots controlled by women and men could increase plot output by 10 to 15percent.44
Interventions outside the formal agricultural sector are also crucial forfarm productivity. Not surprisingly, education is important. The Inter-national Food Policy Research Institute (IFPRI) estimates, for example,that an extra year of primary education provided to women farmers inKenya would increase maize yields by 24 percent.45 Transport infra-structure and services are also critical, since well-maintained feeder,district, and national roads are crucial in order to bring products to mar-kets and to lower the costs of agricultural inputs, such as fertilizer andimproved seeds. In one indication of the severity of rural farmer isola-tion, John Hine and John Rutter estimate that, for 51 percent of villages inGhana and 60 percent of villages in Malawi, the walking distance to thenearest pickup point for motorized transport services was more than2 kilometers; it was over 10 kilometers for 10 percent of Ghanaian vil-lages and 19 percent of Malawian villages.46 D. S. Spencer calculatesthat, for tropical Africa to reach a road density (measured in kilometersof roads per square kilometer of land) equivalent to that of India at the
154 Brookings Papers on Economic Activity, 1:2004
with the needs of small farmers, inability to adapt to local conditions, and inadequate prac-tical knowledge on the part of the trainers; all of these shortcomings were compounded bybudgetary constraints and lack of long-term fiscal support. Increasingly, hybrid solutionshave been proposed that combine the best of the T&V model with principles of demand-driven and farmer-led knowledge creation and management systems. However, basic prin-ciples of increased investment in hiring and training extension workers (especially womenworkers to reach women farmers), close links to research, and continual and timely trainingremain critical.
43. FAO (1995b). 44. Udry, Hoddinott, and Haddad (1995). 45. IFPRI (2000). 46. Hine and Rutter (2000).
2259-02-Sachs.qxd 8/6/04 11:21 Page 154
onset of the Green Revolution in 1950, the length of the road networkwould have to be increased by a factor of six.47
Often forgotten in the rural productivity equation are modern energyservices, and in particular safe thermal energy for cooking as well as elec-tricity for illumination, water pumps, and refrigeration. In addition to pro-viding health benefits through reduced indoor air pollution, improvedcooking stoves and fuels help to preserve biomass and dung for use as fer-tilizer. Subsidized access to safe fuel sources such as liquid petroleum gasalso allows women to spend less time collecting biomass fuel and cookingand more time tending to farm production and opportunities to generateprivate income.
reducing child mortality. Table 1 showed how child mortalityrates in Africa are by far the worst in the world; a total of 4 millionAfrican children under five die each year. Remarkably, five conditionsaccount for approximately 95 percent of these fatalities: one quarter resultfrom neonatal disorders (infections, birth asphyxia and injuries, and com-plications of prematurity) that occur in the first twenty-eight days of life;22 percent from malaria; 21 percent from pneumonia; 20 percent fromdiarrheal diseases; and 8 percent from HIV/AIDS.48 Although these esti-mates are imprecise because of the difficulty of attributing cause of deathand the dubious quality of the underlying data, the basic message is thatcontrolling a limited number of preventable and treatable conditions couldbring about a dramatic reduction in child mortality.
Underlying these proximate causes of death are contributing factorsthat render children susceptible. Malnutrition, for example, is a contribut-ing factor in at least half of all child deaths,49 because malnourished chil-dren cannot resist common infections as readily as adequately nourishedchildren and, when infected, have a much higher risk of complications anddeath. Even mildly underweight children are estimated to have a two-fold higher risk of death than those that are adequately nourished.50 Mean-while, poor indoor air quality and lack of access to drinking water andsanitation predispose children to pneumonia and diarrhea.
Because the causes of child death are both direct and indirect, inter-ventions focused on saving children’s lives need to both treat children
Sachs, McArthur, Schmidt-Traub, Kruk, Bahadur, Faye, and McCord 155
47. Spencer (1994). 48. Black, Morris, and Bryce (2003). 49. Black, Morris, and Bryce (2003). 50. Black, Morris, and Bryce (2003).
2259-02-Sachs.qxd 8/6/04 11:21 Page 155
who are sick and prevent children from becoming sick. Treatment inter-ventions typically fall within the realm of the formal health sector, but pre-ventive interventions necessarily span other sectors as well. Prominentamong health sector interventions to improve child health outcomes is anintegrated neonatal package that includes clean delivery, newborn resus-citation, prevention of hypothermia, antibiotics for infection, tetanus tox-oid, breastfeeding education, and community hygiene education.51 Such apackage may reduce neonatal mortality by up to 60 percent.52 Immuniza-tions are another simple intervention with well-documented benefits inthe early stages of life: vaccinations against major diseases such as polio,diphtheria, pertussis, tetanus, measles, hepatitis B, and yellow fever haveall been shown to reduce child mortality. Immunizing all children againstmeasles alone could save 2.3 million children in Africa within the currentdecade.53
For children beyond infancy, a broad set of interventions has been estab-lished under the UNICEF-WHO protocol known as the Integrated Manage-ment of Childhood Illness (IMCI). This includes a series of preventive andcurative interventions that enable health workers to treat symptoms thatcould have multiple underlying causes. Specific IMCI interventions includeinsecticide-treated nets (ITNs) to prevent malaria; complementary feed-ing;54 vaccinations; micronutrient supplementation; case management ofacute respiratory infections, diarrhea, measles, malaria, and malnutrition;treatment with iron; and antihelminthic treatment.55 This protocol has beenapplied successfully in dozens of developing countries. For example, earlyresults from Tanzania show a significantly reduced hospital admissionrate for children in IMCI districts.56
Interventions to prevent and treat malaria are part of IMCI but deservespecial elaboration in the African context. On the prevention side, ITNsprovide both a physical and a chemical barrier to the mosquitoes thattransmit malaria, with benefits extending beyond the individual user as
156 Brookings Papers on Economic Activity, 1:2004
51. Marsh and others (2002). 52. Bang and others (1999). 53. World Health Organization, United Nations Children’s Fund, and Global Alliance
for Vaccines and Immunizations (2003). 54. Complementary feeding involves adding solid foods to the diet of breastfed infants
over six months of age to prevent nutritional deficiencies.55. The IMCI protocol is available at World Health Organization (2001).56. Armstrong Schellenberg and others (2004).
2259-02-Sachs.qxd 8/6/04 11:21 Page 156
the chemical halo emitted by the net repels and shortens the lives of mos-quitoes in the vicinity. The impact of comprehensive ITN programs canbe substantial. A review evaluating twenty-two trials concluded thatapproximately 6 lives could be saved for every 1,000 children protectedwith ITNs.57 In Tanzania, C. A. Maxwell and colleagues found that ITNswere linked to 55 to 75 percent reductions in malarial morbidity forchildren aged six months to two years.58 On the treatment side, the recentrise in malarial resistance to chloroquine and sulfadoxine-pyrimethaminein Africa has accelerated the need to make the transition to more effec-tive therapies such as artemisinin-based combination treatment.59 Thistreatment can enhance clinical efficacy and delay the development ofresistance.60
Of course, interventions outside of the formal health sector are alsocrucial for reducing child mortality, as described in appendix B. Targetednutritional interventions can help enormously. For example, a UN studydemonstrated that vitamin A supplementation resulted in a 23 percentaverage reduction in mortality rates among infants and children betweensix months and five years old.61 Substituting clean cooking fuels fordomestic biomass fuels has been estimated to reduce acute respiratoryinfections in several developing countries by approximately 30 percent.62
D. Leipziger and colleagues, in a study of forty-three developing coun-tries, estimated that improved access to water explains 37 percent of thedifference in child mortality between the poorest and richest quintileswithin countries.63 Simple hand washing with soap and water reducesshigella and diarrheal disease transmission by 35 percent.64
Maternal education similarly contributes to child health. Each addi-tional year of a mother’s education corresponds to an estimated 7 to 9 per-cent decline in her under-five child’s mortality risk, although the precise
Sachs, McArthur, Schmidt-Traub, Kruk, Bahadur, Faye, and McCord 157
57. Lengeler (2004).58. Maxwell and others (2002). 59. World Health Organization and United Nations Children’s Fund (2003). 60. World Health Organization (2001). 61. Beaton and others (1993). 62. Reductions in the range of 21 to 44 percent were found for acute lower respiratory
infections and 24 to 64 percent for all acute respiratory infections (Ezzati and Kammen,2002).
63. Leipziger and others (2003). 64. Kotloff and others (1999); Khan (1982).
2259-02-Sachs.qxd 8/6/04 11:21 Page 157
mechanisms of this relationship are not yet entirely clear.65 Access to con-traception can also have a strong impact on child mortality rates.
These interventions must be provided in an integrated manner, but onemust be careful not to think of their effects as purely additive. A criticallesson from past experience with development programs in the health sec-tor is that successful scale-up and utilization of a broad range of disease-specific health interventions requires a functioning health system, includingan adequate complement of health workers; good management capacityfor supervision and oversight; ongoing monitoring, evaluation, and qual-ity assurance; and sustained outreach and education for communities,among other features.
In a prominent recent study, G. Jones and colleagues evaluated theimpact of a broad set of health sector and non-health sector interventionson child survival and concluded that 63 percent of annual child deathscould be prevented by providing universal (defined as 99 percent) accessto an integrated set of interventions.66 Although these authors did notevaluate the role of a full health management system, they did includepreventive medical interventions (such as immunization, micronutrientsupplementation, and clean delivery), curative interventions (such as oralrehydration therapy through salt tablets, antibiotics for pneumonia andsepsis, and antimalarial medications), promotion of breastfeeding, ITNs,complementary feeding, and improved access to water, sanitation, andhygiene education.67
MDG Needs Assessments for Ghana, Tanzania, and Uganda
To be aligned with the MDGs, the full intervention package outlined inappendix A must be converted into a country-level investment plan, onethat works backward from the outcome targets to identify needed inputtargets and then identifies infrastructure, human, and financial resourcerequirements to meet the targets. We dub this a “needs assessment”
158 Brookings Papers on Economic Activity, 1:2004
65. Cleland and Van Ginneken (1988). 66. Jones and others (2003). 67. Importantly, Jones and others (2003) point out that their estimate of lives saved
through known interventions may be conservative, since they evaluate only those interven-tions for which good cause-and-effect evidence exists and that are “feasible” for develop-ing countries to implement (for example, they exclude emergency obstetric care). They donot assess other underlying factors, such as maternal education, that have a strong althoughindirect impact on child survival.
2259-02-Sachs.qxd 8/6/04 11:21 Page 158
approach to the MDGs.68 Here we estimate the costs of interventions forthree countries: Ghana, Tanzania, and Uganda. We chose these coun-tries because all have high rates of extreme poverty, are making insuffi-cient progress toward achieving the MDGs, and are well governed fortheir level of income per capita, as indicated by their “good” and “aver-age” governance ratings in table 2. These are countries where governanceis not the binding constraint.
To highlight the extent of poverty in Ghana, Tanzania, and Uganda,table 11 summarizes available data for some key MDG indicators. Althoughthe underlying data are often imprecise and incomplete (a reflection of theextreme poverty in these countries), they highlight each country’s unevenprogress across the MDGs. Persistently high rates of hunger and childmortality are particularly notable. Indeed, the fact that Ghana’s child mor-tality rate of 100 per 1,000 live births in 2001 is the lowest in the groupreflects how extreme poverty is in these countries. Human capital accu-mulation meanwhile remains slow in Ghana and Tanzania in particular,as reflected in their low primary enrollment rates, and more than a thirdof the population in all three countries was living on less than $1 a day inthe latest available surveys.
To meet the MDGs systematically in each of these countries, we assumethat the interventions are scaled up linearly through 2015. As much aspossible, the intervention package is also adjusted according to the ageand gender structure of the population and to the rural-urban divide. Toaccount for population growth and other changes in a country’s demo-graphic profile, the UN Population Division’s 2002 revision of mediumpopulation forecasts is used.69 Where more recent population data areavailable at the country level, we use those.
For each intervention, such as the provision of ITNs or the hiring ofnew teachers, we specify quantitative input targets that are consistent withthe MDGs. We then translate the interventions into budget lines, estimat-ing financial costs per year. We use local unit costs wherever possible andregional proxies where these are not available. In some cases, unit costsare assumed to increase as coverage rates increase. For example, teachers’
Sachs, McArthur, Schmidt-Traub, Kruk, Bahadur, Faye, and McCord 159
68. The UN Millennium Project needs assessment (UN Millennium Project, 2004)draws on several works including Bruns, Mingat, and Rakotomalala (2003), World Bank(2002), Delamonica, Mehrotra, and Vandermoortele (2001), FAO (2002), Commission onMacroeconomics and Health (2001), and Global Water Partnership (2000).
69. United Nations (2003).
2259-02-Sachs.qxd 8/6/04 11:21 Page 159
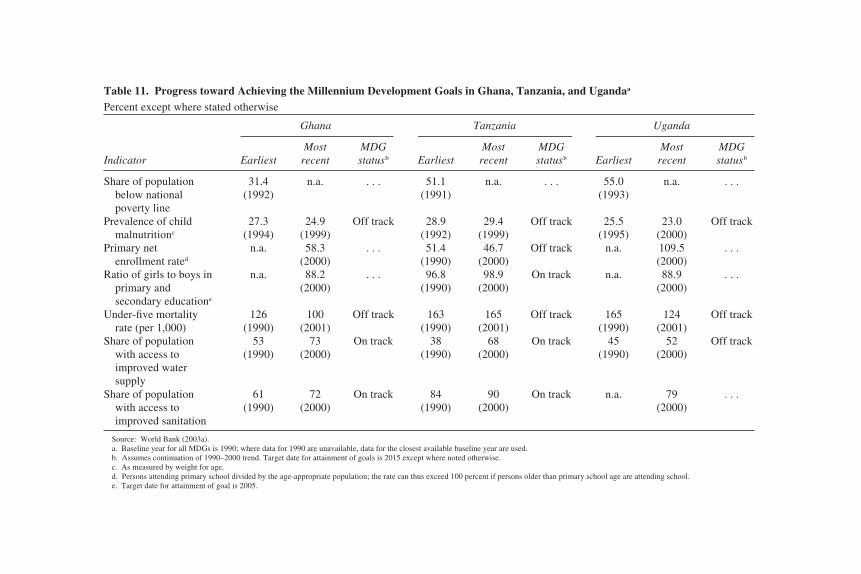
Table 11. Progress toward Achieving the Millennium Development Goals in Ghana, Tanzania, and Ugandaa
Percent except where stated otherwise
Ghana Tanzania Uganda
Most MDG Most MDG Most MDGIndicator Earliest recent statusb Earliest recent statusb Earliest recent statusb
Share of population 31.4 n.a. . . . 51.1 n.a. . . . 55.0 n.a. . . .below national (1992) (1991) (1993)poverty line
Prevalence of child 27.3 24.9 Off track 28.9 29.4 Off track 25.5 23.0 Off trackmalnutritionc (1994) (1999) (1992) (1999) (1995) (2000)
Primary net n.a. 58.3 . . . 51.4 46.7 Off track n.a. 109.5 . . .enrollment rated (2000) (1990) (2000) (2000)
Ratio of girls to boys in n.a. 88.2 . . . 96.8 98.9 On track n.a. 88.9 . . .primary and (2000) (1990) (2000) (2000)secondary educatione
Under-five mortality 126 100 Off track 163 165 Off track 165 124 Off trackrate (per 1,000) (1990) (2001) (1990) (2001) (1990) (2001)
Share of population 53 73 On track 38 68 On track 45 52 Off trackwith access to (1990) (2000) (1990) (2000) (1990) (2000)improved water supply
Share of population 61 72 On track 84 90 On track n.a. 79 . . .with access to (1990) (2000) (1990) (2000) (2000)improved sanitation
Source: World Bank (2003a).a. Baseline year for all MDGs is 1990; where data for 1990 are unavailable, data for the closest available baseline year are used. b. Assumes continuation of 1990–2000 trend. Target date for attainment of goals is 2015 except where noted otherwise.c. As measured by weight for age.d. Persons attending primary school divided by the age-appropriate population; the rate can thus exceed 100 percent if persons older than primary school age are attending school. e. Target date for attainment of goal is 2005.
2259-02-Sachs.qxd 8
/6/04 1
1:21 P
age 160
salaries are increased to improve retention rates. Importantly, we estimatecapital as well as operating costs, and total costs instead of incrementalcosts. This implicitly assumes that all investments and service deliveriesfollow best practice, regardless of current efficacy of delivery, yielding adownward bias in our cost estimates. Since the marginal costs of a majorscale-up are unknown—they could be increasing or decreasing whenmaking investments in rural communities—we use average unit costs.
Next we identify key interventions that, upon implementation, wouldreduce resource requirements for other interventions. The resulting cost sav-ings can occur through reductions in the population in need or reductions inunit costs for other interventions. Quantifying these links is often difficult,especially for the interventions that have numerous indirect effects, such asgirls’ education. And even where clear data exist, the magnitude of theimpact may not be known for different settings or for different deliverymechanisms. Nonetheless, our estimates include the effect of several syner-gies that are likely to result in particularly large cost savings. These are areduction in diarrhea morbidity through expanded access to improved watersupply and sanitation, including improved hygiene behavior; a reduction inacute respiratory infections through increased use of improved cookingfuels; a reduction in HIV/AIDS incidence through increased condom use;and a reduction in malaria incidence through increased use of ITNs.
As a last step in the needs assessment, we develop a basic financingstrategy for each country, distinguishing among domestic governmentresources, out-of-pocket household expenditure, and ODA. We assumethat domestically financed government spending on MDG-related inter-ventions will rise by 4 percentage points of GDP between 2005 and 2015,in addition to the increase in domestic resource availability resulting fromGDP growth alone. We also assume that, as a result of this package ofinterventions, GDP per capita rises between 2.2 and 3.3 percent a year onaverage during 2005–15, which is approximately the growth rate neededto reduce income poverty by half at an average elasticity of headcountpoverty with respect to income per capita of −1.4.70
Sachs, McArthur, Schmidt-Traub, Kruk, Bahadur, Faye, and McCord 161
70. Several studies have estimated these elasticities for low-income countries. Bruno,Ravallion, and Squire (1998) estimate a global average of –2, whereas Besley and Burgess(2003) cite a low value of –0.49 for sub-Saharan Africa. In the case of Uganda, theEconomic Policy Research Center estimates a value of –1.39 (Okidi, Okwi, and Ddumba,2000); Tanzania’s elasticity for basic needs poverty has been estimated at –1.45(TAKWIMU, 2000).
2259-02-Sachs.qxd 8/6/04 11:21 Page 161
Household contributions are estimated based on the incentive effectsof user fees and overall ability to pay. Since user fees can play a criticalrole in preventing poor people from accessing basic services, we assumeno user fees for primary school education, adult literacy programs,improving gender equality, basic health care, nutritional interventions,and roads.71 In some cases, however, user fees may be necessary to avoidwasting scarce resources after basic minimum needs have been ensured.“Lifeline tariffs,” which ensure the free provision of water (or other basicneeds) up to the minimum daily requirement for personal hygiene andcooking, but then charge for consumption above the minimum, have beenused successfully in many parts of the world to avoid wastage whileimproving access to clean drinking water. We assume that householdsbear some of the cost of agricultural interventions, secondary school edu-cation, energy provision, water supply, and sanitation. To calculatehouseholds’ ability to pay, we divide the population of each country intothree segments using income shares derived from national household bud-get surveys as reported by the World Bank.72 It is assumed that the poor-est segment of the population, that living below the national poverty line,will not contribute to the cost of meeting the MDGs. The middle segmentand the top segment (with income above twice the poverty line) areassumed to contribute larger shares of operating and capital costs.73
A core result of our needs assessment is that the investment programrequired to meet the MDGs is beyond the financing means of the poorestcountries, even when one assumes that governments will devote an addi-tional 4 percent of GNP to meeting the MDGs alongside roughly 3 per-cent annual growth in income per capita and that households contribute tothe increased investments. We estimate an “MDG financing gap” as thetotal cost of the package of interventions minus the contributions by the
162 Brookings Papers on Economic Activity, 1:2004
71. “Experience has taught repeatedly that user fees end up excluding the poor fromessential health services, while at the same time recovering only a tiny fraction of costs”(Commission on Macroeconomics and Health, 2001, p. 61). Even modest user fees havebeen shown to have a strong impact on reducing effective access to these basic services,particularly for women, young girls, and other vulnerable groups. See World EducationForum (2000). The Education for All Dakar Goal 2 reads as follows: “Ensuring that by2015 all children, particularly girls, children in difficult circumstances, and those belongingto ethnic minorities, have access to and complete free and compulsory primary education ofgood quality” (available at www.unesco.org/education/efa/ed_for_all/dakfram_eng.shtml).
72. World Bank (2003a).73. Details are outlined in UN Millennium Project (2004).
2259-02-Sachs.qxd 8/6/04 11:21 Page 162
domestic government and households. This is the amount that donorswould have to bear in order to finance the MDG intervention package.Table 12 presents the total estimated resource requirements for the threecountries, based on an eleven-year scale-up period from 2005 through2015. The results suggest that each of the three countries will be able tofinance between 41 and 48 percent of the total investment needs throughdomestic sources. This translates into an average total need for externaldevelopment assistance equivalent to $47 (for Uganda) to $60 (for Tanza-nia) per capita per year. Points of interest for each country are drawn fromthe UN Millennium Project and summarized below:74
—Ghana’s total investment needs for meeting the MDGs aver-age $2.0 billion a year, or $82.8 annually per capita. Of this total, $1.2 billion is estimated for required average annual external assistance.This need remains significantly above the $653 million in net ODA thatdonors disbursed to Ghana in 2001 for MDG- and non-MDG-relatedactivities.
—Of the three countries in our sample, Tanzania faces the biggestchallenges in meeting the MDGs. We estimate that the country willrequire the highest per capita levels of average investment and externalfinance to meet the MDGs, at $100.4 and $60.2, respectively. These fig-ures are equivalent to an aggregate investment of $4.2 billion a year andimply external finance of $2.5 billion a year. More than a third of theseinvestments are required to achieve the health MDGs, because of thecountry’s high prevalence of HIV/AIDS and malaria.
—Uganda is widely lauded for its progress in education and its HIV/AIDS control program over the past decade. However, the country stillremains off track in several areas, including hunger, health, and water.We project that the country will need to spend an average of $3.0 billiona year to meet the MDGs, or $89.7 per capita. More than half of theseinvestments will need to be financed externally, requiring an average of $1.6 billion, or $46.7 per capita, annually. An important gap in ourUganda study is an estimate of the transport and communications infra-structure required to provide the landlocked country with improved ac-cess to world markets. The Northern Corridor highway to Mombasa,Kenya, is in critical need of upgrading, as is the rail infrastructure.
Sachs, McArthur, Schmidt-Traub, Kruk, Bahadur, Faye, and McCord 163
74. UN Millennium Project (2004).
2259-02-Sachs.qxd 8/6/04 11:21 Page 163
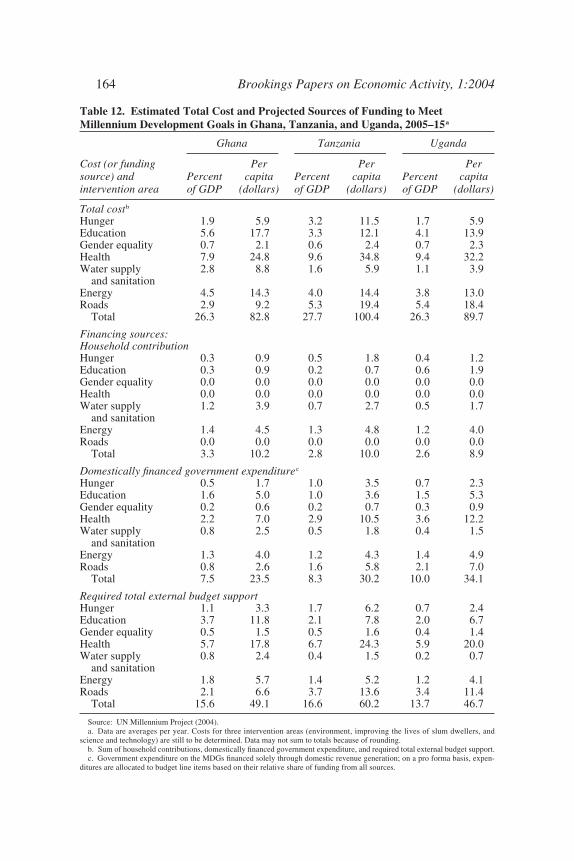
164 Brookings Papers on Economic Activity, 1:2004
Table 12. Estimated Total Cost and Projected Sources of Funding to MeetMillennium Development Goals in Ghana, Tanzania, and Uganda, 2005–15a
Ghana Tanzania Uganda
Cost (or funding Per Per Persource) and Percent capita Percent capita Percent capitaintervention area of GDP (dollars) of GDP (dollars) of GDP (dollars)
Total costb
Hunger 1.9 5.9 3.2 11.5 1.7 5.9Education 5.6 17.7 3.3 12.1 4.1 13.9Gender equality 0.7 2.1 0.6 2.4 0.7 2.3Health 7.9 24.8 9.6 34.8 9.4 32.2Water supply 2.8 8.8 1.6 5.9 1.1 3.9
and sanitationEnergy 4.5 14.3 4.0 14.4 3.8 13.0Roads 2.9 9.2 5.3 19.4 5.4 18.4
Total 26.3 82.8 27.7 100.4 26.3 89.7
Financing sources:Household contributionHunger 0.3 0.9 0.5 1.8 0.4 1.2Education 0.3 0.9 0.2 0.7 0.6 1.9Gender equality 0.0 0.0 0.0 0.0 0.0 0.0Health 0.0 0.0 0.0 0.0 0.0 0.0Water supply 1.2 3.9 0.7 2.7 0.5 1.7
and sanitationEnergy 1.4 4.5 1.3 4.8 1.2 4.0Roads 0.0 0.0 0.0 0.0 0.0 0.0
Total 3.3 10.2 2.8 10.0 2.6 8.9
Domestically financed government expenditurec
Hunger 0.5 1.7 1.0 3.5 0.7 2.3Education 1.6 5.0 1.0 3.6 1.5 5.3Gender equality 0.2 0.6 0.2 0.7 0.3 0.9Health 2.2 7.0 2.9 10.5 3.6 12.2Water supply 0.8 2.5 0.5 1.8 0.4 1.5
and sanitationEnergy 1.3 4.0 1.2 4.3 1.4 4.9Roads 0.8 2.6 1.6 5.8 2.1 7.0
Total 7.5 23.5 8.3 30.2 10.0 34.1
Required total external budget supportHunger 1.1 3.3 1.7 6.2 0.7 2.4Education 3.7 11.8 2.1 7.8 2.0 6.7Gender equality 0.5 1.5 0.5 1.6 0.4 1.4Health 5.7 17.8 6.7 24.3 5.9 20.0Water supply 0.8 2.4 0.4 1.5 0.2 0.7
and sanitationEnergy 1.8 5.7 1.4 5.2 1.2 4.1Roads 2.1 6.6 3.7 13.6 3.4 11.4
Total 15.6 49.1 16.6 60.2 13.7 46.7
Source: UN Millennium Project (2004).a. Data are averages per year. Costs for three intervention areas (environment, improving the lives of slum dwellers, and
science and technology) are still to be determined. Data may not sum to totals because of rounding.b. Sum of household contributions, domestically financed government expenditure, and required total external budget support. c. Government expenditure on the MDGs financed solely through domestic revenue generation; on a pro forma basis, expen-
ditures are allocated to budget line items based on their relative share of funding from all sources.
2259-02-Sachs.qxd 8/6/04 11:21 Page 164
In addition to estimating the costs of meeting the MDGs, the bottom-up needs assessments yield detailed estimates of each country’s human re-source and infrastructure requirements. For example, our analysis suggeststhat Tanzania will need to increase the number of primary and secondaryschool teachers from approximately 134,000 in 2005 to 215,000 in 2015.
We emphasize that these results are preliminary and likely to underes-timate the true costs of achieving the MDGs in each country, since theyassume an optimal intervention package and exclude a number of expen-sive interventions, such as ports, railroads, infrastructure for water storageand transport, urban infrastructure and slum upgrading, expanding highereducation, and information and communications technologies.75 The esti-mates nonetheless provide an important first approximation of the combi-nation of resources and inputs required to achieve the MDGs.
Implications for Development Assistance
The external financing requirements presented in table 12 are not totalODA needs. Table 12 includes only MDG-oriented investments and ex-cludes programs that are not directly linked to the MDGs but that mightbe indirectly important, such as support for the judicial system or otherinstitutions that underpin democratic governance. To calculate the threecountries’ total ODA needs, one needs to add other important forms ofODA to directly MDG-focused ODA. One can then identify the totalincremental ODA need for each country.
Table 13 presents estimated current ODA and incremental total ODAneeds for Ghana, Tanzania, and Uganda. The first column shows aid lev-els per capita in 2001. The second indicates the estimated share of thatODA that is focused on MDG-related activities other than those address-ing income poverty, using a decomposition accounting methodologydeveloped by Brian Hammond of the OECD Development AssistanceCommittee (DAC). The actual results produced through that methodologywere in the range of 33 to 59 percent, but because it is difficult to allocateaid flows precisely to each MDG, and because poor aid quality (for exam-ple, due to lack of donor coordination) often limits resource efficacy, weassume a figure toward the low side of that range, namely, 40 percent. Thethird column of the table reports the estimate of non-MDG aid per capita.
Sachs, McArthur, Schmidt-Traub, Kruk, Bahadur, Faye, and McCord 165
75. Appendix A lists all the interventions that have so far not been included in theneeds assessment.
2259-02-Sachs.qxd 8/6/04 11:21 Page 165
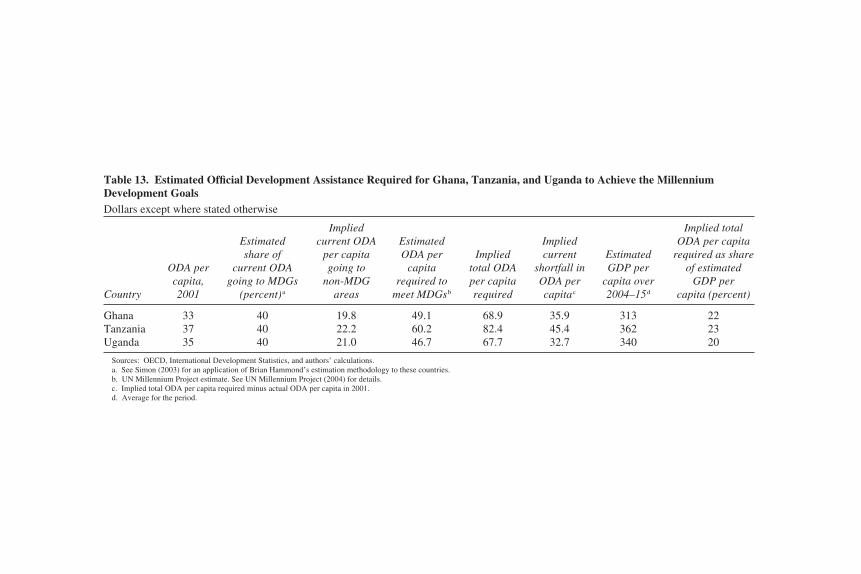
Table 13. Estimated Official Development Assistance Required for Ghana, Tanzania, and Uganda to Achieve the MillenniumDevelopment GoalsDollars except where stated otherwise
Implied Implied totalEstimated current ODA Estimated Implied ODA per capitashare of per capita ODA per Implied current Estimated required as share
ODA per current ODA going to capita total ODA shortfall in GDP per of estimatedcapita, going to MDGs non-MDG required to per capita ODA per capita over GDP per
Country 2001 (percent)a areas meet MDGsb required capitac 2004–15d capita (percent)
Ghana 33 40 19.8 49.1 68.9 35.9 313 22Tanzania 37 40 22.2 60.2 82.4 45.4 362 23Uganda 35 40 21.0 46.7 67.7 32.7 340 20
Sources: OECD, International Development Statistics, and authors’ calculations. a. See Simon (2003) for an application of Brian Hammond’s estimation methodology to these countries.b. UN Millennium Project estimate. See UN Millennium Project (2004) for details.c. Implied total ODA per capita required minus actual ODA per capita in 2001.d. Average for the period.
2259-02-Sachs.qxd 8
/6/04 1
1:21 P
age 166
We assume perfect donor delivery mechanisms and so do not distinguishbetween currently efficient and inefficient aid dollars. This biases upwardthe estimate of current MDG-related aid and biases downward the impliedaid gap. The fourth column of the table repeats from table 12 the esti-mated total external finance gaps per capita. The fifth column thenassumes that current non-MDG aid spending will remain constant asMDG-based investments are scaled up, so that the total ODA need percapita is the sum of MDG-targeted ODA and complementary ODA. Thesixth column presents the implied shortfall in ODA per capita, indicatingthat roughly a doubling of ODA is needed in each country.
The seventh column of table 13 then presents the average GDP percapita that is assumed by our financing model, which in turn is used tocalculate the final column, total ODA required as a share of GDP in eachcountry. The results, which range from 20 to 23 percent of GDP, present alower bound for estimates of the aid required for these three countries toachieve the MDGs. These are lower bounds because the costing modelexcludes several “big ticket” items listed above and neglects the inherentoverhead costs of managing aid delivery, which are likely in the neigh-borhood of 15 to 20 percent of total aid, or 3 to 4 percentage points ofGDP. Overall, the results thus suggest that these countries will requireaverage ODA equivalent to 20 to 30 percent of GDP through 2015.
A New Framework for Donor-Recipient Country Relations
The package of public investments proposed in this paper implies asignificant increase in ODA transfers to Africa, perhaps a doubling ormore. Many will read this as an excessively bold proposal, because skep-ticism is widespread among policymakers and voters regarding the effi-ciency and level of coordination in aid delivery. Although there is muchevidence that aid works, it is true that, even in well-governed developingcountries, a lack of coordination and goal orientation leave the currentsystem far from adequate to the task. Nonetheless, the pieces of the solu-tion are now coming together. For instance, there is broad conceptualagreement on the need to focus on poverty as an outcome rather than onmacroeconomic stability alone. Likewise there is recognition of the needto provide development assistance through common financing arrange-ments that harmonize donor practices and allow recipient countries to
Sachs, McArthur, Schmidt-Traub, Kruk, Bahadur, Faye, and McCord 167
2259-02-Sachs.qxd 8/6/04 11:21 Page 167
define their own Poverty Reduction Strategies (PRSs).76 In what followswe sketch the kind of donor-recipient mechanisms that will be needed totranslate large-scale aid flows into effective investments and povertyreduction under conditions of good governance, as well as some thoughtson situations where governance is inadequate to justify large-scale aidflows.
Guidelines for Converting Goals into Plans in Well-Governed Countries
To meet the MDGs in cases where domestic governance is adequate (thatis, at or above the norm for countries at the given income level), aid pro-cesses should be guided by four core principles. First, policies should bealigned with the 2015 time horizon, with that MDG target date serving asthe planning horizon for both recipient countries and donors. Given adecade-long horizon, developing countries can address key questions ofabsorptive capacity by investing in human resources and infrastructure.The international adoption of a 2015-based planning horizon would amountto an enormous shift in development policy, because today’s primary vehi-cles for development assistance in Africa, the Poverty Reduction StrategyPapers (PRSPs) and Medium-Term Expenditure Frameworks, adopt amuch shorter horizon, usually three years. Within such a short-term view,today’s absorptive capacity constraints are seen as fundamental impedi-ments rather than as targets of opportunity for public investment, espe-cially in human resources and managerial capacity.
Second, the public investment program needs to be guided by bottom-up assessments of needs rather than ex ante budget constraints set by thedonor countries. In development policy as practiced today, the first pointof discussion is to identify the external resources available to a countryand then to decide how those resources can best be deployed. Crucially,we recommend that this process be turned on its head. The first step wouldbe to undertake a real needs assessment methodology along the lines ofthat presented in this paper. The second would be to mobilize the neces-sary external resources. This differs from current practice in that the PRSPsare the core development assistance framework for Africa, yet the WorldBank’s own assessment shows that these documents are not consistently
168 Brookings Papers on Economic Activity, 1:2004
76. This was reaffirmed in the 2002 Monterrey Consensus and subsequently in theRome Declaration on Harmonization.
2259-02-Sachs.qxd 8/6/04 11:21 Page 168
aligned with the MDGs.77 This happens because, in the typical case whereexisting development assistance flows are insufficient to achieve the MDGs,developing country governments are encouraged not to be too ambitiousin aspiring to the MDGs but instead to be “realistic” in their targets. Theyare encouraged to “accelerate progress toward the MDGs” rather than toachieve the MDGs.78
A related and perhaps deeper problem within the current approach togoal setting is that targets in many PRSPs have been based solely on looseaspirations rather than on a rigorous assessment of the real investmentneeded to achieve the targets. According to the World Bank’s own PRSPsourcebook, “[PRSP] targets tend to be too optimistic, and the cost ofreaching them tends to be underestimated.”79 A rigorous MDG-orientedprocess must therefore include not just outcome goals, but also specificpaths that will lead to those goals, with clear and monitorable input tar-gets, including adequate financing.
Third, donor assistance needs to be harmonized and coordinatedaround budget support, particularly in countries like Ghana, Uganda, andTanzania where governance structures are not the binding constraint onaccelerating progress toward achieving the MDGs. Uncoordinated andsupply-driven development assistance from the twenty-three bilateraldonors that are members of the DAC places unnecessary transactions costburdens on recipient country governments. The tendency for bilateraldonors to go their own way in providing project support is known as“planting the flag,” because the donor country gets political credit and agood photo opportunity for its aid. We strongly urge a less photogenic butmore meaningful approach, in which donors combine their resources intoa common pool of budgetary support. A convenient way to do this wouldbe to increase substantially the funding provided by the World Bankthrough its concessional lending arm, the International DevelopmentAssociation. Current IDA flows are on the order of $8 billion a year, and
Sachs, McArthur, Schmidt-Traub, Kruk, Bahadur, Faye, and McCord 169
77. The data in Harrison, Klugman, and Swanson (2003) show the lack of PRSP align-ment with the MDGs. Their table 5, for example, indicates that seven of twelve recentPRSPs do not even include targets that can be compared with the hunger MDG. Similarly,seven of twelve do not have targets relevant to the education MDG.
78. The language of “accelerating progress toward the MDGs” rather than “achievingthe MDGs” is used, for instance, in the recent World Bank staff paper for the Bank’sDevelopment Committee (World Bank, 2003c).
79. See, for instance, the critique of “too optimistic” PRSP targets in Christiansen,Scott, and Wodon (2002).
2259-02-Sachs.qxd 8/6/04 11:21 Page 169
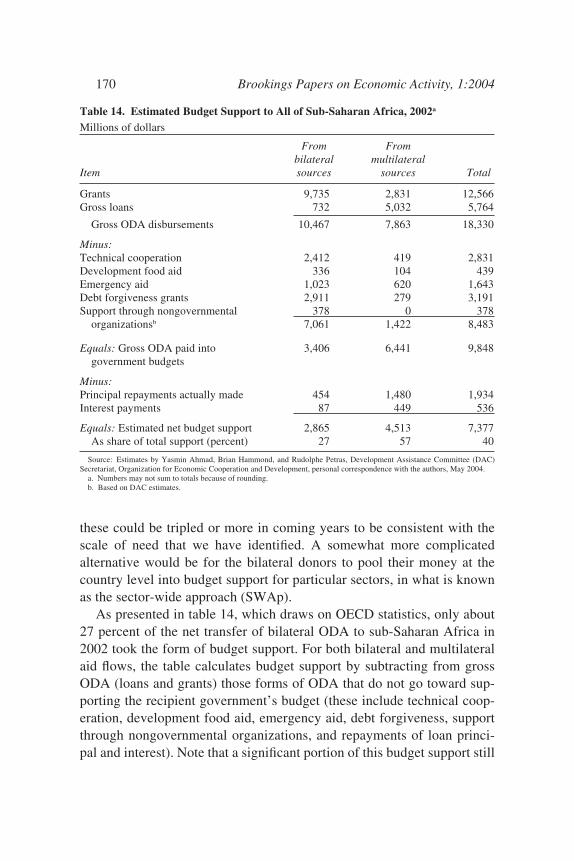
these could be tripled or more in coming years to be consistent with thescale of need that we have identified. A somewhat more complicatedalternative would be for the bilateral donors to pool their money at thecountry level into budget support for particular sectors, in what is knownas the sector-wide approach (SWAp).
As presented in table 14, which draws on OECD statistics, only about27 percent of the net transfer of bilateral ODA to sub-Saharan Africa in2002 took the form of budget support. For both bilateral and multilateralaid flows, the table calculates budget support by subtracting from grossODA (loans and grants) those forms of ODA that do not go toward sup-porting the recipient government’s budget (these include technical coop-eration, development food aid, emergency aid, debt forgiveness, supportthrough nongovernmental organizations, and repayments of loan princi-pal and interest). Note that a significant portion of this budget support still
170 Brookings Papers on Economic Activity, 1:2004
Table 14. Estimated Budget Support to All of Sub-Saharan Africa, 2002a
Millions of dollars
From Frombilateral multilateral
Item sources sources Total
Grants 9,735 2,831 12,566Gross loans 732 5,032 5,764
Gross ODA disbursements 10,467 7,863 18,330
Minus:Technical cooperation 2,412 419 2,831Development food aid 336 104 439Emergency aid 1,023 620 1,643Debt forgiveness grants 2,911 279 3,191Support through nongovernmental 378 0 378
organizationsb 7,061 1,422 8,483
Equals: Gross ODA paid into 3,406 6,441 9,848government budgets
Minus:Principal repayments actually made 454 1,480 1,934Interest payments 87 449 536
Equals: Estimated net budget support 2,865 4,513 7,377As share of total support (percent) 27 57 40
Source: Estimates by Yasmin Ahmad, Brian Hammond, and Rudolphe Petras, Development Assistance Committee (DAC)Secretariat, Organization for Economic Cooperation and Development, personal correspondence with the authors, May 2004.
a. Numbers may not sum to totals because of rounding.b. Based on DAC estimates.
2259-02-Sachs.qxd 8/6/04 11:21 Page 170
takes the form of loans that need to be repaid, although on concessionalterms. As hinted by the “technical cooperation” line of the table, tied aid(the practice of linking development assistance to the purchase of donorcountry goods or services) also remains a significant issue for manydeveloping countries.
Fourth, reforming donor financing requires new notions of sustainabil-ity. The first point is that recipient countries will need large-scale supportfor many years to come—at least a decade and possibly more. Thereforeit is completely unsound to expect development projects or programs tobecome self-sustaining financially in a few years, as many donors nowassume. It is also necessary, for the poorest countries, to finance theseprograms through grants rather than loans. We have seen that countrieswill require perhaps 20 to 30 percent of their GDP in annual developmentassistance for a decade or more. If much of this comes in the form of loans,those countries will be bankrupt once again by the end of the decade. Grantfinancing is the only way to pay for the investments and leave the recipi-ent countries with viable public finances at the end of the process. For thesame reason, the outstanding debts of the poorest countries should also becancelled in their entirety as part of the MDG process. After all, what isthe meaning of “debt sustainability” for a country that also requires annualaid of more than 20 percent of GDP just to achieve basic poverty reduc-tion targets? Debt cancellation will need to be deepened accordingly.80
National Planning Processes
We recommend that African governments implement these guidingprinciples through a three-stage process. First, each country should con-vene a planning team comprising its own representatives and those of keystakeholders and technical advisers—the bilateral and multilateral donors,UN specialized agencies, and civil society leaders—to conduct an MDGneeds assessment. In the second step, the needs assessment should feedinto a ten-year public investment and human resource strategy. The thirdstep would be to construct the medium-term budget framework (covering,for example, three years, as with the PRSPs), which would finance thefirst three years of the ten-year investment strategy.
Developing multisector ten-year scale-up plans will require a greatdeal of technical work. In the poorest countries, UN agencies already pro-
Sachs, McArthur, Schmidt-Traub, Kruk, Bahadur, Faye, and McCord 171
80. Sachs (2002).
2259-02-Sachs.qxd 8/6/04 11:21 Page 171
vide vital support in almost every sector and can thus play a crucial rolein assisting national governments as they develop their MDG plans. Thechallenge will be to coordinate this work around the specific MDGs. Inmost low-income countries, the resident representatives of all agenciesnow meet regularly as UN Country Teams (UNCTs), which report to theUN Development Group that was established by the secretary-general in1997 as the overall coordination mechanism among development-oriented UN agencies. The UNCTs, including representatives of the Inter-national Monetary Fund (IMF) and the World Bank, can provide vitalassistance to countries in formulating the ten-year strategy and three-yearbudget framework.
As an explicit MDG-based planning framework is developed, increasesin ODA inflows will raise a number of structural macroeconomic issues.Countries must maintain their efforts to mobilize domestic revenue andfoster domestic saving and investment in order to support long-term eco-nomic growth. We have assumed, for example, that governments will raisedomestic resources committed to the MDGs by 4 percent of GNP. Ofcourse, governments should not spend what they do not have, especially ifthe funds are obtained through domestic credit expansion. The increasedMDG investment program must be financed through reliable increases inODA grants.
With significant increases in ODA inflows, issues of Dutch disease willarise and need to be managed carefully. However, the implications shouldnot be too quantitatively significant, as Alessandro Prati and his col-leagues have argued.81 The reason is that there is a substantial tradablegoods component to scaling up, both in capital investments and in thehigh proportion of skilled labor that is globally mobile. The ODA willalso be directed toward raising supply-side productivity through invest-ments in agriculture and human capital rather than toward a consumptionboom of the kind typically linked to a squeeze in the tradable goods sec-tor. More important than the size of the ODA inflows is their predictabil-ity, as the IMF’s own analysis has shown.82
Underlying this discussion of macroeconomic programming is the con-sideration of what to do if donor funds are not readily forthcoming tomeet the needs of the MDG-based PRSP. In that case, of course, the
172 Brookings Papers on Economic Activity, 1:2004
81. Prati, Sahay, and Tressel (2003).82. IMF Fiscal Affairs Department, personal correspondence with the authors, April
2004.
2259-02-Sachs.qxd 8/6/04 11:21 Page 172
MDGs are unlikely to be met. The IMF, however, should not then simplyurge the country to live within its means. It should also present the techni-cal case that the country could achieve the MDGs if given additional sup-port, and it should urge donor countries to expand available support to alevel that would enable any well-governed African country making theeffort to achieve the MDGs.
National Implementation Processes
Government-led coordination will be crucial not just for crafting theseplans but also for implementing them. As their part of the bargain, recipi-ent governments will need to put in place a clear and transparent systemfor monitoring and evaluating the implementation of the plans, building inregular milestones and checkpoints through which the plans can be fine-tuned or adjusted as necessary. Public evaluation of plans will need to takeplace within the context of the African Peer Review Mechanism (APRM)of the New Partnership for Africa’s Development (NEPAD). The APRM,which is beginning its first evaluations in 2004, entails African countriespublicly reviewing each other’s performance in four categories: democ-racy and political governance, economic governance and management,corporate governance, and socioeconomic development.
To ensure that ODA resources are being used effectively, monitoringand evaluation mechanisms will need to be included in the MDG-basedPRSs, including PRSPs when appropriate. These systems will need toevolve as scale-up proceeds, but they will need to be consistently guidedby key principles of fiscal accountability, institutional strengthening, sub-stantive goal orientation, and benchmarking of progress.83 Importantly,progress will need to be measured with respect to both financial manage-ment and MDG-based development outcomes. Too often, developmentevaluations focus on assessing the procedural outcomes of projects andprocesses rather than the development outcomes of programs. More impor-tant, intermediate input targets and milestones will be required en route toreaching the long-term outcome goals. For instance, bed net use needsto be measured as an input en route to reducing the incidence of malaria.Before implementation of the PRS begins, such intermediate and outcome
Sachs, McArthur, Schmidt-Traub, Kruk, Bahadur, Faye, and McCord 173
83. As described in UN Millennium Project Task Force on Poverty and EconomicDevelopment (2004).
2259-02-Sachs.qxd 8/6/04 11:21 Page 173
benchmarks need to be developed and proposed by the recipient govern-ments and then agreed upon by the donors.
Domestically, successful implementation will require African govern-ments to work closely with civil society organizations to ensure that publictrust is maintained in the accountability of public expenditure managers,to identify best mechanisms for service scale-up, and to help with ser-vice delivery where appropriate. Procedures for public accountability in-clude the opportunity for consultation in policy planning processes, therelease of budgets for public review, and the release of independent auditreports on public expenditure. In larger countries where it is difficult totransmit information to remote rural areas, distributive mechanisms ofbudget disbursement and community-based oversight can be most appro-priate both for maintaining accountability and for identifying the bestmeans of service delivery. For instance, targeted block grants can be givento rural communities, allowing them to decide how those resources shouldbest be spent. There is considerable evidence to suggest that women’s com-munity organizations should be given key oversight roles, since their mem-bers make household investment decisions that yield greater communitybenefits than those made by men.84 Actual delivery of services will nodoubt involve a mix of public sector institutions, nongovernmental orga-nizations that operate on a national scale, and community-based organiza-tions that receive transfers from the public sector.
Donor Assistance When Governance is Weak
Although the bulk of this paper focuses on poor African countries withgood governance, a few observations can be made about what to do inpoorly governed countries. In those instances the preceding frameworkwill not apply, mainly because development aid allocated to poorly func-tioning governments can easily be squandered or even used to reinforcebad practices. The key is to understand the nature of the poor gover-nance and to take actions that make sense in that context. Here we offersome basic thoughts on this difficult topic.
In some cases what is called “poor governance” is in fact an issue oflack of financial resources to carry out reasonable public functions. Thepolitical and social will may be present, but the government may simplylack the means to maintain an effective police force, judiciary, and other
174 Brookings Papers on Economic Activity, 1:2004
84. Quisumbing and Maluccio (2000).
2259-02-Sachs.qxd 8/6/04 11:21 Page 174
instruments of governance. In such cases an increased flow of ODA canmake a significant difference, not only by financing key public invest-ments but also by financing key instruments of governance.
In other cases the problems of governance run deeper than simple lackof finances. They may involve violent conflict, authoritarian rule, or cor-rupt and predatory practices by the state. When the problem is violentconflict, the role of aid needs to be focused in the first instance on peace-making, peacekeeping, and humanitarian assistance. Early funding ofpostconflict situations may help to sustain the peace, for example by pro-viding funds for disarmament and resettlement of combatants. Aid mayalso be vital for refugees and the sustenance and relocation of displacedpopulations. The current aid system operates haphazardly in these cir-cumstances, although the case of Liberia provided an impressive recentexample of a rapid UN system response in designing a postconflict aidagenda. Of course, in this and related cases a key question is whetherpledged donor support will actually arrive in a timely fashion.
When the problem is entrenched despotic rule, large-scale aid transfersto the government are ill advised. Even tight conditionality will not bevery successful in ensuring that such aid is well used. Governments thatdo not intend to carry out needed reforms can find too many ways to cir-cumvent the conditions. Therefore our basic answer for this scenario isthat the scale of aid to such governments should be limited, and aid shouldbe substantially allocated through nongovernmental organizations andinternational agencies rather than through the central government. Thisapproach will generally not be sufficient to achieve the MDGs, but it willat least help to ensure progress (or lack of retrogression).
Some guidelines on providing aid in this “third-best” situation mightinclude the following. First, donors should focus on direct delivery ofhumanitarian assistance and on cases where aid is provided in kind anddelivery is monitorable (immunizations or emergency food programs, forexample). These programs have proved successful even in situations ofdisastrously poor governance. “Immunization days,” for example, havebeen successfully implemented in the middle of civil wars. Second,donors should seek out nongovernmental organizations that can effectivelydeliver longer-term services, such as health care and education, recogniz-ing that the scale of services provided by such organizations will rarelysubstitute for effective public sector delivery. Third, donors should encour-age small-scale demonstration projects by civil society, as precursors
Sachs, McArthur, Schmidt-Traub, Kruk, Bahadur, Faye, and McCord 175
2259-02-Sachs.qxd 8/6/04 11:21 Page 175
to large-scale programs should governance conditions someday change.Fourth, cutoffs in aid should not be used punitively in an attempt to fine-tune the quality of governance (for example, in protest of a single govern-ment decision that the donor finds undesirable). Micromanagement oflocal governance is a disaster and a self-fulfilling trap. When aid is cut,governance itself is put in jeopardy. Cutting aid over small matters caneasily trigger a downward spiral of political instability.
Finally, we have serious reservations about punitive sanctions, such astrade embargoes, on poorly governed countries. Although such countriescannot be entrusted with large-scale aid inflows, it is a mistake to punishthem with trade embargoes (other than an arms embargo). Trade sanctionsrarely bring down a government, because they weaken civil society atleast as much as they weaken government power. Therefore they tend tocreate intense economic hardship without tilting the balance of powerbetween a despotic government and its opposition. Of course, in a fewwidely noted cases (such as the end of apartheid in South Africa), tradesanctions seem to have played a role in accelerating the transition to goodgovernance, but an even larger number of cases can be cited (Cuba, Haiti,and Myanmar, for example) where trade sanctions made little differenceto governance, but instead contributed to country-wide impoverishment.
The Role of Trade Reform
Most of this paper has focused on the quantity and direction of ODAneeded for African countries to make the public investments necessary tobreak out of a poverty trap. The implied aid flows are large, equivalent to20 to 30 percent of recipient countries’ GDP over the course of a decadeor more. An important related issue is how these costs compare with thebenefits of increased international trade. Could improved trade conditionssubstitute for the required aid? Have the advocates of “trade, not aid” dis-covered a less expensive solution? These questions are particularly rele-vant in the context of the current Doha round of negotiations under theauspices of the World Trade Organization, which are meant to focus inlarge part on developing country needs, although the talks have producedfew results as yet. The long-term ambition for African economies withrespect to trade needs to be to diversify away from dependence on com-modity exports and the related long-term decline in terms of trade, but
176 Brookings Papers on Economic Activity, 1:2004
2259-02-Sachs.qxd 8/6/04 11:21 Page 176
several other trade policy issues are of immediate importance.85 Marketaccess remains crucial for African exporters, as is an intellectual propertyregime that permits reliable access to key pharmaceutical products and atrade regime that allows enough flexibility for countries to implementindustrial promotion policies. Yet even though trade reform is welcomeand important, it is certainly not sufficient to achieve the MDGs. Tradewill not directly provide the targeted public investment strategies outlinedabove, and the gains from trade are simply insufficient to finance the nec-essary investments. Even the much-heralded Africa Growth and Opportu-nity Act of the United States has had only marginal effects on mostAfrican countries’ exports.86
Within the African trade agenda, the most immediate political priorityis progress in agricultural trade liberalization.87 Yet progress will meandifferent things in different countries. The countries that are net agricul-tural exporters will naturally seek greater access to protected markets in industrial countries for their exports. Those that are net agriculturalimporters, particularly food importers, are at risk of immediate adversewelfare shocks if, for instance, industrial countries’ export subsidies arequickly removed, resulting in major price increases for core foodstuffs.88
Many countries in Africa are net food importers but net exporters of non-food agricultural products, so that welfare outcomes from trade liberal-ization will be mixed. Given these countervailing forces and existingdata limitations, it is difficult to estimate the country-specific effects oftrade liberalization packages. That challenge is further compounded byour proposal to double or triple agricultural productivity through a pack-age of rural investments, since most trade modeling exercises are limitedto comparative statics and hold agricultural productivity constant whenexamining changes in trade regimes.
Sachs, McArthur, Schmidt-Traub, Kruk, Bahadur, Faye, and McCord 177
85. One World Bank estimate indicates that the cumulative loss to non-oil-exportingcountries from the decline in their terms of trade from 1970 to 1997 was equivalent to 119percent of their combined GDP. See World Bank (2000).
86. Brenton and Ikezuki (2004).87. Agricultural trade reform is of course a less pressing concern for fuel-exporting
countries such as Angola, the Republic of the Congo, Equatorial Guinea, Gabon, andNigeria.
88. Hoekman, Ng, and Olarreaga (2002) have usefully outlined the country-specificeffects of export subsidies and tariffs.
2259-02-Sachs.qxd 8/6/04 11:21 Page 177
Nonetheless, one can begin to evaluate the differing effects of agricul-tural trade liberalization measures by distinguishing between the impactof liberalization of food commodities and that of liberalization of nonfoodcommodities. Among the latter, cotton is likely the most prominent. It isestimated that the United States spends nearly $4 billion a year on cot-ton subsidies, or more than twice the entire annual U.S. bilateral devel-opment assistance budget for Africa, to maintain annual production by itsroughly 25,000 cotton growers at about $4 billion a year.89 China exportsmuch less cotton than the United States but supports its domestic cottonproduction with $1.2 billion in annual subsidies; the European Uniondirects roughly $0.8 billion a year to support cotton producers in Greeceand Spain.
Although the precise global impact of cotton subsidies is not easily cal-culated, they clearly have a deleterious effect on several West Africaneconomies, especially Benin, Burkina Faso, Chad, Mali, and Togo, wherecotton production amounts to a significant portion of GDP and a largeshare of agricultural export earnings. In Mali, for instance, cotton pro-duction was 9 percent of GDP and 38 percent of merchandise exports in2000–01. In Benin it was 5.3 percent of GDP in the same period and fullytwo-thirds of merchandise exports.90 John Baffes estimates that globalcotton liberalization would raise the world price by approximately 13 per-cent over what it would be without reforms.91 This would present a clearbenefit to West African cotton producers, whose exports under liberaliza-tion would also increase by an estimated 13 percent annually.92 In welfareterms the West African cotton-exporting countries could enjoy as much asa 1 or 2 percent increase in GDP from cotton trade liberalization. In com-parison, their ODA needs are above 20 percent of GNP.
The liberalization story is much more complicated for food commodi-ties, among which sugar and groundnuts are two of the most importantproducts for Africa. These two foodstuffs are subject to very differentglobal trade dynamics. As is well known, sugar is one of the world’s mostprotected industries. In the European Union, long-standing domestic sub-sidies and quotas have maintained prices for producers at roughly doublethe world price, resulting in overproduction and limited market access for
178 Brookings Papers on Economic Activity, 1:2004
89. Figures cited in this paragraph are from Baffes (2004). 90. UNCTAD (2003a). 91. Baffes (2004).92. Baffes (2004)
2259-02-Sachs.qxd 8/6/04 11:21 Page 178
low-cost producers such as Australia and Brazil. High levels of price sup-port are also in effect in the United States and Japan. However, manyAfrican countries benefit from the EU Sugar Protocol, a series of bilateralsugar trading agreements that give some developing countries preferentialaccess to sell sugar at the vastly inflated European prices. Beneficiariesinclude the Republic of Congo, Côte d’Ivoire, Kenya, Madagascar,Malawi, Mauritius, Swaziland, Tanzania, Uganda, Zambia, and Zimbabwe.93
The Sugar Protocol arrangement is extremely lucrative to the most suc-cessful African exporters, Mauritius and Swaziland, but these are bothmiddle-income countries, and so its benefits are distributed somewhatregressively.94 Among low-income countries, the Sugar Protocol yieldsbenefits of roughly $10 million a year to Malawi, or a minuscule 90 centsper capita.95 The United States also has a quota system in place, but ittends to prefer Latin American sugar producers and so is of less signifi-cance for African countries.
Although sugar is one of the few products exempted from the EUEverything But Arms initiative, the European Union is scheduled tostart reducing sugar tariffs in July 2006, with full phase-out complete byJuly 2009. While the precise path of future European sugar marketreform is uncertain, it is estimated that full liberalization of industrialcountry sugar markets would yield a 40 percent increase in the worldprice. Yet that new price would still be less than the current price avail-able through preferential access, and thus many African sugar producerswould not necessarily gain from the world price change.96 Moreover, aremoval of import quotas in Europe, Japan, and the United States wouldbenefit the low-cost sugar producers such as Australia and Brazil muchmore than the African producers. All told, the net liberalization effectfor African sugar producers is unclear and, if positive, likely to beextremely small.97
Groundnut products, meanwhile, follow very different patterns of pro-duction and protection. China and India together produce nearly two-thirds of the world’s groundnuts. Those countries’ high levels of domesticconsumption and market protection result in very thin international mar-
Sachs, McArthur, Schmidt-Traub, Kruk, Bahadur, Faye, and McCord 179
93. Huan-Niemi and Niemi (2003). 94. Borrell and Pearce (1999).95. Borrell and Pearce (1999). 96. Mitchell (2004). 97. Borrell and Pearce (1999).
2259-02-Sachs.qxd 8/6/04 11:21 Page 179
kets, equivalent to only 5 percent of global production. Among exporters,the major traders are China (32 percent share of total exports), the UnitedStates (19 percent), and Argentina (11 percent). Collectively, the ground-nut exporters of sub-Saharan Africa—The Gambia, Malawi, Nigeria,Senegal, South Africa, and Sudan—account for only 5 percent of the tradedmarket.98 Since the groundnut markets of Argentina, China, India, and theUnited States are all protected, one might think that full liberalizationwould create a major opportunity for African producers. However, theresults again differ by country. Ndiame Diop, John Beghin, and MirvatSewadeh estimate that the African winners would be Senegal, which isslated to gain $21 million a year, or $2 per capita (in 1995 dollars), andNigeria, which would gain $13 million a year, or roughly 10 cents percapita.99 The Gambia is estimated to gain less than half a million dollars ayear, or 35 cents per capita, and Malawi would lose roughly $1 million ayear, or 9 cents per capita.
Although we discuss only three commodities here, product-by-productassessments are instructive for pinpointing who wins and who loses fromspecific components of trade policy. The evidence is also important forhighlighting that the benefits from liberalization in particular commodi-ties are not necessarily enormous, if indeed they are positive at all. A keyquestion thus hinges on how the benefits of trade liberalization aggregateacross products. Elena Ianchovichina, Aaditya Mattoo, and MarceloOlarreaga focus on the benefits of full access to the “Quad” markets ofCanada, the European Union, Japan, and the United States; they estimatethat such access would yield a $2.5 billion, or 14 percent, increase innonoil exports and a $1.8 billion, or 1.2 percent, welfare enhancement forthirty-seven sub-Saharan African countries (all except Angola, Botswana,Lesotho, Malawi, Mauritius, Mozambique, Namibia, South Africa,Swaziland, Tanzania, Zambia, and Zimbabwe).100 Most of these benefitswould accrue through improved access to EU markets. Ianchovichina andcolleagues also estimate that if, in addition to full Quad access, nonpref-erential tariffs were cut by 25 percent across all countries, this wouldremove more than $500 million of the same African countries’ benefits.Thus full rich-country access and significant global tariff liberalization
180 Brookings Papers on Economic Activity, 1:2004
98. Diop, Beghin, and Sewadeh (2004). 99. Diop, Beghin, and Sewadeh (2004, p. 30).
100. Ianchovichina, Mattoo, and Olarreaga (2001).
2259-02-Sachs.qxd 8/6/04 11:21 Page 180
would result in less than a 1 percent net welfare increase for most ofAfrica.
Other researchers have used different modeling assumptions to estimatetrade liberalization benefits of a similar order of magnitude. Andersonand others calculate that the countries of the Southern African CustomsUnion (SACU; Botswana, Lesotho, Namibia, South Africa, and Swazi-land) would gain nearly $1.4 billion a year from full global trade liberal-ization, and that the rest of sub-Saharan Africa would gain $3.2 billion(both figures in 1995 dollars).101 The United Nations Conference on Tradeand Development (UNCTAD) meanwhile estimates that comprehensive,across-the-board cuts in agricultural and manufacturing tariffs by 50 per-cent would entail a terms-of-trade loss to sub-Saharan Africa that wouldbalance the market access benefits, to yield an outcome that is effectivelywelfare neutral.102 Stephen Tokarick estimates the net effects of global agri-cultural liberalization for SACU members at $1.8 billion a year, or 1.3 per-cent of GDP.103 For the rest of sub-Saharan Africa, he estimates the totalbenefits at $1.0 billion, or roughly 0.5 percent of GDP.
This range of estimates underscores a key point. Even if the Dohatrade negotiations yielded African countries the most optimistic of esti-mated outcomes, these countries’ benefits would likely not exceed 1 or2 percent of GDP a year. Although these benefits would be nontrivial inscale and important for long-term economic development, they would bean order of magnitude less than the level of resources required to achievethe MDGs in the poorest countries. They are not a substitute for the sus-tained increases in ODA needed to fund the public investments describedin this paper.
The diversity of commodity-specific, and thereby country-specific, tradescenarios underscores a second crucial point for macroeconomic planning.Just as a local needs assessment approach is necessary to identify the pub-lic investments that a country should undertake, so, too, a similar approachmust be taken to identify how a country’s macroeconomic framework willevolve in step with changes to the global trade system. Some net exporters
Sachs, McArthur, Schmidt-Traub, Kruk, Bahadur, Faye, and McCord 181
101. Anderson and others (2001). 102. UNCTAD (2003b, p. 48). Importantly, UNCTAD distinguishes between the ben-
efits to sub-Saharan Africa of a global reduction in agricultural tariffs, estimated at$226 million, and the high costs of a removal of industrial countries’ agricultural exportsubsidies, estimated at $355 million (both figures in 1997 dollars).
103. Tokarick (2003).
2259-02-Sachs.qxd 8/6/04 11:21 Page 181
might emerge as major winners, while their net food-importing neighborssuffer tremendously. The MDG-based PRS process will need to be devel-oped and constantly updated, within a larger process that systematicallyanticipates how the poorest countries will be affected by changes in inter-national trade policy. Those countries slated to suffer losses from tradeliberalization will need to have their external assistance adjusted upwardaccordingly.
Regional Integration and Cross-Country Infrastructure
The small populations of most African countries and the large numberof landlocked countries reinforce the need for deepening regional inte-gration and investments in cross-country transport, energy, and com-munications infrastructure, as promoted by NEPAD.104 Not only doessub-Saharan Africa have extremely low per capita densities of rail androad infrastructure, but indeed existing transport systems were largelydesigned under colonial rule to transport natural resources from the inte-rior to the nearest port. As a result, cross-country transport connectionswithin Africa tend to be extremely poor and are in urgent need of exten-sion, to reduce intraregional transport costs and promote cross-bordertrade.
Regional cooperation is also needed to develop and consolidate energysupplies. Countries across sub-Saharan Africa need to invest in petroleumrefining, storage, and distribution infrastructure, including pipelines tolower transport costs and ensure the continuous availability of fuel through-out the region. Cross-country infrastructure for the transmission of elec-tricity also needs to be improved.105 Similarly, a regional backbone ofinformation and communications infrastructure is required.
Regional organizations like NEPAD and the African Union will becritical for the management of the regional “hardware” listed above andfor the key “software” of international economic integration that is fos-tered by harmonizing cross-border policies and procedures, including cus-toms policies, macroeconomic policies, and the joint management of majorecosystems such as international watersheds. In light of their importancefor ending the poverty trap in Africa, these supranational organizations
182 Brookings Papers on Economic Activity, 1:2004
104. New Partnership for Africa’s Development (2004). 105. U.S. Department of Energy, Energy Information Administration (1999).
2259-02-Sachs.qxd 8/6/04 11:21 Page 182
will need increased direct funding from donors in addition to the supportrequired for individual countries.
Investing in Global Public Goods
In addition to aid and trade, many of Africa’s challenges in agriculture,health, the environment, and access to energy services will require break-throughs in science and technology. Examples of promising technologiesthat could help Africa achieve the MDGs include new vaccines or treat-ments for malaria and HIV/AIDS, improved agricultural varieties andcropping systems for rain-fed and drought-prone agriculture, low-costinformation and communications technologies, and low-cost water treat-ment and purification technologies. Private markets in industrial countriesare able to produce development-stage and, to a lesser extent, research-stage science, but those in poor countries cannot. Even though these mar-ket failures have been understood for some time, the international systemhas so far not responded adequately. Appropriate solutions could consistof global coordinating mechanisms based on one of the following models:precommitment purchase agreements,106 prizes,107 public-private partner-ships based on contractual terms that would ensure free access to intellec-tual properties generated through publicly funded research,108 and directfinancing of research.
Despite several efforts, global research into areas critical to Africandevelopment remains woefully underfunded. For example, the annualoperating budget of $400 million for the worldwide network of sixteentropical agricultural research centers known as the Consultative Group onInternational Agricultural Research (CGIAR) is minuscule comparedwith the research and development (R&D) budgets of the world’s sixlargest agrobiotech companies, estimated at roughly $3 billion a year.109
The budget of the CGIAR system as well as of the national agriculturalresearch centers remains low despite considerable evidence of the highsocial rates of return from R&D in tropical food production.
Sachs, McArthur, Schmidt-Traub, Kruk, Bahadur, Faye, and McCord 183
106. Kremer (2002). 107. Masters (forthcoming).108. Several of these partnerships have been developed by private foundations, such as
the Rockefeller and Gates Foundations.109. Robert Evenson, Department of Economics, Yale University, personal communi-
cation with the authors, 2004.
2259-02-Sachs.qxd 8/6/04 11:21 Page 183
Similarly, R&D into tropical diseases amounts to only 10 percent ofglobal health-related R&D spending, even though such diseases accountfor 90 percent of the global disease burden.110 As a result, the World HealthOrganization’s Commission on Macroeconomics and Health (CMH) rec-ommends that annual funding for R&D into global public goods in health(for malaria, AIDS, tuberculosis, and nutrition, among other priorities)be increased by $3 billion by 2007 and $4 billion by 2015.111 The situa-tion is similar in other areas that are critical to the needs of poor people.Low-cost sanitation technologies that are adapted to local cultural prefer-ences, ability to pay, and environmental constraints are notoriously under-researched across the developing world.
Global science is also vitally needed to address the regional conse-quences and risks for Africa of long-term climate change caused mainlyby rich countries’ emissions of greenhouse gases. Climate change islikely to lead to a reduction in potential crop yields in most tropical andsub-tropical regions of Africa, worsening food security and raisingAfrica’s total need for assistance.112 A concerted global effort is requiredto improve countries’ ability to mitigate and adapt to climate changethrough additional investments in critical global public goods, such asimproved climate modeling and forecasting tools. These can help predictchanges in precipitation patterns so as to improve the management ofreservoirs and help African farmers adapt their cropping and irrigationtechniques accordingly.
Because African science remains severely underdeveloped, the glo-bal science community—led by national research laboratories, universi-ties, and national academies of science—needs to play a critical role indeveloping the public goods required to overcome these constraints. Inaddition to supporting R&D institutions within African countries, inter-national donors and foundations need to increase funding to focus exist-ing global science institutions on the unique challenges of Africa. A veryrough back-of-the-envelope estimate of the total global cost of thesepublic goods is likely to reach at least $6.5 billion a year. Of this, perhaps$4 billion would be directed toward public health;113 another $1 billionto agriculture, through a tripling of the current budget of the CGIAR;
184 Brookings Papers on Economic Activity, 1:2004
110. Global Forum for Health Research (2002). 111. CMH (2001). 112. Intergovernmental Panel on Climate Change (2001). 113. CMH (2001).
2259-02-Sachs.qxd 8/6/04 11:21 Page 184
roughly another $1 billion toward research into energy technologies forAfrica (such as geothermal energy in East Africa and off-grid electric-ity sources for rural Africa); and perhaps $500 million for improvedunderstanding of year-to-year, seasonal, and long-term climate changein Africa.
Implications for Global Development Assistance
Planning, investing, and coordinating efforts to achieve the MDGs inAfrican countries stuck in poverty traps amounts to an undoubtedlyambitious agenda. Yet we have argued that only an effort of such scalecan enable countries in tropical sub-Saharan Africa to escape thepoverty trap, and we have outlined that such an effort is feasible. The set of known and effective interventions that can be successfully de-ployed at the necessary scale suggests that, in most areas, technology isnot the limiting factor. Instead, shortsighted and poorly coordinatedinstitutional mandates of the world’s development agencies are cur-rently a limiting factor, but these can be realigned and better coordi-nated fairly quickly through more-focused policies and increasedmultilateral financing.
The current level of ODA is surely a limiting factor for achieving theMDGs in the well-governed African countries. It is not only necessary butalso possible to remove this constraint. We have found that well-governedAfrican countries need an additional $40 or so per capita per year in de-velopment assistance. If we supposed that 620 million Africans were toreceive that amount, it would add about $25 billion a year to the roughly$18 billion a year provided in 2002, or more than a doubling of aid flows tothe continent. That total amounts to less than 0.2 percent of the rich coun-tries’ combined GNP. Of course, if the increment were limited only towell-governed countries, the overall increase would be significantly less,perhaps a bit more than half of the $25 billion a year, depending onwhere the donors draw the line.
Calculating the global increase in ODA needed for all countries tomeet the MDGs is of course even trickier, and we have not tried to do that,either for this paper or for the UN Millennium Project to date. Still, wecan make a few observations. Perhaps 30 percent of the world’s poorestpeople live in Africa. If one estimates that Africa requires around 50 per-cent of the world’s incremental donor needs, the $25 billion or so increase
Sachs, McArthur, Schmidt-Traub, Kruk, Bahadur, Faye, and McCord 185
2259-02-Sachs.qxd 8/6/04 11:21 Page 185
in assistance for Africa might signify an increase of perhaps $50 billionglobally for the MDGs, which in turn would signify roughly a doubling ofworldwide development assistance, from around $60 billion a year at cur-rent rates to perhaps $110 billion a year. Again, these dollar figures arelikely to be underestimates because of the big-ticket items not costed, dol-lar depreciation, the assumption of optimal intervention packages, and theongoing need for aid not directly geared toward the MDGs. Moreover, wewould add investments in a variety of global public goods, includingincreased funding for specialized international agencies, such as theWorld Health Organization, that have had their core budgets frozen for adecade or more, and for increased spending on science and technologyneeded for the poorest countries. The total global need might be an addi-tional $75 billion in ODA each year.
The order of magnitude for these indicative estimates conforms wellwith those reported by other recent studies. The UN High-Level Panelon Financing for Development, chaired by former president of MexicoErnesto Zedillo, similarly estimated that at least $50 billion in extraannual ODA would be required to achieve the MDGs. The U.K. govern-ment has also recently called for “doubling aid to halve poverty.” Ourrough estimates suggest that a somewhat larger amount might be needed,but still within the same general range.
The bottom line, however, is how small even these “large” numbersreally are. Adding to the many promises of the rich world before andsince, the 2002 Monterrey Consensus includes a commitment of theworld’s industrial countries “to make concrete efforts towards the targetof 0.7 per cent of gross national product (GNP) as ODA to developingcountries. . . .” (pp. 9–10). With a combined GNP of around $27 trillion,the donor countries of the OECD have in effect committed to donor flowson the order of $190 billion, compared with actual flows of roughly$60 billion, or around 0.2 percent of GNP. Even an additional $75 billiona year would put the donor countries’ assistance at around $135 billion ayear, or 0.5 percent of their current GNP, far below their own com-mitment. If one includes additional ODA for development assistanceabove and beyond the increment needed for the MDGs, for instance tomiddle-income countries, total global ODA needs are still likely to be lessthan or equal to 0.7 percent of donor GNP.
To close where we began, however, large-scale aid is not sufficient forending the poverty trap, nor is it even warranted where domestic gover-
186 Brookings Papers on Economic Activity, 1:2004
2259-02-Sachs.qxd 8/6/04 11:21 Page 186
nance is poor. We are advocating large-scale help only for those countriesthat can help themselves. We do not seek to pick ODA numbers out ofthe air, but instead argue for true needs assessments on a country-by-country basis. We believe that the situation in much of Africa is sufficientlydesperate, and that the potential benefits of increased donor-financedinvestment are sufficiently high, that the world community should startimmediately in partnership with well-governed African countries to helpthem to escape their poverty trap once and for all.
A P P E N D I X A
Recommended Intervention Packages and Their Components*
Area 1: Agricultural Productivity and Rural Infrastructure
Farm ProductionIncreasing agricultural productivityInvestments in soil health: Application of chemical fertilizers, agrofor-
estry (use of trees to replenish soil nutrients), green manure, and/or covercrops in combination, as appropriate, depending on soil characteristics
Improved inputs*: Application of improved seeds, livestock feed, andimplements (such as plows)
Small-scale water management: Application of water managementtechniques and structures, pumps, drip irrigation, wells, etc., as appropriate
Extension services and agricultural research: Provision of compre-hensive extension services, combining technical support, farmer partici-pation, and investment in agricultural research
Special interventions to reach women farmers: Recruitment and train-ing of women extension workers, provision of inputs (seeds, fertilizers,implements) targeted to reach women on an equitable basis with men
Linking farmers to marketsStorage, marketing, and agroprocessing facilities*: Construction of
warehouses to reduce postharvest losses; construction of market spaces;provision of training and equipment to encourage small-scale agropro-cessing industries in rural areas
Sachs, McArthur, Schmidt-Traub, Kruk, Bahadur, Faye, and McCord 187
*From UN Millennium Project (2004). Interventions marked by asterisks are not yetquantified in the needs assessment.
2259-02-Sachs.qxd 8/6/04 11:21 Page 187
Access to credit*: Extension of the formal banking system and/or pro-vision of microcredit services to enable farmers to access credit
Rural Transport InfrastructureRoadsDistrict roads: Upgrading, construction, and maintenance of paved
secondary or district roadsFeeder and community roads: Upgrading, construction, and mainte-
nance of small paved roads connecting villages and farmers to the nearestdistrict road
Footpaths*: Extension and improvement of footpaths connecting indi-vidual rural farmers to feeder roads
Rural Energy ServicesThermal energy systemsImproved stoves: Distribution and maintenance or replacement of
appropriate cooking stoves (ceramic stoves, liquid petroleum gas [LPG]stoves, ethanol stoves, charcoal, etc.)
Improved fuel inputs: Production and distribution system for appropri-ate improved fuels (LPG, ethanol, dimethylsulfoxide [DMSO], kerosene,etc.) including safe containers, depending on specific fuel mix available inthe country
ElectricityElectric power generation capacity: Extension, upgrading, and main-
tenance of capacity (thermal energy plants, hydropower, or geothermalpower, as appropriate) to supply electricity grids
Electric power grid: Extension of grid through high-voltage lines,medium- to low-voltage lines (including end-user connections), and otherrelated infrastructure (such as transformer stations)
Off-grid electric power systems: Provision of diesel generators, hybridsystems, or solar home systems together with necessary wiring to remoterural communities
Access to Water and Sanitation and Water Management Infrastructure
WaterWater supply infrastructure: Provision and operation of infrastructure
for water supply (such as standpipes, boreholes, dug wells, and rainwaterharvesting)
188 Brookings Papers on Economic Activity, 1:2004
2259-02-Sachs.qxd 8/6/04 11:22 Page 188
Water storage and other infrastructure for water management*: Con-struction and operation of water storage infrastructure for drinking watersupply, agricultural water use, and hydropower; extension of large-scalewater harvesting
Integrated water resources management*: Protection and allocationof water resources to agricultural, domestic, and industrial uses, as wellas environmental needs (“green water”) based on comprehensive assess-ment of renewable and nonrenewable water resources
Hydrological monitoring*: Operation and extension of hydrologicalmonitoring systems
SanitationSanitation infrastructure: Construction and operation of toilets (simple
pit latrines, ventilated improved pit latrines, septic tanks, flush toilets,etc.), including emptying of pits and safe disposal of sullage
Awareness building: Targeted awareness building measures accompa-nying the provision of new sanitation infrastructure to ensure the choice ofthe adequate technology option and proper use by all household members
HygieneHygiene education: Awareness campaigns (in primary schools, through
community-based organizations, media, etc.) to promote hygienic behav-ior, with particular focus on hand washing and personal hygiene, as wellas appropriate use of sanitation facilities and safe water storage.
Environmental SustainabilityNatural resource managementPrevention of desertification*: For example, improving land hus-
bandry through soil erosion control and soil fertility improvementForest management*: For example, implementation of sustained-
yield forest management techniques; forest plantation to satisfy demand for forestry products; tree seedlings and other measures to supportafforestation
Watershed management*: For example, promotion of afforestation toprotect selected water catchment areas
Management of coastal ecosystems and fisheries*: To be specified ineach country
Other protected areas*: To be specified in each countryEnvironmental monitoring systems*: To be specified in each country
Sachs, McArthur, Schmidt-Traub, Kruk, Bahadur, Faye, and McCord 189
2259-02-Sachs.qxd 8/6/04 11:22 Page 189
Area 2: Health, Nutrition, and Family Planning
Child healthNeonatal integrated package: Clean delivery, newborn resuscitation,
prevention of hypothermia, kangaroo care (skin-to-skin contact), anti-biotics for infection, maternal tetanus toxoid, breastfeeding education,hygiene education
Immunization: Vaccines for polio, diphtheria, pertussis, tetanus,measles, hepatitis B, Haemophilus influenzae type b, and yellow fever
Integrated management of childhood illness (IMCI): Integratedapproach to child health that focuses on the well-being of the whole childto reduce mortality, illness, and disability and to promote improvedgrowth and development among children under five years of age; includesboth preventive and curative elements to address leading causes of childmortality such as diarrheal disease, acute respiratory infection, measles,malaria, and malnutrition
Maternal healthAntenatal care: Routine care during pregnancy, including preventive
and curative interventions such as blood pressure and weight monitoring,treatment of infections, nutrition and smoking counseling, intermittent pre-ventive treatment for malaria, and antiretrovirals for HIV-positive women
Skilled attendance and clean delivery: Presence of trained and regis-tered midwives, nurses, nurse-midwives, or doctors at birth with ability todiagnose and refer emergent complications
Emergency obstetric care: Rapidly accessible treatment for deliverycomplications such as eclampsia, hemorrhage, obstructed labor, and sepsis
Safe abortion: Access to abortion counseling, safe abortion services,and postabortion care
HIV/AIDS: preventionBehavior change programs: Programs to encourage safer sexual
behavior including condom social marketing, peer-based education, massmedia campaigns, and school-based AIDS education
Control of sexually transmitted diseases: Routine screening and effec-tive treatment of sexually transmitted diseases (such as syphilis, gonor-rhea, and chlamydia)
Voluntary counseling and testing: Pre- and posttest counseling andHIV testing
190 Brookings Papers on Economic Activity, 1:2004
2259-02-Sachs.qxd 8/6/04 11:22 Page 190
Harm reduction for injecting drug users: Actions to prevent transmis-sion of HIV and other infections that occur through sharing of nonsterileinjection equipment and drug preparations; specific programs include pro-vision of sterile syringes and needles and drug substitution treatment
Prevention of mother-to-child transmission: Prevention of transmis-sion of HIV from infected women to their infants during pregnancy,labor, and delivery as well as during breastfeeding; includes short-termantiretroviral prophylactic treatment, infant feeding counseling and sup-port, and use of safer infant feeding methods
Blood safety interventions: Measures to reduce risk of receivinginfected blood through a transfusion, including HIV antibody screening,protocols to avoid unnecessary blood transfusions,* and policies toexclude high-risk donors*
HIV/AIDS: care and treatmentAntiretroviral therapy: Combination drug therapy to treat HIV
infectionTreatment of opportunistic infections: Treatment of any infection
caused by a microorganism that would not normally cause disease in theindividual but occurs in persons with abnormally functioning immunesystems (such as AIDS patients)
Orphan support: Provision of support to orphans to minimize theimpact of AIDS on their lives; includes school fee support, provision oforphanages, and community support
TuberculosisBCG vaccine: Vaccine using Calmette-Guérin bacillus for tuberculosisDirectly Observed Treatment—Short-Course: Internationally recom-
mended tuberculosis control strategy combining five elements: politicalcommitment, microscopy services, drug supplies, surveillance and moni-toring systems, and use of highly efficacious regimes with direct observa-tion of treatment
MalariaInsecticide-treated nets and curtains: Mosquito nets that are treated
with insecticide, providing a physical and chemical barrier to mosquitoesand shortening the mosquito’s life span
Artemisinin combination treatment: Combination of drugs used to treatfirst-line-drug-resistant falciparum malaria, which is now widespread inAfrica
Sachs, McArthur, Schmidt-Traub, Kruk, Bahadur, Faye, and McCord 191
2259-02-Sachs.qxd 8/6/04 11:22 Page 191
Nutrition and Emergency Food AssistanceNutritionNutrition for infants: Complementary feeding (food additional to
breast milk) for infants aged seven to twenty-four monthsNutrition for children attending school: Provision of school meals with
locally produced foodsNutrition for women in reproductive age group: Introduction of
community-based programs to provide micronutrient supplementation foradolescent girls and women of childbearing age
Food fortification: Introduction of fortification for the entire popula-tion (adding micronutrients to foods, for example by using iodized salt)
Emergency food assistanceDirect assistance in food-scarce areas: Food-for-work programs and/
or direct food aid
Family planningCounseling on contraception and family spacing: Information and
education on benefits and methods of family planningProvision of modern contraceptive methods: Program to ensure uni-
versal access to modern contraceptive methods including sterilization(male or female), intrauterine devices, long-acting hormonal methods(injectable and implant), birth control pills, condoms, vaginal barriermethods, and spermicides
Area 3: Education
Primary educationSchool infrastructure: Provision of schools, including classrooms,
toilets (especially girls’ toilets), furniture, and transportation facilitiesTeachers: Recruitment of teachers, especially female teachers, with
provision of incentives (such as housing in rural areas where applicableand adequate salaries) and ensuring preservice and regular in-servicetraining
Learning materials: Provision of textbooks and other learning materi-als such as stationery
Curriculum reform: Implementation of curriculum reform, where nec-essary, to improve education content*
Demand-side incentives: Provision of uniforms, school meals (and/ortake-home food rations where needed), special targeted subsidies to girls
192 Brookings Papers on Economic Activity, 1:2004
2259-02-Sachs.qxd 8/6/04 11:22 Page 192
and other vulnerable populations (such as certain ethnic groups), andconditional cash transfers to parents (if appropriate) to reduce the oppor-tunity cost of children attending school and increase attendance
Secondary educationSchool infrastructure: Provision of schools, including classrooms, toi-
lets (especially girls’ toilets), furniture, transportation facilities, and otherfacilities such as libraries, laboratories, and sports facilities
Teachers: Recruitment of teachers, especially female teachers, withprovision of incentives (such as housing in rural areas where applicableand adequate salaries) and ensuring adequate preservice and in-servicetraining
Learning materials: Provision of adequate textbooks and other learn-ing materials such as stationery
Curriculum reform*: Implementation of curriculum reform, wherenecessary, to improve education content, with a focus on vocational andnonformal training as necessary to prepare students for transition to work
Demand-side incentives: Provision of uniforms, school meals (and/ortake-home food rations where needed), special targeted subsidies to girlsand other vulnerable populations (such as certain ethnic groups), and con-ditional cash transfers to parents (if appropriate) to reduce the opportunitycost of children attending school and increase attendance
Adult literacyAdult literacy programs: Implementation of adult literacy programs
through trainers and volunteers and accompanied by mass media cam-paigns to increase awareness of the importance of literacy
Hard-to-reach childrenSpecial packages for hard-to-reach populations*: Examples include
introduction of distance education and emergency schooling in conflictareas
Area 4: Slum Upgrading and Urban Management
Urban Infrastructure and Slum UpgradingSlum upgradingShelter*: Upgrading and construction of houses
Sachs, McArthur, Schmidt-Traub, Kruk, Bahadur, Faye, and McCord 193
2259-02-Sachs.qxd 8/6/04 11:22 Page 193
Urban infrastructure*: Upgrading and extension of roads and side-walks, street lighting, storm drainage, and communications infrastructurewithin slums
TenureSecurity of tenure*: Improving the security of tenure through non-
eviction legislation, legitimized occupancy, or formal titleEnforcement of improved land tenure legislation*: Legal protection
and enforcement of slum dwellers’ rights
Citywide urban planning and managementUrban infrastructure*: Planning of urban infrastructure (roads, foot-
paths, sidewalks, street lighting, stormwater drainage, bus lanes, andother transport infrastructure)
Basic services*: Provision of basic services (such as refuse collectionand solid waste disposal, policing and security, and fire protection)
Pollution control*: Controlling pollution of air and waterTransport system*: Operation of bus, rail, and other mass transport
systems
Urban Transport InfrastructureRoadsUrban roads: Upgrading, construction, and maintenance of urban roadsInfrastructure for mass transport systems*: For example, bus lanesFootpaths*: Extension and improvement of footpaths within cities
Urban Energy ServicesThermal energy systemsImproved stoves: Distribution and maintenance or replacement of
appropriate cooking stoves (ceramic stoves, LPG stoves, ethanol stoves,charcoal, etc.)
Improved fuel inputs: Production and distribution system for appropri-ate improved fuels (LPG, ethanol, DMSO, kerosene, etc.), including safecontainers, depending on specific fuel mix available in the country
ElectricityElectric power generation capacity: Extension, upgrading, and mainte-
nance of electric power generation capacity (thermal energy plants, hydro-power, or geothermal power, as appropriate) to supply electric power grids
194 Brookings Papers on Economic Activity, 1:2004
2259-02-Sachs.qxd 8/6/04 11:22 Page 194
Electric power grid: Extension of grid through high-voltage lines,medium- to low-voltage lines (including end-user connections), and otherrelated infrastructure (such as transformer stations)
Urban Water Supply and SanitationWaterWater supply infrastructure: Provision and operation of infrastructure
for water supply (for example, household connections, standpipes, bore-holes, and rainwater harvesting)
Hydrological monitoring*: Operation and extension of hydrologicalmonitoring systems
SanitationSanitation infrastructure: Construction and operation of toilets (simple
pit latrines, ventilated improved pit latrines, septic tanks, flush toilets,etc.) and sewers, including emptying of pits and safe disposal of sullage
Sewage treatment: Construction and operation of simple sewage andother wastewater treatment facilities (such as waste stabilization ponds orother forms of primary treatment) where needed in dense urban settle-ments or because of specific environmental concerns (such as eutrophica-tion of freshwater lakes)
Awareness building: Targeted awareness building measures accompa-nying the provision of new sanitation infrastructure to ensure the choiceof the adequate technology option and proper use by all householdmembers
HygieneHygiene education: Awareness campaigns (in primary schools, through
community-based organization, media, etc.) to promote hygienic behav-ior, with particular focus on hand washing and personal hygiene, as wellas appropriate use of sanitation facilities and safe water storage
Urban Environmental ManagementPollution controlAir pollution control*: To be specified in each countryWater pollution control*: For example, industrial wastewater treat-
ment to complement sewage treatment, as necessarySolid waste and soil pollution control*: Construction and maintenance
of technically sound landfills
Sachs, McArthur, Schmidt-Traub, Kruk, Bahadur, Faye, and McCord 195
2259-02-Sachs.qxd 8/6/04 11:22 Page 195
Urban Industrial DevelopmentPrivate sector developmentExport processing zones*: Provision of export processing zones, indus-
trial parks, and other designated areas for private sector developmentIndustrial promotion activities*: Supportive policies, including tax
concessions and grants, as well as provision of additional infrastructurefor development of manufacturing and service industries
Area 5: Science, Technology, and Innovation
Science and technology institutionsScience and technology advice*: Creation of independent body
charged with providing scientific advice and technology forecasting topolicymakers
Higher education*: Extension and maintenance of higher educationsystem, with a particular focus on science and engineering education
Science and technology research*: Extension and maintenance of cen-ters of excellence for scientific research, including the financing ofresearch at universities and the establishment of science parks
Information and communications technologiesTelecommunications infrastructure*: Provision of telecommunica-
tions infrastructure, including international and trunk fiber infrastructure;provision of connectivity to hospitals and schools
Area 6: Gender Equality
Reproductive health rights and servicesAwareness of and access to reproductive health rights and services:
Legislation and awareness campaigns to decriminalize and enable safeaccess to abortions, to protect the rights of women to plan their families,to enable access to safe contraceptives, and to discourage female genitalmutilation and other harmful practices
Access to property rights and workEqual access to and treatment in work: Provision and enforcement of
equal opportunity legislation,* legislation promoting gender-sensitivepolicies such as provision of maternity and dependent care leave andtraining,* and support programs for women entrepreneurs and young girlstraining to transition to work
196 Brookings Papers on Economic Activity, 1:2004
2259-02-Sachs.qxd 8/6/04 11:22 Page 196
Equal access to property rights*: Legislation and administrative sup-port to provide and protect women’s equal rights to property and otherinherited and acquired assets
SecuritySecurity for girls and women from violence: Legislation and adminis-
trative actions to protect women against violence, promotion of aware-ness of women’s right to seek redress, protection from perpetrators ofviolence (through access to shelters, services, etc.), and mechanisms todispense justice to perpetrators
Participation and institutional reformPolitical representation*: Mechanisms (such as quotas and reserva-
tions) to allow for adequate representation at all levels of governmentalong with adequate training
Involvement of women’s groups at the village level*: Recognition ofand support to women’s groups organized at the village level to encour-age women to be partners in the design and delivery of public services
National women’s machineries (NWMs)*: Legislative and financialsupport to NWMs (defined by the United Nations as “a single body orcomplex organized system of bodies, often under different authorities, butrecognized by the government as the institution dealing with the promo-tion of the status of women”)
Data collection and monitoringGender-disaggregated data*: Collection of gender-disaggregated sta-
tistics on health, education outcomes, access to assets and infrastructure,conditions of work and employment, political representation, and gender-specific violence
Area 7: Cross-National Infrastructure, Trade Integration, and Government Cooperation
Transport InfrastructureRoadsNational highways and international transport corridors: Upgrading,
construction, and maintenance of paved highways for bulk transport
RailroadsRailroad infrastructure*: Extension, upgrading, and maintenance of
railroads, including rolling stock
Sachs, McArthur, Schmidt-Traub, Kruk, Bahadur, Faye, and McCord 197
2259-02-Sachs.qxd 8/6/04 11:22 Page 197
PortsPort infrastructure*: Construction and modernization of container port
facilities; dredging and other maintenance of portsIntegration of transport systems*: Construction and maintenance of
railroad and truck terminals for containerized freight
Energy InfrastructureThermal energy systemsPetroleum refining and storage*: As appropriate, rehabilitation and
extension of petroleum refining, pipeline, and storage systemsGas and oil pipelines*: Construction and maintenance of regional
pipelines to improve supply of fossil fuels (examples include the WestAfrican Gas Pipeline and the Kenya-Uganda oil pipeline)
ElectricityGeothermal electric power plants*: Construction of geothermal elec-
tric power plants in East Africa and parts of southern AfricaRegional electricity pool*: Extension of international electric power
grid through international high-voltage lines and pooling of electricitygrids to reduce peak generating capacity need
Trade Integration and Government CooperationTradeTrade liberalization and harmonization*: Opening of markets for
trade and finance, harmonization of standards, and facilitation of customsprocedures
Government cooperationSupranational institutions for regional public goods*: Establishment
of regional institutions and strengthening of regional cooperation onmigration, finance, monetary policies, watershed management, energypolicy, and other areas
198 Brookings Papers on Economic Activity, 1:2004
2259-02-Sachs.qxd 8/6/04 11:22 Page 198
A P P E N D I X B
Critical Intervention Areas for MDG Targets and Their Effects*
Income Poverty (MDG 1, target 1)
Agriculture—Increasing agricultural productivity directly raises the incomes of
the rural poor.
Nutrition—Better nutrition contributes to human capital accumulation and
improved labor productivity.
Education—Education increases human capital.—Education is linked to lower fertility rates, which in turn are linked
to increases in economic growth per capita.
Gender Equality—Awareness of and access to reproductive health rights and services
enable and empower women to plan their families, leading to lower fertil-ity rates and reduced poverty.
—Empowerment through access to work, property rights, political rep-resentation, and safety from violence leads to increased participation ofwomen in economic activity.
Health—Improved health has pervasive direct and indirect effects on raising
both the level and the growth rate of income.
Environment—Many poor people depend on natural resources for their livelihoods.
Improving natural resource management can sustain or even raise theirincomes.
Sachs, McArthur, Schmidt-Traub, Kruk, Bahadur, Faye, and McCord 199
*From UN Millennium Project (2004).
2259-02-Sachs.qxd 8/6/04 11:22 Page 199
Water and Sanitation—Improved water supply for productive activities can raise economic
growth through agriculture and the urban manufacturing and servicesectors.
Slum Upgrading and Urban Planning—Providing security of tenure can improve labor market participation
and access to credit markets.—Urban infrastructure, including transport systems, is necessary for
establishing manufacturing and service industries.
Science and Technology—Science and technology institutions improve technological learning
in society and improve the adoption of technology by the private sector.—Higher education can open new employment opportunities.
Energy—Access to electric power and improved thermal energy systems is
necessary for manufacturing, service, or cottage industries.
Transport—Roads, railroads, and ports lower transport costs and thereby
increase the real incomes of the poor.—In urban areas improved transport infrastructure supports manufac-
turing and service industries, contributing to employment.
Hunger (MDG 1, target 2)
Agriculture—Increasing agricultural productivity through investments in soil
health, water management, extension services, and improving food stor-age infrastructure increases food availability for subsistence farmers.
Nutrition—Nutrition interventions are needed for vulnerable populations and to
address micronutrient deficiencies.—Direct food assistance in food-scarce areas alleviates short-term
hunger.
200 Brookings Papers on Economic Activity, 1:2004
2259-02-Sachs.qxd 8/6/04 11:22 Page 200
Education—Literacy contributes to better management of nutritional needs and
farm production.
Gender Equality—Land rights allow women to increase agricultural production.—Increased access to work and higher incomes enable women to pur-
chase adequate food for themselves and their families.—Equal access to productive inputs increases plot yields.
Health—Reducing parasitic and infectious disease burden improves nutrition.
Environment—Improved water resource management and protection of water
catchment areas can raise crop yields.—Biodiversity protection sustains pollination and seed dispersal
mechanisms necessary for agricultural production.
Water and Sanitation—Safe drinking water reduces the incidence of water-borne diseases,
which cause malnourishment.—Drinking water supplied through wells and boreholes can help irri-
gate fields during unforeseen droughts.—Access to sanitation reduces the incidence of diarrheal disease and
thereby increases nutrient uptake.—Integrated water resources management sustains adequate water
supply for agriculture.—Water storage and water management infrastructure improve water
management for agriculture.
Slum Upgrading and Urban Planning—Slum upgrading and accompanying interventions help raise incomes
and reduce urban hunger.—Improved transport infrastructure lowers the cost of food products,
further reducing hunger.
Sachs, McArthur, Schmidt-Traub, Kruk, Bahadur, Faye, and McCord 201
2259-02-Sachs.qxd 8/6/04 11:22 Page 201
Science and Technology—Increased agricultural research is critical for improving seed vari-
eties, cropping systems, pest control, and water management, to increaseagricultural productivity, thus reducing hunger.
—Increased access to higher education can help increase the number ofagricultural extension workers.
—ICT improves farmers’ market information, raising agriculturalproduction.
Energy—Improved access to electricity and liquid fuels can power diesel
pumps for irrigation, facilitate mechanization, and power agroprocessingmachinery, thus increasing agricultural output and reducing hunger.
—Improved energy services lower transportation and marketing costs,which reduces food prices.
—Access to improved cooking fuels is necessary to ensure safe cook-ing of food.
Transport—Footpaths and feeder, district, and national roads lower the cost of
agricultural inputs, increase farmgate prices, and facilitate marketing,which can increase agricultural production.
—Improved transport infrastructure reduces postharvest losses throughaccelerated transport of products to markets.
Primary Education (MDG 2, target 3)
Education Interventions—Increase access to improved primary and secondary schools as well
as adult literacy programs through provision of infrastructure; hiring,improved remuneration, and training of teachers; provision of learningmaterials; curriculum reform; and demand-side interventions to retainchildren in school.
Agriculture—Agricultural interventions to improve soils, seeds, and water man-
agement raise rural incomes and reduce the time young children spend inthe field, freeing them to attend school.
202 Brookings Papers on Economic Activity, 1:2004
2259-02-Sachs.qxd 8/6/04 11:22 Page 202
Nutrition—Nutrition interventions for infants improve cognitive development
and improve learning outcomes in the future.
Gender Equality—Maternal education contributes strongly to higher primary
enrollment.
Health—Improved health enhances educational outcomes by improving cog-
nitive abilities and attendance rates.—AIDS prevention and treatment reduce the disease’s impact on
teacher attendance and attrition.—AIDS prevention and treatment reduce the number of orphans, who
are less likely to complete primary education.
Environment—Improved natural resource management can free up children’s time
and increase school attendance.
Water and Sanitation—Improved access to water frees up children’s time, thus allowing
them to attend school.—Improved health through sanitation and hygiene reduces school
absenteeism.—Girls’ toilets in schools can increase their enrollment and comple-
tion rates.
Slum Upgrading and Urban Planning—Security of land tenure and a fixed address are often necessary for
children to be allowed to attend school.
Science and Technology—Higher education is essential to training secondary school teachers
and provides additional incentives to complete primary and secondaryschool.
—ICT infrastructure can improve the quality of education.
Sachs, McArthur, Schmidt-Traub, Kruk, Bahadur, Faye, and McCord 203
2259-02-Sachs.qxd 8/6/04 11:22 Page 203
Energy—Access to electric power and improved cooking fuels lowers time
spent by children (especially girls) collecting fuel wood, thus facilitatingschool attendance.
—Improved access to liquid fuels is necessary to render mechanizedschool transport more affordable.
—Electrification permits children to read and study longer, thusimproving school outcomes.
Transport—Improved transport infrastructure and services increase incentives
for teachers to work in rural areas.—Feeder roads and footpaths reduce the time it takes for children to
reach school and allow them to travel farther, raising enrollment rates.—Improved roads and footpaths reduce the time required for house-
holds to fetch fuel and water and to carry out other tasks, lowering theopportunity cost of children attending school.
Gender Equality (MDG 3, target 4)
Direct Interventions—Programs to reduce violence against women, improve their property
and other rights, ensure full access to reproductive health services andcontraception, and improve women’s participation in decisionmakingprocesses.
Agriculture—Improved soils, seeds, and water provision can reduce the time girls
spend in the field, freeing them to attend school.—Increased agricultural production increases the incomes of women
farmers.
Nutrition—Nutrition interventions for girls (infants and children) lead to better
health and education outcomes.
Education—Education contributes to increased employment opportunities,
improved decisionmaking, and empowerment of women more broadly.
204 Brookings Papers on Economic Activity, 1:2004
2259-02-Sachs.qxd 8/6/04 11:22 Page 204
Health—Family planning services appear to improve employment opportuni-
ties for women, strengthen partner relationships, and provide a greatersense of well-being.
Environment—Women benefit disproportionately from improved management of
natural resources, including through time savings and reduced transportburden.
Water and Sanitation—Improved access to water generates time savings for women and
girls.—Improved access to water reduces the need to carry heavy loads over
long distances, thus improving women’s health.—Increasing access to toilets reduces women’s exposure to harass-
ment and improves personal hygiene and well-being.
Slum Upgrading and Urban Planning—Women benefit disproportionately from slum upgrading, since it
reduces their transport burden and time poverty, improves their health,and provides them with additional income generating opportunities.
Energy—Improved access to electricity and fuels reduces the time poverty of
women and lowers their daily transport burden.—Improved access to energy creates additional employment opportu-
nities for women.
Transport—Improved transport infrastructure reduces women’s time poverty
and transport burden.—Roads improve communication and lower transactions costs, thus
increasing employment opportunities for women.
Sachs, McArthur, Schmidt-Traub, Kruk, Bahadur, Faye, and McCord 205
2259-02-Sachs.qxd 8/6/04 11:22 Page 205
Child Mortality (MDG 4, target 5)
Health Interventions—Provide the neonatal integrated package of interventions, immuniza-
tion, the integrated management of childhood illness (IMCI), and therange of preventive approaches to public health (such as mass distributionof insecticide-treated bednets).
Agriculture—Increased rural incomes and food availability lead to improved
health outcomes.
Nutrition—Nutrition interventions for pregnant women lead to higher birth
weight, an important determinant of child survival.—Micronutrient supplementation and complementary feeding reduce
child mortality.
Education—Secondary education increases the age of marriage, lowers fertility
rates, and increases care seeking for child illnesses.—Adult literacy programs increase awareness of the causes and pre-
vention of child mortality.
Gender Equality—Women’s empowerment leads in multiple ways to greater awareness
of child health issues.
Environment—Reducing pollution of water and air can lower child morbidity and
mortality.
Water and Sanitation—Access to sanitation and improved hygiene reduce the incidence of
waterborne disease.
Slum Upgrading and Urban Planning—Slum upgrading, improved urban infrastructure, and access to basic
services (including solid waste disposal) can reduce exposure to pollu-tants and thereby reduce child mortality rates.
206 Brookings Papers on Economic Activity, 1:2004
2259-02-Sachs.qxd 8/6/04 11:22 Page 206
—Road curbing and street lighting can reduce traffic deaths.
Science and Technology—ICT improves diffusion of hygiene education and thereby lowers
child mortality.—Access to higher education increases the supply of health workers.
Energy—Reducing indoor air pollution through improved cooking fuels and
stoves decreases respiratory infections.—Improved access to energy allows households to boil water, thus
reducing the incidence of waterborne diseases.
Transport—Improved transport infrastructure increases access to health care
clinics and services and reduces costs for health care workers serving inrural areas.
Maternal Mortality (MDG 5, target 6)
Health Interventions—Ensure access to emergency obstetrical care, antenatal care, skilled
attendance, and clean delivery, as well as safe abortion.
Agriculture—Increased rural incomes and food intake lead to improved health
outcomes.
Nutrition—Nutrition interventions such as iron supplementation for women of
reproductive age reduce risk during pregnancy and childbirth.
Education—Secondary education increases the age of marriage, contraception
use, and access to prenatal care and safe delivery, all of which reducematernal mortality.
—Adult literacy programs increase awareness of the causes and pre-vention of maternal mortality.
Sachs, McArthur, Schmidt-Traub, Kruk, Bahadur, Faye, and McCord 207
2259-02-Sachs.qxd 8/6/04 11:22 Page 207
Gender Equality—Women’s empowerment leads to greater effective demand for pre-
natal care and safe delivery.
Water and Sanitation—Running water and sanitation facilities are essential for provision of
prenatal care and emergency obstetric care.—Access to sanitation and hygienic behavior improve women’s
health.
Slum Upgrading and Urban Planning—Slum upgrading and security of land tenure improve women’s
access to health systems and emergency obstetric care.
Science and Technology—ICT is critical for providing adequate access to emergency obstetric
care.—Access to higher education increases the supply of health workers.
Energy—Improved access to energy services improves communication and
transport, which are critical for emergency obstetric care.—Modern energy services reduce the costs for health care workers
serving in rural areas.
Transport—Feeder roads are critical for providing timely access to emergency
obstetric care.—Improved transport infrastructure reduces the costs for health care
workers serving in rural areas.
HIV/AIDS (MDG 6, target 7)
Health Interventions—Provide comprehensive HIV/AIDS prevention programs, orphan
support, voluntary counseling and testing, harm reduction for drug users,prevention of mother-to-child transmission, antiretroviral treatment, andtreatment of opportunistic infections.
208 Brookings Papers on Economic Activity, 1:2004
2259-02-Sachs.qxd 8/6/04 11:22 Page 208
Agriculture—Increased agricultural incomes improve access to prevention
services.
Nutrition—Adequate nutrition interventions can improve survival and quality of
life of patients with HIV/AIDS.
Education—Education and literacy programs increase awareness of ways to pre-
vent and treat HIV/AIDS.
Gender Equality—Women’s empowerment leads to greater effective demand for HIV/
AIDS prevention and treatment, including the ability to negotiate safesexual practices.
Water and Sanitation—Improving access to clean water and sanitation improves the nutri-
tional status of HIV/AIDS patients.
Slum Upgrading and Urban Planning—Slum upgrading and security of land tenure improve access to HIV/
AIDS treatment and prevention.
Science and Technology—Scientific research can improve the diagnosis and treatment of
HIV/AIDS.—ICT is critical for media-based HIV/AIDS prevention.—Access to higher education increases the supply of health workers.
Energy—Electricity and modern energy services support functioning health
clinics and hospitals.—Modern energy services increase incentives for health workers to
work in rural areas.
Sachs, McArthur, Schmidt-Traub, Kruk, Bahadur, Faye, and McCord 209
2259-02-Sachs.qxd 8/6/04 11:22 Page 209
Transport—Improved transport infrastructure facilitates treatment and preven-
tion of HIV/AIDS.—Improved transport infrastructure reduces costs for health workers
serving in rural areas.
Malaria and Other Major Diseases (MDG 6, target 8)
Health Interventions—Combine comprehensive use of insecticide-treated bednets, indoor-
residual spraying where appropriate, effective malaria treatment (usingartemisinin combination therapies where appropriate), and epidemic con-trol measures.
—Contain tuberculosis through promotion of vaccines, Directly Ob-served Treatment Short-Course (DOTS) protocol, and DOTS-Plus formulti-drug-resistant tuberculosis.
Agriculture—An increase in agricultural incomes improves access to and informa-
tion about ways of preventing and treating malaria.
Education—Education and literacy programs increase awareness of ways to pre-
vent and treat malaria and tuberculosis.
Gender Equality—Women’s empowerment leads to greater effective demand for insec-
ticide-treated nets and malaria and tuberculosis treatment.
Environment—In some instances environmental control can contribute to contain-
ing malaria.
Water and Sanitation—In some instances improved water management in urban areas can
contribute toward containing mosquito breeding sites and transmission.
210 Brookings Papers on Economic Activity, 1:2004
2259-02-Sachs.qxd 8/6/04 11:22 Page 210
Slum Upgrading and Urban Planning—Improving housing and urban water management infrastructure can
reduce the incidence of malaria and especially tuberculosis (which istransmitted in overcrowded slum conditions).
—Slum upgrading improves access to appropriate malaria and tuber-culosis treatment.
Science and Technology—Research is necessary to develop new drugs and diagnostics for
malaria and tuberculosis.—Access to higher education increases the supply of health workers.
Energy—Electricity and modern energy services improve health care.—Modern energy services reduce costs for health care workers serving
in rural areas.
Transport—Improved transport infrastructure reduces the cost of distributing
bednets.—Improved transport infrastructure increases incentives for health
care workers to work in rural areas.
Access to Essential Medicines (MDG 8, target 17)
Health Interventions—Improve supply and distribution systems for essential medicines
together with strengthened quality control and quality assurance and pro-grams to promote rational use.
Agriculture—An increase in agricultural incomes makes essential medicines more
affordable.
Education—Education and literacy programs increase access to and appropriate
use of essential medicines.
Sachs, McArthur, Schmidt-Traub, Kruk, Bahadur, Faye, and McCord 211
2259-02-Sachs.qxd 8/6/04 11:22 Page 211
Gender Equality—Women’s empowerment leads to greater effective demand for essen-
tial medicines of good quality.
Science and Technology—Research increases the total stock and effectiveness of essential
medicines.
Transport—Improved transport infrastructure lowers the cost of essential medi-
cines and improves access.
Reverse Loss of Environmental Resources (MDG 7, target 9)
Environmental Interventions—Improve management of natural resources through market mecha-
nisms, strengthened regulation and enforcement, and investments in themanagement of critical ecosystems.
Agriculture—Investments in soil health replenish soils and prevent further land
degradation.—Intensive agricultural production is an alternative to slash-and-burn
and to the deforestation that results.—Small-scale water management can restore water tables and prevent
runoff.
Gender Equality—Equal access to property rights allows women, as primary users, to
manage natural resources in a sustainable manner.
Health—Family planning reduces total fertility rates, thus mitigating popula-
tion pressures on the environment.
Water and Sanitation—Improved sanitation and sewage treatment can reduce environmen-
tal pollution.
212 Brookings Papers on Economic Activity, 1:2004
2259-02-Sachs.qxd 8/6/04 11:22 Page 212
—Integrated water resources management can ensure sufficient “greenwater” necessary for ecosystem functioning.
—Hydrological monitoring systems can help protect aquifers andfreshwater ecosystems from excessive withdrawals.
Slum Upgrading and Urban Planning—Slum upgrading and improved urban water and waste management
infrastructure reduce environmental pollution.
Science and Technology—Research can improve natural resource management (including
management of freshwater ecosystems and wetlands, biodiversityconservation).
Energy—Access to modern cooking fuels reduces demand for biomass cook-
ing fuels, thus reducing pressure on marginal lands and forests.—Improved energy services reduce outdoor air pollution.—Improved energy services can reduce carbon emissions.
Water and Sanitation (MDG 7, target 10)
Water and Sanitation Interventions—Provide, operate, and maintain water and sanitation infrastructure
and services in conjunction with behavior change programs to improvehousehold hygiene.
Agriculture—Small-scale water management increases water availability for rural
farmers.
Education—Education and literacy programs improve hygiene.
Gender Equality—Political representation allows women to ensure that access to water
is a priority in local decisionmaking.
Sachs, McArthur, Schmidt-Traub, Kruk, Bahadur, Faye, and McCord 213
2259-02-Sachs.qxd 8/6/04 11:22 Page 213
Environment—Improved management of wetlands, water catchment areas, and
freshwater ecosystems is critical for ensuring access to drinking water.—Control of industrial pollution improves drinking water quality.
Slum Upgrading and Urban Planning—Slum upgrading reduces water pollution and improves drinking
water quality.—Improved urban infrastructure ensures the separation of sewage
from drinking water supplies.
Science and Technology—Research can help improve sanitation and water management
techniques.—Access to higher education increases the supply of trained workers
to design and manage water supply and sewer infrastructure.
Energy—Electricity and improved access to modern fuels are necessary to
power water supply infrastructure and water treatment systems.
Transport—Improved transport infrastructure facilitates provision, operation,
and maintenance of water supply and sanitation systems.—Improved transport systems reduce the costs of providing hygiene
education through community workers.
Improve Lives of Slum Dwellers (MDG 7, target 11)
Direct Interventions—Scale up slum upgrading programs with the support of improved
urban planning and investments in core urban infrastructure as well asbasic services.
Agriculture—Investing in urban agriculture increases agricultural productivity and
the incomes of slum dwellers.
214 Brookings Papers on Economic Activity, 1:2004
2259-02-Sachs.qxd 8/6/04 11:22 Page 214
Nutrition—Nutrition interventions improve the health outcomes of urban popu-
lations.
Education—Education and literacy programs improve the employment prospects
of slum dwellers.
Gender Equality—Equal access to property rights, political representation, and security
for girls and women allows women living in slums to improve their livesand the lives of their families.
Health—Access to health services reduces the burden of ill health for slum
dwellers.
Environment—Improving solid waste disposal and water treatment can improve
health outcomes.
Water and Sanitation—Improved access to water supply and sanitation services can reduce
household expenditure on water.—Sewage treatment can further improve health outcomes in urban
areas.—Storm water drainage systems are improved through sanitation
infrastructure, thus minimizing the risk of flooding.
Science and Technology—Higher education provides new employment opportunities for the
urban poor.—ICT reduces the cost of income-generating activities.
Energy—Improving access to electricity and modern fuels lowers indoor air
pollution.
Sachs, McArthur, Schmidt-Traub, Kruk, Bahadur, Faye, and McCord 215
2259-02-Sachs.qxd 8/6/04 11:22 Page 215
—Access to electricity and modern fuels can lower household expendi-ture on energy services, thus raising incomes.
—Improved energy services lower the cost of urban transport.
Transport—Improved rural transport infrastructure reduces the cost of food in
urban areas, thus increasing real incomes.—Improved urban transport infrastructure is critical to enhancing
income-generating opportunities as well as access to social services.—Proper sidewalks and curbing are critical to reduce traffic deaths.
Information and Communications Technology (MDG 8, target 18)
Direct Interventions—Strengthen science advisory mechanisms, invest in higher education
and research, promote private sector development, and improve access tocommunications technologies.
Agriculture—Increased agricultural incomes improve access to ICT.
Education—Secondary education prepares students to provide, use, and manage
ICT.
Energy—Electricity is necessary to power ICT applications and to operate
research institutions.
216 Brookings Papers on Economic Activity, 1:2004
2259-02-Sachs.qxd 8/6/04 11:22 Page 216
Comments and Discussion
Michael Kremer: This is an interesting and indeed provocative paper,arguing for a large increase in foreign aid to Africa to help the continentescape from a poverty trap. I agree that aid should be increased, but I willtake issue with a few of the building blocks in the authors’ analysis andwill suggest an alternative case for aid. In particular, I will argue that thelimited empirical evidence seems just as consistent with conventionalgrowth models, in which government quality and policies determinesteady-state income, as with the idea that Africa is caught in a povertytrap. This should not be taken as an argument against aid, however,because there is little evidence for the “new Washington consensus” thataid cannot work in areas with weak governments and that conditionality isa failure. In fact, the case for aid may be greater where governments aredoing a poor job. I will conclude by arguing that planning developmentexpenditure around the Millennium Development Goals (MDGs) risksgenerating distortions.
Poverty trap models suggest that if countries can get over a certainincome threshold, they will take off economically. These models there-fore suggest that aid can have a powerful effect by raising countries overthis threshold. The basic microeconomic case for poverty traps typicallyinvolves nonconvexities. However, even if nonconvexities exist at themicroeconomic level (for example, lumpy capital investments), it is notclear that they exist at the macroeconomic level. If a certain level of trans-port and communications infrastructure is needed for development, forexample, one could imagine a country starting out by building this levelof infrastructure in a single port or capital city and then expanding out-ward. This might eliminate nonconvexities at the macroeconomic level.
217
2259-02-Sachs.qxd 8/6/04 11:22 Page 217
Setting aside the theoretical issue, the question arises of how onewould empirically distinguish a poverty trap model from a conventionalmodel in which government policy determines steady-state income. Inthis model, countries converge to steady-state income from above or frombelow, depending on initial income. One can consider both micro-economic and macroeconomic approaches.
There are certainly some people in Africa with money to invest, and insome poverty trap models those people should be able to set up very pros-perous enterprises, hire more and more labor, and expand their enterprisesrapidly. However, we do not see that happening. In fact, many peoplewith money in Africa move it to Europe or elsewhere rather than takeadvantage of the potentially huge returns available under poverty trapmodels to people who can reach a certain scale of investment.
At the macroeconomic level, poverty trap models suggest that Africancountries that attain a threshold income level should then take off. Again,this does not appear to be the case. In 1998 Gabon’s GNP per capita was$3,870, but by 2002 its GNP per capita had fallen to $3,060.1 In 1980Nigeria’s GNP per capita was almost $1,000, but in 2002 it was only$300. Many argue that governments tend to waste oil revenue, but, in apure poverty trap model, cases such as Nigeria are difficult to explain.Nor is the problem limited to countries with oil: consider the case of Zam-bia, where GNP per capita was $680 in 1981 but $340 in 2002. Nor is itlimited to minerals in general: Côte d’Ivoire had for a while a relativelyhigh income per capita for Africa, but then the economy collapsed. Zim-babwe had a GDP per capita of over $1,100 in 1982, but it had fallen to$480 by 2002 and is presumably below that now. South Africa’s incomeper capita is certainly above the level associated with poverty traps in thispaper, but it has not taken off economically.2 One relatively well offAfrican country with good economic performance is Botswana, but withstrong economic policies, democracy, and ethnic homogeneity, its experi-ence is just as consistent with the story that good government is central aswith the poverty trap story.
Under a conventional model, countries experiencing a large negativeshock should grow quickly once conditions change for the better, whereasin poverty trap models they will stagnate. In fact, the fastest-growingcountries in Africa in recent years have been Uganda and Mozambique,
218 Brookings Papers on Economic Activity, 1:2004
1. All data cited here are from World Bank (2004a).2. See, for example, World Bank (2004b).
2259-02-Sachs.qxd 8/6/04 11:22 Page 218
both of which suffered major shocks due to war, followed by the estab-lishment of a government with good economic policies. (It is worth not-ing that aid has played a major role in each case.)
The authors argue that indicators of government quality in Africa areno worse than expected given income levels. The authors perform a ser-vice here by challenging stereotypes that many people have about Africa.For example, many seem to feel that Africa is uniquely mired in tribalviolence. Yet when one compares the body count in Africa with that ofEurope during the twentieth century, it is hard to make the case thatAfricans are more subject to ethnic strife than Europeans.
However, I do not think that one can argue from the authors’ regres-sion results that government policy is not fairly fundamental to Africa’sproblems. First, it is not clear that traditional measures are well suited tomeasuring the problems of government in Africa. For example, thesemeasures are not designed to pick up the absence of government. Somaliadoes not have a central government, and even stable countries likeUganda or Kenya have areas where the government provides little secu-rity. Another issue is that respondents in corruption surveys may begiving judgments relative to expectations, and they may have low expec-tations for Africa.
More fundamentally, even if African countries do not have worse gov-ernments than would be expected given their income level, this does notimply that government quality does not determine income. In a model inwhich government quality determines income, African governmentsshould be no worse than expected, given their income. If other factors (forexample, geography) also contribute to African poverty, one wouldexpect that African governments would look good relative to theirincome. Thus the authors’ regression results are consistent with a modelin which government quality and economic policies are the primary deter-minants of income, with other factors, such as the geographic factors thatSachs has discussed in previous work, also playing a role.
Although I find it quite plausible that Africa’s poverty is due as muchto poor economic policy and bad government as to a poverty trap, I sup-port the paper’s call for large increases in aid. I do so largely because Ireject the current consensus in the development policy community thataid will only be effective if it is given to good governments and thatconditionality has failed. The empirical evidence for both these proposi-tions is weak.
Sachs, McArthur, Schmidt-Traub, Kruk, Bahadur, Faye, and McCord 219
2259-02-Sachs.qxd 8/6/04 11:22 Page 219
Theoretically, one could imagine that aid directed at countries with“bad” governments would be much more effective. Consider, for exam-ple, a government that is neither vaccinating children nor adequatelyfinancing primary education, but rather is spending all of its resources onpalaces. The fact that kids are not being vaccinated or sent to primaryschool implies that high-value investments are available in the country forpotential donors. There are certainly incentive issues in giving largeamounts of aid to bad governments, but aid need not be given to govern-ments. Donors could provide aid to whatever institutions in the countryare educating children, whether they be private schools or nonprofit orga-nizations. Such an arrangement may well strengthen alternative powerbases and even help promote reform.
It is also unclear to me why we have given up on conditionality. Theclassic poster child for the failures of conditionality was supposed to beKenya. Many observers, including the Economist, have retold the story ofhow President Daniel arap Moi took advantage of soft-hearted or weakwilled donors at the IMF and the World Bank: Moi promises to reform,donors give him money, Moi reneges on his promises; Moi later makesanother set of promises, gets more money from the donors, and renegesagain, in cycle after cycle.
Arguably, this story has things exactly backward. Conditionality didinduce Moi to make both economic and political changes, including free-ing the exchange rate, expanding scope for freedom of speech and cre-ation of political parties, and instituting term limits. As a direct result ofthese changes, term limits in particular, Moi is out of office now, andKenya is a reasonably well functioning democracy. The idea that condi-tionality is never effective and that governments always manipulatedonors is hard to reconcile with the idea that conditionality can actuallyforce a leader like Moi out of office. Nor is such an outcome at all uniqueto Kenya. There has been political reform across Africa, in large part as areaction to pressure from donors.
At the same time, we should admit that we do not know very muchabout what will produce growth in Africa or when that will happen. In myview, although the case that economic policy—and, ultimately, govern-ment quality—influence income is supported by somewhat more evidencethan the poverty trap view, we know very little about what does produceeconomic growth, and even less about how aid can play a major role instimulating economy-wide growth.
220 Brookings Papers on Economic Activity, 1:2004
2259-02-Sachs.qxd 8/6/04 11:22 Page 220
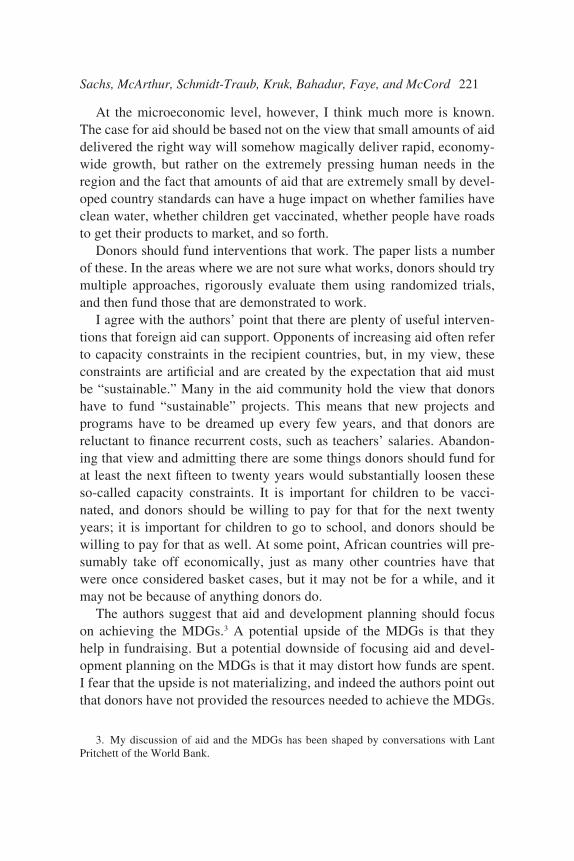
At the microeconomic level, however, I think much more is known.The case for aid should be based not on the view that small amounts of aiddelivered the right way will somehow magically deliver rapid, economy-wide growth, but rather on the extremely pressing human needs in theregion and the fact that amounts of aid that are extremely small by devel-oped country standards can have a huge impact on whether families haveclean water, whether children get vaccinated, whether people have roadsto get their products to market, and so forth.
Donors should fund interventions that work. The paper lists a numberof these. In the areas where we are not sure what works, donors should trymultiple approaches, rigorously evaluate them using randomized trials,and then fund those that are demonstrated to work.
I agree with the authors’ point that there are plenty of useful interven-tions that foreign aid can support. Opponents of increasing aid often referto capacity constraints in the recipient countries, but, in my view, theseconstraints are artificial and are created by the expectation that aid mustbe “sustainable.” Many in the aid community hold the view that donorshave to fund “sustainable” projects. This means that new projects andprograms have to be dreamed up every few years, and that donors arereluctant to finance recurrent costs, such as teachers’ salaries. Abandon-ing that view and admitting there are some things donors should fund forat least the next fifteen to twenty years would substantially loosen theseso-called capacity constraints. It is important for children to be vacci-nated, and donors should be willing to pay for that for the next twentyyears; it is important for children to go to school, and donors should bewilling to pay for that as well. At some point, African countries will pre-sumably take off economically, just as many other countries have thatwere once considered basket cases, but it may not be for a while, and itmay not be because of anything donors do.
The authors suggest that aid and development planning should focuson achieving the MDGs.3 A potential upside of the MDGs is that theyhelp in fundraising. But a potential downside of focusing aid and devel-opment planning on the MDGs is that it may distort how funds are spent.I fear that the upside is not materializing, and indeed the authors point outthat donors have not provided the resources needed to achieve the MDGs.
Sachs, McArthur, Schmidt-Traub, Kruk, Bahadur, Faye, and McCord 221
3. My discussion of aid and the MDGs has been shaped by conversations with LantPritchett of the World Bank.
2259-02-Sachs.qxd 8/6/04 11:22 Page 221
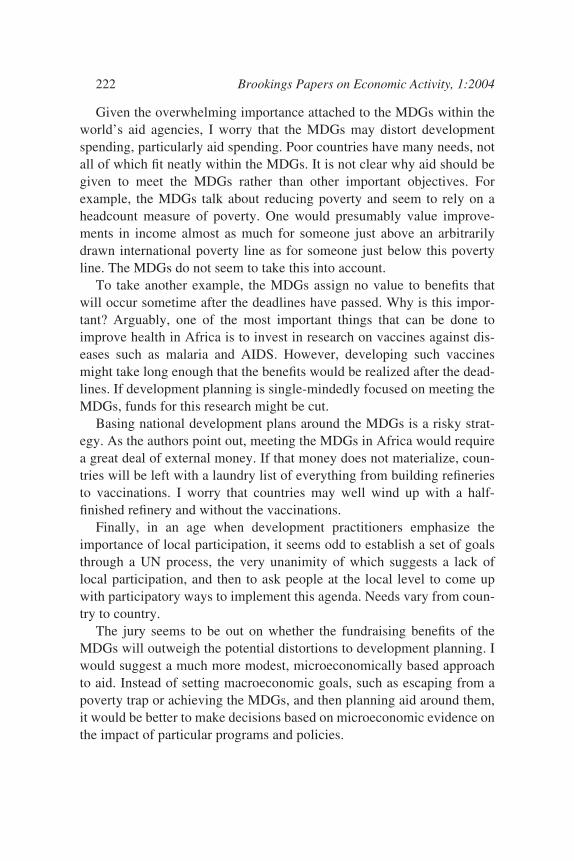
Given the overwhelming importance attached to the MDGs within theworld’s aid agencies, I worry that the MDGs may distort developmentspending, particularly aid spending. Poor countries have many needs, notall of which fit neatly within the MDGs. It is not clear why aid should begiven to meet the MDGs rather than other important objectives. Forexample, the MDGs talk about reducing poverty and seem to rely on aheadcount measure of poverty. One would presumably value improve-ments in income almost as much for someone just above an arbitrarilydrawn international poverty line as for someone just below this povertyline. The MDGs do not seem to take this into account.
To take another example, the MDGs assign no value to benefits thatwill occur sometime after the deadlines have passed. Why is this impor-tant? Arguably, one of the most important things that can be done toimprove health in Africa is to invest in research on vaccines against dis-eases such as malaria and AIDS. However, developing such vaccinesmight take long enough that the benefits would be realized after the dead-lines. If development planning is single-mindedly focused on meeting theMDGs, funds for this research might be cut.
Basing national development plans around the MDGs is a risky strat-egy. As the authors point out, meeting the MDGs in Africa would requirea great deal of external money. If that money does not materialize, coun-tries will be left with a laundry list of everything from building refineriesto vaccinations. I worry that countries may well wind up with a half-finished refinery and without the vaccinations.
Finally, in an age when development practitioners emphasize theimportance of local participation, it seems odd to establish a set of goalsthrough a UN process, the very unanimity of which suggests a lack oflocal participation, and then to ask people at the local level to come upwith participatory ways to implement this agenda. Needs vary from coun-try to country.
The jury seems to be out on whether the fundraising benefits of theMDGs will outweigh the potential distortions to development planning. Iwould suggest a much more modest, microeconomically based approachto aid. Instead of setting macroeconomic goals, such as escaping from apoverty trap or achieving the MDGs, and then planning aid around them,it would be better to make decisions based on microeconomic evidence onthe impact of particular programs and policies.
222 Brookings Papers on Economic Activity, 1:2004
2259-02-Sachs.qxd 8/6/04 11:22 Page 222
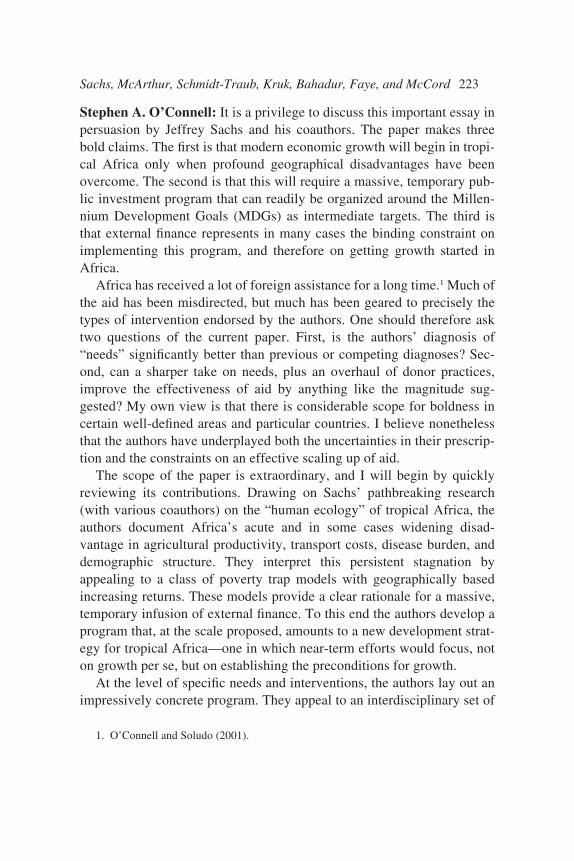
Stephen A. O’Connell: It is a privilege to discuss this important essay inpersuasion by Jeffrey Sachs and his coauthors. The paper makes threebold claims. The first is that modern economic growth will begin in tropi-cal Africa only when profound geographical disadvantages have beenovercome. The second is that this will require a massive, temporary pub-lic investment program that can readily be organized around the Millen-nium Development Goals (MDGs) as intermediate targets. The third isthat external finance represents in many cases the binding constraint onimplementing this program, and therefore on getting growth started inAfrica.
Africa has received a lot of foreign assistance for a long time.1 Much ofthe aid has been misdirected, but much has been geared to precisely thetypes of intervention endorsed by the authors. One should therefore asktwo questions of the current paper. First, is the authors’ diagnosis of“needs” significantly better than previous or competing diagnoses? Sec-ond, can a sharper take on needs, plus an overhaul of donor practices,improve the effectiveness of aid by anything like the magnitude sug-gested? My own view is that there is considerable scope for boldness incertain well-defined areas and particular countries. I believe nonethelessthat the authors have underplayed both the uncertainties in their prescrip-tion and the constraints on an effective scaling up of aid.
The scope of the paper is extraordinary, and I will begin by quicklyreviewing its contributions. Drawing on Sachs’ pathbreaking research(with various coauthors) on the “human ecology” of tropical Africa, theauthors document Africa’s acute and in some cases widening disad-vantage in agricultural productivity, transport costs, disease burden, anddemographic structure. They interpret this persistent stagnation byappealing to a class of poverty trap models with geographically basedincreasing returns. These models provide a clear rationale for a massive,temporary infusion of external finance. To this end the authors develop aprogram that, at the scale proposed, amounts to a new development strat-egy for tropical Africa—one in which near-term efforts would focus, noton growth per se, but on establishing the preconditions for growth.
At the level of specific needs and interventions, the authors lay out animpressively concrete program. They appeal to an interdisciplinary set of
Sachs, McArthur, Schmidt-Traub, Kruk, Bahadur, Faye, and McCord 223
1. O’Connell and Soludo (2001).
2259-02-Sachs.qxd 8/6/04 11:22 Page 223
literatures to identify effective interventions in agriculture, health, andeducation. They cost these out on a country-specific basis for Ghana, Tan-zania, and Uganda. In an exercise familiar to all aid practitioners butexemplary in important respects—including its treatment of recurrentcosts and the incentive effects of user fees—they calculate a financinggap. The bottom line is daunting but perhaps doable: the MDGs forincome poverty, health, and education can be met in these countriesthrough a (first sharply, then gradually) scaled-up commitment that wouldroughly double real aid levels for a decade. In a final section the authorslay out a program for addressing donor shortcomings that might hampersuccess.
Perhaps the most striking bit of persuasion in the paper is its ex postmotivation of the MDGs as take-off thresholds in a big-push developmentstrategy. It is important that this argument not obscure two features of theMDGs that have already proved critical in rallying global support forincreased aid to Africa. The first is their intrinsic appeal as merit goods.Here Sachs’ work on economic geography continues to be instrumental indeepening our understanding of the particular deficits faced by Africanpopulations. The second is the political genius of the MDGs, as a set ofwell-defined targets squarely centered on poverty reduction and humandevelopment. As the authors point out, this is an agenda that cannot easilybe rejected by any party to the aid relationship. As such it may provide aframework for overcoming the conflicts of interest that have underminedthis relationship in the past.
Let me now turn to the substance of the paper, starting with the devel-opment strategy it proposes. This strategy has noble (even Nobel) lineage.In 1953 future laureate W. Arthur Lewis advised the government of theGold Coast (soon to become Ghana) as follows. “The main obstacle todevelopment,” he wrote, “is the fact that agricultural productivity per manis stagnant. Very many years will have elapsed before it becomes eco-nomical for the government to transfer any large part of its resourcestowards industrialization and away from the more urgent priorities ofagricultural productivity and public services.”2 This is precisely thesequencing argument of the present paper. Nor is the geographical scopeof the current argument much different, because in 1953 Ghana had anunambiguous head start in human development relative to most of tropi-
224 Brookings Papers on Economic Activity, 1:2004
2. Lewis (1953, paragraph 255; reprinted in Kay, 1972, p. 88).
2259-02-Sachs.qxd 8/6/04 11:22 Page 224
cal Africa. Lewis would have extended the same advice to most of thecontinent.
Ghana’s early development plans decisively rejected Lewis’s advice.Like many African leaders, Kwame Nkrumah viewed agriculture as inertand industrialization as the way forward. That view was consistent, ironi-cally, with Lewis’s famous 1954 paper, in which agriculture provides asurplus that can be leveraged into capital accumulation and growth in theindustrial sector.3 But it ignored Lewis’s deeper advice that the precondi-tions were not yet there in Ghana: agricultural productivity was too low togenerate a surplus.
Mauritius had something closer to a Korean-style head start in the1950s, and here Lewis’s shadow fell more heavily, although not to bettereffect. In Mauritius future Nobel laureate James Meade dispensed advicethat was vintage Lewis 1954.4 This meant a disastrous ten-year detourinto import-substituting industrialization. It was only in the late 1960sthat this small island economy began to leverage its favorable precondi-tions (and the rents from sugar preferences) into an outward-orientedstrategy based on labor-intensive textile exports.
The strategy advanced here therefore resonates with what at least onedeep observer of the African situation saw as early as the 1950s. More-over, although the authors do not really answer the “what next” question,Mauritius must be the model they have in mind. This would be consistentwith the 1998 Brookings Paper by Sachs and David Bloom, which notesthe hostile environment for African agriculture and (gingerly) endorses amove into labor-intensive manufacturing and services.5 Relative to Bloomand Sachs 1998, the current paper says that a platform must be built first,in the rural economy and in human development. Relative to Lewis 1953,the difference is one of urgency and scale: the platform should be con-structed over the next decade, in a big push.
The contrast with Lewis 1953 highlights the central challenge thispaper throws down to donors: are they being anywhere near bold enough?I think there is tremendous scope for scaling up donor activity in thebroad area of science-intensive regional public goods, including basicresearch in health and agriculture. Here successful models are available,
Sachs, McArthur, Schmidt-Traub, Kruk, Bahadur, Faye, and McCord 225
3. Lewis (1954).4. Meade and others (1961).5. Bloom and Sachs (1998).
2259-02-Sachs.qxd 8/6/04 11:22 Page 225
including the eradication of polio and the development of high-yieldingseed varieties in the Green Revolution in Asia; and donors have an unam-biguous comparative advantage in the direct provision or local supervi-sion of this effort. I also believe that donors should be much bolder inproviding debt relief, which is a matter of housecleaning rather than netresource transfers; here Jubilee 2000 had it right, and the HeavilyIndebted Poor Countries initiative has it wrong. But where the currentpaper innovates is in advocating a massive and externally funded scalingup of in-country public service delivery. This is vintage capital funda-mentalism, and here the challenge reverses itself. The central thrust of theliterature on African development has been to dismiss capital fundamen-talism as a viable interpretation of Africa’s way forward: are the authorsbeing too bold?
To answer this I will start with the gap calculation itself. Such calcula-tions are structurally optimistic, because they are designed to spur theambitions of donors. But their empirical failings in traditional growth-targeting applications are sobering.6 Similar weaknesses confront a gap-financing approach to the MDGs, and particularly one of the scaleproposed here. For Tanzania (the results for Ghana and Uganda are simi-lar), the authors call for a 78 percent increase in real domestic MDG-based spending in the first year of the program, followed by a decade offurther real increases at nearly 7 percent a year.7 The initial increases inMDG spending and aid are each on the order of 10 percent of GDP. Thelatter is a lower bound, moreover; some big-ticket items are left out, andconstant, state-of-the-art efficiency is assumed. Nor is there any genuinesense in which the program proposed here can look any different in 2016than it does in 2015, as the authors acknowledge.
It is clear, then, that if absorptive capacity constraints are at all relevantin African countries, the scale of this program will bring them to the fore.The question is not whether the “needs” identified here are genuine; theyare. But the African development literature locates ongoing needs—orcapital shortages—in dysfunctional policy environments, and dysfunc-tional policy environments in weak institutions. The authors acknowledgethis by limiting their proposal to countries in which policies and institu-tions are reasonably good, after controlling for income. This is an impor-
226 Brookings Papers on Economic Activity, 1:2004
6. Easterly (1999).7. Calculated from detailed spreadsheets generously provided by the authors.
2259-02-Sachs.qxd 8/6/04 11:22 Page 226
tant concession to reality, but the proviso is a non sequitur. The questionis not whether governance is good relative to income, but whether it isgood enough in absolute terms to avoid sharply diminishing returns oreven outright institutional deterioration when managing a massive scalingup of public services.
The point that “absorptive capacity matters” is my central one, and Iwill briefly develop it in three arenas. First, Sachs has written eloquentlyelsewhere about the curse of natural resources. If financial resources werethe binding constraint, African countries that have enjoyed persistentcommodity booms should have leveraged those into an exit from the trap.They have systematically failed to do so. One reason may be that com-modity rents have tended to become a focal point for distributional strug-gles that have undermined policy and institutional performance. Aid maybe better in this respect; unlike commodity rents, it is encumbered bydonors, who pay at least some attention to the activities being financed.Paul Collier and Anke Hoeffler have shown empirically, for example, thatwhereas natural resource abundance tends to increase armed conflict,higher levels of aid do not.8 But the limited and even adverse develop-ment impacts of commodity rents nonetheless pose serious questionsabout state capability in Africa, and about the idea that resources are thekey constraint. If some form of accountability has indeed been critical inforging a constructive link between aid and conflict, the question iswhether this accountability can be scaled up to support a doubling andmore of public service delivery by weak government institutions.
The natural resource curse may also manifest itself via the Dutch dis-ease, and in my own view the authors are on shaky ground in dismissingthis. It is impossible for monetary policy to peg the real exchange rateover anything more than a temporary period. A large and persistent aidinflow that is geared toward domestic spending on nontraded goods andservices is therefore very likely to create a serious competitiveness prob-lem in the near term. In effect, the authors are placing another large bet ontheir sequencing argument: the implicit view here is that there is no pointto having a competitive real exchange rate if a country lacks the humancapital to go with it. This argument may be correct, but in the interim
Sachs, McArthur, Schmidt-Traub, Kruk, Bahadur, Faye, and McCord 227
8. Collier and Hoeffler (2002a, 2002b). The natural resource effect is nonlinear, but therisk of conflict peaks when the ratio of natural resource exports to GDP is quite high(30 percent).
2259-02-Sachs.qxd 8/6/04 11:22 Page 227
export diversification will clearly have to wait; and the empirical evidencestrongly suggests that trade is more important for growth in Africa than itis elsewhere.9
Second, the authors assume “perfect delivery” of public services.Again the scale of the operation gives rise to concern. Improving publicservice delivery is currently at the frontier of public sector reform inAfrica. But if institutions are currently weak, does it make sense toexpand their financing and their mandate very rapidly? This might evenexacerbate existing weaknesses. In a recent paper, Jean-Paul Azam, Shan-tayanan Devarajan, and I develop a trap model that is formally similar tothe ones developed in this paper.10 But ours is a dependency trap, in whichdonor activities tend to drive out the institutional learning-by-doing that iscritical to improved governance. If donors ignore this link between aidand institutional development, they can trap themselves and the recipientin a high-aid, low-institutional-capacity equilibrium. The possibility isnot one we are allowed to dismiss after forty years of high aid and lowgrowth.
As a third point, there has been substantial recent progress in buildinggreater accountability into aid design, through the use of outcomes-basedassessments. But how far can such assessments take us in ensuring highproductivity of public service delivery? As Lant Pritchett and MichaelWoolcock point out in a recent paper, many of the MDG services areboth transactions-intensive and discretionary.11 Unlike macroeconomicreforms, the delivery of many health and education services requires thecollaboration of multiple individuals who make highly discretionarychoices in an environment where many key actions are unobservable.Such services cannot be delivered by a few politically protected tech-nocrats, or even by a ministry stamping out a well-defined protocol in dis-parate locations. They are intrinsically subject to deep incentiveproblems. Consistent with this reality, the empirical link from spendingon health and education to outcomes is notoriously weak—a point empha-sized by the World Bank’s 2004 World Development Report.12
The final section of the paper lays out a program to address a set ofdonor shortcomings—short horizons, inadequate ambition, and poor
228 Brookings Papers on Economic Activity, 1:2004
9. Collier and Gunning (1999); Block (2001).10. Azam, Devarajan, and O’Connell (2002).11. Pritchett and Woolcock (2002).12. World Bank (2003d).
2259-02-Sachs.qxd 8/6/04 11:22 Page 228
coordination—to which the authors attribute past failures in aid effective-ness. These shortcomings are serious, and the poverty reduction strategyprocess has begun to produce important improvements. Some donorshortcomings may be intrinsic, however, to a transaction that is ultimatelya component of bilateral foreign policy. It is not clear, for example, thatdonors can adopt a credible ten-year horizon for aid to a high-performingAfrican country whose current leadership might be replaced in short orderby one with, well, short horizons, inadequate ambition, and poor coordi-nation. Too many times, individual African countries or country pairs ofsimilar geography have switched places in terms of growth performance.Examples include Uganda before and after 1986, Tanzania and Kenya inEast Africa, and Côte d’Ivoire and Ghana in West Africa. Changes in thepolicy environment in these countries have swung growth differentials by3 or 4 percentage points or more on a decadal basis. As we speak, land-locked Zimbabwe and Zambia are switching places in southern Africa.Aid cannot have a horizon that is longer than the uncertainties inherent ina fundamentally weak institutional environment. It may be possible topush horizons to something like five years; for programs insulated frompolitical uncertainties (like the science-intensive regional public goods Imentioned earlier), the horizon can be much longer. But such insulation isimplausible for in-country service delivery on a large scale.
Most fundamentally, improving the effectiveness of aid requires com-ing to grips with the deep inverse correlation of poverty with institutionalcapability. This will require scaling ambitions not only to need but also toabsorptive capacity. A final example may convey the complexity of thisissue, even within the group of countries with comparatively strong gov-ernance. Consider health interventions in Uganda and Ghana. In 1995Ghana adopted its own structure for coordinating donors, setting up asector-wide program in the health ministry to which donors were com-pelled to conform. This was precisely what Botswana had done from theoutset with its own highly effective aid program—owning the process andcoordinating donors around its own agenda. Ghana is now plausibly in aposition to scale up aggressively in the health sector.
Uganda emerged from civil war in the mid-1980s and experienced aremarkable recovery over the next fifteen years or so.13 This was accom-plished by creating tremendous coherence at the highest levels of the bud-
Sachs, McArthur, Schmidt-Traub, Kruk, Bahadur, Faye, and McCord 229
13. Reinikka and Collier (2001).
2259-02-Sachs.qxd 8/6/04 11:22 Page 229
get and policy process—in the president’s office, the Ministry of Planningand Finance, and the central bank. The spending ministries, in contrast,have remained a mixture of well-functioning and nonfunctioning entities,with the health ministry in the latter category. The scaling up advocatedhere might therefore face a Ugandan response of the following form: “Wehave a functioning budget process and have set our spending prioritiesconsistent with our needs and the delivery capacity of our ministries. It isnot appropriate, at this time, to move an additional 4 percent of GDPthrough our health ministry. Nor do we wish you to set up a competinghealth service delivery structure.” To insist in such a context that “it canand must be done” would at best be a risky strategy for donors.
I close by saying that this is a challenging paper in the deepest andmost constructive sense. I have argued for a more moderate scale of inter-vention, but there is much that can and must be done in precisely the areasidentified here. The authors have made a concrete and powerful case for aretargeting of aid efforts in tropical Africa and a significant increase inoverall assistance.
General discussion: Richard Cooper disagreed sharply with the authors’proposals for greatly expanding aid to sub-Saharan Africa at this time,unless one could ensure that the aid could be used effectively. He arguedthat the aid would be wasted in many countries in the region because theylacked the elementary functions of law and order that would be needed todeliver aid effectively. Cooper also questioned some of the paper’s analy-sis of Africa’s economic plight. While granting that the region was des-perately poor compared with many nations in other parts of the world, hepointed to Africa’s own history as evidence that Africa is not in a subsis-tence-level poverty trap. Over the past fifty years, average income percapita has grown by 60 percent, longevity has increased before adjustingfor the impact of AIDS, infant mortality has fallen, and population growthhas been rapid. Nor was Cooper persuaded that geography makes Africa aspecial case: other countries, such as Switzerland, are landlocked andhave even fewer resources than Africa. He observed that the British, theFrench, and the Portuguese had built important railroads in Africa, whichhad fallen into disuse through negligence and the ravages of civil war.Cooper suggested that drastic measures may be needed in some Africancountries, such as a twenty-first-century version of the British colonialoffice (for example, a UN trusteeship, with forces to backstop it), to pro-
230 Brookings Papers on Economic Activity, 1:2004
2259-02-Sachs.qxd 8/6/04 11:22 Page 230
vide minimal law and order so that economies could begin meaningfuldevelopment and make use of expanded aid.
Edward Glaeser, by contrast, was convinced by the authors’ argumentson the importance of geography and reasoned that, were it not for strictimmigration laws in the developed countries, no one would be living insub-Saharan Africa today. However, given the region’s geography, hewas skeptical about developing agriculture in the region, noting that, withtransportation costs so low, only countries with comparative advantageshould be in the staple crop business.
Robert Gordon found a parallel between the post–World War I repara-tions imposed on Germany and current plans to greatly expand aid trans-fers to Africa. In his classic essay “The Economic Consequences of thePeace,” John Maynard Keynes argued that, through the positions theytook at Versailles, Britain and France had undermined their own exportindustries because the reparations they demanded would force a realdevaluation on Germany. Gordon worried that Africa could be similarlyhurt if massive aid transfers led to a real appreciation of currencies there.
Sachs, McArthur, Schmidt-Traub, Kruk, Bahadur, Faye, and McCord 231
2259-02-Sachs.qxd 8/6/04 11:22 Page 231
References
Anderson, Kym, and others. 2001. “The Burdens of Rich Country Protection toDeveloping Countries.” Journal of African Economies 10, no. 3: 227–57.
Armstrong Schellenberg, Johanna, and others. 2004. “The Effect of IntegratedManagement of Childhood Illness on Observed Quality of Care of Under-Fives in Rural Tanzania.” Health Policy and Planning 19, no. 1: 1–10.
Azam, Jean-Paul, Shantayanan Devarajan, and Stephen A. O’Connell. 2002.“Equilibrium Aid Dependence.” University of Toulouse, World Bank, andSwarthmore University (November).
Baffes, John. 2004. “Cotton: Market Setting, Trade Policies, and Issues.” PolicyResearch Working Paper 3218. Washington: World Bank (February).
Baland, Jean Marie, and Jean-Philippe Platteau. 1996. Halting Degradation ofNatural Resources: Is There a Role for Rural Communities? New York: FAO.
Bang, A. T., and others. 1999. “Maternal Morbidity during Labour and the Puer-perium in Rural Homes and the Need for Medical Attention: A ProspectiveObservational Study in Gadchiroli, India.” Lancet 354: 1955–61.
Barro, Robert, and Xavier Sala-i-Martin. 1998. Economic Growth. MIT Press. Beaton, George H., and others. 1993. “Effectiveness of Vitamin A Supplementa-
tion in the Control of Young Child Morbidity and Mortality in DevelopingCountries.” Nutrition Policy Discussion Paper 13. New York: UN Administra-tive Committee on Coordination, Sub-committee on Nutrition.
Ben-David, Dan. 1998. “Convergence Clubs and Subsistence Economies.” Jour-nal of Development Economics 55, no. 1: 155–71.
Besley, Timothy, and Robin Burgess. 2003. “Halving Global Poverty.” Journalof Economic Perspectives 17, no. 3: 3–22.
Birkhaeuser, Dean, Robert E. Evenson, and Gershon Feder. 1991. “The Eco-nomic Impact of Agricultural Extension: A Review.” Economic Developmentand Cultural Change 39, no. 3: 607–50.
Black, Robert E., Saul S. Morris, and Jennifer Bryce. 2003. “Where and Why Are10 Million Children Dying Every Year?” Lancet 361: 2226–34.
Block, Steven A. 2001. “Does Africa Grow Differently?” Journal of Develop-ment Economics 65, no. 2: 443–67.
Bloom, David E., and Jeffrey D. Sachs. 1998. “Geography, Demography, andEconomic Growth in Africa.” BPEA, no. 2: 207–73.
Bloom, David, David Canning, and Jaypee Sevilla. 2003. “Geography andPoverty Traps.” Journal of Economic Growth 8, no. 4: 355–78.
Borrell, Brent, and David Pearce. 1999. “Sugar: The Taste Test of Trade Liberal-isation.” Canberra: Centre for International Economics.
Boserup, Ester. 1965. The Conditions of Agricultural Growth: The Economics ofAgrarian Change under Population Pressure. Chicago: Aldine.
———. 1981. Population and Technical Change: A Study of Long-Term Trends.University of Chicago Press.
232 Brookings Papers on Economic Activity, 1:2004
2259-02-Sachs.qxd 8/6/04 11:22 Page 232
Bosworth, Barry P., and Susan M. Collins. 2003. “The Empirics of Growth: AnUpdate.” BPEA, no. 2: 113–79.
Brenton, Paul, and Takako Ikezuki. 2004. “The Initial and Potential Impact ofPreferential Access to the U.S. Market under the African Growth and Oppor-tunity Act.” Policy Research Working Paper 3262. Washington: World Bank.
Bruno, Michael, Martin Ravallion, and Lyn Squire. 1998. “Equity and Growth inDeveloping Countries: Old and New Perspectives on the Policy Issues.” Pol-icy Research Working Paper 1563. Washington: World Bank.
Bruns, Barbara, Alain Mingat, and Ramahatra Rakotomalala, eds. 2003. Achiev-ing Universal Primary Education by 2015: A Chance for Every Child. Wash-ington: World Bank.
Center for International Earth Science Information Network (CIESIN), ColumbiaUniversity. 2002. National Aggregates of Geospatial Data: Population, Land-scape and Climate Estimates (PLACE). Palisades, N.Y. Available at sedac.ciesin.columbia.edu/plue/nagd/place.
Centro Internacional de Agricultura Tropical (CIAT) and others. 2002. “Soil Fer-tility Degradation in Sub Saharan Africa: Leveraging Lasting Solutions to aLong Term Problem.” Conclusions from a Workshop held at the RockefellerFoundation Bellagio Study and Conference Center, Bellagio, Italy, March 4–8.
Christiansen, Luc, Christopher Scott, and Quentin Wodon. 2002. “DevelopmentTargets and Costs.” In A Sourcebook for Poverty Reduction Strategies(2 vols.), edited by Jeni Klugman. Washington: World Bank.
Cleland, J. G., and J. K. Van Ginneken. 1988. “Maternal Education and ChildSurvival in Developing Countries: The Search for Pathways of Influence.”Social Science Medicine 27, no. 12: 1357–68.
Collier, Paul, and Jan-Willem Gunning. 1999. “Explaining African EconomicGrowth.” Journal of Economic Literature 37, no. 1: 64–111.
Collier, Paul, and Anke Hoeffler. 2002a. “Aid, Policy, and Peace.” Defence andPeace Economics 13, no. 6: 435–50.
———. 2002b. “Greed and Grievance in Civil War.” Working Paper Series2002-1. Oxford, United Kingdom: Centre for Study of African Economies(March).
Commission on Macroeconomics and Health (CMH). 2001. Macroeconomicsand Health: Investing in Health for Economic Development. Geneva: WorldHealth Organization.
Delamonica, Enrique, Santosh Mehrotra, and Jan Vandermoortele. 2001. “Is EFAAffordable? Estimating the Global Minimum Cost of ‘Education for All.’”Innocenti Working Paper 87. Florence, Italy: UNICEF Innocenti ResearchCenter.
Diop, Ndiame, John Beghin, and Mirvat Sewadeh. 2004. “Groundnut Policies,Global Trade Dynamics, and the Impact of Trade Liberalization.” PolicyResearch Working Paper 3226. Washington: World Bank.
Sachs, McArthur, Schmidt-Traub, Kruk, Bahadur, Faye, and McCord 233
2259-02-Sachs.qxd 8/6/04 11:22 Page 233
Donovan, Graeme, and Frank Casey. 1998. “Soil Fertility Management in Sub-Saharan Africa.” Technical Paper 408. Washington: World Bank.
Easterly, William. 1999. “The Ghost of Financing Gap: Testing the GrowthModel of the International Financial Institutions.” Journal of DevelopmentEconomics 60, no. 2: 423–38.
Evenson, Robert E., and Douglas Gollin. 2003. Crop Variety Improvement andIts Effect on Productivity: The Impact of International Research. Wallingford,United Kingdom: CABI Publishing.
Ezzati, Majid, and Daniel M. Kammen. 2002. “Evaluating the Health Benefits ofTransitions in Household Energy Technologies in Kenya.” Energy Policy 30,no. 10: 815–26.
Food and Agriculture Organisation of the United Nations (FAO). 1995a. “Irriga-tion in Africa in Figures.” Water Reports 7. Rome.
———. 1995b. “Women, Agriculture and Rural Development: A SynthesisReport of the Africa Region.” Rome.
———. 1996. “Special Feature: Crucial Role of Irrigation Development inIncreasing Food Production in Sub-Saharan Africa.” Africa Report 05/96.Rome. Available at www.fao.org/docrep/004/w1144e/w1144e54.htm.
———. 2001. “Report of the World Food Summit: Five Years Later.” Rome.Available at www.fao.org/DOCREP/MEETING/005/Y7106E/Y7106E00.HTM.
———. 2002. “Anti-Hunger Programme: Reducing Hunger through SustainableAgricultural and Rural Development and Wide Access to Food.” Rome.
Food and Agricultural Policy Research Institute (FAPRI). 2002. “The DohaRound of the World Trade Organization: Liberalization of Agricultural Mar-kets and Its Impact on Developing Economies.” Paper presented at the Inter-national Agricultural Trade Research Consortium Winter Meetings, SanDiego, December.
Foster, Mick. 2002. “Direct Budget Support to Mozambique.” Report to theDepartment for International Development. Mick Foster Economics, Ltd.(November).
Foster, Mick, and Andrew Keith. 2003. “The Case for Increased Aid.” FinalReport to the Department for International Development of the United King-dom (December).
Freedom House. 2003. Freedom in the World 2003. New York. Available atwww.freedomhouse.org/research/index.htm.
Global Environmental Monitoring and Research Center (GEMS). 1995. Environ-mental Data Report 1993–1994. London: Blackwell Publishers.
Global Forum for Health Research. 2002. “10/19 Report on Health Research2001–2002.” Geneva. Available at www.globalforumhealth.org/Files Upld/36.pdf.
234 Brookings Papers on Economic Activity, 1:2004
2259-02-Sachs.qxd 8/6/04 11:22 Page 234
Global Water Partnership. 2000. “Towards Water Security: A Framework forAction.” Paper prepared for the Second World Water Forum, The Hague,March 17–22.
Hamilton, Kirk, and Michael Clemens. 1999. “Genuine Savings Rates in Devel-oping Countries.” World Bank Economic Review 13, no. 2: 333–56.
Harrison, Makiko, Jeni Klugman, and Eric Swanson. 2003. “Are Poverty Reduc-tion Strategies Undercutting the Millennium Development Goals? An Empiri-cal Review.” Washington: World Bank (September 17).
Henao, Julio, and Carlos Baanante. 1999. “Nutrient Depletion in the AgriculturalSoils of Africa.” 2020 Brief 62. Washington: International Food PolicyResearch Institute. Available at www.cgiar.org/ifpri/2020/briefs.
Hine, John L., and Simon D. Ellis. 2001. “Agricultural Marketing and Access toTransport Services.” Wokingham, United Kingdom: Transport ResearchLaboratory.
Hine, John L., and John Rutter. 2000. “Roads, Personal Mobility and Poverty:The Challenge.” Transport and Poverty Alleviation Workshop. Wokingham,United Kingdom: Transport Research Laboratory.
Hoekman, Bernard, Francis Ng, and Marcelo Olarreaga. 2002. “Agricultural Tar-iffs versus Subsidies: What’s More Important for Developing Countries?”World Bank Working Paper. Washington: World Bank.
Huan-Niemi, Ellen, and Jyrki Niemi. 2003. “The Impact of Preferential, Regionaland Multilateral Trade Agreements: A Case Study of the EU Sugar Regime.”Working Paper 1. Brussels: European Network of Agricultural and Rural Pol-icy Research Institutes (September).
Ianchovichina, Elena, Aaditya Mattoo, and Marcelo Olarreaga. 2001. “Unre-stricted Market Access for Sub-Saharan Africa: How Much Is It Worth andWho Pays?” Policy Research Working Paper 2595. Washington: World Bank.
Intergovernmental Panel on Climate Change (IPCC). 2001. Climate Change2001: Impacts, Adaptation and Vulnerability. Contribution of Working GroupII to the Third Assessment Report of the Intergovernmental Panel on ClimateChange. Cambridge University Press.
International Food Policy Research Institute (IFPRI). 2000. “Women—The Keyto Food Security: Looking Within the Household.” IFPRI Policy Brief. Wash-ington. Available at www.ifpri.org/pubs/ib/ib3.pdf.
Jayne, T. S., and others. 2001. “Smallholder Income and Land Distribution inAfrica: Implications for Poverty Reduction Strategies.” MSU InternationalDevelopment Paper 24. Michigan State University, Department of Agricul-tural Economics.
Jones, Gareth, and others. 2003. “How Many Child Deaths Can We Prevent ThisYear?” Lancet 362, no. 9377: 65–71.
Kaufmann, Daniel, Aart Kraay, and Massimo Mastruzzi. 2003. “GovernanceMatters III: Governance Indicators for 1996–2002.” Policy Research Working
Sachs, McArthur, Schmidt-Traub, Kruk, Bahadur, Faye, and McCord 235
2259-02-Sachs.qxd 8/6/04 11:22 Page 235
Paper 3106 (June). Available at www.worldbank.org/wbi/governance/pubs/govmatters3.html.
Kaufmann, Daniel, Aart Kraay, and Pablo Zoido-Lobaton. 2002. “GovernanceMatters II—Updated Indicators for 2000/01.” Policy Research DepartmentWorking Paper 2772. Washington: World Bank (January).
Kay, G. B., ed. 1972. The Political Economy of Colonialism in Ghana: A Collec-tion of Documents and Statistics 1900–1960. Cambridge University Press.
Khan, M. 1982. “Interruption of Shigellosis by Hand Washing. Transactions ofthe Royal Society of Tropical Medicine and Hygiene 76, no. 2: 164–68.
Kiszewski, Anthony, and others. 2004. “A Global Index Representing the Stabil-ity of Malaria Transmission.” American Journal of Tropical Medicine andHygiene 70, no. 5: 486–98.
Kotloff, Karen L., and others. 1999. “Global Burden of Shigella Infections:Implications for Vaccine Development and Implementation of Control Strate-gies.” Bulletin of the World Health Organization 77, no. 8: 651–66.
Kremer, Michael. 2002. “A Purchase Commitment for Vaccines.” In Global Pub-lic Goods Financing: New Tools for New Challenges, A Policy Dialogue,edited by Inge Kaul, Katell Le Goulven, and Mirjam Schnupf. New York:United Nations Development Programme.
———. Forthcoming. “Randomized Evaluations of Educational Programs inDeveloping Countries: Some Lessons.” American Economic Review Papersand Proceedings.
Kuznets, Simon. 1966. Modern Economic Growth: Rate, Structure and Spread.Yale University Press.
Leipziger, Danny, and others. 2003. “Achieving the Millennium DevelopmentGoals: The Role of Infrastructure.” Policy Research Working Paper 3163.Washington: World Bank (November).
Lengeler, C. 2004. “Insecticide-Treated Bed Nets and Curtains for PreventingMalaria.” In The Cochrane Library, issue 2. Chichester, United Kingdom:John Wiley & Sons.
Lewis, W. Arthur. 1953. Report on Industrialisation and the Gold Coast. Accra,Ghana: Government Printer.
———. 1954. “Economic Development with Unlimited Supplies of Labour.”Manchester School 22 (May): 139–91.
Limao, Nuno, and Anthony J. Venables. 1999. “Infrastructure, Geographical Dis-advantage and Transport Costs.” London School of Economics, Department ofEconomics.
Loayza, Norman, Klaus Schmidt-Hebbel, and Luis Servén. 2000. “Saving inDeveloping Countries: An Overview.” World Bank Economic Review 14, no.3: 393–414.
Marsh, David R., and others. 2002. “Advancing Newborn Health and Survival inDeveloping Countries: A Conceptual Framework.” Washington: Save theChildren Federation.
236 Brookings Papers on Economic Activity, 1:2004
2259-02-Sachs.qxd 8/6/04 11:22 Page 236
Masters, William A. Forthcoming. “Research Prizes: A New Kind of Incentivefor Innovation in African Agriculture. International Journal of Biotechnology.
Maxwell, Caroline A., and others. 2002. “Effect of Community-wide Use ofInsecticide Treated Nets for 3-4 Years on Malarial Morbidity in Tanzania.”Tropical Medicine and International Health 7, no. 12: 1003–08.
Meade, James E., and others. 1961. The Economic and Social Structure of Mauri-tius: Report to the Governor of Mauritius. London: Methuen.
Miles, Marc, Edwin Feulner, and Mary O’Grady. 2004. 2004 Index of EconomicFreedom. Washington: Heritage Foundation and Wall Street Journal.
Mitchell, Donald. 2004. “Sugar Policies: Opportunity for Change.” PolicyResearch Working Paper 3222. Washington: World Bank.
Musinguzi, Polycarp, and Peter Smith. 2000. “Saving and Borrowing in RuralUganda.” University of Southampton Discussion Papers in Economics andEconometrics 0016. University of Southampton.
Nelson, Richard. 1956. “A Theory of the Low-Level Equilibrium Trap in Under-developed Economies.” American Economic Review 46, no. 5: 894–908.
New Partnership for Africa’s Development (NEPAD). 2004. “InfrastructureShort-Term Action Plan (STAP): Review of Implementation Progress and theWay Forward.” Johannesburg. Available at www.nepadst.org/publications/docs/doc12_032004.pdf.
O’Connell, Stephen A., and Charles C. Soludo. 2001. “Aid Intensity in Africa.”World Development 29, no. 9: 1527–52.
Ogaki, Masao, Jonathan Ostry, and Carmen Reinhart. 1996. “Saving Behavior inLow- and-Middle-Income Developing Countries.” Staff Papers 43, no. 1:38–71. Washington: International Monetary Fund.
Okidi, John, Paul Okwi, and John Ddumba. 2000. “Welfare Distribution andPoverty in Uganda 1992–1997.” Occasional Paper 6. Kampala, Uganda: Eco-nomic Policy Research Center.
Oxfam. 2002. “Cultivating Poverty: The Impact of US Cotton Subsidies onAfrica.” Oxfam Briefing Paper 30. Oxford, United Kingdom.
Prati, Alessandro, Ratna Sahay, and Thierry Tressel. 2003. “Is There a Case forSterilizing Foreign Aid Inflows?” Paper presented at the 18th Annual EEACongress and the 58th European ESEM meeting, Stockholm, August.
Pritchett, Lant, and Michael Woolcock. 2002. “Solutions When the Solution Isthe Problem: Arraying the Disarray in Development.” Working Paper 10.Washington: Center for Global Development (September).
PSR Group. 2004. International Country Risk Guide. East Syracuse, N.Y. Avail-able at www.prsgroup.com/icrg/icrg.html.
Quirke, Derek. 2002, Trade Distortions and Cotton Markets: Implications forGlobal Cotton Producers. Canberra: Cotton Research and Development Cor-poration, Centre for International Economics.
Quisumbing, Agnes, and John Maluccio. 2000. “Intrahousehold Allocation andGender Relations: New Empirical Evidence from Four Developing Coun-
Sachs, McArthur, Schmidt-Traub, Kruk, Bahadur, Faye, and McCord 237
2259-02-Sachs.qxd 8/6/04 11:22 Page 237
tries.” FCND Discussion Paper 84. Washington: International Food PolicyResearch Institute.
Radelet, Steve. 2004. “Aid Effectiveness and the Millennium DevelopmentGoals.” Background Paper for Millennium Project Task Force 1. WorkingPaper 39. Washington: Center for Global Development (March).
Reinikka, Ritva, and Paul Collier, eds. 2001. Uganda’s Recovery: The Role ofFarms, Firms, and Government. Washington: World Bank.
Rizet, C., and J. Hine. 1993. “A Comparison of the Costs and Productivity ofRoad Freight Transport in Africa and Pakistan.” Transport Reviews 13, no. 2:151–65.
Ross, John A., and William L. Winfrey. 2002. “Unmet Need for Contraception inthe Developing World and the Former Soviet Union: An Updated Estimate.”International Family Planning Perspectives 28, no. 3: 138–43.
Sachs, Jeffrey D. 2002. “Resolving the Debt Crisis of Low-Income Countries.”BPEA, no. 1: 257–86.
———. Forthcoming. “Globalization and Patterns of Economic Growth.” InGlobalization: What’s New? edited by Michael M. Weinstein. Columbia Uni-versity Press/Council on Foreign Relations.
Sanchez, Pedro. 2002. “Soil Fertility and Hunger in Africa.” Science 295:2019–220.
Sasakawa Africa Association. 2000. “About Sasakawa Africa Fund for ExtensionEducation.” Available at www.saa-tokyo.org/english/safe/.
Simon, David. 2003. “Official Development Assistance and the MillenniumDevelopment Goals.” Report prepared for the UN Millennium Project Secre-tariat. Harvard University.
Smith, Adam. 1776. An Inquiry into the Nature and Causes of the Wealth ofNations. Facsimile of the 1976 Oxford University Press edition. Indianapolis,Ind.: Liberty Fund.
Spencer, Dunstan. 1994. “Infrastructure and Technology Constraints to Agricul-tural Development in the Humid and Subhumid Tropics of Africa.” EPTDDiscussion Paper 3. Washington: International Food Policy Research Institute.
Starkey, Paul, and others. 2002. “Improving Rural Mobility—Options for Devel-oping Motorized and Nonmotorized Transport in Rural Areas.” World BankTechnical Paper 525. Washington: World Bank.
TAKWIMU. 2000. “Developing a Poverty Baseline in Tanzania.” Dar es Salaam:National Bureau of Statistics and OPM Ltd.
Tokarick, Stephen. 2003. “Measuring the Impact of Distortions in AgriculturalTrade in Partial and General Equilibrium.” Working Paper WP/03/110. Wash-ington: International Monetary Fund.
Torero, Maximo, and Shyamal Chowdhury. 2004. “Infrastructure for Africa:Overcoming Barriers to Development.” Paper prepared for the 2020 AfricaConference, Kampala, Uganda, sponsored by the International Food PolicyResearch Institute, April.
238 Brookings Papers on Economic Activity, 1:2004
2259-02-Sachs.qxd 8/6/04 11:22 Page 238
Transparency International. 2004. Global Corruption Report 2004. London:Pluto Press.
Udry, Christopher, John Hoddinott, and Lawrence Haddad. 1995. “Gender Dif-ferentials in Farm Productivity: Implications for Household Efficiency andAgricultural Policy.” Food Policy 20, no. 5: 407–23.
United Nations. 2003. World Population Prospects 1950–2050: The 2002 Revi-sion. Department of Economic and Social Affairs, Population Division, NewYork.
United Nations Conference on Trade and Development (UNCTAD). 2002. TheLeast Developed Countries Report 2002: Escaping the Poverty Trap. Geneva.
———. 2003a. Economic Development in Africa: Trade Performance and Com-modity Dependence. New York and Geneva: United Nations.
———. 2003b. “Back to Basics: Market Access Issues in the Doha Agenda.”New York and Geneva: United Nations. Available at 192.91.247.38/tab/pubs/itcdtabMisc9_en.pdf.
United Nations Millennium Project. 2004. “Millennium Development GoalsNeeds Assessment: Background Paper to ‘Ending Africa’s Poverty Trap.’”Working paper. New York.
United Nations Millennium Project Task Force on Poverty and Economic Devel-opment. 2004. “Interim Report: An Enhanced Strategy for Reducing ExtremePoverty by the Year 2015.” New York. Available at www.unmillenniumproject.org/documents/tfoneinterim.pdf.
U.S. Department of Energy, Energy Information Administration. 1999. Energy inAfrica.
World Bank. 2000. Can Africa Claim the 21st Century? Washington.
———. 2002. “Achieving Education for All by 2015: Simulation Results for47 Low Income Countries.” Washington: World Bank, Human DevelopmentNetwork, Africa Region and Education Department.
———. 2003a. World Development Indicators 2003. Washington.
———. 2003b. “Are Poverty Reduction Strategies Undercutting the MillenniumDevelopment Goals? An Empirical Review.” Washington. Available atwww.worldbank.org/poverty/strategies/events/attackpov/nov11_prsp_mdg.pdf.
———. 2003c. “Supporting Sound Policies with Adequate and AppropriateFinancing.” Staff Paper for the Development Committee. Washington. Avail-able at siteresources.worldbank.org/DEVCOMMINT/Resources/Fall-2003/DC2003-0016(E)-Financing.pdf.
———. 2003d. World Development Report 2004: Making Services Work forPoor People. Oxford University Press.
———. 2004a. World Development Indicators 2004. Washington.
———. 2004b. “South Africa: Country Brief.” Washington. Available at www.worldbank.org/afr/za/za_ctry_brief.htm.
Sachs, McArthur, Schmidt-Traub, Kruk, Bahadur, Faye, and McCord 239
2259-02-Sachs.qxd 8/6/04 11:22 Page 239
World Education Forum. 2000. Dakar Framework for Action: Education for All:Meeting Our Collective Commitments. Paris: UNESCO. Available at www.unesco.org/education/efa/ed_for_all/dakfram_eng.shtml.
World Health Organization. 1992. “World Malaria Situation in 1990, Part II.Weekly Epidemiological Record 67, pp. 167–74.
———. 2001. “WHO Technical Consultation. Report on Antimalarial DrugCombination Therapy.” Document WHO/CDS/RBM/2001.35. Geneva. Avail-able at rbm.who.int/cmc_upload/0/000/015/082/use_of_antimalarials2.pdf.
World Health Organization and United Nations Children’s Fund. 2003. TheAfrica Malaria Report 2003. Geneva. Available at mosquito.who.int/amd2003/amr2003/pdf/amr2003.pdf.
World Health Organization, United Nations Children’s Fund, and GlobalAlliance for Vaccines and Immunizations. 2003. “Comprehensive Immuniza-tion Strategy Can Greatly Reduce Child Deaths from Measles.” Geneva.Available at www.who.int/vaccines/gavi/pr_20030103.shtml.
240 Brookings Papers on Economic Activity, 1:2004
2259-02-Sachs.qxd 8/6/04 11:22 Page 240


