Embed Size (px)
Citation preview
End-to-end implementation and operation of the European Ground Motion Service
(EGMS)
End User Interface Manual
Date: 18/05/2022 Doc. Version: Draft 1.2
Contract ID: SPECIFIC CONTRACT No 3436/R0-COPERNICUS/EEA.58816
Start date: 03-01-2022 End date: 31-12-2023
Consortium ORIGINAL (OpeRatIonal Groundmotion INsar ALliance), composed by:
EGMS SC
ORIGINAL Consortium
End User Interface Manual
(D5-UIM)
EGMS-D5-UIM-SC2-2.0-008
18/05/2022
Page 2 of 16
Document Control Information
Settings Value
Document Title: End User Interface Manual
Project Title: EGMS-SC2
Document Author: Yngvar Larsen John Dehls, Petar Marinkovic, Line Rouyet,
Daniel Stødle
Project Owner: Henrik Steen Andersen (EEA)
Project Manager: Sergio Proietti (e-GEOS)
Document Code: EGMS-D5-UIM-SC2-2.0-008
Document Version: Draft 1.2
Distribution: Public
Date: 18/05/2022
Document Approver(s) and Reviewer(s):
Name Role Action Date
Yngvar Larsen Document Owner Review 18/05/2022
< TSC members> Original Consortium
Technical Steering
Committee
Review 18/05/2022
Henrik Steen Andersen Project Officer (EEA) Approve 19/05/2022
Document history:
Revision Date Created by Short Description of Changes
draft 1.0 18/06/2021 Yngvar Larsen Initial version
draft 1.1 15/10/2021 Yngvar Larsen Updated according to review by EEA
draft 1.2 18/05/2022 Yngvar Larsen Revision for preliminary release.

EGMS SC
ORIGINAL Consortium
End User Interface Manual
(D5-UIM)
EGMS-D5-UIM-SC2-2.0-008
18/05/2022
Page 3 of 16
TABLE OF CONTENTS
1. INTRODUCTION ...................................................................................................................................................... 5
1.1. SCOPE OF THE DOCUMENT ............................................................................................................................................. 5 1.2. REFERENCES AND RELATED DOCUMENTS ........................................................................................................................... 5
2. KEY INPUT REQUIREMENTS .................................................................................................................................... 6
2.1. KEY REQUIREMENTS FOR VISUALISATION ............................................................................................................................ 6 2.2. KEY REQUIREMENTS FOR SEARCH AND DOWNLOAD .............................................................................................................. 6
3. WEBGIS ................................................................................................................................................................... 7
3.1. OVERVIEW OF THE INTERFACE ......................................................................................................................................... 7 3.1.1. Layout............................................................................................................................................................... 7 3.1.2. Navigation ........................................................................................................................................................ 9 3.1.3. Interaction with InSAR data ............................................................................................................................. 9
3.2. DATASETS ................................................................................................................................................................. 14 3.2.1. Selecting datasets .......................................................................................................................................... 14 3.2.2. Configuring the visual appearance of an InSAR dataset ................................................................................ 14
3.3. BACKGROUND MAP LAYERS ........................................................................................................................................... 15 3.4. SHARING AND DOWNLOADING ...................................................................................................................................... 15

EGMS SC
ORIGINAL Consortium
End User Interface Manual
(D5-UIM)
EGMS-D5-UIM-SC2-2.0-008
18/05/2022
Page 4 of 16
FIGURES
Figure 1. The overall layout of the WebGIS interface ......................................................................................................... 8 Figure 2. Toolbar elements available in the upper right corner of the WebGIS interface ................................................. 8 Figure 3. Interaction with InSAR data in the WebGIS interface. ....................................................................................... 10 Figure 4. Time series viewer. ............................................................................................................................................ 11 Figure 5. User option for visualisation of the time series. ................................................................................................ 12 Figure 6. Data properties and displacement values at the location of the last selected InSAR measurement point ...... 12 Figure 7. A. Time series with a best-fit line. B. Time series with a best-fit polynomial function. ..................................... 13 Figure 8. Averaging time series within a manually drawn polygon. ................................................................................. 13 Figure 9. Level-3 EGMS deformation layers. A. Hide layers outside the current view. B. Send selected layer to the front
or the back of the view. C. Unselected layer. D. Selected layer displayed in the map viewer. E. Show the full
extent of the dataset. F. Set the opacity of the layer. G. Set the point size. H. Choose the color palette and the
scale (in mm/yr). I-K. Additional visualisation parameters. ..................................................................................... 14 Figure 10. Example of basemap layer selection. .............................................................................................................. 15 Figure 11. Sharing the current view and exporting figures. ............................................................................................. 16
TABLES
Table 1. Actions for WebGIS navigation ............................................................................................................................. 9
EGMS SC
ORIGINAL Consortium
End User Interface Manual
(D5-UIM)
EGMS-D5-UIM-SC2-2.0-008
18/05/2022
Page 5 of 16
1. INTRODUCTION
1.1. Scope of the Document
This document introduces the EGMS Product Archive and Dissemination System (PADS, RD5) as the frontend
of the service. It provides an overview of the available datasets and functionality, emphasising the main types
of data access. Chapter 2 outlines the main requirements considered during the design of the system.
Chapter 3 describes the WebGIS, an interactive environment for viewing the data. Chapter 4 describes the
Product Archive, which provides search and download functions for registered users.
1.2. References and Related Documents
ID Reference or Related
Document
Date ID Source or Link/Location
RD1. Algorithm Theoretical Basis 20/12/2021 EGMS-D3-ALG-SC1-2.0-006 EGMS ORIGINAL
Consortium
RD2. Product User Manual 15/10/2021 EGMS-D4-PUM-SC1-2.0-007 EGMS ORIGINAL
Consortium
RD3. End User Interface Manual 15/10/2021 EGMS-D5-UIM-SC1-2.0-008 EGMS ORIGINAL
Consortium
RD4. Product Description and
Format Specification 20/12/2021
EGMS-D6-PDD-SC1-2.0-009 EGMS ORIGINAL
Consortium
RD5. Product Archive and
Dissemination system
description
20/12/2021
EGMS-D9-PADS-SC1-2.0-011 EGMS ORIGINAL
Consortium
RD6. Quality assurance and
control report 03/05/2022 EGMS-D10.4-QCR-SC2--042 EGMS ORIGINAL
Consortium
RD7. User Uptake Plan 15/10/2021 EGMS-D14-UUP-SC1-8.0-016 EGMS ORIGINAL
Consortium
RD8. End User Requirements 15/10/2021 EGMS-D15-URD-SC1-8.0-017 EGMS ORIGINAL
Consortium
RD9. GNSS calibration report 20/12/2021 EGMS-D19.1-GCR-SC1-3.0-031 EGMS ORIGINAL
Consortium
Table Reference Documents

EGMS SC
ORIGINAL Consortium
End User Interface Manual
(D5-UIM)
EGMS-D5-UIM-SC2-2.0-008
18/05/2022
Page 6 of 16
2. KEY INPUT REQUIREMENTS
The EGMS product archive and dissemination system [RD5] provides access to the ground motion data
produced by the service. The system comprises two main parts: an interactive WebGIS allowing all users to
explore the data within a map interface and a product archive enabling registered users to search and
download data for use within their systems.
The goal of the PADS is to make ground motion data findable, accessible, usable, and understandable. It has
been designed to be intuitive to use, serving both casual users and professionals. EGMS provides ground
motion data for tens of billions of locations, each with hundreds of individual measurement values, so the
WebGIS has been designed to be as efficient and responsive as possible. Users can navigate a fully three-
dimensional map of the service area, view average velocities, and explore deformation histories. No user
registration is required for the WebGIS. The product archive, to be documented in a future update of this
report, will provide an interface for registered users to find and download datasets in standard formats that
are easily ingested into the users’ GIS and other software.
The following subsections outline the input requirements that were considered when designing the
interfaces.
2.1. Key requirements for visualisation
The visualisation interface is expected to be the most used interface to EGMS products. Although user needs
vary, depending on the use case and user expertise, we have tried to meet the needs of all users within a
single, intuitive, WebGIS (Section 3). The primary requirement, shared by all users, is to see where ground
movement occurs and how fast. A user should be able to open the service, quickly find and zoom to their
area of interest, and display velocity measurements. The initial symbolisation needs to be intuitive but
customisable. The background map should allow easy identification of the ground features being measured.
Users need to be able to compare and contrast individual measurements as well as different datasets. Users
need to be able to see the progression of deformation over time, both for single points and areas of interest.
2.2. Key requirements for search and download
A subset of users needs to be able to download data for use within their workflows. Copernicus services
require registration and authentication for data download. Thus, a form-based web interface has been
created to allow easy discovery and data download in an easily ingestible format. Users primarily need to be
able to search for a given geographical area of interest (AOI). They should be simple to specify, either by text-
based entry or uploading a simple polygon in a standard format. As multiple datasets are available, the user
should be able to filter based upon the acquisition geometry or other parameters.

EGMS SC
ORIGINAL Consortium
End User Interface Manual
(D5-UIM)
EGMS-D5-UIM-SC2-2.0-008
18/05/2022
Page 7 of 16
3. WEBGIS
3.1. Overview of the interface
3.1.1. Layout
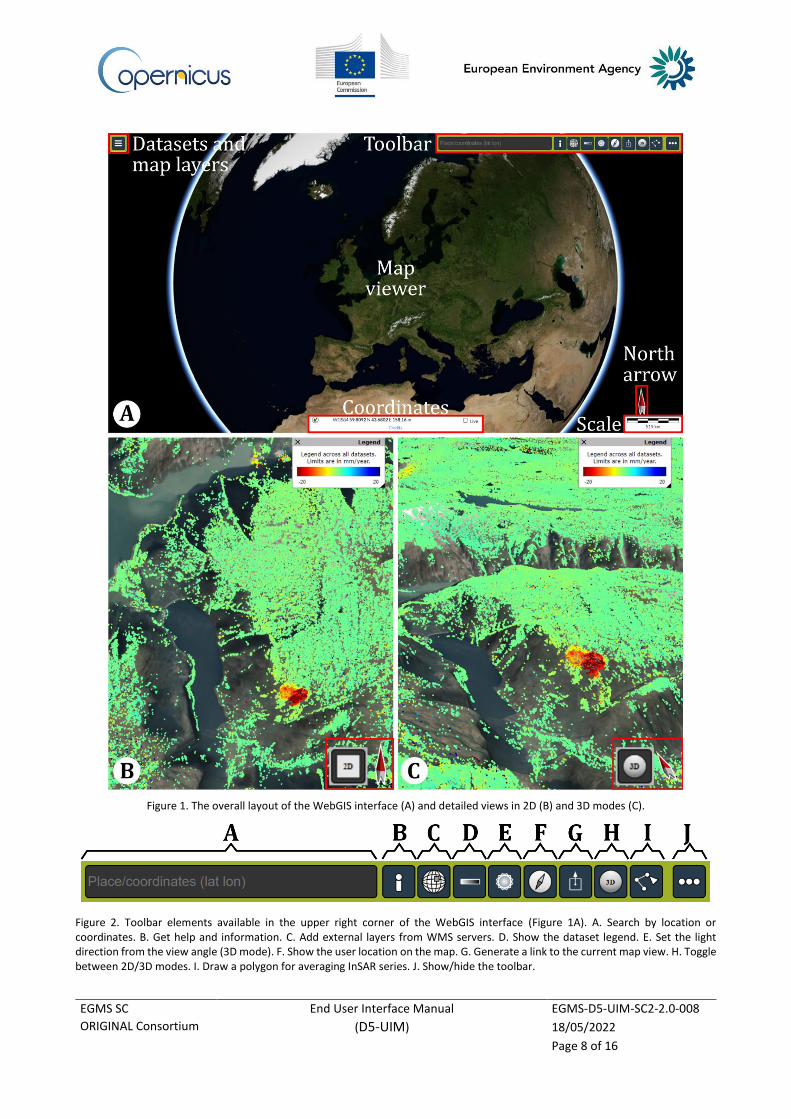
The WebGIS is an interactive environment allowing the users to view and analyse the InSAR data. The
interface includes five basic elements: the map viewer, the north arrow, the scale, the coordinates, the map
layers, and the toolbar (Figure 1A):
Map viewer: The map can be viewed both in 2D or 3D by clicking on the corresponding element of the
toolbar (Figure 2G). 3D-mode is especially useful when analysing mountainous areas (Figure 1C).
North arrow and scale: North is always directed upwards while using the 2D-mode (Figure 1B). The arrow
adjusts according to navigation when the user activates the 3D-mode (Figure 1C). The scale bar gives a
distance reference in metre/kilometre that automatically adjusts when zooming in/out.
Coordinates and credits: When clicking somewhere in the map viewer, coordinates and elevation
information of the point are displayed at the bottom of the WebGIS interface (Figure 1A). The default
coordinate system is latitude/longitude in degrees (WGS84). By clicking on the coordinate display, the user
can change the projection to metres (LAEA). The blue text “Credits” opens a window with further information
on data and code attributions.
Datasets and map layers: In the upper left corner, the users can choose which InSAR datasets (Section 3.2),
the background and supplementary map layers (Section 3.3) to visualise in the map viewer.
Toolbar: The bar in the upper right corner includes a set of tools useful for navigation, visualisation and
data analysis (Figure 2).
EGMS SC
ORIGINAL Consortium
End User Interface Manual
(D5-UIM)
EGMS-D5-UIM-SC2-2.0-008
18/05/2022
Page 8 of 16
Figure 1. The overall layout of the WebGIS interface (A) and detailed views in 2D (B) and 3D modes (C).
Figure 2. Toolbar elements available in the upper right corner of the WebGIS interface (Figure 1A). A. Search by location or coordinates. B. Get help and information. C. Add external layers from WMS servers. D. Show the dataset legend. E. Set the light direction from the view angle (3D mode). F. Show the user location on the map. G. Generate a link to the current map view. H. Toggle between 2D/3D modes. I. Draw a polygon for averaging InSAR series. J. Show/hide the toolbar.
EGMS SC
ORIGINAL Consortium
End User Interface Manual
(D5-UIM)
EGMS-D5-UIM-SC2-2.0-008
18/05/2022
Page 9 of 16
3.1.2. Navigation
The WebGIS interface allows the users to pan around, zoom, tilt, and rotate the map. In 2D-mode, flying
in/out, left/right and up/down is possible. To tilt and rotate, the user must first activate the 3D-mode in the
toolbar (Figure 2H). The navigation can be performed using a mouse, a keyboard, or a touch screen. The
possible actions are summarised in Table 1.
A free-flight mode is also available and combines navigation based on keyboard and mouse. The movement
is controlled using the keyboard (Table 1, key). The look direction is controlled by moving the mouse.
The toolbar includes a geographical search function that allows for quickly zooming the map view to an area
of interest based on a locality name, a street address or latitude/longitude coordinates (Figure 2A).
Action Mouse Key Touch
Fly in / out (2/3D modes) Scroll wheel on mouse or scroll gesture on trackpad
W, S Stretch/Pinch with two fingers
Fly left / right (2/3D modes) Click-and-drag A, D Drag with one finger
Fly up / down (2/3D modes) Click-and-drag Q, E Drag with one finger
Tilt (3D mode) Click-and-drag with right mouse button or while holding Shift key
- Move two fingers up or down
Rotate (3D mode) Click-and-drag with right mouse button or while holding Shift key
- Move two fingers in a circular motion
Enter / Exit free-flight - Alt + G -
Table 1. Actions for WebGIS navigation
3.1.3. Interaction with InSAR data
When selecting an InSAR dataset (Figure 3A), the ground deformation information is visualised in the map
viewer. The colour of each point represents the mean velocity, in (mm/yr), according to a generic colour scale
that can be adjusted by the user (Figure 3B). Each individual layer can also be modified differently in the
dataset setting window (Figure 3C), further documented in Section 3.2.2. To view the entire data series and
get information about the measurement properties, the user must click on an InSAR point (Figure 3D), which
opens an additional window: the time series viewer (Figure 3E). The location of the active point is shown by
a white circle in the map viewer.
EGMS SC
ORIGINAL Consortium
End User Interface Manual
(D5-UIM)
EGMS-D5-UIM-SC2-2.0-008
18/05/2022
Page 10 of 16
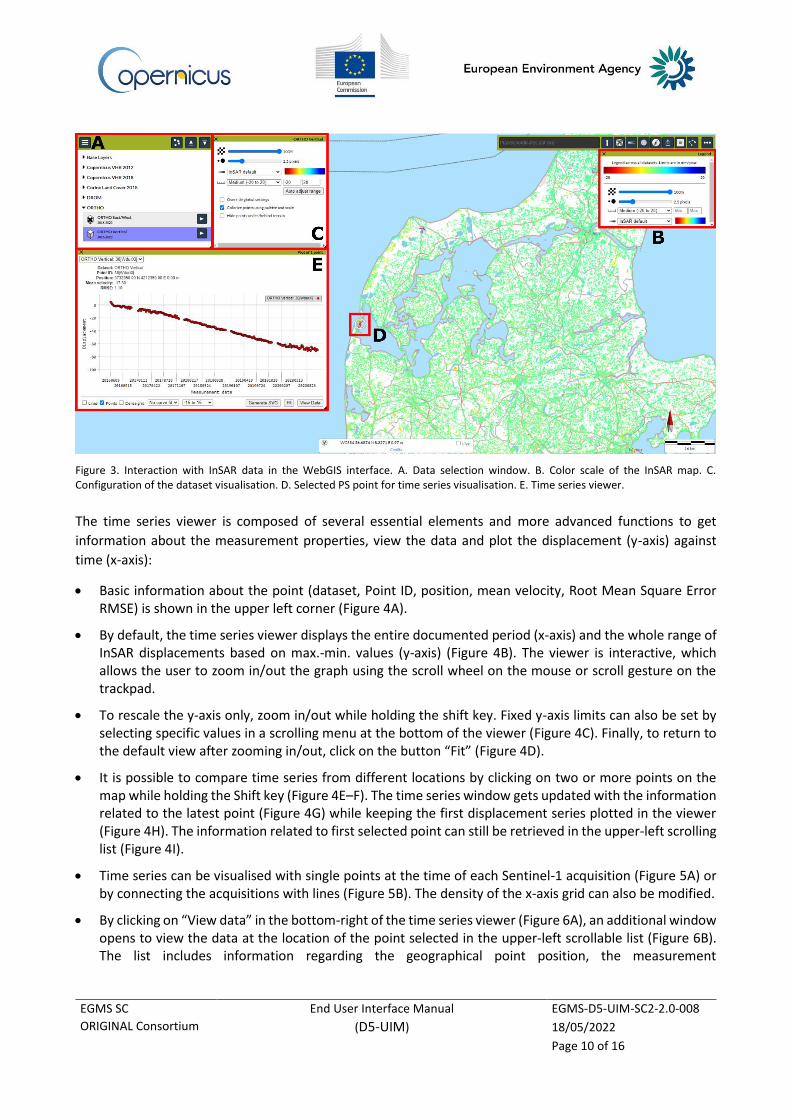
Figure 3. Interaction with InSAR data in the WebGIS interface. A. Data selection window. B. Color scale of the InSAR map. C. Configuration of the dataset visualisation. D. Selected PS point for time series visualisation. E. Time series viewer.
The time series viewer is composed of several essential elements and more advanced functions to get
information about the measurement properties, view the data and plot the displacement (y-axis) against
time (x-axis):
• Basic information about the point (dataset, Point ID, position, mean velocity, Root Mean Square Error RMSE) is shown in the upper left corner (Figure 4A).
• By default, the time series viewer displays the entire documented period (x-axis) and the whole range of InSAR displacements based on max.-min. values (y-axis) (Figure 4B). The viewer is interactive, which allows the user to zoom in/out the graph using the scroll wheel on the mouse or scroll gesture on the trackpad.
• To rescale the y-axis only, zoom in/out while holding the shift key. Fixed y-axis limits can also be set by selecting specific values in a scrolling menu at the bottom of the viewer (Figure 4C). Finally, to return to the default view after zooming in/out, click on the button “Fit” (Figure 4D).
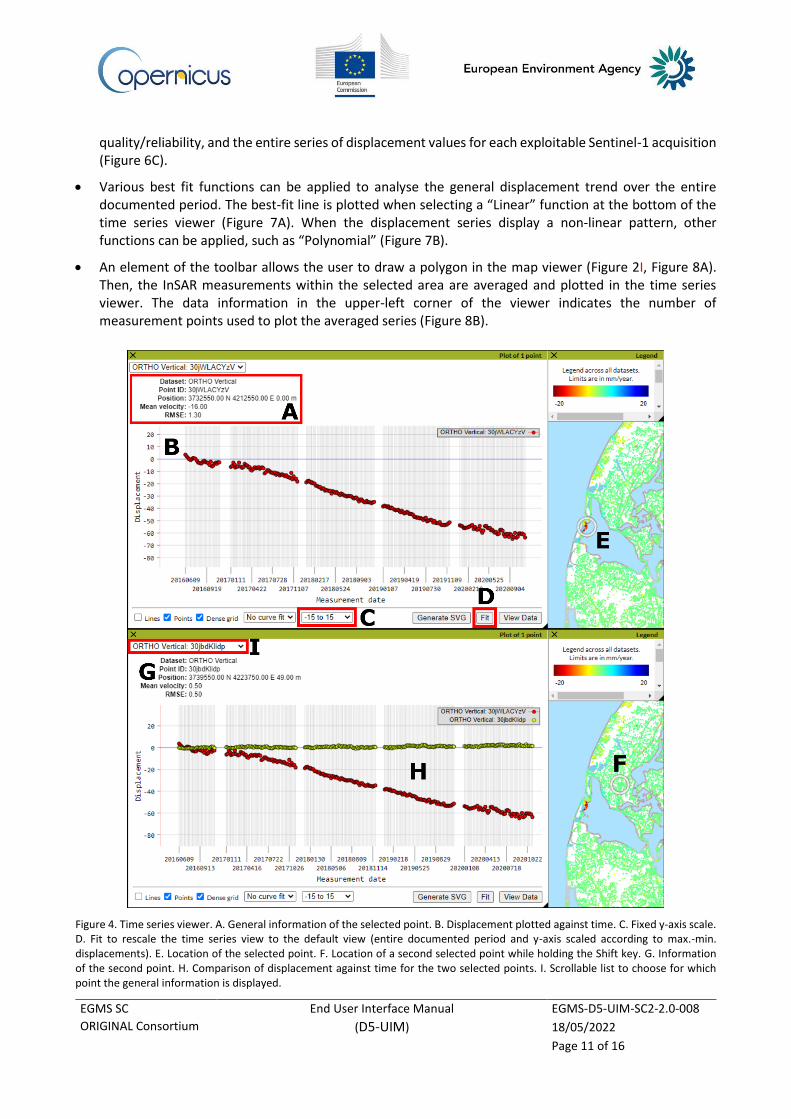
• It is possible to compare time series from different locations by clicking on two or more points on the map while holding the Shift key (Figure 4E–F). The time series window gets updated with the information related to the latest point (Figure 4G) while keeping the first displacement series plotted in the viewer (Figure 4H). The information related to first selected point can still be retrieved in the upper-left scrolling list (Figure 4I).
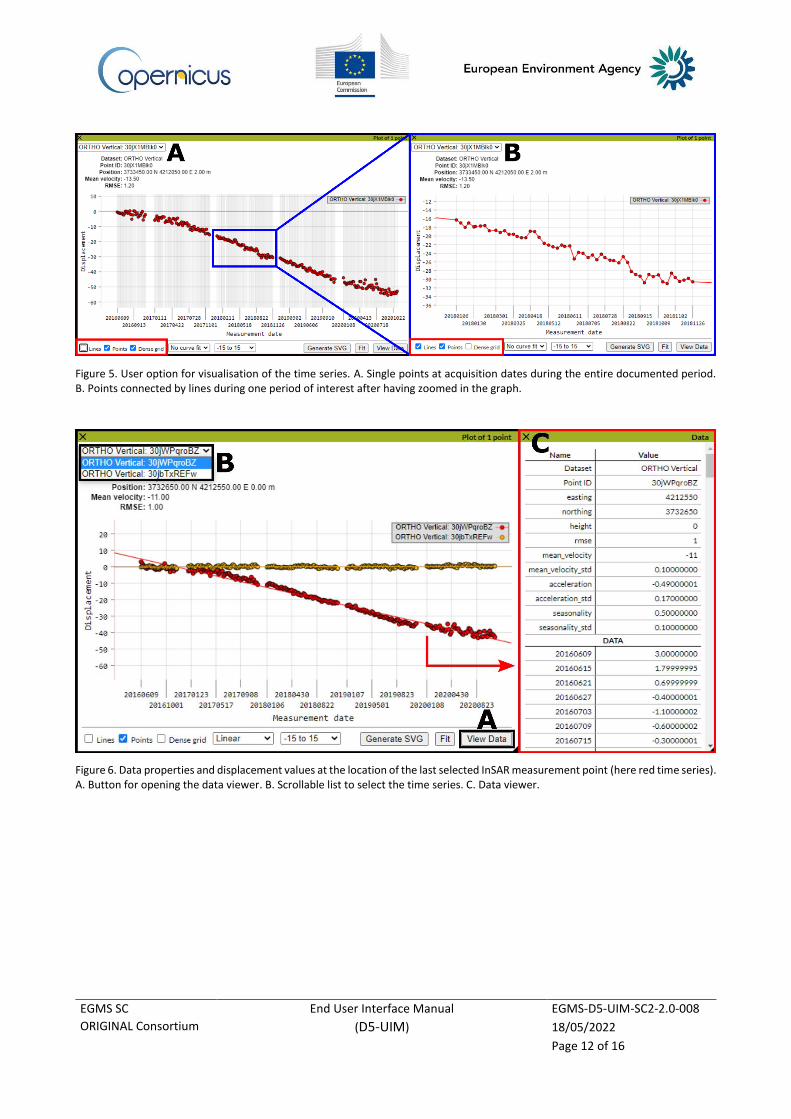
• Time series can be visualised with single points at the time of each Sentinel-1 acquisition (Figure 5A) or by connecting the acquisitions with lines (Figure 5B). The density of the x-axis grid can also be modified.
• By clicking on “View data” in the bottom-right of the time series viewer (Figure 6A), an additional window opens to view the data at the location of the point selected in the upper-left scrollable list (Figure 6B). The list includes information regarding the geographical point position, the measurement
EGMS SC
ORIGINAL Consortium
End User Interface Manual
(D5-UIM)
EGMS-D5-UIM-SC2-2.0-008
18/05/2022
Page 11 of 16
quality/reliability, and the entire series of displacement values for each exploitable Sentinel-1 acquisition (Figure 6C).
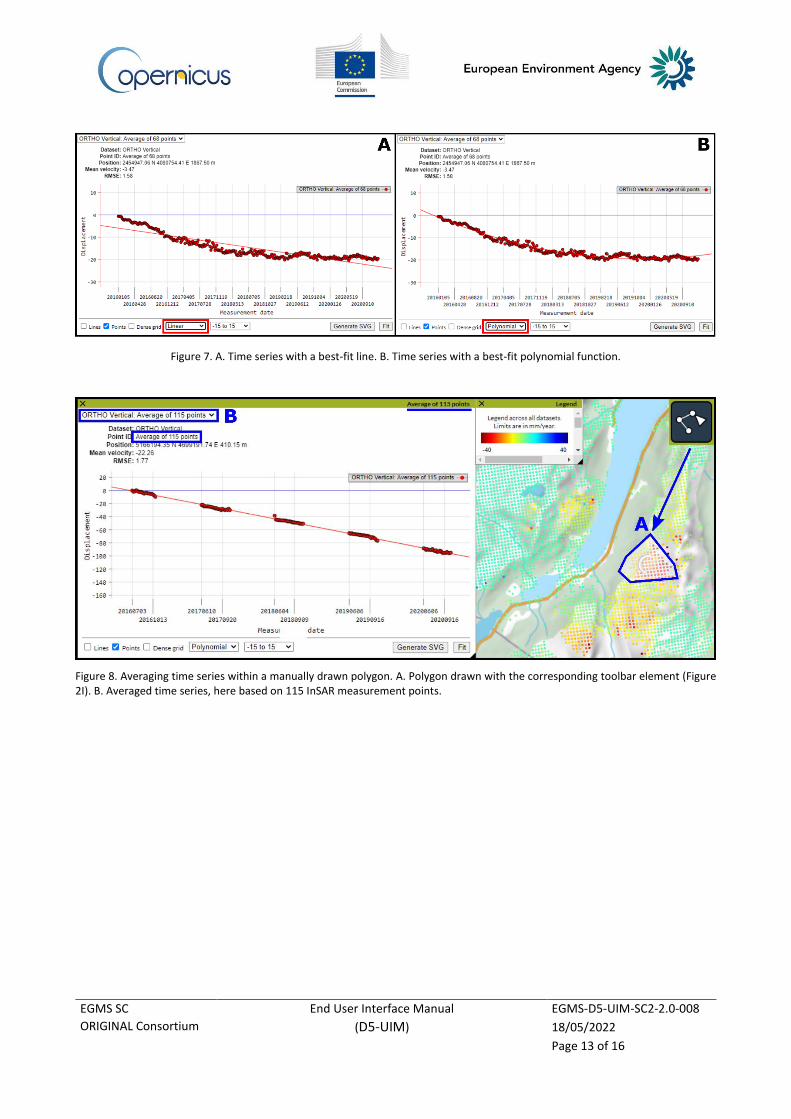
• Various best fit functions can be applied to analyse the general displacement trend over the entire documented period. The best-fit line is plotted when selecting a “Linear” function at the bottom of the time series viewer (Figure 7A). When the displacement series display a non-linear pattern, other functions can be applied, such as “Polynomial” (Figure 7B).
• An element of the toolbar allows the user to draw a polygon in the map viewer (Figure 2I, Figure 8A). Then, the InSAR measurements within the selected area are averaged and plotted in the time series viewer. The data information in the upper-left corner of the viewer indicates the number of measurement points used to plot the averaged series (Figure 8B).
Figure 4. Time series viewer. A. General information of the selected point. B. Displacement plotted against time. C. Fixed y-axis scale. D. Fit to rescale the time series view to the default view (entire documented period and y-axis scaled according to max.-min. displacements). E. Location of the selected point. F. Location of a second selected point while holding the Shift key. G. Information of the second point. H. Comparison of displacement against time for the two selected points. I. Scrollable list to choose for which point the general information is displayed.
EGMS SC
ORIGINAL Consortium
End User Interface Manual
(D5-UIM)
EGMS-D5-UIM-SC2-2.0-008
18/05/2022
Page 12 of 16
Figure 5. User option for visualisation of the time series. A. Single points at acquisition dates during the entire documented period. B. Points connected by lines during one period of interest after having zoomed in the graph.
Figure 6. Data properties and displacement values at the location of the last selected InSAR measurement point (here red time series). A. Button for opening the data viewer. B. Scrollable list to select the time series. C. Data viewer.
EGMS SC
ORIGINAL Consortium
End User Interface Manual
(D5-UIM)
EGMS-D5-UIM-SC2-2.0-008
18/05/2022
Page 13 of 16
Figure 7. A. Time series with a best-fit line. B. Time series with a best-fit polynomial function.
Figure 8. Averaging time series within a manually drawn polygon. A. Polygon drawn with the corresponding toolbar element (Figure 2I). B. Averaged time series, here based on 115 InSAR measurement points.
EGMS SC
ORIGINAL Consortium
End User Interface Manual
(D5-UIM)
EGMS-D5-UIM-SC2-2.0-008
18/05/2022
Page 14 of 16
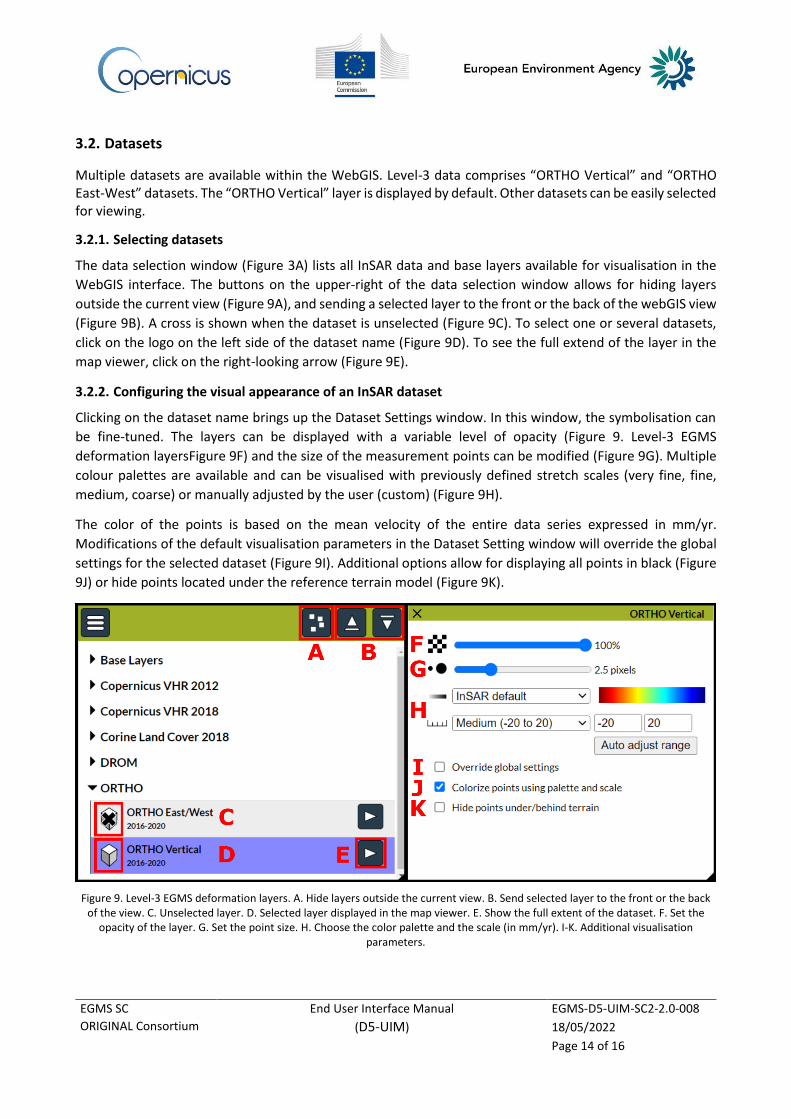
3.2. Datasets
Multiple datasets are available within the WebGIS. Level-3 data comprises “ORTHO Vertical” and “ORTHO East-West” datasets. The “ORTHO Vertical” layer is displayed by default. Other datasets can be easily selected for viewing.
3.2.1. Selecting datasets
The data selection window (Figure 3A) lists all InSAR data and base layers available for visualisation in the
WebGIS interface. The buttons on the upper-right of the data selection window allows for hiding layers
outside the current view (Figure 9A), and sending a selected layer to the front or the back of the webGIS view
(Figure 9B). A cross is shown when the dataset is unselected (Figure 9C). To select one or several datasets,
click on the logo on the left side of the dataset name (Figure 9D). To see the full extend of the layer in the
map viewer, click on the right-looking arrow (Figure 9E).
3.2.2. Configuring the visual appearance of an InSAR dataset
Clicking on the dataset name brings up the Dataset Settings window. In this window, the symbolisation can
be fine-tuned. The layers can be displayed with a variable level of opacity (Figure 9. Level-3 EGMS
deformation layersFigure 9F) and the size of the measurement points can be modified (Figure 9G). Multiple
colour palettes are available and can be visualised with previously defined stretch scales (very fine, fine,
medium, coarse) or manually adjusted by the user (custom) (Figure 9H).
The color of the points is based on the mean velocity of the entire data series expressed in mm/yr.
Modifications of the default visualisation parameters in the Dataset Setting window will override the global
settings for the selected dataset (Figure 9I). Additional options allow for displaying all points in black (Figure
9J) or hide points located under the reference terrain model (Figure 9K).
Figure 9. Level-3 EGMS deformation layers. A. Hide layers outside the current view. B. Send selected layer to the front or the back of the view. C. Unselected layer. D. Selected layer displayed in the map viewer. E. Show the full extent of the dataset. F. Set the
opacity of the layer. G. Set the point size. H. Choose the color palette and the scale (in mm/yr). I-K. Additional visualisation parameters.
EGMS SC
ORIGINAL Consortium
End User Interface Manual
(D5-UIM)
EGMS-D5-UIM-SC2-2.0-008
18/05/2022
Page 15 of 16
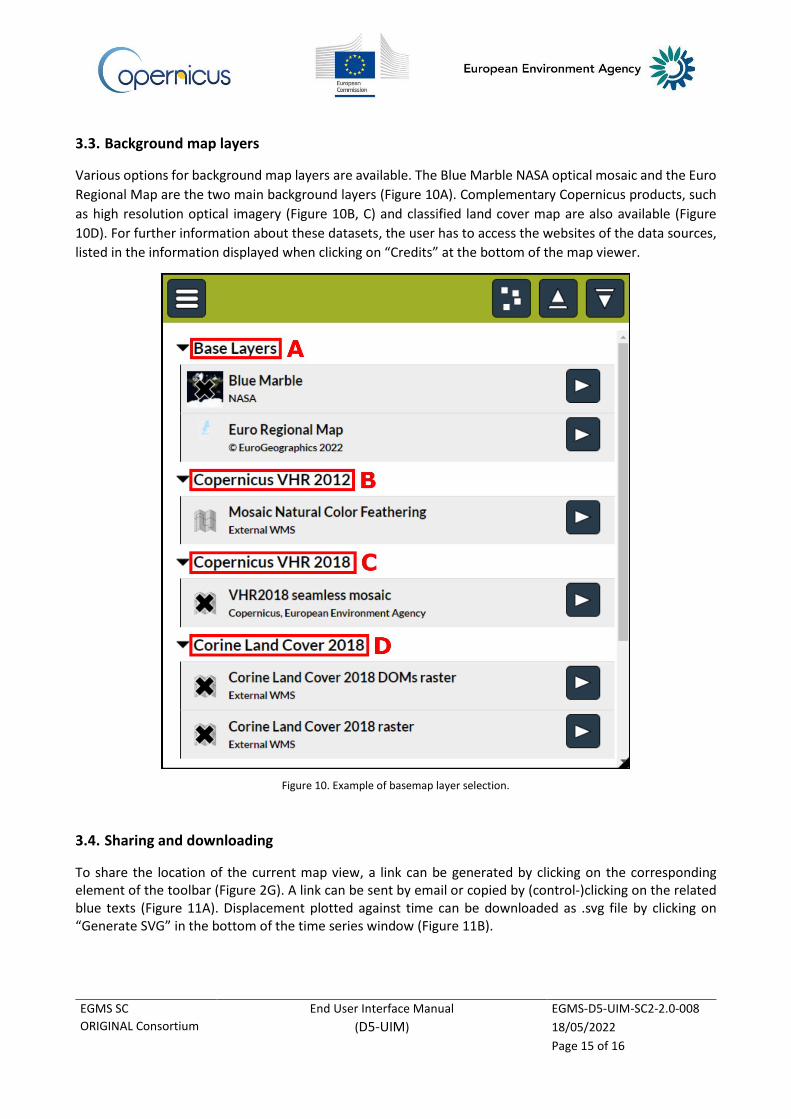
3.3. Background map layers
Various options for background map layers are available. The Blue Marble NASA optical mosaic and the Euro
Regional Map are the two main background layers (Figure 10A). Complementary Copernicus products, such
as high resolution optical imagery (Figure 10B, C) and classified land cover map are also available (Figure
10D). For further information about these datasets, the user has to access the websites of the data sources,
listed in the information displayed when clicking on “Credits” at the bottom of the map viewer.
Figure 10. Example of basemap layer selection.
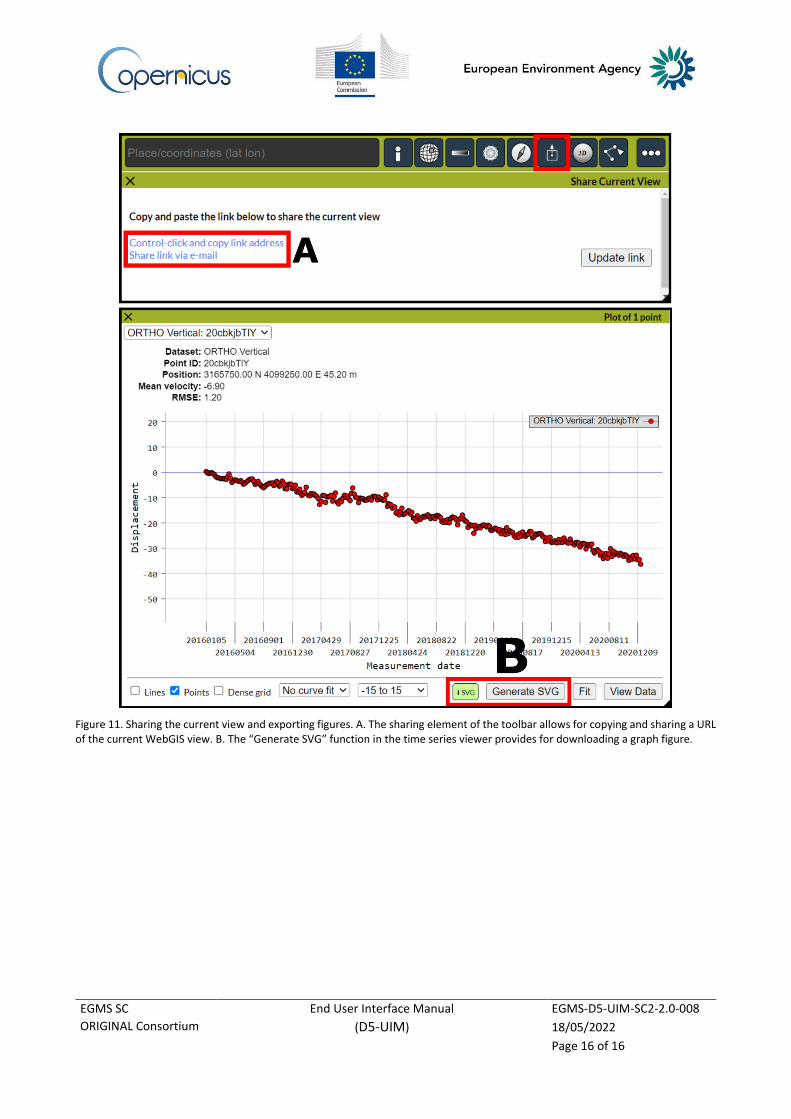
3.4. Sharing and downloading
To share the location of the current map view, a link can be generated by clicking on the corresponding element of the toolbar (Figure 2G). A link can be sent by email or copied by (control-)clicking on the related blue texts (Figure 11A). Displacement plotted against time can be downloaded as .svg file by clicking on “Generate SVG” in the bottom of the time series window (Figure 11B).
EGMS SC
ORIGINAL Consortium
End User Interface Manual
(D5-UIM)
EGMS-D5-UIM-SC2-2.0-008
18/05/2022
Page 16 of 16
Figure 11. Sharing the current view and exporting figures. A. The sharing element of the toolbar allows for copying and sharing a URL of the current WebGIS view. B. The “Generate SVG” function in the time series viewer provides for downloading a graph figure.


