Embed Size (px)
Citation preview

GEE|GPEARI
BMEP N.º 03| 2010 – Em Análise 37
Em Análise
Employer Enterprise Creation in Portugal1 Elsa de Morais Sarmento
2
Alcina Nunes3
This study provides a description of enterprise birth dynamics in Portugal, using an entrepreneurship
dataset conceived from Quadros de Pessoal based on the Eurostat/OECD methodology ―Manual on
Business Demography Statistics‖, for the period 1987 to 2007. The main contribution of this analysis is to
provide detailed empirical evidence of the performance of enterprise births by firm dimension, region and
main economic sectors. Using this unique matched employer-employee micro dataset, we discuss the
prevalence of some of the main stylized facts on firm creation. When relevant, we resort to international
data for comparison.
1. Introduction
In 2007, a joint OECD-Eurostat partnership took place, and new standard definitions and concepts were
adopted as a basis for the collection of empirical data on entrepreneurship, culminating in the publication
of a ―Manual on Business Demography Statistics‖ (OECD/Eurostat, 2008).
Our work follows this methodology and focuses on the analysis of entrepreneurial performance indicators
of enterprise creation, applied to the Quadros de Pessoal dataset (Employment Administrative Records) of
the Portuguese Ministry of Labour and Social Security, which is the main data source in Portugal, for the
universe of employer enterprises. This is composed of all active enterprises with at least one paid
employee during the period 1985 to 2007, which constitutes the so-called employer enterprise population.
According to the Eurostat/OECD definitions (2007), the core measure of births reflects the concept of
employer enterprise birth. A birth amounts to the ―creation of a combination of production factors with the
restriction that no other enterprises are involved in the event‖ (Eurostat/OECD, 2007). Births do not
include entries into the population which result from break-ups, spit-offs, mergers, restructuring of
enterprises or reactivations of units which are dormant within a period of two years4. Thus, this population
consists of enterprises that have at least one paid employee in its birth year and also of enterprises that,
despite existing before the year in consideration, were below the one employee threshold.
An employer enterprise birth is thus counted in the dataset as a birth of an employer enterprise after it
recruits its first employee, while complying with the above mentioned requisites.
The application of this specific methodology implied checking the previous two years before the firm’s
entry in the database (while fulfilling the one employee threshold), to account for possible reactivations.
This caused enterprise births to be effectively accounted for from 1987 onwards, instead of 19855.
Thus, the considered target indicator for the measurement of firm births is the employer enterprise birth
rate6. The employer enterprise birth rate is based on a numerator which follows the above definition for
1 This work reflects the opinions of the authors and not of the Ministry of Economics, Innovation and Development.
Other usual disclaimers apply. The authors would like to thank Gabinete de Estratégia e Planeamento of the Portuguese Ministry of Labour and Social Security for the provision of data. 2 Universidade de Aveiro (DEGEI). Gabinete de Estratégia e Estudos do Ministério da Economia, da Inovação e do
Desenvolvimento. 3 Escola Superior de Tecnologia e Gestão do Instituto Politécnico de Bragança.
4 If a dormant unit is reactivated within two years, this is not considered a birth but a reactivation. Reactivations of
enterprises are counted for the active enterprise population and not for the population of enterprise births. 5 Although data is available since 1981, entries were not measured before 1985, due to reliability issues.

GEE|GPEARI
BMEP N.º 03| 2010 – Em Análise 38
employer enterprise births, and a denominator which consists of the population of active enterprises with
one or more employees during the reference period.
3. Entrepreneurship performance indicators for enterprise creation in
Portugal
3.1. Employer enterprise births
The body of research published so far on entry, has engendered a series of persistent and compelling
stylized facts about firm dynamics, which are observed in a wide spectrum of countries (Geroski, 1995;
Bartelsman et al., 2005; Cabral, 2007; Klapper et al., 2009; Plehn-Djowich, 2009).
One of the less controversial stylised facts is that net entry is far less important than the gross flows of
entry7 and exit that generate it. It is known that there are a high number of firms that enter and exit the
market every year. Most of new entrants are more involved in the search process rather than in the
effective increase of the number of competitors in the market (Bartelsman, 2004).
The analysis of the growth rate of Portuguese employer enterprise births shows a considerable level of
turnover8 and volatility during the period 1987-2007. In what concerns enterprise births, four main ―peaks‖
are clearly observable (Figure 1), 1989, 1994 with a 57% growth rate (year on year) and the highest birth
rate throughout the period (22,8%), 2000 with 35% growth and 19,5% of birth rate and 2005 with a rate of
growth 38% (corresponding to a birth rate of 16,1%).
Overall, the rhythm of growth of enterprise births has been decreasing since the 2000 ―peak‖, exception
made for 2005 (with a 37,6% growth rate), and the slight recovery occurred in 2007 (1,4%). In 2005, 16 out
of 100 enterprises were new. In 2007, the birth rate was back to 2004´s level (12,6%).
Figure 1 - Employer enterprise births and birth rates*, 1987-2007
Source: Own calculations based on Quadros de Pessoal, GEP, Ministério do Trabalho e da Solidariedade Social. Note: Employer Enteprises are enterprises which have at least one paid worker. Birth rates are calculated as the ratio of the number of employer enterprise births over the population of employer enterprises during the reference period.
6 The manual on ―Business Demography Statistics‖ (Eurostat/OECD, 2007) considers three different indicators for the
measurement of a firm’s birth, providing higher levels of international comparability as the threshold rises. 7 In fact, several measures of entry can be considered. According to Siegfried and Evans (1994), a net entry measure
treats exits as negative entries, forcing the structural determinants of entry to be the same as the structural determinants of exit. Gross entry on the other had, refers to entry alone. However, gross entry does not reflect entry that matters for competition measurement, as entering firms may simple displace exiting firms. Moreover, this measurement might not reflect effective entry rates, that is the amount of firms that actually survive and do not abandon the market. 8 Turnover is a measure of firm churning. It is defined as the sum of birth and death rates, that is the percentage of
active firms that either enter or exit the market in a given year.
Population of active employer enterprises*
110,8122,8
148,6159,2
184,3
213,6
228,8
244,2
268,7
284,0
299,8
340,8
25,7 26,8
42,035,0 37,6 38,9
52,3 54,2 54,741,5 39,9
54,944,6
306,6
354,9
344,0
312,9
192,2
197,5
165,9
140,3
137,1
102,0106,7
30,0 30,126,823,519,1
44,0
23,8 27,5
17,2
19,420,1
16,8 17,3 16,816,2
22,8
15,6 15,216,4 16,4 15,9
19,5 19,118,2
13,512,7
16,1
12,8 12,6
0
50
100
150
200
250
300
350
400
1985 1986 1987 1988 1989 1990 1991 1992 1993 1994 1995 1996 1997 1998 1999 2000 2001 2002 2003 2004 2005 2006 2007
Nu
mb
er
of
em
plo
yer
en
terp
rises (
tho
usan
ds)
0
5
10
15
20
25
30
35
40
%
Active employer enterprises (nº) Employer enterprise births (nº) Employer enteprise birth rate (%)
Source: Own calculations based on Quadros de Pessoal, GEP, Ministério do Trabalho e da Solidariedade Social
Note: Employer Enteprises are enterprises which have at least one paid worker. Birth rates are calculated as the ration of the number of employer enterprise
births over the population of employer enterprises during the reference period.

GEE|GPEARI
BMEP N.º 03| 2010 – Em Análise 39
In the 20 year period starting in 1987, the annual average growth rate of employer enterprise births was
4,3% (Table 1), but from 1996 to 2000, an economic recovery period, it becomes substantially higher
(14,9%), particularly when compared with the less favourable period of 1990-1995 (4,9%) and also to the
period ranging from 2001 to 2005 (0,3%)9. The average birth rate also highlights this deceleration
tendency, in particular from 2001. From 1990 to 1995, it averages 17,6%, decreases to 16,7% during 1996
to 2000 and continues to fall in the following five year period (15,9%).
Table 1 - Average birth rate and annual average growth of births
Source: Author’s calculations based on Quadros de Pessoal GEP, MTSS
Various studies have documented substantial rates of entry (and exit) in a number of countries (Caves,
1998; Scarpetta et al., 2002; Masso et al., 2004; Ahn, 2001; Cabral, 2007; Klapper et al., 2008). Among
the European countries, Portugal has one of the highest records of new firms relatively to the stock of
existing enterprises, even when other universes and methodologies are considered (OECD/Eurostat,
2009; Eurostat, 2009; INE 2009; Scarpetta et al., 2002; Cabral, 2007; Bartelsman, 2004).
The Structural Business Statistics data by Eurostat (2009) shows that in 2005, Portugal had the second
highest business entry rate among 20 countries (Figure 2). The same rank is found if we used instead our
entry rate based on Quadros de Pessoal (Eurostat/OECD, 2007), or the entry rate from Statistics Portugal
(INE, 2009), calculated for enterprises which employ more than one worker (which follows the same
Eurostat/OECD´s methodology). In 2006, within a panel of 16 countries, Portugal ranks the third highest,
after Estonia and Romania (INE, 2009) and would be ranked second if Statistics Portugal data (EIP) or
Quadros de Pessoal (Eurostat/OECD, 2007) data would be used instead.
9 We observe a positive correlation between the GDP at current prices and the birth rate, within the period from 1996 to
2006 (47,7%) and a significant correlation between the lagged GDP at current prices and the birth rate (96,6%, significant at 1% level) and of the lagged GDP at the previous year prices and the birth rate (70,5%, significant at 5% level).
PeriodAverage birth
rate (%)
Annual Average
Growth of Births
(%)
1987-2007 16,7 4,3
1987-2000 17,5 8,1
2000-2007 15,6 -2,3
1990-1995 17,6 4,9
1996-2000 16,7 14,9
2001-2005 15,9 0,3

GEE|GPEARI
BMEP N.º 03| 2010 – Em Análise 40
Figure 2 - Birth rates, according to the Business Demography Statistics by Eurostat and Birth rate
for Portugal according to Statistics Portugal (EIP) and Quadros de Pessoal , ordered by 2005 and
country
Source: Eurostat, Statistics Portugal for Portugal INE (EIP) data and author’s calculations based on Quadros de Pessoal GEP, MTSS for Portugal QP (Eurostat/OECD)and SDBS Business Demography Indicators from the OECD (EIP).
Notes: Preliminary version of 2005 for Bulgaria, Romania, Portugal and Slovenia. * Employer enterprises according to the Eurostat/OECD methodology, based on Quadros de Pessoal. ** Statistitics Portugal data, for enterprises with more than 1 paid employee (employer enterprises).
3.2. Employer enterprise births by size class
The vast majority of enterprises in OECD countries (OECD, 2000) and in the European Union (Storey,
1994; Eurostat, 2009) are small and medium enterprises (SMEs). The weight of SMEs in the economy has
been increasing in many countries (OECD, 2000) due to the predominance of the service sector, as larger
firms outsource more functions and as developments in information technologies lower entry costs,
allowing smaller firms to enter market niches.
Another stylized fact is that entry is more likely to occur in smaller size classes (Segarra and Callejón,
2002). Births (and deaths) are traditionally more concentrated in smaller size classes compared to the
overall firm population (OECD/Eurostat, 2009). In general, due to the uncertainty regarding future
profitability and the learning process firms incur only after entering the market, most firms prefer to enter
small in order to have minimum costs in case of exit. On the other hand, firms with better information
about their future success tend to enter with a bigger size10
. Another possible cause is that firms start
small, despite the adequacy in some industries to enter with a bigger scale, due to financing constraints
(Cabral and Mata, 2003).
In Portugal, small firms are created at a faster pace than larger firms, gaining share in both enterprise and
employment (Sarmento and Nunes, 2009). In the period comprised between 2000 and 2007, 48.259 new
enterprises were created on average per year (Table 2). Among these, 40.297 are within the 1 to 4
employees size class (83,5% of total enterprises) and 48.011 are below the 50 employees range (99,5%).
During 1993, an year characterised by a widespread international economic crisis and speculative
currency attacks within the European Monetary System, Portugal faced a negative GDP growth (-0,7%).
Firms with over 50 employees were particularly hit (84,2% increase in deaths), but managed to grow
substantially in the following year (from 205 to 361 enterprises). The year of 1994, initiated a period of
economic recovery and was marked by the start of the second community support framework (QCAII). In
10
Firms that start up bigger also have a higher probability of survival. These constraints are larger in the service sector as a firm’s current size dimension highly determines its survival chances (Nunes and Sarmento, 2010).
Birth rate Business demography statistics Eurostat
18,3
16,1
14,9
13,313,7
13,2
11,511,1 11,0
10,4
9,49,0 8,8 8,7
8,3 8,37,8
7,3 7,1 7,0
14,6
12,8
16,2
14,2
12,9
9,9
12,3
15,9
10,4
9,4
8,7
9,79,3
8,4
7,16,7
9,8
11,9 11,9
0
2
4
6
8
10
12
14
16
18
20
Rom
ania
Por
tuga
l QP (E
USTA
T/OECD)*
Por
tuga
l INE (E
IP)**
Por
tuga
lUK
Den
mar
k
Bulga
ria
Latvia
Luxe
mbo
urg
Eston
ia
Spa
in
Net
herla
nds
Franc
e
Hun
gary
Slove
nia
Cze
ch R
ep
Finland
Aus
tria
Italy
Slova
kia
Cyp
rus
Swed
en
%
2005 2006

GEE|GPEARI
BMEP N.º 03| 2010 – Em Análise 41
1994, the rate of growth of births was the highest of all the 1987-2007 period (57%), in particular for the
size class of over 250 employees (600%). The second highest growth rate occurred in 2000 (35%),
particularly in what concerns micro firms with less than 4 employees (38%).
Table 2 – Average employer enterprise births by periods and firm size
Source: Author’s calculations based on Quadros de Pessoal GEP, MTSS
According to Table 2 and Figure 3, most of enterprise births occurred in the 1 to 4 employees’ range, in
particular during the period 2000-2007 (83,5%), when compared to the previous period of 1992-1999
(79,3% of total). The annual average rate of growth of the 1-4 size class firms is 1 p.p. above the
economy’s average (4,1%) from 1986 to 2007, only surpassed by the over 250 employees range with
6,4% of growth.
In 1995, the 1-4 size class firms obtained more than 80% of the share of total business (Table 1 in Annex
I) and has shown a steady increase, at the expense of all other business size ranges (Figure 3). The shift-
share analysis shows that the greatest contributions to the rate of growth of births comes mainly from the
1-4 size class (except for the year 2001 when it was mainly due to 5-9 and 10-19 size classes).
According to Eurostat (2009), Portugal has had the highest share of enterprises births in the 1 to 4
employees’ size class (average of 2005 and 2006).
Figure 3 – Employer enterprise births by size class
Source: Author’s calculations based on Quadros de Pessoal GEP, MTSS
The decrease in birth rates in particular after 2001, is observed in all size classes (Figure 4). In 2006,
enterprises with more than 250 employees suffered a sharper decline than other size class ranges (-65%
of growth rate), but managed to recover in 2007 (with a growth of 83,3%).
Period
1 - 4 1 - 9 1 - 19 1-49 1 - 249 ALL
1987-2000 31.368 24.442 28.900 30.476 31.147 31.347 31.368
% of total 100 77,9 92,1 97,2 99,3 99,9 100,0
1987-2007 36.803 29.555 34.256 35.885 36.574 36.781 36.803
% of total 100 80,3 93,1 97,5 99,4 99,9 100,0
1992-1999 33.383 26.483 30.982 32.511 33.162 33.363 33.383
% of total 100 79,3 92,8 97,4 99,3 99,9 100,0
2000-2007 48.259 40.287 45.543 47.286 48.011 48.233 48.259
% of total 100 83,5 94,4 98,0 99,5 99,9 100,0
Source: Own calculations based on Quadros de Pessoal, GEP, MTSS
Cumulative by Size Class (nº employees)Average
entreprise
births
Employer Enterprise Births by Size Class (%)
13.626
17.065
19.905
16.872
19.036
19.999
20.450
32.174
24.232
24.249
28.288
30.717
31.757
43.812
42.141
44.808
34.780
33.935
46.284
37.784
38.748
3.385
4.150
4.814
4.078
4.256
4.304
3.974
6.238
3.806
3.893
4.446
4.588
4.738
5.751
8.093
6.888
4.411
3.909
5.208
3.998
3.795
1.331
1.655
1.816
1.695
1.528
1.568
1.546
2.237
1.232
1.254
1.405
1.446
1.543
1.799
2.808
2.069
1.454
1.207
1.953
1.379
1.277
0 0,2 0,4 0,6 0,8 1
1987
1988
1989
1990
1991
1992
1993
1994
1995
1996
1997
1998
1999
2000
2001
2002
2003
2004
2005
2006
2007
%
1 - 4 5 - 9 10 - 19 20-49 50 - 249 + 250
Source: GEE based on Quadros de Pessoal, GEP, Ministério do Trabalho e da Solidariedade Social

GEE|GPEARI
BMEP N.º 03| 2010 – Em Análise 42
Figure 4 - Birth rates by firm size
Source: Author’s calculations based on Quadros de Pessoal GEP, MTSS
The increasing births of firms in smaller size classes (Figure 3), combined with a smaller average entrant
size (Table 3) and specialisation effects towards industries with a smaller efficient scale, have led to a
decline in average firm size in Portugal over time (Sarmento and Nunes, 2009).
Table 3 - Average firm size of new employer enterprises (Births)
(average number of employees)
Source: Author’s calculations based on Quadros de Pessoal GEP, MTSS
3.3. Employer enterprise births by regions
The creation of enterprises is also a primary indicator of the level of entrepreneurship, at the regional level.
The regional distribution of start-up rates is relatively uneven across the seven NUT II regions (Table 4).
Norte is responsible for most of the enterprise births in the country, with an average share of 36% of total
enterprises, throughout the 20 year period considered (with a ―peak‖ in 2005 when it reached a 44,4%
share), with a birth rate greater than the national average (except for years 1991, 1992 and 2000). This
region also presents the highest dispersion, followed by Centro and Lisboa.
Lisbon and Açores have smaller birth rates than the country’s average throughout most of the observed
period, while the Algarve is systematically the region with the highest birth rates in Portugal. In 2007, the
Algarve had a birth rate of 15,3%, compared to a national birth rate of 12,6% (in 2001 there was a 4,3 p.p.
difference relatively to the national average). In 2007, there were three regions with birth rates above the
national average, Algarve, Lisboa and Norte.
Table 4 - Employer Enterprise Birth rates by NUT II (%)
Source: Author’s calculations based on Quadros de Pessoal GEP, MTSS
Birth rates by firm size
24,3
13,0
9,4
6,5
3,3
0,7
23,0
12,6
9,8
6,3
3,4
1,9
21,8
9,9
6,7
5,3
3,2
1,6
23,8
14,0
10,3
6,4
3,53,0
17,7
7,3
5,2
4,13,5
3,1
6,5
4,93,9
2,7
1,3
6,0
4,43,7
2,2 2,3
16,4
16,3
0
5
10
15
20
25
30
1 - 4 5 - 9 10 - 19 20-49 50 - 249 + 250
Size class (nº employees)
%1987 1990 1997 2001 2003 2006 2007
1987 1988 1989 1990 1991 1992 1993 1994 1995 1996 1997 1998 1999 2000 2001 2002 2003 2004 2005 2006 2007
5,41 5,58 5,76 5,66 5,83 5,1 5,23 6,06 4,11 4,1 4,08 4,27 4,11 4,31 4,24 3,88 3,97 3,82 4,03 3,38 3,37
1987 1988 1989 1990 1991 1992 1993 1994 1995 1996 1997 1998 1999 2000 2001 2002 2003 2004 2005 2006 2007 1987-1995 1990-1995 1996-2001 2002-2007
Norte 18,6 20,5 20,4 17,4 17,1 15,9 16,7 23,4 16,1 15,5 16,8 17,1 16,7 19,3 20,6 18,8 14,3 13,4 19,9 12,9 12,8 18,4 17,9 17,9 15,3
Algarve 25,7 28,8 30,4 22,8 23,2 20,6 19,7 28,9 17,7 17,5 18,6 17,5 17,4 22,3 23,4 20,9 14,7 14,1 16,9 14,9 15,3 23,7 22,1 19,8 16,0
Centro 16,9 18,1 21,2 16,9 18,6 18,4 16,8 23,2 16,0 15,8 16,0 16,5 16,2 20,8 18,1 18,1 12,3 11,6 14,4 11,3 10,8 18,5 18,4 17,4 13,0
Lisboa 14,4 16,6 17,3 14,8 15,5 16,0 14,6 20,8 14,0 13,6 14,7 15,3 14,5 18,4 17,5 17,4 13,2 12,7 13,0 13,6 13,5 16,1 16,0 15,8 13,9
Alentejo 20,4 25,9 22,9 18,5 19,1 17,9 16,9 22,8 16,7 16,5 21,0 17,0 15,6 19,7 17,9 17,2 13,5 12,0 14,5 12,1 11,8 19,9 18,6 18,0 13,5
Açores 18,9 18,3 17,0 15,1 16,7 16,1 13,7 20,3 15,3 16,0 13,2 12,8 14,5 15,2 16,8 17,4 13,7 13,4 12,4 12,5 11,4 16,8 16,2 14,8 13,4
Madeira 15,9 16,6 17,4 16,6 16,9 17,6 17,7 25,1 17,6 16,3 15,9 17,2 17,5 17,4 19,4 18,3 16,6 14,8 13,2 13,6 12,0 18,3 18,8 17,4 14,6
Total 17,2 19,4 20,1 16,8 17,3 16,8 16,2 22,8 15,6 15,2 16,4 16,4 15,9 19,5 19,1 18,2 13,5 12,7 16,1 12,8 12,6 18,0 17,7 17,3 14,3

GEE|GPEARI
BMEP N.º 03| 2010 – Em Análise 43
Most regions follow the general trend of decreasing birth rates (Table 4 and 5), in particular after 2000, a
phenomena also observable by the decreasing annual average growth rates of enterprise births. The
Algarve is the only region that manages to dispute this tendency and maintain a positive annual growth
rate of enterprise births, during the period 2000 to 2007 (1,0%).
Colantone and Sleuwaegen (2008), when analysing entries and exits in eight European countries, point
out that globalisation is bringing an increasing level of risk, tougher competitive pressure and increasing
barriers to entry the market for potential entrepreneurs, which has resulted in declining entry rates.
Table 5 - Annual average growth rate of employer enterprise births by NUT II
Source: Author’s calculations based on Quadros de Pessoal GEP, MTSS
In 1993, a year of economic downturn, the sharp decrease in birth rates was felt most severely in Lisbon.
According to the shift-share decomposition provided in Table 3 in Annex I, this region depicts a negative
contribution to the growth of enterprise births (-1,5 p.p. of an overall 0,2% of growth) followed by Centro (-
0,5 p.p.), Açores, Alentejo and the Algarve. This tendency is counteracted by the growth in Norte (2,5 p.p.
contribution to an overall 0,2% of growth) and Madeira (0,1 p.p.).
The 1994 peak in enterprise births was mostly due to the contributions of Norte (20,8 p.p. of the overall
56,6% of birth growth), Lisboa (15 p.p.) and the Algarve (4 p.p.), which experienced the highest birth rate
in the country. According to the shift-share analysis, the peak of 2000 is explained by the contribution of
enterprise births in Centro (10 p.p. to an overall birth growth of 34,6%), Norte (9,7 p.p.) and Lisboa (9,2
p.p.).
By combining the geographical with the size class dimension, we may observe the preponderance of small
firms births in most regions (Table 6), in particular in Algarve (above 98,1% of enterprises are born with
fewer than 20 employees throughout the period), Alentejo (above 97,7%), Centro (97,2%) and the Açores.
Over the period, Norte is the region where relatively less firms are born with fewer than 20 employees.
Table 6 - Share of enterprises with fewer than 20 employees by NUT II region (%)
Source: Author’s calculations based on Quadros de Pessoal GEP, MTSS
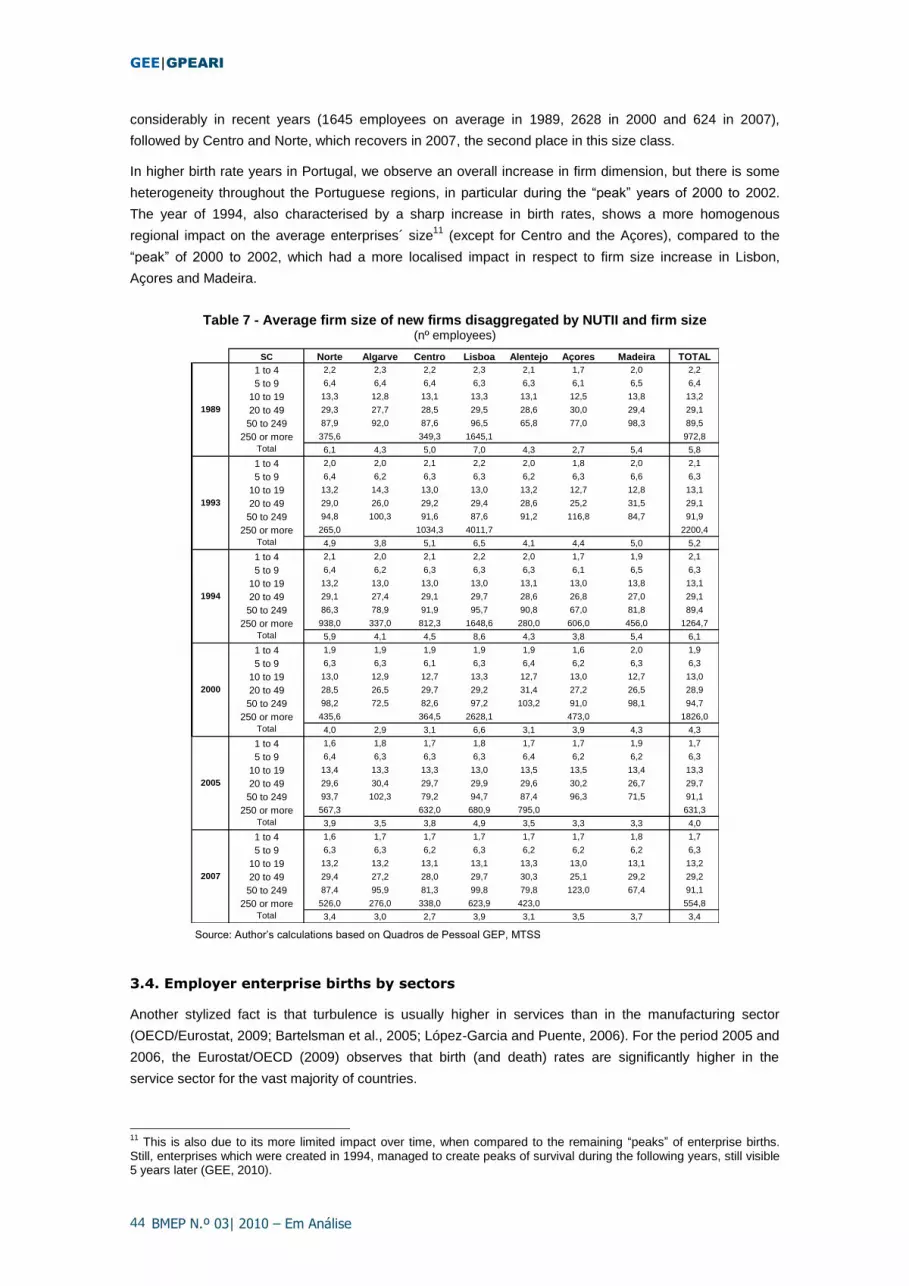
Average firm size of entrants has also been decreasing throughout the country’s regions (Table 7), except
for size class of 20-49 employees which, despite the natural fluctuations over this 12 year period, has been
able to show systematic recoveries and maintain its average range between 25 and 31 employees
throughout the period.
Until 2003, Açores had the smallest sized enterprises, in the size class 1-4 (1,8 employees on average).
From 2005, it was overthrown by Norte (1,6). On the other hand, Lisbon has the biggest sized enterprises
in the country in the size class of over 250 employees, although average firm size has been decreasing
NUTII 1987-2007 2000-2007
Norte 4,3% -1,5%
Algarve 6,2% 1,0%
Centro 4,6% -5,3%
Lisboa e Vale do Tejo 4,3% -1,1%
Alentejo 3,1% -4,2%
Açores 1,1% -1,0%
Madeira 4,9% -1,1%
Portugal 4,3% -2,3%
Regions 1995 1996 1997 1998 1999 2000 2001 2002 2003 2004 2005 2006 2007
Norte 96,8 97,5 96,9 97,4 97,3 97,7 97,4 98,0 97,4 97,6 97,4 97,8 98,0
Algarve 98,7 98,9 98,7 98,7 98,4 98,9 98,8 99,0 98,8 98,8 98,1 98,4 98,5
Centro 98,1 98,1 98,2 98,5 98,4 98,7 98,5 99,0 98,7 98,6 97,2 98,8 98,8
Lisboa 97,8 97,5 97,6 97,4 97,5 97,7 97,4 97,9 97,8 97,7 97,1 97,9 98,1
Alentejo 98,7 97,7 98,6 98,6 98,8 98,9 98,6 98,7 98,7 98,5 98,1 98,4 98,4
Açores 98,7 99,0 98,2 99,1 99,4 97,8 97,8 97,4 98,6 98,3 98,3 98,7 98,1
Madeira 97,0 96,4 98,0 97,6 97,5 98,1 96,6 97,8 98,3 97,4 98,9 97,9 97,3
Portugal 97,7 97,7 97,6 97,8 97,8 98,1 97,8 98,3 98,0 98,0 97,4 98,1 98,2
GEE|GPEARI
BMEP N.º 03| 2010 – Em Análise 44
considerably in recent years (1645 employees on average in 1989, 2628 in 2000 and 624 in 2007),
followed by Centro and Norte, which recovers in 2007, the second place in this size class.
In higher birth rate years in Portugal, we observe an overall increase in firm dimension, but there is some
heterogeneity throughout the Portuguese regions, in particular during the ―peak‖ years of 2000 to 2002.
The year of 1994, also characterised by a sharp increase in birth rates, shows a more homogenous
regional impact on the average enterprises´ size11
(except for Centro and the Açores), compared to the
―peak‖ of 2000 to 2002, which had a more localised impact in respect to firm size increase in Lisbon,
Açores and Madeira.
Table 7 - Average firm size of new firms disaggregated by NUTII and firm size
(nº employees)
Source: Author’s calculations based on Quadros de Pessoal GEP, MTSS
3.4. Employer enterprise births by sectors
Another stylized fact is that turbulence is usually higher in services than in the manufacturing sector
(OECD/Eurostat, 2009; Bartelsman et al., 2005; López-Garcia and Puente, 2006). For the period 2005 and
2006, the Eurostat/OECD (2009) observes that birth (and death) rates are significantly higher in the
service sector for the vast majority of countries.
11
This is also due to its more limited impact over time, when compared to the remaining ―peaks‖ of enterprise births. Still, enterprises which were created in 1994, managed to create peaks of survival during the following years, still visible 5 years later (GEE, 2010).
SC Norte Algarve Centro Lisboa Alentejo Açores Madeira TOTAL
1 to 4 2,2 2,3 2,2 2,3 2,1 1,7 2,0 2,2
5 to 9 6,4 6,4 6,4 6,3 6,3 6,1 6,5 6,4
10 to 19 13,3 12,8 13,1 13,3 13,1 12,5 13,8 13,2
20 to 49 29,3 27,7 28,5 29,5 28,6 30,0 29,4 29,1
50 to 249 87,9 92,0 87,6 96,5 65,8 77,0 98,3 89,5
250 or more 375,6 #DIV/0! 349,3 1645,1 #DIV/0! #DIV/0! #DIV/0! 972,8
Total 6,1 4,3 5,0 7,0 4,3 2,7 5,4 5,8
1 to 4 2,0 2,0 2,1 2,2 2,0 1,8 2,0 2,1
5 to 9 6,4 6,2 6,3 6,3 6,2 6,3 6,6 6,3
10 to 19 13,2 14,3 13,0 13,0 13,2 12,7 12,8 13,1
20 to 49 29,0 26,0 29,2 29,4 28,6 25,2 31,5 29,1
50 to 249 94,8 100,3 91,6 87,6 91,2 116,8 84,7 91,9
250 or more 265,0 #DIV/0! 1034,3 4011,7 #DIV/0! #DIV/0! #DIV/0! 2200,4
Total 4,9 3,8 5,1 6,5 4,1 4,4 5,0 5,2
1 to 4 2,1 2,0 2,1 2,2 2,0 1,7 1,9 2,1
5 to 9 6,4 6,2 6,3 6,3 6,3 6,1 6,5 6,3
10 to 19 13,2 13,0 13,0 13,0 13,1 13,0 13,8 13,1
20 to 49 29,1 27,4 29,1 29,7 28,6 26,8 27,0 29,1
50 to 249 86,3 78,9 91,9 95,7 90,8 67,0 81,8 89,4
250 or more 938,0 337,0 812,3 1648,6 280,0 606,0 456,0 1264,7
Total 5,9 4,1 4,5 8,6 4,3 3,8 5,4 6,1
1 to 4 1,9 1,9 1,9 1,9 1,9 1,6 2,0 1,9
5 to 9 6,3 6,3 6,1 6,3 6,4 6,2 6,3 6,3
10 to 19 13,0 12,9 12,7 13,3 12,7 13,0 12,7 13,0
20 to 49 28,5 26,5 29,7 29,2 31,4 27,2 26,5 28,9
50 to 249 98,2 72,5 82,6 97,2 103,2 91,0 98,1 94,7
250 or more 435,6 #DIV/0! 364,5 2628,1 #DIV/0! 473,0 #DIV/0! 1826,0
Total 4,0 2,9 3,1 6,6 3,1 3,9 4,3 4,3
1 to 4 1,6 1,8 1,7 1,8 1,7 1,7 1,9 1,7
5 to 9 6,4 6,3 6,3 6,3 6,4 6,2 6,2 6,3
10 to 19 13,4 13,3 13,3 13,0 13,5 13,5 13,4 13,3
20 to 49 29,6 30,4 29,7 29,9 29,6 30,2 26,7 29,7
50 to 249 93,7 102,3 79,2 94,7 87,4 96,3 71,5 91,1
250 or more 567,3 #DIV/0! 632,0 680,9 795,0 #DIV/0! #DIV/0! 631,3
Total 3,9 3,5 3,8 4,9 3,5 3,3 3,3 4,0
1 to 4 1,6 1,7 1,7 1,7 1,7 1,7 1,8 1,7
5 to 9 6,3 6,3 6,2 6,3 6,2 6,2 6,2 6,3
10 to 19 13,2 13,2 13,1 13,1 13,3 13,0 13,1 13,2
20 to 49 29,4 27,2 28,0 29,7 30,3 25,1 29,2 29,2
50 to 249 87,4 95,9 81,3 99,8 79,8 123,0 67,4 91,1
250 or more 526,0 276,0 338,0 623,9 423,0 #DIV/0! #DIV/0! 554,8
Total 3,4 3,0 2,7 3,9 3,1 3,5 3,7 3,4
1989
1993
1994
2000
2005
2007

GEE|GPEARI
BMEP N.º 03| 2010 – Em Análise 45
According to Quadros de Pessoal, the service sector has been reinforcing its position as the leading sector
in the Portuguese economy, a phenomenon shared with a considerable amount of countries (OECD, 2005;
Ahn, 2001), given the increasing reliance on intangibles, information technologies and globalisation
(Colantone and Sleuwaegen , 2008), among other factors (Sarmento and Nunes, 2009).
In 2006, the service sector was responsible for 71,6% of all start-ups (+3 p.p. than in 1996), as depicted in
Table 8, and 62% of total employment generated by new firm entries (+6 p.p. than in 1996), greater than
the weight of this sector’s overall employment in the economy (60,3% in 2006 and 50,1% in 1996)
(Sarmento and Nunes, 2009).
Table 8 - Distribution of enterprise births, by broad sectors
12 (share, %)
Source: Author’s calculations based on Quadros de Pessoal GEP, MTSS
Concerning birth rates, we observe considerable variations across Portuguese sectors (Figure 5). From
1998 to 2001, the most dynamic sector was ―Construction‖, where birth rates surpassed 20%,
accompanied by an increasing weight in the share of total births. From 1996 to 2001, the Construction
sector gave the greatest contribution to the growth of enterprise births in the country, which is still
maintained in 2003 and 2004 (Table 2 in Annex I).
In 2001, 29 out of each 100 were new enterprises in the construction sector (which represented 4,4% of
total enterprises in the country in 2001)13
. A similar trend can be found in other countries, particularly in
Spain (Consejo Superior de Cámaras de Comercio en España, 2003).
From 1996, the service sector is ranked as having the second highest birth rate14
, taking the lead from
2003 onwards (in 2005, 16 out of 100 were new service enterprises). According to OECD/Eurostat (2009),
in 2006, Portugal had the highest birth rate in the service sector, above 20 other countries.
Manufacturing birth rates have been decreasing since 2001, with a slight recovery in 2005, which was
extended to all broad sectors.
At a more disaggregated level, the sectors with the highest average births during 1995-2006 (at one letter
level of the Classification of Economic Activities, Rev. 2.1.) are ―Public administration and defence;
compulsory social security‖ (which also holds the highest annual average growth rate), ―Fishing‖,
―Agriculture, farming of animals, hunting and forestry‖, ―Real estate, renting and business activities‖ and
the ―Construction‖ sector, which averages 18,4% during the period. From 2001 to 2006, the same sectors
rank the highest birth rates.
12
Broad sectors are services, manufacturing, Construction and Agriculture (and Fishing, that is the primary sector). Data is provided from 1995 only, due to the start of European System of Accounts in 1995, and up to 2006 due to the problems of compatibility with Classification of Economic Activities Revision 3, introduced in 2007. 13
In the year following 1995, survival rates for the construction sector were the highest of all broad sectors during the 3 first years of activity (1996-1998). From 1999 onwards, firm survival in the service sector overcame survival in the construction sector, that kept on falling at a relatively higher rate than in other sectors (for the survival cohort 1995-2005) (Sarmento and Nunes, 2009). 14
Nunes and Sarmento (2010) show that industries characterised by high entry rates at the moment of birth, find post-entry survival more difficult.
1995 1996 1997 1998 1999 2000 2001 2002 2003 2004 2005 2006
Agriculture 4,5 4,6 5,2 4,1 3,8 3,5 3,5 3,7 3,9 4,3 14,9 5,8
Manufacturing 15,5 14,6 15,0 14,3 14,1 12,2 14,2 11,6 10,4 9,8 8,7 9,2
Services 68,9 68,9 66,1 65,9 64,7 65,4 59,5 65,2 71,4 72,4 64,5 71,6
Construction 11,1 11,9 13,7 15,7 17,4 19,0 22,8 19,4 14,2 13,5 11,9 13,3

GEE|GPEARI
BMEP N.º 03| 2010 – Em Análise 46
Figure 5 - Birth rates by broad sectors, 1995-2006 15
Source: Author’s calculations based on Quadros de Pessoal GEP, MTSS
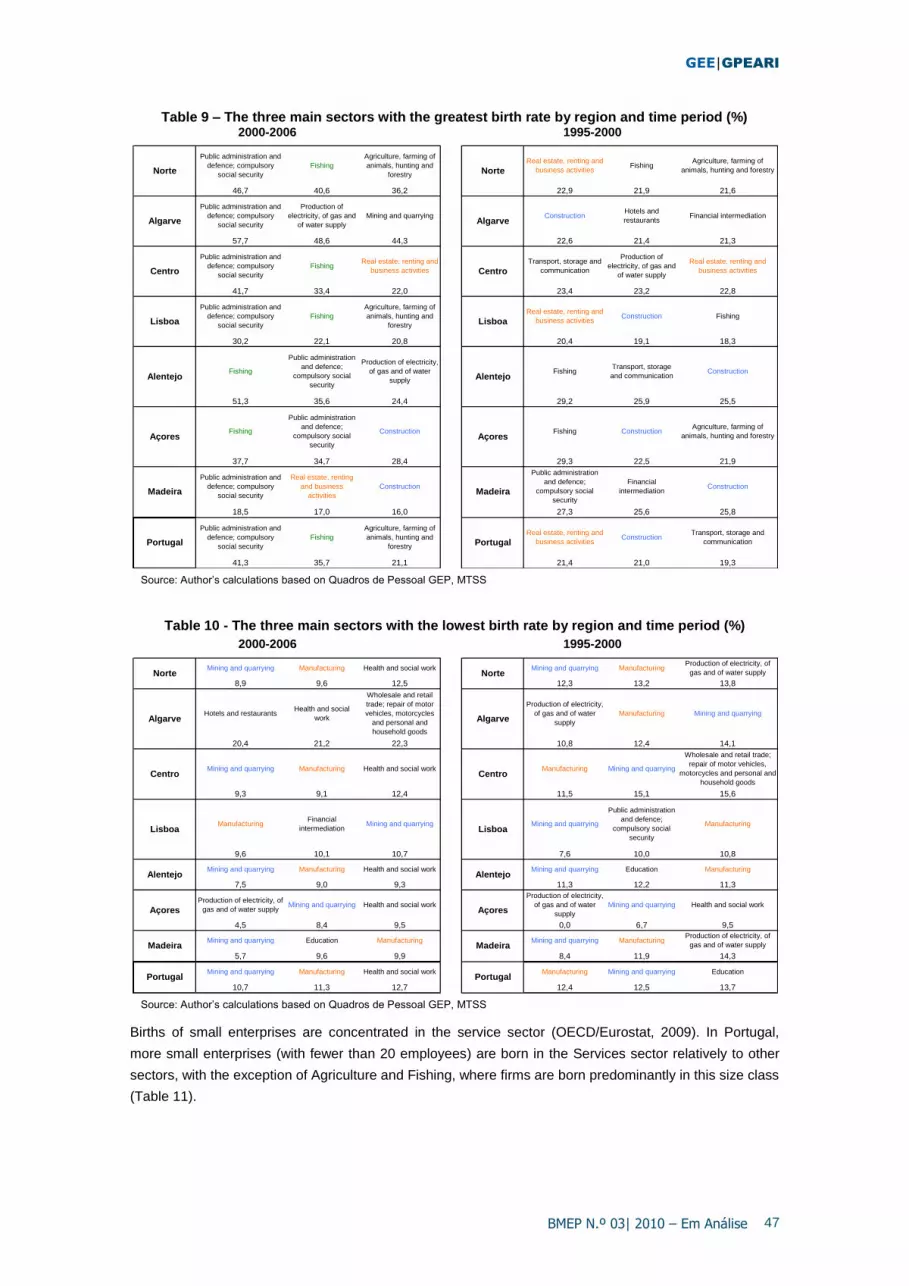
The same rankings are maintained when we consider an analysis by NUT II for the sub-period 2000 to
2006 (Tables 9 and 10). In the Açores and Alentejo, the fishing activity still engenders a considerable
creation of enterprises. InMadeira, turism might be the main responsible for the increase in enterprise
creation in the Real Estate16
and Construction sectors.
From 1995 to 2000, Real Estate, mostly in the Norte and Lisbon regions, and Construction are the
prevailing sectors in enterprise creation. The Construction sector, which has grown considerably in regions
such as Algarve, Madeira, Açores, Alentejo and Lisboa, faces a slowdown during the following sub-period
(2000-2006), both in enterprise and employment creation (Sarmento and Nunes, 2009).
The broad Manufacturing sector17
shows the smallest birth rates in both sub-periods (Table 10), as well as
in employment generation, especially after 2000 (Sarmento and Nunes, 2009). From 1995 to 2000, the
Manufacturing sub-sector (D) has the lowest birth rates in Lisboa, Alentejo and Centro, while ―Mining and
Quarrying‖ grows below the country’s average in Lisbon, Norte and Alentejo.
From 2000 to 2006, the ―Mining and Quarrying‖ sub-sector faces an overall higher slowdown than
Manufacturing (10,7% and 11,3%, respectively). Manufacturing is particularly hit by smaller birth rates, in
regions such as Alentejo, Centro, Norte and Lisboa.
15
This disaggregation by NUT II is only provided after 1995 due to the start of SEC 95, and up to 2006 due to the problems of compatibility with CAE Rev. 3 after 2007. 16
During the period 1995-2000, we can observe the importance of off-shore activities, as the financial intermediation sector plays a very important part in enterprise creation. 17
Sectors C, D and E of CAE Rev. 2.1.
Birth rates by broad sectors, 1995-2006
11,9% 11,5%
12,6% 12,4% 12,1%
13,6%
16,2%
13,4%
9,1%8,4%
10,0%
8,6%
16,5%16,0%
16,6% 16,7%15,9%
19,7%
17,6%18,3%
14,7%13,8%
15,7%
13,6%
16,8%
19,7%
21,2% 21,4%
26,1%
28,8%
23,1%
12,9%
11,8%
13,6%
12,4%
16,2%
0%
5%
10%
15%
20%
25%
30%
35%
1995 1996 1997 1998 1999 2000 2001 2002 2003 2004 2005 2006
%Manufacturing Services Construction Total
GEE|GPEARI
BMEP N.º 03| 2010 – Em Análise 47
Table 9 – The three main sectors with the greatest birth rate by region and time period (%) 2000-2006 1995-2000
Source: Author’s calculations based on Quadros de Pessoal GEP, MTSS
Table 10 - The three main sectors with the lowest birth rate by region and time period (%)
2000-2006 1995-2000
Source: Author’s calculations based on Quadros de Pessoal GEP, MTSS
Births of small enterprises are concentrated in the service sector (OECD/Eurostat, 2009). In Portugal,
more small enterprises (with fewer than 20 employees) are born in the Services sector relatively to other
sectors, with the exception of Agriculture and Fishing, where firms are born predominantly in this size class
(Table 11).
Public administration and
defence; compulsory
social security
Fishing
Agriculture, farming of
animals, hunting and
forestry
Real estate, renting and
business activitiesFishing
Agriculture, farming of
animals, hunting and forestry
46,7 40,6 36,2 22,9 21,9 21,6
Public administration and
defence; compulsory
social security
Production of
electricity, of gas and
of water supply
Mining and quarrying ConstructionHotels and
restaurantsFinancial intermediation
57,7 48,6 44,3 22,6 21,4 21,3
Public administration and
defence; compulsory
social security
FishingReal estate, renting and
business activities
Transport, storage and
communication
Production of
electricity, of gas and
of water supply
Real estate, renting and
business activities
41,7 33,4 22,0 23,4 23,2 22,8
Public administration and
defence; compulsory
social security
Fishing
Agriculture, farming of
animals, hunting and
forestry
Real estate, renting and
business activitiesConstruction Fishing
30,2 22,1 20,8 20,4 19,1 18,3
Fishing
Public administration
and defence;
compulsory social
security
Production of electricity,
of gas and of water
supply
FishingTransport, storage
and communicationConstruction
51,3 35,6 24,4 29,2 25,9 25,5
Fishing
Public administration
and defence;
compulsory social
security
Construction Fishing ConstructionAgriculture, farming of
animals, hunting and forestry
37,7 34,7 28,4 29,3 22,5 21,9
Public administration and
defence; compulsory
social security
Real estate, renting
and business
activities
Construction
Public administration
and defence;
compulsory social
security
Financial
intermediationConstruction
18,5 17,0 16,0 27,3 25,6 25,8
Public administration and
defence; compulsory
social security
Fishing
Agriculture, farming of
animals, hunting and
forestry
Real estate, renting and
business activitiesConstruction
Transport, storage and
communication
41,3 35,7 21,1 21,4 21,0 19,3
Portugal Portugal
Açores Açores
Madeira Madeira
Lisboa Lisboa
Alentejo Alentejo
Algarve
Centro Centro
Norte Norte
Algarve
Mining and quarrying Manufacturing Health and social work Mining and quarrying ManufacturingProduction of electricity, of
gas and of water supply
8,9 9,6 12,5 12,3 13,2 13,8
Hotels and restaurantsHealth and social
work
Wholesale and retail
trade; repair of motor
vehicles, motorcycles
and personal and
household goods
Production of electricity,
of gas and of water
supply
Manufacturing Mining and quarrying
20,4 21,2 22,3 10,8 12,4 14,1
Mining and quarrying Manufacturing Health and social work Manufacturing Mining and quarrying
Wholesale and retail trade;
repair of motor vehicles,
motorcycles and personal and
household goods
9,3 9,1 12,4 11,5 15,1 15,6
ManufacturingFinancial
intermediationMining and quarrying Mining and quarrying
Public administration
and defence;
compulsory social
security
Manufacturing
9,6 10,1 10,7 7,6 10,0 10,8
Mining and quarrying Manufacturing Health and social work Mining and quarrying Education Manufacturing
7,5 9,0 9,3 11,3 12,2 11,3
Production of electricity, of
gas and of water supplyMining and quarrying Health and social work
Production of electricity,
of gas and of water
supply
Mining and quarrying Health and social work
4,5 8,4 9,5 0,0 6,7 9,5
Mining and quarrying Education Manufacturing Mining and quarrying ManufacturingProduction of electricity, of
gas and of water supply
5,7 9,6 9,9 8,4 11,9 14,3
Mining and quarrying Manufacturing Health and social work Manufacturing Mining and quarrying Education
10,7 11,3 12,7 12,4 12,5 13,7
Portugal Portugal
Açores Açores
Madeira Madeira
Lisboa Lisboa
Alentejo Alentejo
Algarve
Centro Centro
Norte Norte
Algarve

GEE|GPEARI
BMEP N.º 03| 2010 – Em Análise 48
The proportion of firms born below this threshold is higher than the total weight of these enterprises in the
population, revealing that newcomers have on average a smaller size than incumbents. This is also
verified for all sectors and time periods (Sarmento and Nunes, 2009).
From the first sub-period to the second, there are proportionately more enterprises being born with fewer
than 20 employees in all sectors, particularly in manufacturing, which reveals the greatest decrease on
average size. Throughout the period, entrants (and exiting firms) are smaller than the average size of firms
already in operation18
.
Table 11 – Average share of enterprises births with fewer than 20 employees
(new enterprises with fewer than 20 employees as a % of total by sector)
Source: Author’s calculations based on Quadros de Pessoal GEP, MTSS
5. Firm size distribution
Another stylized fact is that the creation of new firms, which are in general of a smaller size than
incumbents, make the firm distribution right skewed, with proportionally more smaller firms than large firms
with respect to the lognormal distribution. Cabral and Mata (2003) show for a given cohort of Portuguese
firms, that the distribution of log of size is very skewed at birth but then becomes more symmetric over
time19
. Following the same methodology, we also applied a nonparametric estimation method, a gaussian
kernel density smoother with a bandwidth of 0,5 to the logartithm of firm size for enterprise births to test if
firm size (expressed as the log of the employment of new firms) distribution is stable and approximately
lognormal for the population of active new enterprises. We have found a distribution with a distinct shape
from the Normal distribution, confirming Cabral and Mata´s (2003) conclusions20
. Our results also show
that firm size distribution is skewed to the right and is not stable over time (Figure 6). We also find that firm
size distribution of employer enterprise births is shifting over time to smaller sized firms, in line with the
total economy and enterprise deaths (Sarmento and Nunes, 2009).
18
The small size of new entrants is a relevant factor when attempting to explain their lower survival changes that is, the high mortality rate that affects many small sized businesses in their first years of operation (Nunes e Sarmento, 2010). 19
Similar results have been found for other countries where the pattern of right-skeweness 20
It is important to keep in mind that the type of firm distribution obtained depends heavily on the type of data source considered (Cabral, 2007).
Agriculture
and fishingManufacturing Services Construction
Total (Births)
(sectors A-Q)
Total
(enterprises)
(sectors A-Q)
1995-2007 99,1% 94,3% 98,5% 97,8% 97,9% 92,4%
1995-1999 98,8% 93,8% 98,5% 97,8% 97,7% 91,5%
2000-2007 99,2% 94,6% 98,5% 97,9% 98,0% 92,8%
< 20 employees

GEE|GPEARI
BMEP N.º 03| 2010 – Em Análise 49
Figure 6 - Firm size distribution of 1985, 1995 and 2005 cohorts of entrants
Source: Author’s calculations based on Quadros de Pessoal GEP, MTSS
5. Conclusions
Employer enterprise births have increased at an annual average growth rate of 4,3%, from 1987 to 2007,
with periods of stronger growth, such as from 1996 to 2000 (14,9%) and deceleration, from 2000 to 2007
(-2,3%). There are four instances worth noting, the ―peak‖ of enterprise births in 1989, 1994, 2000/2001
and 2005. After 2000, birth rates have been slowing down throughout all regions, sectors and size classes.
Despite this fact, Portugal has one of the highest records of new firm creation relatively to the stock of
existing enterprises, even when other universes and methodologies are considered. According to Eurostat,
in 2005 and 2006, Portugal had the second and the third highest birth rate in Europe, respectively.
There is a clear trend in the creation of smaller enterprises, in particular in the 1-4 size class in most
regions and in all economic sectors, which is in line with a tendency also observable in other countries in
Europe. Moreover, according to Eurostat (2009), Portugal presents the highest share of enterprises births
in the 1-4 employees’ size class (average 2005 and 2006). We also observe a decline in the average size
of enterprise births over time, from 5,41 in 1987 to 3,37 employees in 2007, on average.
Norte is the region with the highest number of births and share of enterprises in the country, while Algarve
is the region with the highest birth rate in Portugal, where firms are created with the smallest average size.
Portugal is increasingly a service-based economy, where Services occupy the pole position in enterprise
creation since 2003. According to the OECD/Eurostat (2009), in 2006, Portugal had the highest birth rate
in the service sector, above 20 other countries. The Construction sector had the highest birth rates from
1996 to 2001 and the highest contributions to enterprise birth growth, but suffered a sharp decline after
2001, together with the Manufacturing sector.
Firm size distribution of employer enterprise births is skewed to the right, with proportionally more smaller
than larger firms and has been shifting over time towards smaller sized firms.
We acknowledge that birth rates cannot be considered in isolation from death rates and the overall
turnover analysis, needed to acquire a global picture on firm demographics and productivity growth in
Portugal. These other dynamics will be approached in further studies.
0.1
.2.3
.4.5
.6.7
.8.9
1
De
nsity
0 1 2 3 4 5 6Firm Size (Log10)
1987
Normal (1987)
1997
2007
kernel = gaussian, bandwidth = 0.5000
Births Firm Size Distribution in 1987, 1997 and 2007

GEE|GPEARI
BMEP N.º 03| 2010 – Em Análise 50
BIBLIOGRAPHY
Ahn, S. (2001), ―Firm dynamics and Productivity Growth: a review of micro evidence from OECD
countries‖, OECD Economics Department Working Paper n. 297, Paris.
Bartelsman, E.J., S. Scarpetta, and F. Schivardi, (2005), "Comparative Analysis of Firm Demographics
and Survival: Evidence from Micro-level Sources in OECD Countries", Industrial and Corporate
Change, 14(3): 365–391.
Bartelsman, E.J., J. Haltiwanger, and S. Scarpetta, (2004), "Microeconomic Evidence of Creative
Destruction in Industrial and Developing Countries", The World Bank Policy Research Working
Paper Series 3464.
Cabral, L. (2007), ―Small firms in Portugal: A selective Survey of Stylized Facts, Economic Analysis and
Policy Implementation‖. Portuguese Economic Journal, 6(1): 65-88.
Cabral, L. and J. Mata (2003), ―On the evolution of the firm size distribution: facts and theory‖, The
American Economic Review, 93(4): 1075 - 1090.
Caves, R.E. (1998), "Industrial Organization and New Findings on the Turnover and Mobility of Firms",
Journal of Economic Literature 36: 1947-1982.
Colantone, Italo and L. Sleuwaegen (2008), "Entry and exit of firms in a global economy: a cross-country
and industry analysis," Vlerick Leuven Gent Management School Working Paper Series 2007-36,
Vlerick Leuven Gent Management School.
Consejo Superior de Cámaras de Comercio, Industria y Navegación de España, (2003) ―Creación y
consolidación de empresas. Políticas de apoyo‖, Servicio de Estudios.
Eurostat (2009), "Business Demography: employment and survival", Statistics in focus, 70/2009.
Eurostat/OECD (2007), "Eurostat/OECD Manual on Business Demography Statistics".
Gabinete de Estratégia e Estudos (2010), "Estatísticas de Bolso da Dinâmica Empresarial", GEE,
Ministério da Economia, da Inovação e do Desenvolvimento.
Geroski, P. (1995), "What do we know about entry?", International Journal of Industrial Organization, Vol.
13, p. 421-440.
Instituto Nacional de Estatística (2009), "Demografia de Empresas 2004-2007, O Empreendedorismo em
Portugal - Indicadores sobre a Demografia das Empresas", Destaque.
Klapper, Leora, A. Lewin and J. M.Q. Delgado (2009) ―The impact of business environment on the
business creation process‖, The World Bank Policy Research Working Paper Series 4937.
Klapper, L., R. Amit and M. Guillén (2008), "Entrepreneurship and firm formation across countries" The
World Bank Policy Research Working Paper Series 4313
López-Garcia, P. and Puente, S. (2006) "Business demography in Spain: determinants of firm survival",
Documentos de Trabajo n. 608, Banco de España.
Masso, J., R. Eamets and K. Philips (2004), ―Creative Destruction and Transition: The Effects of Firm Entry
and Exit on Productivity Growth in Estonia‖, Discussion Paper Series, Institute for the Study of
Labor (IZA).
Nunes, A. and E. Morais Sarmento (2010), ―Business Demography Dynamics in Portugal: a semi-
parametric Survival Analysis‖, 2010 Hawaii Global Conference on Business and Finance,
Conference proceedings.

GEE|GPEARI
BMEP N.º 03| 2010 – Em Análise 51
Nunes, A. and E. Morais Sarmento (2009), ―A non parametric survival analysis of business demography
dynamics in Portugal‖, Boletim Mensal de Economia Portuguesa, Ministério da Economia, da
Inovação e do Desenvolvimento e Ministério das Finanças e da Administração Pública,
Dezembro de 2009.
OECD (2000), "OECD Small and medium enterprise outlook", Paris.
OECD/Eurostat (2009), "Measuring Entrepreneurship A Collection of Indicators, 2009 Edition",
OECD/Eurostat Entrepreneurship Indicators Programme.
Sarmento, E. Morais e A. Nunes (2009), ―Entrepreneurship Performance Indicators‖, Workshop do NIPE:
Economic Analysis using Linked Employer and Employee Data, Universidade do Minho.
Scarpetta, S., P. Hemmings, T. Tressel and J. Woo (2002), ―The role of policy and institutions for
productivity and firm dynamics‖, OECD Economics Department Working Papers, n. 329.
Segarra, A. and M. Callejón (2002), ―New firm’s survival and market turbulence: new evidence from
Spain‖, Review of Industrial Organization 20: 1-14.
Siegfried J. and Evans L. (1994) ―Empirical studies of entry and exit: a survey of the evidence‖, Review of
Industrial Organization, 9, 121–156.
Storey, D. ed. (1994), ―Understanding the small business sector‖, Thomson Learning.

GEE|GPEARI
BMEP N.º 03| 2010 – Em Análise 52
ANNEX I - Shift-share analysis
Table 1 - Contributions to the rate of growth of employer enterprise births by firm size, 1995-2007
Source: Author’s calculations based on Quadros de Pessoal GEP, MTSS
Size Class 1995 1996 1997 1998 1999 2000 2001 p.p. % p.p. % p.p. % p.p. % p.p. % p.p. %
TOTAL 100,0 100,0 100,0 100,0 100,0 100,0 100,0 0,4 0,4 100,0 16,2 16,2 100,0 7,4 7,4 100,0 3,5 3,5 100,0 34,6 34,6 100,0 3,6 3,6 100,0
1-4 80,8 80,6 80,9 81,8 81,7 83,7 77,7 0,1 0,1 15,3 16,7 13,4 82,8 8,6 6,9 93,3 3,4 2,8 78,9 38,0 31,0 89,5 -3,8 -3,2 -88,7
5-9 12,7 12,9 12,7 12,2 12,2 11,0 14,9 2,3 0,3 78,4 14,2 1,8 11,3 3,2 0,4 5,5 3,3 0,4 11,4 21,4 2,6 7,5 40,7 4,5 124,4
10 - 19 4,1 4,2 4,0 3,8 4,0 3,4 5,2 1,8 0,1 19,8 12,0 0,5 3,1 2,9 0,1 1,6 6,7 0,3 7,4 16,6 0,7 1,9 56,1 1,9 53,6
20-49 1,8 1,7 1,8 1,6 1,6 1,4 1,7 -3,7 -0,1 -18,0 22,7 0,4 2,4 -4,3 -0,1 -1,0 4,0 0,1 1,8 15,4 0,2 0,7 28,9 0,4 11,2
50 - 249 0,53 0,54 0,51 0,49 0,50 0,45 0,41 2,5 0,0 3,6 10,5 0,1 0,3 2,8 0,0 0,2 6,0 0,0 0,8 21,0 0,1 0,3 -5,1 0,0 -0,6
+ 250 0,04 0,04 0,04 0,07 0,06 0,04 0,05 9,1 0,0 0,9 8,3 0,0 0,0 100,0 0,0 0,5 -15,4 0,0 -0,3 0,0 0,0 0,0 22,7 0,0 0,3
Size Class 2001 2002 2003 2004 2005 2006 2007 p.p. % p.p. % p.p. % p.p. % p.p. % p.p. %
TOTAL 100,0 100,0 100,0 100,0 100,0 100,0 100,0 0,9 0,9 100,0 -24,2 -24,2 100,0 -3,9 -3,9 100,0 37,6 37,6 100,0 -19,8 -19,8 100,0 1,4 1,4 100,0
1-4 77,7 81,9 83,9 85,1 84,4 85,9 86,9 6,3 4,9 563,8 -22,4 -18,3 75,8 -2,4 -2,0 52,6 36,4 31,0 82,3 -18,4 -15,5 78,1 2,6 2,2 152,8
5-9 14,9 12,6 10,6 9,8 9,5 9,1 8,5 -14,9 -2,2 -254,8 -36,0 -4,5 18,7 -11,4 -1,2 31,3 33,2 3,3 8,7 -23,2 -2,2 11,1 -5,1 -0,5 -32,2
10 - 19 5,2 3,8 3,5 3,0 3,6 3,1 2,9 -26,3 -1,4 -156,2 -29,7 -1,1 4,6 -17,0 -0,6 15,4 61,8 1,9 5,0 -29,4 -1,0 5,3 -7,4 -0,2 -16,2
20-49 1,7 1,3 1,4 1,4 1,9 1,4 1,4 -23,7 -0,4 -46,9 -18,5 -0,2 1,0 -3,4 0,0 1,2 84,5 1,2 3,2 -39,7 -0,8 3,8 -1,4 0,0 -1,4
50 - 249 0,41 0,35 0,53 0,56 0,64 0,41 0,34 -13,8 -0,1 -6,6 13,0 0,0 -0,2 1,8 0,0 -0,2 57,2 0,3 0,8 -47,9 -0,3 1,5 -15,9 -0,1 -4,6
+ 250 0,05 0,05 0,06 0,08 0,06 0,03 0,05 11,1 0,0 0,6 -13,3 0,0 0,0 15,4 0,0 -0,2 13,3 0,0 0,0 -64,7 0,0 0,2 83,3 0,0 1,6
2001
growth
y.o.y (%)
contributions to
growth
contributions to
growthgrowth
y.o.y (%)
contributions to
growthgrowth
y.o.y (%)
contributions to
growthgrowth
y.o.y (%)
1998
contributions to
growth
2006 2007
growth
y.o.y (%)
2000
growth
y.o.y (%)
contributions to
growth
1996
growth
y.o.y (%)
contributions to
growth
1997
2004
1999
growth
y.o.y (%)
2005
contributions to
growthgrowth
y.o.y (%)
growth
y.o.y (%)
contributions to
growth
contributions to
growth
Structure
Share (%)
Structure
Share (%) contributions to
growthgrowth
y.o.y (%)
growth
y.o.y (%)
contributions to
growth
20032002

GEE|GPEARI
BMEP N.º 03| 2010 – Em Análise 53
Table 2 - Contributions to the rate of growth of employer enterprise births by sectors, 1995-2007
Source: Author’s calculations based on Quadros de Pessoal GEP, MTSS
Region 1995 1996 1997 1998 1999 2000 2001 p.p. % p.p. % p.p. % p.p. % p.p. % p.p. %
PORTUGAL 100,0 100,0 100,0 100,0 100,0 100,0 100,0 0,4 0,4 100,0 16,2 16,2 100,0 7,4 7,4 100,0 3,5 3,5 100,0 34,6 34,6 100,0 3,6 3,6 100,0
A 4,3 4,5 5,1 4,0 3,7 3,3 3,4 4,1 0,2 47,7 33,2 1,5 9,2 -16,3 -0,8 -11,3 -4,9 -0,2 -5,5 22,4 0,8 2,4 6,0 0,2 5,6
B 0,2 0,1 0,1 0,1 0,2 0,1 0,1 -24,4 0,0 -9,9 14,7 0,0 0,1 -17,9 0,0 -0,3 96,9 0,1 2,4 0,0 0,0 0,0 -20,6 0,0 -0,7
C 0,4 0,3 0,3 0,3 0,3 0,2 0,3 -20,0 -0,1 -18,9 45,2 0,1 0,8 1,6 0,0 0,1 -21,0 -0,1 -2,0 26,5 0,1 0,2 31,5 0,1 2,1
D 15,1 14,3 14,6 14,0 13,8 11,9 13,9 -4,7 -0,7 -190,1 18,2 2,6 16,1 2,8 0,4 5,6 2,2 0,3 8,9 15,8 2,2 6,3 21,1 2,5 69,6
E 0,1 0,0 0,0 0,0 0,0 0,1 0,1 -50,0 0,0 -7,2 112,5 0,0 0,2 -76,5 0,0 -0,5 100,0 0,0 0,3 300,0 0,1 0,2 -12,5 0,0 -0,2
F 11,1 11,9 13,7 15,7 17,4 19,0 22,8 7,2 0,8 217,1 33,7 4,0 24,7 23,4 3,2 42,9 14,8 2,3 66,0 46,8 8,1 23,5 24,5 4,7 129,5
G 34,1 33,2 30,7 30,3 28,8 28,0 25,1 -2,3 -0,8 -207,2 7,6 2,5 15,6 5,8 1,8 24,1 -1,7 -0,5 -14,9 31,2 9,0 25,9 -7,3 -2,0 -56,6
H 14,3 14,9 13,8 13,1 12,8 12,1 10,9 4,7 0,7 181,1 7,4 1,1 6,8 2,2 0,3 4,1 1,3 0,2 4,8 27,2 3,5 10,1 -6,7 -0,8 -22,5
I 2,9 3,2 3,0 3,5 3,6 4,9 5,1 8,5 0,3 67,6 11,3 0,4 2,2 22,1 0,7 9,0 6,8 0,2 6,7 83,7 3,0 8,6 8,6 0,4 11,6
J 0,5 0,4 0,6 0,6 0,5 0,5 0,5 -8,8 0,0 -11,7 58,2 0,3 1,6 -0,5 0,0 0,0 -0,9 0,0 -0,2 37,3 0,2 0,6 -4,9 0,0 -0,7
K 8,9 8,8 9,1 9,8 10,1 11,6 10,4 -1,0 -0,1 -23,4 20,1 1,8 10,9 15,3 1,4 18,7 7,3 0,7 20,4 54,5 5,5 15,9 -7,4 -0,9 -23,9
L 0,1 0,1 0,1 0,1 0,1 0,1 0,1 56,3 0,0 8,1 56,0 0,0 0,3 -2,6 0,0 0,0 -10,5 0,0 -0,3 5,9 0,0 0,0 13,9 0,0 0,3
M 0,7 0,8 0,9 0,8 1,0 1,0 0,8 12,6 0,1 25,2 29,6 0,2 1,5 -11,4 -0,1 -1,4 30,3 0,2 6,6 36,1 0,3 1,0 -12,6 -0,1 -3,4
N 2,9 3,1 3,3 3,2 3,2 2,9 2,6 8,3 0,2 64,9 21,5 0,7 4,1 4,5 0,1 2,0 5,6 0,2 5,1 22,2 0,7 2,1 -7,7 -0,2 -6,3
O 4,5 4,3 4,5 4,7 4,6 4,3 4,0 -3,5 -0,2 -42,3 22,3 1,0 5,9 11,5 0,5 7,0 1,4 0,1 1,8 24,1 1,1 3,2 -3,6 -0,2 -4,2
Region 2000 2001 2002 2003 2004 2005 2006 p.p. % p.p. % p.p. % p.p. % p.p. % p.p. %
PORTUGAL 100,0 100,0 100,0 100,0 100,0 100,0 100,0 3,6 3,6 100,0 0,9 0,9 100,0 -24,2 -24,2 100,0 -3,9 -3,9 100,0 37,6 37,6 100,0 -19,8 -19,8 100,0
A 3,3 3,4 3,6 3,5 3,9 13,8 5,1 6,0 0,2 5,6 5,1 0,2 20,1 -25,2 -0,9 3,7 7,5 0,3 -6,8 383,3 15,1 40,0 -70,5 -9,7 49,0
B 0,1 0,1 0,2 0,4 0,3 1,1 0,7 -20,6 0,0 -0,7 84,0 0,1 8,9 83,7 0,1 -0,6 -18,3 -0,1 1,9 344,9 1,2 3,2 -48,7 -0,5 2,7
C 0,2 0,3 0,2 0,2 0,2 0,2 0,2 31,5 0,1 2,1 -19,0 -0,1 -6,6 -39,4 -0,1 0,4 -2,5 0,0 0,1 12,8 0,0 0,1 -18,2 0,0 0,1
D 11,9 13,9 11,4 10,2 9,6 8,5 9,0 21,1 2,5 69,6 -17,4 -2,4 -275,9 -32,0 -3,6 15,0 -9,6 -1,0 25,2 22,1 2,1 5,6 -15,0 -1,3 6,4
E 0,1 0,1 0,0 0,0 0,1 0,1 0,1 -12,5 0,0 -0,2 -42,9 0,0 -2,5 -6,3 0,0 0,0 53,3 0,0 -0,5 73,9 0,0 0,1 -37,5 0,0 0,1
F 19,0 22,8 19,4 14,2 13,5 11,9 13,3 24,5 4,7 129,5 -14,0 -3,2 -367,0 -44,5 -8,7 35,8 -9,0 -1,3 33,1 21,3 2,9 7,6 -10,0 -1,2 6,0
G 28,0 25,1 26,9 29,7 29,2 23,5 26,7 -7,3 -2,0 -56,6 8,3 2,1 238,5 -16,4 -4,4 18,2 -5,6 -1,7 42,9 10,8 3,1 8,3 -9,0 -2,1 10,6
H 12,1 10,9 11,2 13,2 13,6 11,3 13,2 -6,7 -0,8 -22,5 3,5 0,4 44,2 -10,4 -1,2 4,8 -1,5 -0,2 5,2 14,5 2,0 5,2 -6,0 -0,7 3,4
I 4,9 5,1 5,6 4,9 4,8 3,3 4,0 8,6 0,4 11,6 11,2 0,6 65,8 -34,2 -1,9 8,0 -4,8 -0,2 6,0 -6,3 -0,3 -0,8 -2,3 -0,1 0,4
J 0,5 0,5 0,5 0,7 0,6 0,6 0,6 -4,9 0,0 -0,7 9,2 0,0 5,3 -7,4 0,0 0,2 -12,3 -0,1 2,1 30,6 0,2 0,5 -19,0 -0,1 0,6
K 11,6 10,4 12,0 12,8 13,6 11,9 15,2 -7,4 -0,9 -23,9 16,6 1,7 197,0 -19,3 -2,3 9,6 2,4 0,3 -7,9 20,6 2,8 7,5 2,0 0,2 -1,2
L 0,1 0,1 0,3 0,2 0,4 2,4 0,7 13,9 0,0 0,3 339,0 0,3 29,4 -45,6 -0,1 0,6 54,1 0,1 -3,3 754,3 2,9 7,6 -76,4 -1,8 9,0
M 1,0 0,8 0,9 0,9 1,0 2,4 1,5 -12,6 -0,1 -3,4 13,9 0,1 13,1 -25,8 -0,2 1,0 10,9 0,1 -2,6 213,4 2,2 5,9 -49,1 -1,2 5,9
N 2,9 2,6 2,8 3,3 3,3 3,1 3,1 -7,7 -0,2 -6,3 8,5 0,2 25,4 -10,7 -0,3 1,2 -4,9 -0,2 4,2 31,2 1,0 2,7 -19,2 -0,6 3,0
O 4,3 4,0 4,8 5,7 5,9 6,1 6,6 -3,6 -0,2 -4,2 23,0 0,9 104,4 -10,4 -0,5 2,1 -0,2 0,0 0,3 41,0 2,4 6,5 -12,2 -0,7 3,7
contributions to
growthgrowth
y.o.y (%)
contributions to
growthgrowth
y.o.y (%)
contributions to
growth
2004 2005 2006
growth
y.o.y (%)
contributions to
growthgrowth
y.o.y (%)
contributions to
growthgrowth
y.o.y (%)
contributions to
growthgrowth
y.o.y (%)
Share (%)
2001 2002 2003
growth
y.o.y (%)
contributions to
growth
Structure
growth
y.o.y (%)
contributions to
growthgrowth
y.o.y (%)
contributions to
growthgrowth
y.o.y (%)
contributions to
growthgrowth
y.o.y (%)
contributions to
growth
Share (%)
1996 1997 1998 1999 2000 2001
growth
y.o.y (%)
contributions to
growth
Structure

GEE|GPEARI
BMEP N.º 03| 2010 – Em Análise 54
Table 3 - Contributions to the rate of growth of employer enterprise births by NUT II region, 1989-2007
Source: Author’s calculations based on Quadros de Pessoal GEP, MT.
Size Class 1989 1990 1991 1992 1993 1994 p.p. % p.p. % p.p. % p.p. % p.p. % p.p. %
TOTAL 100,0 100,0 100,0 100,0 100,0 100,0 100,0 -14,5 -14,5 100,0 9,3 9,3 100,0 4,1 4,1 100,0 0,2 0,2 100,0 56,6 56,6 100,0 -28,6 -28,6 100,0
Norte 35,0 36,1 34,0 32,2 34,7 35,4 35,6 -11,7 -4,1 28,2 2,7 1,0 10,6 -1,3 -0,5 -11,2 7,8 2,5 1375,5 60,1 20,8 36,8 -28,2 -10,0 35,0
Algarve 6,1 5,5 5,7 5,4 5,4 5,9 5,3 -23,1 -1,4 9,8 13,5 0,7 8,0 -2,4 -0,1 -3,4 -0,2 0,0 -6,1 72,0 3,9 6,8 -35,4 -2,1 7,3
Centro 20,0 19,0 20,9 21,6 21,1 20,7 21,2 -18,9 -3,8 26,1 20,3 3,8 41,5 7,7 1,6 39,4 -2,3 -0,5 -267,3 53,8 11,3 20,0 -26,9 -5,6 19,4
Lisboa 26,6 26,9 27,0 28,7 27,2 26,9 25,9 -13,4 -3,6 24,5 9,6 2,6 28,0 10,5 2,8 69,9 -5,1 -1,5 -804,1 54,9 14,9 26,4 -31,3 -8,4 29,4
Alentejo 8,9 8,6 8,5 8,0 7,8 7,1 7,7 -17,0 -1,5 10,4 7,0 0,6 6,6 -1,1 -0,1 -2,4 -2,7 -0,2 -118,4 42,5 3,3 5,9 -23,0 -1,6 5,7
Açores 1,9 2,1 2,2 2,2 1,9 1,9 2,0 -8,3 -0,2 1,1 14,9 0,3 3,3 4,0 0,1 2,1 -13,7 -0,3 -161,2 57,1 1,1 1,9 -21,8 -0,4 1,4
Madeira 1,5 1,7 1,8 1,9 2,1 2,1 2,2 1,5 0,0 -0,2 10,7 0,2 2,0 12,8 0,2 5,6 7,8 0,1 81,6 59,6 1,2 2,2 -24,5 -0,5 1,8
Estrangeiro 0,0 0,0 0,0 0,0 0,0 0,0 0,0 -100,0 0,0 0,0#DIV/
0!
#DIV/0
!
#DIV/0
!
#DIV/0
!
#DIV/0
!
#DIV/0
!
#DIV/0
!
#DIV/0
!
#DIV/0
!
#DIV/0
!
#DIV/0
!
#DIV/0
!0,0 0,0 0,0
Size Class 1995 1996 1997 1998 1999 2000 2001 p.p. % p.p. % p.p. % p.p. % p.p. % p.p. %
TOTAL 100,0 100,0 100,0 100,0 100,0 100,0 100,0 0,4 0,4 100,0 16,2 16,2 100,0 7,4 7,4 100,0 3,5 3,5 100,0 34,6 34,6 100,0 3,6 3,6 100,0
Norte 35,6 34,0 35,4 36,1 36,7 34,5 37,1 -4,3 -1,5 -409,9 21,1 7,2 44,2 9,5 3,4 45,2 5,3 1,9 54,9 26,4 9,7 28,0 11,5 4,0 110,1
Algarve 5,3 5,6 5,5 5,1 5,3 5,6 6,4 4,9 0,3 71,2 15,2 0,8 5,2 -0,5 0,0 -0,4 6,6 0,3 9,6 43,5 2,3 6,6 17,3 1,0 27,0
Centro 21,2 22,3 20,8 21,6 22,2 24,0 21,4 5,6 1,2 323,4 8,3 1,8 11,4 11,7 2,4 32,6 6,4 1,4 39,7 45,2 10,0 29,0 -7,4 -1,8 -49,3
Lisboa 25,9 25,9 24,9 25,6 24,5 25,1 24,4 0,4 0,1 29,7 11,8 3,0 18,8 10,4 2,6 34,7 -0,8 -0,2 -5,9 37,6 9,2 26,6 0,7 0,2 5,2
Alentejo 7,7 7,9 9,9 8,0 7,4 7,7 7,2 2,8 0,2 58,6 46,2 3,6 22,4 -12,9 -1,3 -17,1 -4,5 -0,4 -10,3 40,0 3,0 8,5 -2,9 -0,2 -6,1
Açores 2,0 2,2 1,6 1,5 1,7 1,4 1,6 10,1 0,2 55,9 -15,7 -0,4 -2,2 -1,2 0,0 -0,3 18,5 0,3 7,9 11,1 0,2 0,5 14,7 0,2 5,8
Madeira 2,2 2,1 1,8 2,1 2,1 1,8 2,0 -4,8 -0,1 -28,8 1,3 0,0 0,2 21,7 0,4 5,3 7,2 0,1 4,2 10,5 0,2 0,7 14,9 0,3 7,3
Estrangeiro 0,0 0,0 0,0 0,0 0,0 0,0 0,0 0,0 0,0 0,0 0,0 0,0 0,0 0,0 0,0 0,0 -100,0 0,0 -0,1#DIV/0
!
#DIV/0
!
#DIV/0
!
#DIV/0
!
#DIV/0
!
#DIV/0
!
Size Class 2001 2002 2003 2004 2005 2006 2007 p.p. % p.p. % p.p. % p.p. % p.p. % p.p. %
TOTAL 100,0 100,0 100,0 100,0 100,0 100,0 100,0 0,9 0,9 100,0 -24,2 -24,2 100,0 -3,9 -3,9 100,0 37,6 37,6 100,0 -19,8 -19,8 100,0 1,4 1,4 100,0
Norte 37,1 35,0 36,1 36,2 44,4 36,0 36,3 -4,8 -1,8 -205,5 -21,8 -7,6 31,6 -3,7 -1,3 34,5 68,8 24,9 66,1 -34,9 -15,5 78,0 2,2 0,8 55,3
Algarve 6,4 6,2 5,9 6,2 5,8 6,6 7,1 -1,8 -0,1 -13,1 -27,3 -1,7 7,0 0,6 0,0 -0,9 29,4 1,8 4,9 -9,1 -0,5 2,7 8,6 0,6 39,5
Centro 21,4 22,9 20,8 20,7 20,3 19,9 19,2 7,7 1,7 189,6 -31,0 -7,1 29,3 -4,5 -0,9 24,4 34,9 7,2 19,2 -21,3 -4,3 21,8 -2,1 -0,4 -29,2
Lisboa 24,4 25,1 25,3 25,8 20,0 26,7 27,2 4,0 1,0 111,2 -23,7 -6,0 24,6 -2,0 -0,5 12,9 6,9 1,8 4,7 7,2 1,4 -7,2 3,3 0,9 60,9
Alentejo 7,2 7,2 7,6 6,9 6,6 6,8 6,7 0,3 0,0 2,5 -19,8 -1,4 5,9 -13,1 -1,0 25,7 31,9 2,2 5,8 -17,2 -1,1 5,7 0,1 0,0 0,3
Açores 1,6 1,7 1,8 1,9 1,3 1,7 1,5 8,6 0,1 15,4 -19,7 -0,3 1,4 1,6 0,0 -0,7 -5,3 -0,1 -0,3 4,9 0,1 -0,3 -7,9 -0,1 -9,4
Madeira 2,0 1,9 2,5 2,4 1,6 2,2 1,9 0,0 0,0 0,0 -3,3 -0,1 0,3 -6,5 -0,2 4,2 -6,6 -0,2 -0,4 7,4 0,1 -0,6 -11,0 -0,2 -16,8
Estrangeiro 0,0 0,0 0,0 0,0 0,0 0,0 0,0 -100,0 0,0 -0,2#DIV/
0!
#DIV/0
!
#DIV/0
!
#DIV/0
!
#DIV/0
!
#DIV/0
!
#DIV/0
!
#DIV/0
!
#DIV/0
!
#DIV/0
!
#DIV/0
!
#DIV/0
!-50,0 0,0 -0,6
contributions to
growth
contributions to
growthgrowth
y.o.y (%)
contributions to
growthgrowth
y.o.y (%)
2005 2006 2007
growth
y.o.y (%)
contributions to
growthgrowth
y.o.y (%)
contributions to
growthgrowth
y.o.y (%)
contributions to
growthgrowth
y.o.y (%)
Share (%)
2002 2003 2004
contributions to
growth
Structure
contributions to
growthgrowth
y.o.y (%)
contributions to
growthgrowth
y.o.y (%)
contributions to
growthgrowth
y.o.y (%)
contributions to
growthgrowth
y.o.y (%)
1998 1999 2000 2001
Structure
Share (%)
1996 1997
growth
y.o.y (%)
contributions to
growthgrowth
y.o.y (%)
growth
y.o.y (%)
contributions to
growth
1995
growth
y.o.y (%)
contributions to
growthgrowth
y.o.y (%)
contributions to
growthgrowth
y.o.y (%)
contributions to
growthgrowth
y.o.y (%)
contributions to
growth
Share (%)
1990 1991 1992 1993 1994 1995
growth
y.o.y (%)
contributions to
growth
Structure