Embed Size (px)
Citation preview

Employee Satisfaction Survey TTUHSC Institutional Report Fall 2014
Table of Contents Summary ................................................................................................................................................................. 2
Methodology ........................................................................................................................................................... 2
Demographics ......................................................................................................................................................... 2
Quantitative Data .................................................................................................................................................... 9
Faculty and Staff ................................................................................................................................................. 9
Staff Only ........................................................................................................................................................... 16
Faculty Only ....................................................................................................................................................... 18
Results by Appointment/Affiliation ................................................................................................................... 23
Results by Campus ............................................................................................................................................. 23
Qualitative Data .................................................................................................................................................... 24
Using Survey Data to Promote Continuous Improvement ................................................................................... 24
Appendices ............................................................................................................................................................ 25
Updated 2/3/15
1

Summary • Overall, faculty and staff seem to be satisfied with their experiences at TTUHSC. Most feel that
their work contributes to the institutional mission. • In general, feeling that their work is valued and appreciated is important to both faculty and staff. • Overall, faculty members expressed the highest satisfaction levels with library resources and their
sense of personal safety/security in the work environment. No clear areas of improvement emerged for faculty as a whole.
• As in previous years, many staff members are satisfied with their interactions with immediate coworkers, understanding of job responsibilities, and awareness of performance expectations for their positions.
• Potential areas of improvement for staff include compensation, the ability to report complaints without fear of retaliation, and awareness of staff needs by institutional leaders.
• In reviewing survey results by school, faculty members in the Paul L. Foster School of Medicine expressed lower levels of satisfaction compared to faculty in other schools.
• A clear area of improvement for faculty in the Gayle Greve Hunt School of Nursing is clarity of the tenure process.
• Overall, faculty in the TTUHSC School of Nursing expressed the highest levels of satisfaction compared to faculty in other schools.
• Faculty at the Midland campus also seem to be very satisfied with their experiences at TTUHSC. • Staff members who are affiliated with CMHC expressed lower levels of satisfaction in some areas
compared to other TTUHSC staff. • Staff members who work in Institutional Advancement expressed the highest levels of satisfaction
compared to other TTUHSC staff.
Methodology The biennial Employee Satisfaction Survey (ESS) was administered to TTUHSC faculty and staff in Fall 2014. The data collection period lasted two weeks for the online survey (October 14-27, 2014) and slightly longer for the paper version to account for mailing times (October 14-30, 2014). Targeted participants included employees with a faculty or staff designation, including working retirees and excluding residents, teaching assistants, and student employees. Survey invitations were sent to 1,165 faculty and 3,934 staff (N= 5,099). The initial invitation to complete the online survey was sent via email by the Office of Institutional Planning & Assessment (OIPA). A subsequent reminder email was sent to targeted participants one week before data collection ended. Additional reminders were distributed on the TTUHSC website. (Because many CMHC employees were unable to access the online survey from the workplace due to permission restrictions, they were also given the option to request a printed version of the survey and submit it via mail.)
Demographics When data collection ended, 264 faculty and 1,220 staff had completed the survey, resulting in approximate response rates of 23% and 31%, respectively. This is higher for staff compared to response rates in Fall 2012 (Faculty= 26% and Staff= 25%).
2
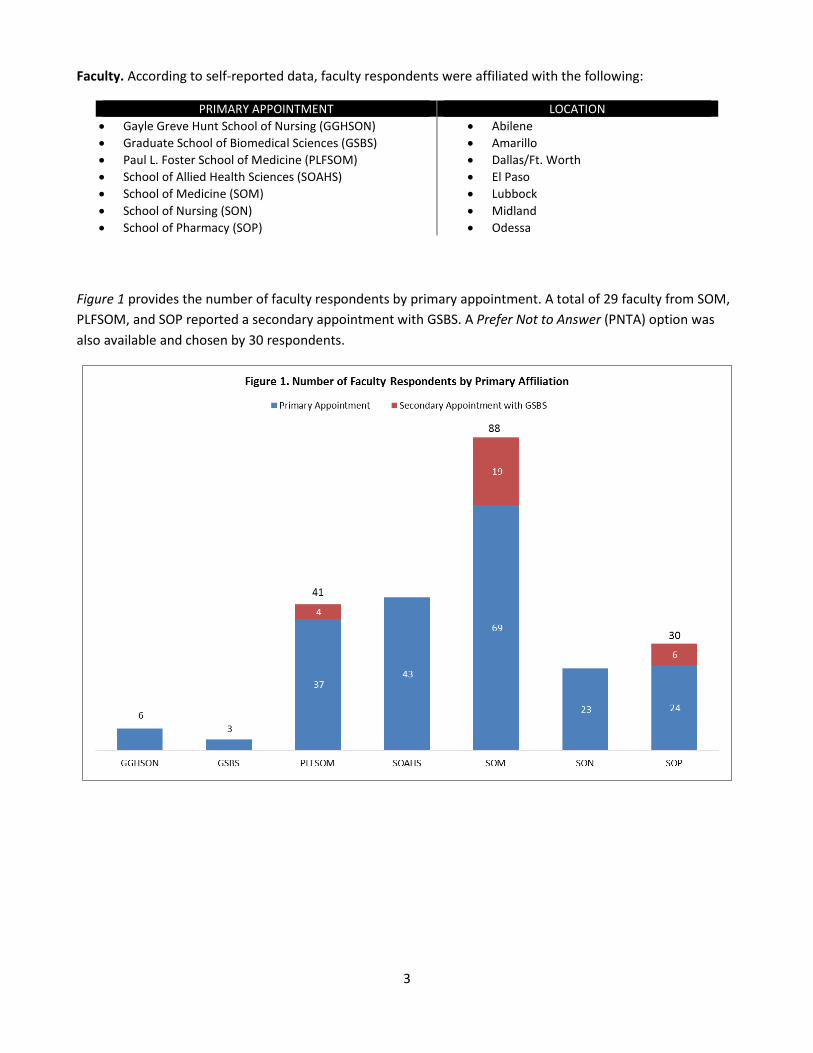
Faculty. According to self-reported data, faculty respondents were affiliated with the following:
PRIMARY APPOINTMENT LOCATION • Gayle Greve Hunt School of Nursing (GGHSON) • Graduate School of Biomedical Sciences (GSBS) • Paul L. Foster School of Medicine (PLFSOM) • School of Allied Health Sciences (SOAHS) • School of Medicine (SOM) • School of Nursing (SON) • School of Pharmacy (SOP)
• Abilene • Amarillo • Dallas/Ft. Worth • El Paso • Lubbock • Midland • Odessa
Figure 1 provides the number of faculty respondents by primary appointment. A total of 29 faculty from SOM, PLFSOM, and SOP reported a secondary appointment with GSBS. A Prefer Not to Answer (PNTA) option was also available and chosen by 30 respondents.
3

Faculty also provided information related to their positions. Three of five respondents classified themselves as non-tenure track faculty (see Figure 2). Additionally, faculty were asked if they work for the Texas Tech Physicians. More than one-third of the faculty respondents (=96) indicated that they do so.
Non-tenure track 60%
Prefer not to answer
12%
Tenured 20%
Tenure-track 8%
Figure 2. Faculty Position
4

Staff. According to self-reported data, staff respondents were affiliated with the following areas:
PRIMARY AFFILIATION LOCATION • Academic Affairs (AA) • Institutional Advancement (ADV) • Communications & Marketing (COMM) • Correctional Managed Health Care (CMHC) • Finance & Administration (i.e., Business Affairs, Budget,
HR, Physical Plant, HUB Operations) (F&A) • Institutional Compliance (IC) • Information Technology (IT) • Research • Rural and Community Health (Rural) • Texas Tech Physicians (TTP) • Gayle Greve Hunt School of Nursing (GGHSON) • Graduate School of Biomedical Sciences (GSBS) • Paul L. Foster School of Medicine (PLFSOM) • School of Allied Health Sciences (SOAHS) • School of Medicine (SOM) • School of Nursing (SON) • School of Pharmacy (SOP)
• Abilene • Amarillo • Dallas/Ft. Worth • El Paso • Lubbock • Midland • Odessa
Figure 3 provides the number of staff respondents by primary affiliation. Staff who did not affiliate themselves with one of the given options could select Other. A Prefer Not to Answer (PNTA) option was also available.
12 9 5
116 102
3 39 48
18
236
1 12
95
34
194
41 41
107 107
Figure 3. Number of Staff Respondents by Primary Affiliation
5

Staff also provided information regarding their classification (see Figure 4). The large majority of respondents were full-time staff.
Faculty and Staff. Figure 5 provides the distribution of all faculty and staff respondents by location. The number of respondents is displayed above the columns. Faculty and staff who did not affiliate themselves with one of the given options could select Other. A Prefer Not to Answer (PNTA) option was also available.
Full-time staff 95%
Part-time staff 3%
Prefer not to answer
2%
Figure 4. Staff Classification
0%
10%
20%
30%
40%
50%
60%
Abilene Amarillo Dallas/Ft.Worth
El Paso Lubbock Midland Odessa Other Prefer notto answer
Figure 5. Number of Respondents by Location
Faculty Staff
10 22 21 166
6 4
52 304
129 571
5 5 8 47 2 25
31 76
6
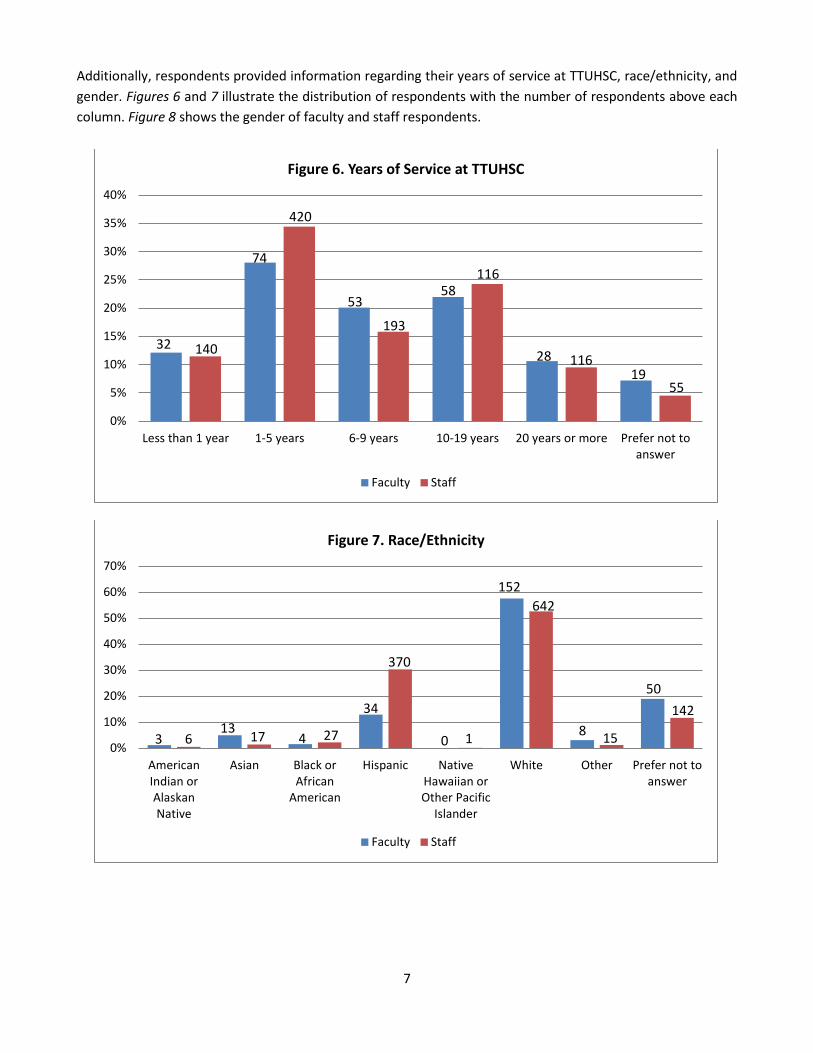
Additionally, respondents provided information regarding their years of service at TTUHSC, race/ethnicity, and gender. Figures 6 and 7 illustrate the distribution of respondents with the number of respondents above each column. Figure 8 shows the gender of faculty and staff respondents.
0%
5%
10%
15%
20%
25%
30%
35%
40%
Less than 1 year 1-5 years 6-9 years 10-19 years 20 years or more Prefer not toanswer
Figure 6. Years of Service at TTUHSC
Faculty Staff
140
74
420
32
53
193
58 116
28 116 19
55
0%
10%
20%
30%
40%
50%
60%
70%
AmericanIndian orAlaskanNative
Asian Black orAfrican
American
Hispanic NativeHawaiian orOther Pacific
Islander
White Other Prefer not toanswer
Figure 7. Race/Ethnicity
Faculty Staff
152 642
142 50
8 15
370
34 13 17 3 6 4 27 0 1
7

8
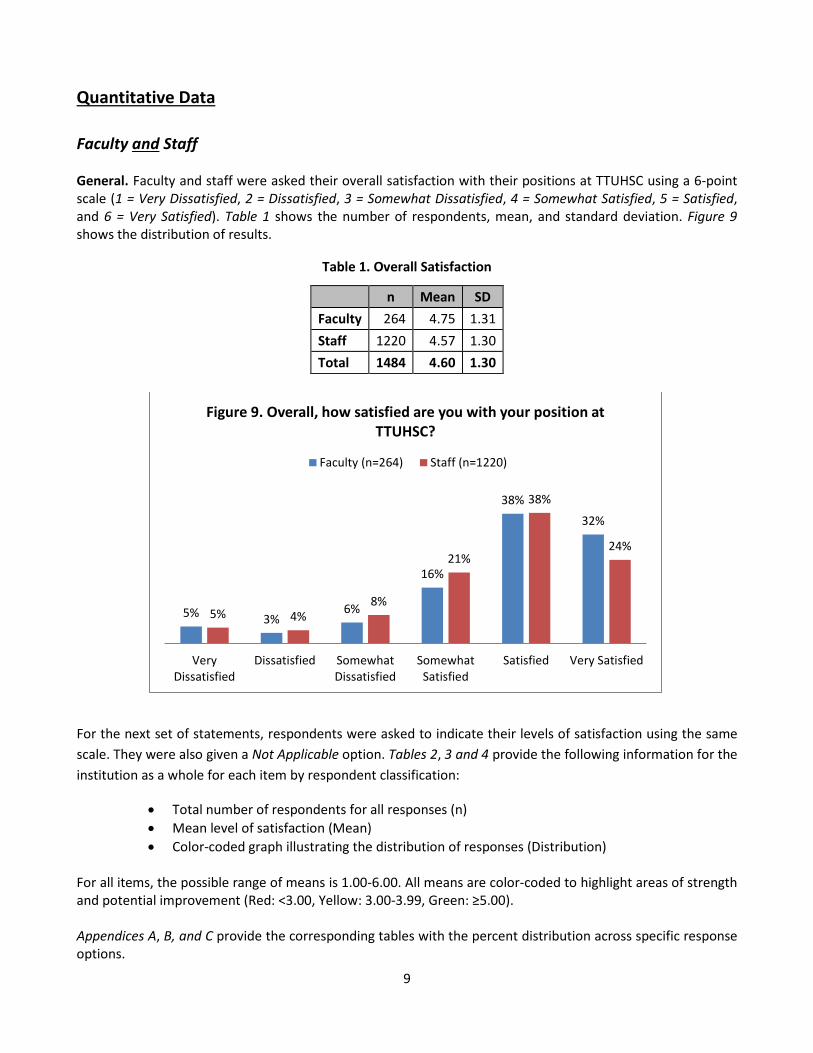
Quantitative Data Faculty and Staff General. Faculty and staff were asked their overall satisfaction with their positions at TTUHSC using a 6-point scale (1 = Very Dissatisfied, 2 = Dissatisfied, 3 = Somewhat Dissatisfied, 4 = Somewhat Satisfied, 5 = Satisfied, and 6 = Very Satisfied). Table 1 shows the number of respondents, mean, and standard deviation. Figure 9 shows the distribution of results.
Table 1. Overall Satisfaction
n Mean SD Faculty 264 4.75 1.31 Staff 1220 4.57 1.30 Total 1484 4.60 1.30
For the next set of statements, respondents were asked to indicate their levels of satisfaction using the same scale. They were also given a Not Applicable option. Tables 2, 3 and 4 provide the following information for the institution as a whole for each item by respondent classification:
• Total number of respondents for all responses (n) • Mean level of satisfaction (Mean) • Color-coded graph illustrating the distribution of responses (Distribution)
For all items, the possible range of means is 1.00-6.00. All means are color-coded to highlight areas of strength and potential improvement (Red: <3.00, Yellow: 3.00-3.99, Green: ≥5.00). Appendices A, B, and C provide the corresponding tables with the percent distribution across specific response options.
5% 3% 6%
16%
38% 32%
5% 4% 8%
21%
38%
24%
VeryDissatisfied
Dissatisfied SomewhatDissatisfied
SomewhatSatisfied
Satisfied Very Satisfied
Figure 9. Overall, how satisfied are you with your position at TTUHSC?
Faculty (n=264) Staff (n=1220)
9
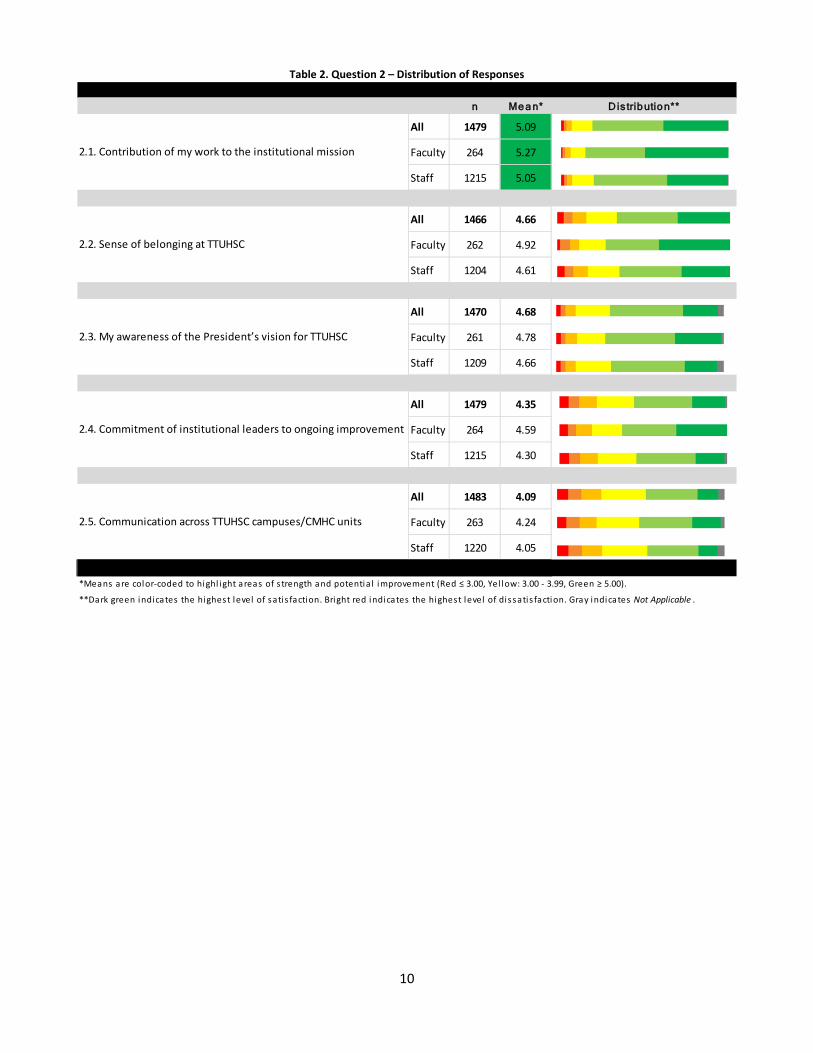
Table 2. Question 2 – Distribution of Responses
n Me a n* Dis trib utio n**
All 1479 5.09
Faculty 264 5.27
Staff 1215 5.05
All 1466 4.66
Faculty 262 4.92
Staff 1204 4.61
All 1470 4.68
Faculty 261 4.78
Staff 1209 4.66
All 1479 4.35
Faculty 264 4.59
Staff 1215 4.30
All 1483 4.09
Faculty 263 4.24
Staff 1220 4.05
*Means are color-coded to highl ight areas of s trength and potentia l improvement (Red ≤ 3.00, Yel low: 3.00 - 3.99, Green ≥ 5.00).
**Dark green indicates the highest level of sati s faction. Bright red indicates the highest level of dissatis faction. Gray indicates Not Applicable .
2.1. Contribution of my work to the institutional mission
2.2. Sense of belonging at TTUHSC
2.3. My awareness of the President’s vision for TTUHSC
2.4. Commitment of institutional leaders to ongoing improvement
2.5. Communication across TTUHSC campuses/CMHC units
10

Table 3. Question 3 – Distribution of Responses
n Me a n* Dis trib utio n**
All 1472 3.64
Faculty 260 4.43
Staff 1212 3.47
All 1470 4.90
Faculty 262 5.09
Staff 1208 4.86
All 1474 4.05
Faculty 262 4.60
Staff 1212 3.93
*Means are color-coded to highl ight areas of s trength and potentia l improvement (Red ≤ 3.00, Yel low: 3.00 - 3.99, Green ≥ 5.00).
**Dark green indicates the highest level of sati s faction. Bright red indicates the highest level of dissatis faction. Gray indicates Not Applicable .
3.1. Salary/wages for the work I do
3.2. Sense of personal safety/security in the work environment
3.3. Ability to report complaints without fear of retaliation
11

Table 4. Question 7 – Distribution of Responses
n Me a n* Dis trib utio n**
All 1480 4.32
Faculty 263 4.50
Staff 1217 4.28
All 1461 4.92
Faculty 259 5.15
Staff 1202 4.85
All 1467 4.69
Faculty 259 4.92
Staff 1208 4.64
All 1479 4.60
Faculty 264 4.26
Staff 1215 4.68
All 1474 4.59
Faculty 263 4.20
Staff 1211 4.69
All 1477 4.60
Faculty 260 4.89
Staff 1217 4.54
All 1466 4.76
Faculty 262 4.83
Staff 1204 4.75
All 1481 4.84
Faculty 264 4.95
Staff 1217 4.81
7.6. Office/work space
7.7. Clerical/administrative assistance
7.1. Effectiveness of local Human Resources services
7.2. Library resources
7.3. Cleanliness/maintenance of my work environment
7.4. TTUHSC technology support (IT Solution Center)
7.5. Interactive video broadcasting system (i.e., Techlink)
*Means are color-coded to highl ight areas of s trength and potentia l improvement (Red ≤ 3.00, Yel low: 3.00 - 3.99, Green ≥ 5.00).
7.8. Availability of office equipment and supplies
**Dark green indicates the highest level of sati s faction. Bright red indicates the highest level of dissatis faction. Gray indicates Not Applicable .
12

Recognition. For the next set of statements, respondents were asked to rate the importance of items using a 5-point scale (1 = Unimportant, 2 = Of Little Importance, 3 = Moderately Important, 4 = Important, and 5 = Very Important). Table 5 provides the following information for the institution as a whole for each item by respondent classification:
• Total number of respondents for all responses (n) • Mean level of importance (Mean) • Color-coded graph illustrating the mean and distribution of responses (Distribution)
Note: The length of the bar displays the overall mean. Different shades of blue highlight the distribution of respondents across response options. Lighter colors highlight the percentage of respondents who marked lower levels of importance. Darker colors display the percentage of respondents who marked higher levels of importance.
For these items, the possible range of means is 1.00-5.00. Means are color-coded to highlight areas of greater importance (Blue: ≥ 4.00). Appendix D shows the corresponding table with the percent distribution across response options.
13

Table 5. Question 5 – Distribution of Responses
n Me a n** D is trib utio n***
All 1479 4.30
Faculty 261 4.57
Staff 1218 4.24
All 1474 3.52
Faculty 263 3.64
Staff 1211 3.49
All 1475 3.83
Faculty 263 3.97
Staff 1212 3.80
All 1472 3.66
Faculty 261 3.72
Staff 1211 3.65
All 1476 3.96
Faculty 262 4.03
Staff 1214 3.94
All 1476 3.91
Faculty 261 3.98
Staff 1215 3.89
All 1472 3.72
Faculty 260 3.84
Staff 1212 3.69
*Means are color-coded to highl ight areas of importance (Blue ≥ 4.00).**The length of the bar displays the overa l l mean. Di fferent shades of blue highl ight how many respondents marked each response option. Lighter colors highl ight the percentage of respondents who marked lower levels of importance. Darker colors display the percentage of respondents who marked higher levels of importance.
5.3. Receiving informal recognition for your contributions/achievements
5.4. Receiving recognition for individual accomplishments
5.5. Receiving recognition for team accomplishments
5.6. Being recognized by managers/supervisors
5.7. Being recognized by peers and coworkers
5.1. Feeling that your work is valued and appreciated
5.2. Receiving formal recognition for your contributions/achievements
14
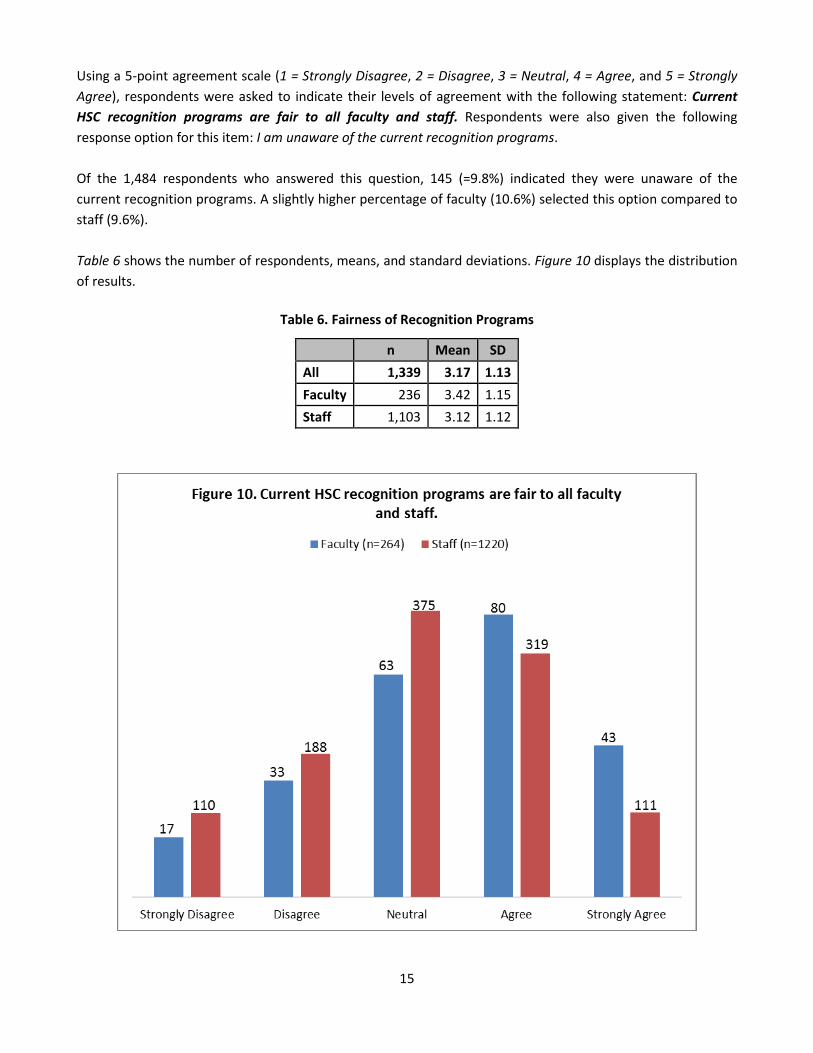
Using a 5-point agreement scale (1 = Strongly Disagree, 2 = Disagree, 3 = Neutral, 4 = Agree, and 5 = Strongly Agree), respondents were asked to indicate their levels of agreement with the following statement: Current HSC recognition programs are fair to all faculty and staff. Respondents were also given the following response option for this item: I am unaware of the current recognition programs. Of the 1,484 respondents who answered this question, 145 (=9.8%) indicated they were unaware of the current recognition programs. A slightly higher percentage of faculty (10.6%) selected this option compared to staff (9.6%). Table 6 shows the number of respondents, means, and standard deviations. Figure 10 displays the distribution of results.
Table 6. Fairness of Recognition Programs
n Mean SD All 1,339 3.17 1.13 Faculty 236 3.42 1.15 Staff 1,103 3.12 1.12
15

Staff Only
The following questions were answered by staff members only. Respondents were asked to indicate their level of satisfaction using a 6-point scale (1 = Very Dissatisfied, 2 = Dissatisfied, 3 = Somewhat Dissatisfied, 4 = Somewhat Satisfied, 5 = Satisfied, and 6 = Very Satisfied). Respondents were also given a Not Applicable option. Tables 7 and 8 provide the following information for the institution as a whole for each item:
• Total number of respondents for all responses (n) • Mean level of satisfaction (Mean) • Color-coded graph illustrating the distribution of responses (Distribution)
For all items, the possible range of means is 1.00-6.00. Means are color-coded to highlight areas of strength and potential improvement (Red: <3.00, Yellow: 3.00-3.99, Green: ≥5.00). Appendices E and F provide the corresponding tables with the percent distribution across response options.
Table 7. Question 11 – Distribution of Responses for Staff
n Mean* Distribution**11.1. Institutional leaders’ awareness of staff needs
1211 3.84
11.2. Effectiveness of Staff Senators in representing my interests
1208 3.96
11.3. Workload for my position 1186 4.29
11.4. Opportunities for professional development/continuing education
1214 4.10
**Dark green indicates the highest level of sati s faction. Bright red indicates the highest level of dissatis faction. Gray indicates Not Applicable To Me .
*Means are color-coded to highl ight areas of s trength and potentia l improvement (Red < 3.00, Yel low: 3.00 - 3.99, Green ≥ 5.00).
16

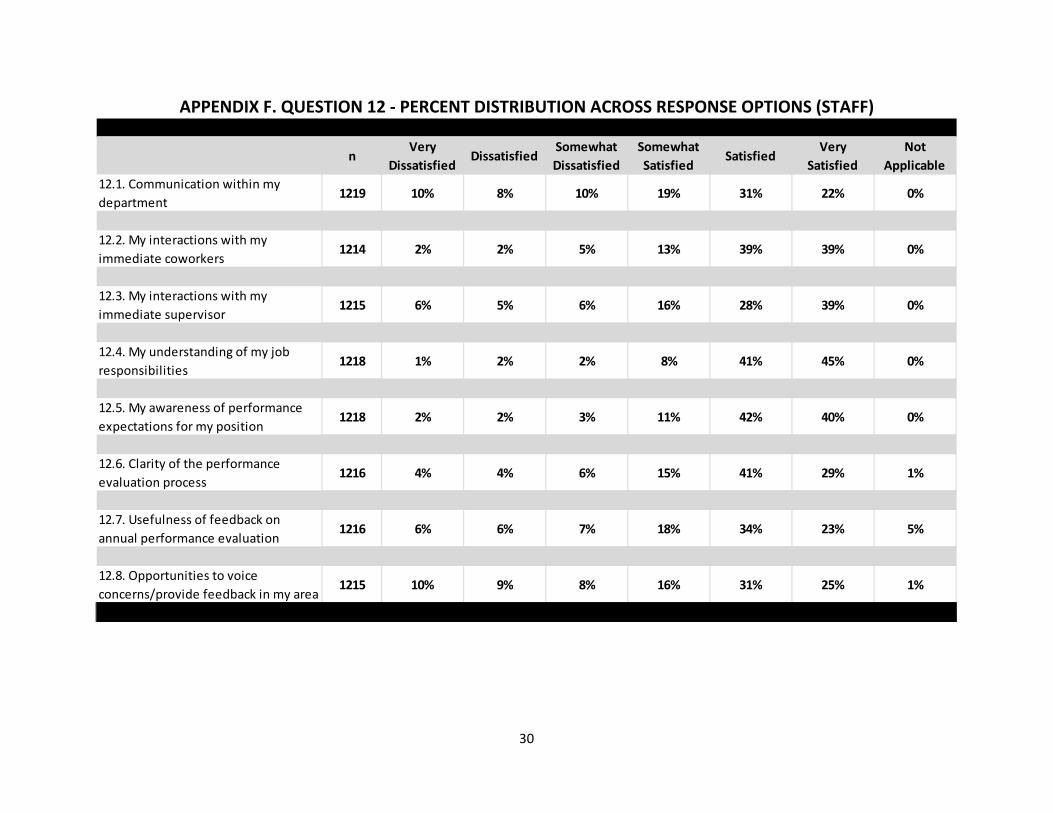
Table 8. Question 12 – Distribution of Responses for Staff
n Mean* Distribution**
12.1. Communication within my department 1219 4.18
12.2. My interactions with my immediate coworkers 1214 5.02
12.3. My interactions with my immediate supervisor 1215 4.72
12.4. My understanding of my job responsibilities 1218 5.23
12.5. My awareness of performance expectations for my position
1218 5.10
12.6. Clarity of the performance evaluation process 1216 4.75
12.7. Usefulness of feedback on annual performance evaluation
1216 4.43
12.8. Opportunities to voice concerns/provide feedback in my area
1215 4.25
*Means are color-coded to highl ight areas of s trength and potentia l improvement (Red < 3.00, Yel low: 3.00 - 3.99, Green ≥ 5.00).
**Dark green indicates the highest level of sati s faction. Bright red indicates the highest level of dissatis faction. Gray indicates Not Applicable To Me .
17
Faculty Only
General. The following questions were answered by faculty only. Respondents were asked to indicate their levels of satisfaction using a 6-point scale (1 = Very Dissatisfied, 2 = Dissatisfied, 3 = Somewhat Dissatisfied, 4 = Somewhat Satisfied, 5 = Satisfied, and 6 = Very Satisfied). Respondents were also given a Not Applicable option. Tables 9 through 11 provide the following information for the institution as a whole for each item:
• Total number of respondents for all responses (n) • Mean level of satisfaction (Mean) • Color-coded graph illustrating the distribution of responses (Distribution)
For all items, the possible range of means is 1.00-6.00. Means are color-coded to highlight areas of strength and potential improvement (Red: <3.00, Yellow: 3.00-3.99, Green: ≥5.00). Appendices G through I show the corresponding tables with the percent distribution across response options.
18
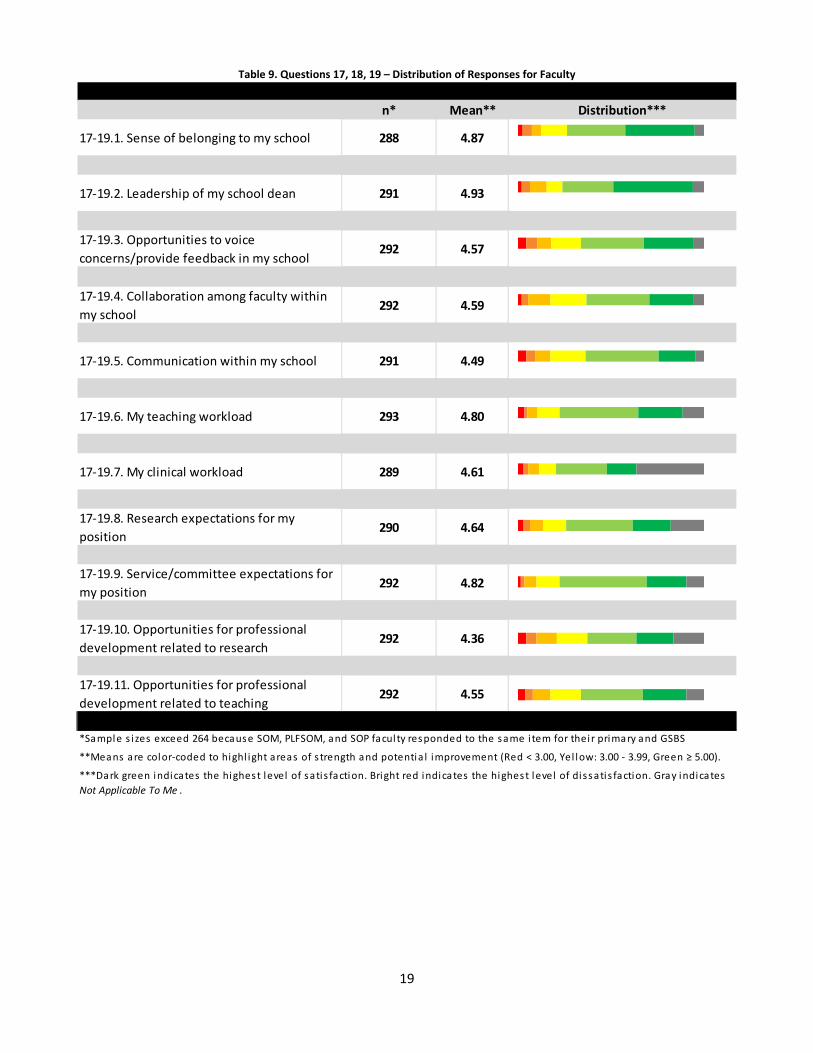
Table 9. Questions 17, 18, 19 – Distribution of Responses for Faculty
n* Mean** Distribution***
17-19.1. Sense of belonging to my school 288 4.87
17-19.2. Leadership of my school dean 291 4.93
17-19.3. Opportunities to voice concerns/provide feedback in my school
292 4.57
17-19.4. Collaboration among faculty within my school
292 4.59
17-19.5. Communication within my school 291 4.49
17-19.6. My teaching workload 293 4.80
17-19.7. My clinical workload 289 4.61
17-19.8. Research expectations for my position
290 4.64
17-19.9. Service/committee expectations for my position
292 4.82
17-19.10. Opportunities for professional development related to research
292 4.36
17-19.11. Opportunities for professional development related to teaching
292 4.55
*Sample s i zes exceed 264 because SOM, PLFSOM, and SOP facul ty responded to the same i tem for thei r primary and GSBS
**Means are color-coded to highl ight areas of s trength and potentia l improvement (Red < 3.00, Yel low: 3.00 - 3.99, Green ≥ 5.00).
***Dark green indicates the highest level of sati s faction. Bright red indicates the highest level of dissatis faction. Gray indicates Not Applicable To Me .
19

Table 10. Question 20 – Distribution of Responses for Faculty
n Mean* Distribution**20.1. Opportunities for professional development as a clinician/practitioner
262 4.71
20.2. Laboratory and/or research space 261 4.52
20.3. My school's technology support 261 4.33
20.4. Audio-video equipment in classrooms 261 4.49
20.5. Learning management system (e.g., Sakai/The Hub, Blackboard)
263 4.31
*Means are color-coded to highl ight areas of s trength and potentia l improvement (Red < 3.00, Yel low: 3.00 - 3.99, **Dark green indicates the highest level of sati s faction. Bright red indicates the highest level of dissatis faction. Gray
indicates Not Applicable To Me .
20

Table 11. Question 21 – Distribution of Responses for Faculty
Feedback by Chairs. Faculty were also asked about performance feedback received from their chairs. Figure 11 displays the results.
n Mean* Distribution**21.1. Institutional leaders’ awareness of faculty needs
261 4.29
21.2. Communication with my chair 264 4.89
21.3. Effectiveness of Faculty Senators in representing my interests
263 4.44
21.4. Collaboration among faculty across schools
262 4.24
21.5. Formal evaluation process of faculty
260 4.44
21.6. Clarity of the tenure process 264 4.60
21.7. Clarity of the promotion process 261 4.58
*Means are color-coded to highl ight areas of s trength and potentia l improvement (Red < 3.00, Yel low: 3.00 - 3.99, Green ≥ 5.00).**Dark green indicates the highest level of sati s faction. Bright red indicates the highest level of dissatis faction. Gray indicates Not Applicable To Me .
21

Those who do not receive regular feedback were asked to evaluate the statement: I would prefer to receive regular feedback about my performance by my chair. Those who do receive regular feedback were asked to rate the statement: Usefulness of feedback about my performance by my chair. Figures 12 and 13 illustrate the results.
2 5 5
17 20
9
StronglyDisagree
Disagree SomewhatDisagree
SomewhatAgree
Agree StronglyAgree
Figure 12. I would prefer to receive regular feedback about my performance by my chair.
5 2 8
30
94
67
VeryDissatisfied
Dissatisfied SomewhatDissatisfied
SomewhatSatisfied
Satisfied Very Satisfied
Figure 13. Usefulness of feedback about my performance by my chair
22

Results by Appointment/Affiliation Appendix J presents survey results for faculty according to appointment. Appendix K presents survey results for staff according to affiliation. The tables provide the following information:
• Total number of respondents for the scaled responses (i.e. excluding Not Applicable responses) • Mean level of satisfaction/importance/agreement
o For satisfaction items, means are color-coded to highlight areas of strength and potential improvement (Red: <3.00, Yellow: 3.00-3.99, Green: ≥5.00).
o For importance items, means are color-coded to highlight areas of importance (Blue: ≥ 4.00).
• Standard deviation Notes for Faculty Results:
• Faculty who indicated a primary appointment with either the School of Medicine, the School of Nursing, or the School of Pharmacy, were given the option to indicate a secondary appointment with the Graduate School of Biomedical Sciences (GSBS). For the first time in the history of this survey, faculty were also able to indicate a primary appointment with GSBS. The column for GSBS combines answers of both faculty who indicated a primary and faculty who indicated a secondary appointment with GSBS.
• Faculty answered most questions only once. However, responses by faculty who indicated a secondary appointment with GSBS have responded to some items twice—once for their primary appointment and once for their GSBS appointment.
Notes for Staff Results:
• The following areas had less than five respondents and are not included for privacy reasons: o Gayle Greve Hunt School of Nursing o Institutional Compliance
Results by Campus Appendix L presents survey results according to campus for all employees. The tables provide the following information:
• Total number of respondents for the scaled responses (i.e. excluding Not Applicable responses) • Mean level of satisfaction/importance/agreement
o For satisfaction items, means are color-coded to highlight areas of strength and potential improvement (Red: <3.00, Yellow: 3.00-3.99, Green: ≥5.00).
o For importance items, means are color-coded to highlight areas of importance (Blue: ≥ 4.00).
• Standard deviation
23
Qualitative Data At the end of the survey, faculty and staff were given an opportunity to provide open-ended comments in response to the following prompts:
• What do you like most about working for TTUHSC? • Do you have suggestions for making TTUHSC a better place to work? If so, please describe.
Respondents provided 974 comments to the first prompt (Faculty=160, Staff=814) and 790 comments to the second prompt (Faculty=131, Staff=659). Any comments which indicated the respondent did not have a comment (e.g., N/A, none) or were otherwise not useful (e.g., all, nothing) were eliminated. This left 962 and 722 usable comments, respectively. Due to the sensitive nature of some comments, actual comments will be provided to selected institutional leaders only. They will determine how best to distribute them in their respective areas.
Using Survey Data to Promote Continuous Improvement More often than not, it is difficult to determine what to do with information collected from general surveys like the Employee Satisfaction Survey. It is one thing to collect the data—it is another thing entirely to use the information to promote continuous improvement. The first step in this process is to put the current data into context. Consider the following questions:
• Do these results support other existing data? • Does additional information need to be gathered? (e.g. focus groups, interviews)
Once you have gained an appropriate perspective, identify an area of potential improvement or a strength upon which to build. Consider what your desired outcome will be. Then, identify and implement a potential strategy for improvement. After a reasonable timeframe, evaluate whether the strategy has been successful. Did you achieve the desired outcome? Continuous improvement is a process. Sometimes strategies for improvement will be successful—sometimes they will not. Although the ultimate outcome is indeed important, what is equally critical is the documentation of your efforts to make those improvements. Contact the Office of Institutional Planning & Assessment for additional guidance in this process.
24

Appendices APPENDIX A. QUESTION 2 - PERCENT DISTRIBUTION ACROSS RESPONSE OPTIONS
nVery
DissatisfiedDissatisfied
Somewhat Dissatisfied
Somewhat Satisfied
SatisfiedVery
SatisfiedNot
ApplicableAll 1479 2% 1% 3% 12% 42% 39% 0%Faculty 264 1% 2% 3% 9% 36% 50% 0%Staff 1215 2% 1% 3% 13% 44% 36% 1%
All 1466 4% 5% 8% 18% 35% 30% 0%Faculty 262 2% 6% 5% 15% 31% 41% 0%Staff 1204 4% 5% 8% 18% 36% 28% 0%
All 1470 3% 3% 6% 20% 44% 21% 4%Faculty 261 3% 3% 7% 17% 42% 28% 2%Staff 1209 2% 3% 6% 21% 44% 19% 4%
All 1479 5% 6% 10% 22% 35% 20% 1%Faculty 264 5% 5% 9% 18% 33% 30% 0%Staff 1215 6% 7% 11% 23% 35% 17% 2%
All 1483 6% 8% 12% 27% 31% 12% 4%Faculty 263 5% 8% 10% 25% 32% 17% 2%Staff 1220 7% 8% 12% 27% 31% 11% 4%
2.1. Contribution of my work to the institutional mission
2.2. Sense of belonging at TTUHSC
2.3. My awareness of the President’s vision for TTUHSC
2.4. Commitment of institutional leaders to ongoing improvement
2.5. Communication across TTUHSC campuses/CMHC units
25

APPENDIX B. QUESTION 3 - PERCENT DISTRIBUTION ACROSS RESPONSE OPTIONS
nVery
DissatisfiedDissatisfied
Somewhat Dissatisfied
Somewhat Satisfied
SatisfiedVery
SatisfiedNot
ApplicableAll 1472 11% 14% 16% 24% 24% 10% 0%Faculty 260 4% 7% 10% 22% 38% 20% 0%Staff 1212 13% 16% 18% 25% 21% 8% 0%
All 1470 3% 3% 6% 13% 42% 33% 1%Faculty 262 3% 2% 6% 8% 34% 45% 2%Staff 1208 2% 3% 6% 14% 44% 31% 0%
All 1474 11% 10% 11% 17% 30% 19% 3%Faculty 262 7% 3% 10% 14% 30% 32% 5%Staff 1212 12% 11% 11% 18% 29% 16% 3%
3.1. Salary/wages for the work I do
3.2. Sense of personal safety/security in the work environment
3.3. Ability to report complaints without fear of retaliation
26

APPENDIX C. QUESTION 7 - PERCENT DISTRIBUTION ACROSS RESPONSE OPTIONS
nVery
DissatisfiedDissatisfied
Somewhat Dissatisfied
Somewhat Satisfied
SatisfiedVery
SatisfiedNot
ApplicableAll 1480 6% 6% 9% 19% 39% 16% 3%
Faculty 263 5% 4% 9% 20% 36% 21% 6%Staff 1217 7% 7% 10% 19% 40% 15% 3%
All 1461 1% 2% 2% 9% 35% 18% 33%Faculty 259 2% 2% 1% 13% 36% 42% 5%
Staff 1202 1% 2% 2% 8% 35% 12% 40%
All 1467 3% 4% 7% 17% 42% 25% 2%Faculty 259 4% 0% 6% 14% 41% 33% 3%
Staff 1208 3% 5% 8% 18% 42% 23% 1%
All 1479 4% 5% 8% 19% 39% 25% 1%Faculty 264 9% 8% 8% 20% 30% 24% 0%
Staff 1215 2% 4% 8% 18% 41% 25% 1%
All 1474 2% 3% 5% 15% 38% 12% 25%Faculty 263 5% 6% 9% 21% 29% 11% 19%
Staff 1211 2% 3% 4% 13% 39% 13% 27%
All 1477 4% 4% 10% 16% 41% 24% 1%Faculty 260 4% 1% 7% 11% 42% 32% 3%
Staff 1217 4% 4% 11% 17% 41% 22% 1%
All 1466 3% 4% 5% 14% 40% 26% 8%Faculty 262 4% 5% 6% 14% 28% 41% 2%
Staff 1204 3% 3% 4% 14% 43% 22% 10%
All 1481 3% 3% 6% 13% 46% 29% 1%Faculty 264 4% 2% 5% 10% 41% 36% 2%
Staff 1217 3% 3% 6% 13% 46% 28% 1%
7.7. Clerical/administrative assistance
7.8. Availability of office equipment and supplies
7.1. Effectiveness of local Human Resources services
7.2. Library resources
7.3. Cleanliness/maintenance of my work environment
7.4. TTUHSC technology support (IT Solution Center)
7.5. Interactive video broadcasting system (i.e., TechLink)
7.6. Office/work space
27

APPENDIX D. QUESTION 5 - PERCENT DISTRIBUTION ACROSS RESPONSE OPTIONS
n UnimportantOf Little
ImportanceModerately Important
ImportantVery
ImportantAll 1479 2% 4% 10% 33% 52%Faculty 261 1% 1% 5% 28% 66%Staff 1218 2% 4% 11% 34% 49%
All 1474 5% 16% 25% 33% 22%Faculty 263 3% 12% 30% 28% 27%Staff 1211 5% 16% 24% 34% 21%
All 1475 3% 9% 20% 40% 28%Faculty 263 2% 6% 17% 43% 32%Staff 1212 3% 9% 21% 39% 27%
All 1472 4% 12% 24% 36% 25%Faculty 261 3% 10% 27% 33% 27%Staff 1211 4% 12% 23% 36% 25%
All 1476 3% 6% 17% 39% 34%Faculty 262 2% 4% 19% 39% 36%Staff 1214 3% 7% 17% 39% 34%
All 1476 3% 7% 18% 39% 33%Faculty 261 2% 5% 17% 42% 33%Staff 1215 3% 7% 18% 39% 32%
All 1472 3% 10% 25% 38% 25%Faculty 260 2% 8% 23% 38% 28%Staff 1212 3% 10% 25% 38% 24%
5.1. Feeling that your work is valued and appreciated
5.2. Receiving formal recognition for your contributions/achievements
5.3. Receiving informal recognition for your contributions/achievements
5.4. Receiving recognition for individual accomplishments
5.5. Receiving recognition for team accomplishments
5.6. Being recognized by managers/supervisors
5.7. Being recognized by peers and coworkers
28

APPENDIX E. QUESTION 11 - PERCENT DISTRIBUTION ACROSS RESPONSE OPTIONS (STAFF)
nVery
DissatisfiedDissatisfied
Somewhat Dissatisfied
Somewhat Satisfied
SatisfiedVery
SatisfiedNot
Applicable11.1. Institutional leaders’ awareness of staff needs
1211 8% 11% 15% 25% 30% 8% 3%
11.2. Effectiveness of Staff Senators in representing my interests
1208 6% 6% 10% 22% 27% 5% 24%
11.3. Workload for my position 1186 5% 7% 10% 21% 45% 11% 0%
11.4. Opportunities for professional development/continuing education
1214 9% 7% 11% 21% 35% 13% 4%
29
APPENDIX F. QUESTION 12 - PERCENT DISTRIBUTION ACROSS RESPONSE OPTIONS (STAFF)
nVery
DissatisfiedDissatisfied
Somewhat Dissatisfied
Somewhat Satisfied
SatisfiedVery
SatisfiedNot
Applicable12.1. Communication within my department
1219 10% 8% 10% 19% 31% 22% 0%
12.2. My interactions with my immediate coworkers
1214 2% 2% 5% 13% 39% 39% 0%
12.3. My interactions with my immediate supervisor
1215 6% 5% 6% 16% 28% 39% 0%
12.4. My understanding of my job responsibilities
1218 1% 2% 2% 8% 41% 45% 0%
12.5. My awareness of performance expectations for my position
1218 2% 2% 3% 11% 42% 40% 0%
12.6. Clarity of the performance evaluation process
1216 4% 4% 6% 15% 41% 29% 1%
12.7. Usefulness of feedback on annual performance evaluation
1216 6% 6% 7% 18% 34% 23% 5%
12.8. Opportunities to voice concerns/provide feedback in my area
1215 10% 9% 8% 16% 31% 25% 1%
30

APPENDIX G. QUESTION 17, 18, 19 - PERCENT DISTRIBUTION ACROSS RESPONSE OPTIONS (FACULTY)
nVery
DissatisfiedDissatisfied
Somewhat Dissatisfied
Somewhat Satisfied
Satisfied Very SatisfiedNot
Applicable
17-19.1. Sense of belonging to my school 288 3% 5% 5% 14% 31% 38% 5%
17-19.2. Leadership of my school dean 291 2% 4% 9% 8% 27% 43% 6%
17-19.3. Opportunities to voice concerns/provide feedback in my school
292 5% 6% 8% 16% 34% 27% 5%
17-19.4. Collaboration among faculty within my school
292 2% 4% 12% 20% 34% 24% 5%
17-19.5. Communication within my school 291 4% 5% 8% 19% 40% 20% 4%
17-19.6. My teaching workload 293 3% 2% 5% 12% 42% 24% 11%
17-19.7. My clinical workload 289 3% 3% 6% 9% 27% 16% 36%
17-19.8. Research expectations for my position
290 3% 3% 7% 12% 36% 20% 18%
17-19.9. Service/committee expectations for my position
292 2% 2% 6% 13% 47% 22% 9%
17-19.10. Opportunities for professional development related to research
292 4% 6% 11% 16% 26% 20% 16%
17-19.11. Opportunities for professional development related to teaching
292 4% 4% 9% 16% 33% 24% 9%
31

APPENDIX H. QUESTION 20 - PERCENT DISTRIBUTION ACROSS RESPONSE OPTIONS (FACULTY)
nVery
DissatisfiedDissatisfied
Somewhat Dissatisfied
Somewhat Satisfied
SatisfiedVery
SatisfiedNot
Applicable20.1. Opportunities for professional development as a clinician/practitioner
262 3% 2% 6% 11% 32% 18% 30%
20.2. Laboratory and/or research space 261 2% 2% 7% 9% 19% 12% 49%
20.3. My school's technology support 261 9% 6% 8% 16% 32% 23% 7%
20.4. Audio-video equipment in classrooms
261 5% 3% 7% 19% 34% 17% 15%
20.5. Learning management system (e.g., Sakai/The Hub, Blackboard)
263 4% 5% 7% 22% 28% 12% 23%
32

APPENDIX I. QUESTION 21 - PERCENT DISTRIBUTION ACROSS RESPONSE OPTIONS (FACULTY)
nVery
DissatisfiedDissatisfied
Somewhat Dissatisfied
Somewhat Satisfied
SatisfiedVery
SatisfiedNot
Applicable21.1. Institutional leaders’ awareness of faculty needs
261 6% 7% 12% 17% 37% 17% 5%
21.2. Communication with my chair 264 5% 4% 6% 11% 24% 43% 8%
21.3. Effectiveness of Faculty Senators in representing my interests
263 3% 3% 10% 16% 32% 14% 21%
21.4. Collaboration among faculty across schools
262 3% 5% 11% 28% 28% 13% 11%
21.5. Formal evaluation process of faculty 260 3% 5% 11% 18% 38% 17% 8%
21.6. Clarity of the tenure process 264 4% 3% 7% 12% 31% 19% 24%
21.7. Clarity of the promotion process 261 4% 5% 7% 13% 37% 22% 11%
33
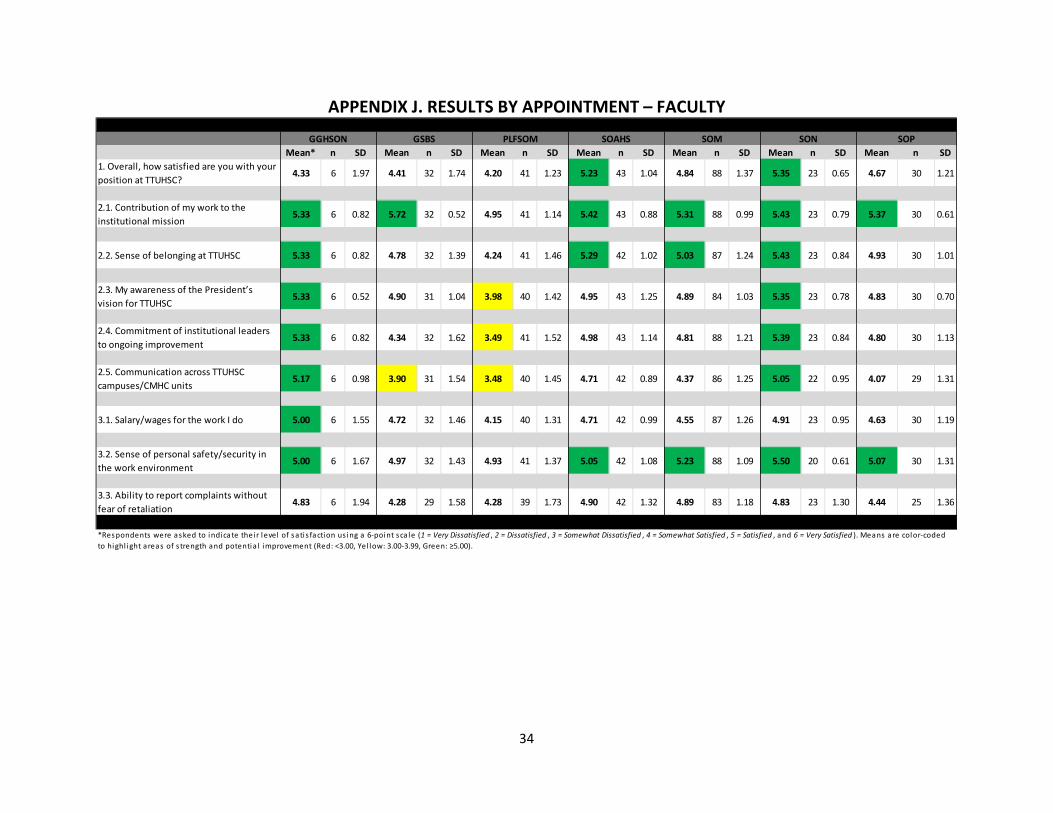
APPENDIX J. RESULTS BY APPOINTMENT – FACULTY
Mean* n SD Mean n SD Mean n SD Mean n SD Mean n SD Mean n SD Mean n SD1. Overall, how satisfied are you with your position at TTUHSC?
4.33 6 1.97 4.41 32 1.74 4.20 41 1.23 5.23 43 1.04 4.84 88 1.37 5.35 23 0.65 4.67 30 1.21
2.1. Contribution of my work to the institutional mission
5.33 6 0.82 5.72 32 0.52 4.95 41 1.14 5.42 43 0.88 5.31 88 0.99 5.43 23 0.79 5.37 30 0.61
2.2. Sense of belonging at TTUHSC 5.33 6 0.82 4.78 32 1.39 4.24 41 1.46 5.29 42 1.02 5.03 87 1.24 5.43 23 0.84 4.93 30 1.01
2.3. My awareness of the President’s vision for TTUHSC
5.33 6 0.52 4.90 31 1.04 3.98 40 1.42 4.95 43 1.25 4.89 84 1.03 5.35 23 0.78 4.83 30 0.70
2.4. Commitment of institutional leaders to ongoing improvement
5.33 6 0.82 4.34 32 1.62 3.49 41 1.52 4.98 43 1.14 4.81 88 1.21 5.39 23 0.84 4.80 30 1.13
2.5. Communication across TTUHSC campuses/CMHC units
5.17 6 0.98 3.90 31 1.54 3.48 40 1.45 4.71 42 0.89 4.37 86 1.25 5.05 22 0.95 4.07 29 1.31
3.1. Salary/wages for the work I do 5.00 6 1.55 4.72 32 1.46 4.15 40 1.31 4.71 42 0.99 4.55 87 1.26 4.91 23 0.95 4.63 30 1.19
3.2. Sense of personal safety/security in the work environment
5.00 6 1.67 4.97 32 1.43 4.93 41 1.37 5.05 42 1.08 5.23 88 1.09 5.50 20 0.61 5.07 30 1.31
3.3. Ability to report complaints without fear of retaliation
4.83 6 1.94 4.28 29 1.58 4.28 39 1.73 4.90 42 1.32 4.89 83 1.18 4.83 23 1.30 4.44 25 1.36
GSBS PLFSOM SOAHS SOM SONGGHSON
*Respondents were asked to indicate their level of sati s faction us ing a 6-point sca le (1 = Very Dissatisfied , 2 = Dissatisfied , 3 = Somewhat Dissatisfied , 4 = Somewhat Satisfied , 5 = Satisfied , and 6 = Very Satisfied ). Means are color-coded to highl ight areas of s trength and potentia l improvement (Red: <3.00, Yel low: 3.00-3.99, Green: ≥5.00).
SOP
34

APPENDIX J. RESULTS BY APPOINTMENT – FACULTY (CONT.)
Mean* n SD Mean n SD Mean n SD Mean n SD Mean n SD Mean n SD Mean n SD7.1. Effectiveness of local Human Resources services
5.00 6 1.26 3.90 30 1.75 4.26 38 1.25 4.76 41 1.07 4.43 83 1.29 5.24 21 1.04 4.87 30 0.94
7.2. Library resources 5.33 6 0.82 4.14 28 1.65 5.15 39 1.04 5.24 41 0.62 5.10 83 1.16 5.73 22 0.46 4.93 29 0.80
7.3. Cleanliness/maintenance of my work environment
4.83 6 1.17 4.48 31 1.50 5.05 38 0.90 4.93 43 1.03 4.84 86 1.24 5.50 18 0.71 5.07 30 1.17
7.4. TTUHSC technology support (IT Solution Center)
4.33 6 1.63 3.41 32 1.76 3.95 40 1.66 4.26 43 1.40 4.14 88 1.65 5.48 23 1.12 4.60 30 1.16
7.5. Interactive video broadcasting system (i.e., TechLink)
4.60 5 1.67 3.72 29 1.56 4.36 28 1.10 4.41 29 0.95 4.00 70 1.43 5.05 21 1.32 4.03 30 1.35
7.6. Office/work space 4.50 6 1.87 4.94 31 1.26 4.65 40 1.23 5.19 42 0.71 4.86 86 1.22 5.35 17 1.27 5.14 28 1.11
7.7. Clerical/administrative assistance 4.83 6 1.94 5.06 31 1.39 4.34 41 1.56 5.24 42 0.96 4.87 85 1.31 5.57 23 1.12 4.90 29 1.37
7.8. Availability of office equipment and supplies
4.50 6 1.87 4.88 32 1.43 4.71 41 1.31 5.19 43 0.96 4.93 88 1.29 5.55 20 0.83 5.14 29 0.88
SON SOP
*Respondents were asked to indicate their level of sati s faction us ing a 6-point sca le (1 = Very Dissatisfied , 2 = Dissatisfied , 3 = Somewhat Dissatisfied , 4 = Somewhat Satisfied , 5 = Satisfied , and 6 = Very Satisfied ). Means are color-coded to highl ight areas of s trength and potentia l improvement (Red: <3.00, Yel low: 3.00-3.99, Green: ≥5.00).
GSBS PLFSOM SOAHS SOMGGHSON
35

APPENDIX J. RESULTS BY APPOINTMENT – FACULTY (CONT.)
Mean* n SD Mean n SD Mean n SD Mean n SD Mean n SD Mean n SD Mean n SD5.1. Feeling that your work is valued and appreciated
4.17 6 1.33 4.72 32 0.46 4.60 40 0.67 4.55 42 0.63 4.57 88 0.71 4.74 23 0.45 4.60 30 0.62
5.2. Receiving formal recognition for your contributions/achievements
3.67 6 1.63 4.00 32 1.05 3.49 41 1.05 3.44 43 0.98 3.59 88 1.10 4.09 23 0.90 3.87 30 0.86
5.3. Receiving informal recognition for your contributions/achievements
3.83 6 1.47 4.16 32 1.02 4.05 41 0.71 3.86 43 0.91 3.93 88 1.00 4.22 23 0.80 4.10 30 0.88
5.4. Receiving recognition for individual accomplishments
4.00 5 1.73 3.94 32 1.05 3.66 41 1.04 3.35 43 0.90 3.68 87 1.04 4.22 23 0.85 3.97 29 0.91
5.5. Receiving recognition for team accomplishments
3.83 6 1.47 4.26 31 0.89 4.15 41 0.76 3.74 43 0.95 4.03 87 1.01 4.61 23 0.50 3.97 30 0.67
5.6. Being recognized by managers/supervisors
4.00 5 1.73 4.09 32 1.09 4.03 40 0.73 3.77 43 0.84 3.93 87 1.00 4.39 23 0.78 4.27 30 0.69
5.7. Being recognized by peers and coworkers
3.60 5 1.52 4.03 32 1.03 3.98 40 0.80 3.47 43 0.93 3.95 87 1.01 4.35 23 0.78 3.57 30 0.82
PLFSOM SOAHS SOMGGHSON SON SOP
*Respondents were asked to rate the importance of these i tems us ing a 5-point sca le (1 = Unimportant, 2 = Of Li ttle Importance, 3 = Moderately Important, 4 = Important, and 5 = Very Important). Means are color-coded to highl ight areas of importance (Blue: ≥ 4.00)
GSBS
36

APPENDIX J. RESULTS BY APPOINTMENT – FACULTY (CONT.)
The table below shows the average level of agreement by affiliation (1 = Strongly Disagree, 2 = Disagree, 3 = Neutral, 4 = Agree, and 5 = Strongly Agree), as well as the percent of respondents who selected the following option: I am unaware of the current recognition programs.
GGHSON GSBS PLFSOM SOAHS SOM SON SOP Average of scaled responses 3.40 3.11 3.06 3.59 3.52 4.00 3.52
I am unaware of the current recognition programs. 17% (n=1)
13% (n=4)
17% (n=7)
14% (n=6)
6% (n=5)
9% (n=2)
17% (n=5)
0%
10%
20%
30%
40%
50%
60%
StronglyDisagree
Disagree Neutral Agree StronglyAgree
Current HSC recognition programs are fair to all faculty and staff.
GGHSON (n=5) GSBS (n=28) PLFSOM (n=34) SOAHS (n=37) SOM (n=83) SON (n=21) SOP (n=25)
37
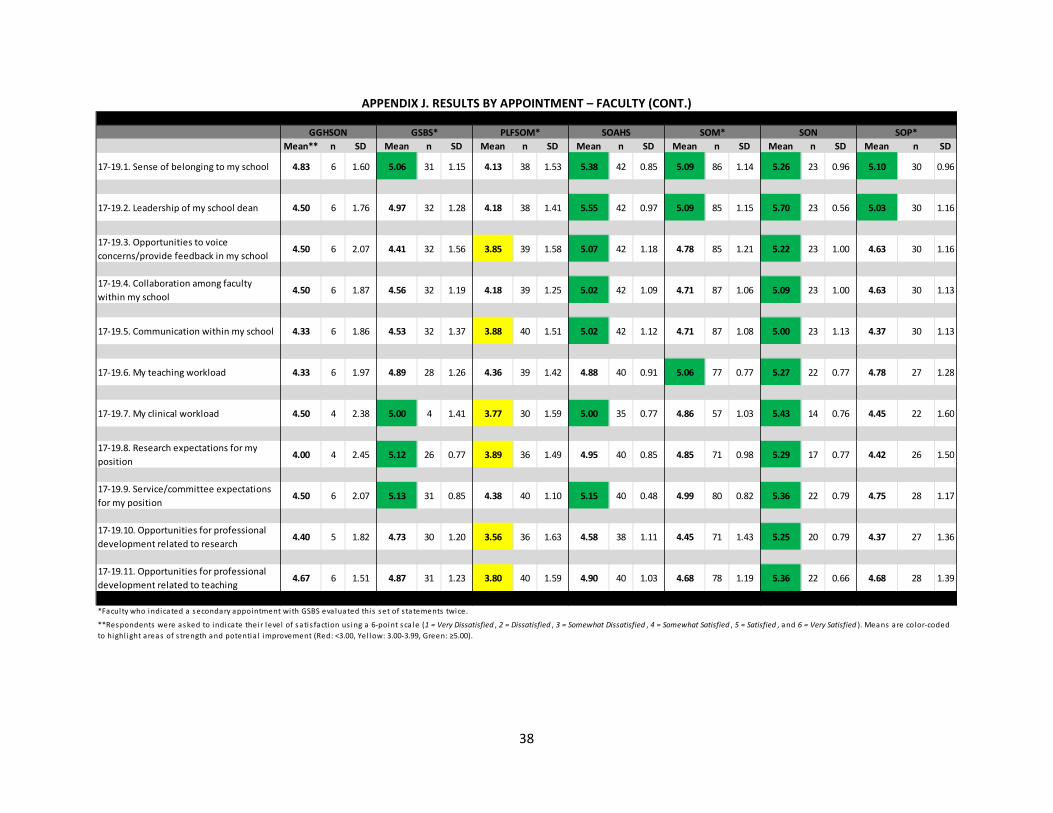
APPENDIX J. RESULTS BY APPOINTMENT – FACULTY (CONT.)
Mean** n SD Mean n SD Mean n SD Mean n SD Mean n SD Mean n SD Mean n SD
17-19.1. Sense of belonging to my school 4.83 6 1.60 5.06 31 1.15 4.13 38 1.53 5.38 42 0.85 5.09 86 1.14 5.26 23 0.96 5.10 30 0.96
17-19.2. Leadership of my school dean 4.50 6 1.76 4.97 32 1.28 4.18 38 1.41 5.55 42 0.97 5.09 85 1.15 5.70 23 0.56 5.03 30 1.16
17-19.3. Opportunities to voice concerns/provide feedback in my school
4.50 6 2.07 4.41 32 1.56 3.85 39 1.58 5.07 42 1.18 4.78 85 1.21 5.22 23 1.00 4.63 30 1.16
17-19.4. Collaboration among faculty within my school
4.50 6 1.87 4.56 32 1.19 4.18 39 1.25 5.02 42 1.09 4.71 87 1.06 5.09 23 1.00 4.63 30 1.13
17-19.5. Communication within my school 4.33 6 1.86 4.53 32 1.37 3.88 40 1.51 5.02 42 1.12 4.71 87 1.08 5.00 23 1.13 4.37 30 1.13
17-19.6. My teaching workload 4.33 6 1.97 4.89 28 1.26 4.36 39 1.42 4.88 40 0.91 5.06 77 0.77 5.27 22 0.77 4.78 27 1.28
17-19.7. My clinical workload 4.50 4 2.38 5.00 4 1.41 3.77 30 1.59 5.00 35 0.77 4.86 57 1.03 5.43 14 0.76 4.45 22 1.60
17-19.8. Research expectations for my position
4.00 4 2.45 5.12 26 0.77 3.89 36 1.49 4.95 40 0.85 4.85 71 0.98 5.29 17 0.77 4.42 26 1.50
17-19.9. Service/committee expectations for my position
4.50 6 2.07 5.13 31 0.85 4.38 40 1.10 5.15 40 0.48 4.99 80 0.82 5.36 22 0.79 4.75 28 1.17
17-19.10. Opportunities for professional development related to research
4.40 5 1.82 4.73 30 1.20 3.56 36 1.63 4.58 38 1.11 4.45 71 1.43 5.25 20 0.79 4.37 27 1.36
17-19.11. Opportunities for professional development related to teaching
4.67 6 1.51 4.87 31 1.23 3.80 40 1.59 4.90 40 1.03 4.68 78 1.19 5.36 22 0.66 4.68 28 1.39
GSBS* PLFSOM* SOAHS SOM* SON SOP*GGHSON
*Facul ty who indicated a secondary appointment with GSBS eva luated this set of s tatements twice.
**Respondents were asked to indicate their level of sati s faction us ing a 6-point sca le (1 = Very Dissatisfied , 2 = Dissatisfied , 3 = Somewhat Dissatisfied , 4 = Somewhat Satisfied , 5 = Satisfied , and 6 = Very Satisfied ). Means are color-coded to highl ight areas of s trength and potentia l improvement (Red: <3.00, Yel low: 3.00-3.99, Green: ≥5.00).
38

APPENDIX J. RESULTS BY APPOINTMENT – FACULTY (CONT.)
Mean* n SD Mean n SD Mean n SD Mean n SD Mean n SD Mean n SD Mean n SD
20.1. Opportunities for professional development as a clinician/practitioner
4.60 5 1.14 5.75 4 0.50 3.74 31 1.69 5.08 36 0.65 4.89 57 0.90 5.33 15 0.90 4.96 23 1.15
20.2. Laboratory and/or research space 4.20 5 2.17 5.00 23 0.90 3.86 21 1.62 4.56 34 1.21 4.70 40 1.02 4.88 8 1.25 5.08 12 0.90
20.3. My school's technology support 4.40 5 1.82 3.94 31 1.67 3.62 39 1.62 4.66 41 1.30 4.30 82 1.50 5.70 23 0.88 4.43 30 1.45
20.4. Audio-video equipment in classrooms
3.83 6 1.94 4.10 30 1.54 4.26 34 1.14 4.76 38 0.88 4.55 76 1.35 5.61 18 0.70 4.23 30 1.30
20.5. Learning management system (e.g., Sakai/The Hub, Blackboard)
4.33 6 1.86 4.37 30 1.13 4.21 24 1.35 4.71 41 1.05 4.25 60 1.19 5.09 22 1.23 3.97 30 1.33
SON SOPGGHSON
*Respondents were asked to indicate their level of sati s faction us ing a 6-point sca le (1 = Very Dissatisfied , 2 = Dissatisfied , 3 = Somewhat Dissatisfied , 4 = Somewhat Satisfied , 5 = Satisfied , and 6 = Very Satisfied ). Means are color-coded to highl ight areas of s trength and potentia l improvement (Red: <3.00, Yel low: 3.00-3.99, Green: ≥5.00).
GSBS PLFSOM SOAHS SOM
39
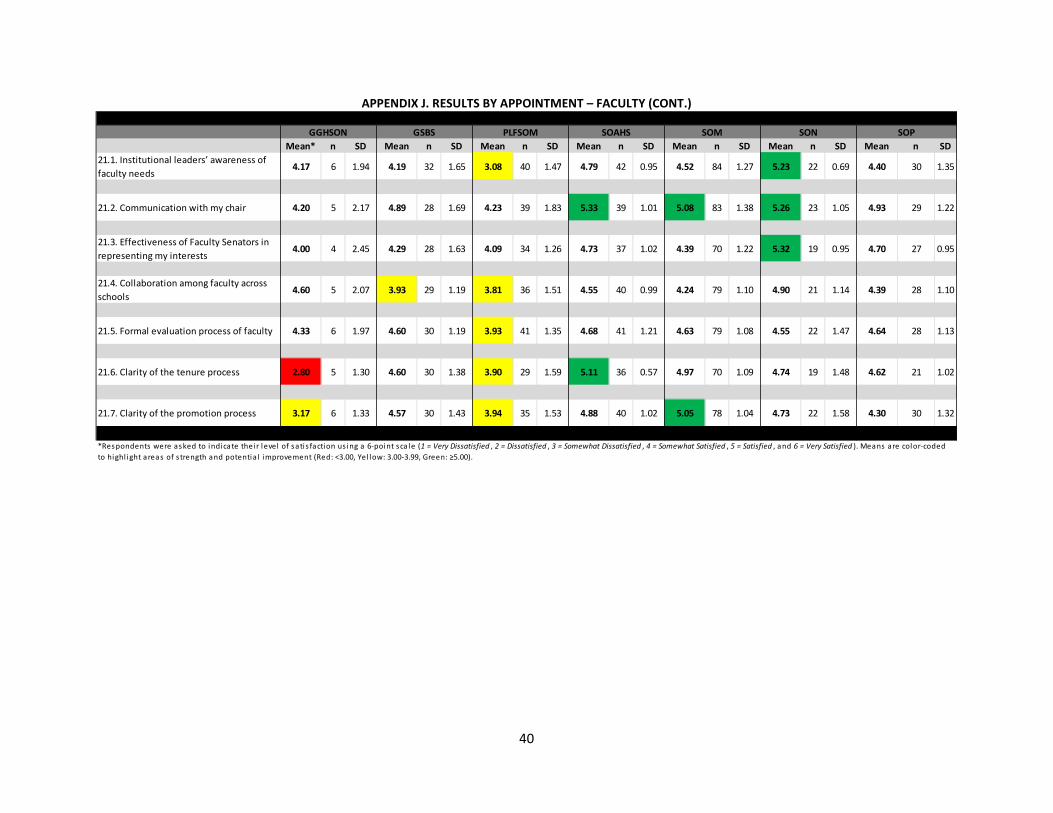
APPENDIX J. RESULTS BY APPOINTMENT – FACULTY (CONT.)
Mean* n SD Mean n SD Mean n SD Mean n SD Mean n SD Mean n SD Mean n SD21.1. Institutional leaders’ awareness of faculty needs
4.17 6 1.94 4.19 32 1.65 3.08 40 1.47 4.79 42 0.95 4.52 84 1.27 5.23 22 0.69 4.40 30 1.35
21.2. Communication with my chair 4.20 5 2.17 4.89 28 1.69 4.23 39 1.83 5.33 39 1.01 5.08 83 1.38 5.26 23 1.05 4.93 29 1.22
21.3. Effectiveness of Faculty Senators in representing my interests
4.00 4 2.45 4.29 28 1.63 4.09 34 1.26 4.73 37 1.02 4.39 70 1.22 5.32 19 0.95 4.70 27 0.95
21.4. Collaboration among faculty across schools
4.60 5 2.07 3.93 29 1.19 3.81 36 1.51 4.55 40 0.99 4.24 79 1.10 4.90 21 1.14 4.39 28 1.10
21.5. Formal evaluation process of faculty 4.33 6 1.97 4.60 30 1.19 3.93 41 1.35 4.68 41 1.21 4.63 79 1.08 4.55 22 1.47 4.64 28 1.13
21.6. Clarity of the tenure process 2.80 5 1.30 4.60 30 1.38 3.90 29 1.59 5.11 36 0.57 4.97 70 1.09 4.74 19 1.48 4.62 21 1.02
21.7. Clarity of the promotion process 3.17 6 1.33 4.57 30 1.43 3.94 35 1.53 4.88 40 1.02 5.05 78 1.04 4.73 22 1.58 4.30 30 1.32
SOAHS SOM SON SOPGSBS PLFSOMGGHSON
*Respondents were asked to indicate their level of sati s faction us ing a 6-point sca le (1 = Very Dissatisfied , 2 = Dissatisfied , 3 = Somewhat Dissatisfied , 4 = Somewhat Satisfied , 5 = Satisfied , and 6 = Very Satisfied ). Means are color-coded to highl ight areas of s trength and potentia l improvement (Red: <3.00, Yel low: 3.00-3.99, Green: ≥5.00).
40

APPENDIX J. RESULTS BY APPOINTMENT – FACULTY (CONT.)
67%
84%
71%
91% 82% 83% 83%
33%
16%
29%
9% 18% 17% 17%
GGHSON(n=6)
GSBS(n=32)
PLFSOM(n=41)
SOAHS(n=43)
SOM(n=88)
SON(n=23)
SOP(n=30)
I do receive regular feedback about my performance.
I don’t receive regular feedback about my performance.
41

APPENDIX J. RESULTS BY APPOINTMENT – FACULTY (CONT.)
Note: Only faculty who do not receive regular feedback from their chairs responded to this question.
0%
10%
20%
30%
40%
50%
60%
Strongly Disagree Disagree Somewhat Disagree Somewhat Agree Agree Strongly Agree
I would prefer to receive regular feedback about my performance by my chair.
GGHSON (n=2) GSBS (n=5) PLFSOM (n=12) SOAHS (n=4) SOM (=16) SON (n=4) SOP (n=5)
42

APPENDIX J. RESULTS BY APPOINTMENT – FACULTY (CONT.)
Note: Only faculty who receive regular feedback from their chairs responded to this question.
0%
10%
20%
30%
40%
50%
60%
70%
80%
Very Dissatisfied Dissatisfied Somewhat DissatisfiedSomewhat Satisfied Satisfied Very Satisfied
Usefulness of feedback about my performance by my chair
GGHSON (n=4) GSBS (n=27) PLFSOM (n=29) SOAHS (n=39) SOM (n=72) SON (n=19) SOP (n=25)
43

APPENDIX K. RESULTS BY AFFILIATION – STAFF
SATISFACTION I - SECTION 1 Mean* n SD Mean n SD Mean n SD Mean n SD Mean n SD1. Overall, how satisfied are you with your position at TTUHSC?
4.75 12 1.48 4.60 5 1.14 4.46 116 1.35 4.70 102 1.18 4.67 12 0.49
2.1. Contribution of my work to the institutional mission
4.83 12 0.94 5.00 5 0.71 4.73 115 1.30 5.16 101 0.81 5.00 12 0.60
2.2. Sense of belonging at TTUHSC 4.58 12 1.44 5.20 5 0.84 3.86 114 1.57 4.96 101 1.04 4.83 12 1.19
2.3. My awareness of the President’s vision for TTUHSC
4.67 12 1.07 5.60 5 0.55 3.99 104 1.38 4.89 98 0.84 4.17 12 1.47
2.4. Commitment of institutional leaders to ongoing improvement
4.50 12 0.67 4.40 5 1.67 3.71 112 1.58 4.52 102 1.04 4.25 12 1.36
2.5. Communication across TTUHSC campuses/CMHC units
4.33 12 0.65 3.80 5 1.30 3.46 112 1.56 4.05 99 1.11 3.50 10 0.85
3.1. Salary/wages for the work I do 4.42 12 1.24 4.00 5 1.22 3.27 114 1.51 3.66 102 1.44 3.50 12 1.45
3.2. Sense of personal safety/security in the work environment
5.42 12 0.67 5.00 5 0.71 4.25 114 1.37 5.02 100 0.98 5.00 12 0.74
3.3. Ability to report complaints without fear of retaliation
4.82 11 1.25 4.75 4 0.96 3.27 113 1.78 4.27 96 1.46 4.00 12 1.04
Graduate School of Biomedical Sciences
*Respondents were asked to indicate their level of satisfaction using a 6-point scale (1 = Very Dissatisfied , 2 = Dissatisfied , 3 = Somewhat Dissatisfied , 4 = Somewhat Satisfied , 5 = Satisfied , and 6 = Very Satisfied ). Means are color-coded to highlight areas of strength and potential improvement (Red: <3.00, Yellow: 3.00-3.99, Green: ≥5.00).
Academic Affairs Communications & Marketing CMHC Finance & Administration
44
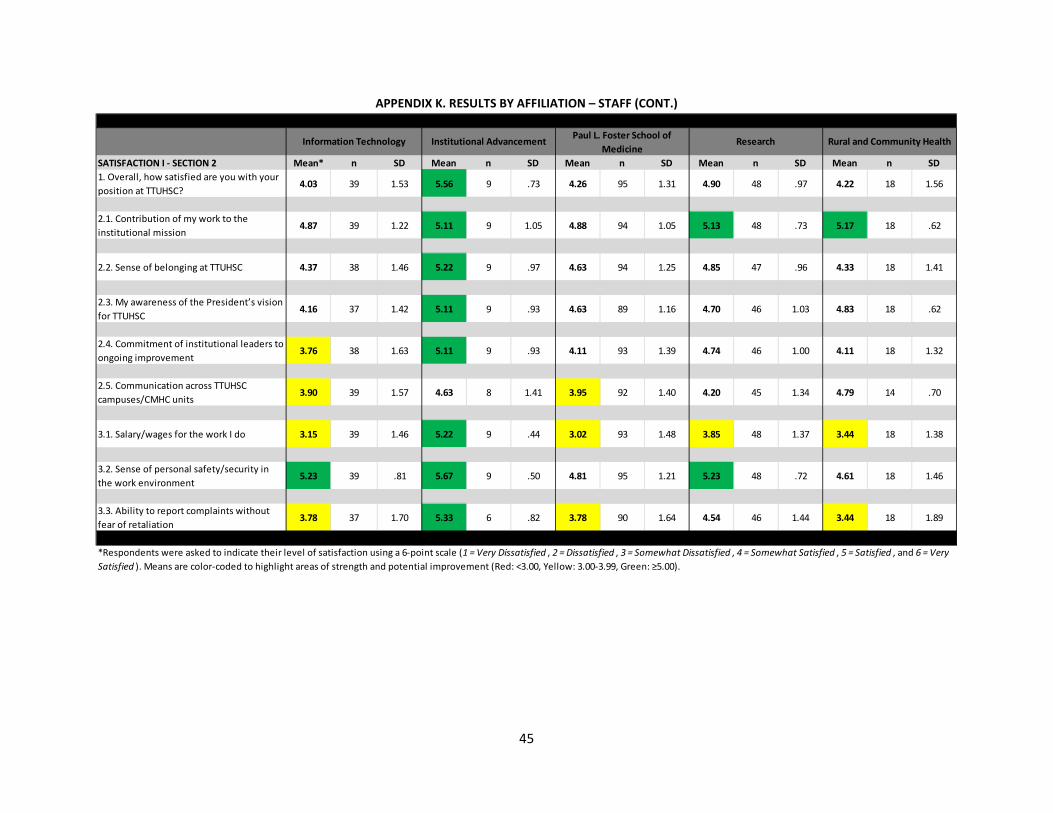
APPENDIX K. RESULTS BY AFFILIATION – STAFF (CONT.)
SATISFACTION I - SECTION 2 Mean* n SD Mean n SD Mean n SD Mean n SD Mean n SD1. Overall, how satisfied are you with your position at TTUHSC?
4.03 39 1.53 5.56 9 .73 4.26 95 1.31 4.90 48 .97 4.22 18 1.56
2.1. Contribution of my work to the institutional mission
4.87 39 1.22 5.11 9 1.05 4.88 94 1.05 5.13 48 .73 5.17 18 .62
2.2. Sense of belonging at TTUHSC 4.37 38 1.46 5.22 9 .97 4.63 94 1.25 4.85 47 .96 4.33 18 1.41
2.3. My awareness of the President’s vision for TTUHSC
4.16 37 1.42 5.11 9 .93 4.63 89 1.16 4.70 46 1.03 4.83 18 .62
2.4. Commitment of institutional leaders to ongoing improvement
3.76 38 1.63 5.11 9 .93 4.11 93 1.39 4.74 46 1.00 4.11 18 1.32
2.5. Communication across TTUHSC campuses/CMHC units
3.90 39 1.57 4.63 8 1.41 3.95 92 1.40 4.20 45 1.34 4.79 14 .70
3.1. Salary/wages for the work I do 3.15 39 1.46 5.22 9 .44 3.02 93 1.48 3.85 48 1.37 3.44 18 1.38
3.2. Sense of personal safety/security in the work environment
5.23 39 .81 5.67 9 .50 4.81 95 1.21 5.23 48 .72 4.61 18 1.46
3.3. Ability to report complaints without fear of retaliation
3.78 37 1.70 5.33 6 .82 3.78 90 1.64 4.54 46 1.44 3.44 18 1.89
Information Technology Institutional Advancement Paul L. Foster School of Medicine
Research Rural and Community Health
*Respondents were asked to indicate their level of satisfaction using a 6-point scale (1 = Very Dissatisfied , 2 = Dissatisfied , 3 = Somewhat Dissatisfied , 4 = Somewhat Satisfied , 5 = Satisfied , and 6 = Very Satisfied ). Means are color-coded to highlight areas of strength and potential improvement (Red: <3.00, Yellow: 3.00-3.99, Green: ≥5.00).
45

APPENDIX K. RESULTS BY AFFILIATION – STAFF (CONT.)
SATISFACTION I - SECTION 3 Mean* n SD Mean n SD Mean n SD Mean n SD Mean n SD1. Overall, how satisfied are you with your position at TTUHSC?
4.82 34 1.09 4.72 194 1.29 4.88 41 1.44 4.83 41 1.22 4.53 236 1.31
2.1. Contribution of my work to the institutional mission
5.06 33 0.97 5.18 192 0.91 5.45 40 0.55 5.15 40 0.98 5.06 236 1.10
2.2. Sense of belonging at TTUHSC 4.81 32 1.09 4.85 193 1.15 5.20 41 1.05 4.56 41 1.57 4.63 231 1.30
2.3. My awareness of the President’s vision for TTUHSC
4.88 33 0.86 4.68 186 1.06 5.29 41 0.60 4.59 39 1.04 4.80 227 0.93
2.4. Commitment of institutional leaders to ongoing improvement
4.47 32 1.19 4.39 191 1.28 5.29 41 0.75 4.40 40 1.28 4.30 232 1.32
2.5. Communication across TTUHSC campuses/CMHC units
4.23 30 1.38 4.15 186 1.29 4.95 41 0.89 4.00 41 1.34 4.14 228 1.33
3.1. Salary/wages for the work I do 3.27 33 1.66 3.60 194 1.49 4.12 41 1.29 3.80 41 1.40 3.40 235 1.47
3.2. Sense of personal safety/security in the work environment
4.73 33 1.15 4.99 193 1.01 5.15 39 0.78 5.03 39 1.04 4.95 235 1.06
3.3. Ability to report complaints without fear of retaliation
3.75 32 1.93 4.10 189 1.51 4.61 41 1.32 4.18 38 1.49 3.93 232 1.57
*Respondents were asked to indicate their level of satisfaction using a 6-point scale (1 = Very Dissatisfied , 2 = Dissatisfied , 3 = Somewhat Dissatisfied , 4 = Somewhat Satisfied , 5 = Satisfied , and 6 = Very Satisfied ). Means are color-coded to highlight areas of strength and potential improvement (Red: <3.00, Yellow: 3.00-3.99, Green: ≥5.00).
School of Allied Health Sciences
School of Medicine School of Nursing School of Pharmacy Texas Tech Physicians
46
APPENDIX K. RESULTS BY AFFILIATION – STAFF (CONT.)
SATISFACTION II - SECTION 1 Mean* n SD Mean n SD Mean n SD Mean n SD Mean n SD7.1. Effectiveness of local Human Resources services
4.58 12 0.90 4.60 5 1.14 3.77 114 1.51 4.45 102 1.44 4.58 12 0.67
7.2. Library resources 4.50 6 0.84 5.00 2 1.41 3.88 57 1.52 4.94 48 0.91 4.60 5 0.55
7.3. Cleanliness/maintenance of my work environment
5.00 12 0.74 5.00 5 0.71 4.07 104 1.49 4.95 100 1.10 5.00 12 0.74
7.4. TTUHSC technology support (IT Solution Center)
3.50 12 1.83 4.80 5 1.10 4.43 106 1.43 4.77 101 0.94 4.33 12 1.15
7.5. Interactive video broadcasting system (i.e., TechLink)
4.00 11 1.95 4.75 4 1.26 4.06 70 1.50 4.98 80 0.67 4.64 11 0.67
7.6. Office/work space 5.00 12 1.21 4.40 5 1.14 4.33 113 1.33 4.76 102 1.10 4.83 12 1.19
7.7. Clerical/administrative assistance 5.00 12 0.85 4.40 5 0.55 4.46 101 1.52 5.00 89 0.95 5.00 12 0.74
7.8. Availability of office equipment and supplies
5.50 12 0.52 5.20 5 0.45 4.24 114 1.45 5.13 101 0.88 5.08 12 0.79
Academic Affairs Communications & Marketing CMHC Finance & Administration Graduate School of Biomedical Sciences
*Respondents were asked to indicate their level of satisfaction using a 6-point scale (1 = Very Dissatisfied , 2 = Dissatisfied , 3 = Somewhat Dissatisfied , 4 = Somewhat Satisfied , 5 = Satisfied , and 6 = Very Satisfied ). Means are color-coded to highlight areas of strength and potential improvement (Red: <3.00, Yellow: 3.00-3.99, Green: ≥5.00).
47

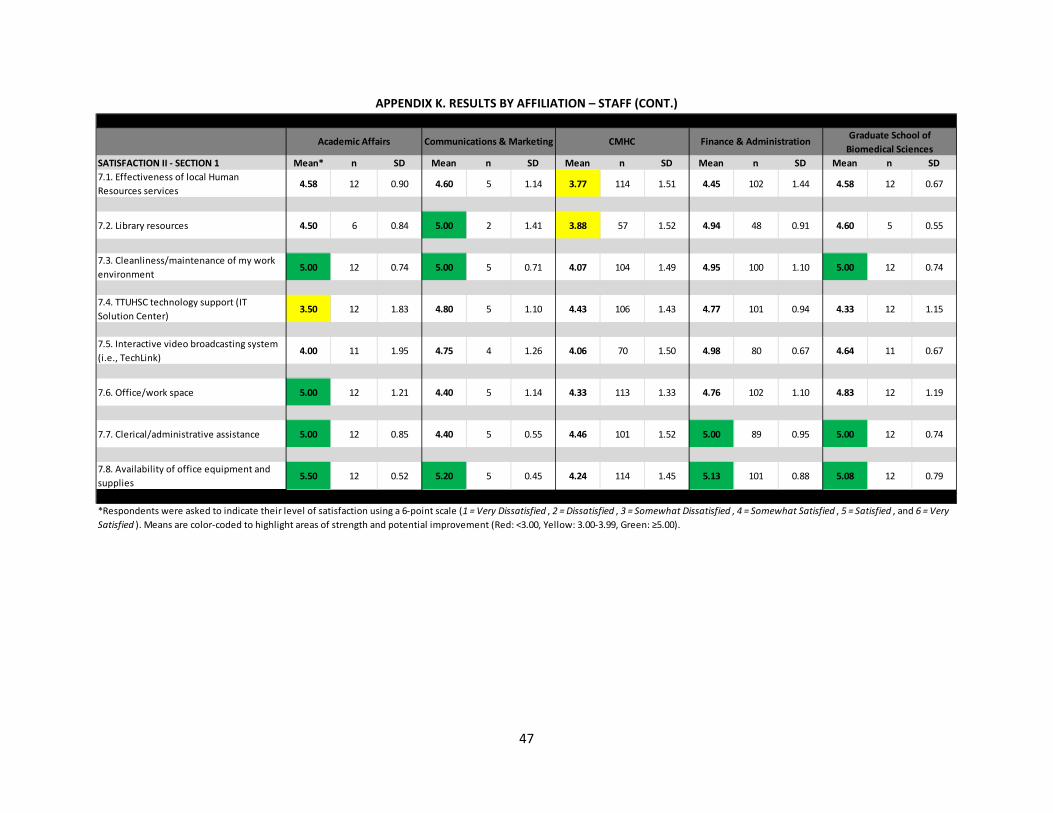
APPENDIX K. RESULTS BY AFFILIATION – STAFF (CONT.)
SATISFACTION II - SECTION 2 Mean* n SD Mean n SD Mean n SD Mean n SD Mean n SD7.1. Effectiveness of local Human Resources services
4.26 38 1.41 4.63 8 .74 4.16 92 1.50 4.52 46 1.13 3.94 18 1.86
7.2. Library resources 5.05 22 .65 6.00 1 .00 4.95 62 .80 4.88 34 .88 5.43 7 .53
7.3. Cleanliness/maintenance of my work environment
4.64 39 1.09 5.67 9 .50 4.85 95 1.16 4.98 48 .91 5.06 18 .87
7.4. TTUHSC technology support (IT Solution Center)
4.87 38 1.07 5.22 9 .44 4.83 95 .95 4.83 48 1.10 4.83 18 1.10
7.5. Interactive video broadcasting system (i.e., TechLink)
4.65 26 1.23 5.25 8 .71 4.67 72 .92 4.78 36 .93 5.40 10 .70
7.6. Office/work space 4.21 39 1.52 5.67 9 .71 4.47 94 1.36 4.90 48 1.06 4.33 18 1.28
7.7. Clerical/administrative assistance 4.26 34 1.58 4.88 8 1.36 4.69 91 1.19 4.98 45 1.14 5.24 17 .66
7.8. Availability of office equipment and supplies
4.45 38 1.35 5.78 9 .44 4.94 95 1.14 5.13 48 .84 5.33 18 .59
*Respondents were asked to indicate their level of satisfaction using a 6-point scale (1 = Very Dissatisfied , 2 = Dissatisfied , 3 = Somewhat Dissatisfied , 4 = Somewhat Satisfied , 5 = Satisfied , and 6 = Very Satisfied ). Means are color-coded to highlight areas of strength and potential improvement (Red: <3.00, Yellow: 3.00-3.99, Green: ≥5.00).
Information Technology Institutional Advancement Paul L. Foster School of Medicine
Research Rural and Community Health
48

APPENDIX K. RESULTS BY AFFILIATION – STAFF (CONT.)
SATISFACTION II - SECTION 3 Mean* n SD Mean n SD Mean n SD Mean n SD Mean n SD7.1. Effectiveness of local Human Resources services
3.81 32 1.53 4.27 186 1.45 4.93 41 1.03 4.35 40 1.29 4.41 226 1.32
7.2. Library resources 4.82 22 0.96 5.09 107 0.78 5.13 31 0.81 4.45 20 1.00 4.82 153 0.90
7.3. Cleanliness/maintenance of my work environment
4.18 33 1.49 4.50 191 1.24 4.59 37 1.26 4.88 41 0.78 4.59 235 1.16
7.4. TTUHSC technology support (IT Solution Center)
4.91 34 1.03 4.39 193 1.25 5.25 40 0.90 4.27 41 1.41 4.86 234 1.15
7.5. Interactive video broadcasting system (i.e., TechLink)
4.85 20 1.27 4.68 142 0.92 4.93 40 1.00 4.06 35 1.26 4.84 163 0.88
7.6. Office/work space 4.55 33 1.18 4.71 194 1.23 4.86 37 1.25 4.80 41 1.14 4.36 236 1.30
7.7. Clerical/administrative assistance 4.67 27 1.24 4.88 172 1.12 5.22 36 0.87 4.81 36 1.04 4.63 215 1.14
7.8. Availability of office equipment and supplies
5.06 33 1.03 4.98 191 1.03 5.34 38 0.67 4.98 41 1.04 4.60 235 1.26
School of Allied Health Sciences
School of Medicine School of Nursing School of Pharmacy Texas Tech Physicians
*Respondents were asked to indicate their level of satisfaction using a 6-point scale (1 = Very Dissatisfied , 2 = Dissatisfied , 3 = Somewhat Dissatisfied , 4 = Somewhat Satisfied , 5 = Satisfied , and 6 = Very Satisfied ). Means are color-coded to highlight areas of strength and potential improvement (Red: <3.00, Yellow: 3.00-3.99, Green: ≥5.00).
49

APPENDIX K. RESULTS BY AFFILIATION – STAFF (CONT.)
IMPORTANCE I - SECTION 1 Mean* n SD Mean n SD Mean n SD Mean n SD Mean n SD5.1. Feeling that your work is valued and appreciated
4.67 12 0.49 3.40 5 1.34 3.97 115 1.20 4.40 102 0.72 4.33 12 0.78
5.2. Receiving formal recognition for your contributions/achievements
3.17 12 1.27 2.60 5 1.14 3.26 116 1.22 3.33 101 1.07 3.83 12 0.83
5.3. Receiving informal recognition for your contributions/achievements
3.50 12 1.31 3.40 5 0.89 3.61 114 1.19 3.80 101 0.89 4.08 12 0.90
5.4. Receiving recognition for individual accomplishments
3.42 12 1.08 3.20 5 1.10 3.38 115 1.23 3.61 102 1.06 3.64 11 0.92
5.5. Receiving recognition for team accomplishments
3.83 12 0.94 3.80 5 0.84 3.71 114 1.29 4.06 102 0.89 4.00 12 0.74
5.6. Being recognized by managers/supervisors
3.92 12 1.00 3.60 5 0.89 3.64 116 1.24 3.97 102 0.91 4.25 12 0.62
5.7. Being recognized by peers and coworkers
3.67 12 0.98 3.80 5 0.84 3.66 116 1.14 3.64 102 0.92 3.92 12 0.67
Academic Affairs Communications & Marketing CMHC Finance & Administration Graduate School of Biomedical Sciences
*Respondents were asked to rate the importance of these i tems us ing a 5-point sca le (1 = Unimportant, 2 = Of Li ttle Importance, 3 = Moderately Important, 4 = Important, and 5 = Very Important). Means are color-coded to highl ight areas of importance (Blue: ≥ 4.00)
50
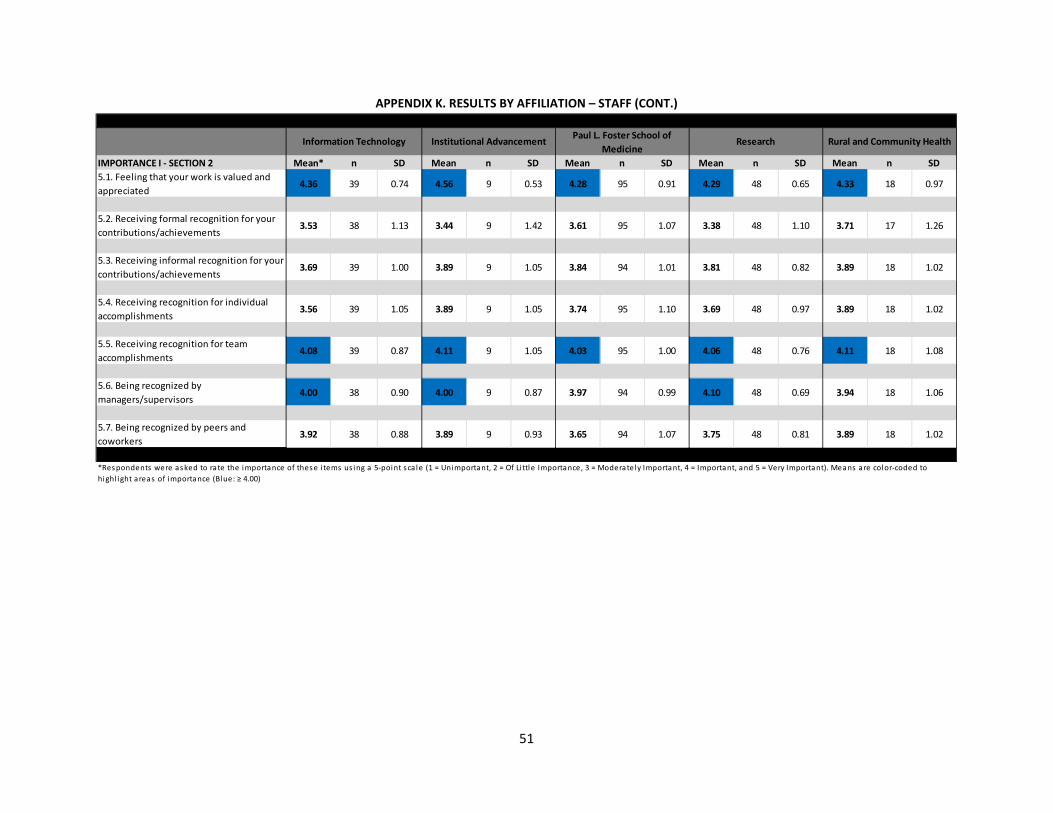
APPENDIX K. RESULTS BY AFFILIATION – STAFF (CONT.)
IMPORTANCE I - SECTION 2 Mean* n SD Mean n SD Mean n SD Mean n SD Mean n SD5.1. Feeling that your work is valued and appreciated
4.36 39 0.74 4.56 9 0.53 4.28 95 0.91 4.29 48 0.65 4.33 18 0.97
5.2. Receiving formal recognition for your contributions/achievements
3.53 38 1.13 3.44 9 1.42 3.61 95 1.07 3.38 48 1.10 3.71 17 1.26
5.3. Receiving informal recognition for your contributions/achievements
3.69 39 1.00 3.89 9 1.05 3.84 94 1.01 3.81 48 0.82 3.89 18 1.02
5.4. Receiving recognition for individual accomplishments
3.56 39 1.05 3.89 9 1.05 3.74 95 1.10 3.69 48 0.97 3.89 18 1.02
5.5. Receiving recognition for team accomplishments
4.08 39 0.87 4.11 9 1.05 4.03 95 1.00 4.06 48 0.76 4.11 18 1.08
5.6. Being recognized by managers/supervisors
4.00 38 0.90 4.00 9 0.87 3.97 94 0.99 4.10 48 0.69 3.94 18 1.06
5.7. Being recognized by peers and coworkers
3.92 38 0.88 3.89 9 0.93 3.65 94 1.07 3.75 48 0.81 3.89 18 1.02
Information Technology Institutional Advancement Paul L. Foster School of Medicine
Research Rural and Community Health
*Respondents were asked to rate the importance of these i tems us ing a 5-point sca le (1 = Unimportant, 2 = Of Li ttle Importance, 3 = Moderately Important, 4 = Important, and 5 = Very Important). Means are color-coded to highl ight areas of importance (Blue: ≥ 4.00)
51
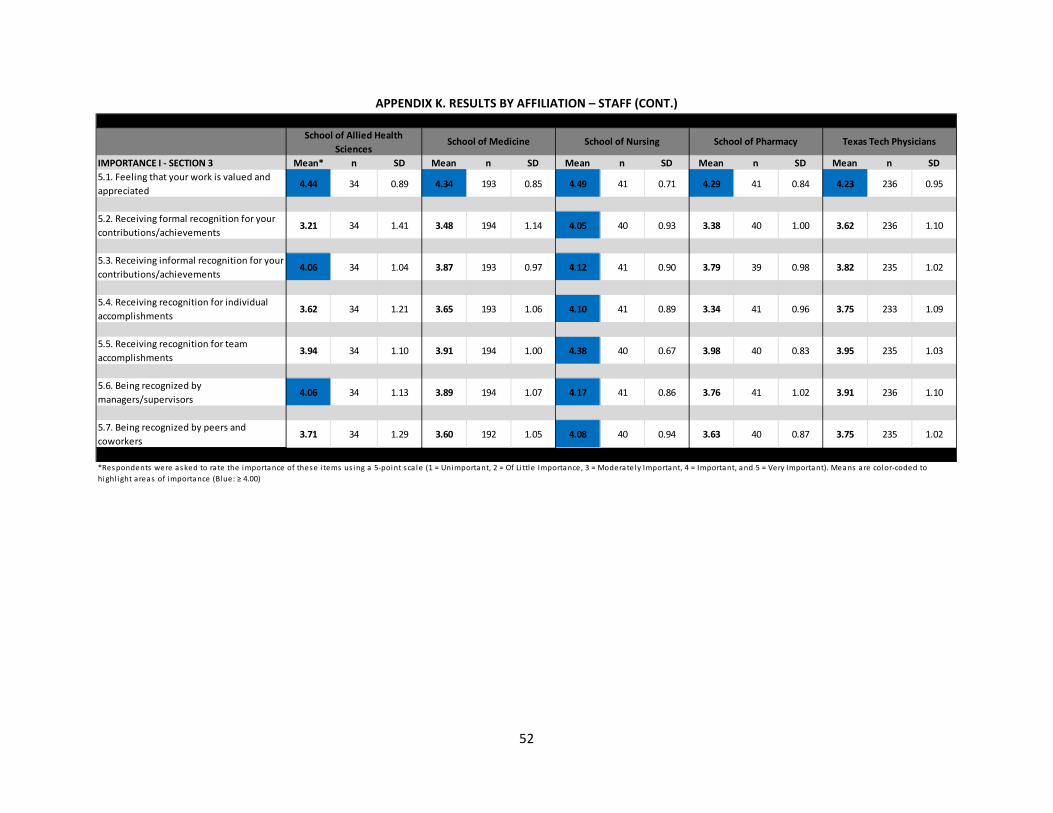
APPENDIX K. RESULTS BY AFFILIATION – STAFF (CONT.)
IMPORTANCE I - SECTION 3 Mean* n SD Mean n SD Mean n SD Mean n SD Mean n SD5.1. Feeling that your work is valued and appreciated
4.44 34 0.89 4.34 193 0.85 4.49 41 0.71 4.29 41 0.84 4.23 236 0.95
5.2. Receiving formal recognition for your contributions/achievements
3.21 34 1.41 3.48 194 1.14 4.05 40 0.93 3.38 40 1.00 3.62 236 1.10
5.3. Receiving informal recognition for your contributions/achievements
4.06 34 1.04 3.87 193 0.97 4.12 41 0.90 3.79 39 0.98 3.82 235 1.02
5.4. Receiving recognition for individual accomplishments
3.62 34 1.21 3.65 193 1.06 4.10 41 0.89 3.34 41 0.96 3.75 233 1.09
5.5. Receiving recognition for team accomplishments
3.94 34 1.10 3.91 194 1.00 4.38 40 0.67 3.98 40 0.83 3.95 235 1.03
5.6. Being recognized by managers/supervisors
4.06 34 1.13 3.89 194 1.07 4.17 41 0.86 3.76 41 1.02 3.91 236 1.10
5.7. Being recognized by peers and coworkers
3.71 34 1.29 3.60 192 1.05 4.08 40 0.94 3.63 40 0.87 3.75 235 1.02
*Respondents were asked to rate the importance of these i tems us ing a 5-point sca le (1 = Unimportant, 2 = Of Li ttle Importance, 3 = Moderately Important, 4 = Important, and 5 = Very Important). Means are color-coded to highl ight areas of importance (Blue: ≥ 4.00)
School of Allied Health Sciences
School of Medicine School of Nursing School of Pharmacy Texas Tech Physicians
52

APPENDIX K. RESULTS BY AFFILIATION – STAFF (CONT.)
2.60 3.80
2.80 3.23
3.33 2.97
3.50 3.15
3.51 2.83
3.00 3.27
3.68 3.14
3.10
Academic Affairs (n=10)Communications & Marketing (n=5)
CMHC (n=103)Finance & Administration (n=95)
Graduate School of Biomedical Sciences (n=9)Information Technology (n=33)
Institutional Advancement (n=6)Paul L. Foster School of Medicine (n=84)
Research (n=43)Rural and Community Health (n=18)
School of Allied Health Sciences (n=31)School of Medicine (n=178)
School of Nursing (n=38)School of Pharmacy (n=37)
Texaxs Tech Physicians (n=215)
Average Levels of Agreement: Current HSC recognition programs are fair to all faculty and staff.
(1=Strongly Diasagree, 5=Strongly Agree)
53

APPENDIX K. RESULTS BY AFFILIATION – STAFF (CONT.)
The following table provides the number of staff members by affiliation who indicated they were unaware of the current recognition programs.
Affiliation n % Academic Affairs 2 17% Communications & Marketing 0 0% Correctional Managed Health Care 13 11% Finance & Administration 7 7% Graduate School of Biomedical Sciences 3 25% Information Technology 6 15% Institutional Advancement 3 33% Paul L. Foster School of Medicine 11 12% Research 5 10% Rural and Community Health 0 0% School of Allied Health Sciences 3 9% School of Medicine 16 8% School of Nursing 3 7% School of Pharmacy 4 10% Texas Tech Physicians 21 9%
54
APPENDIX K. RESULTS BY AFFILIATION – STAFF (CONT.)
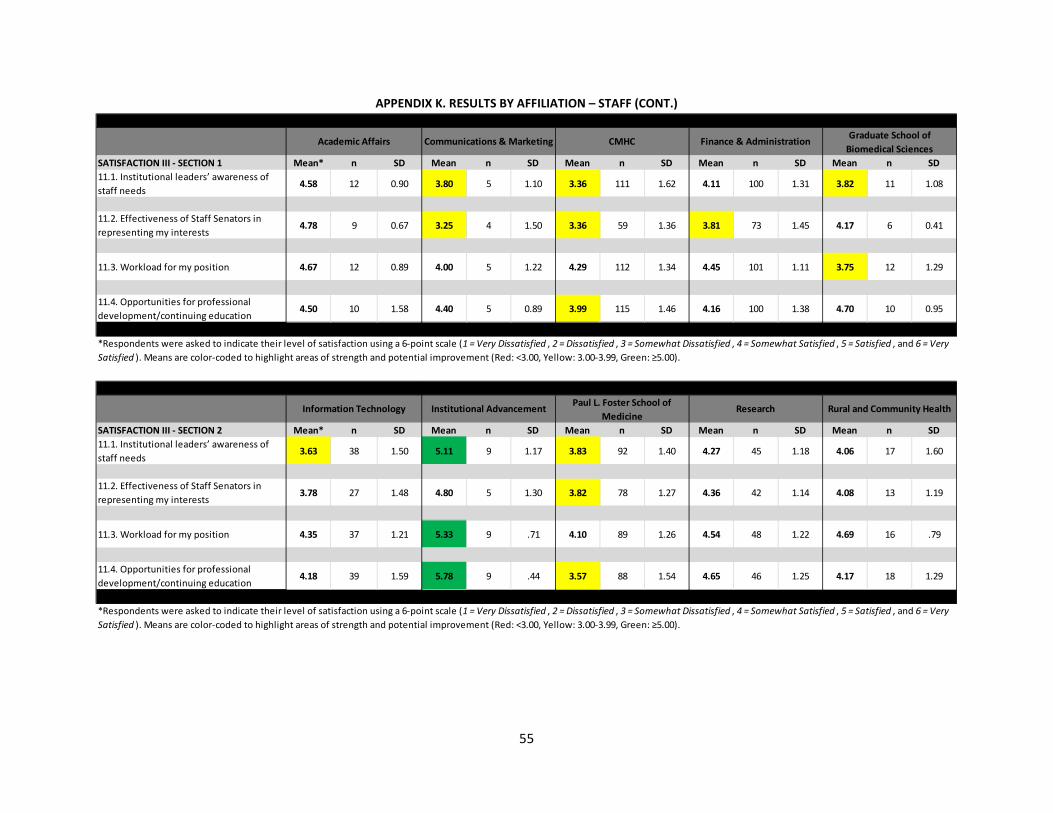
SATISFACTION III - SECTION 1 Mean* n SD Mean n SD Mean n SD Mean n SD Mean n SD11.1. Institutional leaders’ awareness of staff needs
4.58 12 0.90 3.80 5 1.10 3.36 111 1.62 4.11 100 1.31 3.82 11 1.08
11.2. Effectiveness of Staff Senators in representing my interests
4.78 9 0.67 3.25 4 1.50 3.36 59 1.36 3.81 73 1.45 4.17 6 0.41
11.3. Workload for my position 4.67 12 0.89 4.00 5 1.22 4.29 112 1.34 4.45 101 1.11 3.75 12 1.29
11.4. Opportunities for professional development/continuing education
4.50 10 1.58 4.40 5 0.89 3.99 115 1.46 4.16 100 1.38 4.70 10 0.95
Academic Affairs Communications & Marketing CMHC Finance & Administration Graduate School of Biomedical Sciences
*Respondents were asked to indicate their level of satisfaction using a 6-point scale (1 = Very Dissatisfied , 2 = Dissatisfied , 3 = Somewhat Dissatisfied , 4 = Somewhat Satisfied , 5 = Satisfied , and 6 = Very Satisfied ). Means are color-coded to highlight areas of strength and potential improvement (Red: <3.00, Yellow: 3.00-3.99, Green: ≥5.00).
SATISFACTION III - SECTION 2 Mean* n SD Mean n SD Mean n SD Mean n SD Mean n SD11.1. Institutional leaders’ awareness of staff needs
3.63 38 1.50 5.11 9 1.17 3.83 92 1.40 4.27 45 1.18 4.06 17 1.60
11.2. Effectiveness of Staff Senators in representing my interests
3.78 27 1.48 4.80 5 1.30 3.82 78 1.27 4.36 42 1.14 4.08 13 1.19
11.3. Workload for my position 4.35 37 1.21 5.33 9 .71 4.10 89 1.26 4.54 48 1.22 4.69 16 .79
11.4. Opportunities for professional development/continuing education
4.18 39 1.59 5.78 9 .44 3.57 88 1.54 4.65 46 1.25 4.17 18 1.29
Information Technology Institutional Advancement Paul L. Foster School of Medicine
Research Rural and Community Health
*Respondents were asked to indicate their level of satisfaction using a 6-point scale (1 = Very Dissatisfied , 2 = Dissatisfied , 3 = Somewhat Dissatisfied , 4 = Somewhat Satisfied , 5 = Satisfied , and 6 = Very Satisfied ). Means are color-coded to highlight areas of strength and potential improvement (Red: <3.00, Yellow: 3.00-3.99, Green: ≥5.00).
55

APPENDIX K. RESULTS BY AFFILIATION – STAFF (CONT.)
SATISFACTION III - SECTION 3 Mean* n SD Mean n SD Mean n SD Mean n SD Mean n SD11.1. Institutional leaders’ awareness of staff needs
3.88 33 1.52 3.81 188 1.39 4.59 39 1.23 4.03 40 1.35 3.76 229 1.35
11.2. Effectiveness of Staff Senators in representing my interests
4.36 25 1.60 4.01 154 1.27 4.63 35 1.06 4.10 30 1.32 3.94 191 1.30
11.3. Workload for my position 4.18 33 1.53 4.23 192 1.26 4.83 41 1.05 4.59 41 1.05 4.11 229 1.37
11.4. Opportunities for professional development/continuing education
4.03 32 1.56 4.32 187 1.37 4.31 39 1.20 4.26 38 1.33 4.12 226 1.48
*Respondents were asked to indicate their level of satisfaction using a 6-point scale (1 = Very Dissatisfied , 2 = Dissatisfied , 3 = Somewhat Dissatisfied , 4 = Somewhat Satisfied , 5 = Satisfied , and 6 = Very Satisfied ). Means are color-coded to highlight areas of strength and potential improvement (Red: <3.00, Yellow: 3.00-3.99, Green: ≥5.00).
School of Allied Health Sciences
School of Medicine School of Nursing School of Pharmacy Texas Tech Physicians
56

APPENDIX K. RESULTS BY AFFILIATION – STAFF (CONT.)
SATISFACTION IV- SECTION 1 Mean* n SD Mean n SD Mean n SD Mean n SD Mean n SD12.1. Communication within my department
4.83 12 1.85 4.00 5 1.00 4.11 114 1.67 4.29 102 1.45 4.42 12 1.38
12.2. My interactions with my immediate coworkers
5.67 12 0.49 4.60 5 0.89 4.93 116 1.24 5.22 102 0.92 4.83 12 1.03
12.3. My interactions with my immediate supervisor
5.00 12 1.71 4.80 5 1.10 4.59 114 1.62 4.78 101 1.25 4.50 12 1.17
12.4. My understanding of my job responsibilities
5.67 12 0.49 5.20 5 0.84 5.30 115 0.96 5.26 101 0.83 5.17 12 0.83
12.5. My awareness of performance expectations for my position
5.50 12 0.67 4.40 5 1.14 5.12 116 1.19 5.17 101 0.95 5.17 12 0.83
12.6. Clarity of the performance evaluation process
5.27 11 0.79 4.60 5 1.14 4.60 115 1.40 4.98 101 1.01 5.00 11 0.77
12.7. Usefulness of feedback on annual performance evaluation
4.92 12 0.90 4.67 3 0.58 4.02 106 1.72 4.61 95 1.25 5.00 10 0.94
12.8. Opportunities to voice concerns/provide feedback in my area
4.92 12 1.24 4.20 5 0.84 3.74 114 1.75 4.57 100 1.38 4.91 11 0.94
*Respondents were asked to indicate their level of satisfaction using a 6-point scale (1 = Very Dissatisfied , 2 = Dissatisfied , 3 = Somewhat Dissatisfied , 4 = Somewhat Satisfied , 5 = Satisfied , and 6 = Very Satisfied ). Means are color-coded to highlight areas of strength and potential improvement (Red: <3.00, Yellow: 3.00-3.99, Green: ≥5.00).
Academic Affairs Communications & Marketing CMHC Finance & Administration Graduate School of Biomedical Sciences
57

APPENDIX K. RESULTS BY AFFILIATION – STAFF (CONT.)
SATISFACTION IV - SECTION 2 Mean* n SD Mean n SD Mean n SD Mean n SD Mean n SD12.1. Communication within my department
3.72 39 1.70 5.22 9 1.09 4.18 95 1.56 4.60 48 1.44 3.72 18 1.99
12.2. My interactions with my immediate coworkers
5.05 38 .87 5.78 9 .67 4.97 95 1.15 5.26 47 .77 5.00 18 1.37
12.3. My interactions with my immediate supervisor
4.62 39 1.53 5.78 9 .67 4.77 94 1.53 4.98 48 1.21 5.00 18 1.14
12.4. My understanding of my job responsibilities
5.16 38 .95 5.56 9 .73 5.09 95 1.13 5.33 48 .69 5.22 18 .55
12.5. My awareness of performance expectations for my position
4.95 38 1.18 5.56 9 .73 5.04 94 1.19 5.27 48 .87 5.17 18 .99
12.6. Clarity of the performance evaluation process
4.70 37 1.31 5.56 9 .53 4.83 93 1.25 5.10 48 .93 5.06 18 1.06
12.7. Usefulness of feedback on annual performance evaluation
4.13 38 1.56 5.38 8 .92 4.43 89 1.40 4.78 45 1.11 4.88 17 1.11
12.8. Opportunities to voice concerns/provide feedback in my area
4.08 37 1.75 5.44 9 .73 4.22 94 1.60 4.80 46 1.26 4.06 18 1.98
Information Technology Institutional Advancement Paul L. Foster School of Medicine
Research Rural and Community Health
*Respondents were asked to indicate their level of satisfaction using a 6-point scale (1 = Very Dissatisfied , 2 = Dissatisfied , 3 = Somewhat Dissatisfied , 4 = Somewhat Satisfied , 5 = Satisfied , and 6 = Very Satisfied ). Means are color-coded to highlight areas of strength and potential improvement (Red: <3.00, Yellow: 3.00-3.99, Green: ≥5.00).
58
APPENDIX K. RESULTS BY AFFILIATION – STAFF (CONT.)
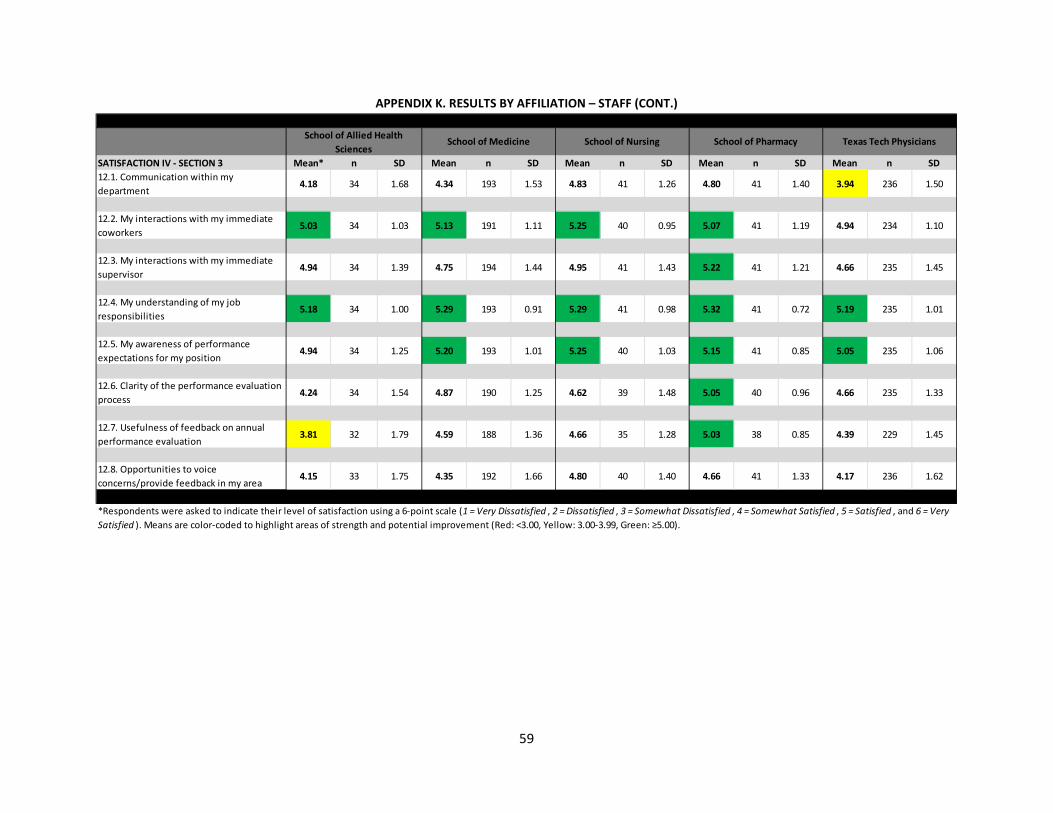
SATISFACTION IV - SECTION 3 Mean* n SD Mean n SD Mean n SD Mean n SD Mean n SD12.1. Communication within my department
4.18 34 1.68 4.34 193 1.53 4.83 41 1.26 4.80 41 1.40 3.94 236 1.50
12.2. My interactions with my immediate coworkers
5.03 34 1.03 5.13 191 1.11 5.25 40 0.95 5.07 41 1.19 4.94 234 1.10
12.3. My interactions with my immediate supervisor
4.94 34 1.39 4.75 194 1.44 4.95 41 1.43 5.22 41 1.21 4.66 235 1.45
12.4. My understanding of my job responsibilities
5.18 34 1.00 5.29 193 0.91 5.29 41 0.98 5.32 41 0.72 5.19 235 1.01
12.5. My awareness of performance expectations for my position
4.94 34 1.25 5.20 193 1.01 5.25 40 1.03 5.15 41 0.85 5.05 235 1.06
12.6. Clarity of the performance evaluation process
4.24 34 1.54 4.87 190 1.25 4.62 39 1.48 5.05 40 0.96 4.66 235 1.33
12.7. Usefulness of feedback on annual performance evaluation
3.81 32 1.79 4.59 188 1.36 4.66 35 1.28 5.03 38 0.85 4.39 229 1.45
12.8. Opportunities to voice concerns/provide feedback in my area
4.15 33 1.75 4.35 192 1.66 4.80 40 1.40 4.66 41 1.33 4.17 236 1.62
*Respondents were asked to indicate their level of satisfaction using a 6-point scale (1 = Very Dissatisfied , 2 = Dissatisfied , 3 = Somewhat Dissatisfied , 4 = Somewhat Satisfied , 5 = Satisfied , and 6 = Very Satisfied ). Means are color-coded to highlight areas of strength and potential improvement (Red: <3.00, Yellow: 3.00-3.99, Green: ≥5.00).
School of Allied Health Sciences
School of Medicine School of Nursing School of Pharmacy Texas Tech Physicians
59
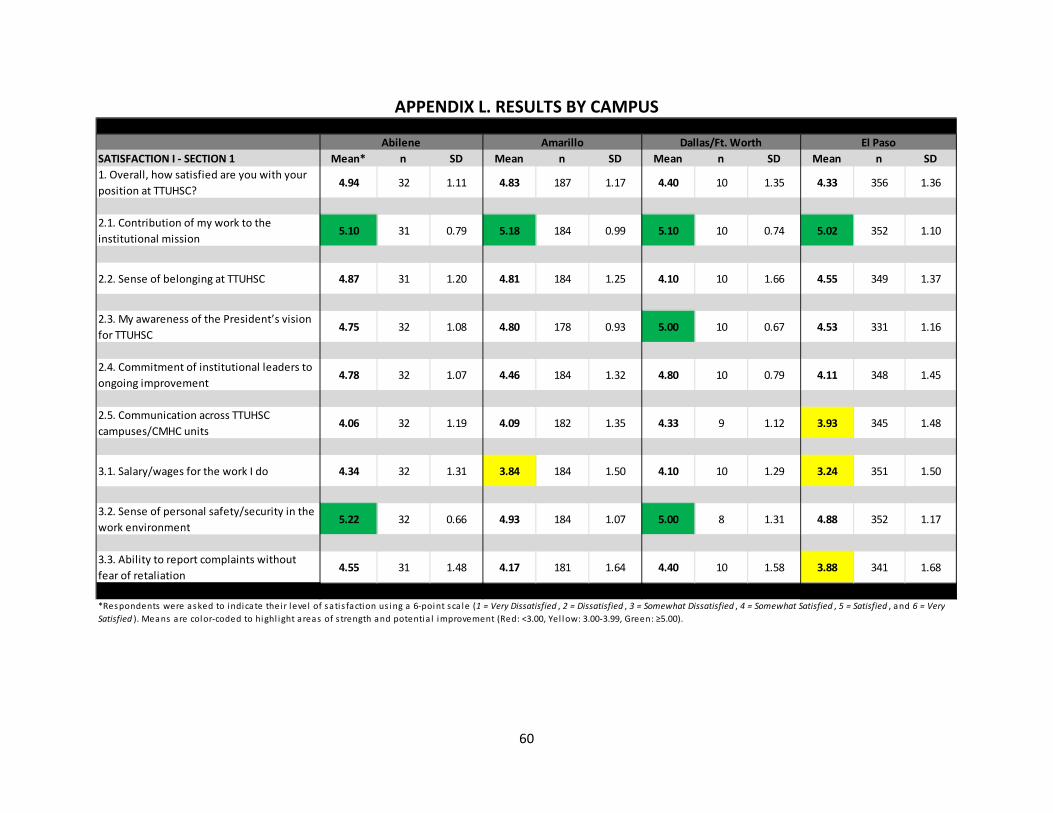
APPENDIX L. RESULTS BY CAMPUS
SATISFACTION I - SECTION 1 Mean* n SD Mean n SD Mean n SD Mean n SD1. Overall, how satisfied are you with your position at TTUHSC?
4.94 32 1.11 4.83 187 1.17 4.40 10 1.35 4.33 356 1.36
2.1. Contribution of my work to the institutional mission
5.10 31 0.79 5.18 184 0.99 5.10 10 0.74 5.02 352 1.10
2.2. Sense of belonging at TTUHSC 4.87 31 1.20 4.81 184 1.25 4.10 10 1.66 4.55 349 1.37
2.3. My awareness of the President’s vision for TTUHSC
4.75 32 1.08 4.80 178 0.93 5.00 10 0.67 4.53 331 1.16
2.4. Commitment of institutional leaders to ongoing improvement
4.78 32 1.07 4.46 184 1.32 4.80 10 0.79 4.11 348 1.45
2.5. Communication across TTUHSC campuses/CMHC units
4.06 32 1.19 4.09 182 1.35 4.33 9 1.12 3.93 345 1.48
3.1. Salary/wages for the work I do 4.34 32 1.31 3.84 184 1.50 4.10 10 1.29 3.24 351 1.50
3.2. Sense of personal safety/security in the work environment
5.22 32 0.66 4.93 184 1.07 5.00 8 1.31 4.88 352 1.17
3.3. Ability to report complaints without fear of retaliation
4.55 31 1.48 4.17 181 1.64 4.40 10 1.58 3.88 341 1.68
*Respondents were asked to indicate their level of sati s faction us ing a 6-point sca le (1 = Very Dissatisfied , 2 = Dissatisfied , 3 = Somewhat Dissatisfied , 4 = Somewhat Satisfied , 5 = Satisfied , and 6 = Very Satisfied ). Means are color-coded to highl ight areas of s trength and potentia l improvement (Red: <3.00, Yel low: 3.00-3.99, Green: ≥5.00).
Abilene Amarillo Dallas/Ft. Worth El Paso
60
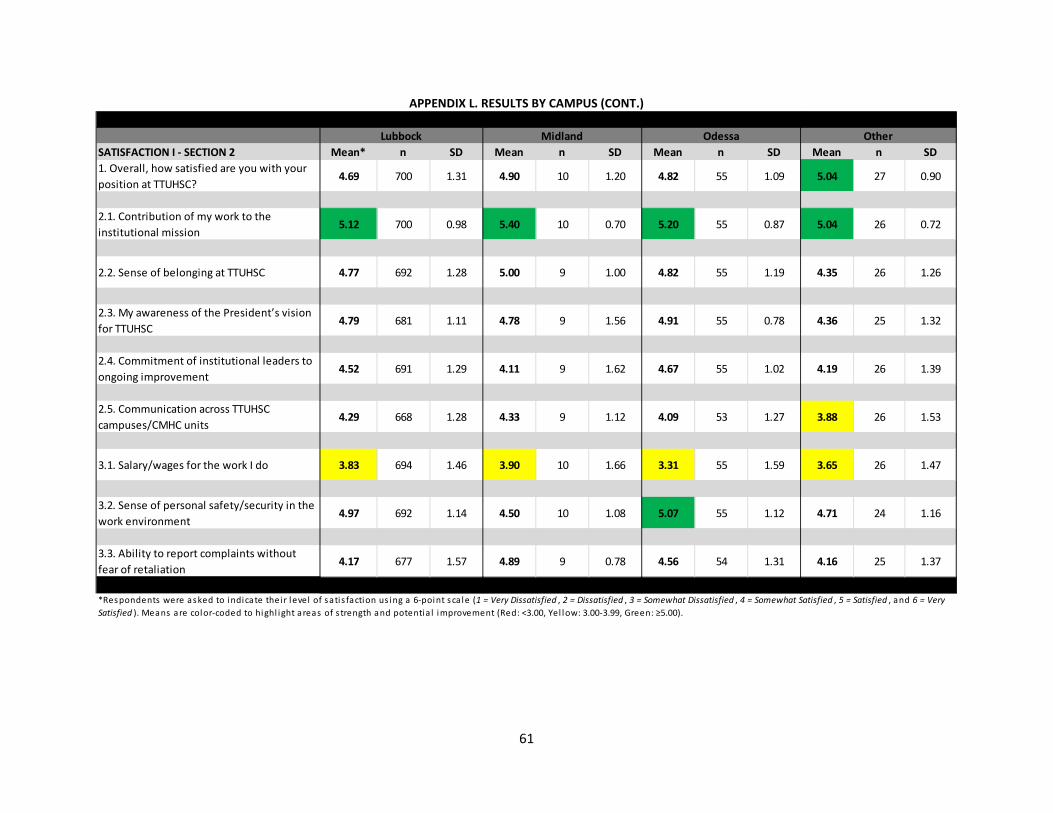
APPENDIX L. RESULTS BY CAMPUS (CONT.)
SATISFACTION I - SECTION 2 Mean* n SD Mean n SD Mean n SD Mean n SD1. Overall, how satisfied are you with your position at TTUHSC?
4.69 700 1.31 4.90 10 1.20 4.82 55 1.09 5.04 27 0.90
2.1. Contribution of my work to the institutional mission
5.12 700 0.98 5.40 10 0.70 5.20 55 0.87 5.04 26 0.72
2.2. Sense of belonging at TTUHSC 4.77 692 1.28 5.00 9 1.00 4.82 55 1.19 4.35 26 1.26
2.3. My awareness of the President’s vision for TTUHSC
4.79 681 1.11 4.78 9 1.56 4.91 55 0.78 4.36 25 1.32
2.4. Commitment of institutional leaders to ongoing improvement
4.52 691 1.29 4.11 9 1.62 4.67 55 1.02 4.19 26 1.39
2.5. Communication across TTUHSC campuses/CMHC units
4.29 668 1.28 4.33 9 1.12 4.09 53 1.27 3.88 26 1.53
3.1. Salary/wages for the work I do 3.83 694 1.46 3.90 10 1.66 3.31 55 1.59 3.65 26 1.47
3.2. Sense of personal safety/security in the work environment
4.97 692 1.14 4.50 10 1.08 5.07 55 1.12 4.71 24 1.16
3.3. Ability to report complaints without fear of retaliation
4.17 677 1.57 4.89 9 0.78 4.56 54 1.31 4.16 25 1.37
*Respondents were asked to indicate their level of sati s faction us ing a 6-point sca le (1 = Very Dissatisfied , 2 = Dissatisfied , 3 = Somewhat Dissatisfied , 4 = Somewhat Satisfied , 5 = Satisfied , and 6 = Very Satisfied ). Means are color-coded to highl ight areas of s trength and potentia l improvement (Red: <3.00, Yel low: 3.00-3.99, Green: ≥5.00).
Lubbock Midland Odessa Other
61

APPENDIX L. RESULTS BY CAMPUS (CONT.)
SATISFACTION II - SECTION 1 Mean* n SD Mean n SD Mean n SD Mean n SD7.1. Effectiveness of local Human Resources services
4.88 32 1.07 4.29 184 1.41 4.00 9 1.22 4.38 344 1.36
7.2. Library resources 4.53 19 1.12 4.96 108 0.84 4.40 10 0.84 4.92 236 0.91
7.3. Cleanliness/maintenance of my work environment
4.97 32 1.06 4.77 181 1.09 3.89 9 1.45 4.89 352 1.08
7.4. TTUHSC technology support (IT Solution Center)
4.78 32 1.29 4.63 184 1.15 4.10 10 1.29 4.75 350 1.19
7.5. Interactive video broadcasting system (i.e., TechLink)
4.52 29 1.18 4.44 139 1.08 3.78 9 1.56 4.75 270 0.97
7.6. Office/work space 4.81 32 1.49 4.81 187 1.12 4.67 9 1.58 4.45 353 1.31
7.7. Clerical/administrative assistance 4.94 32 1.19 4.84 158 1.24 4.80 10 1.23 4.68 335 1.18
7.8. Availability of office equipment and supplies
5.03 32 1.12 4.84 186 1.15 4.89 9 0.78 4.79 355 1.22
*Respondents were asked to indicate their level of sati s faction us ing a 6-point sca le (1 = Very Dissatisfied , 2 = Dissatisfied , 3 = Somewhat Dissatisfied , 4 = Somewhat Satisfied , 5 = Satisfied , and 6 = Very Satisfied ). Means are color-coded to highl ight areas of s trength and potentia l improvement (Red: <3.00, Yel low: 3.00-3.99, Green: ≥5.00).
Abilene Amarillo Dallas/Ft. Worth El Paso
62
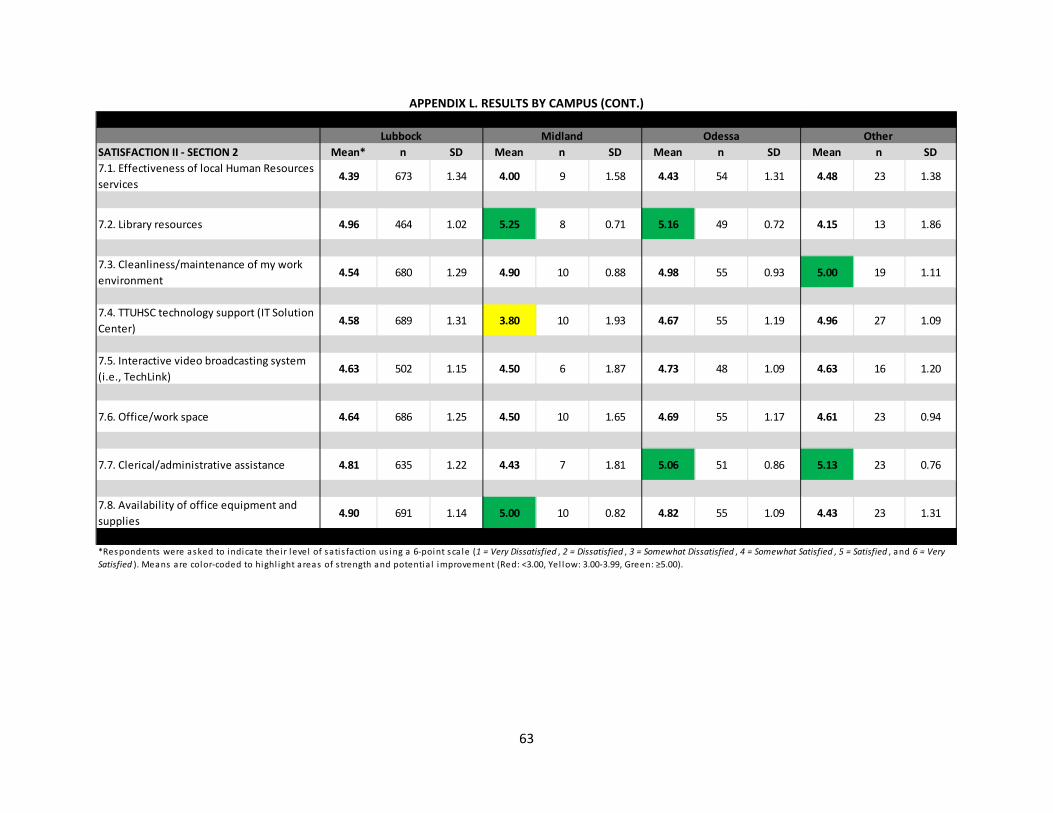
APPENDIX L. RESULTS BY CAMPUS (CONT.)
SATISFACTION II - SECTION 2 Mean* n SD Mean n SD Mean n SD Mean n SD7.1. Effectiveness of local Human Resources services
4.39 673 1.34 4.00 9 1.58 4.43 54 1.31 4.48 23 1.38
7.2. Library resources 4.96 464 1.02 5.25 8 0.71 5.16 49 0.72 4.15 13 1.86
7.3. Cleanliness/maintenance of my work environment
4.54 680 1.29 4.90 10 0.88 4.98 55 0.93 5.00 19 1.11
7.4. TTUHSC technology support (IT Solution Center)
4.58 689 1.31 3.80 10 1.93 4.67 55 1.19 4.96 27 1.09
7.5. Interactive video broadcasting system (i.e., TechLink)
4.63 502 1.15 4.50 6 1.87 4.73 48 1.09 4.63 16 1.20
7.6. Office/work space 4.64 686 1.25 4.50 10 1.65 4.69 55 1.17 4.61 23 0.94
7.7. Clerical/administrative assistance 4.81 635 1.22 4.43 7 1.81 5.06 51 0.86 5.13 23 0.76
7.8. Availability of office equipment and supplies
4.90 691 1.14 5.00 10 0.82 4.82 55 1.09 4.43 23 1.31
Lubbock Midland Odessa Other
*Respondents were asked to indicate their level of sati s faction us ing a 6-point sca le (1 = Very Dissatisfied , 2 = Dissatisfied , 3 = Somewhat Dissatisfied , 4 = Somewhat Satisfied , 5 = Satisfied , and 6 = Very Satisfied ). Means are color-coded to highl ight areas of s trength and potentia l improvement (Red: <3.00, Yel low: 3.00-3.99, Green: ≥5.00).
63

APPENDIX L. RESULTS BY CAMPUS (CONT.)
IMPORTANCE I - SECTION 1 Mean* n SD Mean n SD Mean n SD Mean n SD5.1. Feeling that your work is valued and appreciated
4.41 32 0.80 4.31 187 0.89 4.50 10 0.71 4.24 355 0.96
5.2. Receiving formal recognition for your contributions/achievements
3.63 32 0.98 3.37 187 1.14 3.80 10 1.23 3.63 354 1.12
5.3. Receiving informal recognition for your contributions/achievements
3.75 32 0.92 3.78 187 1.01 4.00 9 0.87 3.84 354 1.04
5.4. Receiving recognition for individual accomplishments
3.84 31 0.90 3.50 186 1.06 3.40 10 1.07 3.73 353 1.12
5.5. Receiving recognition for team accomplishments
4.00 32 0.84 3.90 186 0.98 3.70 10 0.82 3.99 355 1.06
5.6. Being recognized by managers/supervisors
4.03 32 0.86 3.76 187 1.07 3.80 10 1.14 3.98 351 1.04
5.7. Being recognized by peers and coworkers
3.75 32 0.72 3.68 187 1.05 3.56 9 0.88 3.73 353 1.04
*Respondents were asked to rate the importance of these i tems us ing a 5-point sca le (1 = Unimportant, 2 = Of Li ttle Importance, 3 = Moderately Important, 4 = Important, and 5 = Very Important). Means are color-coded to highl ight areas of importance (Blue: ≥ 4.00)
Abilene Amarillo Dallas/Ft. Worth El Paso
64

APPENDIX L. RESULTS BY CAMPUS (CONT.)
IMPORTANCE I - SECTION 2 Mean* n SD Mean n SD Mean n SD Mean n SD5.1. Feeling that your work is valued and appreciated
4.35 697 0.88 4.40 10 0.70 4.24 55 0.88 4.04 27 1.22
5.2. Receiving formal recognition for your contributions/achievements
3.48 694 1.15 3.40 10 1.07 3.59 54 1.06 3.30 27 1.27
5.3. Receiving informal recognition for your contributions/achievements
3.84 695 1.01 3.90 10 0.99 3.87 55 0.77 3.70 27 1.23
5.4. Receiving recognition for individual accomplishments
3.66 694 1.07 3.40 10 1.07 3.76 55 1.04 3.26 27 1.32
5.5. Receiving recognition for team accomplishments
3.96 695 1.02 3.80 10 0.79 3.98 55 0.99 3.89 27 1.28
5.6. Being recognized by managers/supervisors
3.92 697 1.01 3.80 10 1.23 3.93 55 0.96 3.67 27 1.21
5.7. Being recognized by peers and coworkers
3.72 694 1.02 3.20 10 1.32 3.76 55 1.05 3.65 26 1.13
Lubbock Midland Odessa Other
*Respondents were asked to rate the importance of these i tems us ing a 5-point sca le (1 = Unimportant, 2 = Of Li ttle Importance, 3 = Moderately Important, 4 = Important, and 5 = Very Important). Means are color-coded to highl ight areas of importance (Blue: ≥ 4.00)
65

APPENDIX L. RESULTS BY CAMPUS (CONT.)
Abilene Amarillo Dallas/ Ft. Worth El Paso Lubbock Midland Odessa Other
I am unaware of the current recognition programs. 19% 9% 10% 11% 8% 30% 6% 26% (n=6) (n=17) (n=1) (n=38) (n=59) (n=3) (n=3) (n=7)
3.35
3.37
3.22
3.10
3.23
3.57
3.25
3.40
Abilene (n=26)
Amarillo (n=170)
Dallas/Ft. Worth (n=9)
El Paso (n=318)
Lubbock (n=641)
Midland (n=7)
Odessa (n=52)
Other (n=20)
Average Levels of Agreement: Current HSC recognition programs are fair to all faculty and staff.
(1=Strongly Diasagree, 5=Strongly Agree)
66

APPENDIX L. RESULTS BY CAMPUS (CONT.)
STAFF ONLY I - SECTION 1 Mean* n SD Mean n SD Mean n SD Mean n SD11.1. Institutional leaders’ awareness of staff needs
4.32 22 1.25 4.04 162 1.35 4.00 4 1.63 3.86 290 1.41
11.2. Effectiveness of Staff Senators in representing my interests
4.37 19 1.34 4.20 124 1.21 3.00 3 1.00 3.93 239 1.32
11.3. Workload for my position 4.55 22 1.22 4.34 162 1.31 5.00 4 0.82 4.17 290 1.33
11.4. Opportunities for professional development/continuing education
4.05 20 1.47 4.25 162 1.34 3.00 4 1.63 3.81 286 1.56
*Respondents were asked to indicate their level of sati s faction us ing a 6-point sca le (1 = Very Dissatisfied , 2 = Dissatisfied , 3 = Somewhat Dissatisfied , 4 = Somewhat Satisfied , 5 = Satisfied , and 6 = Very Satisfied ). Means are color-coded to highl ight areas of s trength and potentia l improvement (Red: <3.00, Yel low: 3.00-3.99, Green: ≥5.00).
Amarillo Dallas/Ft. Worth El PasoAbilene
STAFF ONLY I - SECTION 2 Mean* n SD Mean n SD Mean n SD Mean n SD11.1. Institutional leaders’ awareness of staff needs
3.83 554 1.41 3.00 3 1.73 3.91 46 1.26 4.00 23 1.41
11.2. Effectiveness of Staff Senators in representing my interests
3.94 429 1.34 2.33 3 1.53 4.23 43 1.00 4.56 9 0.73
11.3. Workload for my position 4.33 556 1.25 4.20 5 1.79 4.35 46 0.99 4.64 25 1.19
11.4. Opportunities for professional development/continuing education
4.28 551 1.39 3.50 4 1.91 4.23 44 1.14 3.88 25 1.83
Lubbock Midland Odessa Other
*Respondents were asked to indicate their level of sati s faction us ing a 6-point sca le (1 = Very Dissatisfied , 2 = Dissatisfied , 3 = Somewhat Dissatisfied , 4 = Somewhat Satisfied , 5 = Satisfied , and 6 = Very Satisfied ). Means are color-coded to highl ight areas of s trength and potentia l improvement (Red: <3.00, Yel low: 3.00-3.99, Green: ≥5.00).
67

APPENDIX L. RESULTS BY CAMPUS (CONT.)
STAFF ONLY II - SECTION 1 Mean* n SD Mean n SD Mean n SD Mean n SD
12.1. Communication within my department 4.95 22 1.09 4.35 164 1.62 4.25 4 2.06 4.07 304 1.60
12.2. My interactions with my immediate coworkers
5.27 22 0.70 5.09 163 1.08 4.00 4 2.16 4.97 302 1.05
12.3. My interactions with my immediate supervisor
5.18 22 0.73 4.75 165 1.56 5.00 4 1.41 4.66 303 1.51
12.4. My understanding of my job responsibilities
5.27 22 0.83 5.23 166 0.91 5.25 4 0.50 5.18 302 1.03
12.5. My awareness of performance expectations for my position
5.32 22 0.72 5.17 166 0.99 4.50 4 1.00 5.02 302 1.12
12.6. Clarity of the performance evaluation process
4.50 20 1.73 4.86 165 1.14 4.50 4 1.00 4.72 298 1.28
12.7. Usefulness of feedback on annual performance evaluation
4.79 19 1.13 4.66 159 1.28 4.50 4 0.58 4.39 287 1.46
12.8. Opportunities to voice concerns/provide feedback in my area
4.82 22 1.37 4.31 164 1.62 3.25 4 1.71 4.16 297 1.67
*Respondents were asked to indicate their level of sati s faction us ing a 6-point sca le (1 = Very Dissatisfied , 2 = Dissatisfied , 3 = Somewhat Dissatisfied , 4 = Somewhat Satisfied , 5 = Satisfied , and 6 = Very Satisfied ). Means are color-coded to highl ight areas of s trength and potentia l improvement (Red: <3.00, Yel low: 3.00-3.99, Green: ≥5.00).
Abilene Amarillo Dallas/Ft. Worth El Paso
68

APPENDIX L. RESULTS BY CAMPUS (CONT.)
STAFF ONLY II - SECTION 2 Mean n SD Mean n SD Mean n SD Mean n SD
12.1. Communication within my department 4.14 570 1.58 4.60 5 1.14 4.45 47 1.33 4.72 25 0.98
12.2. My interactions with my immediate coworkers
5.06 566 1.15 4.00 5 1.73 4.98 46 1.02 5.08 25 0.86
12.3. My interactions with my immediate supervisor
4.73 569 1.44 5.20 5 0.45 4.98 46 1.14 5.12 25 0.93
12.4. My understanding of my job responsibilities
5.26 568 0.92 4.80 5 1.30 5.32 47 0.75 5.44 25 0.71
12.5. My awareness of performance expectations for my position
5.13 568 1.07 4.60 5 1.14 5.19 47 0.74 5.32 25 0.95
12.6. Clarity of the performance evaluation process
4.74 564 1.32 4.40 5 1.34 5.00 46 1.07 4.80 25 1.15
12.7. Usefulness of feedback on annual performance evaluation
4.40 541 1.46 3.40 5 2.30 4.82 44 1.21 4.55 22 1.37
12.8. Opportunities to voice concerns/provide feedback in my area
4.31 564 1.59 3.80 5 1.79 4.74 46 1.39 4.36 25 1.55
Lubbock Midland Odessa Other
*Respondents were asked to indicate their level of sati s faction us ing a 6-point sca le (1 = Very Dissatisfied , 2 = Dissatisfied , 3 = Somewhat Dissatisfied , 4 = Somewhat Satisfied , 5 = Satisfied , and 6 = Very Satisfied ). Means are color-coded to highl ight areas of s trength and potentia l improvement (Red: <3.00, Yel low: 3.00-3.99, Green: ≥5.00).
69
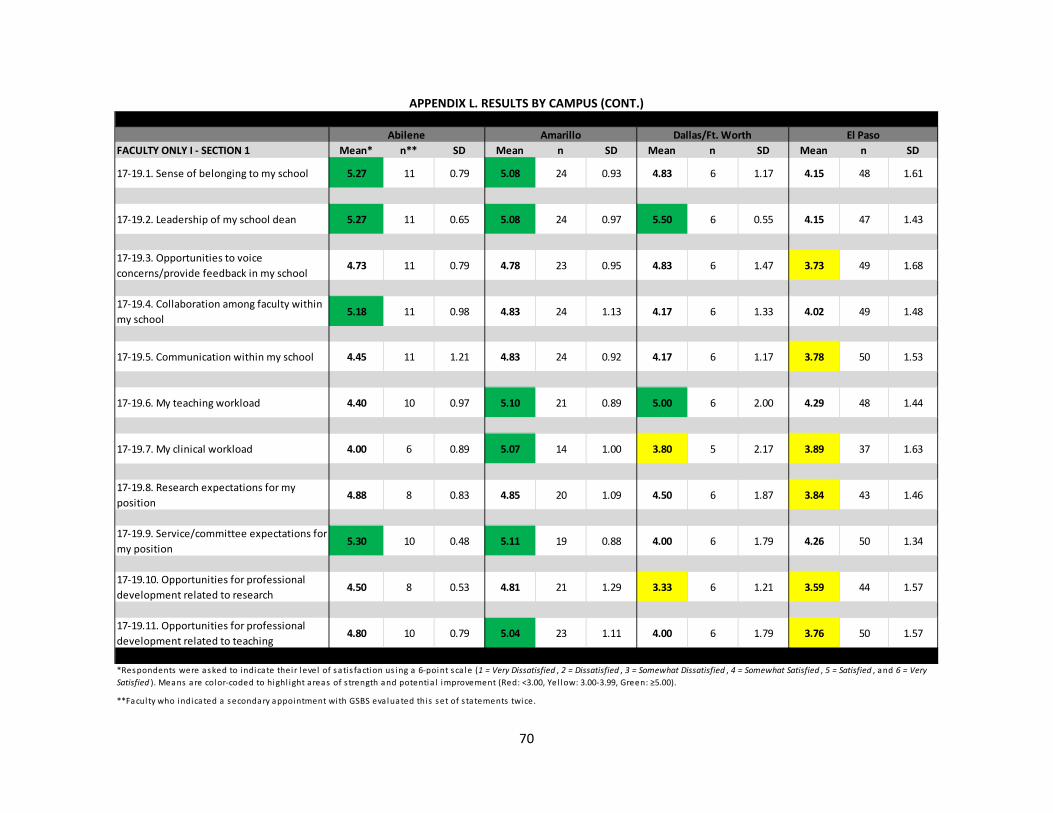
APPENDIX L. RESULTS BY CAMPUS (CONT.)
FACULTY ONLY I - SECTION 1 Mean* n** SD Mean n SD Mean n SD Mean n SD
17-19.1. Sense of belonging to my school 5.27 11 0.79 5.08 24 0.93 4.83 6 1.17 4.15 48 1.61
17-19.2. Leadership of my school dean 5.27 11 0.65 5.08 24 0.97 5.50 6 0.55 4.15 47 1.43
17-19.3. Opportunities to voice concerns/provide feedback in my school
4.73 11 0.79 4.78 23 0.95 4.83 6 1.47 3.73 49 1.68
17-19.4. Collaboration among faculty within my school
5.18 11 0.98 4.83 24 1.13 4.17 6 1.33 4.02 49 1.48
17-19.5. Communication within my school 4.45 11 1.21 4.83 24 0.92 4.17 6 1.17 3.78 50 1.53
17-19.6. My teaching workload 4.40 10 0.97 5.10 21 0.89 5.00 6 2.00 4.29 48 1.44
17-19.7. My clinical workload 4.00 6 0.89 5.07 14 1.00 3.80 5 2.17 3.89 37 1.63
17-19.8. Research expectations for my position
4.88 8 0.83 4.85 20 1.09 4.50 6 1.87 3.84 43 1.46
17-19.9. Service/committee expectations for my position
5.30 10 0.48 5.11 19 0.88 4.00 6 1.79 4.26 50 1.34
17-19.10. Opportunities for professional development related to research
4.50 8 0.53 4.81 21 1.29 3.33 6 1.21 3.59 44 1.57
17-19.11. Opportunities for professional development related to teaching
4.80 10 0.79 5.04 23 1.11 4.00 6 1.79 3.76 50 1.57
*Respondents were asked to indicate their level of sati s faction us ing a 6-point sca le (1 = Very Dissatisfied , 2 = Dissatisfied , 3 = Somewhat Dissatisfied , 4 = Somewhat Satisfied , 5 = Satisfied , and 6 = Very Satisfied ). Means are color-coded to highl ight areas of s trength and potentia l improvement (Red: <3.00, Yel low: 3.00-3.99, Green: ≥5.00).
**Facul ty who indicated a secondary appointment with GSBS eva luated this set of s tatements twice.
Abilene Amarillo Dallas/Ft. Worth El Paso
70

APPENDIX L. RESULTS BY CAMPUS (CONT.)
FACULTY ONLY I - SECTION 2 Mean* n** SD Mean n SD Mean n SD Mean n SD
17-19.1. Sense of belonging to my school 5.17 139 1.11 5.50 4 0.58 4.88 8 0.99 5.00 2 0.00
17-19.2. Leadership of my school dean 5.26 140 1.12 5.75 4 0.50 5.25 8 1.04 5.00 2 0.00
17-19.3. Opportunities to voice concerns/provide feedback in my school
4.95 141 1.17 5.50 4 0.58 5.00 7 1.15 5.00 2 0.00
17-19.4. Collaboration among faculty within my school
4.79 141 1.14 5.25 4 0.96 5.00 8 0.76 5.00 2 0.00
17-19.5. Communication within my school 4.86 141 1.11 5.25 4 0.50 5.00 8 0.76 5.00 2 0.00
17-19.6. My teaching workload 5.16 129 0.79 5.25 4 0.50 5.13 8 0.64 4.50 2 0.71
17-19.7. My clinical workload 4.99 92 0.95 5.40 5 0.55 4.88 8 0.99 4.00 1 0.00
17-19.8. Research expectations for my position
5.06 120 0.95 5.00 3 1.00 4.75 8 1.04 4.50 2 0.71
17-19.9. Service/committee expectations for my position
5.08 133 0.84 5.40 5 0.55 5.00 8 0.93 4.50 2 0.71
17-19.10. Opportunities for professional development related to research
4.74 122 1.25 5.00 3 1.00 4.63 8 1.19 5.50 2 0.71
17-19.11. Opportunities for professional development related to teaching
4.92 131 1.01 5.25 4 0.50 5.00 7 1.15 5.00 2 1.41
Other
*Respondents were asked to indicate their level of sati s faction us ing a 6-point sca le (1 = Very Dissatisfied , 2 = Dissatisfied , 3 = Somewhat Dissatisfied , 4 = Somewhat Satisfied , 5 = Satisfied , and 6 = Very Satisfied ). Means are color-coded to highl ight areas of s trength and potentia l improvement (Red: <3.00, Yel low: 3.00-3.99, Green: ≥5.00).
**Facul ty who indicated a secondary appointment with GSBS eva luated this set of s tatements twice.
Lubbock Midland Odessa
71

APPENDIX L. RESULTS BY CAMPUS (CONT.)
FACULTY ONLY II - SECTION 1 Mean* n SD Mean n SD Mean n SD Mean n SD
20.1. Opportunities for professional development as a clinician/practitioner
5.00 6 0.00 5.08 13 0.86 4.00 6 1.79 3.92 38 1.60
20.2. Laboratory and/or research space 5.33 3 0.58 5.00 8 1.07 3.00 1 0.00 3.89 27 1.63
20.3. My school's technology support 4.90 10 1.20 4.63 19 1.34 4.17 6 1.47 3.43 44 1.73
20.4. Audio-video equipment in classrooms 5.00 9 0.50 4.30 20 1.38 3.40 5 1.82 4.00 40 1.43
20.5. Learning management system (e.g., Sakai/The Hub, Blackboard)
4.44 9 1.13 4.50 18 1.29 3.67 6 1.51 3.97 32 1.64
Abilene
*Respondents were asked to indicate their level of sati s faction us ing a 6-point sca le (1 = Very Dissatisfied , 2 = Dissatisfied , 3 = Somewhat Dissatisfied , 4 = Somewhat Satisfied , 5 = Satisfied , and 6 = Very Satisfied ). Means are color-coded to highl ight areas of s trength and potentia l improvement (Red: <3.00, Yel low: 3.00-3.99, Green: ≥5.00).
Amarillo Dallas/Ft. Worth El Paso
72

APPENDIX L. RESULTS BY CAMPUS (CONT.)
FACULTY ONLY II - SECTION 2 Mean* n SD Mean n SD Mean n SD Mean n SD
20.1. Opportunities for professional development as a clinician/practitioner
5.04 89 0.88 5.40 5 0.55 5.00 8 0.76 3.00 1 0.00
20.2. Laboratory and/or research space 4.83 69 1.12 5.33 3 0.58 3.50 4 0.58 5.00 1 0.00
20.3. My school's technology support 4.77 119 1.32 4.00 5 1.58 4.00 8 1.51 5.50 2 0.71
20.4. Audio-video equipment in classrooms 4.86 110 1.13 4.50 4 1.73 3.83 6 1.47 5.00 2 0.00
20.5. Learning management system (e.g., Sakai/The Hub, Blackboard)
4.60 101 1.06 3.25 4 2.63 3.75 4 1.50 5.00 2 0.00
Lubbock Midland Odessa Other
*Respondents were asked to indicate their level of sati s faction us ing a 6-point sca le (1 = Very Dissatisfied , 2 = Dissatisfied , 3 = Somewhat Dissatisfied , 4 = Somewhat Satisfied , 5 = Satisfied , and 6 = Very Satisfied ). Means are color-coded to highl ight areas of s trength and potentia l improvement (Red: <3.00, Yel low: 3.00-3.99, Green: ≥5.00).
73
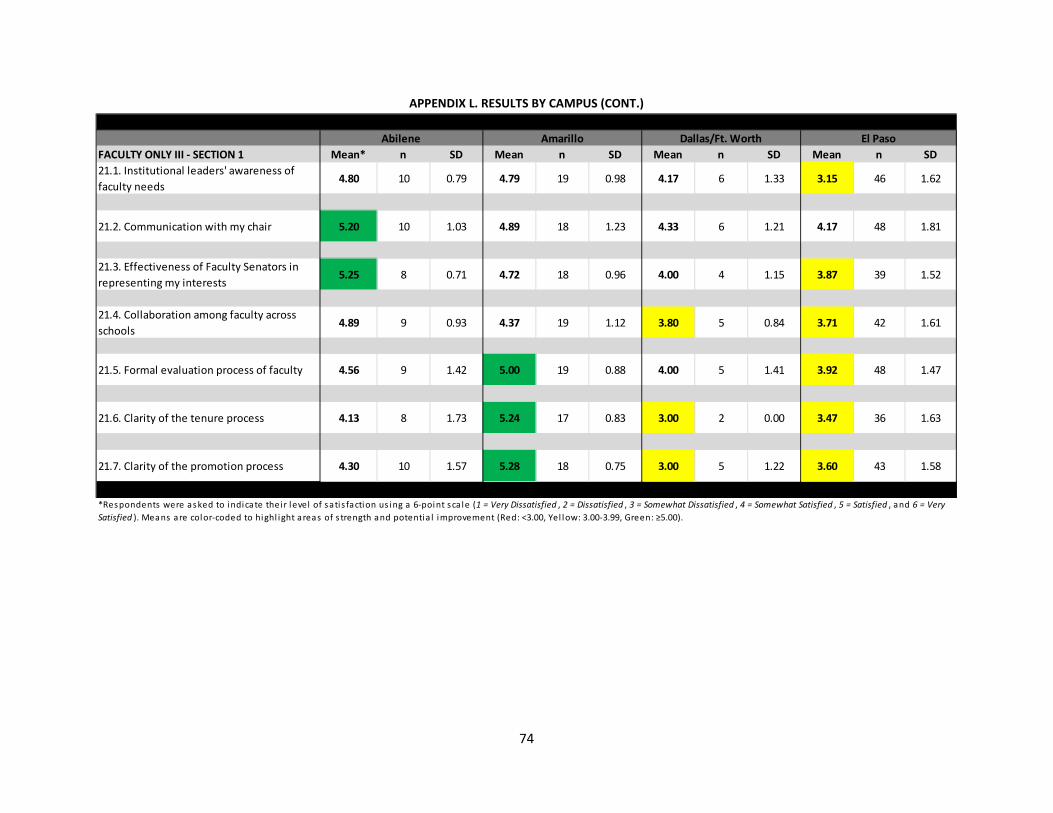
APPENDIX L. RESULTS BY CAMPUS (CONT.)
FACULTY ONLY III - SECTION 1 Mean* n SD Mean n SD Mean n SD Mean n SD21.1. Institutional leaders' awareness of faculty needs
4.80 10 0.79 4.79 19 0.98 4.17 6 1.33 3.15 46 1.62
21.2. Communication with my chair 5.20 10 1.03 4.89 18 1.23 4.33 6 1.21 4.17 48 1.81
21.3. Effectiveness of Faculty Senators in representing my interests
5.25 8 0.71 4.72 18 0.96 4.00 4 1.15 3.87 39 1.52
21.4. Collaboration among faculty across schools
4.89 9 0.93 4.37 19 1.12 3.80 5 0.84 3.71 42 1.61
21.5. Formal evaluation process of faculty 4.56 9 1.42 5.00 19 0.88 4.00 5 1.41 3.92 48 1.47
21.6. Clarity of the tenure process 4.13 8 1.73 5.24 17 0.83 3.00 2 0.00 3.47 36 1.63
21.7. Clarity of the promotion process 4.30 10 1.57 5.28 18 0.75 3.00 5 1.22 3.60 43 1.58
*Respondents were asked to indicate their level of sati s faction us ing a 6-point sca le (1 = Very Dissatisfied , 2 = Dissatisfied , 3 = Somewhat Dissatisfied , 4 = Somewhat Satisfied , 5 = Satisfied , and 6 = Very Satisfied ). Means are color-coded to highl ight areas of s trength and potentia l improvement (Red: <3.00, Yel low: 3.00-3.99, Green: ≥5.00).
Abilene Amarillo Dallas/Ft. Worth El Paso
74
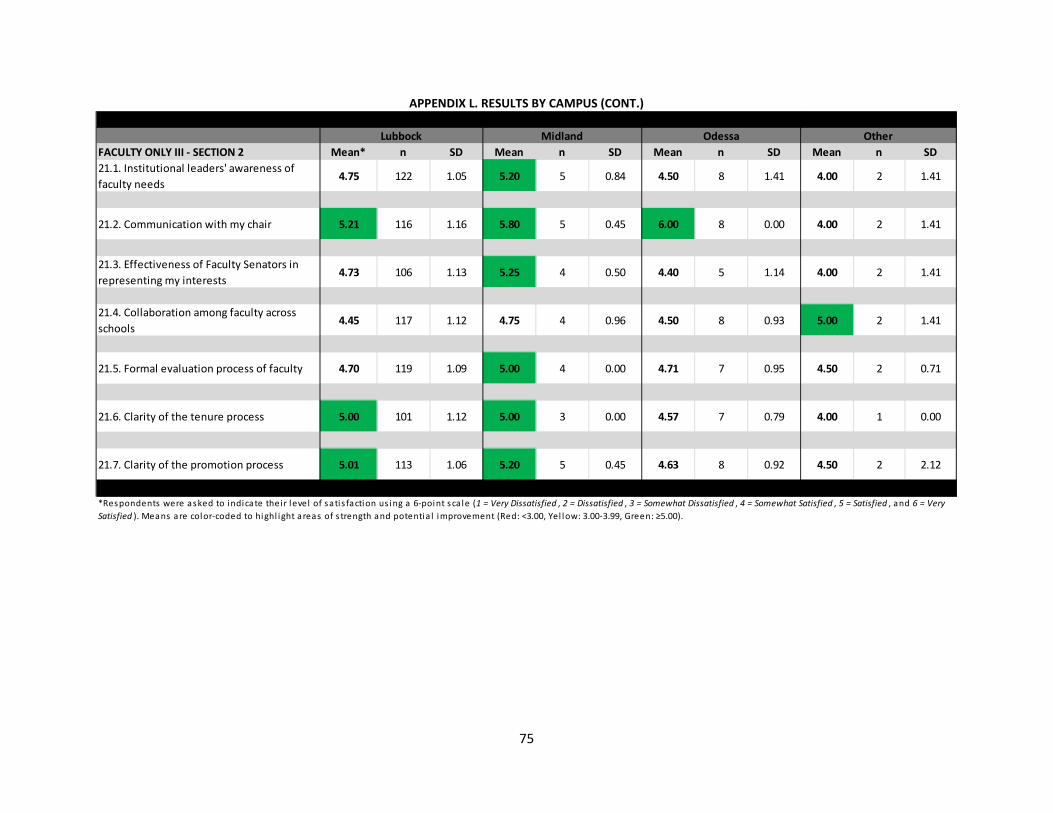
APPENDIX L. RESULTS BY CAMPUS (CONT.)
FACULTY ONLY III - SECTION 2 Mean* n SD Mean n SD Mean n SD Mean n SD21.1. Institutional leaders' awareness of faculty needs
4.75 122 1.05 5.20 5 0.84 4.50 8 1.41 4.00 2 1.41
21.2. Communication with my chair 5.21 116 1.16 5.80 5 0.45 6.00 8 0.00 4.00 2 1.41
21.3. Effectiveness of Faculty Senators in representing my interests
4.73 106 1.13 5.25 4 0.50 4.40 5 1.14 4.00 2 1.41
21.4. Collaboration among faculty across schools
4.45 117 1.12 4.75 4 0.96 4.50 8 0.93 5.00 2 1.41
21.5. Formal evaluation process of faculty 4.70 119 1.09 5.00 4 0.00 4.71 7 0.95 4.50 2 0.71
21.6. Clarity of the tenure process 5.00 101 1.12 5.00 3 0.00 4.57 7 0.79 4.00 1 0.00
21.7. Clarity of the promotion process 5.01 113 1.06 5.20 5 0.45 4.63 8 0.92 4.50 2 2.12
Lubbock Midland Odessa Other
*Respondents were asked to indicate their level of sati s faction us ing a 6-point sca le (1 = Very Dissatisfied , 2 = Dissatisfied , 3 = Somewhat Dissatisfied , 4 = Somewhat Satisfied , 5 = Satisfied , and 6 = Very Satisfied ). Means are color-coded to highl ight areas of s trength and potentia l improvement (Red: <3.00, Yel low: 3.00-3.99, Green: ≥5.00).
75
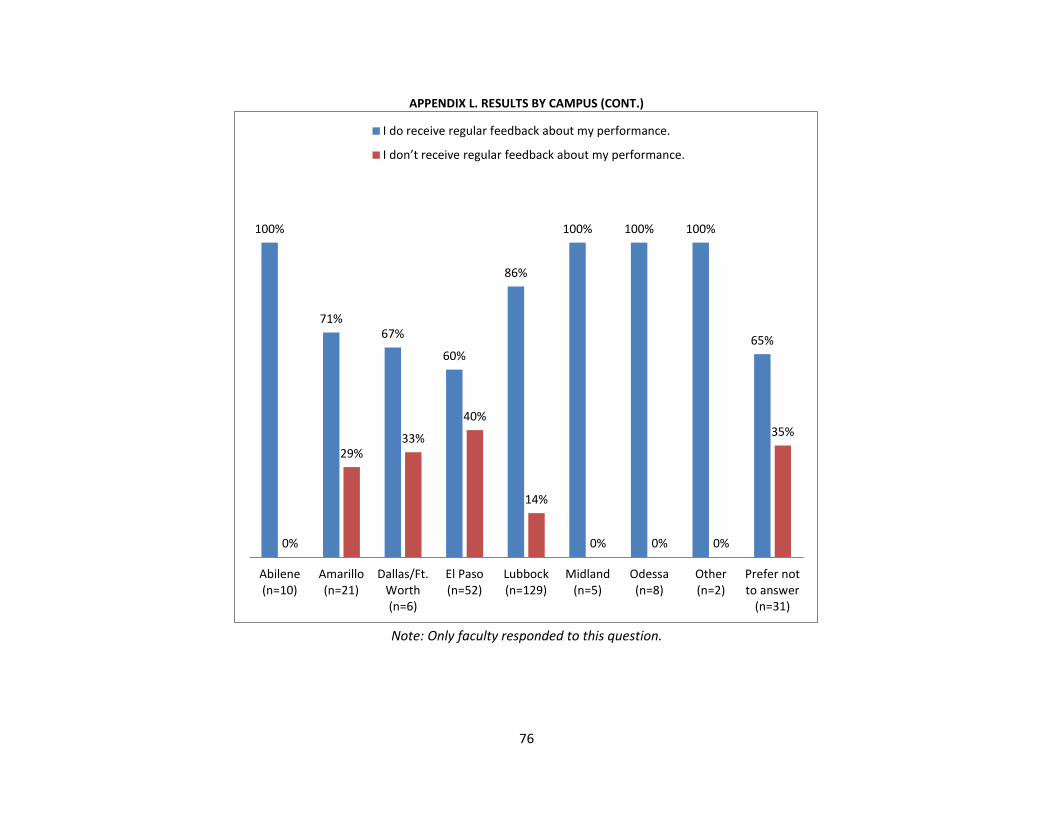
APPENDIX L. RESULTS BY CAMPUS (CONT.)
Note: Only faculty responded to this question.
100%
71% 67%
60%
86%
100% 100% 100%
65%
0%
29% 33%
40%
14%
0% 0% 0%
35%
Abilene(n=10)
Amarillo(n=21)
Dallas/Ft.Worth(n=6)
El Paso(n=52)
Lubbock(n=129)
Midland(n=5)
Odessa(n=8)
Other(n=2)
Prefer notto answer
(n=31)
I do receive regular feedback about my performance.
I don’t receive regular feedback about my performance.
76

APPENDIX L. RESULTS BY CAMPUS (CONT.)
Note: Only faculty who do not receive regular feedback from their chairs responded to this question.
77

APPENDIX L. RESULTS BY CAMPUS (CONT.)
Note: Only faculty who receive regular feedback from their chairs responded to this question.
--END--
Questions about this report can be submitted to the Office of Institutional Planning & Assessment at (806) 743-2918.
78


