Embed Size (px)
Citation preview

Empirically Identifying FactorsRelated to Violence Riskin Corrections
Eugene W. Wang* and Pamela M. Diamond
The authors used structural modeling to predict institu-
tional aggression amongmalementally ill o�enders using
the predictors of anger, antisocial personality style,
current violent o�ense, ethnicity, and impulsivity.
Measures included the Barratt Impulsiveness Scale, the
Buss-Perry Aggression Questionnaire, the Personality
Assessment Inventory, age, ethnicity, current violent
o�ense, victim injury from current o�ense, and institu-
tional incidents of physical and verbal aggression. The
model ®t the data, and accounted for 94% and 87% of the
variance of physical and verbal aggression, respectively.
Results indicated anger, antisocial personality style,
and impulsivity are stronger predictors of institutional
aggression than are ethnicity and current violent o�ense;
anger was the best predictor. Results suggest dynamic
variables such as anger can be targeted for clinical inter-
vention to reduce institutional violence. Copyright# 1999
John Wiley & Sons, Ltd.
Correctional violence is a large problem in modern America. In 1994, there were13,379 sta� assaults and 24,128 inmate assaults in state and federal correctionalfacilities. Of these assaults, 9,425 required medical attention and 2,491 werereferred for prosecution (Camp & Camp, 1995). Correctional sta� are often askedto predict the potential threat of an individual for purposes of classi®cation andprogramming. However, ``informal'' (clinical, subjective, impressionistic) predic-tions have historically been extremely poor in all domains, including aggression(Grove & Meehl, 1996; Monahan & Steadman, 1994; Quinsey, Harris, Rice, &
CCC 0735±3936/99/030377±13$17.50Copyright # 1999 John Wiley & Sons, Ltd.
Behavioral Sciences and the Law
Behav. Sci. Law 17: 377±389 (1999)
* Correspondence to: Eugene W. Wang, Program Evaluation Department, John T. MontfordPsychiatric/Medical Unit, 8602 Peach Street, Lubbock, TX 79404, USA. Email address: [email protected].
Eugene W. Wang, Program Evaluation Department, Correctional Mental Health; Pamela M.Diamond, Program Evaluation Department, Correctional Mental Health Services and Department ofNeuropsychiatry and Behavioral Sciences.This research was based on a doctoral dissertation by Eugene Wang under the supervision of Paul F.
Zelhart at Texas A&MÐCommerce.We would like to acknowledge the contributions of the correctional and clinical sta� of the John T.
Montford Psychiatric/Medical Unit for their support in the collection of the data for this study.Particular thanks go to Warden Chuck Keeton, Medical Director E. Ross Taylor, and Program Directordes Anges Cruser. Special thanks also go to Lue Herrington-Wang, Shaun Long, and Scot Hat®eld fortheir help in the preparation of the manuscript.
Cormier, 1998). For example, Quinsey et al. (1998) concluded that, in theprediction of violent reo�ending, mental health professionals are (or, at least havebeen) functioning only as e�ectively as laypeople. They stated: ``The generalconclusion seems to be that clinical intuition, experience, and training at least astraditionally conceived are not helpful in either prediction or treatment delivery''(p. 72). They went on to add:
Whether clinical judgment can ever improve the predictive accuracy of actuarialprediction schemes seems doubtful . . . the literature . . . does not make onesanguine about the prospect that intuitive clinical judgment can increase theaccuracy of actuarially devised instruments, even when the independentjudgments of clinicians are averaged to increase their reliability (p. 65).
Because of these problems with predictions involving human judgment,``formal'' (actuarial, mechanical, algorithmic) prediction models have been pro-posed as alternatives to informal (i.e., clinical) prediction models for all domains,including violence (Grove & Meehl, 1996; Monahan & Steadman, 1994; Quinseyet al., 1998) Although actuarial models have been better than clinical models inviolence prediction, actuarial models have not fared as well as hoped; it has beenproposed that the ceiling (or ``sound barrier'') for actuarial violence predictionmodels is a correlation of .45 between risk factors and violent behavior (Menzies,Webster, & Sepejak, 1985).
Obviously, actuarial prediction models require accurate identi®cation andmeasurement of the predictors (i.e., risk factors) related to the predictand(i.e., violence) (Grove & Meehl, 1996). However, Monahan and Steadman(1994) proposed that the two biggest methodological weaknesses in the actuarialviolence prediction literature have been impoverished predictor variables (i.e., riskfactors) and weak criterion variables. There have been many risk factors of violenceand aggression proposed in the professional literature. Some of the more recentlyhypothesized risk factors for violence have included: (a) anger (Buss & Perry, 1992;Novaco, 1994), (b) impulsivity (Barratt, 1994), (c) personality disorders (Widiger& Trull, 1994), and (d) substance abuse (Swanson, 1994). Because substance abuseis presumed to be controlled within an institution, we did not address it inthis study.
Novaco (1994) de®ned anger as ``a subjective emotional state, entailing thepresence of physiological arousal and cognitions of antagonism, and is a causaldeterminant of aggression'' (p. 32). Novaco also posited that anger is a ``signi®cantactivator of and has a mutually in¯uenced relationship with aggression . . . The`mutually in¯uenced' idea postulates a bidirectional causality'' (p. 33). Buss andPerry (1992) distinguished between anger, hostility, verbal aggression, andphysical aggression. They de®ned verbal and physical aggression as theinstrumental or motor components of behavior, and involve ``hurting or harmingothers'' (p. 457). They de®ned anger as the a�ective component of behavior(physiological arousal and preparation for aggression), and hostility as the cognitivecomponent of behavior ( feelings of ill will and injustice).
Barratt (1994) de®ned impulsivity as a lack of inhibitory behavioral controls, andproposed that the personality traits of impulsiveness and anger/hostility are relatedto most impulsive aggression. Barratt proposed that impulsivity is ``part of anaction-oriented second-order trait similar to extroversion'' (p. 68). He also noted
378 E. W. Wang and P. M. Diamond
Copyright # 1999 John Wiley & Sons, Ltd. Behav. Sci. Law 17: 377±389 (1999)

that research indicates that impulsivity is not a unitary construct. His previousresearch has shown either three factors (an ideo-motor impulsiveness subtrait, acareful planning subtrait, and a future-oriented coping stability subtrait), or fourfactors (speed of cognitive response, lack of impulse control, adventure-seeking orextroversion, and risk taking). Recently (1994), he proposed on an a priori basisthree subfactors of impulsiveness: motor impulsiveness, cognitive impulsiveness,and nonplanning impulsiveness. Barratt in comparing impulsiveness factors acrosssamples, noted:
. . . it is clear that there are di�erences in personality structure between``normals'' and persons with psychopathology. It is this di�erence in overallstructure that relates to the patient's ``personality system'' and inability tomaitain stability in coping with everyday life events (p. 65).
Some people believe that violence is more likely to stem from relatively enduringpersonality traits (i.e., personality disorders) than from environmental or situa-tional variables (Widiger & Trull, 1994). Violent behavior is a de®ning feature fortwo of the personality disorders (borderline and antisocial) in the Diagnostic andstatistical manual of mental disorders (DSM-IV; American Psychiatric Association,1994). Antagonistic, hostile traits are also evident in eight personality disorders(paranoid, antisocial, borderline, histrionic, narcissistic, negativistic, obsessive±compulsive, and schizotypal).
Actuarial violence prediction research has focused almost exclusively on pre-dicting community violence, typically of individuals (o�enders or psychiatricpatients) following institutionalization. Exemplary examples of these studiesinclude the Violence Risk Appraisal Guide developed by Quinsey et al. (1998),and the ongoing MacArthur Risk Study (Steadman et al., 1998). However, pre-dicting community violence is di�erent from predicting institutional violence, andinstitutional research may have some advantages over community research.Cornell, Peterson, and Richards (1999) noted three advantages to studyinginstitutional violence: (1) ``short-term, institutional predictions may be moreaccurate than longer term predictions'' (p. 108); (2) ``violent behavior can be moreaccurately assessed because violent acts are less likely to go undetected'' (p. 108);and (3) ``environmental variability is constrained in institutions so that the widevariability in circumstances and situational factors that individuals encounter incommunity settings is greatly reduced'' (p. 108).
Methodological problems have plagued the actuarial violence predictionliterature, most notably problems with criterion and predictor variables (Monahan& Steadman, 1994). The criterion for violence in community follow-up studies hasbeen violent reo�ending, although this is a weak criterion because, as Serin andKuriychuk (1994) noted, criminal convictions are a conservative estimate of violentbehavior. In addition to problems with criterion variables, Monahan and Steadman(1994) criticized previous research for employing a ``very narrow range of . . .predictor variables . . . chosen without conscious regard for any theory of violentbehavior'' (p. 7). Predictor variables are typically chosen based on convenience, andare usually static (i.e., historical) as opposed to dynamic (or potentially dynamic)variables (Heilbrun, 1997; Rice & Harris, 1997); see Quinsey et al. (1998) for anexcellent review of static and dynamic predictors. To complicate the picture,predictor variables related to violence di�er in type and number from community to
Violence risk factors 379
Copyright # 1999 John Wiley & Sons, Ltd. Behav. Sci. Law 17: 377±389 (1999)
institutional samples (Steadman & Morrissey, 1982). Despite advances in theviolence prediction literature, Monahan and Steadman (1994) stated:
. . . until clinicians are better informed of the factors that are actuariallyassociated with the criterion of violent behavior, there is little reason to expectthat research on the validity of clinical judgments of risk will produce resultssuperior to those found in the literature of the 1970s (p. 7).
In sum, the actuarial violence prediction literature has focused almostexclusively on community (as opposed to institutional) violence. In addition,criterion variables have been weak, and predictor variables have been narrow andnot linked to theory, leading to less than optimal predictions (Monahan &Steadman, 1994). There is also evidence that risk factors are di�erent forcommunity and institutional violence (Steadman & Morrissey, 1982). Moreoverwith the exception of hallucinations (e.g., Link & Stueve, 1994), little attention hasbeen paid to dynamic variables which can be targeted for clinical intervention.
Using archival data, in the current study we used a robust statistical techniqueÐstructural equation modeling (SEM)Ðto simultaneously assess theoreticallyrelevant risk factors of aggression, including (in alphabetical order) anger,antisocial personality style, current violent o�ense, ethnicity, and impulsivity.We assessed institutional aggression among male mentally ill prisoners, and wedisaggregated aggression into physical aggression and verbal aggression. Becauseof the nature of structural modeling, we used multiple indicators to measureeach factor.
METHOD
Participants
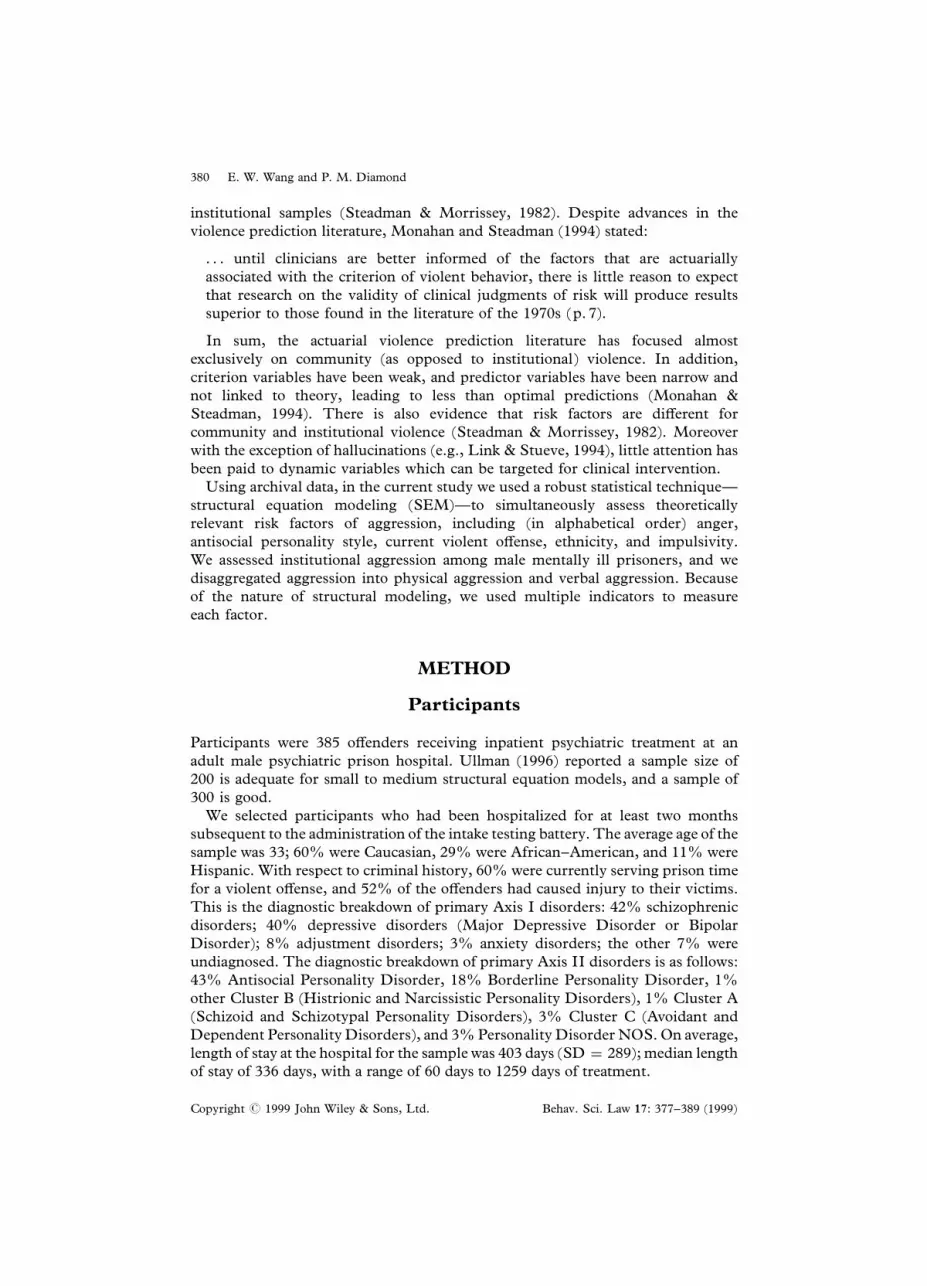
Participants were 385 o�enders receiving inpatient psychiatric treatment at anadult male psychiatric prison hospital. Ullman (1996) reported a sample size of200 is adequate for small to medium structural equation models, and a sample of300 is good.
We selected participants who had been hospitalized for at least two monthssubsequent to the administration of the intake testing battery. The average age of thesample was 33; 60% were Caucasian, 29% were African±American, and 11% wereHispanic. With respect to criminal history, 60% were currently serving prison timefor a violent o�ense, and 52% of the o�enders had caused injury to their victims.This is the diagnostic breakdown of primary Axis I disorders: 42% schizophrenicdisorders; 40% depressive disorders (Major Depressive Disorder or BipolarDisorder); 8% adjustment disorders; 3% anxiety disorders; the other 7% wereundiagnosed. The diagnostic breakdown of primary Axis II disorders is as follows:43% Antisocial Personality Disorder, 18% Borderline Personality Disorder, 1%other Cluster B (Histrionic and Narcissistic Personality Disorders), 1% Cluster A(Schizoid and Schizotypal Personality Disorders), 3% Cluster C (Avoidant andDependent Personality Disorders), and 3%Personality Disorder NOS. On average,length of stay at the hospital for the samplewas 403 days (SD � 289); median lengthof stay of 336 days, with a range of 60 days to 1259 days of treatment.
380 E. W. Wang and P. M. Diamond
Copyright # 1999 John Wiley & Sons, Ltd. Behav. Sci. Law 17: 377±389 (1999)

Materials
Barratt Impulsiveness Scale
The Barratt Impulsiveness Scale-11 (BIS-11; Barratt, 1994) is a 30-item self-reportinventory to measure impulsiveness. Items are rated from 1 (rarely/never) to 4(almost always/always). The BIS-11 has three subscales: Attentional Impulsiveness(eight items), Motor Impulsiveness (10 items), and Non-Planning Impulsiveness(12 items). Barratt (1994) provided evidence as to the factorial structure of the BIS.
Buss±Perry Aggression Questionnaire
The Buss-Perry Aggression Questionnaire (BPAQ; Buss & Perry, 1992) is a29-item self-report scale. Items are rated from 1 (very unlike me) to 5 (very like me).The BPAQ has four subscales: Physical Aggression (nine items), Verbal Aggres-sion (®ve items), Anger (seven items), and Hostility (eight items). Buss and Perryo�ered evidence of the scale's internal consistency and stability over time, as well asevidence of convergent and discriminant validity. Other work we have done(Diamond & Wang, 1999) has supported the BPAQ's convergent, discriminant,and predictive validity with male mentally ill o�enders.
Personality Assessment Inventory
The Personality Assessment Inventory (PAI; Morey, 1991) is a self-administered,objective test of personality and psychopathology. The PAI was developed andstandardized for use in the clinical assessment of adults, and requires a fourth-grade reading level. The PAI contains 344 items answered either 1 (totally false), 2(slightly true), 3 (mainly true), or 4 (very true). The PAI has 22 nonoverlappingscales (grouped into validity, clinical treatment, and interpersonal scales); 10 of thefull scales contain conceptually derived subscales. Raw scores are transformed toT scores with a mean of 50 and a standard deviation of 10.
Procedures
We used archival data for the analyses. As part of a routine clinical intake assess-ment process, the BPAQ, BIS, and PAI were administered within two to three daysof hospital admission. They were administered with standard instructions, andtreatment sta� screened individuals for appropriate reading levels prior to testadministration; individuals who could not read did not complete the battery. To becomparable to the PAI, BIS and BPAQ raw scores from the collected sample wereconverted to T scores (via linear transformation) with a mean of 50 and a standarddeviation of 10. The following criminal history and demographic data weregathered from the criminal justice department's centralized mainframe computer:date of birth (which was used to compute current age), ethnicity, current violento�ense (Y/N), and victim injury from current o�ense (Y/N).
O�cial hospital records of disciplinary o�enses were collected for the twomonths of psychiatric hospitalization following administration of the intakeassessment battery. Aggressive acts were disaggregated into verbal aggression
Violence risk factors 381
Copyright # 1999 John Wiley & Sons, Ltd. Behav. Sci. Law 17: 377±389 (1999)

and physical aggression. The following behaviors were de®ned as physicalaggression: assaulting an o�cer, assaulting an inmate, ®ghting with a weapon,riot and inciting to riot, and sexual abuse. The following acts were de®ned as verbalaggression: threatening an o�cer, threatening an inmate, and vulgar language/gestures. Vulgar language/gestures were categorized as verbal aggression becausethey are behavioral acts, as opposed to emotional states (i.e., anger).
RESULTS
We used structural equation modeling (SEM) for the analyses. SEM is acomprehensive statistical approach used to test relationships among observed andunobserved variables (Hoyle, 1995). A hypothesizedmodel can be tested statisticallyin a simultaneous analysis of the entire system of variables to determine the extentthe hypothesized model ``®ts'' (i.e., is consistent with) the data (Byrne, 1994).Although SEM cannot establish or provide causal relations among variables, it canhelp to reject or retain hypothesized causal theories, or to assess the strengths anddirections of certain a priori hypothesized causal or structural relations within thecontext of a speci®c model. Several aspects of SEM di�erentiate it from othermultivariate procedures. First, it takes a con®rmatory rather than an exploratoryapproach to the data. Second, whereas traditional multivariate procedures areincapable of either assessing or correcting for measurement error, SEM providesexplicit estimates of measurement error. Finally, SEM can incorporate bothobserved and unobserved (i.e., latent) variables (Byrne, 1994). Given its highlydesirable characteristics, SEM has become a popular methodology for non-experimental research, where methods for testing theories are not well developedand ethical considerationsmaymake experimental design unfeasible (Bentler, 1980).
Prior to analyses, we examined the data for missing values, univariate andmultivariate outliers, and univariate and multivariate normality. From the originalsample of 385, we deleted 47 cases due to missing data. Because outliers lead toresult that do not generalize, and can lead to both Type I and Type II errors(Tabachnick & Fidell, 1996), we deleted two cases as univariate outliers and ®ve asmultivariate outliers, leaving 331 cases for analysis; Table 1 reports descriptivestatistics for the ®nal sample. Multivariate normality was assessed in EQS forWindows (Version 5.7) (Bentler, 1998) with Mardia's coe�cient (Mardia, 1970);the normalized estimate of Mardia's coe�cient was 6.76. Mardia's coe�cient is a zscore; thus 6.76 indicates deviation from multivariate normality. Because of thisdeviation, we used robust methods such as the maximum likelihood method, theRobust Comparative Fit Index, and the Satorra±Bentler Scaled w2 goodness-of-®ttest (all described below), because these are less vulnerable to violations ofdistributional assumptions (Ullman, 1996).
Using EQS for Windows (Version 5.7), we examined relationships among ®veindependent and two dependent factors: (1) anger, a latent factor with threeindicators (BPAQ Anger, BPAQ Hostility, and PAI Aggressive Attitude); (2)antisocial personality style, a latent factor with four indicators (current age, PAIAntisocial Behaviors, PAI Egocentricity, and PAI Stimulus-Seeking); (3) currentviolent o�ense, a latent factor with two indicators (current violent o�ense (Y/N)and victim injury from current o�ense (Y/N); (4) ethnicity, a latent factor with two
382 E. W. Wang and P. M. Diamond
Copyright # 1999 John Wiley & Sons, Ltd. Behav. Sci. Law 17: 377±389 (1999)

(dummy) indicators (Caucasian (Y/N) and African±American (Y/N); (5)impulsivity, a latent factor with three indicators (BIS-11 Motor Impulsiveness,BIS-11 Attentional Impulsiveness, and BIS-11 Non-planning Impulsiveness);(6) physical aggression, a latent factor with three indicators (BPAQ PhysicalAggression, PAI Physical Aggression, and number of institutional acts of physicalaggression during the two months following assessment); and (7) verbal aggression,a latent factor with two indicators (BPAQ Verbal Aggression and PAI VerbalAggression). Physical aggression and verbal aggression were the dependentvariables in the structural model.
We estimated the model with the maximum likelihood method; we estimatedmodel ®t using the Satorra±Bentler Scaled w2 goodness-of-®t test (Scaled w2;Satorra & Bentler, 1988), the Comparative Fit Index (CFI; Bentler, 1990), and theRoot Mean Square Error of Estimation (RMSEA; Steiger & Lind, 1980). Ullman(1996) noted that .90 or greater for the CFI indicates acceptable ®t, and anRMSEA value of .08 or less indicates reasonable model ®t (Browne & Cudeck,1993).
Following the recommendations of Byrne (1994), to ensure the measurementof each latent variable was psychometrically sound, we tested the measurementmodel before we estimated the structural model. See Wang (1998) for a detaileddescription of the steps that led to the current measurement model. Themeasurement model ®t the data adequately, Scaled w2 (142, N � 331) � 435.09,p5 .001, robust CFI � .90, RMSEA � .08. See Table 2 for the covariancematrix, and Figure 1 for the diagram of the measurement model.
Then we tested the structural model (with verbal and physical aggression asdependent variables). The structural model accounted for 81% of the variance inthe data (94% of the variance of the physical aggression and 87% of the variance ofverbal aggression), and met RMSEA, but not CFI, criteria for adequate model ®t,Scaled w2 (144, N � 331) � 451.26, p5 .001, robust CFI � .89, RMSEA � .08.Much of the mis®t of the structural model can be attributed more to measurement
Table 1. Descriptive statistics
Variable M SD Skewa Kurtosisb
Age 32.66 8.15 .48 ÿ.29BISÐAttentional 50.00 10.05 ÿ.09 ÿ.27BISÐMotor 50.02 9.94 ÿ.04 ÿ.69BISÐNon-planning 49.99 9.99 ÿ.15 ÿ.22BPAQÐAnger 50.02 10.00 ÿ.08 ÿ.51BPAQÐHostility 50.06 9.98 ÿ.39 ÿ.41BPAQÐPhysical Aggression 50.02 10.02 ÿ.13 ÿ.69BPAQÐVerbal Aggression 49.98 9.91 .03 ÿ.69Hospital Physical Aggression .16 .41 2.46 5.55PAIÐAggressive Attitude 61.27 12.53 ÿ.15 ÿ.62PAIÐPhysical Aggression 68.39 16.25 .26 ÿ.74PAIÐVerbal Aggression 53.24 11.62 .04 ÿ.61PAIÐAntisocial Behavior 69.87 11.14 ÿ.24 ÿ.44PAIÐEgocentricity 62.75 15.25 .52 ÿ.27PAIÐStimulus-Seeking 62.74 14.06 .29 ÿ.63a SE skew � .13.b SE kurtosis � .26.
Violence risk factors 383
Copyright # 1999 John Wiley & Sons, Ltd. Behav. Sci. Law 17: 377±389 (1999)

Table 2. Covariance matrix
Violent Injury Physical Aggression ANT-A ANT-E
Violent .240Injury .208 .250Physical Aggression ÿ.014 ÿ.015 .167ANT-A ÿ.617 ÿ.640 .054 124.160ANT-E ÿ.373 ÿ.469 .517 47.162 232.685ANT-S ÿ.772 ÿ.618 .795 80.006 117.261AGG-A ÿ.278 ÿ.528 .646 64.459 56.618AGG-V ÿ.523 ÿ.634 .418 45.816 61.216AGG-P ÿ.442 ÿ.671 1.122 94.155 116.455BIS-A ÿ.433 ÿ.693 .140 29.513 8.564BIS-M ÿ.509 ÿ.631 .212 43.843 37.096BIS-N ÿ.694 ÿ.730 .384 36.998 18.936BPAQ-PA ÿ.014 ÿ.181 .681 43.769 49.454BPAQ-VA ÿ.009 ÿ.290 .527 29.906 27.724BPAQ-A .030 ÿ.151 .567 40.857 35.718BPAQ-H .080 .037 .140 38.387 17.918Age .693 .719 ÿ.445 ÿ35.603 ÿ16.902White .011 .006 ÿ.020 .916 ÿ.848Black ÿ.011 ÿ.006 .019 ÿ.787 .388
ANT-S AGG-A AGG-V AGG-P BIS-A
ANT-S 196.600AGG-A 86.833 157.115AGG-V 84.201 83.823 134.967AGG-P 152.593 143.154 112.408 263.923BIS-A 36.426 38.168 26.088 52.921 100.964BIS-M 68.976 55.474 40.788 74.503 55.870BIS-N 37.121 31.265 13.666 42.482 49.339BPAQ-PA 66.338 74.706 60.885 111.026 28.876BPAQ-VA 53.776 58.866 58.278 68.428 23.479BPAQ-A 64.949 78.860 54.962 95.852 38.675BPAQ-H 37.244 41.666 18.903 54.110 37.580Age ÿ32.316 ÿ21.043 ÿ16.962 ÿ35.629 ÿ15.185White .517 ÿ.051 .212 .305 .756Black ÿ.624 ÿ.104 ÿ.208 ÿ.625 ÿ.512
BIS-M BIS-N BPAQ-PA BPAQ-VA BPAQ-A
BIS-M 98.835BIS-N 39.606 99.805BPAQ-PA 33.524 19.370 100.328BPAQ-VA 34.231 9.623 61.107 98.259BPAQ-A 49.611 27.598 70.370 61.627 100.023BPAQ-H 34.522 27.187 50.672 42.280 59.656Age ÿ16.985 ÿ18.405 ÿ18.466 ÿ9.854 ÿ14.136White .908 .597 .048 ÿ.066 .478Black ÿ.761 ÿ.457 ÿ.218 ÿ.027 ÿ.615
BPAQ-H Age White Black
BPAQ-H 99.542Age ÿ10.238 66.401White .493 ÿ.211 .240Black ÿ.722 .270 ÿ.176 .207
Note. Following the suggestion of Hoyle and Panter (1995), the variance-covariance matrix isreproduced to three decimal places. All BIS, BPAQ, and PAI scale scores have a mean of 50 and astandard deviation of 10.
ANT-A PAI Antisocial FeaturesÐAntisocial BehaviorANT-E PAI Antisocial FeaturesÐEgocentricityANT-S PAI Antisocial FeaturesÐStimulus-SeekingAGG-A PAI AggressionÐAggressive AttitudeAGG-V PAI AggressionÐVerbal AggressionAGG-P PAI AggressionÐPhysical AggressionBIS-A BISÐAttentionalBIS-M BISÐMotorBIS-N BISÐNon-planningBPAQ-PA BPAQÐPhysical AggressionBPAQ-VA BPAQÐVerbal AggressionBPAQ-A BPAQÐAngerBPAQ-H BPAQÐHostility
384 E. W. Wang and P. M. Diamond
Copyright # 1999 John Wiley & Sons, Ltd. Behav. Sci. Law 17: 377±389 (1999)

error than to mis®t of the model: The relatively small di�erence in the w2 betweenthe structural model (Scaled w2 � 451.26, df � 144) and the measurement model(Scaled w2 � 435.09, df � 142) indicates the structural model was not creating asubstantial additional mis®t to the mis®t produced by the measurement model(Loehlin, 1992). Inspection of the di�erences in the robust CFI and RMSEAindices between the measurement model and structural model show that theRMSEA scores between the two models were equivalent (.08), and the robust CFIchanged from .90 in the measurement model to .89 in the structural model. SeeTable 3 for the measurement and structural models tested (with the null, or inde-pendence, model as a comparison); a diagram of the structural model is presentedin Figure 2.
Figure 1. Measurement model
Table 3. Models tested
Model RMSEA CFI RCFI w2Scaled
w2 df
Independence (null)model
3160.15 171
Measurement model .08 .89 .90 460.26 435.09 142Structural model .08 .89 .89 477.44 451.26 144
Note. RMSEAÐRoot Mean Square Error of EstimationCFIÐComparative Fit IndexRCFIÐRobust Comparative Fit IndexScaledw2ÐSatorra±Bentler Scaled Chi-Square.
Violence risk factors 385
Copyright # 1999 John Wiley & Sons, Ltd. Behav. Sci. Law 17: 377±389 (1999)

With respect to the individual paths, Loehlin (1992) described the interpretationof standardized partial regression coe�cients (or path coe�cients):
Because they are regression coe�cients, they tell us to what extent a change on thevariable at the tail of the arrow [the independent variable] is transmitted to thevariable at the head of the arrow [the dependent variable]. Because they arepartial regression coe�cients, this is the change that occurs with all othervariables in the diagram held constant. Because they are standardized partialregression coe�cients, we are talking about changes measured in standarddeviation units (p. 13, italics in original).
In the ®nal model, anger was strongly related to both verbal aggression (pathcoe�cient � .84) and physical aggression (path coe�cient � .67). Antisocialpersonality style was also strongly related to both verbal aggression (pathcoe�cient � .26) and physical aggression (path coe�cient � .37). Impulsivitywas weakly related to verbal aggression (path coe�cient � ÿ.18), but not related tophysical aggression. Neither ethnicity nor current violent o�ense was directlyrelated to either verbal or physical aggression.
DISCUSSION
The structural model met RMSEA, but not CFI criterion, for adequate model ®t.However, closer inspection of the ®t indices indicates that the structural model ®talmost as well as the measurement model, indicating most of the mis®t in thestructural model was due to measurement error. For example, the RMSEA scores
Figure 2. Structural model
386 E. W. Wang and P. M. Diamond
Copyright # 1999 John Wiley & Sons, Ltd. Behav. Sci. Law 17: 377±389 (1999)
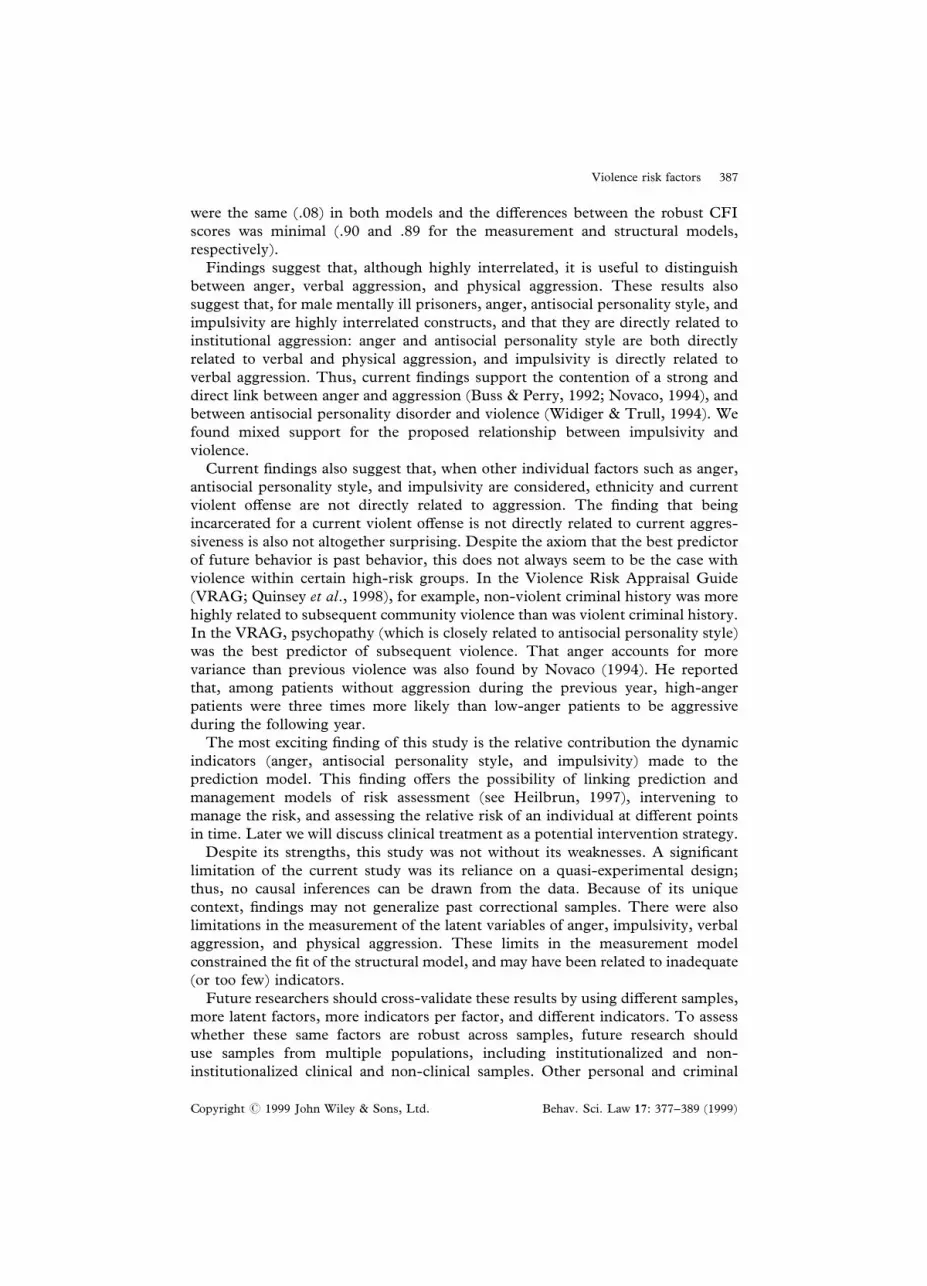
were the same (.08) in both models and the di�erences between the robust CFIscores was minimal (.90 and .89 for the measurement and structural models,respectively).
Findings suggest that, although highly interrelated, it is useful to distinguishbetween anger, verbal aggression, and physical aggression. These results alsosuggest that, for male mentally ill prisoners, anger, antisocial personality style, andimpulsivity are highly interrelated constructs, and that they are directly related toinstitutional aggression: anger and antisocial personality style are both directlyrelated to verbal and physical aggression, and impulsivity is directly related toverbal aggression. Thus, current ®ndings support the contention of a strong anddirect link between anger and aggression (Buss & Perry, 1992; Novaco, 1994), andbetween antisocial personality disorder and violence (Widiger & Trull, 1994). Wefound mixed support for the proposed relationship between impulsivity andviolence.
Current ®ndings also suggest that, when other individual factors such as anger,antisocial personality style, and impulsivity are considered, ethnicity and currentviolent o�ense are not directly related to aggression. The ®nding that beingincarcerated for a current violent o�ense is not directly related to current aggres-siveness is also not altogether surprising. Despite the axiom that the best predictorof future behavior is past behavior, this does not always seem to be the case withviolence within certain high-risk groups. In the Violence Risk Appraisal Guide(VRAG; Quinsey et al., 1998), for example, non-violent criminal history was morehighly related to subsequent community violence than was violent criminal history.In the VRAG, psychopathy (which is closely related to antisocial personality style)was the best predictor of subsequent violence. That anger accounts for morevariance than previous violence was also found by Novaco (1994). He reportedthat, among patients without aggression during the previous year, high-angerpatients were three times more likely than low-anger patients to be aggressiveduring the following year.
The most exciting ®nding of this study is the relative contribution the dynamicindicators (anger, antisocial personality style, and impulsivity) made to theprediction model. This ®nding o�ers the possibility of linking prediction andmanagement models of risk assessment (see Heilbrun, 1997), intervening tomanage the risk, and assessing the relative risk of an individual at di�erent pointsin time. Later we will discuss clinical treatment as a potential intervention strategy.
Despite its strengths, this study was not without its weaknesses. A signi®cantlimitation of the current study was its reliance on a quasi-experimental design;thus, no causal inferences can be drawn from the data. Because of its uniquecontext, ®ndings may not generalize past correctional samples. There were alsolimitations in the measurement of the latent variables of anger, impulsivity, verbalaggression, and physical aggression. These limits in the measurement modelconstrained the ®t of the structural model, and may have been related to inadequate(or too few) indicators.
Future researchers should cross-validate these results by using di�erent samples,more latent factors, more indicators per factor, and di�erent indicators. To assesswhether these same factors are robust across samples, future research shoulduse samples from multiple populations, including institutionalized and non-institutionalized clinical and non-clinical samples. Other personal and criminal
Violence risk factors 387
Copyright # 1999 John Wiley & Sons, Ltd. Behav. Sci. Law 17: 377±389 (1999)

history factors can be added to the model to see whether they account for morevariance. In addition to self-report indicators, future researchers should includeclinician ratings and behavioral measures. Future research should also examinemore complex violence models, including the proposal by Buss and Perry (1992)that anger acts as a ``bridge'' to violence, and Novaco's (1994) model of mutuallyin¯uenced (i.e., bidirectional) e�ects between anger and aggression (anger causesaggression and vice versa).
As mentioned earlier, the ultimate goal of actuarial models of violence risk is toaccurately identify high-risk individuals, and to intervene to manage that risk(Heilbrun, 1997). The ®nding that dynamic (or potentially dynamic) predictorssuch as anger, impulsivity, and antisocial personality style are more highly relatedto aggression than are static predictors such as ethnicity and o�ense history ishighly encouraging, because it o�ers correctional sta� speci®c targets for clinicalintervention strategies. Because anger is so strongly linked to aggression, it appearsnon-instrumental (a�ective or impulsive) aggression can potentially be reduced byaddressing the angry feelings that precipitate it. Because it is axiomatic that``the arousal of anger is cognitively mediated'' (Novaco, 1994, p. 35), cognitive±behavioral techniques (e.g., Beck, 1976) might prove especially helpful. Andalthough treatment with o�enders is not typically as e�ective as treatment withnon-o�enders, e�ectiveness of treatment with o�enders is gaining considerablesupport (Lipsey & Wilson, 1993). Some evidence for the e�cacy of cognitive-behavioral interventions is surfacing in Texas, where a correctional treatmentprogram for violent o�enders is showing dramatic decreases in institutionalaggression (and other non-aggressive behavioral problems) following intensivecognitive±behavioral treatment (Wang, Owens, Long, Diamond, & Smith, 1999).Further research is needed to support this potential link between the predictionand management aspects of risk assessment.
REFERENCES
American Psychiatric Association (1994).Diagnostic and statistical manual of mental disorders (4th ed.).Washington, DC: American Psychiatric Association.
Barratt, E. S. (1994). Impulsiveness and aggression. In J. Monahan & H. J. Steadman (Eds.), Violenceand mental disorder: Developments in risk assessment (pp. 61±80). Chicago: University of Chicago Press.
Beck, A. T. (1976). Cognitive therapy and emotional disorders. New York: International UniversitiesPress.
Bentler, P. M. (1980). Multivariate analysis with latent variables: Causal modeling. Annual Review ofPsychology, 31, 419±456.
Bentler, P. M. (1990). Comparative ®t indexes in structural models. Psychological Bulletin, 107,238±246.
Bentler, P. M. (1998). EQS for Windows (Version 5.7). Los Angeles: BMDP.Browne, M. W., & Cudeck, R. (1993). Alternative ways of assessing model ®t. In K. A. Bollen & J. S.
Long (Eds.), Testing structural equation models (pp. 136±162). Newbury Park, CA: Sage.Buss, A. H., & Perry, M. (1992). The Aggression Questionnaire. Journal of Personality and Social
Psychology, 63(3), 452±459.Byrne, B. M. (1994). Structural equation modeling with EQS and EQS/Windows: Basic concepts,
applications, and programming. Thousand Oaks, CA: Sage.Camp, C. G., & Camp, G. M. (1995). The corrections yearbook: 1995. South Salem, NY: Criminal
Justice Institute.Cornell, D. G., Peterson, C. S., & Richards, H. (1999). Anger as a predictor of aggression among
incarcerated adolescents. Journal of Consulting and Clinical Psychology, 67(1), 108±115.
388 E. W. Wang and P. M. Diamond
Copyright # 1999 John Wiley & Sons, Ltd. Behav. Sci. Law 17: 377±389 (1999)

Diamond, P. M., & Wang, E. W. (1999). Validity of the Buss±Perry Aggression Questionnaire (BPAQ)with mentally ill male prisoners. Manuscript submitted for publication.
Grove, W. M., & Meehl, P. E. (1996). Comparative e�ciency of informal (subjective, impressionistic)and formal (mechanical, algorithmic) prediction procedures: The clinical±statistical controversy.Psychology, Public Policy, and Law, 2, 293±323.
Heilbrun, K. (1997). Prediction versus management models relevant to risk assessment: Theimportance of legal decision-making context. Law and Human Behavior, 24(4), 347±359.
Hoyle, R. H. (1995). The structural equation modeling approach: Basic concepts and fundamentalissues. In R. H. Hoyle (Ed.), Structural equation modeling: Concepts, issues, and applications (pp. 1±15).Thousand Oaks, CA: Sage.
Hoyle, R. H., & Panter, A. T. (1995). Writing about structural equation models. In R. H. Hoyle (Ed.),Structural equation modeling: Concepts, issues, and applications (pp. 158±176). Thousand Oaks, CA:Sage.
Link, B. G., & Stueve, A. (1994). Psychotic symptoms and violent/illegal behavior of mental patientscompared to community controls. In J. Monahan & H. J. Steadman (Eds.),Violence and mental disorder:Developments in risk assessment (pp. 137±160). Chicago: University of Chicago Press.
Lipsey, M. W., & Wilson, D. B. (1993). The e�cacy of psychological, educational, and behavioraltreatment: Con®rmation from meta-analysis. American Psychologist, 48(12), 1181±1209.
Loehlin, J. C. (1992). Latent variable models: An introduction to factor, path, and structural analysis(2nd ed.). Hillsdale, NJ: Erlbaum.
Mardia, K. V. (1970). Measures of multivariate skewness and kurtosis with applications. Biometrika,57, 519±530.
Menzies, R. J., Webster, C. D., & Sepejak, D. S. (1985). Hitting the forensic sound barrier:Predictions of dangerousness in a pre-trial psychiatric clinic. In C. D. Webster, M. H. Ben-Aron, & S. J.Hucker (Eds.), Dangerousness: Probability and prediction, psychiatry and public policy (pp. 115±143).New York: Cambridge University Press.
Monahan, J., & Steadman, H. J. (1994). Toward a rejuvenation of risk assessment research. InJ. Monahan & H. J. Steadman (Eds.), Violence and mental disorder: Developments in risk assessment(pp. 1±17). Chicago: University of Chicago Press.
Morey, L. C. (1991). The Personality Assessment Inventory professional manual. Odessa, FL:Psychological Assessment Resources.
Novaco, R. W. (1994). Anger as a risk factor for violence among the mentally disordered. In J.Monahan & H. J. Steadman (Eds.), Violence and mental disorder: Developments in risk assessment(pp. 21±60). Chicago: University of Chicago Press.
Quinsey, V. L., Harris, G. T., Rice, M. E., & Cormier, C. A. (1998). Violent o�enders: Appraising andmanaging risk. Washington, DC: American Psychological Association.
Rice, M. E., & Harris, G. T. (1997). The treatment of mentally disordered o�enders. Psychology,Public Policy, and Law, 3(1), 126±183.
Satorra, A., & Bentler, P. M. (1988). Scaling corrections for chi square statistics in covariancestructure analysis. American Statistical Association 1988 Proceedings of the Business and EconomicsSections (pp. 308±313). Alexandria, VA: American Statistical Association.
Serin, R. C., & Kuriychuk, M. (1994). Social and cognitive processing de®cits in violent o�enders:Implications for treatment. International Journal of Law and Psychiatry, 17(4), 431±441.
Steadman, H. J., & Morrissey, J. P. (1982). Predicting violent behavior: A note on a cross-validationstudy. Social Forces, 61(2), 475±483.
Steadman, H. J., Mulvey, E. P., Monahan, J., Robbins, P. C., Appelbaum, P. S., Grisso, T., Roth,L. H., & Silver, E. (1998). Violence by people discharged from acute psychiatric inpatient facilities andby others in the same neighborhoods. Archives of General Psychiatry, 55, 393±401.
Steiger, J. H., & Lind, J. C. (1980, May). Statistically-based tests for the number of common factors.Handout for a presentation delivered at the meeting of the Psychometric Society, Iowa City, IA.
Swanson, J. W. (1994). Mental disorder, substance abuse, and community violence: An epidemio-logical approach. In J. Monahan & H. J. Steadman (Eds.), Violence and mental disorder: Developments inrisk assessment (pp. 101±136). Chicago: University of Chicago Press.
Tabachnick, B. G., & Fidell, L. S. (1996). Using multivariate statistics (3rd ed.). New York: HarperCollins.
Ullman, J. B. (1996). Structural equation modeling. In B. G. Tabachnick & L. S. Fidell (Eds.), Usingmultivariate statistics (3rd ed., pp. 709±811). New York: Harper and Row.
Wang, E. W. (1998). The use of structural modeling techniques to predict violence potential in mentally illmale prisoners. Unpublished doctoral dissertation, Texas A&M±Commerce.
Wang, E. W., Owens, R. M., Long, S. A., Diamond, P. M., & Smith, J. L. (1999). The e�cacy ofintensive intervention for aggressive male prisoners. Manuscript submitted for publication.
Widiger, T. A., & Trull, T. J. (1994). Personality disorders and violence. In J. Monahan & H. J.Steadman (Eds.), Violence and mental disorder: Developments in risk assessment (pp. 203±226). Chicago:University of Chicago Press.
Violence risk factors 389
Copyright # 1999 John Wiley & Sons, Ltd. Behav. Sci. Law 17: 377±389 (1999)