Embed Size (px)
Citation preview
Emigration intentions: theory and evidence
Aleksandr Grigoryan∗†
December 25, 2014
Abstract
In this paper we use the household block of the Grigoryan (2014b) model and
derive testable hypotheses on the causal relationship between politico-economic factors
and emigration intentions. The hypotheses are tested for South Caucasian countries,
using household level dataset for the period 2010 − 2013. The response of emigration
intentions to a change in political factors is the largest in transition, thus rejecting
the hypothesis that partial impacts can be ordered according to the level of politico-
economic development. On the other hand, the response of emigration intentions to
economic policy factors is effectively ordered. The paper suggests a novelty for a
non-linear relationship between emigration (intentions) and the stage of development
- political discontent need not be high in transition, but small perturbation in the
development process may create a high resonance in emigration intentions.
Keywords: Emigration intentions; institutions; democracy, South Caucasus; bivariate probit
JEL Codes: F22, J11, O15, R23, R28
Introduction
Since the collapse of the Soviet empire the countries in the South Caucasus, Armenia,
Azerbaijan and Georgia, have permanently experienced large population outflows. Emigra-
∗Assistant Professor at American University of Armenia and Affiliate Fellow at CERGE-EI, Prague. E-mail: [email protected]. This research was supported by the Economics Education and Research Consortium(EERC) and funded by GDN.
†I thank Victor Ginsburgh, James Leitzel, John Earle, Tom Coupe, Irina Murtazashvilli and other par-ticipants in the subsequent EERC workshops 2013-2014.
1
tion rates in these countries are among the highest in the world. On the other hand, these
countries differ in geographic conditions, unresolved territorial/ethnic conflicts and distri-
bution of natural resources, among other factors. As a result, the countries have adopted
different paths of economic development.
This paper studies the differences in emigration patterns in the South Caucasus, using
microeconomic data on emigration intentions, rather than revealed actions. In the theory
part, we expand the household block of the model by Grigoryan (2014b) and formally derive
the hypothesis that emigration intentions are more sensitive to the political institutions,
departed from democracy. Socio-economic conditions are commonly perceived endogenous
to political institutions1, implying that emigration intentions should be more responsive to
these conditions in such polities either. According to our novelty, the divergence of political
institutions in the South Caucasus region explains the differences in emigration patterns
directly and indirectly, the latter through economic institutions.
The theoretical model involves distinct variables for political and economic factors, one
for each. These are policy instruments appropriated by households, when deciding on pro-
duction/consumption schemes and migration policies. When building the empirical model,
we think of these variables as aggregate indicators, reflecting respondents’ perceptions on
government policies. Nothing impedes to add an unobservable component to the policy in-
struments in the theoretical model, in order to differentiate the true policy from its perceived
component, but the issue is beyond the informational asymmetry. We claim that adverse per-
ceptions on the economic development path may affect the attitude towards existing political
institutions. From the first insight, the fundamental causality from political institutions to
their economic counterparts is reversed, but in the dynamic context current distribution of
resources updates the future political states (Acemoglu et al. (2004)). Households had been
sufficiently diverse in taking advantages from the emerging politico-economic institutions in
the early phase of independence, and current material conditions and the attitude towards
1Acemoglu et al. (2004) provides an evidence-rich narrative for economic institutions endogenous topolitical institutions.
2
public policies much depend on their status in the past.
As a starting point for the empirical analysis, we want to make sure that the South Cau-
casian countries can be effectively ranked based on the democracy measure, we construct
from the Caucasus Barometer dataset and name as ”political index”. This is important,
because we derive the central hypothesis from the theoretical model by Grigoryan (2014b),
in which countries are ranked based on the extent of power concentration, the latter aimed to
capture the level of democracy in a country. Our political index is a (perceived) democracy
measure, constructed in two steps. In the first step we select political factors and construct
an index with equal weights. Then, in the second step, we regress that measure on the
indicators of economic conditions, and the unexplained part is taken as the political index2.
The underlying argument is that economic conditions are predetermined and resulted from
the past political institutions. On the other hand, economic factors to which emigration
intentions respond are captured by perception based variables, reflecting respondents’ atti-
tude towards current economic policies. That is, we also distinguish two sets of economic
variables, which are mutually exclusive: (i) variables measuring households’ economic condi-
tions and (ii) variables measuring respondents’ attitude towards current economic policies.
The second set of variables are the economic factors, which constitute the economic index.
In the empirical part of the study, we estimate how willingness to emigrate responds to
variation of the political and economic indexes, given the ”stock” of democracy as a country
specific factor. Formally we test the following hypotheses:
Hypothesis 1: The response of emigration intentions to the deterioration of perceived
democracy measure (political index) is stronger in a less democratic country;
Hypothesis 2: The response of emigration intentions to the deterioration of perceived
economic policy measure (economic index) is stronger in a less democratic country.
In the context of the South Caucasus, these hypotheses rank the three countries in terms
2In our regressions we control for economic conditions, which allows to directly use the measure con-structed in the first step as a political index.
3
of the described responses, using the commonly perceived rank of the countries with respect
to the ”stock” of democracy.
Our key findings are as follows. The country rank with respect to political index is not
preserved - Armenia, the second in the democracy stock, reports the largest response of
emigration intentions to political index. That is, Hypothesis 1 is essentially rejected. We
motivate discussion in a separate section and explain this finding in that if a country is
sufficiently close to either of political regimes, such as Azerbaijan to autocracy and Georgia
to democracy, emigration intentions respond to the changes in political institutions weakly,
since the chance to have a shift in the direction of convergence is very low. Armenia is
centered between the two absorbing states and may experience a shift in politico-economic
discourse through a relatively small change in political institutions. This explains why the
response of young households in Armenia to the small perturbation of political institutions
is the largest. For old households, the involvement of the government in production plays
a crucial role in shaping responses of emigration intentions, and we argue that it is very
large in Armenia, bringing equivalent distortions to the private business. In Azerbaijan, the
government is largely involved in the oil sector, and people in the private sector (rather than
oil) may not feel the burden that strongly. Contrary to Hypothesis 1, one cannot reject
Hypothesis 2.
In our model we control for migrant social capital by the variable ”close friend abroad”,
which is significant for young households3. The variable serves as an indicator for migra-
tion costs, since close friend(s) outside may mitigate the process of migration and thereby
amplify intentions. In the theoretical model (Grigoryan (2014b)), remittances play a crucial
role in explaining migration related decisions. The head of household, if emigrated, sends
remittances based on altruistic motives4. Nevertheless, in the empirical model remittances
3The concept is developed by Garip (2008), using Portes (1998) approach. Grigoryan (2014a) discussesthe role of migrant social capital for Armenian emigrants. Gerber and Torosyan (2013) finds an evidence forGeorgia that social capital formation can be a distinct motive for sending remittances.
4Migration and remittances are interconnected through a large set of channels. In the literature, twotypes of motives are distinguished when explaining the existence and nature of remittances: altruism (Lucasand Stark (1985), Stark and Lucas (1988), van Dalen et al. (2005), among others), and self-interest. Inthe second category there are numerous motives assuming implicit contractual relationship. These motives
4
do not have a significant impact on emigration intentions once we control for the migrant
social capital.
There are only few papers studying the pattern of migration and consequences in South
Caucasus. Our study has a direct link to Gugushvili (2011), which uses the same dataset
as we do, but for the period 2009 - 2010. In the empirical part of the study, we test
Gugushvili’s (2011) hypothesis ”...that in an authoritative political system (Azerbaijan),
political attitudes are more important for emigration than economic conditions, while in
more troubled economic environment (Georgia) material conditions are more decisive for
emigration than political attitudes”. Using more robust methodology, our findings fail to
support Gugushvili (2011) hypothesis, both for economic conditions and for the policy index
reflecting the quality of economic institutions.
Dermendzhieva (2011) provides an empirical evidence on labor migration for the countries
in South Caucasus. The author uses household level dataset for South Caucasus for the years
2004 - 2005 and finds no evidence of emigration among skilled workers. Still, individuals
with higher education are more likely to emigrate to high income OECD countries from
the capital of Armenia. Despite the lack of clear evidence on brain drain, Dermendzhieva
(2011) does not exclude the possibility of brain drain from the region towards high-income
OECD countries. In our study, years of education and work experience are not significant
in explaining emigration intentions. Respondents’ low selectivity on these skill measures
suggests that emigration intentions are uniformly spread over the population, known as
mass migration. Grigoryan (2014a) finds the same evidence for Armenia.
Our paper contributes to the relatively scarce emigration literature in several aspects.
To our knowledge, previous works (Taylor (1999), van Dalen et al. (2005), van Dalen and
Henkens (2008)) estimate emigration intentions having no structural relationship behind.
We derive our testable hypotheses from a micro-founded model, which allows to properly
are bequest (Hoddinott (1994), Bernheim et al. (1985)), accumulation of wealth (Dustmann and Kirchkamp(2001)), covering educational costs of household members (Lucas and Stark (1985)), allocating risks (Starkand Lucas (1988), Cox et al. (1998)), exchange of various types of services with remittances (Rapoport andDocquier (2005)). As a distinct motive, remittances may encourage or discourage migration from a homecountry (e.g. Stark (1995), van Dalen et al. (2005), Rapoport and Docquier (1998)).
5
interpret empirical results. Importantly, we distinguish two types of households in an econ-
omy, young and old. Young households embed future development of institutions in their
decisions, and the dynamic structure of the environment makes current economic and po-
litical reforms relevant for reshaping emigration intentions for the young. We suggest a
novelty for a non-linear relationship between emigration (intentions) and the stage of the
politico-economic development. Political discontent need not be high in transition, but small
perturbation in the development process may create high resonance in emigration intentions,
as it can be perceived as a shift in the political discourse from moving towards democracy
to autocracy (or vice versa).
The paper has the following structure. We construct the theoretical model in Section
1. Section 2 describes the empirical strategy and the dataset. The econometric model and
the followed discussion are in Section 4 and Section 5, respectively. The main findings are
summarized in Conclusion.
1 Theoretical model
We derive our hypotheses from the household block of the Grigoryan (2014b) model.
In order to save space, some of the analytical results will be readily used from Grigoryan
(2014b).
The economy is populated by infinitely lived dynasties, each of them represented by a
distinct household in a given period. Each household, distinguished by its head, lives two
periods. By the end of the second period, a household bequeathes a fraction of earnings to
a successor household, to be headed by the offspring. At the first period of household’s life,
the head decides whether to emigrate or stay at home. At the beginning of the first period,
the household’s head either (i) emigrates and sends remittances within that period or (ii)
continues to live in the home country. At the beginning of the second period of household’s
life, the head, if migrated in the first period, decides on the location of family unification,
between home and host. If the head stays at home in the first period, she/he can still
6
emigrate, but with the entire family5.
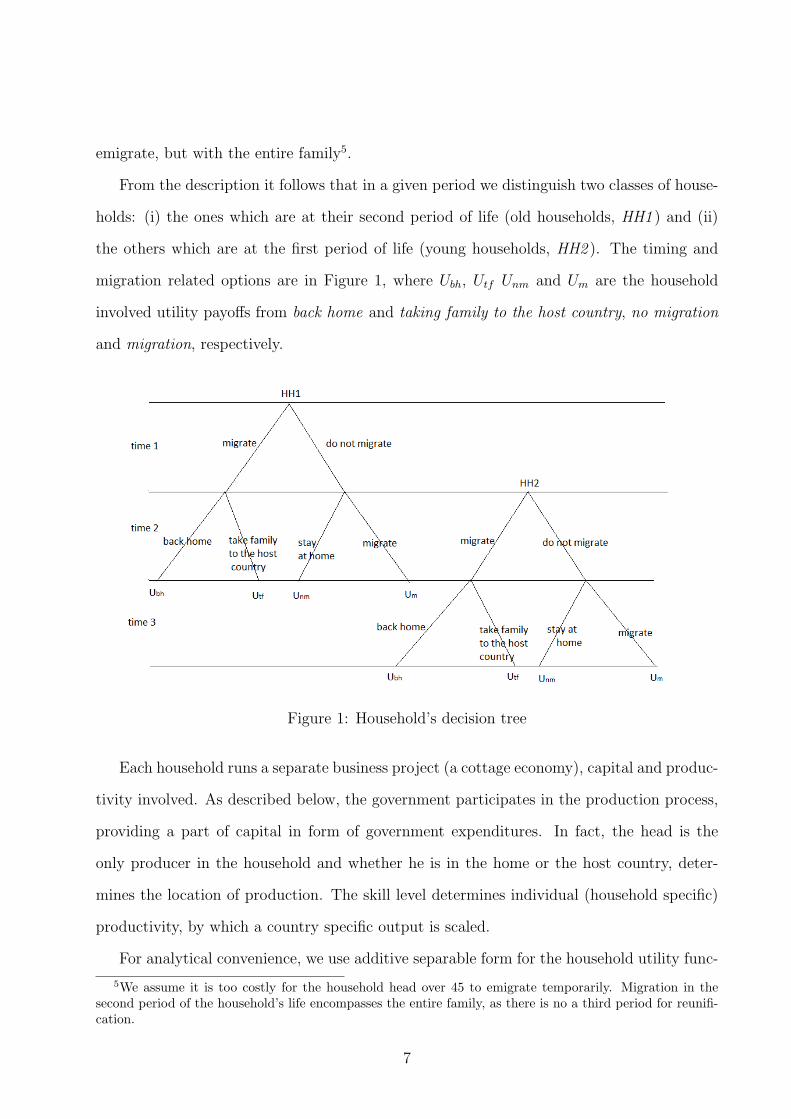
From the description it follows that in a given period we distinguish two classes of house-
holds: (i) the ones which are at their second period of life (old households, HH1 ) and (ii)
the others which are at the first period of life (young households, HH2 ). The timing and
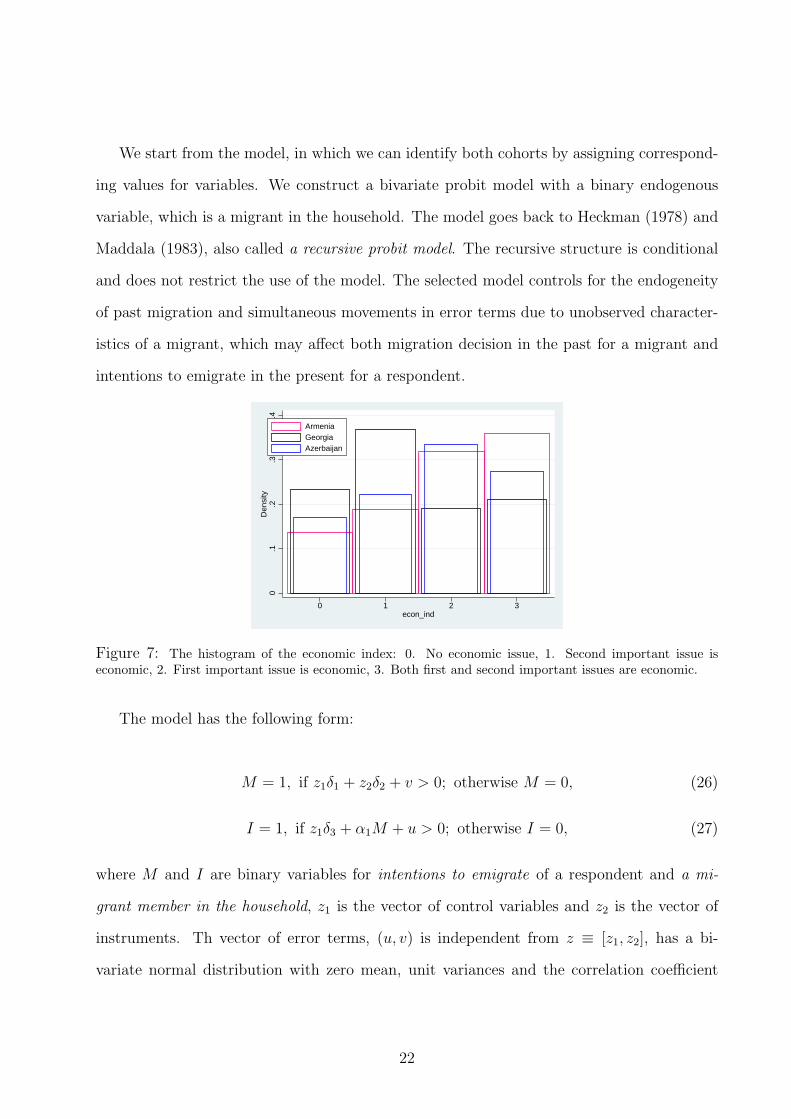
migration related options are in Figure 1, where Ubh, Utf Unm and Um are the household
involved utility payoffs from back home and taking family to the host country, no migration
and migration, respectively.
Figure 1: Household’s decision tree
Each household runs a separate business project (a cottage economy), capital and produc-
tivity involved. As described below, the government participates in the production process,
providing a part of capital in form of government expenditures. In fact, the head is the
only producer in the household and whether he is in the home or the host country, deter-
mines the location of production. The skill level determines individual (household specific)
productivity, by which a country specific output is scaled.
For analytical convenience, we use additive separable form for the household utility func-
5We assume it is too costly for the household head over 45 to emigrate temporarily. Migration in thesecond period of the household’s life encompasses the entire family, as there is no a third period for reunifi-cation.
7
tion, similar to Rapoport and Docquier (2005) and Melkonyan and Grigorian (2011). In the
model, labor is supplied inelastically and therefore does not enter the utility structure. For
each node of decision three, we specify corresponding utility functions:
Unm = ln c1 + θE[ln ch,2 + β lnkh,2], (1)
Um = ln c1 + θE[ln cf ,2 + β lnkf ,2], (2)
Ubh = α ln cm,1 + (1− α) ln cn,1 + θE[ln ch,2 + β lnkh,2], (3)
Utf = α ln cm,1 + (1− α) ln cn,1 + θE[ln cf ,2 + β lnkf ,2], (4)
where the parameter α ∈ (0, 1) governs the share of the utility from consumption for the
migrant member (cm,1) and non-migrant member (cn,1); θ is the discounting factor, β governs
the share of earnings bequeathed to the offspring and E[.] is the expectation operator for the
second period utility. Numbers in indexes indicate time periods and the variables c and k in
the square brackets are family involved consumption and bequest to the next generation. We
use indexes to identify the country, h for home and and f for foreign. The bequest motive
is purely altruistic, following Andreoni (1989). For the complete characterization and the
solution of the household problem, see Grigoryan (2014b).
We take a more general form for the production function, which allows richer interaction
between policy variables and production factors. Production function takes the form
y = (SA)1
γ [(1− q)µ]1−γγ k
vγ , (5)
where v is the contribution of capital to the production y = SAkv[(1 − q)g]1−γ, with the
government expenditure g. The parameters γ and v are country specific and in particular
condition the effectiveness of the individual skill S and the country specific productivity
A. If government expenditures have a large contribution to the production process, given
the level of power concentration, it increases the contribution of both country specific and
8
individual productivities in the value creation process. In order to save space, we denote
A ≡ (SA)1
γ [(1 − q)µ]1−γγ , and the production function becomes y = Ak
vγ . Under constant
return to scale, which is the case in Grigoryan (2014), v = γ.
In order to derive the econometric model, we take the approach by Borjas (1987), model-
ing migration decision by comparing benefits at home and abroad, if migration would occur.
The choice is modeled through the binary variable, which enables to make the model proba-
bilistic. Our primary interest is to model permanent migration and for this reason we identify
utilities in the corresponding nodes and compare with the alternative, which is to stay at
home. We develop testable hypotheses separately for young and old households. We start
from the old, since they have one period decision making and it is therefore less involved.
1.1 Old households
If the the household has no a migrant member by the end of the first period, the head of
household chooses between stay at home and migrate at the beginning of the second period.
In the decision tree in Figure 1, the two choices correspond to the end nodes with the payoffs
Unm and Um, respectively. Then, the choice can be modeled as6:
I∗ = 1 if I = Um − Unm > 0, otherwise I∗ = 0; (6)
where I is a latent variable and I∗ is the revealed intention to emigrate, observed from the
dataset. We can write the model (6) in a standard probability form and plug consumption
policies from Grigoryan (2014b) into the utilities, after correcting for minor changes due to
a more general form of the production function:
Prob(I∗ = 1) = Prob(Um − Unm > 0)
= Prob(log[(1− τ f2 )qf,2(1− qf,2)
ηAf (k1 −QS2 )
vf/γf ]− log[(1− τ2)q2(1− q2)
ηAkv/γ1 ] > 0), (7)
6We suppress the household specific index to save space.
9
where η = (1−γ)/γ. Power concentration is measured by q2 ∈ [0, 1], with perfect democracy
and perfect autocracy at q = 0 and q = 1, respectively7. The time index represents the life
period for the household under consideration. The way, private resources are diverted here, is
different from that in Grigoryan (2014). There, part of resources, taxed from households but
not appropriated by the government, is wasted. In the current setting there is no resource
waste. The government expropriates the fraction [1 − (1 − τ)q], which is less than τ unless
q = 1, while the rest remains with the household. The intuition is that the lower the power
concentration, the weaker the bargaining power of the government and the less resources are
diverted from households.
Two measures of power concentration, q and q, differ in that the former reflects the
individual perception, while the latter is the de-facto measure of it. In the empirical model
q enters as a variable and q is fixed. Households face different levels of destruction in the
production process ([1 − q]1−γ) and extraction rents ([1 − τ ]q), but the curvature of the
extraction rent is common for all, given by q.
In our dataset, we have null information about a (potential) migrant, implying that
all variables with the superscript f , determined in a host country, should be treated as
unobservables. However, we keep skill and capital related productivity differentials between
the host and home countries, in order to identify the impact of skill change on emigration
intentions. As a result, (7) reduces to
Prob(I∗ = 1) = Prob(ǫ−1− γ
γlog γ − q2 log(1− τ2)− η log(1− q2)
+vfγf
log(k1 −QS2 )−
v
γlog k1 +
[
1
γf−
1
γ
]
log S2), (8)
where G(.) is a cumulative distribution function, with the symmetric density function G′(.)
7The notation is different from Grigoryan(2014b), where democracy and autocracy correspond to thevalues q2 = 1 and q2 = 0. We change the notation for the analytical convenience.
10
and the unobservable components are embedded into the error term,
ǫ ≡ qf,2 log[(1− τ f2 ) + η log(1− qf,2) +1
γflogAf +
1− γfγf
log µ. (9)
Assuming normality for cumulative distribution function G(.), we can write the model in
the probit form,
Prob(I∗ = 1) = G(−1− γ
γlog γ − q2 log(1− τ2)− η log(1− q2)
+vfγf
log(k1 −QS2 )−
v
γlog k1 −
1
γlogA+
[
1
γf−
1
γ
]
log S2).
For notational convenience we denote the argument of G by z, and evaluate it at the
mean values of observables q, τ k and S. Then, in order to derive the hypotheses, we take
partial derivatives with respect to the variables in the function G.
∂Prob(I∗ = 1)
∂ log q2=
1− γ
γG′(z), (10)
∂Prob(I∗ = 1)
∂ log τ2= q2G
′(z), (11)
∂Prob(I∗ = 1)
∂ log(k1 −QS2 )
=vfγf
G′(z),∂Prob(I∗ = 1)
∂ log k1= −
v
γG′(z) (12)
∂Prob(I∗ = 1)
∂ log S2
=
[
1
γf−
1
γ
]
G′(z). (13)
Now, consider two economies with high and low power concentration indexes, qh and
ql, respectively. One of the key hypotheses (Hypothesis 1), which is the response of emi-
gration intentions to the political index is stronger in a more power concentrated country,
hinges on the participation share of government in the production process. If a more power
concentrated country patterns a larger involvement in the value creation process (low γ),
then higher concentration brings more destruction, translating into stronger intentions to
emigrate. As for the second hypothesis, according to (11), emigration intentions respond to
the excessive tax rate stronger in a more concentrated country.
11
The role of capital in shaping intentions depends on migration cost QS2 : larger migration
costs make potential migrants less eager to emigrate (Equation 12). On the other hand,
a higher capital productivity abroad, vf/γf , amplifies intentions. Finally, if government
investment share is higher in a host country, it increases the individual (as well as country
specific) productivity abroad and hence emigration intentions (Equation 13).
1.2 Young households
Next we develop the probabilistic model for the young household, which should decide
between permanent migration and staying at home. In Figure 1, we consider two terminal
nodes, Utf and Unm for the family unification abroad and no migration, respectively. We drop
temporary migration as a second alternative to permanent migration, because our primary
interest is to identify determinants of permanent migration. The choice model, similar to
the one for the second period household, takes the following form:
I∗ = 1 if I = Utf − Unm > 0, otherwise I∗ = 0; (14)
For the young household the model is more involved, because the decision making covers
two periods. The probabilistic model is
Prob(I∗ = 1) = Prob(Utf − Unm > 0) = Prob(α log cm,1 + (1− α)cn,1
+ θE{log cf,2 + β log kf,2} − log c1 − θE{log c2 + β log k2} > 0), (15)
where E{} the expectation operator defined over the state space S, conditioned by the
information set available at the end of the first period8.
After plugging the optimal values for the two-period consumption, capital and bequest
8Ex =
∫
s∈Sxsfs(x)ds, with the (objective) probability distribution fs(.).
12
and removing unobservables, the model in (15) takes the form
Prob(I∗ = 1) = G((1/γf − 1/γ)[(1 + θ) log S1 + θE log(S2)]
+ (1 + θ)[vf log(k0 −QM1 )− v log k0]
− (α + θ)q1 log(1− τ1)− θE{q2 log(1− τ2)}
− (1 + θ)η log(1− q1)− θηE{log(1− q2)}), (16)
where G(.) is the cumulative normal distribution function, the rows, from above to below,
are the corresponding terms for the skill, initial asset, power concentration and excessive tax
rate. When taking the model into the data, we assume perfect foresight in order to utilize
second period variables through their first period counterparts. We assume the following
dynamic rule for power concentration:
1− qt+1 = eµj(1− qt)λq,j(1− τt)
1−λq,j , (17)
where j is the country index. The rule is analytically convenient and share basic properties
with that in Grigoryan (2014b)9. For the excessive tax rate, Grigoryan (2014b) assumes
AR(1) process, for which the deterministic version collapses to τt+1 = τt. Also, we drop the
second period migration cost, assuming that its first period counterpart QM1 includes the
costs for family unification in the second period.
Using the dynamic rules for power concentration and the excessive tax rate, we modify
9Grigoryan (2014b) uses a linear form for the dynamic model and involves τt−1, (1− qt+1) = λq(1− qt)−(1− λq)(τt − τt−1) + ǫ
qt ; ǫ
qt ∼ N (0, σ2
q ).
13
(16) to
Prob(I∗ = 1) = G((1/γf − 1/γ)[(1 + θ) log S1 + θE log(S2)]
+ (1 + θ)[(vf/γf ) log(k0 −QM1 )− (v/γ) log k0]
− [(α + θ)q1 + θ{1− (1− q1)λq(1− τ1)
1−λq}+ θη(1− λq)] log(1− τ1)
− [(1 + θ)η + θηλq] log(1− q1)), (18)
Partial impacts with respect to the variables of interest are
∂Prob(I∗ = 1)
∂ log q1= η[(1 + θ) + θλq]G
′(z), (19)
∂Prob(I∗ = 1)
∂ log τ1= [(α + θ)q1 + θ{1− (1− q1)
λq(1− τ1)1−λq}+ θη(1− λq)]G
′(z), (20)
∂Prob(I∗ = 1)
∂ log(k1 −QS1 )
=vfγf
(1 + θ)G′(z),∂Prob(I∗ = 1)
∂ log k1= −
v
γ(1 + θ)G′(z), (21)
∂Prob(I∗ = 1)
∂ log S1
= (1 + 2θ)(1/γf − 1/γ)G′(z). (22)
For the young household, the partial impact of power concentration on emigration inten-
tions depends on the share of government investments, η, but the latter is scaled upward by
the factor, involving the patience rate θ and the coefficient λq which governs the persistence
of qt. One can draw a scenario, which may lead to the rejection of Hypothesis 1: suppose the
domestic country experiences a drastic positive change in economic policies, which is effec-
tively translated into the next period low power concentration (through small λq in Equation
17). Then, despite the currently high power concentration, marginal response of emigration
intentions can be small enough to maintain households at home. The policy implication is
that successful economic reforms can bring changes in emigration decisions for the young,
despite their discontent from the current political discourse.
The response of emigration intentions to the capital stock and the skill depends on their
contribution to the production process, similar to the old household case. The only change
14
is that the patience (preference) rate amplifies the response, since initial assets and skills
determine the capacity of the household in raising the life time, current and next period,
income. As a result, the response of emigration intentions to production factors is stronger.
2 Empirical strategy
In order to estimate for the South Caucasian countries the partial impacts on emigration
intentions of (i) power concentration, (ii) excessive tax rate, (iii) household asset holdings
and (iv) individual skills, we use the Caucasus Barometer Dataset for the period 2010 - 2013.
We have longitudinal data on respondents’ and their households’ characteristics, attitudes
to public policies with the large spectrum of political and economic factors, perceptions
to their financial and economic situation (absolute and relative), social capital abroad in
forms of household migrant member and/or a close friend abroad, intentions to emigrate
(permanently and temporarily), among other variables. Summary statistics of the variables
of interest separate for each country are shown in Tables 9, 10 and 11.
Power concentration and the excessive tax rate are distinct variables in the theoretical
model, while in our dataset we have respondents’ perceptions on the quality of public insti-
tutions. We embed the information from several variables and construct aggregate measures
(indexes) as proxies for perceived power concentration and the excessive tax rate. In the em-
pirical model, the political index as a perceived democracy measure is the proxy for power
concentration. Respectively, the economic index measures the ineffectiveness of economic
policies and proxies the excessive tax rate.
We select 4 variables to construct the political index (Pol): (i) trust towards local gov-
ernment, (ii) fairness of the most recent national elections, (iii) how fairly people are treated
by the government and (iv) people’s right to openly say what they think. These variables
enter the political index with equal weights. If a respondent gives the highest values for all
variables in the index, then, according to her view, political institutions are completely in
place and there is no power concentration in the sense of the theoretical model. If the index
15
takes the value zero then the respondent perceives an absolute concentration of the power,
which in particular leads to total destruction of production. Values in between correspond
to imperfect concentration of the power.
For sake of robustness, we construct alternative measures for political and economic
indexes, involving different set of variables, while sharing the same structure with the original
indexes. The second political index, denoted Pol2, involves the following variables: ”trust
towards excetive government”, ”fair treatment by the government”, ”fair elections” and ”fair
courts”.10
The theoretical model in Grigoryan (2014b) ranks the countries according to the level
of democracy, using the indicator, developed by Marshall et al. (2012). If we want to test
the model implied hypotheses, we should make sure that the micro data preserves the rank-
ing invoked in the theoretical model so that the estimated partial impacts can represent
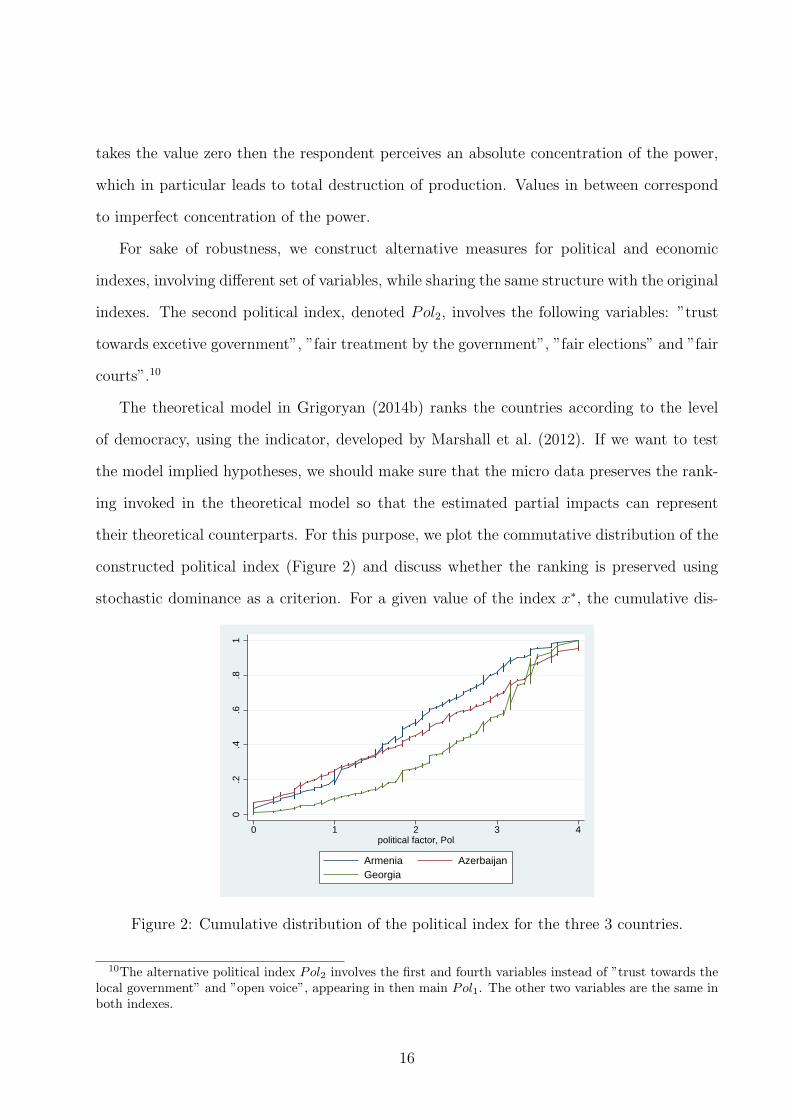
their theoretical counterparts. For this purpose, we plot the commutative distribution of the
constructed political index (Figure 2) and discuss whether the ranking is preserved using
stochastic dominance as a criterion. For a given value of the index x∗, the cumulative dis-
0.2
.4.6
.81
0 1 2 3 4political factor, Pol
Armenia AzerbaijanGeorgia
Figure 2: Cumulative distribution of the political index for the three 3 countries.
10The alternative political index Pol2 involves the first and fourth variables instead of ”trust towards thelocal government” and ”open voice”, appearing in then main Pol1. The other two variables are the same inboth indexes.
16
tribution F (x∗) indicates the fraction of respondents, who evaluate the extent of democracy
or the efficiency of political institutions at most x∗, while the fraction 1 − F (x∗) gives the
value to the same variable at least x∗. Then, if a country has the lowest score of democracy
in Marshall et al. (2012), which is Azerbaijan, then we expect that the corresponding index
will be first order stochastically dominated by the indexes of the other two countries. Con-
sequently, the index for Georgia should first order stochastically dominate the indexes of the
remaining countries. That is, we should have
FGEO(x) ≤ FARM(x) ≤ FAZE(x), ∀x ∈ [0, 4], (23)
where F is the cumulative distribution function plotted in Figure 2. The expected ranking,
however, is not observed, since the the cumulative distribution for Armenia remains above for
the values Pol > 1.5. The mismatch between the democracy index by Marshall et al. (2012)
and the political index based on the micro data is unexpected, because the two measures
are based on the common components11 and aggregate perceptions, though from different
datasets.
We think that the discrepancy between the indexes is due to respondents (their house-
holds’) economic situation, which differs from one country to another substantially. Azer-
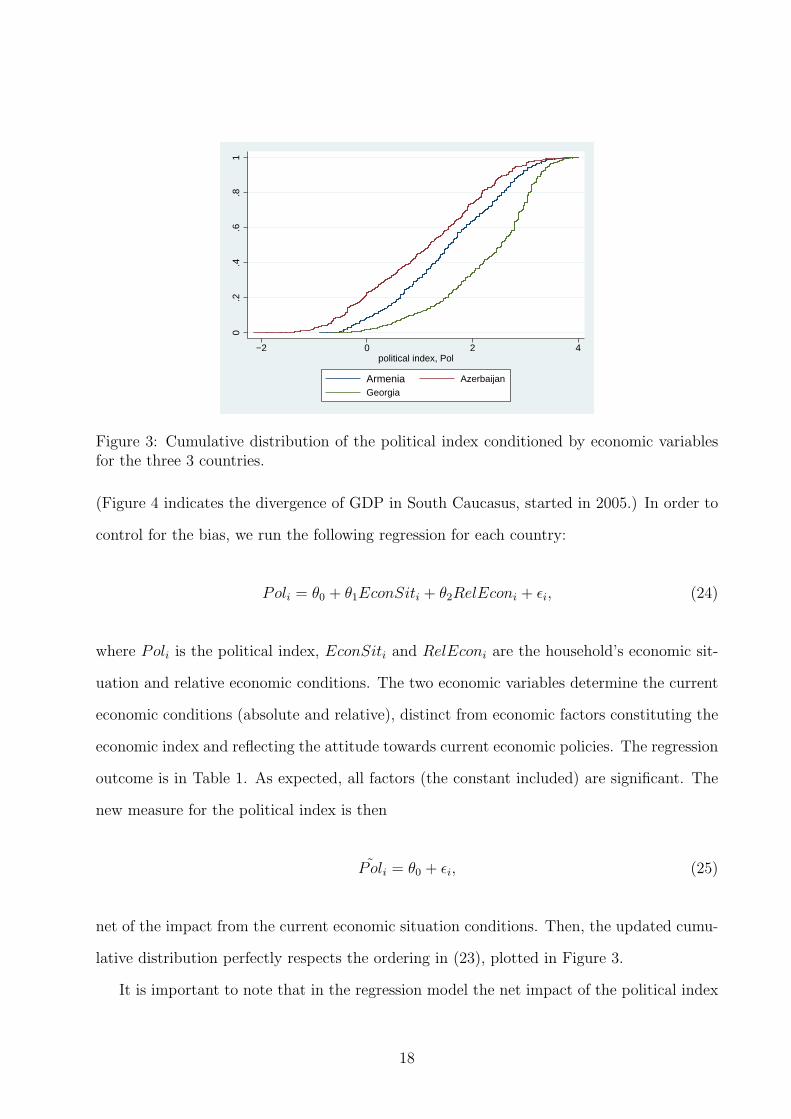
baijan patterns a strong increase in GDP per capita (Figure 4), while Georgia consistently
improves the political environment. Consequently, people in Azerbaijan might be less sensi-
tive to political constraints, as they are compensated by economic wellbeing, while people in
Georgia directly observe achievements in democratic values and economic wellbeing does not
distort political perceptions. In Armenia, on the other hand, poor economic conditions may
intensify political discontent, and this will introduce a positive bias in our political index.
11In page 14, Marshall et al. (2012) provide information on the main components of the index: ”Insti-tutionalized Democracy: Democracy is conceived as three essential, interdependent elements. One is thepresence of institutions and procedures through which citizens can express effective preferences about alter-native policies and leaders. Second is the existence of institutionalized constraints on the exercise of powerby the executive. Third is the guarantee of civil liberties to all citizens in their daily lives and in acts ofpolitical participation”. In fact, our political index involves variables which capture respondents’ perceptionsin these elements.
17
0.2
.4.6
.81
−2 0 2 4political index, Pol
Armenia Azerbaijan
Georgia
Figure 3: Cumulative distribution of the political index conditioned by economic variablesfor the three 3 countries.
(Figure 4 indicates the divergence of GDP in South Caucasus, started in 2005.) In order to
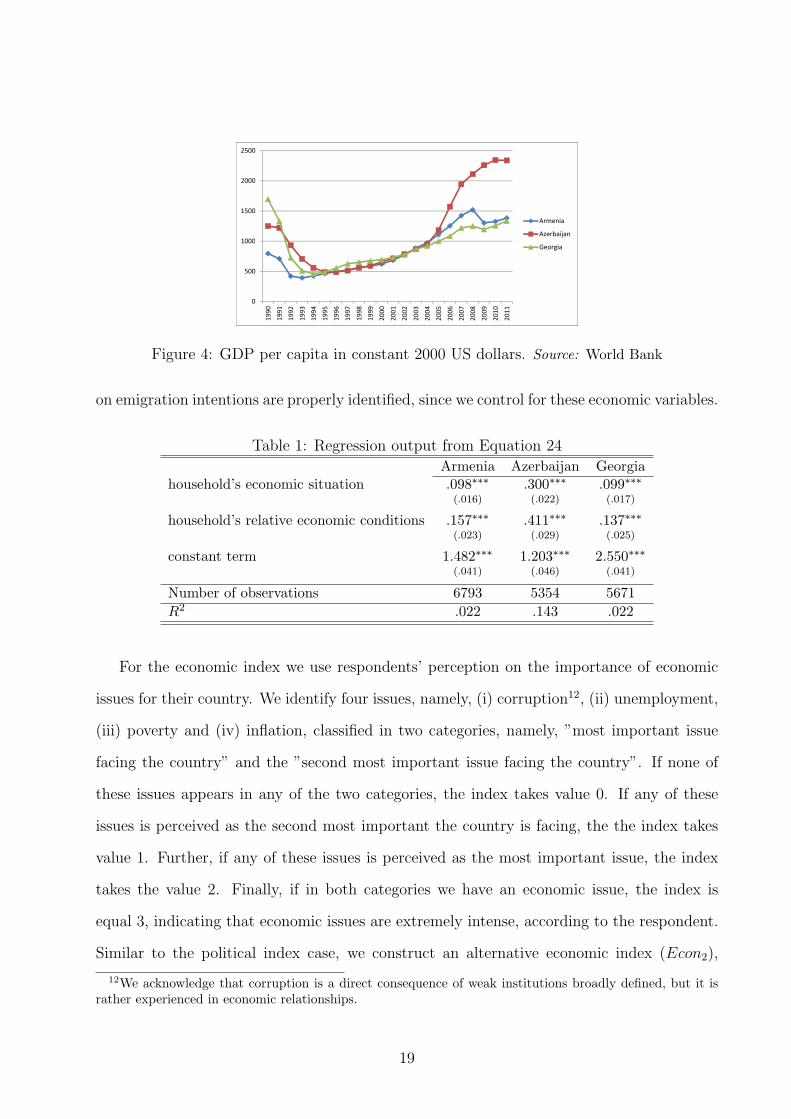
control for the bias, we run the following regression for each country:
Poli = θ0 + θ1EconSiti + θ2RelEconi + ǫi, (24)
where Poli is the political index, EconSiti and RelEconi are the household’s economic sit-
uation and relative economic conditions. The two economic variables determine the current
economic conditions (absolute and relative), distinct from economic factors constituting the
economic index and reflecting the attitude towards current economic policies. The regression
outcome is in Table 1. As expected, all factors (the constant included) are significant. The
new measure for the political index is then
P oli = θ0 + ǫi, (25)
net of the impact from the current economic situation conditions. Then, the updated cumu-
lative distribution perfectly respects the ordering in (23), plotted in Figure 3.
It is important to note that in the regression model the net impact of the political index
18
1000
1500
2000
2500
Armenia
Azerbaijan
Georgia
0
500
1000
1990
1991
1992
1993
1994
1995
1996
1997
1998
1999
2000
2001
2002
2003
2004
2005
2006
2007
2008
2009
2010
2011
Georgia
Figure 4: GDP per capita in constant 2000 US dollars. Source: World Bank
on emigration intentions are properly identified, since we control for these economic variables.
Table 1: Regression output from Equation 24
Armenia Azerbaijan Georgiahousehold’s economic situation .098∗∗∗ .300∗∗∗ .099∗∗∗
(.016) (.022) (.017)
household’s relative economic conditions .157∗∗∗ .411∗∗∗ .137∗∗∗
(.023) (.029) (.025)
constant term 1.482∗∗∗ 1.203∗∗∗ 2.550∗∗∗
(.041) (.046) (.041)
Number of observations 6793 5354 5671
R2 .022 .143 .022
For the economic index we use respondents’ perception on the importance of economic
issues for their country. We identify four issues, namely, (i) corruption12, (ii) unemployment,
(iii) poverty and (iv) inflation, classified in two categories, namely, ”most important issue
facing the country” and the ”second most important issue facing the country”. If none of
these issues appears in any of the two categories, the index takes value 0. If any of these
issues is perceived as the second most important the country is facing, the the index takes
value 1. Further, if any of these issues is perceived as the most important issue, the index
takes the value 2. Finally, if in both categories we have an economic issue, the index is
equal 3, indicating that economic issues are extremely intense, according to the respondent.
Similar to the political index case, we construct an alternative economic index (Econ2),
12We acknowledge that corruption is a direct consequence of weak institutions broadly defined, but it israther experienced in economic relationships.
19
which uses ”low wages” instead of ”inflation” as a major problem in the country, otherwise
the same as the main index (Econ1).
corruption
unemployment
poverty
inflation
0.1
.2.3
.4.5
Fra
ctio
n
0 5 10 15 20Categories
ArmeniaAzerbaijanGeorgia
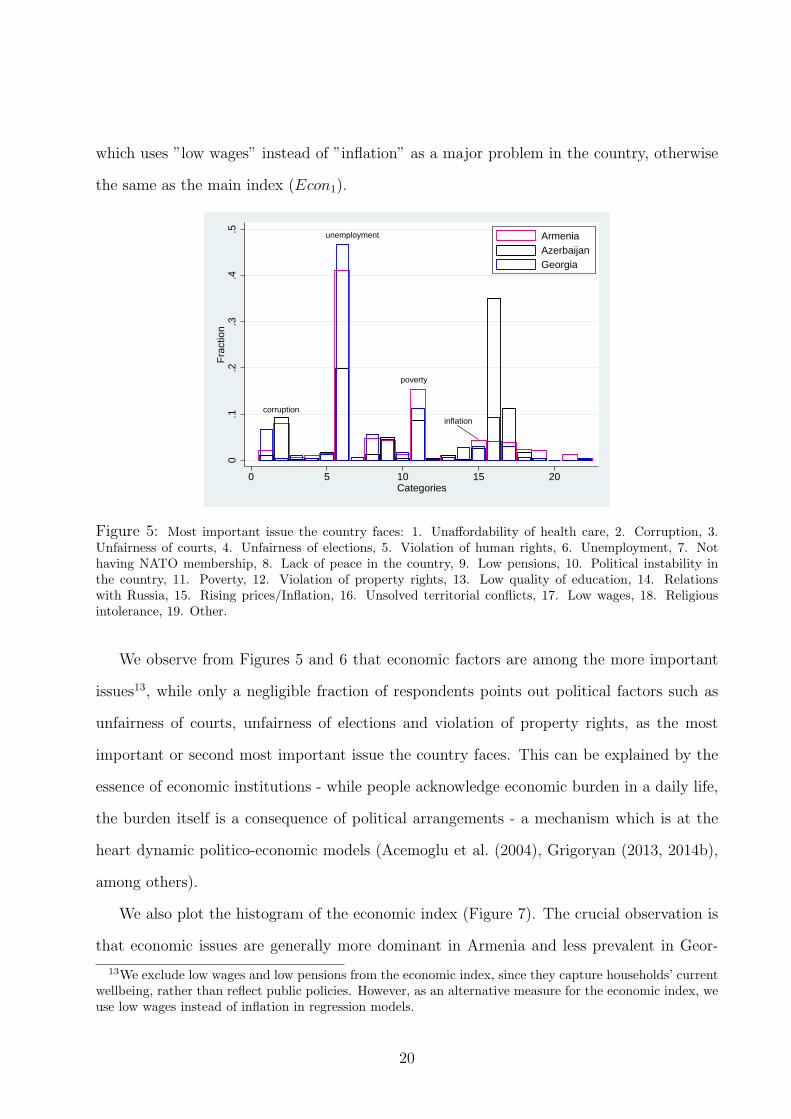
Figure 5: Most important issue the country faces: 1. Unaffordability of health care, 2. Corruption, 3.Unfairness of courts, 4. Unfairness of elections, 5. Violation of human rights, 6. Unemployment, 7. Nothaving NATO membership, 8. Lack of peace in the country, 9. Low pensions, 10. Political instability inthe country, 11. Poverty, 12. Violation of property rights, 13. Low quality of education, 14. Relationswith Russia, 15. Rising prices/Inflation, 16. Unsolved territorial conflicts, 17. Low wages, 18. Religiousintolerance, 19. Other.
We observe from Figures 5 and 6 that economic factors are among the more important
issues13, while only a negligible fraction of respondents points out political factors such as
unfairness of courts, unfairness of elections and violation of property rights, as the most
important or second most important issue the country faces. This can be explained by the
essence of economic institutions - while people acknowledge economic burden in a daily life,
the burden itself is a consequence of political arrangements - a mechanism which is at the
heart dynamic politico-economic models (Acemoglu et al. (2004), Grigoryan (2013, 2014b),
among others).
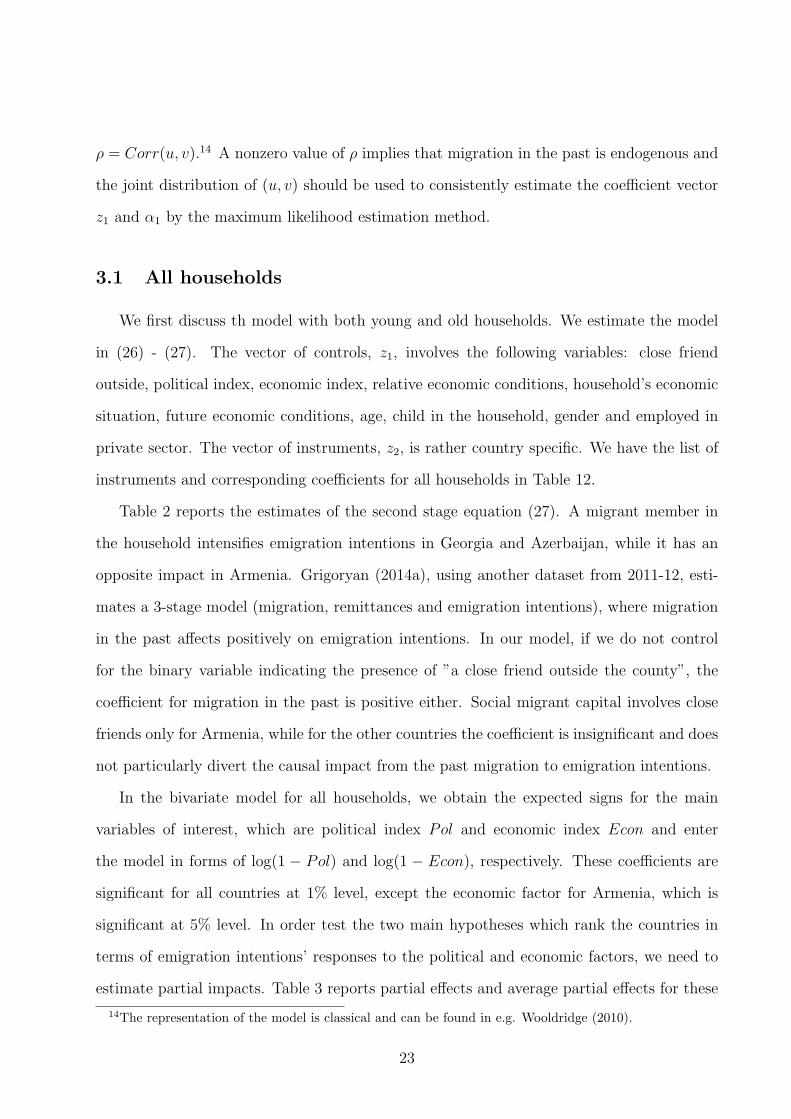
We also plot the histogram of the economic index (Figure 7). The crucial observation is
that economic issues are generally more dominant in Armenia and less prevalent in Geor-
13We exclude low wages and low pensions from the economic index, since they capture households’ currentwellbeing, rather than reflect public policies. However, as an alternative measure for the economic index, weuse low wages instead of inflation in regression models.
20
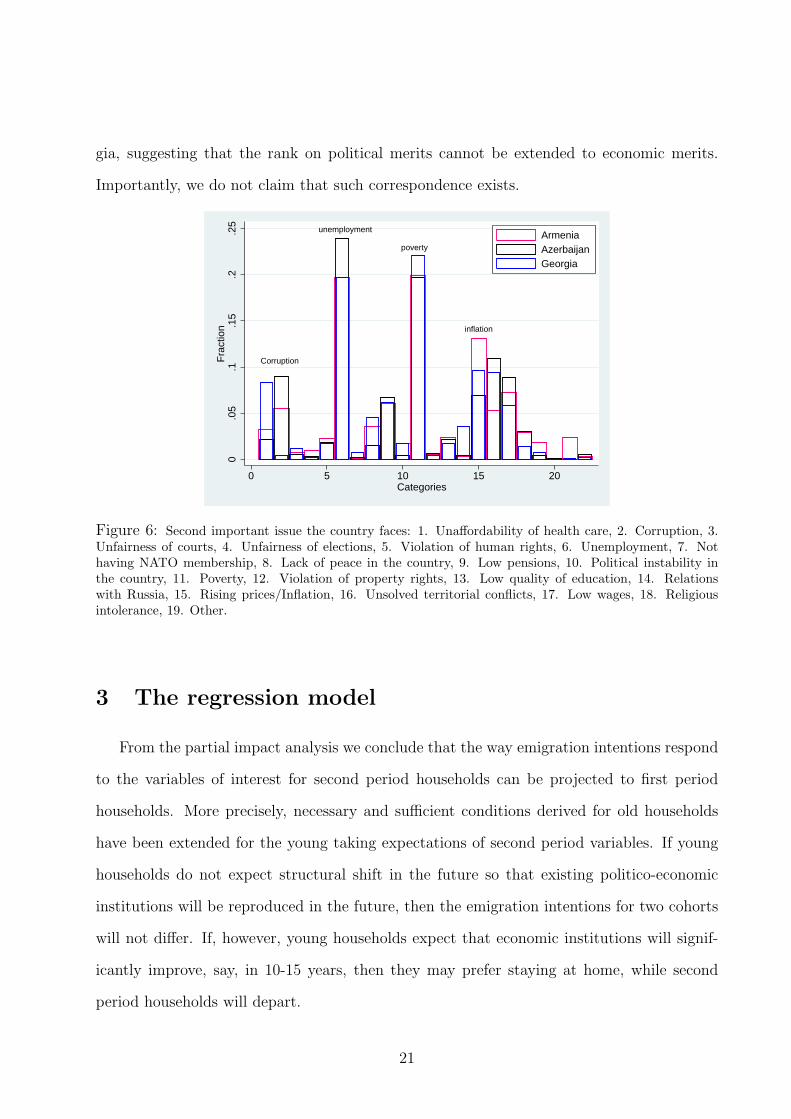
gia, suggesting that the rank on political merits cannot be extended to economic merits.
Importantly, we do not claim that such correspondence exists.
Corruption
unemployment
poverty
inflation
0.0
5.1
.15
.2.2
5F
ract
ion
0 5 10 15 20Categories
ArmeniaAzerbaijanGeorgia
Figure 6: Second important issue the country faces: 1. Unaffordability of health care, 2. Corruption, 3.Unfairness of courts, 4. Unfairness of elections, 5. Violation of human rights, 6. Unemployment, 7. Nothaving NATO membership, 8. Lack of peace in the country, 9. Low pensions, 10. Political instability inthe country, 11. Poverty, 12. Violation of property rights, 13. Low quality of education, 14. Relationswith Russia, 15. Rising prices/Inflation, 16. Unsolved territorial conflicts, 17. Low wages, 18. Religiousintolerance, 19. Other.
3 The regression model
From the partial impact analysis we conclude that the way emigration intentions respond
to the variables of interest for second period households can be projected to first period
households. More precisely, necessary and sufficient conditions derived for old households
have been extended for the young taking expectations of second period variables. If young
households do not expect structural shift in the future so that existing politico-economic
institutions will be reproduced in the future, then the emigration intentions for two cohorts
will not differ. If, however, young households expect that economic institutions will signif-
icantly improve, say, in 10-15 years, then they may prefer staying at home, while second
period households will depart.
21
We start from the model, in which we can identify both cohorts by assigning correspond-
ing values for variables. We construct a bivariate probit model with a binary endogenous
variable, which is a migrant in the household. The model goes back to Heckman (1978) and
Maddala (1983), also called a recursive probit model. The recursive structure is conditional
and does not restrict the use of the model. The selected model controls for the endogeneity
of past migration and simultaneous movements in error terms due to unobserved character-
istics of a migrant, which may affect both migration decision in the past for a migrant and
intentions to emigrate in the present for a respondent.
0.1
.2.3
.4D
ensi
ty
0 1 2 3econ_ind
ArmeniaGeorgiaAzerbaijan
Figure 7: The histogram of the economic index: 0. No economic issue, 1. Second important issue iseconomic, 2. First important issue is economic, 3. Both first and second important issues are economic.
The model has the following form:
M = 1, if z1δ1 + z2δ2 + v > 0; otherwise M = 0, (26)
I = 1, if z1δ3 + α1M + u > 0; otherwise I = 0, (27)
where M and I are binary variables for intentions to emigrate of a respondent and a mi-
grant member in the household, z1 is the vector of control variables and z2 is the vector of
instruments. Th vector of error terms, (u, v) is independent from z ≡ [z1, z2], has a bi-
variate normal distribution with zero mean, unit variances and the correlation coefficient
22
ρ = Corr(u, v).14 A nonzero value of ρ implies that migration in the past is endogenous and
the joint distribution of (u, v) should be used to consistently estimate the coefficient vector
z1 and α1 by the maximum likelihood estimation method.
3.1 All households
We first discuss th model with both young and old households. We estimate the model
in (26) - (27). The vector of controls, z1, involves the following variables: close friend
outside, political index, economic index, relative economic conditions, household’s economic
situation, future economic conditions, age, child in the household, gender and employed in
private sector. The vector of instruments, z2, is rather country specific. We have the list of
instruments and corresponding coefficients for all households in Table 12.
Table 2 reports the estimates of the second stage equation (27). A migrant member in
the household intensifies emigration intentions in Georgia and Azerbaijan, while it has an
opposite impact in Armenia. Grigoryan (2014a), using another dataset from 2011-12, esti-
mates a 3-stage model (migration, remittances and emigration intentions), where migration
in the past affects positively on emigration intentions. In our model, if we do not control
for the binary variable indicating the presence of ”a close friend outside the county”, the
coefficient for migration in the past is positive either. Social migrant capital involves close
friends only for Armenia, while for the other countries the coefficient is insignificant and does
not particularly divert the causal impact from the past migration to emigration intentions.
In the bivariate model for all households, we obtain the expected signs for the main
variables of interest, which are political index Pol and economic index Econ and enter
the model in forms of log(1 − Pol) and log(1 − Econ), respectively. These coefficients are
significant for all countries at 1% level, except the economic factor for Armenia, which is
significant at 5% level. In order test the two main hypotheses which rank the countries in
terms of emigration intentions’ responses to the political and economic factors, we need to
estimate partial impacts. Table 3 reports partial effects and average partial effects for these
14The representation of the model is classical and can be found in e.g. Wooldridge (2010).
23
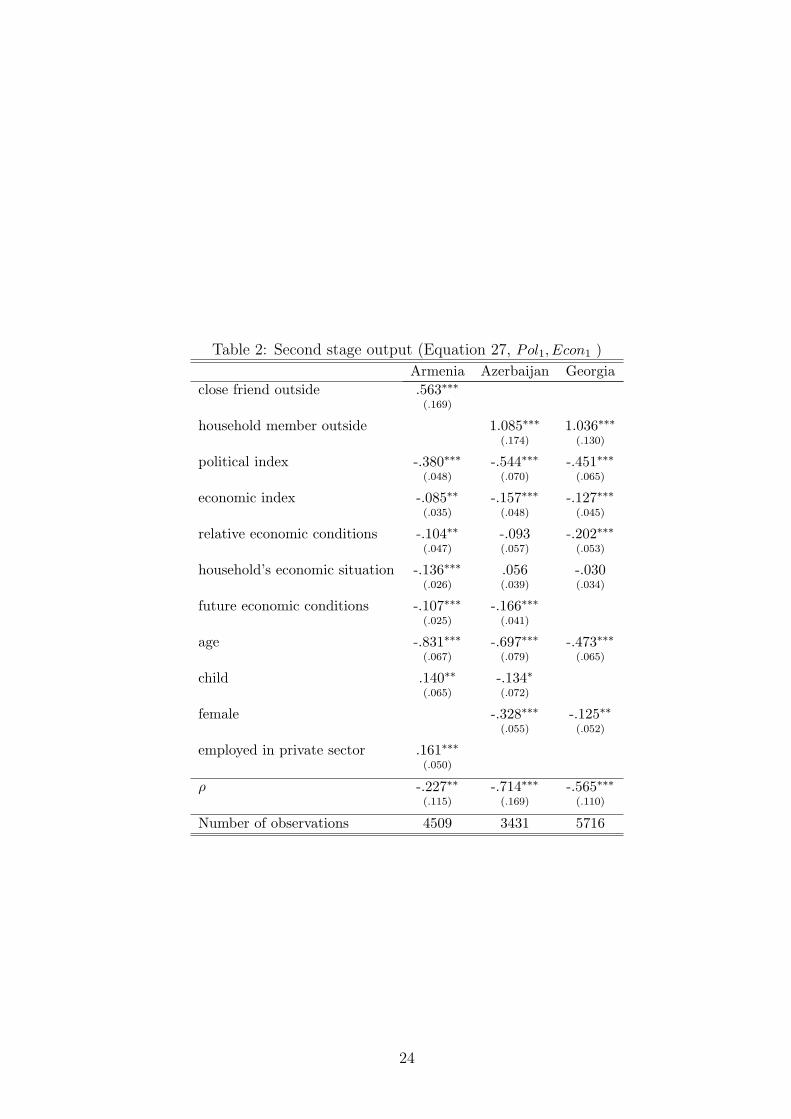
Table 2: Second stage output (Equation 27, Pol1, Econ1 )
Armenia Azerbaijan Georgia
close friend outside .563∗∗∗
(.169)
household member outside 1.085∗∗∗ 1.036∗∗∗
(.174) (.130)
political index -.380∗∗∗ -.544∗∗∗ -.451∗∗∗
(.048) (.070) (.065)
economic index -.085∗∗ -.157∗∗∗ -.127∗∗∗
(.035) (.048) (.045)
relative economic conditions -.104∗∗ -.093 -.202∗∗∗
(.047) (.057) (.053)
household’s economic situation -.136∗∗∗ .056 -.030(.026) (.039) (.034)
future economic conditions -.107∗∗∗ -.166∗∗∗
(.025) (.041)
age -.831∗∗∗ -.697∗∗∗ -.473∗∗∗
(.067) (.079) (.065)
child .140∗∗ -.134∗
(.065) (.072)
female -.328∗∗∗ -.125∗∗
(.055) (.052)
employed in private sector .161∗∗∗
(.050)
ρ -.227∗∗ -.714∗∗∗ -.565∗∗∗
(.115) (.169) (.110)
Number of observations 4509 3431 5716
24
two variables, calculated for each country separately. In all cases, Table 3 reports that the
key hypotheses, which are emigration intentions are more sensitive to both political and
economic factors in a more power concentrated country, cannot be rejected:
|PolGeo| < |PolArm| < |PolAze|; |EconGeo| < |EconArm| < |EconAze|. (28)
When taking all respondents into the regression model, we assume that both the young
and the old has the same preferences. We may evaluate partial impacts at the specific values
of determinants, such as age, marrital status etc, but the assumption of a single type of
preferences does not vanish. Our primary objective is then to reveal whether the ranking
in (28) can also be established when running the regression model separately for the young
and for the old households.
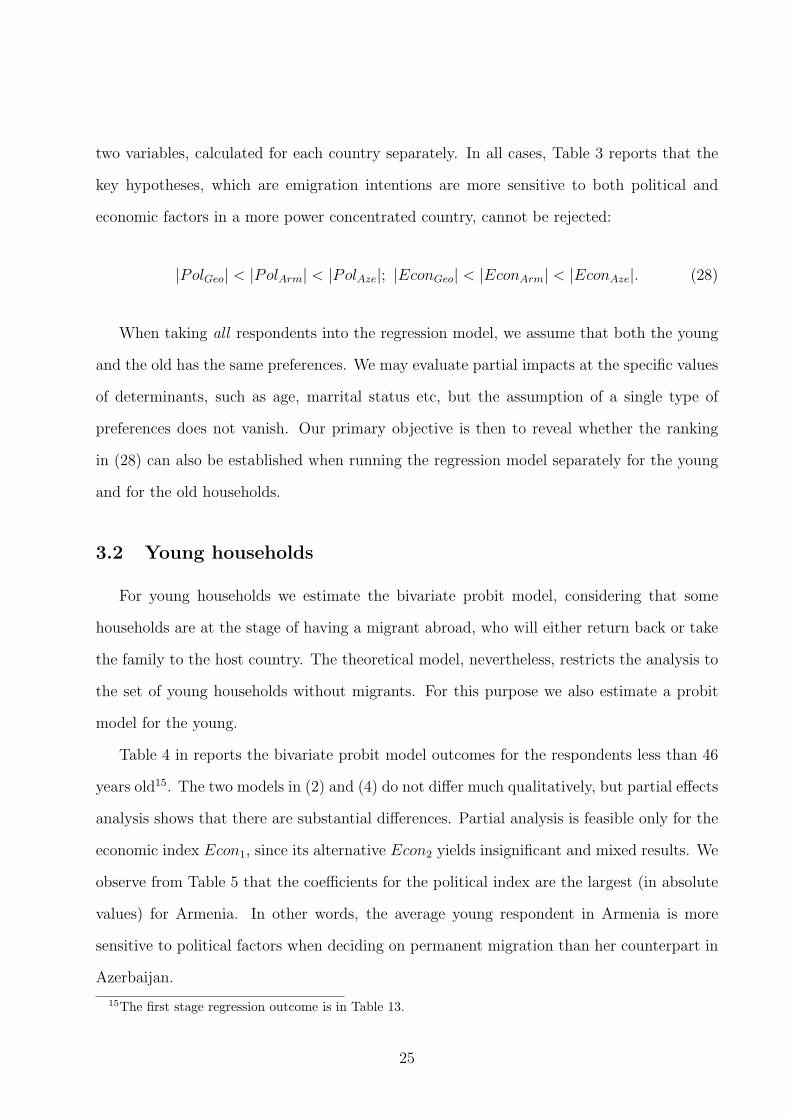
3.2 Young households
For young households we estimate the bivariate probit model, considering that some
households are at the stage of having a migrant abroad, who will either return back or take
the family to the host country. The theoretical model, nevertheless, restricts the analysis to
the set of young households without migrants. For this purpose we also estimate a probit
model for the young.
Table 4 in reports the bivariate probit model outcomes for the respondents less than 46
years old15. The two models in (2) and (4) do not differ much qualitatively, but partial effects
analysis shows that there are substantial differences. Partial analysis is feasible only for the
economic index Econ1, since its alternative Econ2 yields insignificant and mixed results. We
observe from Table 5 that the coefficients for the political index are the largest (in absolute
values) for Armenia. In other words, the average young respondent in Armenia is more
sensitive to political factors when deciding on permanent migration than her counterpart in
Azerbaijan.
15The first stage regression outcome is in Table 13.
25
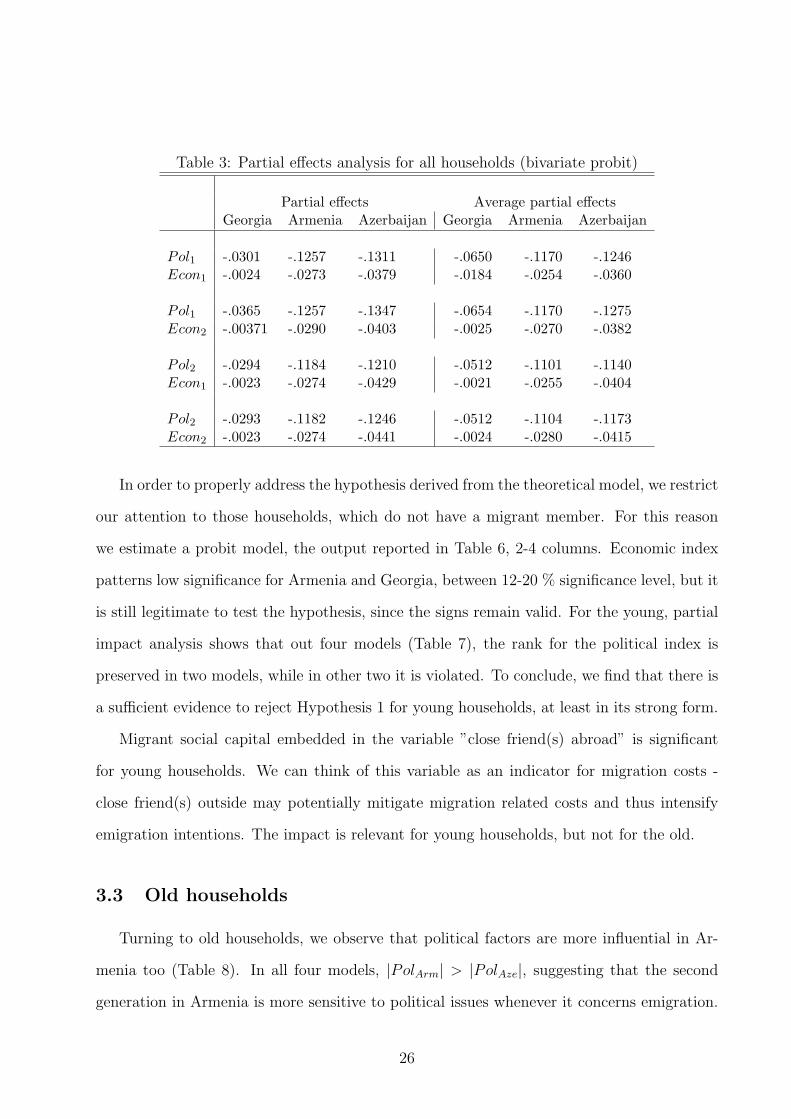
Table 3: Partial effects analysis for all households (bivariate probit)
Partial effects Average partial effectsGeorgia Armenia Azerbaijan Georgia Armenia Azerbaijan
Pol1 -.0301 -.1257 -.1311 -.0650 -.1170 -.1246Econ1 -.0024 -.0273 -.0379 -.0184 -.0254 -.0360
Pol1 -.0365 -.1257 -.1347 -.0654 -.1170 -.1275Econ2 -.00371 -.0290 -.0403 -.0025 -.0270 -.0382
Pol2 -.0294 -.1184 -.1210 -.0512 -.1101 -.1140Econ1 -.0023 -.0274 -.0429 -.0021 -.0255 -.0404
Pol2 -.0293 -.1182 -.1246 -.0512 -.1104 -.1173Econ2 -.0023 -.0274 -.0441 -.0024 -.0280 -.0415
In order to properly address the hypothesis derived from the theoretical model, we restrict
our attention to those households, which do not have a migrant member. For this reason
we estimate a probit model, the output reported in Table 6, 2-4 columns. Economic index
patterns low significance for Armenia and Georgia, between 12-20 % significance level, but it
is still legitimate to test the hypothesis, since the signs remain valid. For the young, partial
impact analysis shows that out four models (Table 7), the rank for the political index is
preserved in two models, while in other two it is violated. To conclude, we find that there is
a sufficient evidence to reject Hypothesis 1 for young households, at least in its strong form.
Migrant social capital embedded in the variable ”close friend(s) abroad” is significant
for young households. We can think of this variable as an indicator for migration costs -
close friend(s) outside may potentially mitigate migration related costs and thus intensify
emigration intentions. The impact is relevant for young households, but not for the old.
3.3 Old households
Turning to old households, we observe that political factors are more influential in Ar-
menia too (Table 8). In all four models, |PolArm| > |PolAze|, suggesting that the second
generation in Armenia is more sensitive to political issues whenever it concerns emigration.
26
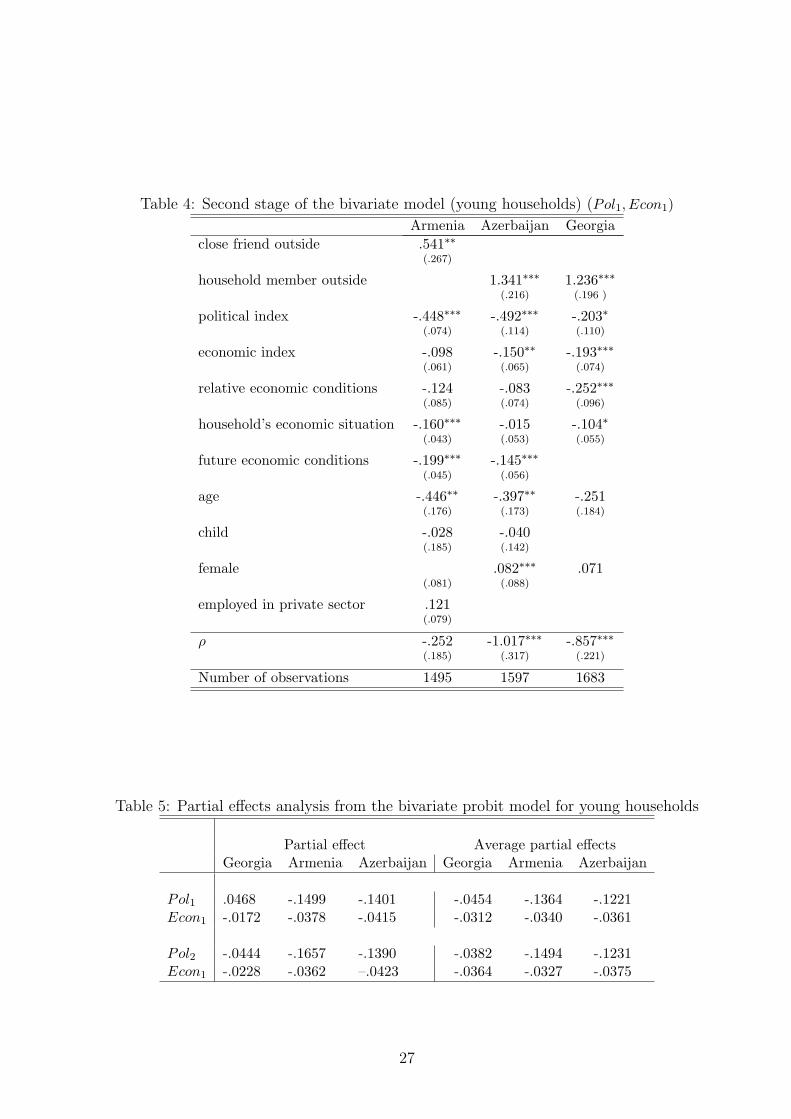
Table 4: Second stage of the bivariate model (young households) (Pol1, Econ1)
Armenia Azerbaijan Georgia
close friend outside .541∗∗
(.267)
household member outside 1.341∗∗∗ 1.236∗∗∗
(.216) (.196 )
political index -.448∗∗∗ -.492∗∗∗ -.203∗
(.074) (.114) (.110)
economic index -.098 -.150∗∗ -.193∗∗∗
(.061) (.065) (.074)
relative economic conditions -.124 -.083 -.252∗∗∗
(.085) (.074) (.096)
household’s economic situation -.160∗∗∗ -.015 -.104∗
(.043) (.053) (.055)
future economic conditions -.199∗∗∗ -.145∗∗∗
(.045) (.056)
age -.446∗∗ -.397∗∗ -.251(.176) (.173) (.184)
child -.028 -.040(.185) (.142)
female .082∗∗∗ .071(.081) (.088)
employed in private sector .121(.079)
ρ -.252 -1.017∗∗∗ -.857∗∗∗
(.185) (.317) (.221)
Number of observations 1495 1597 1683
Table 5: Partial effects analysis from the bivariate probit model for young households
Partial effect Average partial effectsGeorgia Armenia Azerbaijan Georgia Armenia Azerbaijan
Pol1 .0468 -.1499 -.1401 -.0454 -.1364 -.1221Econ1 -.0172 -.0378 -.0415 -.0312 -.0340 -.0361
Pol2 -.0444 -.1657 -.1390 -.0382 -.1494 -.1231Econ1 -.0228 -.0362 –.0423 -.0364 -.0327 -.0375
27
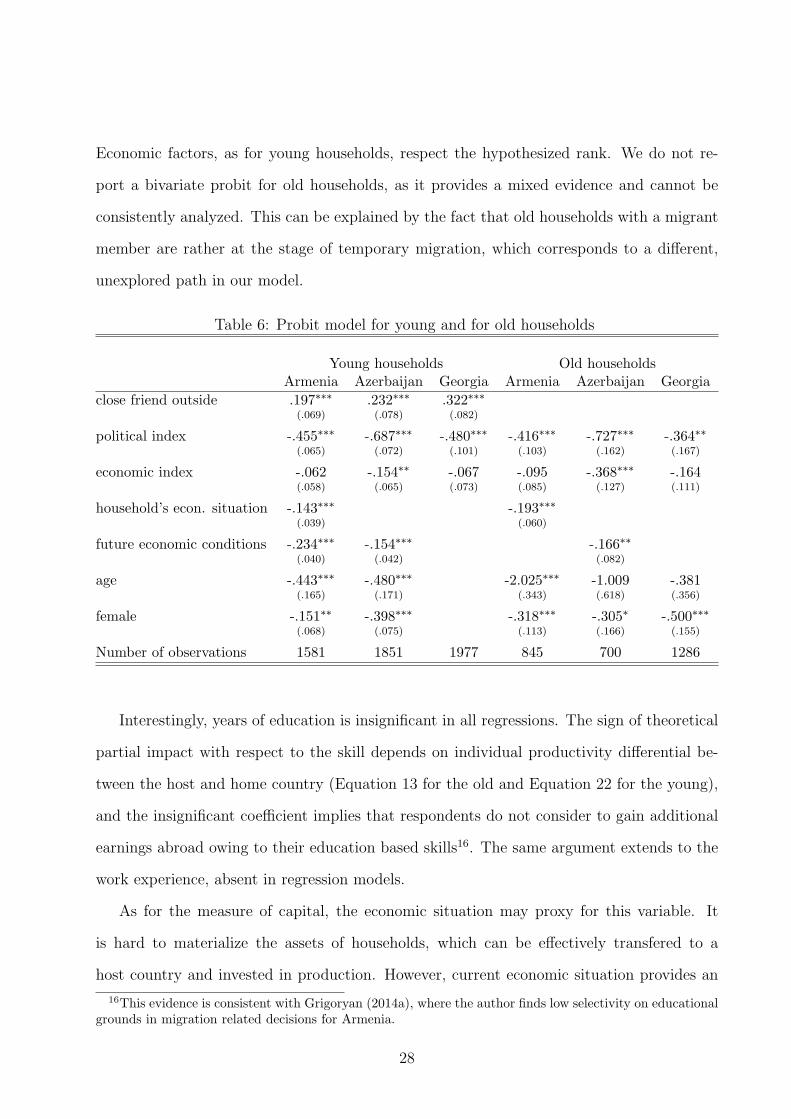
Economic factors, as for young households, respect the hypothesized rank. We do not re-
port a bivariate probit for old households, as it provides a mixed evidence and cannot be
consistently analyzed. This can be explained by the fact that old households with a migrant
member are rather at the stage of temporary migration, which corresponds to a different,
unexplored path in our model.
Table 6: Probit model for young and for old households
Young households Old householdsArmenia Azerbaijan Georgia Armenia Azerbaijan Georgia
close friend outside .197∗∗∗ .232∗∗∗ .322∗∗∗
(.069) (.078) (.082)
political index -.455∗∗∗ -.687∗∗∗ -.480∗∗∗ -.416∗∗∗ -.727∗∗∗ -.364∗∗
(.065) (.072) (.101) (.103) (.162) (.167)
economic index -.062 -.154∗∗ -.067 -.095 -.368∗∗∗ -.164(.058) (.065) (.073) (.085) (.127) (.111)
household’s econ. situation -.143∗∗∗ -.193∗∗∗
(.039) (.060)
future economic conditions -.234∗∗∗ -.154∗∗∗ -.166∗∗
(.040) (.042) (.082)
age -.443∗∗∗ -.480∗∗∗ -2.025∗∗∗ -1.009 -.381(.165) (.171) (.343) (.618) (.356)
female -.151∗∗ -.398∗∗∗ -.318∗∗∗ -.305∗ -.500∗∗∗
(.068) (.075) (.113) (.166) (.155)
Number of observations 1581 1851 1977 845 700 1286
Interestingly, years of education is insignificant in all regressions. The sign of theoretical
partial impact with respect to the skill depends on individual productivity differential be-
tween the host and home country (Equation 13 for the old and Equation 22 for the young),
and the insignificant coefficient implies that respondents do not consider to gain additional
earnings abroad owing to their education based skills16. The same argument extends to the
work experience, absent in regression models.
As for the measure of capital, the economic situation may proxy for this variable. It
is hard to materialize the assets of households, which can be effectively transfered to a
host country and invested in production. However, current economic situation provides an
16This evidence is consistent with Grigoryan (2014a), where the author finds low selectivity on educationalgrounds in migration related decisions for Armenia.
28
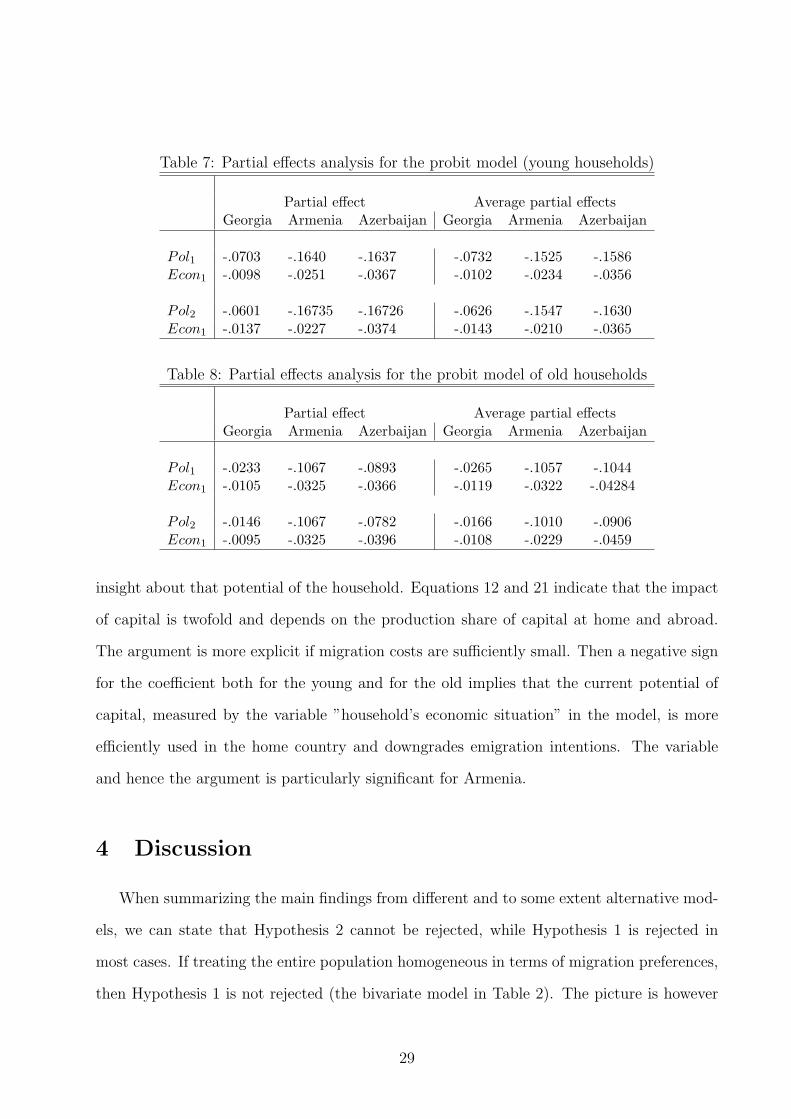
Table 7: Partial effects analysis for the probit model (young households)
Partial effect Average partial effectsGeorgia Armenia Azerbaijan Georgia Armenia Azerbaijan
Pol1 -.0703 -.1640 -.1637 -.0732 -.1525 -.1586Econ1 -.0098 -.0251 -.0367 -.0102 -.0234 -.0356
Pol2 -.0601 -.16735 -.16726 -.0626 -.1547 -.1630Econ1 -.0137 -.0227 -.0374 -.0143 -.0210 -.0365
Table 8: Partial effects analysis for the probit model of old households
Partial effect Average partial effectsGeorgia Armenia Azerbaijan Georgia Armenia Azerbaijan
Pol1 -.0233 -.1067 -.0893 -.0265 -.1057 -.1044Econ1 -.0105 -.0325 -.0366 -.0119 -.0322 -.04284
Pol2 -.0146 -.1067 -.0782 -.0166 -.1010 -.0906Econ1 -.0095 -.0325 -.0396 -.0108 -.0229 -.0459
insight about that potential of the household. Equations 12 and 21 indicate that the impact
of capital is twofold and depends on the production share of capital at home and abroad.
The argument is more explicit if migration costs are sufficiently small. Then a negative sign
for the coefficient both for the young and for the old implies that the current potential of
capital, measured by the variable ”household’s economic situation” in the model, is more
efficiently used in the home country and downgrades emigration intentions. The variable
and hence the argument is particularly significant for Armenia.
4 Discussion
When summarizing the main findings from different and to some extent alternative mod-
els, we can state that Hypothesis 2 cannot be rejected, while Hypothesis 1 is rejected in
most cases. If treating the entire population homogeneous in terms of migration preferences,
then Hypothesis 1 is not rejected (the bivariate model in Table 2). The picture is however
29
substantially different when running separate models for the young and for the old. In par-
ticular, political factors are more influential for both young and old households in Armenia
than in Azerbaijan. We rewrite partial impacts with respect to the political index for the
young,
∂Prob(I∗ = 1)
∂ log(1− q1)= −η[(1 + θ) + θλq]G
′(z). (29)
Young households in Armenia can be more sensitive to the change in political institu-
tions, if the latter is more path-dependent than that in Azerbaijan, λARMq > λARM
q . Young
households form expectations for the next period political institutions, and the strong per-
sistence in the dynamics (high λq) translates into high responses of emigration intentions
today. Current political institutions can be better in Armenia but if the deterioration of
institutions are expected to be magnified more in Armenia than in Azerbaijan for the second
period of life, then the young in Armenia is likely to be more vulnerable.
Grigoryan (2014b) plots a democracy index from the Policy-IV dataset, which is constant
for Azerbaijan for the last 20 years and patterns limited volatility for Armenia. Little changes
in political institutions may quickly vanish in Azerbaijan, while they might be amplified
in Armenia, taking into account the transition the country is experiencing as ”incomplete
democracy” or ”anocracy” (Marshall et al. (2012), Grigoryan (2013)). Grigoryan (2014a),
on the other hand, finds that the push factors for emigration intentions in Armenia are
rather non-economic, further suggesting that the future development of the country may
well determine current emigration tendencies. We elaborate on the argument in a more
detail below.
From Grigoryan (2014b) we learn that the current tax policy is a function of power
concentration. For our purpose, we can write (17) in the form
log ht+1 = µ+ λq log ht + (1− λq) logwt, (30)
where h = 1 − q and w = 1 − τ . The policy function is τ ∗t = τ(qt; vt, z), where vt is
the vector of all other variables and z is the vector of parameters, can be translated into
30
w∗
t = w(ht; vt, z). Then, (30) can be rewritten as
log ht+1 = µ+ λq log ht + (1− λq) logwt(ht; vt, z). (31)
The change in current political institutions brings to a corresponding change in the next
period political institutions:
d log ht+1
d log ht
= λq + (1− λq)∂wt(ht; vt, z)
∂ht
. (32)
The direct impact of the current political institutions (ht) to its next period value (ht+1) is
captured by λq. The indirect impact is channeled by the economic policy, ∂wt(ht;vt,z)∂ht
, scaled by
the factor (1−λq). Important to our econometric analysis, we may have a change in economic
policies not triggered by political institutions, but some other factors entering in vt. If we
think that there two steady states, namely, perfect autocracy (h = 0) and perfect democracy
(h = 1), a given country should gradually converge to either of two states. As plotted in
Figure 8, countries closer to either of absorbing states, will have λq lower than countries
in the middle. The economic policy component in (31) with a (potentially) nonlinear slop
(1 − λq)∂wt(ht;vt,z)
∂ht, will perturb the graph log ht+1 = λq log ht. If current economic policies
bring drastic changes in future political institutions, then the resulting dynamic rule for the
evolution of political institutions can be very different from its component driven by current
political institutions. The dashed line is the complete dynamic rule for the evolution of
political institutions, given by (31).
Current states of political institutions are specified following to the rank on the democ-
racy index by Polity-IV in Grigoryan (2014b) (and by others such as Freedom House, Trans-
parency International etc). Gradual convergence of political institutions is properly identified
for Georgia converging to perfect democracy (h = 1) and for Azerbaijan converging to per-
fect autocracy (h = 0). The dynamics of political institutions in Armenia depends on the
current state: if the country is at h0 < h∗ (log h0 < log h∗), it will move towards perfect
31
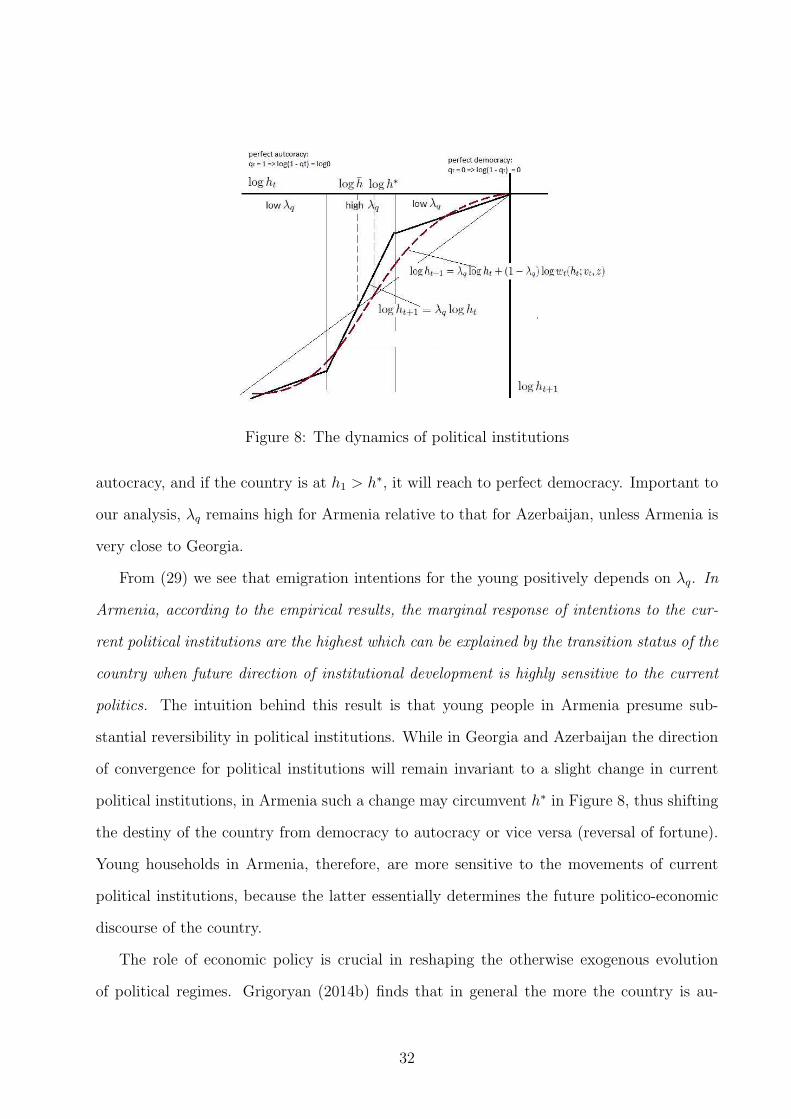
Figure 8: The dynamics of political institutions
autocracy, and if the country is at h1 > h∗, it will reach to perfect democracy. Important to
our analysis, λq remains high for Armenia relative to that for Azerbaijan, unless Armenia is
very close to Georgia.
From (29) we see that emigration intentions for the young positively depends on λq. In
Armenia, according to the empirical results, the marginal response of intentions to the cur-
rent political institutions are the highest which can be explained by the transition status of the
country when future direction of institutional development is highly sensitive to the current
politics. The intuition behind this result is that young people in Armenia presume sub-
stantial reversibility in political institutions. While in Georgia and Azerbaijan the direction
of convergence for political institutions will remain invariant to a slight change in current
political institutions, in Armenia such a change may circumvent h∗ in Figure 8, thus shifting
the destiny of the country from democracy to autocracy or vice versa (reversal of fortune).
Young households in Armenia, therefore, are more sensitive to the movements of current
political institutions, because the latter essentially determines the future politico-economic
discourse of the country.
The role of economic policy is crucial in reshaping the otherwise exogenous evolution
of political regimes. Grigoryan (2014b) finds that in general the more the country is au-
32
tocratic, the heavier is the the excessive tax rate (except the first 2-3 periods), suggesting
that economic policies amplify political rigidities rather mitigate them. The flipping point
h∗ is then expected to be higher for the complete dynamic rule that that for the rule with-
out economic policy component (log ht+1 = λq log ht). Suppose the country country starts
from log h0 ∈ (log h, log h∗). Then, if economic policy had not affect next period political
institutions, the country would have converged to perfect democracy. Economic policy, nev-
ertheless, further deteriorates political institutions and the country will converge to perfect
autocracy. Of course, one can draw a scenario in which h∗ < h, in which economic policy
will rather help the country converge to perfect democracy.
For old households, the partial impact formula is
∂Prob(I∗ = 1)
∂ log(1− q2)= −
1− γ
γG′(z).
Here, the response of emigration intentions to the political index merely depends on the share
of the government’s contribution to the production process - a high share of government in-
vestments, 1 - γ, amplifies the response. Recalling that in the model we allow governments
to be non-benevolent, larger participation of the government in business brings more dis-
tortion, and this intensifies emigration intentions. Our results suggest that old households
in Armenia may reflect stronger intentions to emigrate at the margin, because the govern-
ment harms the private business more severely, in terms of providing, e.g., green light to
monopolists, public goods with higher costs etc, which are eventually transformed to a larger
destruction in value creation. In Azerbaijan, people may not feel the burden to such a high
extent, because of the very high concentration of the oil sector, distinct from the private
business. The above argument is also valid for young households.
33
5 Conclusion
This paper elaborates on the theoretical model by Grigoryan (2014b) and derives testable
hypotheses on the causal relationship between politico-economic factors and emigration in-
tentions for the South Caucasian countries. These hypotheses are then tested using Caucasus
Barometer Dataset for the period 2010-2013.
Theoretical partial impacts of emigration intentions with respect to power concentration
and the excessive tax rate convey information relevant for the interpretation of empirical
findings. For young households, the dynamic rule of power concentration directly enters the
partial impact formula and explains why the response of emigration intentions to power con-
centration is the highest in Armenia, contrary to the initial claim that partial impacts can
be ordered following to the rank of democracy stock in the three countries. While Georgia
is getting closer to democracy and Azerbaijan is rather perceived as an autocratic state, Ar-
menia navigates between the two extremes, and any slight change in political institutions in
either of directions creates a resonance for the young in terms of updating migration related
decisions. Young households are specifically vulnerable to the arrangements of political insti-
tutions, as the quality of the second period life is essentially determined by current political
institutions. Both young and old households are concerned with the government’s involve-
ment in production, which brings distortions to this process. According to the empirical
results, old households in Armenia are more sensitive to these distortions in the context of
migration decision making and, as in the young households’ case, Azerbaijan is in the second
place. Our empirical evidence therefore rejects Hypothesis 1.
The response of emigration intentions to the economic policy index is effectively ordered
according to Hypothesis 2. The de-facto measure of power concentration enters the formula
for the young and lonely constitutes the partial impact for the old. As a consequence, the
country rank of the democracy stock, measured by power concentration, is preserved for the
economic policy index.
Our empirical framework enables to test Gugushvili (2011) hypothesis ”...that in an
34
authoritative political system (Azerbaijan), political attitudes are more important for emi-
gration than economic conditions, while in more troubled economic environment (Georgia)
material conditions are more decisive for emigration than political attitudes”. Based on
different and more robust methodology, our findings fail to support Gugushvili (2011) hy-
pothesis, both for economic conditions and for the policy index reflecting the quality of
economic institutions.
Our findings emphasize the role of political and/or economic reforms in shaping emi-
gration moods for young households with forward looking nature. The marginal change in
intentions particularly depends on the extent by which current policies affect the next period
political institutions17. Current economic policies therefore can drastically change the emi-
gration intentions for the young through the expectations for the second period outcomes. If
the current government is able to launch reforms, either economic or political, it will provide
an opportunity to reverse the destiny of the country and move towards democracy. The
argument opens a room for the debate that no matter how deteriorated current institutions
are (causing high population outflows from the country), current politico-economic reforms
can bring a ”within a period” impact on emigration moods among young households.
We also estimate the impact of migrant social capital on emigration intentions. The
impact is significant for the young households, but not for the old. Somewhat surprisingly,
years of education and work experience are insignificant in all regressions. Respondents’ low
selectivity on these skill measures suggests that emigration intentions are uniformly spread
over the population, known as mass migration (for revealed actions) in the literature.
17This is embedded in λ (Equation 19) for political reforms and in (1 − λq) (Equation 20) for economicreforms.
35

Appendix
36
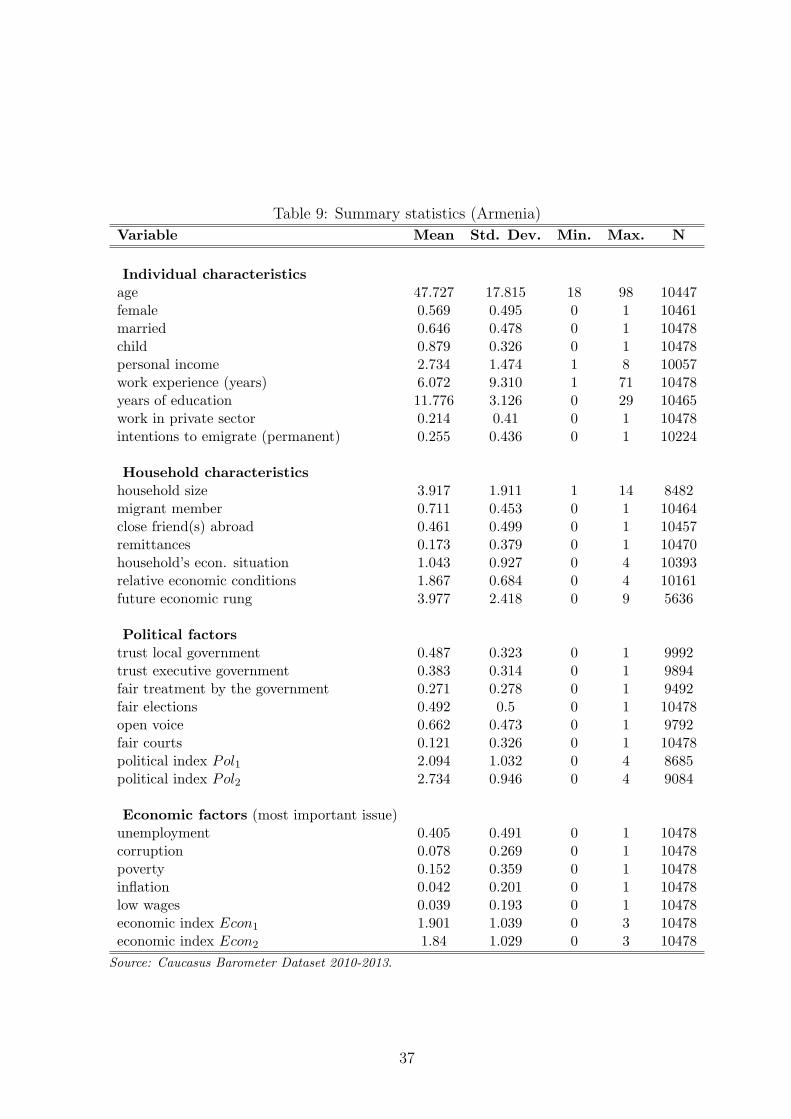
Table 9: Summary statistics (Armenia)
Variable Mean Std. Dev. Min. Max. N
Individual characteristics
age 47.727 17.815 18 98 10447female 0.569 0.495 0 1 10461married 0.646 0.478 0 1 10478child 0.879 0.326 0 1 10478personal income 2.734 1.474 1 8 10057work experience (years) 6.072 9.310 1 71 10478years of education 11.776 3.126 0 29 10465work in private sector 0.214 0.41 0 1 10478intentions to emigrate (permanent) 0.255 0.436 0 1 10224
Household characteristics
household size 3.917 1.911 1 14 8482migrant member 0.711 0.453 0 1 10464close friend(s) abroad 0.461 0.499 0 1 10457remittances 0.173 0.379 0 1 10470household’s econ. situation 1.043 0.927 0 4 10393relative economic conditions 1.867 0.684 0 4 10161future economic rung 3.977 2.418 0 9 5636
Political factors
trust local government 0.487 0.323 0 1 9992trust executive government 0.383 0.314 0 1 9894fair treatment by the government 0.271 0.278 0 1 9492fair elections 0.492 0.5 0 1 10478open voice 0.662 0.473 0 1 9792fair courts 0.121 0.326 0 1 10478political index Pol1 2.094 1.032 0 4 8685political index Pol2 2.734 0.946 0 4 9084
Economic factors (most important issue)unemployment 0.405 0.491 0 1 10478corruption 0.078 0.269 0 1 10478poverty 0.152 0.359 0 1 10478inflation 0.042 0.201 0 1 10478low wages 0.039 0.193 0 1 10478economic index Econ1 1.901 1.039 0 3 10478economic index Econ2 1.84 1.029 0 3 10478
Source: Caucasus Barometer Dataset 2010-2013.
37
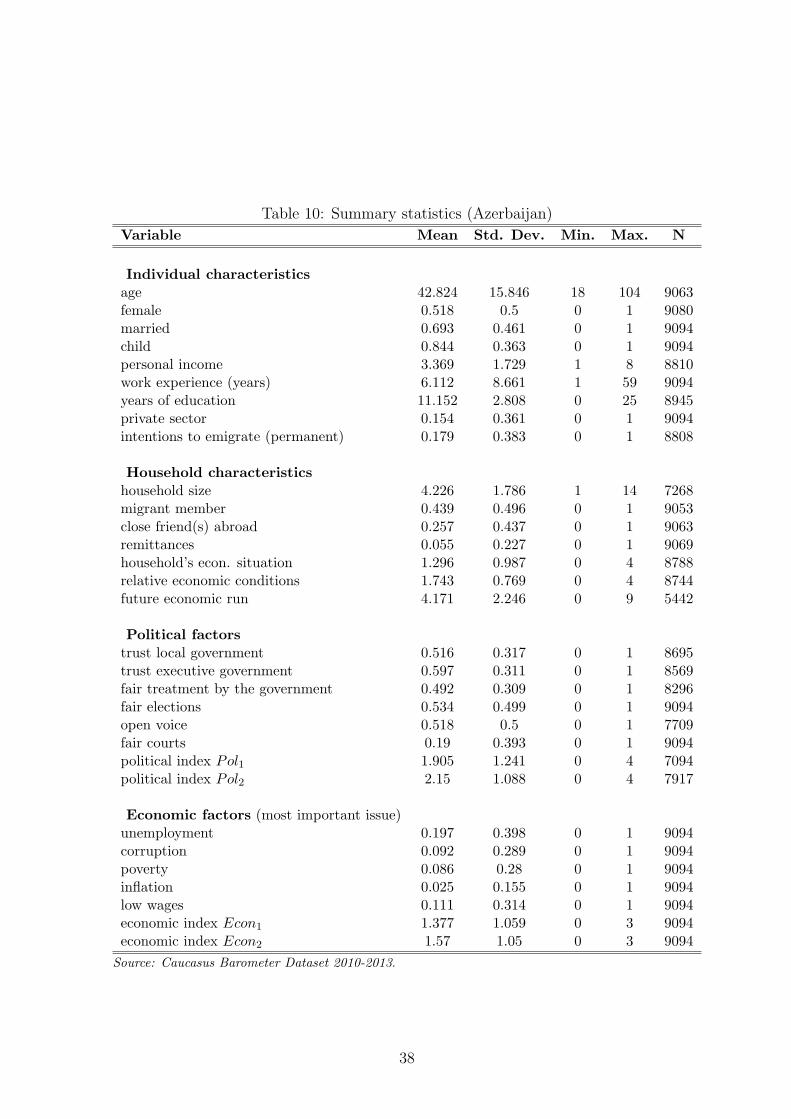
Table 10: Summary statistics (Azerbaijan)
Variable Mean Std. Dev. Min. Max. N
Individual characteristics
age 42.824 15.846 18 104 9063female 0.518 0.5 0 1 9080married 0.693 0.461 0 1 9094child 0.844 0.363 0 1 9094personal income 3.369 1.729 1 8 8810work experience (years) 6.112 8.661 1 59 9094years of education 11.152 2.808 0 25 8945private sector 0.154 0.361 0 1 9094intentions to emigrate (permanent) 0.179 0.383 0 1 8808
Household characteristics
household size 4.226 1.786 1 14 7268migrant member 0.439 0.496 0 1 9053close friend(s) abroad 0.257 0.437 0 1 9063remittances 0.055 0.227 0 1 9069household’s econ. situation 1.296 0.987 0 4 8788relative economic conditions 1.743 0.769 0 4 8744future economic run 4.171 2.246 0 9 5442
Political factors
trust local government 0.516 0.317 0 1 8695trust executive government 0.597 0.311 0 1 8569fair treatment by the government 0.492 0.309 0 1 8296fair elections 0.534 0.499 0 1 9094open voice 0.518 0.5 0 1 7709fair courts 0.19 0.393 0 1 9094political index Pol1 1.905 1.241 0 4 7094political index Pol2 2.15 1.088 0 4 7917
Economic factors (most important issue)unemployment 0.197 0.398 0 1 9094corruption 0.092 0.289 0 1 9094poverty 0.086 0.28 0 1 9094inflation 0.025 0.155 0 1 9094low wages 0.111 0.314 0 1 9094economic index Econ1 1.377 1.059 0 3 9094economic index Econ2 1.57 1.05 0 3 9094
Source: Caucasus Barometer Dataset 2010-2013.
38
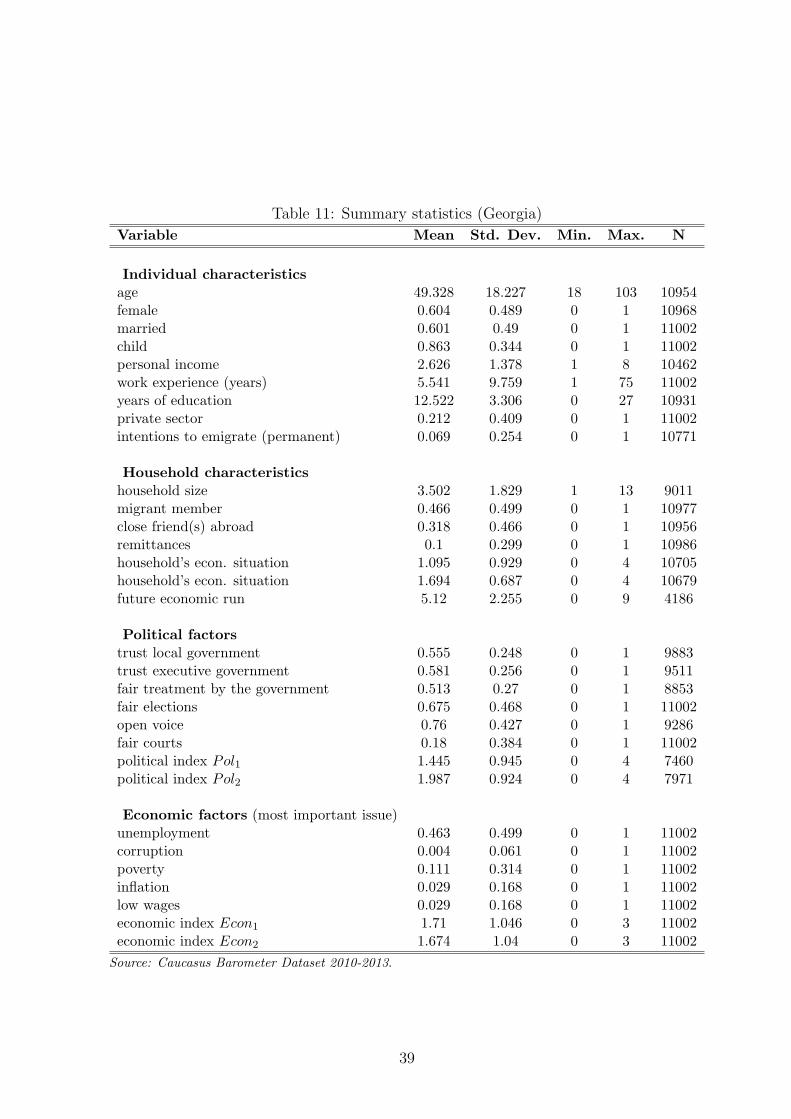
Table 11: Summary statistics (Georgia)
Variable Mean Std. Dev. Min. Max. N
Individual characteristics
age 49.328 18.227 18 103 10954female 0.604 0.489 0 1 10968married 0.601 0.49 0 1 11002child 0.863 0.344 0 1 11002personal income 2.626 1.378 1 8 10462work experience (years) 5.541 9.759 1 75 11002years of education 12.522 3.306 0 27 10931private sector 0.212 0.409 0 1 11002intentions to emigrate (permanent) 0.069 0.254 0 1 10771
Household characteristics
household size 3.502 1.829 1 13 9011migrant member 0.466 0.499 0 1 10977close friend(s) abroad 0.318 0.466 0 1 10956remittances 0.1 0.299 0 1 10986household’s econ. situation 1.095 0.929 0 4 10705household’s econ. situation 1.694 0.687 0 4 10679future economic run 5.12 2.255 0 9 4186
Political factors
trust local government 0.555 0.248 0 1 9883trust executive government 0.581 0.256 0 1 9511fair treatment by the government 0.513 0.27 0 1 8853fair elections 0.675 0.468 0 1 11002open voice 0.76 0.427 0 1 9286fair courts 0.18 0.384 0 1 11002political index Pol1 1.445 0.945 0 4 7460political index Pol2 1.987 0.924 0 4 7971
Economic factors (most important issue)unemployment 0.463 0.499 0 1 11002corruption 0.004 0.061 0 1 11002poverty 0.111 0.314 0 1 11002inflation 0.029 0.168 0 1 11002low wages 0.029 0.168 0 1 11002economic index Econ1 1.71 1.046 0 3 11002economic index Econ2 1.674 1.04 0 3 11002
Source: Caucasus Barometer Dataset 2010-2013.
39
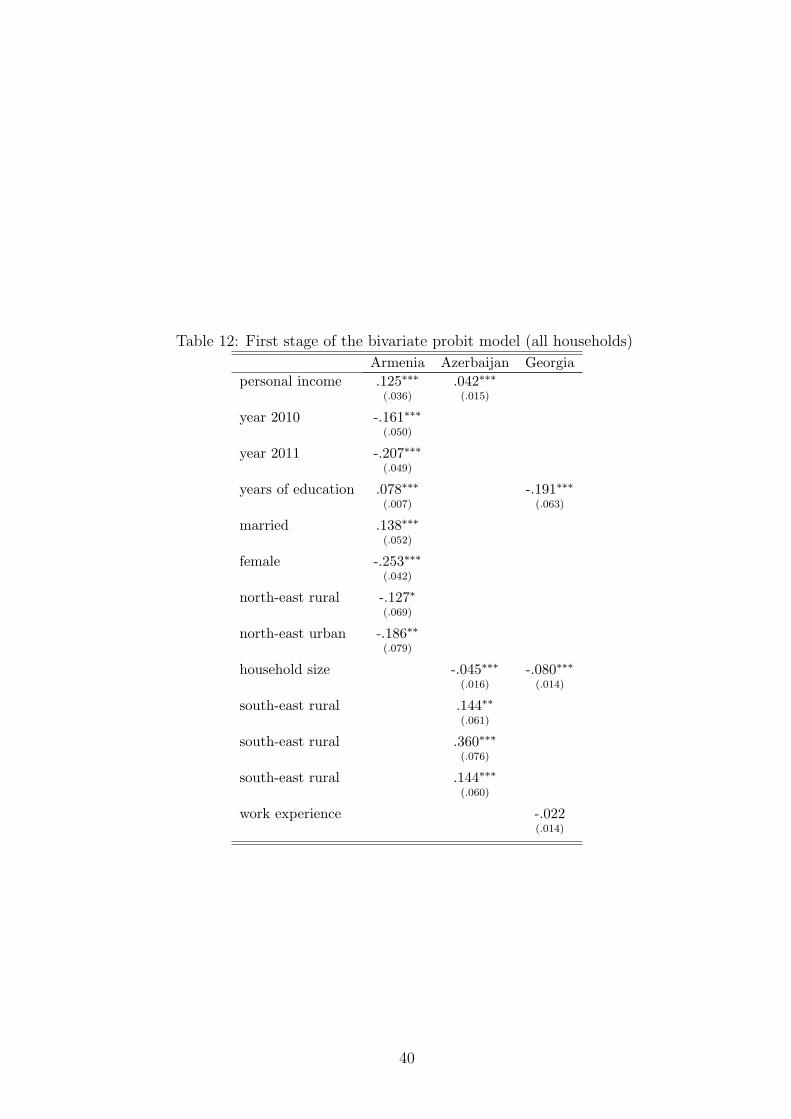
Table 12: First stage of the bivariate probit model (all households)
Armenia Azerbaijan Georgia
personal income .125∗∗∗ .042∗∗∗
(.036) (.015)
year 2010 -.161∗∗∗
(.050)
year 2011 -.207∗∗∗
(.049)
years of education .078∗∗∗ -.191∗∗∗
(.007) (.063)
married .138∗∗∗
(.052)
female -.253∗∗∗
(.042)
north-east rural -.127∗
(.069)
north-east urban -.186∗∗
(.079)
household size -.045∗∗∗ -.080∗∗∗
(.016) (.014)
south-east rural .144∗∗
(.061)
south-east rural .360∗∗∗
(.076)
south-east rural .144∗∗∗
(.060)
work experience -.022(.014)
40
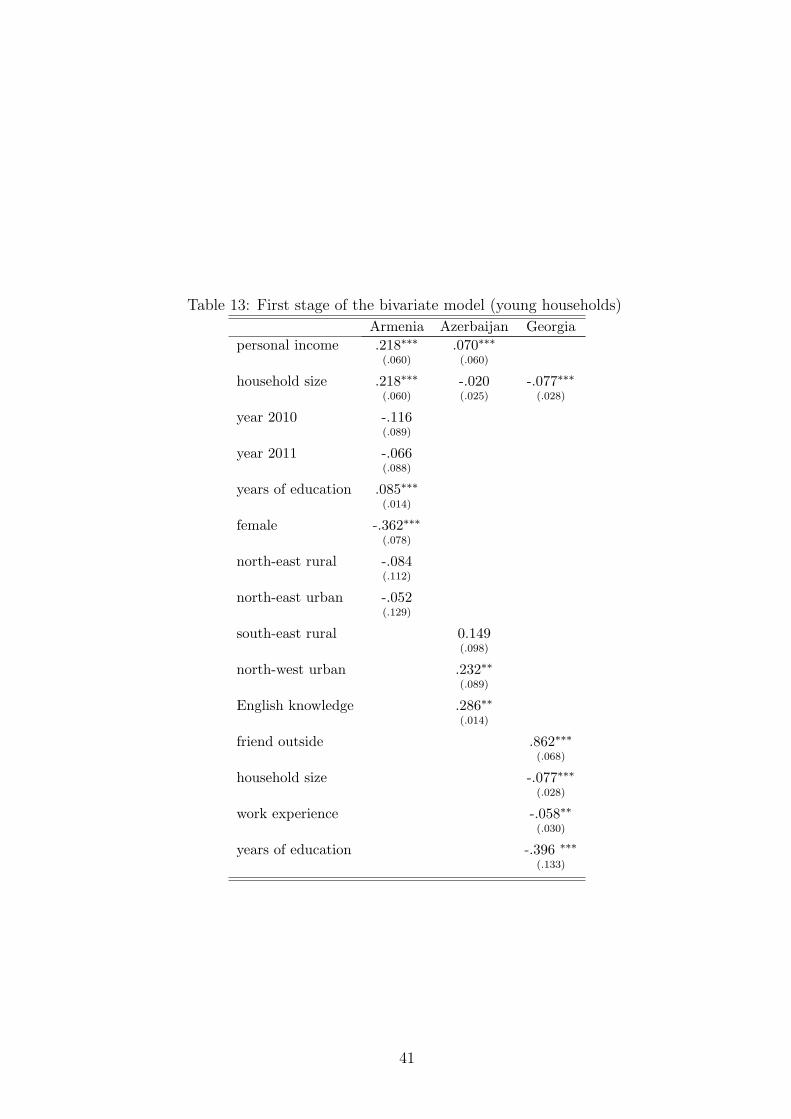
Table 13: First stage of the bivariate model (young households)
Armenia Azerbaijan Georgia
personal income .218∗∗∗ .070∗∗∗
(.060) (.060)
household size .218∗∗∗ -.020 -.077∗∗∗
(.060) (.025) (.028)
year 2010 -.116(.089)
year 2011 -.066(.088)
years of education .085∗∗∗
(.014)
female -.362∗∗∗
(.078)
north-east rural -.084(.112)
north-east urban -.052(.129)
south-east rural 0.149(.098)
north-west urban .232∗∗
(.089)
English knowledge .286∗∗
(.014)
friend outside .862∗∗∗
(.068)
household size -.077∗∗∗
(.028)
work experience -.058∗∗
(.030)
years of education -.396 ∗∗∗
(.133)
41
References
Daron Acemoglu, Simon Johnson, and James A Robinson. Institutions as the fundamental
cause of long-run growth. CEPR Discussion Papers 4458, C.E.P.R. Discussion Papers,
June 2004.
J. Andreoni. Giving with impure altruism: Applications to charity and ricardian equivalence.
Journal of Political Economy, 97(6):1447–58, December 1989.
B Douglas Bernheim, Andrei Shleifer, and Lawrence H Summers. The strategic bequest
motive. Journal of Political Economy, 93(6):1045–76, December 1985.
George J Borjas. Self-selection and the earnings of immigrants. American Economic Review,
77(4):531–53, September 1987.
Donald Cox, Zekeriya Eser, and Emmanuel Jimenez. Motives for private transfers over
the life cycle: An analytical framework and evidence for peru. Journal of Development
Economics, 55:57–80, January 1998.
Zvezda Dermendzhieva. Emigration from the south caucasus: who goes abroad and what
are the economic implications? Post-Communist Economies, 23(3), 2011.
Christian Dustmann and Oliver Kirchkamp. The optimal migration duration and activity
choice after re-migration. IZA Discussion Papers 266, Institute for the Study of Labor
(IZA), February 2001.
Filiz Garip. Social capital and migration: How do similar resources lead to divergent out-
comes? Demography, 45(3):591–617, 2008.
Theodore P. Gerber and Karine Torosyan. Remittances in the republic of georgia: correlates,
economic impact, and social capital formation. Demography, 50:pp. 12791301, 2013.
Aleksandr Grigoryan. A model for anocracy. forthcoming in Journal of Income distribution
(forthcoming), 4(1):37–74, 03 2013.
42
Aleksandr Grigoryan. Who else emigrates from armenia? evidence from intentions. Working
paper, American University of Armenia, 2014a.
Aleksandr Grigoryan. Power and migration. Working paper, American University of Arme-
nia, 2014b.
Alex Gugushvili. Demographic discontent and emigration: do political attitudes explain
emigration intentions? Working paper, European University Institute, 2011.
James J. Heckman. Dummy endogenous variables in a simultaneous equation system. Econo-
metrica, 46(4):931–959, July 1978.
John Hoddinott. A model of migration and remittances applied to western kenya. Oxford
Economic Papers, 46(3):pp. 459–476, 1994.
Robert E B Lucas and Oded Stark. Motivations to remit: Evidence from botswana. Journal
of Political Economy, 93(5):901–18, October 1985.
G.S. Maddala. Limited-Dependent and Qualitative Variables in Econometrics. Cambridge
University Press, Cambridge UK, 1983.
Monty G. Marshall, Ted Robert Gurr, and Keith Jaggers. Political regime characteristics
and transitions, 1800-2012. User manual, Center for Systemic Peace, 2012.
Tigran A. Melkonyan and David A. Grigorian. Microeconomic implications of remittances
in an overlapping generations model with altruism and a motive to receive inheritance.
The Journal of Development Studies, 48(8):1026–1044, March 2011.
Alejandro Portes. Social capital: Its origins and applications in modern sociology. Annual
Review of Sociology, 24:pp. 1–24, 1998.
Hillel Rapoport and Frdric Docquier. The economics of migrants remittances. IZA Discussion
Papers 1531, Institute for the Study of Labor (IZA), March 2005.
43
Hillel Rapoport and Frederic Docquier. Are migrant minorities strategically self-selected?
Journal of Population Economics, 11(4):579–588, 1998.
Oded Stark. Altruism and Beyond. Cambridge Books. Cambridge University Press, 1995.
Oded Stark and Robert E B Lucas. Migration, remittances, and the family. Economic
Development and Cultural Change, 36(3):465–81, April 1988.
J. Edward Taylor. The new economics of labour migration and the role of remittances in
the migration process. International Migration, 37:63–88, 1999.
H.P. van Dalen and K. Henkens. Emigration Intentions: Mere Words or True Plans? Ex-
plaining International Migration Intentions and Behavior. Technical report, 2008.
H.P. van Dalen, G. Groenewold, and T. Fokkema. The effect of remittances on emigration
intentions in egypt, morocco, and turkey. Population Studies, 59(3):375–392, November
2005.
Jeffrey M Wooldridge. Econometric Analysis of Cross Section and Panel Data, volume 1 of
MIT Press Books. The MIT Press, September 2010.
44