Embed Size (px)
Citation preview
www.newphytologist.org
1
Research
Blackwell Publishing, Ltd.
Elevated CO
2
reduces leaf damage by insect herbivores in
a forest community
Rachel G. Knepp
1
, Jason G. Hamilton,
2
Jacqueline E. Mohan
3
, Arthur R. Zangerl
4
, May R. Berenbaum
4
and Evan H. DeLucia
1
1
Department of Plant Biology, University of Illinois, Urbana, IL 61820, USA;
2
Department of Biology, Ithaca College, Ithaca, NY 14850, USA;
3
Department
of Organismic and Evolutionary Biology, Harvard University, Cambridge, MA 02138, USA;
4
Department of Entomology, University of Illinois, Urbana, IL
61820, USA
Summary
• By altering foliage quality, exposure to elevated levels of atmospheric CO
2
potentiallyaffects the amount of herbivore damage experienced by plants.• Here, we quantified foliar carbon (C) and nitrogen (N) content, C : N ratio, phenoliclevels, specific leaf area (SLA) and the amount of leaf tissue damaged by chewinginsects for 12 hardwood tree species grown in plots exposed to elevated CO
2
(ambientplus 200 µl l
−
1
) using free-air CO
2
enrichment (FACE) over 3 yr.• The effects of elevated CO
2
varied considerably by year and across species. ElevatedCO
2
decreased herbivore damage across 12 species in 1 yr but had no detectableeffect in others. Decreased damage may have been related to lower average foliarN concentration and SLA and increased C : N ratio and phenolic content for somespecies under elevated compared with ambient CO
2
. It remains unclear how thesechanges in leaf properties affect herbivory.• Damage to the leaves of hardwood trees by herbivorous insects may be reducedin the future as the concentration of CO
2
continues to increase, perhaps altering thetrophic structure of forest ecosystems.
Key words:
arthropod, carbon content, global change, herbivory, leaf nitrogen, leafphenolic content, specific leaf area (SLA).
New Phytologist
(2005)
doi
: 10.1111/j.1469-8137.2005.01399.x
©
New Phytologist
(2005)
Author for correspondence:
Evan H. DeLuciaTel: +1 217 3336177Fax:
+
1 217 2447246Email: [email protected]
Received:
19 January 2005
Accepted:
24 January 2005
Introduction
Human activity is increasing the concentration of CO
2
in theatmosphere at the rate of
c
. 0.4% yr
−
1
and it is expected todouble from preindustrial levels by the middle of this century(Houghton
et al
., 2001). Elevated CO
2
can directly affectforest productivity by increasing photosynthesis and nutrientuse efficiency (Drake
et al
., 1997; Curtis & Wang, 1998; Norby
et al
., 1999; D.M. Moore, unpublished), but it may alsoindirectly affect productivity by altering the performance ofherbivores and pathogens. Insect herbivory typically removes2–15% of net primary production in temperate deciduousforests (Whittaker, 1970; Ohmart
et al
., 1983; Cyr & Pace,1993). By altering the chemical composition of foliage(Bezemer & Jones, 1998), elevated CO
2
may change the
impact of herbivores on forest productivity. However, mostresearch has been conducted in controlled environments, andhow insect herbivory may be affected by elevated CO
2
incomplex natural communities is not fully understood.
The stimulation of photosynthesis and accumulation ofnonstructural carbohydrates by elevated CO
2
contributes todilution of foliar nitrogen (N) and a corresponding increasein C : N ratio (Drake
et al
., 1997; Hughes & Bazzaz, 1997).This increase in C : N ratio may reduce the palatability andnutritional quality of foliage to insects and is sometimesassociated with the production of allelochemicals, such asphenolics, which deter herbivory (Bryant
et al
., 1983; Agrell
et al
., 2000; Lindroth
et al
., 2001). Insect growth and metab-olism often are N-limited and can respond strongly to leaf Ncontent (Mattson, 1980; Scriber & Slansky, 1981). Consequently,
www.newphytologist.org
©
New Phytologist
(2005)
Research2
reduced N content in foliage under elevated CO
2
can decreaseinsect performance and increase mortality (Stiling
et al
.,1999). For plants grown under elevated CO
2
, increased percapita feeding by chewing insects (compensatory feeding)generally has been associated with low leaf N content andhigh C : N ratios (Bezemer & Jones, 1998; Coviella & Trumble,1999; Hunter, 2001). However, an increase in per capitaconsumption of foliage under elevated CO
2
in laboratory orgreenhouse trials does not necessarily result in increased her-bivory in native forest communities (Hamilton
et al
., 2004).In nature, plant physiological responses to elevated CO
2
interact with other sources of environmental variation (Arnone
et al
., 1995; Roth
et al
., 1997; McDonald
et al
., 1999) or varyamong species (Lindroth
et al
., 1993; Bezemer & Jones, 1998;Williams
et al
., 2000) and even among genotypes (Goverde
et al
., 1999; Mansfield
et al
., 1999; Lindroth
et al
., 2001),potentially complicating the interactions between plants andinsects. In addition, there is considerable variation in the effectof elevated CO
2
on insect feeding and oviposition preferenceand demography (Stange
et al
., 1995; Stiling
et al
., 1999;Stiling
et al
., 2002; Kopper & Lindroth, 2003b). Furthermore,larval feeding trials under controlled conditions may notcapture the multitrophic interactions that occur in forestsecosystems (Lincoln
et al
., 1993; Arnone
et al
., 1995; Coviella& Trumble, 1999; Hunter, 2001).
Hamilton
et al
. (2004) found that most damage to the foliageof four species of hardwood saplings (1–3 m high) growing inthe understory of a pine forest was from chewing insects and theamount of damage was substantially lower in plots exposed toelevated atmospheric CO
2
compared with plots under ambientconditions. In that experiment, CO
2
concentration wascontrolled by free-air CO
2
enrichment (FACE) technology,which distributes CO
2
throughout the forest without enclosuresthat restrict the movement of insects and other organisms(Hendrey & Kimball, 1994; Lewin
et al
., 1994; Hendrey
et al
., 1999).In the present study we examined the effect of elevated CO
2
on damage by chewing insects on saplings of seven (2002) and12 (2001, 2003) hardwood species growing in the same forestunderstory as Hamilton
et al
. (2004). To capture annualvariation in the interaction between plant and insect responsesto elevated CO
2
, measurements were made over three growingseasons. Aspects of leaf chemistry, including N, C and tanninconcentration and specific leaf area (SLA), were measured toelucidate potential mechanisms governing the effect of CO
2
on herbivory.
Materials and Methods
Leaf damage by chewing insects was quantified on saplingsof 12 species of hardwood trees growing in the understory ofa 17-yr-old loblolly pine plantation and exposed to ambientor elevated levels of atmospheric CO
2
. Research was conductedat the Forest Atmosphere Carbon Dioxide Transfer and Storage-1
(FACTS-1) research site in the Piedmont region of NorthCarolina, USA (35
°
97
′
N 79
°
09
′
W). At the FACTS-1site, the CO
2
concentration in three, 30-m diameter plots waselevated with a free-air CO
2
enrichment (FACE) system(Hendrey & Kimball, 1994; Lewin
et al
., 1994; Hendrey
et al
., 1999). Beginning in 1996, the FACE system was usedto raise the concentration of CO
2
in the forest canopyby 200 µl l
−
1
above current levels (
c
. 577 µl l
−
1
at 1 m and
c
.586 µl l
−
1
at 0.25 m height; G.R. Hendrey, pers. comm.).This level was chosen to represent the CO
2
concentrationpredicted for the year 2050 (Houghton
et al
., 2001). Threeadditional fully instrumented control plots received ambientair (CO
2
386
±
27 µl l
−
1
). The pine canopy provided completecover (DeLucia
et al
., 2002) and saplings in the understory werein shade; the average photon flux density in the understory was121 µmol m
−
2
s
−
1
between 08:00 and 17:00 hours (Singsaas
et al
., 2000).The amount of missing tissue and foliar characteristics were
measured in three consecutive years from 2001 to 2003 onsaplings of hardwood trees species that represent those inregenerating forests in the Piedmont of North Carolina, USA(Mohan, 2002). Because of logistical constraints, not allspecies were measured every year. Leaf damage was measuredon seven of 12 species in all three years:
Acer rubrum
L. (redmaple),
Cercis canadensis
L. (redbud),
Liquidambar styraciflua
L. (sweetgum),
Prunus serotina
Ehrh. (black cherry),
Quercusalba
L. (white oak),
Quercus phellos
L. (willow oak), and
Ulmus alata
Michx. (winged elm). Five additional specieswere measured only in 2001 and 2003:
Acer barbatum
Michx.(sugar maple),
Liriodendron tulipifera
L. (yellow poplar),
Quercus rubra
L. (red oak),
Quercus velutina
Lam. (black oak),and
Robinia pseudo-acacia
L. (black locust). Because these speciesrepresent a range of life history traits (Burns & Honkala,1990), we considered them likely to vary in their responses toelevated CO
2
and herbivory.Tree saplings were grown from seed and transplanted into
the experimental plots. Locally collected, genetically diverseseeds for each species were germinated in a greenhouse, and inOctober 1998 an equal number of 8-month old saplings ofeach species were planted at 30-cm intervals in a randomorder in eight subplots within each of the six FACE plots(2352 seedlings). The eight 1.44 m
2
subplots were evenly dis-tributed within each experimental FACE plot and surroundedby 1-m high wire fencing to reduce vertebrate herbivory(Mohan, 2002). At the time of herbivory measurements,saplings ranged from 10 to 100 cm tall and had been exposedto the elevated CO
2
treatment for at least two full years.The amount of leaf tissue damaged by arthropod herbivory
was quantified using digital photographs taken in mid-June in2001, late June in 2002, and mid-August in 2003. Damagewas defined as tissue area or mass removed by chewing herbiv-ores, which constitutes approximately 66% of all leaf damagein this forest (Hamilton
et al
., 2004). However, discrete sam-pling of folivore damage may underestimate total herbivory
©
New Phytologist (2005) www.newphytologist.org
Research 3
losses by not accounting for leaf or hole expansion andchanges in photosynthetic activity (Reichle et al., 1973;Lowman, 1984; Sand-Jensen & Jacobsen, 1994; Zangerl et al.,2002), although most leaves were fully expanded by the timethey were sampled in June.
Each year, 20 trees of each species were randomly selectedin each FACE plot. Every fully expanded leaf on each of thetrees was given a number and two leaves were selected ran-domly and photographed, yielding 120 leaves for each speciesand treatment (7440 images in total over 3 year). Becausesaplings were small there was no self-shading within theirindividual crowns. Leaves were photographed in situ against acalibrated background with a high-resolution digital camera(Coolpix 950; Nikon, Melville, NY, USA), and the area ofeach leaf was determined with image analysis software (ScionImage, Beta Version 4.0.2; Scion Corp., Frederick, MD,USA). Leaf area before damage was estimated by reconstruct-ing the perimeter of the damaged leaf. The damaged area wasexpressed as the absolute difference between the area of intactand damaged leaves and as a percentage of the area of intactleaves. The mass of tissue removed was estimated from theabsolute area damaged divided by the average specific leaf area(SLA, cm2 g−1) calculated for each subplot.
Leaf tissue was analysed for physical and chemical charac-teristics thought to affect insect performance. Tissue sampleswere collected using a cork borer (0.6 cm2) from randomlyselected undamaged leaves within each plot subplot. Primaryand second order veins were avoided. From each species andtreatment, approximately 45 leaf punches were dried at 70°Cto constant mass and weighed to determine SLA. Carbonand N content per unit dry mass were measured on groundsubsamples with an Elemental Combustion System (Model4010; Costech Analytical Technologies, Valencia, CA, USA).Because only limited quantities of leaf tissue were availablefrom these small plants, especially during the drought in2002, C and N were measured only on black cherry, whiteoak, willow oak, black oak and winged elm, and SLA wasreported for these five species and for red maple and sweetgumin this year.
Protein precipitation capacity was measured for the fouroaks species in 2001 and 2003, and six additional species (redmaple, redbud, sweetgum, black cherry, winged elm and sugarmaple) in 2003. Potential biological tannin activity was quan-tified, with minor modifications, by a protein precipitation–diffusion assay developed by Hagerman (1987). A crude leafextract was prepared by grinding dried leaf tissue (5–150 mg)in a 70% acetone solution (150 µl), and the supernatant(40 µl) was loaded onto 0.8-ml glass tubes containing bovineserum albumin (BSA, Fraction V powder, essentially fatty acidfree, #A-6003; Sigma, Sigma-Aldrich Co., St Louis, MO,USA) added to a buffered agarose solution (Type I, A-6013,Sigma). During a 9-h incubation at 30°C, tannins diffused intothe agarose, creating a visible precipitate. The distance fromthe top of the tube to the precipitate was measured with a
digital dial caliper accurate to 0.01 mm. A linear standardcurve was created by loading different concentrations of tan-nic acid (Baker, Phillipsburg, NJ, USA) onto a subset of tubesand the values for leaf extracts were expressed as tannic acidequivalents, either as the percentage of leaf mass or per unitleaf area.
Leaf damage, foliar C, N and protein precipitation capacity,C : N ratio, and SLA were analysed using a randomizedcomplete block analysis of variance (PROC MIXED; SASVersion 8.1, The SAS Institute, Inc., Cary, NC, USA). Valuesfor plant replicates and subplots were averaged within eachFACE plot before statistical analysis. New individuals weresampled from the population each year and were thereforeassumed to be statistically independent. The CO2 treatment,year, species and their interactions were modeled as fixedeffects, and block and CO2 treatment by block were includedas random effects within the . For herbivory, foliar Cand N content, C : N ratio and SLA, separate statistical anal-yses were performed for the species that were measured in allthree years and for the additional species measured only in2001 and 2003. Separate statistical analyses of protein precip-itation capacity were performed for the four oak species thatwere measured in 2001 and 2003 and the additional sixspecies measured only in 2003. To meet the assumptions ofnormality, data were log- or square root-transformed asrequired and herbivory levels were analysed using subplotmeans. The Kenward–Rogers correction was used to estimatethe degrees of freedom because of the nested design. The rela-tionship between the CO2 treatment effect on insect herbiv-ory and foliar quality (e.g. N and C content, total phenoliccontent, C : N and SLA) were tested with linear regressions( , SAS Institute Inc., Cary, NC, USA). The signifi-cance of the treatment effect within individual species wasdetermined by least-squared differences within an analysis ofvariance. Unless otherwise noted, mean values were consid-ered statistically significant where P < 0.05.
At the level of replication in this experiment (three ambientplots and three plots exposed to elevated CO2) there was agreater than 99% probability of resolving a statistical differ-ence in herbivory between plants grown at ambient andelevated CO2 at a significance level of α = 0.05, if herbivoresremoved, on average, 1.0 ± 0.2 mg of leaf tissue, and thisvalue decreased to a 62% probability of resolving a statisticallysignificant treatment effect for a lower level of leaf damage(0.5 ± 0.2 mg; ).
Results
Across the seven species that were measured in each of thethree years, elevated CO2 caused a reduction in the percentageof leaf area removed by chewing insects (Fig. 1, Table 1, maineffect of CO2, P = 0.10). Growth under elevated CO2 causeda substantial reduction in herbivory in 2001, when across 12species the average damage per leaf under ambient CO2 was
www.newphytologist.org © New Phytologist (2005)
Research4
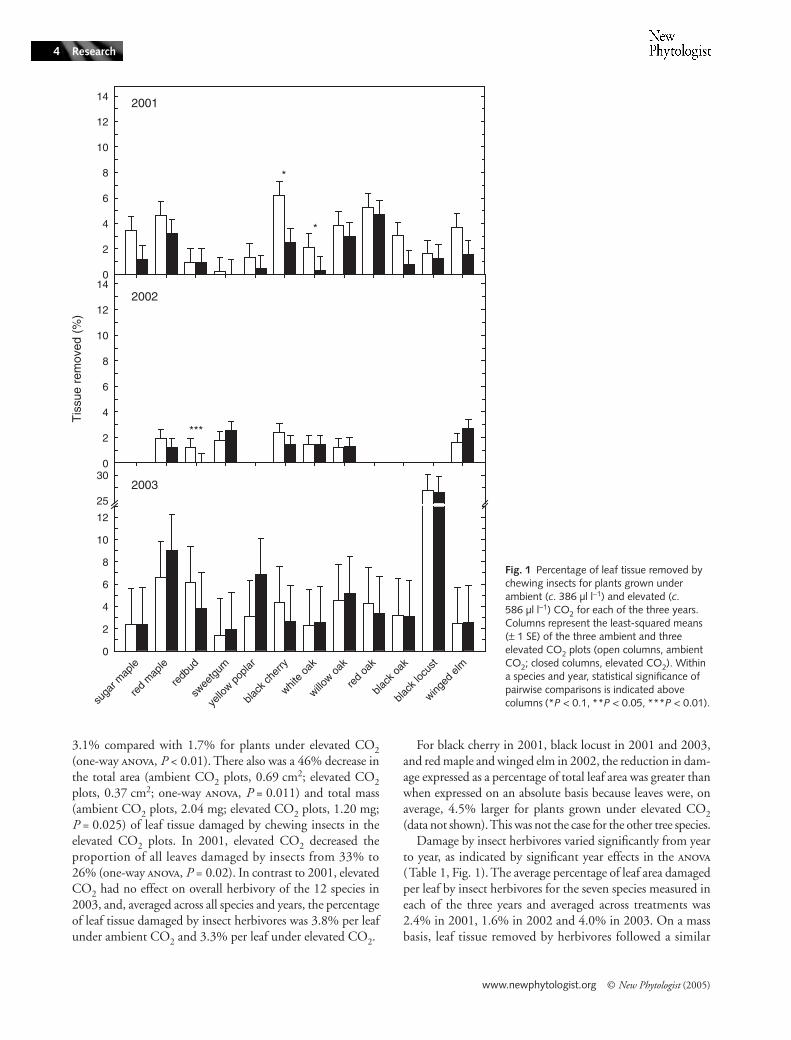
3.1% compared with 1.7% for plants under elevated CO2(one-way , P < 0.01). There also was a 46% decrease inthe total area (ambient CO2 plots, 0.69 cm2; elevated CO2plots, 0.37 cm2; one-way , P = 0.011) and total mass(ambient CO2 plots, 2.04 mg; elevated CO2 plots, 1.20 mg;P = 0.025) of leaf tissue damaged by chewing insects in theelevated CO2 plots. In 2001, elevated CO2 decreased theproportion of all leaves damaged by insects from 33% to26% (one-way , P = 0.02). In contrast to 2001, elevatedCO2 had no effect on overall herbivory of the 12 species in2003, and, averaged across all species and years, the percentageof leaf tissue damaged by insect herbivores was 3.8% per leafunder ambient CO2 and 3.3% per leaf under elevated CO2.
For black cherry in 2001, black locust in 2001 and 2003,and red maple and winged elm in 2002, the reduction in dam-age expressed as a percentage of total leaf area was greater thanwhen expressed on an absolute basis because leaves were, onaverage, 4.5% larger for plants grown under elevated CO2(data not shown). This was not the case for the other tree species.
Damage by insect herbivores varied significantly from yearto year, as indicated by significant year effects in the (Table 1, Fig. 1). The average percentage of leaf area damagedper leaf by insect herbivores for the seven species measured ineach of the three years and averaged across treatments was2.4% in 2001, 1.6% in 2002 and 4.0% in 2003. On a massbasis, leaf tissue removed by herbivores followed a similar
Fig. 1 Percentage of leaf tissue removed by chewing insects for plants grown under ambient (c. 386 µl l−1) and elevated (c. 586 µl l−1) CO2 for each of the three years. Columns represent the least-squared means (± 1 SE) of the three ambient and three elevated CO2 plots (open columns, ambient CO2; closed columns, elevated CO2). Within a species and year, statistical significance of pairwise comparisons is indicated above columns (*P < 0.1, **P < 0.05, ***P < 0.01).
© New Phytologist (2005) www.newphytologist.org
Research 5
pattern: 1.0 mg per leaf, 0.9 mg per leaf, and 1.9 mg per leafin each of the three years, respectively. The average percentagearea damaged per leaf for the five additional species measuredin 2001 and 2003 was 2.3% and 8.2%, respectively, and theaverage mass removed per leaf in these years was 2.4 mg and6.0 mg, respectively.
There was significant variation in the extent of damageamong individual species, but the species with greatest suscep-tibility to damage varied each year (Table 1, Fig. 1). For example,in 2001 damage of red maple, black cherry and red oak wasgreater than most other species. Red maple also had relativelyhigh levels of damage in 2003, but black locust had substan-tially greater damage (27% damage per leaf ) than all otherspecies this year. Sweetgum typically experienced low levels ofdamage (0.2–2.2% damage per leaf; Fig. 1).
Although growth under elevated CO2 decreased N andSLA and increased C : N ratio for individual species (Figs 2–4), it had no detectable main effect on these variables across
all three years of the experiment (Tables 2–4). For the four oakspecies that were measured in 2001 and 2003, there was amarginally significant CO2 × year interaction on protein pre-cipitation capacity expressed as a percentage of leaf mass(P = 0.10, Table 5; Fig. 5) and a significant CO2 × year inter-action when expressed per unit leaf area (P = 0.03). The pro-tein precipitation capacity on an area basis increased by 32%under elevated CO2 compared with ambient CO2 (ambientCO2 plots, 1.0 g m−2; elevated CO2 plots, 1.5 g m−2; one-way , P = 0.07, Table 5).
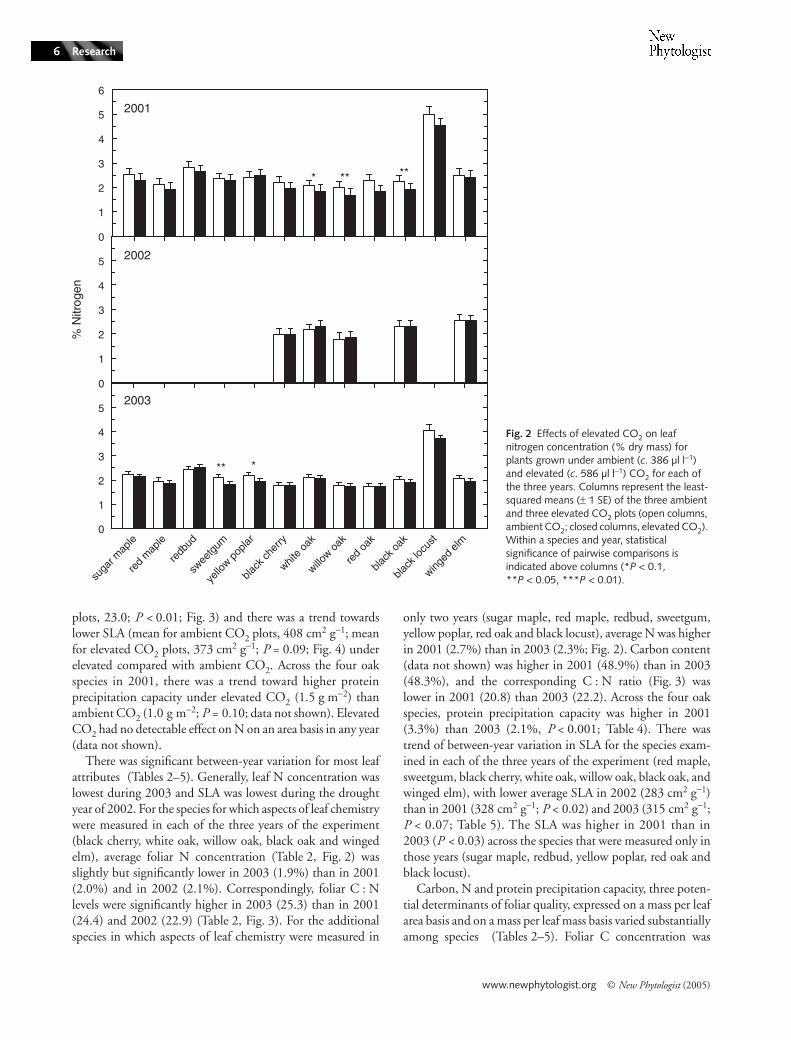
In 2001, the only year with a significant effect of CO2 onherbivory levels, elevated CO2 altered key aspects of leafchemistry and structure thought to affect suitability for insects.Averaged across all 12 species in 2001, there was a statisticallysignificant decrease in average foliar N from 2.5% underambient CO2 to 2.3% under elevated CO2 (Fig. 2; one-way, P < 0.01). In that same year, the C : N ratio wasgreater (mean for ambient plots, 20.9; mean for elevated CO2
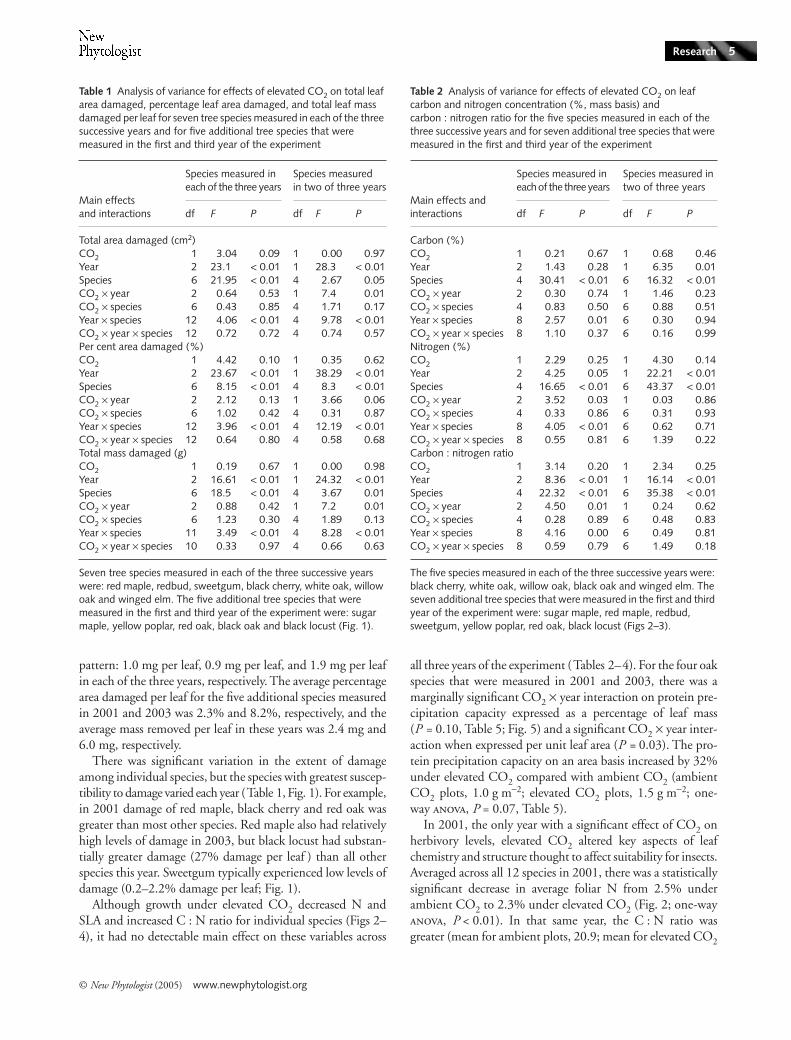
Table 1 Analysis of variance for effects of elevated CO2 on total leaf area damaged, percentage leaf area damaged, and total leaf mass damaged per leaf for seven tree species measured in each of the three successive years and for five additional tree species that were measured in the first and third year of the experiment
Main effects and interactions
Species measured in each of the three years
Species measured in two of three years
df F P df F P
Total area damaged (cm2)CO2 1 3.04 0.09 1 0.00 0.97Year 2 23.1 < 0.01 1 28.3 < 0.01Species 6 21.95 < 0.01 4 2.67 0.05CO2 × year 2 0.64 0.53 1 7.4 0.01CO2 × species 6 0.43 0.85 4 1.71 0.17Year × species 12 4.06 < 0.01 4 9.78 < 0.01CO2 × year × species 12 0.72 0.72 4 0.74 0.57Per cent area damaged (%)CO2 1 4.42 0.10 1 0.35 0.62Year 2 23.67 < 0.01 1 38.29 < 0.01Species 6 8.15 < 0.01 4 8.3 < 0.01CO2 × year 2 2.12 0.13 1 3.66 0.06CO2 × species 6 1.02 0.42 4 0.31 0.87Year × species 12 3.96 < 0.01 4 12.19 < 0.01CO2 × year × species 12 0.64 0.80 4 0.58 0.68Total mass damaged (g)CO2 1 0.19 0.67 1 0.00 0.98Year 2 16.61 < 0.01 1 24.32 < 0.01Species 6 18.5 < 0.01 4 3.67 0.01CO2 × year 2 0.88 0.42 1 7.2 0.01CO2 × species 6 1.23 0.30 4 1.89 0.13Year × species 11 3.49 < 0.01 4 8.28 < 0.01CO2 × year × species 10 0.33 0.97 4 0.66 0.63
Seven tree species measured in each of the three successive years were: red maple, redbud, sweetgum, black cherry, white oak, willow oak and winged elm. The five additional tree species that were measured in the first and third year of the experiment were: sugar maple, yellow poplar, red oak, black oak and black locust (Fig. 1).
Table 2 Analysis of variance for effects of elevated CO2 on leaf carbon and nitrogen concentration (%, mass basis) and carbon : nitrogen ratio for the five species measured in each of the three successive years and for seven additional tree species that were measured in the first and third year of the experiment
Main effects and interactions
Species measured in each of the three years
Species measured in two of three years
df F P df F P
Carbon (%)CO2 1 0.21 0.67 1 0.68 0.46Year 2 1.43 0.28 1 6.35 0.01Species 4 30.41 < 0.01 6 16.32 < 0.01CO2 × year 2 0.30 0.74 1 1.46 0.23CO2 × species 4 0.83 0.50 6 0.88 0.51Year × species 8 2.57 0.01 6 0.30 0.94CO2 × year × species 8 1.10 0.37 6 0.16 0.99Nitrogen (%)CO2 1 2.29 0.25 1 4.30 0.14Year 2 4.25 0.05 1 22.21 < 0.01Species 4 16.65 < 0.01 6 43.37 < 0.01CO2 × year 2 3.52 0.03 1 0.03 0.86CO2 × species 4 0.33 0.86 6 0.31 0.93Year × species 8 4.05 < 0.01 6 0.62 0.71CO2 × year × species 8 0.55 0.81 6 1.39 0.22Carbon : nitrogen ratioCO2 1 3.14 0.20 1 2.34 0.25Year 2 8.36 < 0.01 1 16.14 < 0.01Species 4 22.32 < 0.01 6 35.38 < 0.01CO2 × year 2 4.50 0.01 1 0.24 0.62CO2 × species 4 0.28 0.89 6 0.48 0.83Year × species 8 4.16 0.00 6 0.49 0.81CO2 × year × species 8 0.59 0.79 6 1.49 0.18
The five species measured in each of the three successive years were: black cherry, white oak, willow oak, black oak and winged elm. The seven additional tree species that were measured in the first and third year of the experiment were: sugar maple, red maple, redbud, sweetgum, yellow poplar, red oak, black locust (Figs 2–3).
www.newphytologist.org © New Phytologist (2005)
Research6
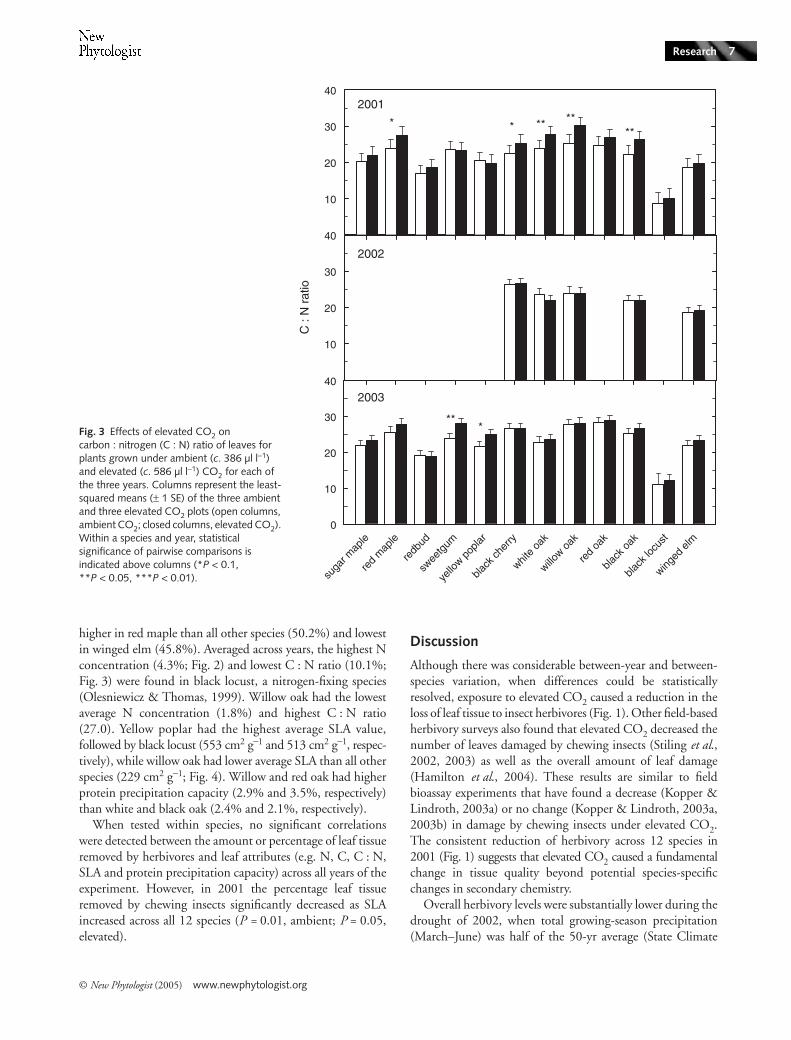
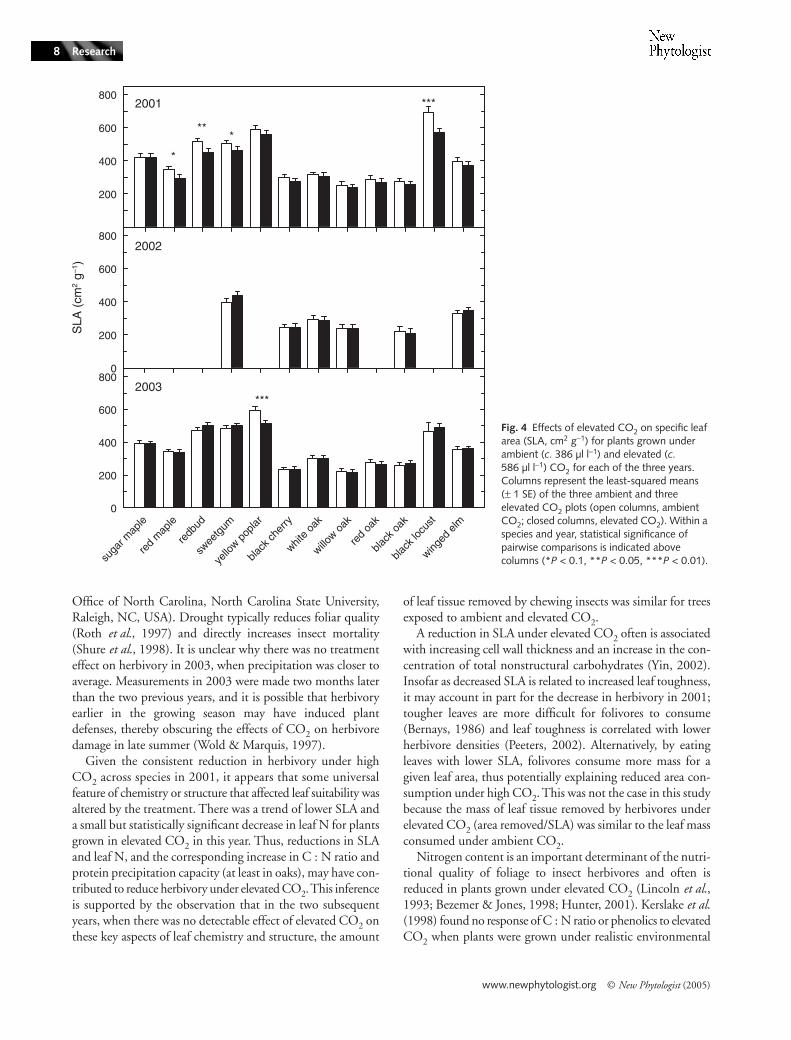
plots, 23.0; P < 0.01; Fig. 3) and there was a trend towardslower SLA (mean for ambient CO2 plots, 408 cm2 g−1; meanfor elevated CO2 plots, 373 cm2 g−1; P = 0.09; Fig. 4) underelevated compared with ambient CO2. Across the four oakspecies in 2001, there was a trend toward higher proteinprecipitation capacity under elevated CO2 (1.5 g m−2) thanambient CO2 (1.0 g m−2; P = 0.10; data not shown). ElevatedCO2 had no detectable effect on N on an area basis in any year(data not shown).
There was significant between-year variation for most leafattributes (Tables 2–5). Generally, leaf N concentration waslowest during 2003 and SLA was lowest during the droughtyear of 2002. For the species for which aspects of leaf chemistrywere measured in each of the three years of the experiment(black cherry, white oak, willow oak, black oak and wingedelm), average foliar N concentration (Table 2, Fig. 2) wasslightly but significantly lower in 2003 (1.9%) than in 2001(2.0%) and in 2002 (2.1%). Correspondingly, foliar C : Nlevels were significantly higher in 2003 (25.3) than in 2001(24.4) and 2002 (22.9) (Table 2, Fig. 3). For the additionalspecies in which aspects of leaf chemistry were measured in
only two years (sugar maple, red maple, redbud, sweetgum,yellow poplar, red oak and black locust), average N was higherin 2001 (2.7%) than in 2003 (2.3%; Fig. 2). Carbon content(data not shown) was higher in 2001 (48.9%) than in 2003(48.3%), and the corresponding C : N ratio (Fig. 3) waslower in 2001 (20.8) than 2003 (22.2). Across the four oakspecies, protein precipitation capacity was higher in 2001(3.3%) than 2003 (2.1%, P < 0.001; Table 4). There wastrend of between-year variation in SLA for the species exam-ined in each of the three years of the experiment (red maple,sweetgum, black cherry, white oak, willow oak, black oak, andwinged elm), with lower average SLA in 2002 (283 cm2 g−1)than in 2001 (328 cm2 g−1; P < 0.02) and 2003 (315 cm2 g−1;P < 0.07; Table 5). The SLA was higher in 2001 than in2003 (P < 0.03) across the species that were measured only inthose years (sugar maple, redbud, yellow poplar, red oak andblack locust).
Carbon, N and protein precipitation capacity, three poten-tial determinants of foliar quality, expressed on a mass per leafarea basis and on a mass per leaf mass basis varied substantiallyamong species (Tables 2–5). Foliar C concentration was
Fig. 2 Effects of elevated CO2 on leaf nitrogen concentration (% dry mass) for plants grown under ambient (c. 386 µl l−1) and elevated (c. 586 µl l−1) CO2 for each of the three years. Columns represent the least-squared means (± 1 SE) of the three ambient and three elevated CO2 plots (open columns, ambient CO2; closed columns, elevated CO2). Within a species and year, statistical significance of pairwise comparisons is indicated above columns (*P < 0.1, **P < 0.05, ***P < 0.01).
© New Phytologist (2005) www.newphytologist.org
Research 7
higher in red maple than all other species (50.2%) and lowestin winged elm (45.8%). Averaged across years, the highest Nconcentration (4.3%; Fig. 2) and lowest C : N ratio (10.1%;Fig. 3) were found in black locust, a nitrogen-fixing species(Olesniewicz & Thomas, 1999). Willow oak had the lowestaverage N concentration (1.8%) and highest C : N ratio(27.0). Yellow poplar had the highest average SLA value,followed by black locust (553 cm2 g−1 and 513 cm2 g−1, respec-tively), while willow oak had lower average SLA than all otherspecies (229 cm2 g−1; Fig. 4). Willow and red oak had higherprotein precipitation capacity (2.9% and 3.5%, respectively)than white and black oak (2.4% and 2.1%, respectively).
When tested within species, no significant correlationswere detected between the amount or percentage of leaf tissueremoved by herbivores and leaf attributes (e.g. N, C, C : N,SLA and protein precipitation capacity) across all years of theexperiment. However, in 2001 the percentage leaf tissueremoved by chewing insects significantly decreased as SLAincreased across all 12 species (P = 0.01, ambient; P = 0.05,elevated).
Discussion
Although there was considerable between-year and between-species variation, when differences could be statisticallyresolved, exposure to elevated CO2 caused a reduction in theloss of leaf tissue to insect herbivores (Fig. 1). Other field-basedherbivory surveys also found that elevated CO2 decreased thenumber of leaves damaged by chewing insects (Stiling et al.,2002, 2003) as well as the overall amount of leaf damage(Hamilton et al., 2004). These results are similar to fieldbioassay experiments that have found a decrease (Kopper &Lindroth, 2003a) or no change (Kopper & Lindroth, 2003a,2003b) in damage by chewing insects under elevated CO2.The consistent reduction of herbivory across 12 species in2001 (Fig. 1) suggests that elevated CO2 caused a fundamentalchange in tissue quality beyond potential species-specificchanges in secondary chemistry.
Overall herbivory levels were substantially lower during thedrought of 2002, when total growing-season precipitation(March–June) was half of the 50-yr average (State Climate
Fig. 3 Effects of elevated CO2 on carbon : nitrogen (C : N) ratio of leaves for plants grown under ambient (c. 386 µl l−1) and elevated (c. 586 µl l−1) CO2 for each of the three years. Columns represent the least-squared means (± 1 SE) of the three ambient and three elevated CO2 plots (open columns, ambient CO2; closed columns, elevated CO2). Within a species and year, statistical significance of pairwise comparisons is indicated above columns (*P < 0.1, **P < 0.05, ***P < 0.01).
www.newphytologist.org © New Phytologist (2005)
Research8
Office of North Carolina, North Carolina State University,Raleigh, NC, USA). Drought typically reduces foliar quality(Roth et al., 1997) and directly increases insect mortality(Shure et al., 1998). It is unclear why there was no treatmenteffect on herbivory in 2003, when precipitation was closer toaverage. Measurements in 2003 were made two months laterthan the two previous years, and it is possible that herbivoryearlier in the growing season may have induced plantdefenses, thereby obscuring the effects of CO2 on herbivoredamage in late summer (Wold & Marquis, 1997).
Given the consistent reduction in herbivory under highCO2 across species in 2001, it appears that some universalfeature of chemistry or structure that affected leaf suitability wasaltered by the treatment. There was a trend of lower SLA anda small but statistically significant decrease in leaf N for plantsgrown in elevated CO2 in this year. Thus, reductions in SLAand leaf N, and the corresponding increase in C : N ratio andprotein precipitation capacity (at least in oaks), may have con-tributed to reduce herbivory under elevated CO2. This inferenceis supported by the observation that in the two subsequentyears, when there was no detectable effect of elevated CO2 onthese key aspects of leaf chemistry and structure, the amount
of leaf tissue removed by chewing insects was similar for treesexposed to ambient and elevated CO2.
A reduction in SLA under elevated CO2 often is associatedwith increasing cell wall thickness and an increase in the con-centration of total nonstructural carbohydrates (Yin, 2002).Insofar as decreased SLA is related to increased leaf toughness,it may account in part for the decrease in herbivory in 2001;tougher leaves are more difficult for folivores to consume(Bernays, 1986) and leaf toughness is correlated with lowerherbivore densities (Peeters, 2002). Alternatively, by eatingleaves with lower SLA, folivores consume more mass for agiven leaf area, thus potentially explaining reduced area con-sumption under high CO2. This was not the case in this studybecause the mass of leaf tissue removed by herbivores underelevated CO2 (area removed/SLA) was similar to the leaf massconsumed under ambient CO2.
Nitrogen content is an important determinant of the nutri-tional quality of foliage to insect herbivores and often isreduced in plants grown under elevated CO2 (Lincoln et al.,1993; Bezemer & Jones, 1998; Hunter, 2001). Kerslake et al.(1998) found no response of C : N ratio or phenolics to elevatedCO2 when plants were grown under realistic environmental
Fig. 4 Effects of elevated CO2 on specific leaf area (SLA, cm2 g−1) for plants grown under ambient (c. 386 µl l−1) and elevated (c. 586 µl l−1) CO2 for each of the three years. Columns represent the least-squared means (± 1 SE) of the three ambient and three elevated CO2 plots (open columns, ambient CO2; closed columns, elevated CO2). Within a species and year, statistical significance of pairwise comparisons is indicated above columns (*P < 0.1, **P < 0.05, ***P < 0.01).
© New Phytologist (2005) www.newphytologist.org
Research 9
conditions. In contrast, for the suite of hardwood speciesexamined in this experiment, elevated CO2 reduced foliar Nby 12% and increased C : N by c. 11% in 2001 (Figs 2 and3; Table 2) during the same year when herbivore damagewas uniformly reduced under elevated CO2. Changes in Nconcentration and C : N ratio under elevated CO2 in 2001 weresimilar in magnitude to those observed in previous studies ofhardwood tree species (McGuire et al., 1995; Cotrufo et al.,1998; Norby et al., 1999; Yin, 2002).
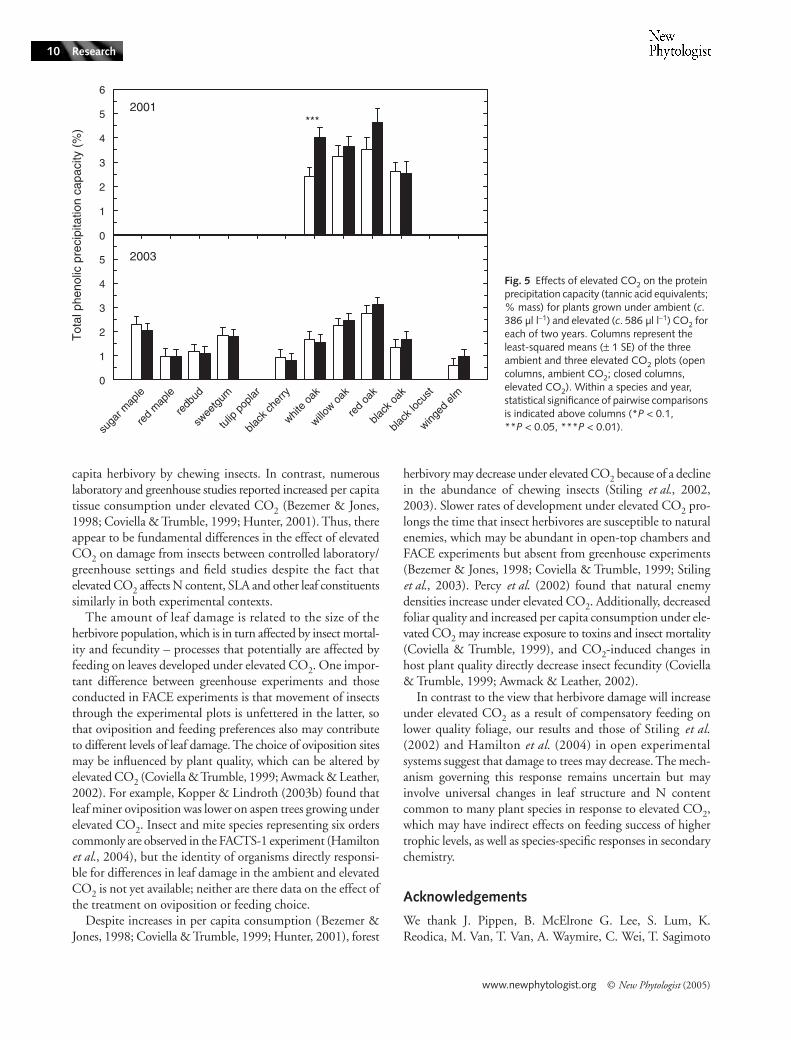
Phenolic compounds – potentially important defensivecompounds – may increase under elevated CO2. Buse et al.(1998) and Dury et al. (1998) reported an increase incondensed tannins and total phenolics for leaves of Q. roburgrown under elevated CO2. Lindroth et al. (1993) andKinney et al. (1997) also found an increase in condensed tanninsfor Q. rubra grown under elevated CO2, but these studiesreport conflicting responses of ellagitannin content to ele-vated CO2 in red maple. At least for the oak species measuredin this study, which tended to have higher concentrations ofprotein-binding tannins than tree species other than oaks, theconcentration of these compounds was greater in leaves onplants grown under elevated than ambient CO2 in 2001,when there was also a significant reduction of leaf damageunder elevated CO2 (Fig. 5, Table 5). For some species, an
increase in leaf phenolics may contribute to lower levels of leafdamage under elevated CO2.
In field studies, elevated CO2 decreased (Kopper & Lindroth,2003a) or had no effect (Kopper & Lindroth, 2003a,b) on per
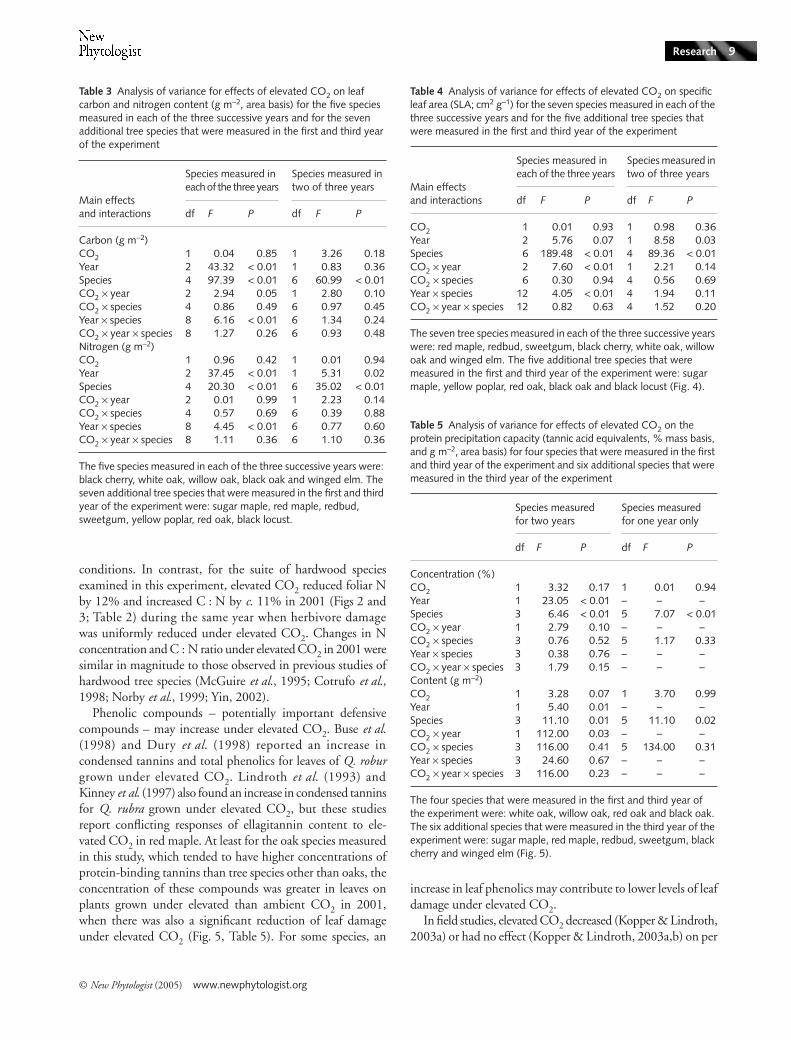
Table 3 Analysis of variance for effects of elevated CO2 on leaf carbon and nitrogen content (g m−2, area basis) for the five species measured in each of the three successive years and for the seven additional tree species that were measured in the first and third year of the experiment
Main effects and interactions
Species measured in each of the three years
Species measured in two of three years
df F P df F P
Carbon (g m−2)CO2 1 0.04 0.85 1 3.26 0.18Year 2 43.32 < 0.01 1 0.83 0.36Species 4 97.39 < 0.01 6 60.99 < 0.01CO2 × year 2 2.94 0.05 1 2.80 0.10CO2 × species 4 0.86 0.49 6 0.97 0.45Year × species 8 6.16 < 0.01 6 1.34 0.24CO2 × year × species 8 1.27 0.26 6 0.93 0.48Nitrogen (g m−2)CO2 1 0.96 0.42 1 0.01 0.94Year 2 37.45 < 0.01 1 5.31 0.02Species 4 20.30 < 0.01 6 35.02 < 0.01CO2 × year 2 0.01 0.99 1 2.23 0.14CO2 × species 4 0.57 0.69 6 0.39 0.88Year × species 8 4.45 < 0.01 6 0.77 0.60CO2 × year × species 8 1.11 0.36 6 1.10 0.36
The five species measured in each of the three successive years were: black cherry, white oak, willow oak, black oak and winged elm. The seven additional tree species that were measured in the first and third year of the experiment were: sugar maple, red maple, redbud, sweetgum, yellow poplar, red oak, black locust.
Table 4 Analysis of variance for effects of elevated CO2 on specific leaf area (SLA; cm2 g−1) for the seven species measured in each of the three successive years and for the five additional tree species that were measured in the first and third year of the experiment
Main effects and interactions
Species measured in each of the three years
Species measured in two of three years
df F P df F P
CO2 1 0.01 0.93 1 0.98 0.36Year 2 5.76 0.07 1 8.58 0.03Species 6 189.48 < 0.01 4 89.36 < 0.01CO2 × year 2 7.60 < 0.01 1 2.21 0.14CO2 × species 6 0.30 0.94 4 0.56 0.69Year × species 12 4.05 < 0.01 4 1.94 0.11CO2 × year × species 12 0.82 0.63 4 1.52 0.20
The seven tree species measured in each of the three successive years were: red maple, redbud, sweetgum, black cherry, white oak, willow oak and winged elm. The five additional tree species that were measured in the first and third year of the experiment were: sugar maple, yellow poplar, red oak, black oak and black locust (Fig. 4).
Table 5 Analysis of variance for effects of elevated CO2 on the protein precipitation capacity (tannic acid equivalents, % mass basis, and g m−2, area basis) for four species that were measured in the first and third year of the experiment and six additional species that were measured in the third year of the experiment
Species measured for two years
Species measured for one year only
df F P df F P
Concentration (%)CO2 1 3.32 0.17 1 0.01 0.94Year 1 23.05 < 0.01 – – –Species 3 6.46 < 0.01 5 7.07 < 0.01CO2 × year 1 2.79 0.10 – – –CO2 × species 3 0.76 0.52 5 1.17 0.33Year × species 3 0.38 0.76 – – –CO2 × year × species 3 1.79 0.15 – – –Content (g m−2)CO2 1 3.28 0.07 1 3.70 0.99Year 1 5.40 0.01 – – –Species 3 11.10 0.01 5 11.10 0.02CO2 × year 1 112.00 0.03 – – –CO2 × species 3 116.00 0.41 5 134.00 0.31Year × species 3 24.60 0.67 – – –CO2 × year × species 3 116.00 0.23 – – –
The four species that were measured in the first and third year of the experiment were: white oak, willow oak, red oak and black oak. The six additional species that were measured in the third year of the experiment were: sugar maple, red maple, redbud, sweetgum, black cherry and winged elm (Fig. 5).
www.newphytologist.org © New Phytologist (2005)
Research10
capita herbivory by chewing insects. In contrast, numerouslaboratory and greenhouse studies reported increased per capitatissue consumption under elevated CO2 (Bezemer & Jones,1998; Coviella & Trumble, 1999; Hunter, 2001). Thus, thereappear to be fundamental differences in the effect of elevatedCO2 on damage from insects between controlled laboratory/greenhouse settings and field studies despite the fact thatelevated CO2 affects N content, SLA and other leaf constituentssimilarly in both experimental contexts.
The amount of leaf damage is related to the size of theherbivore population, which is in turn affected by insect mortal-ity and fecundity – processes that potentially are affected byfeeding on leaves developed under elevated CO2. One impor-tant difference between greenhouse experiments and thoseconducted in FACE experiments is that movement of insectsthrough the experimental plots is unfettered in the latter, sothat oviposition and feeding preferences also may contributeto different levels of leaf damage. The choice of oviposition sitesmay be influenced by plant quality, which can be altered byelevated CO2 (Coviella & Trumble, 1999; Awmack & Leather,2002). For example, Kopper & Lindroth (2003b) found thatleaf miner oviposition was lower on aspen trees growing underelevated CO2. Insect and mite species representing six orderscommonly are observed in the FACTS-1 experiment (Hamiltonet al., 2004), but the identity of organisms directly responsi-ble for differences in leaf damage in the ambient and elevatedCO2 is not yet available; neither are there data on the effect ofthe treatment on oviposition or feeding choice.
Despite increases in per capita consumption (Bezemer &Jones, 1998; Coviella & Trumble, 1999; Hunter, 2001), forest
herbivory may decrease under elevated CO2 because of a declinein the abundance of chewing insects (Stiling et al., 2002,2003). Slower rates of development under elevated CO2 pro-longs the time that insect herbivores are susceptible to naturalenemies, which may be abundant in open-top chambers andFACE experiments but absent from greenhouse experiments(Bezemer & Jones, 1998; Coviella & Trumble, 1999; Stilinget al., 2003). Percy et al. (2002) found that natural enemydensities increase under elevated CO2. Additionally, decreasedfoliar quality and increased per capita consumption under ele-vated CO2 may increase exposure to toxins and insect mortality(Coviella & Trumble, 1999), and CO2-induced changes inhost plant quality directly decrease insect fecundity (Coviella& Trumble, 1999; Awmack & Leather, 2002).
In contrast to the view that herbivore damage will increaseunder elevated CO2 as a result of compensatory feeding onlower quality foliage, our results and those of Stiling et al.(2002) and Hamilton et al. (2004) in open experimentalsystems suggest that damage to trees may decrease. The mech-anism governing this response remains uncertain but mayinvolve universal changes in leaf structure and N contentcommon to many plant species in response to elevated CO2,which may have indirect effects on feeding success of highertrophic levels, as well as species-specific responses in secondarychemistry.
Acknowledgements
We thank J. Pippen, B. McElrone G. Lee, S. Lum, K.Reodica, M. Van, T. Van, A. Waymire, C. Wei, T. Sagimoto
Fig. 5 Effects of elevated CO2 on the protein precipitation capacity (tannic acid equivalents; % mass) for plants grown under ambient (c. 386 µl l−1) and elevated (c. 586 µl l−1) CO2 for each of two years. Columns represent the least-squared means (± 1 SE) of the three ambient and three elevated CO2 plots (open columns, ambient CO2; closed columns, elevated CO2). Within a species and year, statistical significance of pairwise comparisons is indicated above columns (*P < 0.1, **P < 0.05, ***P < 0.01).
© New Phytologist (2005) www.newphytologist.org
Research 11
and M. Clarke for assistance with data collection and analyses.We also thank O. Dermody, D. Moore, M. Prater and J. Tangfor their critical review of the manuscript and Dr Suzanne Arefand Dr German Bollero for advice on the statistical analyses.The National Science Foundation (Grant No. IBN 0326053)supported this research, with additional support from theFrancis M. and Harlie M. Clark Research Support Grant andthe University of Illinois Graduate College Dissertation TravelGrant. The Office of Biological and Environmental Research,US. Department of Energy supports the FACTS-1 research site.
References
Agrell J, McDonald EP, Lindroth RL. 2000. Effects of CO2 and light on tree phytochemistry and insect performance. Oikos 88: 259–272.
Arnone JAI, Zaller JG, Ziegler C, Zandt H, Korner C. 1995. Leaf quality and insect herbivory in model tropical plant communities after long-term exposure to elevated atmospheric CO2. Oecologia 104: 72–78.
Awmack CS, Leather SR. 2002. Host plant quality and fecundity in herbivorous insects. Annual Review of Entomology 47: 817–844.
Bernays EA. 1986. Diet-induced head allometry among foliage-chewing insects and its importance for graminivores. Science 231: 495–497.
Bezemer TM, Jones TH. 1998. Plant–insect herbivore interactions in elevated atmospheric CO2: quantitative analyses and guild effects. Oikos 82: 212–222.
Bryant JP, Chapin FSI, Klein DR. 1983. Carbon/nutrient balance of boreal plants in relation to vertebrate herbivory. Oikos 40: 357–368.
Burns RM, Honkala BH. 1990. Silvics of North America. Washington, DC, USA: Forest Service.
Buse A, Good JEG, Dury S, Perrins CM. 1998. Effects of elevated temperature and carbon dioxide on the nutritional quality of leaves of oak (Quercus robur L.) as food for the Winter Moth (Operophtera brumata L.). Functional Ecology 12: 742–749.
Cotrufo MF, Ineson P, Scott A. 1998. Elevated CO2 reduces the nitrogen concentration of plant tissues. Global Change Biology 4: 43–54.
Coviella CE, Trumble JT. 1999. Effects of elevated atmospheric carbon dioxide on insect–plant interactions. Conservation Biology 13: 700–712.
Curtis PS, Wang X. 1998. A meta-analysis of elevated CO2 effects on woody plant mass, form, and physiology. Oecologia 113: 299–313.
Cyr H, Pace ML. 1993. Magnitude and patterns of herbivory in aquatic and terrestrial ecosystems. Nature 361: 148–150.
DeLucia EH, George K, Hamilton JG. 2002. Radiation-use efficiency of a forest exposed to elevated concentrations of atmospheric carbon dioxide. Tree Physiology 22: 1003–1010.
Drake BG, Gonzalez-Meler MA, Long SP. 1997. More efficient plants: a consequence of rising atmospheric CO2? Annual Review of Plant Physiology and Plant Molecular Biology 48: 609–639.
Dury SJ, Good JEG, Perrins CM, Buse A, Kaye T. 1998. The effects of increasing CO2 and temperature on oak leaf palatability and the implications for herbivorous insects. Global Change Biology 4: 55–61.
Goverde M, Bazin A, Shykoff JA, Erhardt A. 1999. Influence of leaf chemistry of Lotus corniculatus (Fabaceae) on larval development of Polyommatus icarus (Lepidoptera, Lycaenidae): effects of elevated CO2 and plant genotype. Functional Ecology 13: 801–810.
Hagerman AE. 1987. Radial diffusion method for determining tannins in plant extracts. Journal of Chemical Ecology 13: 437–449.
Hamilton JG, Zangerl AR, Berenbaum MR, Pippen JS, Aldea M, DeLucia EH. 2004. Insect herbivory in an intact forest understory under experimental CO2 enrichment. Oecologia 138: 566–573.
Hendrey GR, Kimball BA. 1994. The FACE program. Agricultural and Forest Meteorology 70: 3–14.
Hendrey GR, Ellsworth DS, Lewin KF, Nagy J. 1999. A free-air enrichment system for exposing tall forest vegetation to elevated atmospheric CO2. Global Change Biology 5: 293–309.
Houghton JT, Ding J, Griggs DJ, Nouguer M, van der Linden JJ, Dai X, Maskell K, Johnson CA. 2001. Climate change 2001: the scientific basis. Contribution of working group 1 to the third assessment report of the intergovernmental panel on climate change. Cambridge, UK and New York, NY, USA: Cambridge University Press.
Hughes L, Bazzaz FA. 1997. Effect of elevated CO2 on interactions between the western flower thrips, Frankliniella occidentalis (Thysanoptera: Thripidae) and the common milkweed, Asclepias syriaca. Oecologia 109: 286–290.
Hunter MD. 2001. Effects of elevated atmospheric carbon dioxide on insect–plant interactions. Agricultural and Forest Entomology 3: 153–159.
Kerslake JE, Woodin SJ, Hartley SE. 1998. Effects of carbon dioxide and nitrogen enrichment on a plant–insect interaction: the quality of Calluna vulgaris as a host for Operophtera brumata. New Phytologist 140: 43–53.
Kinney KK, Lindroth RL, Jung SM, Nordheim EV. 1997. Effects of CO2 and NO3
− availability on deciduous trees: phytochemistry and insect performance. Ecology 78: 215–230.
Kopper BJ, Lindroth RL. 2003a. Effects of elevated carbon dioxide and ozone on the phytochemistry of aspen and performance of an herbivore. Oecologia 134: 95–103.
Kopper BJ, Lindroth RL. 2003b. Responses of trembling aspen (Populus tremuloides) phytochemistry and aspen blotch leafminer (Phyllonorycter tremuloidiella) performance to elevated levels of atmospheric CO2 and O3. Agricultural and Forest Entomology 5: 17–26.
Lewin KF, Hendrey GR, Nagy J, LaMorte RL. 1994. Design and application of a free-air carbon dioxide enrichment facility. Agricultural and Forest Meteorology 70: 15–29.
Lincoln DE, Fajer ED, Johnson RH. 1993. Plant–insect herbivore interactions in elevated CO2 environments. Tree 8: 64–68.
Lindroth RL, Kinney KK, Platz CL. 1993. Responses of deciduous trees to elevated atmospheric CO2: productivity, phytochemistry, and insect performance. Ecology 74: 763–777.
Lindroth RL, Roth SK, Nordheim EV. 2001. Genotypic variation in response of quaking aspen (Populus tremuloides) to atmospheric CO2 enrichment. Oecologia 126: 371–379.
Lowman MD. 1984. An assessment of techniques for measuring herbivory: is rainforest defoliation more intense than we thought? Biotropica 16: 264–268.
Mansfield JL, Curtis PS, Zak DR, Pregitzer KS. 1999. Genotypic variation for condensed tannin production in trembling aspen (Populus tremuloides, Salicaceae) under elevated CO2 and in high- and low-fertility soil. American Journal of Botany 86: 1154–1159.
Mattson WJJ. 1980. Herbivory in relation to plant nitrogen content. Annual Review of Ecology System 11: 119–161.
McDonald EP, Agrell J, Lindroth RL. 1999. CO2 and light effects on deciduous trees: growth, foliar chemistry, and insect performance. Oecologia 119: 189–199.
McGuire AD, Melillo JM, Joyce LA. 1995. The role of nitrogen in the response of forest net primary production to elevated atmospheric carbon-dioxide. Annual Review of Ecology and Systematics 26: 473–503.
Mohan JE. 2002. Atmospheric carbon dioxide effects on temperate forests: implications for plant evolution, forest succession, and nutrient turnover. Doctoral Dissertation. Durham, NC, USA: Duke University.
Norby RJ, Wullschleger SD, Gunderson CA, Johnson DW, Ceulemans R. 1999. Tree responses to rising CO2 in field experiments: Implications for the future forest. Plant, Cell & Environment 22: 683–714.
Ohmart CP, Stewart LG, Thomas JR. 1983. Leaf consumption by insects in 3 eucalyptus forest types in southeastern Australia and their role in short-term nutrient cycling. Oecologia 59: 322–330.
Olesniewicz KS, Thomas RB. 1999. Effects of mycorrhizal colonization on biomass production and nitrogen fixation of black locust (Robinia
www.newphytologist.org © New Phytologist (2005)
Research12
pseudoacacia) seedlings grown under elevated atmospheric carbon dioxide. New Phytologist 142: 133–140.
Peeters PJ. 2002. Correlations between leaf structural traits and the densities of herbivorous insect guilds. Biological Journal of the Linnean Society 77: 43–65.
Percy KE, Awmack CS, Lindroth RL, Kubiske ME, Kopper BJ, Isebrands JG, Pregitzer KS, Oksanen E, Sober J, Harrington R, Karnosky DF. 2002. Altered performance of forest pest under atmospheres enriched by CO2 and O3. Nature 420: 403–407.
Reichle DE, Goldstein RA, van Hook RI, Dodson GJ. 1973. Analysis of insect consumption in a forest canopy. Ecology 54: 1076–1084.
Roth SK, McDonald EP, Lindroth RL. 1997. Atmospheric CO2 and soil water availability: consequences for tree–insect interactions. Canadian Journal of Forest Research 27: 1281–1290.
Sand-Jensen K, Jacobsen D. 1994. Herbivory and resulting plant damage. Oikos 69: 545–549.
Scriber JM, Slansky FJ. 1981. The nutritional ecology of immature insects. Annual Review of Entomology 26: 183–211.
Shure DJ, Mooreside PD, Ogle SM. 1998. Rainfall effects on plant–herbivore processes in an upland oak forest. Ecology 79: 604–617.
Singsaas EL, Ort DR, DeLucia EH. 2000. Diurnal regulation of photosynthesis in understory saplings. New Phytologist 145: 39–49.
Stange G, Monro J, Stowe S. 1995. The CO2 sense of the moth Cactoblastis cactorum and its probable role in the biological control of the cam plant Opuntia stricta. Oecologia 102: 341–352.
Stiling P, Rossi AM, Hungate B. 1999. Decreased leaf-miner abundance in elevated CO2: reduced leaf quality and increased parasitoid attack. Ecological Applications 9: 240–244.
Stiling P, Cattell M, Moon DC, Rossu A, Hungate BA, Hymuss G, Drakes B. 2002. Elevated atmospheric CO2 lowers herbivore abundance, but increases leaf abscission rates. Global Change Biology 8: 658–667.
Stiling P, Moon DC, Hunter MD, Colson J, Rossi AM, Hymus GJ, Drake BG. 2003. Elevated CO2 lowers relative and absolute herbivore density across all species of a scrub-oak forest. Oecologia 134: 82–87.
Whittaker RH. 1970. Communities and Ecosystems. New York, NY, USA: MacMillan.
Williams RS, Norby RJ, Lincoln DE. 2000. Effects of elevated CO2 and temperature-grown red and sugar maple on gypsy moth performance. Global Change Biology 6: 685–695.
Wold EN, Marquis RJ. 1997. Induced defense in white oak: Effects on herbivores and consequences for the plant. Ecology 78: 1356–1369.
Yin X. 2002. Responses of leaf nitrogen concentration and specific leaf area to atmospheric CO2 enrichment: a retrospective synthesis across 62 species. Global Change Biology 8: 631–642.
Zangerl AR, Hamilton JG, Miller JT, Crofts AR, Oxborough K, Berenbaum MR, DeLucia EH. 2002. Impact of folivory on photosynthesis is greater than the sum of its holes. PNAS 99: 1088–1091.


