Embed Size (px)
Citation preview
This article appeared in a journal published by Elsevier. The attachedcopy is furnished to the author for internal non-commercial researchand education use, including for instruction at the authors institution
and sharing with colleagues.
Other uses, including reproduction and distribution, or selling orlicensing copies, or posting to personal, institutional or third party
websites are prohibited.
In most cases authors are permitted to post their version of thearticle (e.g. in Word or Tex form) to their personal website orinstitutional repository. Authors requiring further information
regarding Elsevier’s archiving and manuscript policies areencouraged to visit:
http://www.elsevier.com/copyright
Author's personal copy
Electronic structure and related properties of the ferroelectric crystaltriglycine sulfate
B. Andriyevsky a,b,�, K. Doll a
a Max-Planck-Institute for Solid State Research, Heisenbergstrasse 1, Stuttgart D-70569, Germanyb Faculty of Electronics and Computer Sciences, Koszalin University of Technology, 2 Sniadeckich Street, Koszalin PL-75-453, Poland
a r t i c l e i n f o
Article history:
Received 5 December 2007
Received in revised form
1 September 2008
Accepted 3 September 2008
Keywords:
C. Ab initio calculations
D. Elastic properties
D. Electronic structure
D. Ferroelectricity
a b s t r a c t
The electronic band structure and related physical properties of the crystal triglycine sulfate (TGS),
(NH2CH2COOH)3 �H2SO4, in the ferroelectric phase P21 have been calculated using the first principles
Linear Combination of Atomic Orbitals (LCAO) code CRYSTAL’06 at the B3LYP level of theory. The
interactions between the quasi-separate three glycine groups and the sulfate complex have been
studied by the analysis of the density of states of the crystal. The glycine 2 group was found to be the
zwitterion in the optimized structure. Ten coefficients of the elastic stiffness tensor ckl, four coefficients
of the tensor of the elastoelectrical effect eki, and the spontaneous polarization Ps of TGS have been
calculated for the first time and have been found to agree well with experimental data. Extrema are
found in the elastoelectric coefficient e22 as a function of the strain e2, and in the spontaneous
polarization Ps as a function of the unit cell volume.
& 2008 Elsevier Ltd. All rights reserved.
1. Introduction
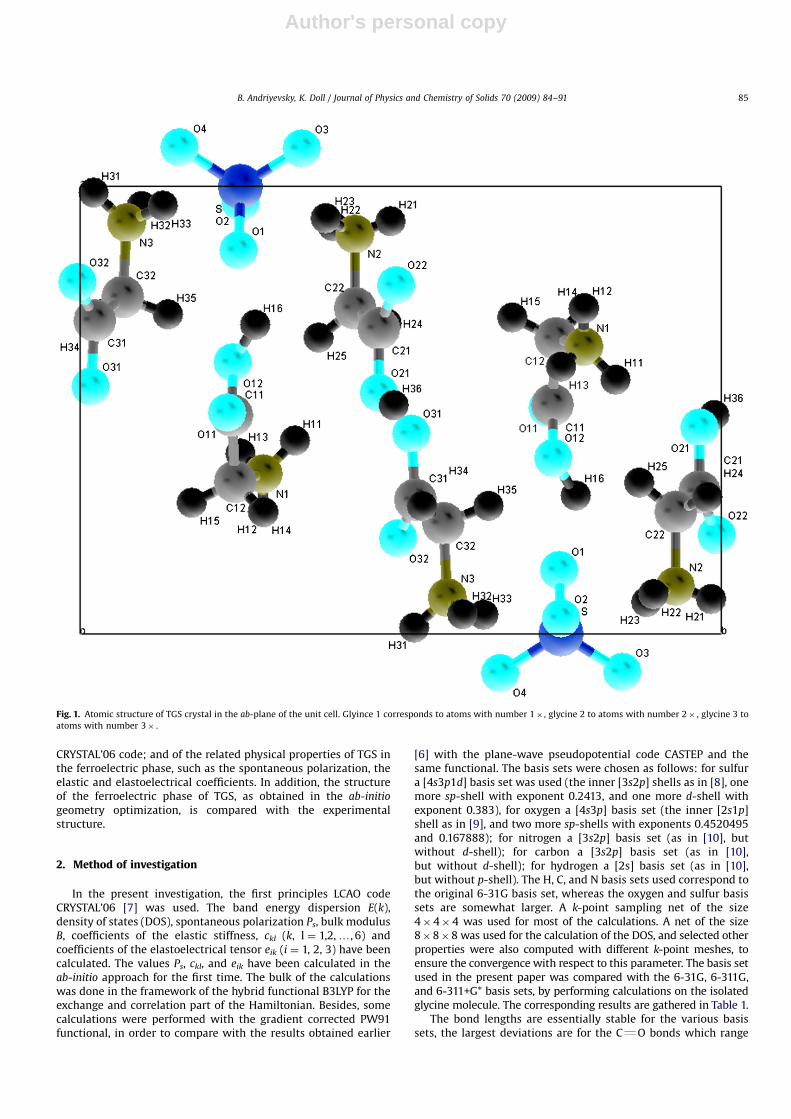
Triglycine sulfate (TGS), (NH2CH2COOH)3 �H2SO4, is a crystalwhich is ferroelectric below the transition temperature of 322 K.In this phase, it has the monoclinic space group P21. In theparaelectric phase, this crystal has the space group P21/m which ismonoclinic and has a center of inversion symmetry [1–4]. The cellparameters in the ferroelectric phase at the temperature T ¼ 298K are as follows: a ¼ 9.419 A, b ¼ 12.647 A, c ¼ 5.727 A, b ¼110.321 [3]. The crystallographic unit cell contains two formulaunits in both phases. The spontaneous polarization vector Ps ofTGS is parallel to the two-fold axis of symmetry (b-axis in Fig. 1)and is essentially due to the position of the polar group NH3
+ of theglycine-1 molecule [5]. The crystal unit cell possesses a largenumber of hydrogen atoms (34) compared to the overall numberof atoms (74). Most of them are closely connected to the nitrogenand carbon atoms by covalent bonds. Only one hydrogen atomH36 between two oxygens of glycine 2 and glycine 3 creates aweak hydrogen bond and changes its position in the paraelectricphase of the crystal (Fig. 1).
Because of the relatively large number of atoms in the crystalunit cell of TGS (n ¼ 74) and its low symmetry (only two
symmetry operations), the first calculations of the electronicband structure and corresponding dielectric functions of TGS wereperformed only recently [6] using a plane-wave basis set andultrasoft pseudopotentials, as implemented in the CASTEP code.However, there are still many open questions: important proper-ties of TGS in its ferroelectric phase, such as the spontaneouspolarization, elastic coefficients and elastoelectrical coefficientshave not yet been computed. Besides, it is interesting to knowhow much the band structure of this crystal depends on themethod of ab-initio calculation, and especially on the functionalemployed.
One of the open questions of the accepted mechanism of theferroelectric phase transition of TGS is the role of the shorthydrogen bond between the glycine 2 and glycine 3 groups.Especially, one question is which of the critical indices b is thesmaller one, either the index bNH3
of the ordering of the NH3 groupof glycine 1, or the index bH of the ordering of the hydrogen atomsof the aforementioned short hydrogen bond. The critical index b isan index of the critical temperature behavior of a certain value a
near the temperature Tc of the ferroelectric phase transition:a�(Tc�T)b. In the case of the NH3 group in the unit cell of TGS, thevalue aNH3
can be some parameter of the spatial orientation of theN–C bond, because the spatial position of the NH3 groupdetermines mainly the magnitude of the spontaneous polarizationof the TGS crystal.
The aim of the present study is a theoretical first principlescalculation of the band structure in the framework of theLinear Combination of Atomic Orbitals (LCAO) scheme with the
ARTICLE IN PRESS
Contents lists available at ScienceDirect
journal homepage: www.elsevier.com/locate/jpcs
Journal of Physics and Chemistry of Solids
0022-3697/$ - see front matter & 2008 Elsevier Ltd. All rights reserved.
doi:10.1016/j.jpcs.2008.09.017
� Corresponding author at: Faculty of Electronics and Computer Sciences,
Koszalin University of Technology, 2 Sniadeckich Street, Koszalin PL-75-453,
Poland. Tel.: +38 943 478 690; fax: +38 943 433 479.
E-mail address: [email protected] (B. Andriyevsky).
Journal of Physics and Chemistry of Solids 70 (2009) 84–91
Author's personal copy
CRYSTAL’06 code; and of the related physical properties of TGS inthe ferroelectric phase, such as the spontaneous polarization, theelastic and elastoelectrical coefficients. In addition, the structureof the ferroelectric phase of TGS, as obtained in the ab-initio
geometry optimization, is compared with the experimentalstructure.
2. Method of investigation
In the present investigation, the first principles LCAO codeCRYSTAL’06 [7] was used. The band energy dispersion E(k),density of states (DOS), spontaneous polarization Ps, bulk modulusB, coefficients of the elastic stiffness, ckl (k, l ¼ 1,2,y, 6) andcoefficients of the elastoelectrical tensor eik (i ¼ 1, 2, 3) have beencalculated. The values Ps, ckl, and eik have been calculated in theab-initio approach for the first time. The bulk of the calculationswas done in the framework of the hybrid functional B3LYP for theexchange and correlation part of the Hamiltonian. Besides, somecalculations were performed with the gradient corrected PW91functional, in order to compare with the results obtained earlier
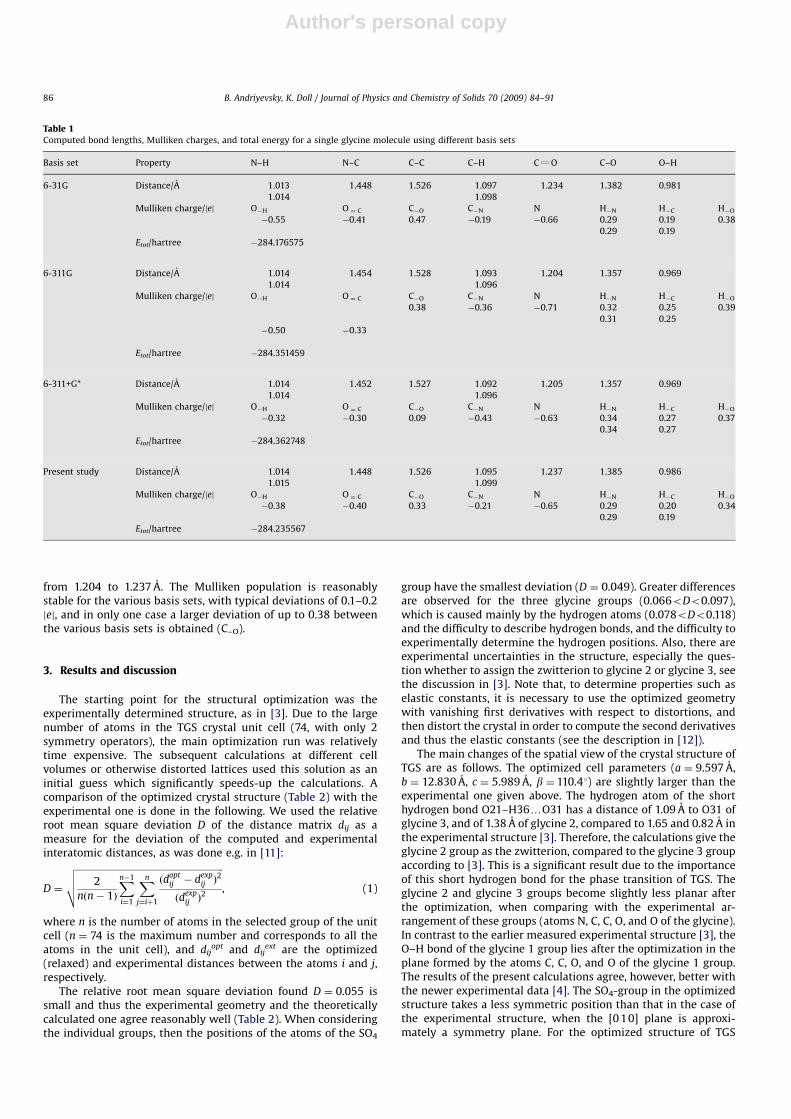
[6] with the plane-wave pseudopotential code CASTEP and thesame functional. The basis sets were chosen as follows: for sulfura [4s3p1d] basis set was used (the inner [3s2p] shells as in [8], onemore sp-shell with exponent 0.2413, and one more d-shell withexponent 0.383), for oxygen a [4s3p] basis set (the inner [2s1p]shell as in [9], and two more sp-shells with exponents 0.4520495and 0.167888); for nitrogen a [3s2p] basis set (as in [10], butwithout d-shell); for carbon a [3s2p] basis set (as in [10],but without d-shell); for hydrogen a [2s] basis set (as in [10],but without p-shell). The H, C, and N basis sets used correspond tothe original 6-31G basis set, whereas the oxygen and sulfur basissets are somewhat larger. A k-point sampling net of the size4� 4� 4 was used for most of the calculations. A net of the size8�8�8 was used for the calculation of the DOS, and selected otherproperties were also computed with different k-point meshes, toensure the convergence with respect to this parameter. The basis setused in the present paper was compared with the 6-31G, 6-311G,and 6-311+G* basis sets, by performing calculations on the isolatedglycine molecule. The corresponding results are gathered in Table 1.
The bond lengths are essentially stable for the various basissets, the largest deviations are for the CQO bonds which range
ARTICLE IN PRESS
Fig. 1. Atomic structure of TGS crystal in the ab-plane of the unit cell. Glyince 1 corresponds to atoms with number 1� , glycine 2 to atoms with number 2� , glycine 3 to
atoms with number 3� .
B. Andriyevsky, K. Doll / Journal of Physics and Chemistry of Solids 70 (2009) 84–91 85
Author's personal copy
from 1.204 to 1.237 A. The Mulliken population is reasonablystable for the various basis sets, with typical deviations of 0.1–0.2jej, and in only one case a larger deviation of up to 0.38 betweenthe various basis sets is obtained (C–O).
3. Results and discussion
The starting point for the structural optimization was theexperimentally determined structure, as in [3]. Due to the largenumber of atoms in the TGS crystal unit cell (74, with only 2symmetry operators), the main optimization run was relativelytime expensive. The subsequent calculations at different cellvolumes or otherwise distorted lattices used this solution as aninitial guess which significantly speeds-up the calculations. Acomparison of the optimized crystal structure (Table 2) with theexperimental one is done in the following. We used the relativeroot mean square deviation D of the distance matrix dij as ameasure for the deviation of the computed and experimentalinteratomic distances, as was done e.g. in [11]:
D ¼
ffiffiffiffiffiffiffiffiffiffiffiffiffiffiffiffiffiffiffiffiffiffiffiffiffiffiffiffiffiffiffiffiffiffiffiffiffiffiffiffiffiffiffiffiffiffiffiffiffiffiffiffiffiffiffiffiffiffiffiffiffiffiffiffi2
nðn� 1Þ
Xn�1
i¼1
Xn
j¼iþ1
ðdoptij � dexp
ij Þ2
ðdexpij Þ
2
vuut , (1)
where n is the number of atoms in the selected group of the unitcell (n ¼ 74 is the maximum number and corresponds to all theatoms in the unit cell), and dij
opt and dijext are the optimized
(relaxed) and experimental distances between the atoms i and j,respectively.
The relative root mean square deviation found D ¼ 0.055 issmall and thus the experimental geometry and the theoreticallycalculated one agree reasonably well (Table 2). When consideringthe individual groups, then the positions of the atoms of the SO4
group have the smallest deviation (D ¼ 0.049). Greater differencesare observed for the three glycine groups (0.066oDo0.097),which is caused mainly by the hydrogen atoms (0.078oDo0.118)and the difficulty to describe hydrogen bonds, and the difficulty toexperimentally determine the hydrogen positions. Also, there areexperimental uncertainties in the structure, especially the ques-tion whether to assign the zwitterion to glycine 2 or glycine 3, seethe discussion in [3]. Note that, to determine properties such aselastic constants, it is necessary to use the optimized geometrywith vanishing first derivatives with respect to distortions, andthen distort the crystal in order to compute the second derivativesand thus the elastic constants (see the description in [12]).
The main changes of the spatial view of the crystal structure ofTGS are as follows. The optimized cell parameters (a ¼ 9.597 A,b ¼ 12.830 A, c ¼ 5.989 A, b ¼ 110.41) are slightly larger than theexperimental one given above. The hydrogen atom of the shorthydrogen bond O21–H36yO31 has a distance of 1.09 A to O31 ofglycine 3, and of 1.38 A of glycine 2, compared to 1.65 and 0.82 A inthe experimental structure [3]. Therefore, the calculations give theglycine 2 group as the zwitterion, compared to the glycine 3 groupaccording to [3]. This is a significant result due to the importanceof this short hydrogen bond for the phase transition of TGS. Theglycine 2 and glycine 3 groups become slightly less planar afterthe optimization, when comparing with the experimental ar-rangement of these groups (atoms N, C, C, O, and O of the glycine).In contrast to the earlier measured experimental structure [3], theO–H bond of the glycine 1 group lies after the optimization in theplane formed by the atoms C, C, O, and O of the glycine 1 group.The results of the present calculations agree, however, better withthe newer experimental data [4]. The SO4-group in the optimizedstructure takes a less symmetric position than that in the case ofthe experimental structure, when the [0 10] plane is approxi-mately a symmetry plane. For the optimized structure of TGS
ARTICLE IN PRESS
Table 1Computed bond lengths, Mulliken charges, and total energy for a single glycine molecule using different basis sets
Basis set Property N–H N–C C–C C–H CQO C–O O–H
6-31G Distance/A 1.013 1.448 1.526 1.097 1.234 1.382 0.981
1.014 1.098
Mulliken charge/jej O�H O ¼ C C�O C�N N H�N H�C H�O
�0.55 �0.41 0.47 �0.19 �0.66 0.29 0.19 0.38
0.29 0.19
Etot/hartree �284.176575
6-311G Distance/A 1.014 1.454 1.528 1.093 1.204 1.357 0.969
1.014 1.096
Mulliken charge/jej O�H O ¼ C C�O C�N N H�N H�C H�O
0.38 �0.36 �0.71 0.32 0.25 0.39
0.31 0.25
�0.50 �0.33
Etot/hartree �284.351459
6-311+G* Distance/A 1.014 1.452 1.527 1.092 1.205 1.357 0.969
1.014 1.096
Mulliken charge/jej O�H O ¼ C C�O C�N N H�N H�C H�O
�0.32 �0.30 0.09 �0.43 �0.63 0.34 0.27 0.37
0.34 0.27
Etot/hartree �284.362748
Present study Distance/A 1.014 1.448 1.526 1.095 1.237 1.385 0.986
1.015 1.099
Mulliken charge/jej O�H O ¼ C C�O C�N N H�N H�C H�O
�0.38 �0.40 0.33 �0.21 �0.65 0.29 0.20 0.34
0.29 0.19
Etot/hartree �284.235567
B. Andriyevsky, K. Doll / Journal of Physics and Chemistry of Solids 70 (2009) 84–9186
Author's personal copy
crystal this quasi-symmetry plane of the SO4-group disappearsbecause the SO4-group in the optimized structure is rotated by5–71 around the c-axes, relative to the corresponding position ofthis group in the experimental structure.
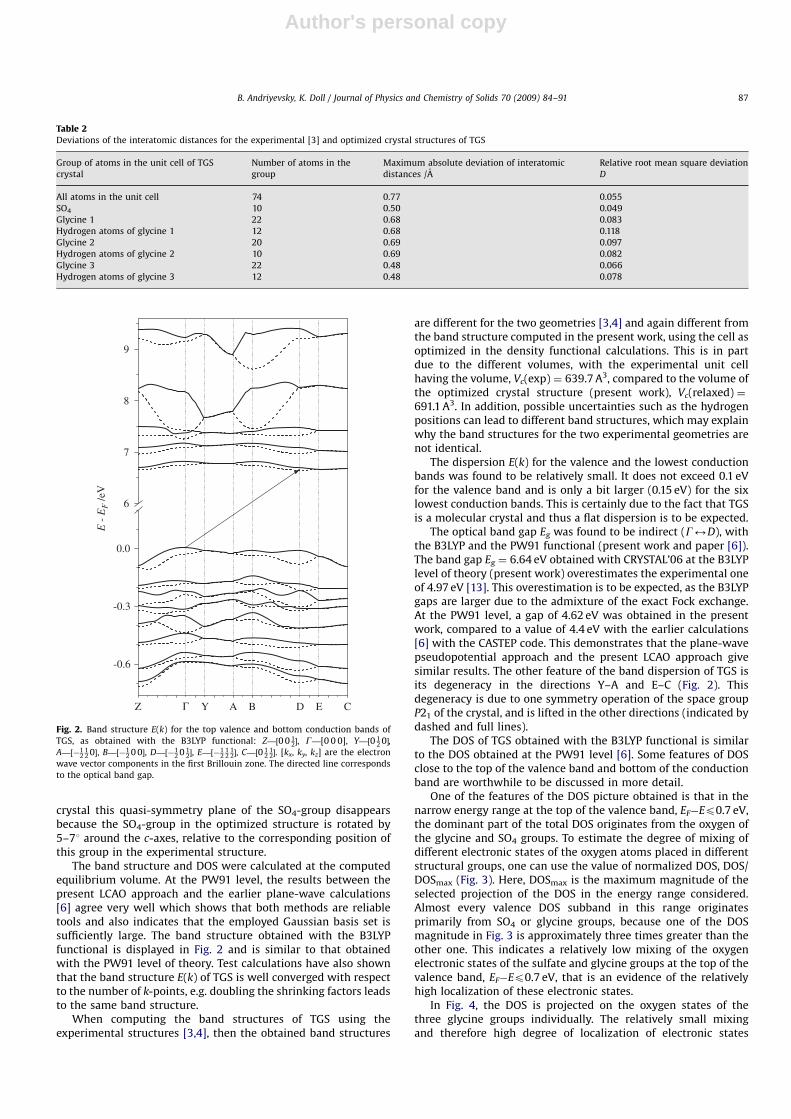
The band structure and DOS were calculated at the computedequilibrium volume. At the PW91 level, the results between thepresent LCAO approach and the earlier plane-wave calculations[6] agree very well which shows that both methods are reliabletools and also indicates that the employed Gaussian basis set issufficiently large. The band structure obtained with the B3LYPfunctional is displayed in Fig. 2 and is similar to that obtainedwith the PW91 level of theory. Test calculations have also shownthat the band structure E(k) of TGS is well converged with respectto the number of k-points, e.g. doubling the shrinking factors leadsto the same band structure.
When computing the band structures of TGS using theexperimental structures [3,4], then the obtained band structures
are different for the two geometries [3,4] and again different fromthe band structure computed in the present work, using the cell asoptimized in the density functional calculations. This is in partdue to the different volumes, with the experimental unit cellhaving the volume, Vc(exp) ¼ 639.7 A3, compared to the volume ofthe optimized crystal structure (present work), Vc(relaxed) ¼691.1 A3. In addition, possible uncertainties such as the hydrogenpositions can lead to different band structures, which may explainwhy the band structures for the two experimental geometries arenot identical.
The dispersion E(k) for the valence and the lowest conductionbands was found to be relatively small. It does not exceed 0.1 eVfor the valence band and is only a bit larger (0.15 eV) for the sixlowest conduction bands. This is certainly due to the fact that TGSis a molecular crystal and thus a flat dispersion is to be expected.
The optical band gap Eg was found to be indirect (G2D), withthe B3LYP and the PW91 functional (present work and paper [6]).The band gap Eg ¼ 6.64 eV obtained with CRYSTAL’06 at the B3LYPlevel of theory (present work) overestimates the experimental oneof 4.97 eV [13]. This overestimation is to be expected, as the B3LYPgaps are larger due to the admixture of the exact Fock exchange.At the PW91 level, a gap of 4.62 eV was obtained in the presentwork, compared to a value of 4.4 eV with the earlier calculations[6] with the CASTEP code. This demonstrates that the plane-wavepseudopotential approach and the present LCAO approach givesimilar results. The other feature of the band dispersion of TGS isits degeneracy in the directions Y–A and E–C (Fig. 2). Thisdegeneracy is due to one symmetry operation of the space groupP21 of the crystal, and is lifted in the other directions (indicated bydashed and full lines).
The DOS of TGS obtained with the B3LYP functional is similarto the DOS obtained at the PW91 level [6]. Some features of DOSclose to the top of the valence band and bottom of the conductionband are worthwhile to be discussed in more detail.
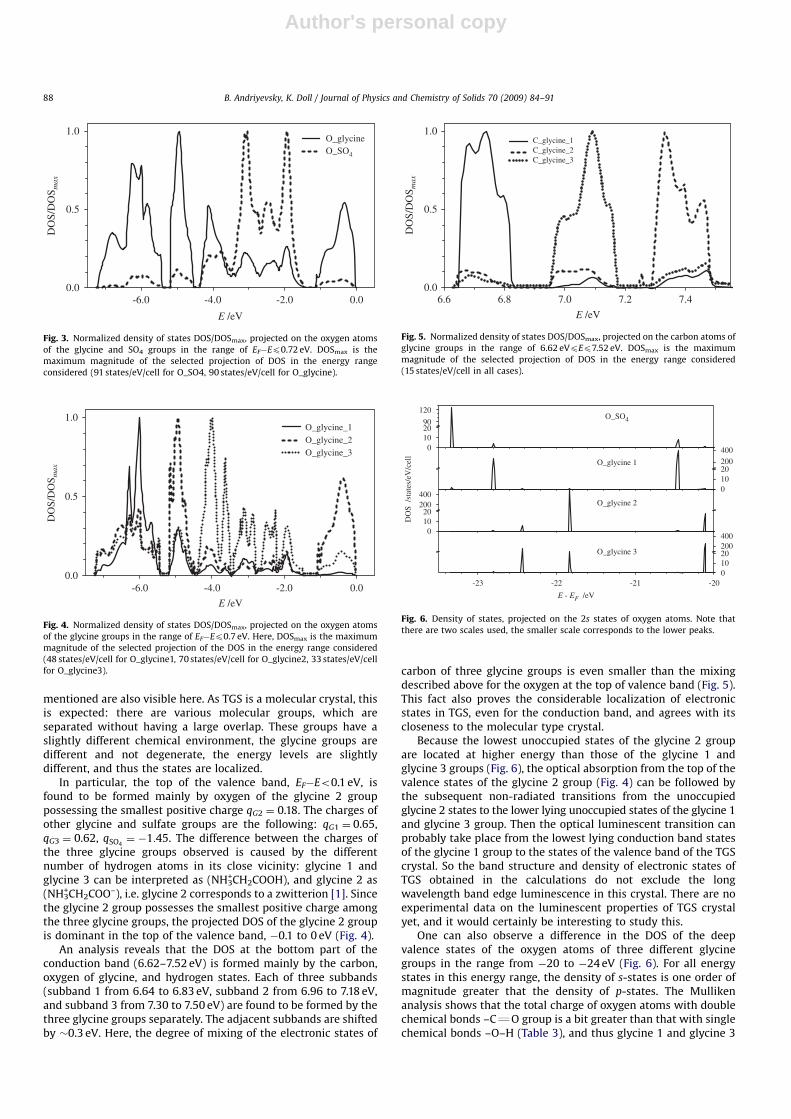
One of the features of the DOS picture obtained is that in thenarrow energy range at the top of the valence band, EF�Ep0.7 eV,the dominant part of the total DOS originates from the oxygen ofthe glycine and SO4 groups. To estimate the degree of mixing ofdifferent electronic states of the oxygen atoms placed in differentstructural groups, one can use the value of normalized DOS, DOS/DOSmax (Fig. 3). Here, DOSmax is the maximum magnitude of theselected projection of the DOS in the energy range considered.Almost every valence DOS subband in this range originatesprimarily from SO4 or glycine groups, because one of the DOSmagnitude in Fig. 3 is approximately three times greater than theother one. This indicates a relatively low mixing of the oxygenelectronic states of the sulfate and glycine groups at the top of thevalence band, EF�Ep0.7 eV, that is an evidence of the relativelyhigh localization of these electronic states.
In Fig. 4, the DOS is projected on the oxygen states of thethree glycine groups individually. The relatively small mixingand therefore high degree of localization of electronic states
ARTICLE IN PRESS
Table 2Deviations of the interatomic distances for the experimental [3] and optimized crystal structures of TGS
Group of atoms in the unit cell of TGS
crystal
Number of atoms in the
group
Maximum absolute deviation of interatomic
distances /A
Relative root mean square deviation
D
All atoms in the unit cell 74 0.77 0.055
SO4 10 0.50 0.049
Glycine 1 22 0.68 0.083
Hydrogen atoms of glycine 1 12 0.68 0.118
Glycine 2 20 0.69 0.097
Hydrogen atoms of glycine 2 10 0.69 0.082
Glycine 3 22 0.48 0.066
Hydrogen atoms of glycine 3 12 0.48 0.078
-0.6
-0.3
0.0
6
7
8
9
E -
EF /e
V
Z Γ Y D CA B E
Fig. 2. Band structure E(k) for the top valence and bottom conduction bands of
TGS, as obtained with the B3LYP functional: Z—½0 0 12�, G—[0 0 0], Y—½0 1
2 0�,
A—½�12
12 0�, B—½�1
2 0 0�, D—½�12 0 1
2�, E—½�12
12
12�, C—½0 1
212�. [kx, ky, kz] are the electron
wave vector components in the first Brillouin zone. The directed line corresponds
to the optical band gap.
B. Andriyevsky, K. Doll / Journal of Physics and Chemistry of Solids 70 (2009) 84–91 87
Author's personal copy
mentioned are also visible here. As TGS is a molecular crystal, thisis expected: there are various molecular groups, which areseparated without having a large overlap. These groups have aslightly different chemical environment, the glycine groups aredifferent and not degenerate, the energy levels are slightlydifferent, and thus the states are localized.
In particular, the top of the valence band, EF�Eo0.1 eV, isfound to be formed mainly by oxygen of the glycine 2 grouppossessing the smallest positive charge qG2 ¼ 0.18. The charges ofother glycine and sulfate groups are the following: qG1 ¼ 0.65,qG3 ¼ 0.62, qSO4
¼ �1:45. The difference between the charges ofthe three glycine groups observed is caused by the differentnumber of hydrogen atoms in its close vicinity: glycine 1 andglycine 3 can be interpreted as (NH3
+CH2COOH), and glycine 2 as(NH3
+CH2COO–), i.e. glycine 2 corresponds to a zwitterion [1]. Sincethe glycine 2 group possesses the smallest positive charge amongthe three glycine groups, the projected DOS of the glycine 2 groupis dominant in the top of the valence band, �0.1 to 0 eV (Fig. 4).
An analysis reveals that the DOS at the bottom part of theconduction band (6.62–7.52 eV) is formed mainly by the carbon,oxygen of glycine, and hydrogen states. Each of three subbands(subband 1 from 6.64 to 6.83 eV, subband 2 from 6.96 to 7.18 eV,and subband 3 from 7.30 to 7.50 eV) are found to be formed by thethree glycine groups separately. The adjacent subbands are shiftedby �0.3 eV. Here, the degree of mixing of the electronic states of
carbon of three glycine groups is even smaller than the mixingdescribed above for the oxygen at the top of valence band (Fig. 5).This fact also proves the considerable localization of electronicstates in TGS, even for the conduction band, and agrees with itscloseness to the molecular type crystal.
Because the lowest unoccupied states of the glycine 2 groupare located at higher energy than those of the glycine 1 andglycine 3 groups (Fig. 6), the optical absorption from the top of thevalence states of the glycine 2 group (Fig. 4) can be followed bythe subsequent non-radiated transitions from the unoccupiedglycine 2 states to the lower lying unoccupied states of the glycine 1and glycine 3 group. Then the optical luminescent transition canprobably take place from the lowest lying conduction band statesof the glycine 1 group to the states of the valence band of the TGScrystal. So the band structure and density of electronic states ofTGS obtained in the calculations do not exclude the longwavelength band edge luminescence in this crystal. There are noexperimental data on the luminescent properties of TGS crystalyet, and it would certainly be interesting to study this.
One can also observe a difference in the DOS of the deepvalence states of the oxygen atoms of three different glycinegroups in the range from �20 to �24 eV (Fig. 6). For all energystates in this energy range, the density of s-states is one order ofmagnitude greater that the density of p-states. The Mullikenanalysis shows that the total charge of oxygen atoms with doublechemical bonds –CQO group is a bit greater than that with singlechemical bonds –O–H (Table 3), and thus glycine 1 and glycine 3
ARTICLE IN PRESS
0.0-2.0-4.0-6.00.0
0.5
1.0O_glycine_1O_glycine_2O_glycine_3
DO
S/D
OS m
ax
E /eV
Fig. 4. Normalized density of states DOS/DOSmax, projected on the oxygen atoms
of the glycine groups in the range of EF�Ep0.7 eV. Here, DOSmax is the maximum
magnitude of the selected projection of the DOS in the energy range considered
(48 states/eV/cell for O_glycine1, 70 states/eV/cell for O_glycine2, 33 states/eV/cell
for O_glycine3).
6.60.0
0.5
1.0C_glycine_1C_glycine_2C_glycine_3
DO
S/D
OS m
ax
E /eV
6.8 7.0 7.2 7.4
Fig. 5. Normalized density of states DOS/DOSmax, projected on the carbon atoms of
glycine groups in the range of 6.62 eVpEp7.52 eV. DOSmax is the maximum
magnitude of the selected projection of DOS in the energy range considered
(15 states/eV/cell in all cases).
0.0-2.0-4.0-6.00.0
0.5
1.0
DO
S/D
OS m
ax
E /eV
O_glycineO_SO4
Fig. 3. Normalized density of states DOS/DOSmax, projected on the oxygen atoms
of the glycine and SO4 groups in the range of EF�Ep0.72 eV. DOSmax is the
maximum magnitude of the selected projection of DOS in the energy range
considered (91 states/eV/cell for O_SO4, 90 states/eV/cell for O_glycine).
010202004000
102090
120
01020
200400
-2301020200400
E - EF /eV
O_SO4
DO
S /s
tate
s/eV
/cel
l
O_glycine 1
O_glycine 2
O_glycine 3
-22 -21 -20
Fig. 6. Density of states, projected on the 2s states of oxygen atoms. Note that
there are two scales used, the smaller scale corresponds to the lower peaks.
B. Andriyevsky, K. Doll / Journal of Physics and Chemistry of Solids 70 (2009) 84–9188
Author's personal copy
have different charges on the two oxygens, whereas the oxygencharges on glycine 2 are similar for both oxygens.
Another feature of the low-lying states is the greater mixing ofthe oxygen states of glycine 2 and glycine 3 compared to that ofthe glycine 2 and glycine 1 groups (Fig. 6). This testifies the greaterinteraction of the glycine 2 and glycine 3 groups. The 2s state ofoxygen of the sulfate group is located mainly at the position�23.3 eV. It is evident from Fig. 6 that a noticeable mixing of theoxygen 2s states takes place only for the oxygens of the sulfategroup and glycine 1 (�23.3, �22.8, and �20.5 eV). This fact agreeswith the close spatial arrangement of the gylince 1 group(compared to glycine 2 and glycine 3) and the sulfate ion in thecrystal structure of TGS. Also, according to the close neighborhoodof the two oxygen atoms of glycine 2 and glycine 3, the greatestmixing of the corresponding 2s states takes place at the energies�22.4, �21.8, and �20.1 eV (Fig. 6).
The spontaneous polarization Ps has been calculated for theoptimized crystal structure of TGS on the basis of the modernBerry phase approach [12,14,15]. According to this approach, thespontaneous polarization Ps of a crystal is the sum of theelectronic Pel and ionic Pion components [16]:
~Ps ¼
Zdt
1
Vcell
Zcell
d~r~jð~r; tÞ ¼ ~Pel þ~Pion. (2)
This approach, implemented into the CRYSTAL’06 code, hasbeen applied to the calculation of the spontaneous polarization Ps
of TGS crystal. The value of spontaneous polarization calculated,Ps ¼ 0.035 C/m2, is within the range of corresponding experimen-tal magnitudes for TGS, 0.029–0.042 C/m2 [17,18]. Calculationsof the magnitude of the spontaneous polarization Ps for differentk-space meshes for the shrinking factors 2, 4, and 6, have revealedonly very small differences of this value (see Table 4). Therefore,the spontaneous polarization is very well converged with respectto the k-space mesh of size 4� 4� 4 used in the bulk of thepresent calculations.
For the optimized crystal structure of TGS the coefficients ofthe elastic stiffness tensor cij (i, j ¼ 1,2,y, 6):
si ¼X
j
cij�j, (3)
and the bulk modulus
B ¼ �VqP
qV¼ V
q2E
qV2(4)
have been calculated using the approach presented in [15]. For thecalculation of one coefficient of the elastic stiffness tensor ckl orbulk modulus B, seven distortions in the range from �3% to 3%were used. Ten coefficients of the elastic stiffness tensor cij of TGScrystal in the ferroelectric phase were calculated (see Table 5) byapplying the corresponding distortion and computing the deriva-tives. The remaining three coefficients (c44, c46, and c66) require adistortion, which breaks the symmetry (only one symmetryoperator is left after applying this distortion). This was compu-tationally too demanding and these components were thus notcomputed.
The results calculated (Table 5) are the first results from ab-
initio calculations for this system. For most of the coefficients inTable 5, the agreement with the experimental results is very good.The disagreement for c15, c25, c35 is due to the small value of thesecomponents and the fact that they cannot be computedindependently but only from a difference expression, where largecoefficients have to be subtracted from the numerically deter-mined second derivative [15]. Also, the calculated bulk modulus ofTGS (BE23 GPa) agrees well with the experimental one (22.7 GPa[19]).
The third type of values to be calculated using the CRYSTAL’06code were the coefficients of the elastoelectrical tensor eki [15]:
eki ¼jej
2pV
Xl
akldjl
d�i; k; l ¼ 1;2;3; i ¼ 1;2; . . . ;6, (5)
where V and akl are the undistorted unit cell volume andcomponent along the cartesian axis k of the al direct latticevector, respectively. According to Eq. (5), the elastoelectricconstants can be obtained by evaluating the phase j as a functionof deformations of the unit cell parameters.
Using the dependences of the calculated Berry phase j2 on thestrains ei (i ¼ 1, 2, 3, 5), the elastoelectrical coefficients e2i wereobtained (Table 6).
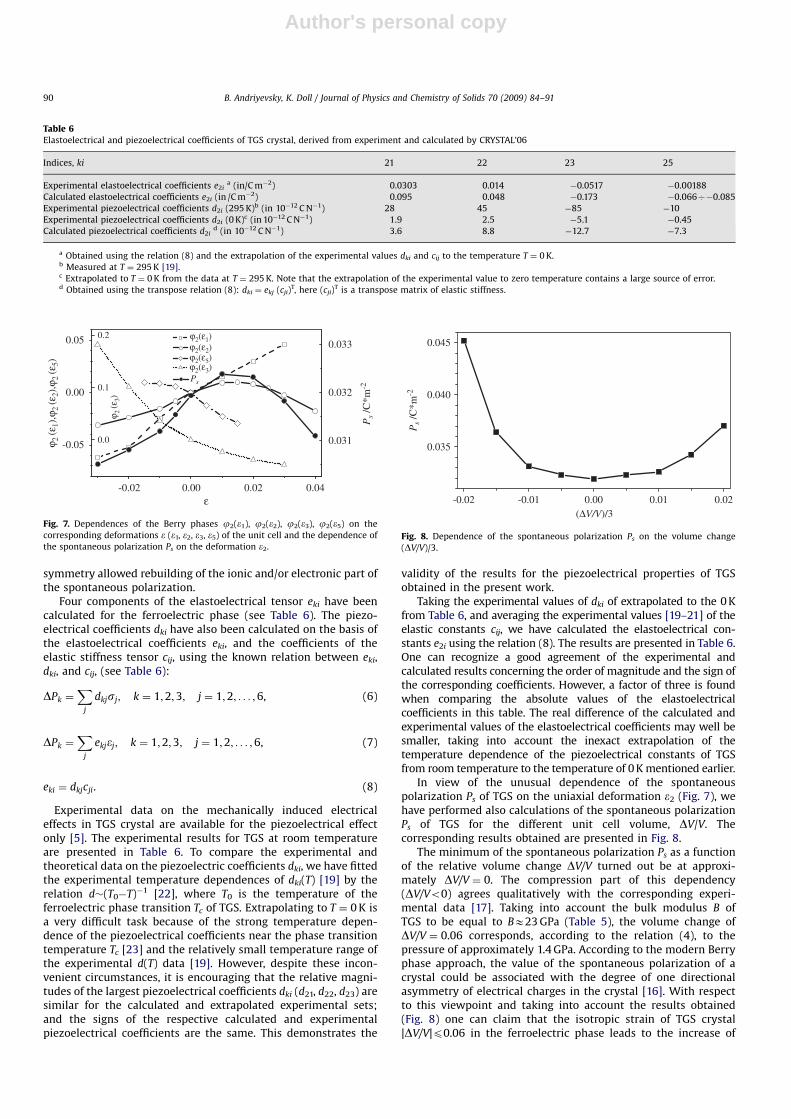
For the strains ei (i ¼ 1, 3, 5) in the range [�0.3, 0.3], thedependences of j2i on the strain ei are monotonous (Fig. 7).
A non-monotonous, unusual maximum-like type dependence ofthe spontaneous polarization Ps(e2) and the Berry phase j2(e2)of the crystal was found for the deformation e2 along the directionof the spontaneous polarization (Fig. 7). These dependencesare expected to be similar because of their common origin inaccordance to the Berry phase approach for the description of thespontaneous polarization and elastoelectrical coefficients [15].The maximum of the dependence j2(e2) takes place at anelongation e2 in the range 0.01–0.02. This means that for TGS, astrong dependence of the elastoelectrical coefficient e22 on theelongation e2 is found. Such a dependence can be caused by the
ARTICLE IN PRESS
Table 3Mulliken charges (in jej) of the constituents of TGS
O S N C H
O11 (–O–H) �0.34 S 0.30 N1 �0.85 C11 0.36 H11 0.45
O12 (–C ¼ O) �0.46 C12 �0.27 H12 0.46
N2 �0.85 H13 0.46
O21 (–O) �0.54 C21 0.42 H14 0.25
O22 (�CQO) �0.51 N3 �0.85 C22 �0.26 H15 0.29
H16 0.29
O31 (�O–H) �0.37 C31 0.36 H21 0.48
O32 (–CQO) �0.47 C32 �0.22 H22 0.45
H23 0.46
O1 (–SQO) �0.44 H24 0.28
O2 (–SQO) �0.45 H25 0.24
O3 (–SQO) �0.43 H31 0.46
O4 (–SQO) �0.42 H32 0.44
H33 0.46
H34 0.25
H35 0.26
H36 0.28
Table 4Spontaneous polarization Ps of TGS crystal calculated for different k-space mesh
(shrinking factor) and volume deformations
Relative volume
deformation DV/V
Ps/C/m2 for
shrinking factor 2
Ps/C/m2 for
shrinking factor 4
Ps/C/m2 for
shrinking factor 6
0.01 0.032653 0.032633 0.032621
0.02 0.037750 0.037048 0.037038
Table 5Bulk modulus B and elastic stiffness constants cij of TGS crystal (in 109 N/m2)
B c11 c22 c33 c55 c12 c13 c23 c15 c25 c35 References
22.7 45.5 32.1 26.3 11.1 17.2 19.8 20.8 �3.0 �0.36 �5.0 Experim. [19]
47.1 33.5 27.5 10.3 15.0 21.0 18.5 �1.8 �2.0 0.5 Experim. [20]
44.1 33.4 27.3 10.8 18.9 16.7 19.7 �2.1 �1.9 �1.8 Experim. [21]
18.0 41.0 24.0 28.0 9.0 16.0 13.9 16.7 2.24 0.98 2.01 Present work
B. Andriyevsky, K. Doll / Journal of Physics and Chemistry of Solids 70 (2009) 84–91 89
Author's personal copy
symmetry allowed rebuilding of the ionic and/or electronic part ofthe spontaneous polarization.
Four components of the elastoelectrical tensor eki have beencalculated for the ferroelectric phase (see Table 6). The piezo-electrical coefficients dki have also been calculated on the basis ofthe elastoelectrical coefficients eki, and the coefficients of theelastic stiffness tensor cij, using the known relation between eki,dki, and cij, (see Table 6):
DPk ¼X
j
dkjsj; k ¼ 1;2;3; j ¼ 1;2; . . . ;6, (6)
DPk ¼X
j
ekj�j; k ¼ 1;2;3; j ¼ 1;2; . . . ;6, (7)
eki ¼ dkjcji. (8)
Experimental data on the mechanically induced electricaleffects in TGS crystal are available for the piezoelectrical effectonly [5]. The experimental results for TGS at room temperatureare presented in Table 6. To compare the experimental andtheoretical data on the piezoelectric coefficients dki, we have fittedthe experimental temperature dependences of dki(T) [19] by therelation d�(T0�T)�1 [22], where T0 is the temperature of theferroelectric phase transition Tc of TGS. Extrapolating to T ¼ 0 K isa very difficult task because of the strong temperature depen-dence of the piezoelectrical coefficients near the phase transitiontemperature Tc [23] and the relatively small temperature range ofthe experimental d(T) data [19]. However, despite these incon-venient circumstances, it is encouraging that the relative magni-tudes of the largest piezoelectrical coefficients dki (d21, d22, d23) aresimilar for the calculated and extrapolated experimental sets;and the signs of the respective calculated and experimentalpiezoelectrical coefficients are the same. This demonstrates the
validity of the results for the piezoelectrical properties of TGSobtained in the present work.
Taking the experimental values of dki of extrapolated to the 0 Kfrom Table 6, and averaging the experimental values [19–21] of theelastic constants cij, we have calculated the elastoelectrical con-stants e2i using the relation (8). The results are presented in Table 6.One can recognize a good agreement of the experimental andcalculated results concerning the order of magnitude and the sign ofthe corresponding coefficients. However, a factor of three is foundwhen comparing the absolute values of the elastoelectricalcoefficients in this table. The real difference of the calculated andexperimental values of the elastoelectrical coefficients may well besmaller, taking into account the inexact extrapolation of thetemperature dependence of the piezoelectrical constants of TGSfrom room temperature to the temperature of 0 K mentioned earlier.
In view of the unusual dependence of the spontaneouspolarization Ps of TGS on the uniaxial deformation e2 (Fig. 7), wehave performed also calculations of the spontaneous polarizationPs of TGS for the different unit cell volume, DV/V. Thecorresponding results obtained are presented in Fig. 8.
The minimum of the spontaneous polarization Ps as a functionof the relative volume change DV/V turned out be at approxi-mately DV/V ¼ 0. The compression part of this dependency(DV/Vo0) agrees qualitatively with the corresponding experi-mental data [17]. Taking into account the bulk modulus B ofTGS to be equal to BE23 GPa (Table 5), the volume change ofDV/V ¼ 0.06 corresponds, according to the relation (4), to thepressure of approximately 1.4 GPa. According to the modern Berryphase approach, the value of the spontaneous polarization of acrystal could be associated with the degree of one directionalasymmetry of electrical charges in the crystal [16]. With respectto this viewpoint and taking into account the results obtained(Fig. 8) one can claim that the isotropic strain of TGS crystal|DV/V|p0.06 in the ferroelectric phase leads to the increase of
ARTICLE IN PRESS
Table 6Elastoelectrical and piezoelectrical coefficients of TGS crystal, derived from experiment and calculated by CRYSTAL’06
Indices, ki 21 22 23 25
Experimental elastoelectrical coefficients e2ia (in/C m�2) 0.0303 0.014 �0.0517 �0.00188
Calculated elastoelectrical coefficients e2i (in /C m�2) 0.095 0.048 �0.173 �0.066C�0.085
Experimental piezoelectrical coefficients d2i (295 K)b (in 10�12 C N�1) 28 45 �85 �10
Experimental piezoelectrical coefficients d2i (0 K)c (in 10�12 C N�1) 1.9 2.5 �5.1 �0.45
Calculated piezoelectrical coefficients d2id (in 10�12 C N�1) 3.6 8.8 �12.7 �7.3
a Obtained using the relation (8) and the extrapolation of the experimental values dki and cij to the temperature T ¼ 0 K.b Measured at T ¼ 295 K [19].c Extrapolated to T ¼ 0 K from the data at T ¼ 295 K. Note that the extrapolation of the experimental value to zero temperature contains a large source of error.d Obtained using the transpose relation (8): dki ¼ ekj (cji)
T, here (cji)T is a transpose matrix of elastic stiffness.
-0.02
-0.05
0.00
0.05
0.031
0.032
0.033
0.0
0.1
0.2 ϕ2(ε1)ϕ2(ε2)ϕ2(ε5)
ϕ 2 (ε
1),ϕ
2 (ε
2),ϕ
2 (ε
5)
ε
ϕ 2 (ε
3)
Ps
Ps /
C*m
-2ϕ2(ε3)
0.00 0.02 0.04
Fig. 7. Dependences of the Berry phases j2(e1), j2(e2), j2(e3), j2(e5) on the
corresponding deformations e (e1, e2, e3, e5) of the unit cell and the dependence of
the spontaneous polarization Ps on the deformation e2.
-0.02
0.035
0.040
0.045
Ps /
C*m
-2
(ΔV/V)/3-0.01 0.00 0.01 0.02
Fig. 8. Dependence of the spontaneous polarization Ps on the volume change
(DV/V)/3.
B. Andriyevsky, K. Doll / Journal of Physics and Chemistry of Solids 70 (2009) 84–9190
Author's personal copy
degree of asymmetry of the ionic and/or electronic charges in thedirection of the spontaneous polarization of the crystal.
4. Conclusions
The CRYSTAL’06 code has been successfully applied to thestudy of the ferroelectric crystal TGS (an organic–inorganic crystalwith 74 atoms in the unit cell). The optimized structure agreesreasonably well with the experimentally determined structure,with the calculated cell being slightly larger. The calculated valuesof the elastic properties and the spontaneous polarization agreewell with the corresponding experimental data.
One of the new features of the optimized structure is relativeposition of the hydrogen atom H36 between two oxygen atomsO21 and O31 of the short hydrogen bond O21–H36yO31, whichmakes the glycine 2 group to be a zwitterion, compared to theglycine 3 group according to some of the known experimentaldata [3]; note that the experimental assignment of the zwitterionis not fully clear (see the discussion in [3]). The results of thecalculations are thus an important finding because of therelevance for the phase transition dynamics of TGS.
The computed DOS of TGS shows for the relatively lowelectronic states mixing in the top of the valence band, EF�Ep0.7eV. The unoccupied states of three glycine groups in the bottom ofthe conduction band, E�Egp0.9 eV are entirely separated. Thesefacts testify for the weak mixing of the electronic statescorresponding to the separate complexes in the states of TGS.Where a comparison was possible, the band structure and DOS ofTGS was found to be close to those values obtained with theCASTEP code using the plane-wave pseudopotential approach.
The magnitude of the spontaneous polarization, 10 compo-nents of the elastic tensor, and four components of the elasto-electric tensor of TGS were calculated for the first time. They werefound to agree satisfactorily with the corresponding experimentalreference data.
A strong dependence of the elastoelectric coefficient e22 on theuniaxial elongation e2 of TGS corresponding to the direction ofspontaneous polarization (Y) has been revealed. Such a depen-dence can be caused by the symmetry allowed rebuilding of theionic and/or electronic part of the spontaneous polarization.
Acknowledgment
This work was supported by DAAD Grant: PKZ, A/07/01239,Referat 323. B.A. expresses his special gratitude to ProfessorMartin Jansen for kind hospitality at the Max Planck Institute forSolid State Research (Stuttgart) during the work on this project.
References
[1] S. Hoshino, I. Okaya, R. Pepinsky, Phys. Rev. 115 (1959) 323–330.[2] M.I. Kay, R. Kleinberg, Ferroelectrics 5 (1973) 45–52.[3] S.R. Fletcher, E.T. Keve, A.C. Skapski, Ferroelectrics 14 (1976) 775–787.[4] T. Kikuta, D. Hamatake, T. Yamazaki, N. Nakatani, Ferroelectrics 347 (2007)
65–73.[5] R.R. Choudhury, R. Chitra, M. Ramanadham, J. Phys.: Condens. Matter 15
(2003) 4641–4650.[6] B. Andriyevsky, N. Esser, A. Patryn, C. Cobet, W. Ciepluch-Trojanek, M.
Romanyuk, Phys. B: Phys. Condens. Matter 373 (2006) 328–333.[7] R. Dovesi, V.R. Saunders, C. Roetti, R. Orlando, C.M. Zicovich-Wilson, F. Pascale,
B. Civalleri, K. Doll, N.M. Harrison, I.J. Bush, Ph. D’Arco, M. Llunell, User’sManual of CRYSTAL’06, Torino, Italy (2006) /www.crystal.unito.itS.
[8] M. Mian, N.M. Harrison, V.R. Saunders, W.R. Flavell, Chem. Phys. Lett. 257(1996) 627–632.
[9] M.D. Towler, N.L. Allan, N.M. Harrison, V.R. Saunders, W.C. Mackrodt, E. Apra,Phys. Rev. B 50 (1994) 5041–5054.
[10] C. Gatti, V.R. Saunders, C. Roetti, J. Chem. Phys. 101 (1994) 10686–10696.[11] K. Doll, G. Zwicknagl, J. Phys. Chem. A 105 (2001) 8500–8503.[12] Y. Noel, R. Dovesi, The evaluation of the elastic and piezoelectric tensors, in:
CRYSTAL’06 Manual /www.crystal.unito.itS.[13] A. Abu El-Fadl, Physica B 269 (1999) 60–68.[14] D. Vanderbilt, J. Phys. Chem. Solids 61 (2000) 147–151.[15] Y. Noel, M. Catti, R. Dovesi, Ferroelectrics 300 (2004) 139–145.[16] R. Resta, D. Vanderbilt, Theory of polarization: a modern approach, in:
K.M. Rabe, C.H. Ahn, J.-M. Triscone (Eds.), Physics of Ferroelectrics: A ModernPerspective, Springer, Berlin, 2007, pp. 31–68.
[17] J. Stankowski, A. Galezewski, S. Waplak, U. Gruszczynska, H. Gierszal,Ferroelectrics 6 (1974) 209–214.
[18] K. Imai, J. Phys. Soc. Japan 49 (1980) 2263–2269.[19] V.P. Konstantinova, I.M. Sil’vestrova, K.S. Aleksandrov, Kristallografiya 4
(1959) 70;V.P. Konstantinova, I.M. Sil’vestrova, K.S. Aleksandrov, Sov. Phys. Crystallogr.(English Transl.) 4 (1959) 63–67.
[20] Y. Luspin, G. Hauret, Ferroelectrics 15 (1977) 43–49.[21] A. Dunk, G.A. Saunders, J. Mater. Sci. 19 (1984) 125–134.[22] M.A. Gaffar, A. Abu El-Fadl, J. Phys.: Condens. Matter 1 (1989) 8991–8999.[23] T. Ikeda, Y. Tanaka, H. Toyoda, Jpn. J. Appl. Phys. 1 (1962) 13–21.
ARTICLE IN PRESS
B. Andriyevsky, K. Doll / Journal of Physics and Chemistry of Solids 70 (2009) 84–91 91


