Embed Size (px)
Citation preview

Electrical peak demand forecasting– A reviewShuang Daia, Fanlin Menga,∗, Hongsheng Daia, Qian Wangb and Xizhong Chenc
aDepartment of Mathematical Sciences, University of Essex, Colchester, UKbDepartment of Computer Science, Durham University, Durham, UKcSchool of Engineering, University College Cork, Cork, Ireland
ART ICLE INFOKeywords:peak demand managementpeak load forecasttime seriesmachine learningdeep learningsmart grid
ABSTRACTThe power system is undergoing rapid evolution with the roll-out of advanced metering infras-tructure and local energy applications (e.g. electric vehicles) as well as the increasing penetrationof intermittent renewable energy at both transmission and distribution level, which characterizesthe peak load demand with stronger randomness and less predictability and therefore poses athreat to the power grid security. Since storing large quantities of electricity to satisfy load de-mand is neither economically nor environmentally friendly, effective peak demand managementstrategies and reliable peak load forecast methods become essential for optimizing the powersystem operations. To this end, this paper provides a timely and comprehensive overview ofpeak load demand forecast methods in the literature. To our best knowledge, this is the firstcomprehensive review on such topic. In this paper we first give a precise and unified problemdefinition of peak load demand forecast. Second, 139 papers on peak load forecast methods weresystematically reviewed where methods were classified into different stages based on the time-line. Thirdly, a comparative analysis of peak load forecast methods are summarized and differentoptimizing methods to improve the forecast performance are discussed. The paper ends with acomprehensive summary of the reviewed papers and a discussion of potential future researchdirections.
1. IntroductionWith the roll-out of advanced metering infrastructure (AMI) [1], the power system is undergoing rapid evolution.
The Office for Gas and Electricity Markets (Ofgem) has announced that the UK plans to install more than 50 millionsmart meters by 2020 [2]. On the one hand, the installation of smart meters enables real-time information exchangebetween power suppliers and end-users and therefore increases the efficiency of the electric power supply and encour-ages different smart energy applications such as demand response and demand side management [3]. On the otherhand, the high temporal resolution energy consumption data coupled with intermittent energy resources such as windenergy make electricity demand present unprecedented diversity and complexity.
Different electricity generation units have been adopted in the power plants to meet the specific electrical demand/load types. Among all the units, peak load units have the lowest efficiency and the highest cost. It is estimated that a5%-15% reduction in peak load would bring substantial benefits in saving resources and decreasing real-time electricitytariffs [4], which calls for effective peak load management strategies.
To realize that, being able to accurately predict the magnitude and occurring time of peak load/ demand, whichcan not only give the power plants sufficient start-up time to avoid grid congestion but also is fundamental in ensuringthe economic benefits and the security and stability of the power grid. With the increasing penetration of large-scaleintermittent energy such aswind and solar as well as energy storage power station, it has given rise to new characteristicsof peak loads and a more challenging task for peak load/ demand forecast.
In such a context, it is evident that accurate peak load demand forecast becomes essential element to the powergrid operations [5]. Although optimizing smart grid operation based on standard load forecast has been a long-heldprinciple [6], the new digital and smart grid era calls for more attention to build flexible peak load forecast frameworksto adapt to the rapid development of the power system.
∗Corresponding [email protected] (S. Dai); [email protected] (F. Meng); [email protected] (H. Dai);
[email protected] (Q. Wang); [email protected] (X. Chen)ORCID(s): 0000-0002-4866-0011 (F. Meng)
Shuang Dai et al.: Preprint submitted to Elsevier Page 1 of 34
arX
iv:2
108.
0139
3v1
[ee
ss.S
Y]
3 A
ug 2
021

Electrical peak demand forecasting– A review
Table 1The importance of peak load demand forecast for electricity stakeholders
Electricity market stakeholders Importance of peak load demand forecast
Grid operators∙ Improve the utilization rate of power generation equipment∙ Reduce the cost of power generation and investment in power facilities∙ Alleviate the supply pressure of the grid during peak hours
Electricity retailers∙ Make reasonable tariff schemes so as to maximize profits∙ Offer energy-efficiency rebates to encourage customers to reduce peak load demand
End-usersCommercial and industrial ∙ Improve the economic benefits and save production resources
∙ Alleviate environmental pollution by distributing emissions concentrated in the peak hoursResidential Save electricity bills and improve their living standard
Government∙ Enable a reliable power supply system∙ Ensure economic growth and social welfare
1.1. Motivation and contributions of this reviewInstead of the continuous and stable power generation, peak load power plants only run for a short time over
a year, which is neither economical nor environmentally friendly. Peak load management strategies were thereforeproposed to reduce peak load generation costs based on the incentive and punishment mechanism and programs, suchas interruptible load control, demand-side bidding, and emergency demand response [7] [8]. Moreover, it is importantto know reasonably well the future peak load demand in order to plan and trigger relevant peak demand managementstrategies and mechanisms. Therefore, accurate and reliable peak load forecast is crucial for materializing any peakdemand management strategy.
In general, a mature peak load forecast can help the system operator to manage the peak load demand effectively inadvance, and thus to achieve demand response to help reduce greenhouse gas emissions and decrease non-renewablefuel reliance. Moreover, the ultimate goal of peak demand management and forecast is to balance electricity supplyand demand to maximize the benefits of system. Therefore, to further highlight the motivation of the peak demandforecast, TABLE 1 lists key stakeholders (grid operators, electricity retailers, electricity end-users, government) andthe impact of peak load demand forecast on them [9] [10] [11].
Based on the above analysis, the objective of this review is to provide a clear and comprehensive overview of thepeak load demand forecast methods in the literature. To the best of our knowledge, this should be the significant reviewon the topic of peak load forecast. In particular, the key contributions of this review are described as follows.
• We give precise definitions of key factors relevant to the peak load forecast framework, which could serve as auseful standardization and guidance for future research in this area.
• We conduct a thorough review of peak load demand forecast methods and explores hybrid forecast models froma historical and systematic point of view.
• We provide a comparative analysis based on existing studies and discuss potential improving methods for peakload demand forecast. A comprehensive summary regarding the application scopes of the reviewed methods isalso presented, which could provide useful insights for future research directions.
1.2. Literature retrieval strategyBefore a detailed overview of peak load demand forecast methods, a necessary initial step is to follow the standard
criteria and protocols to select highly related and high-quality sources and publications.The literature retrieval databases selected are ScienceDirect (SD) and the Institution of Electrical and Electronics
Engineers (IEEE). SD is a famous academic database provided by Elsevier, in which more than a billion articlesare downloaded every year, making it the most downloaded academic search platform among academic databases[12]. IEEE publishes a wide range of peer-reviewed journals, and the criteria defined are of recognized authoritativeinfluence in the field of electrical power analysis [13].
The following key phrases are used during the literature retrieval process (searching range of the year: 1872-2020):• Peak load forecasting/estimation/prediction
Shuang Dai et al.: Preprint submitted to Elsevier Page 2 of 34

Electrical peak demand forecasting– A review
• Peak load demand forecast/estimation/prediction• Maximum load forecasting/estimation/predictionThe keywords in each key phrase utilize the Boolean operator ’AND’; each key phrase is connectedwith the Boolean
operator ’OR’.After excluding low-relevance articles without key phrases in the title and abstract, a total of 139 highly related
and high-quality papers form the basis of this review through a preliminary analysis. The obtained studies consist of67 journal papers and 72 conference papers. The subsequent discussions of peak load demand forecast are all basedon the literature obtained in this section.1.3. Systematic overview of literature based on time line
To understand the historical development trend of peak load demand forecast, important to follow the timeline toconduct a systematic review. Figure. 1 shows the the number of total publications and journal publications publishedevery year from 1956 to 2020.
Figure 1: The number of papers published every year from 1956.
Built on the exponential trend of obtained publications, the exploration of peak load forecast can be roughly cate-gorized into three stages following the timeline: the initial stage, the developing stage, and the developed stage. Theinitial stage was from 1956 to 1990, during which the research on peak load demand forecast was in its infancy with asmall number of publications. The strengthening phase was from 1991 to 2003, during which the number of publica-tions began to increase gradually, with three or four articles published every year. The developed period is from 2004to 2020 with a large number of publications on peak load forecast.
The large number of publications over the past decade reveal that there are increasing interests on peak demandforecast. This could be explained by the fact that with the economic development, there are increasing electricityconsumption. As a result, peak load forecast becomes increasingly important for safe and reliable energy systemsoperation. Moreover, considering increasing integration of modern and clean energy technologies such as electric
Shuang Dai et al.: Preprint submitted to Elsevier Page 3 of 34

Electrical peak demand forecasting– A review
vehicles (EVs) and wind energy, it would be become more challenging for the peak demand forecast and the researchinterests on the topic will continue to grow in the future.
It should be noted that the number of journal publications on peak load forecast each year over the last decade isusually within the range of 1 to 4, which may indicate there still lacks sufficient efforts from the researchers but onthe other hand indicate more research opportunities. This paper will provide a timely review on the important topicof peak load forecast with a clear definition of the research problem, comprehensive review of existing methods and acomparative and forward-looking analysis of future research directions.1.4. Structure of the review
The remainder of this paper is organized as follows: Section 2 provides comprehensive summaries and precisedefinitions for the peak load forecast problem including the forecast period, influential variables, general outputs, andevaluation metrics. Section 3 describes peak load demand forecast methods following the timeline by dividing theminto manual/human expert stage, classic peak load demand forecast stage, and advanced peak load demand forecaststage. Section 4 firstly gives a comparative analysis and explores possible improving methods for the peak load demandforecast framework. Then, a comprehensive summary of existing studies on the peak load forecast will be presented.In Section 5, a conclusion is given with possible future research directions discussed.
2. Peak load demand forecast problem definitionA general peak load demand forecast framework is shown in Figure 2. Intuitively, the general framework for peak
load demand forecast is similar to standard load forecast. However, peak load demand forecast has its particularitywhen it comes to specific sub-processes, such as input variables and output results. To our best knowledge, manyterms that have been defined in the standard load forecast have not been well defined in the peak load demand forecast,which leads to different understanding of the same terms in different studies. To this end, for the first time, this paperwill provide an unification of relevant terms to accurately define peak load demand forecast methods and to providegeneralized guidance for future research on this topic.
Figure 2: A general peak load demand forecast framework.
The following subsections will first summarize the commonly used time horizon for short-term, medium-term, andlong-term peak load demand forecast according to the reviewed literature. Secondly, influential variables used in peakload demand forecast models will be discussed. Thirdly, the outputs of the forecasting model will be summarised.Finally, special evaluation indicators for peak load demand forecast results are presented.2.1. Peak load demand forecast time period
Although the forecast horizon of standard load forecast has been well known, there is no such summary for peakload demand forecast.
Therefore, through analysing the reviewed literature, we classify the time horizon of peak load demand forecastinto following categories:
• Short-term peak load demand forecast (STPLF), to forecast peak load from several hours to days (days<7) [14–17].
• Medium-term peak load demand forecast (MTPLF), to forecast peak load from per week to months (months <12) [17–19].
Shuang Dai et al.: Preprint submitted to Elsevier Page 4 of 34

Electrical peak demand forecasting– A review
Table 2Popular exogenous variables for peak load demand forecast models
Detail
Weather variables[22]
Maximum dry-bulb temperature, average dry-bulb temperature,minimum dry-bulb temperature, average relative humidity, average pressure,
average amount of cloud, rainfall volume, duration of bright sunshine,daily global solar radiation, average wind speed
Calendar variables[23]
Time of the day, day of the week, week of the month, month of the year,season, year number, holidays, special events
Economic variables[24],[22]
Gross National Product (GNP), Gross Domestic Product (GDP),population growth rate, consumer growth rate, tariff structure, electricity price
Other variables[25],[26] Customer type (commercial, residential, industrial, etc.)
• Long-term peak load demand forecast (LTPLF), to forecast peak load from more than a year ahead [16–19].It is worth noting that based on the reviewed papers: 1) daily peak load demand forecast is mainly studied among
STPLF; 2) weekly and monthly peak load demand forecast is mainly studied among MTPLF; and 3) annual peak loaddemand forecast is mainly studied for LTPLF.2.2. Influential variables of peak load demand forecast2.2.1. Endogenous variables
The endogenous variables used in peak load demand forecast differ from those used in standard load forecast. Forexample, assume that the training data are hourly load consumption for one year. A standard load demand forecastmodel will use the hourly load data, i.e. 24 × 365 data points, as the endogenous variables. However, a peak loaddemand forecast model will use the daily peak load value (sometimes also with the daily peak time), i.e. 1 × 365 datapoints (1 × 365 data pairs if with the daily peak time), as the endogenous variables.
The endogenous variables used by peak load demand forecast models are generally peak load data in similar days,which can often reflect the internal structure similar to the peak load in the forecast period, making it easier for thealgorithm to capture the characteristics of the predicted target. [20] proposed novel algorithms to identify the recentdays that are similar to the days before the forecast, and the peak load close to the predicted date is then deduced ashistorical training data by analogy with the rule of thumb to improve the prediction accuracy.
Furthermore, since the input data only need the peak load in a specific period, the input variable dimension ofpeak load demand forecast is much lower than that of standard load forecast. The advantage of this is reflected in thehigh computational efficiency of peak load demand forecast model. [21] compared both the number of input featuresand the computation time of hourly load forecast and daily peak load forecast based on the same historical data. Thestatistical analysis showed that only six input features were needed for the daily peak load demand forecast, while 171input features were necessary for the hourly load forecast.2.2.2. Exogenous variables
TABLE 2 summarizes the exogenous variables that are frequently used in peak load demand forecast models.The selection of exogenous variables of peak load demand forecast models is similar to yet different from standard
load forecast. According to the table, it can be seen that the input variables of peak load are similar to load predictionon the macro level, namely temperature, humidity, etc. Moreover, the selection of input variables of peak load isclosely related to the forecasting period, which is also similar to that of the standard load forecast. The commonlyused variables of STPLF are weather and calendar factors. For MTPLF and LTPLF, in addition to the weather andcalendar variables, it is necessary to capture socio-economic development and population growth trends. Besides, theacquisition method and accuracy of long-term weather data are also thorny problems that must be considered wiselyfor MTPLF and LTPLE.
On the other hand, the difference between peak load demand forecast and standard load forecast is that, sincethe prediction target is a series of extreme values under most conditions, the variables that most closely related to
Shuang Dai et al.: Preprint submitted to Elsevier Page 5 of 34

Electrical peak demand forecasting– A review
a peak load demand forecast model are the extreme variables with the ability to indicate the change degrees of theweather, such as the maximum and minimum temperature. In addition, some weather variables are internally relatedand can affect each other. For example, [27] pointed out that high relative humidity in months with apparent seasonality(summer/winter) would lead to an increase in demand for refrigeration or heating, thus affecting the forecast accuracyof peak load demand. Therefore, in their study, relative humidity was quantified as temperature change to correct theinaccurate input variables, which significantly improved the forecasting accuracy of peak load demand.
Calendar variables have a significant influence on areas with rare special events and regular holidays. In [23], theinfluence of lunar calendar festivals in Egypt on peak loadwas considered, and the influence of Ramadan is quantified asa weight factor and input into the expert system. The prediction results showed that models considering special festivalshad better performance than others. Moreover, electricity consumption in the weekend and holidays of commercialand industrial sectors is considerably changed from that of working days, and the peak load may not even occur inthese sectors during non-working days for the most time. Therefore, some of the reviewed works modeled historicaldata separately based on these calendar factors to improve the forecast performance. [28] trained models separately foreach hour of a day, and the weekend and weekdays were also considered as criteria for model training, which resultedin 48 independent models to predict morning peak and afternoon peak in a day. This time-division modeling methoddistinguishes between working days and non-working days, which significantly overcome the defect of the traditionalmodel in predicting peak load on weekends.2.3. Outputs of peak load demand forecast
The main difference between peak load demand forecast and standard load forecast is that the output is usuallyone value or a pair of values (e.g. a peak load value with its occurring time/date) whereas the output of standard loadforecast is generally a set of load values (time series). Existing studies did not make an unified definition for the outputof the peak load demand forecast. By reviewing relevant literature, the output of peak load forecast are summarizedas follows:
• Forecast the total peak consumption on a given peak day [29]• Forecast load usage pattern during a given peak period [30]• Forecast peak time [31].• Forecast peak value [32].• Forecast peak value and its occurring time simultaneously [33].• Forecast peak value and forecast its occurring time separately [34].• Forecast peak (or together with valley) value as an additional input to produce load profile [35].
2.4. Evaluation indicators for peak load demand forecastThe evaluation indicators of peak load demand forecast models are partly the same as those of standard load forecast
models, such as mean absolute error (MAE), mean square error (MSE), root mean square error (RMSE), mean absolutepercentage error (MAPE), etc. Since these indicators are well known in standard load forecast, this section will notdescribe them in detail. Instead, to highlight the particularity of peak load demand forecast accuracy metrics comparedwith standard load forecast, this section will list some special evaluation indicators used in the existing studies. Inaddition, the following evaluation indicators that are specific to peak load forecast are given below.
• Evaluation indicators for peak valueAssuming that y is the predicted peak value, y is the actual peak value, n is the number of the training samples:
y ={
y1, y2, ..., yn} (1)
y ={
y1, y2, ..., yn} (2)
Shuang Dai et al.: Preprint submitted to Elsevier Page 6 of 34

Electrical peak demand forecasting– A review
Peak absolute percentage error (PAPE) [33] is defined as:
PAPE = 100%n
n∑
i=1∣yi − yiyi
∣ (3)
The range of PAPE is [0,+∞). PAPE equals 0% represents a perfect trained model, while PAPE greaterthan 100% indicates an unacceptable model.
• Evaluation indicators for peak occurring timeAssuming that t is the predicted peak occurring time, t is the actual peak occurring time, n is the number of thetraining samples:
t ={
t1, t2, ..., tn} (4)
t ={
t1, t2, ..., tn} (5)
By using � to represent the tolerance residual for the peak occurring time, and ℎ as a flag to represent whetherthe predicted occurring time hits the tolerance interval [ti − �, ti + �], then we have, the Hit rate (HR) [33] isdefined as::
HR = 100%n
n∑
i=1ℎi (6)
where
ℎi =
{
1 ti ∈ [ti − �, ti + �]0 otℎerwise
(7)
The peak time forecasting is usually measured by HR [33][34], which specifies a period before and after thepeak load occurring as the forecast error tolerance range. The prediction is considered to be correct as long asthe predicted time falls within the tolerance interval.
3. Peak load demand forecast methodsTraditional forecasting methods can be roughly divided into qualitative and quantitative analysis [36]. Qualitative
analysis refers to the use of expert opinions to develop theoretical insights for prediction, such as curve fitting andextrapolation techniques, on the premise that historical data are not available or technical experiments are not feasible[36]. Quantitative analysis, on the other hand, presumes historical data are available and the future development ofdata still follows the changing trend of historical data within a reasonable range. In quantitative analysis, mathematicalor statistical methods are usually used.
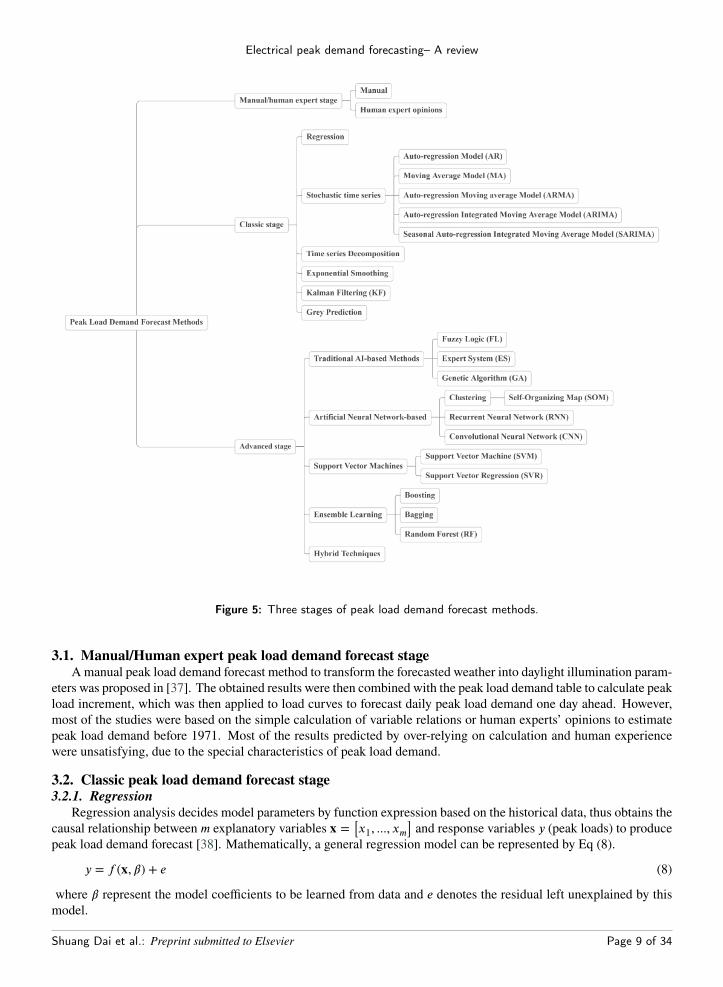
Following the literature obtained in Section 1.2, the number of publications for each method is summarized inFigure 3 while Figure 4 shows the timeline of each method being first used for peak load forecast. Finally, the peakload demand forecast methods are categorized according to the development timeline and types in Figure 5.
According to Figures 3, 4 and 5, the development of peak load demand forecast methods can be broadly classifiedinto three stages: the manual/human expert stage starting in the late 1950s, the classic stage starting in the early1970s, and the advanced stage starting in the early 1990s. There are few studies in the manual/human expert stage.In the classic stage, regression is the most popular method for peak load demand forecast, followed by time seriesdecomposition, stochastic time series models, and exponential smoothing. In the advanced stage, artificial neuralnetwork (ANN) based methods are the most favorable choice.
In the following we will provide a detailed review of methods in each stage.
Shuang Dai et al.: Preprint submitted to Elsevier Page 7 of 34

Electrical peak demand forecasting– A review
Figure 3: The number of publications for each type of methods.
Figure 4: Time line of the first time each method was used for peak load demand forecast.
Shuang Dai et al.: Preprint submitted to Elsevier Page 8 of 34
Electrical peak demand forecasting– A review
Figure 5: Three stages of peak load demand forecast methods.
3.1. Manual/Human expert peak load demand forecast stageAmanual peak load demand forecast method to transform the forecasted weather into daylight illumination param-
eters was proposed in [37]. The obtained results were then combined with the peak load demand table to calculate peakload increment, which was then applied to load curves to forecast daily peak load demand one day ahead. However,most of the studies were based on the simple calculation of variable relations or human experts’ opinions to estimatepeak load demand before 1971. Most of the results predicted by over-relying on calculation and human experiencewere unsatisfying, due to the special characteristics of peak load demand.3.2. Classic peak load demand forecast stage3.2.1. Regression
Regression analysis decides model parameters by function expression based on the historical data, thus obtains thecausal relationship between m explanatory variables x =
[
x1, ..., xm] and response variables y (peak loads) to produce
peak load demand forecast [38]. Mathematically, a general regression model can be represented by Eq (8).y = f (x, �) + e (8)
where � represent the model coefficients to be learned from data and e denotes the residual left unexplained by thismodel.Shuang Dai et al.: Preprint submitted to Elsevier Page 9 of 34

Electrical peak demand forecasting– A review
The above model is said to be univariate regression when y describes a univariate random variable, otherwise, itcan be described as multivariate regression. Besides, if there is only one explanatory variable (i.e., m = 1), the modelis simple regression, otherwise, it is multiple regression. A parametric regression model is based on the knowing formof f (·), in which parameters � are needed to be estimated. When there is a linear relationship between parameters �and the explanatory variables x, the model is said linear, otherwise, the model is known as non-linear [38].
Most of the obtained papers used univariate regression and selected multiple explanatory variables to get preciseforecast results. [39] proposed multiple regression-based approaches that took calendar effects into account to forecastshort-term system load. The approach produced forecasts using four models: an initial peak forecast regression model,an initial hourly forecast regression model, an adjusted peak model, and an adjusted hourly model. All four modelswere based on regression, and the forecasted initial peak load and the maximum hourly load were combined with pasterrors in the adjusted peak model to produce the new peak forecast. Then the new peak forecast was used as a constraintin the adjusted hourly model to produce the final hourly forecasts. The proposed model was more flexible in handlingthe effects of special days and avoided causing iterative residuals for multiple-day forecasts since past forecast errorswere considered as one of the influential variables. A regression-based model was proposed in [40], which consideredeconometric effects such as GDP, consumer price index, and population as extra explanatory variables to performLTPLF for Zimbabwe. [41] included a new variable, average wind chill, for the winter season, and considered theholidays’ effects by using transformation and reflection techniques to produce better daily peak forecast. [42] adopteda multiple regression model to linearise the load trend for Tokyo Electricity Power Company. The model is simple andhas a promising peak load demand forecast performance with a MAPE of 1.43%. However, the performance of themodel on a dataset with more fluctuated load patterns was not satisfactory.
There are a few papers utilizing probabilistic forecasts in the regression framework for peak load demand fore-cast. Instead of providing an estimate of the peak load demand, the probabilistic forecast is capable of predictingthe distribution intervals, in which the uncertainty inherent of the demand could be quantified. [16] presented a newmethodology to forecast annual and weekly peak load demand. This method adopted semi-parametric additive modelsto estimate the correlations between predictors and the peak load demand. Same as [40], weather, calendar, economic,and population variables were also considered in the paper, and the results showed a remarkable improvement in theforecast accuracy. [43] modeled monthly peak load demand as a function by considering the monthly peak time andthe monthly peak load as two key variables. In this paper, the Gaussian process was used to forecast peak load demand.It also proposed a method to optimize the hyper-parameters in the kernel function, which was vital to improve forecastaccuracy. [44] utilized Alternating Conditional Expectation (ACE) to model hourly peak load during a month. Un-like most multiple linear regression models, the seasonal and trend components in this model did not require a prioridecomposition, and the non-parametric transformed functions could be obtained through ACE. In the model, weathervariables such as temperature and humidity were analyzed and used as input to perform a probability density peak loaddemand forecast.
Regression models are also often found being used combined with other techniques to improve forecast accuracy.[45] extended the model in [42] by using trend cancellation and estimation techniques to minimize the effects of tran-sitional seasons. [46] performed monthly peak load demand forecast for the central region of Saudi Arabia wherethree time-series methods (Census-II multiplicative decomposition, seasonal auto-regressive integrated moving aver-age (SARIMA), Winters’ seasonal smoothing) were combined with the regression model. [32] considered intra-dailyseasonality effect, and proposed a new method to forecast daily peak load based on functional data analysis. Theyfirstly introduced functional clustering to obtain groups that contains similar load usage patterns. Then each groupwas assigned a specialized functional regression model. Finally, functional linear discriminant analysis was applied toassign new curves to the classified groups to perform peak load demand forecast. The proposed method demonstratedpromising performance.
Some representative regression methods for peak load forecast are summarized in TABLE 3. As aforementioned,the advantage of regression analysis lies in the model is usually simple and easy to understand, with fewer parametersand higher forecast efficiency. However, regression analysis usually makes assumptions on the historical data and didnot consider the correlation between different time trends, which could limit its applications in some cases. In thefollowing sections, we will review time series models for peak demand forecast to consider the potential correlationbetween historical data at different time points.
Shuang Dai et al.: Preprint submitted to Elsevier Page 10 of 34

Electrical peak demand forecasting– A review
Table 3Regression analysis for peak load demand forecast
Reference Model detail Input Variable(s) Forecast horizon Geographic scope Forecast output(s) Performance
[47]
A compositemultiregression-decompositionmodel
Daily peak load,weather variables(base ambient temperature,mean value of maximum andminimum ambient temperatures),calendar variables(holiday, day of the week) (9 years)
Monthly peakdemand forecast(MTPLF)
Region(Consolidated ElectricCompany of CentralRegion of Kingdomof Saudi Arabia)
Load values(monthly peakload value)
MAPE:7.88%
[39]
Modeled temperature,holiday and other specialeffects using binary variablesto build a time-independentpeak load demand forecast model
daily peak load,weather variables(maximum temperature),calendar variables(holiday, day of week) (6 years)
Daily peakdemand forecast(STPLF)
Region(Pacific Gas andElectric Company)
Load values(next day’s peakload value,hourly loads)
MPE:0.51%-0.04%
[42]
Proposed a transformationfunction with translation andreflection methods to deal withthe seasonal load change,annual load growth andthe latest daily load change
peak load of weekdays(except holidays),weather variables(daily maximum temperature,minimum temperature and humidity)(4 years)
Daily peakdemand forecast(STPLF)
Region(Tokyo ElectricPower Company(TEPCO))
Load values(next day’s peakload value)
MPE:1.50%
[28] Multiple linear regression
Fall&winter historical load,weather variables(daily maximum temperature,seven-day moving averageof past-midnight temperature),calendar variables(day of week,month of the year, year)
Daily peakdemand forecast(STPLF)
Region(Puget SoundPower andLight Company)
Load values(next day’s hourlyload value,next day’speak load)
MAPE:2.45%-6.40%
[48]
Combine fuzzy systemwith MLR, weekdaysand weekend dayswere assigned withdifferent models
Daily 15-minutes peak load,daily energy consumption(4 months)
Daily peakdemand forecast(STPLF)
Region (substations)Load values(daily peak load)
Absolute Errorrange:work days:0.33%-14.05%weekend days:0.30%-18.98%
[32]
Built model based onfunctional data analysis.Functional clustering,functional linear regressionand functional lineardiscriminant analysis were used
Daily load curve (hourly)for heating demand(four discrete periodscovering four years)
Daily peakdemand forecast(STPLF)
Buildings(usingdistrict-heatingsystem)
Load values(daily peak load)
MAPE:3.61%-32.68%
3.2.2. Time series decompositionThere are different time series decomposition methods, such as Fourier series analysis, wavelet methods and em-
pirical mode decomposition (EMD).A general time-series decomposition model usually adopts the addition or multiplication model to split the original
time series into four sub-parts: Secular trend (T), Seasonal Variation (S), Cyclical Variation (C), Irregular Variation,(I). In the context of peak load demand forecast:
• The secular trend refers to the continuous change of peak load demand in a long period.• The seasonal variation refers to the regular seasonal change of peak load demand.• The cyclical variation is the periodic change in peak load demand over years.• The irregular variation refers to the unexpected change of the peak load demand caused by many random factors.When predicting the future peak load, each component is calculated separately first, and then the forecasted value
of for each sub-part is passed to the addition model or the multiplication model to obtain the final prediction.Shuang Dai et al.: Preprint submitted to Elsevier Page 11 of 34

Electrical peak demand forecasting– A review
The addition model of time series decomposition is defined as:yt = Tt + St + Ct + It (9)
where the four components in the addition model are independent of each other, all of which are expressed in absolutequantities and of the same order of magnitude.
On the other hand, the multiplication model of time series decomposition is:yt = Tt × St × Ct × It (10)
Different from the addition model, the four components of the multiplication model are dependent on each other. Ingeneral, the secular trend in the multiplication model is expressed in absolute quantity, while other components areexpressed in relative quantity.
When Tt, St, Ct do not change over time, addition model is usually selected. Otherwise, the multiplication modelcould be a better choice. It should, however, be noted that, there is a convertible relationship between the addition andmultiplication models where log function is one of the effective converting methods [36].
In [49], the addition model is utilized to produce monthly peak load demand probabilistic forecast. It also uti-lized Fourier transformation to reduce the non-stationary time series to a stationary series. Moreover, Monte Carlosimulation was adopted to simplify the computation process. [50] designed a comparative experiment to compare thetime-series model using Fourier series with the auto-regressive model. Weekly peak load demand forecasts for oneyear ahead were produced, which showed that although over-forecasts exist, the model using Fourier expansion couldtrack the dynamic behavior of peak load demand and produce better results than the auto-regressive model.
[51] utilized a multiplicative model to forecast the monthly peak load on a regional power grid. [38] utilized thedecomposition method to develop a multi regression-decomposition model. The proposed method aims to forecastmonthly peak loads for one year ahead, and the result was promising with a MAPE of 7.88%. The advantage of thismethod is that it related the historical load trend with diverse influencing factors, and could simulate additional cycliceffects. [52] used the real-world load data from Korea Electric Power Corporation to perform one day ahead dailypeak load demand forecast. In this paper, Fourier transformation was adopted to identify the chaotic characteristicsof the time series, and the optimal and embedding dimension and delay time were determined to be used as inputs totrain an artificial neural network (ANN) model. MAPE for daily peak load demand forecast of the proposed modelwas close to 1.4%. As aforementioned, wavelet transformation is also a traditional time series decomposition method,and it can transform the information from the time domain to frequency domain, and thus capture the low-frequencyand high-frequency components of the peak load signal. In [53], wavelet decomposition was introduced to combinewith other advanced methods to build a hybrid model. Daily peak load demand forecast for Iran National Grid wasconducted based on the proposed model.
Empirical mode decomposition as a more recent time series decomposition method is also used in peak demandforecast. In [54], empirical mode decomposition was proposed to capture long-run seasonality, short-run effects, andtrend effects for the daily peak load. The load decomposition results given by EMD contain physical meaning relatedto time series characterizes, and thus can improve the forecast accuracy.
Note that time series decomposition uses the deterministic function to extract information. Therefore, it oftenignores the stochastic factors of the original time series, resulting in insufficient information extraction, which can becompensated by the stochastic time series models, as we will discuss in the next subsection.3.2.3. Stochastic time series models
Stochastic time series models can be generally divided into: the auto-regression (AR(p)) model where p denotesthe order of auto-regression; the moving average (MA(q)) model where q is the order of moving average; the auto-regression moving average (ARMA(p, q)) model; the auto-regression integrated moving average (ARIMA(p, d, q))model where d denotes the order of integration; and the seasonal auto-regression integratedmoving average (SARIMA(p, d, q)(P ,D,Q)s) model where P ,D,Q are the seasonal parts of the model corresponding to p, d, q.
A SARIMA model may be written as [55]:�p(B) P (BS )Yt = �q(B)�Q(BS )�t (11)
where: Yt = ▿d▿DS yt, yt is the peak load demand observed at time t. ▿d and ▿DS denote the non-seasonal and seasonaldifference (S is the seasonal length) operators respectively, which transform yt into stationary time series. B is theShuang Dai et al.: Preprint submitted to Elsevier Page 12 of 34

Electrical peak demand forecasting– A review
Table 4Stochastic time series models for peak load demand forecast
Reference Model detail Input variable Forecast horizon Geographic scope Forecast output Performance
[21]Modified ARIMA(incorporate ARIMAwith human experience)
Hourly loads(in the range ofpeak times),weather variables(current temperature),calendar variables(day of year, whichwas distinguished basedon average temperature),human operator’s estimationof current peak load
Daily peakdemand forecast(STPLF)
Country(Iran’s powernetwork)
Load values(next day’s peakload value, hourlyloads)
Hourly loads:MAPE:1.45%- 1.99%;Daily peak loads:ME:1.01%-1.97%
[57]
ARMA(6,5), useSARIMA(1,1,2)x(1,1,2)12to extrapolated maximumtemperature forforecasted periods
Monthly peak load demand,weather variables(maximum temperature),calendar variables(time, months)
Monthly peakdemand forecast(MTPLF)
Region(Saudi ConsolidatedElectric Company)
Load values(monthly peak load demandsfor next year)
Most monthswere observed tofall between theupper and lowerlimits ofthe forecasts
[60]
SARIMA, SARIMA withgeneralized autoregressiveconditional heteroskedasticerrors (SARIMA-GARCH),regression-SARIMA-GARCH(Reg-SARIMA-GARCH)
Daily peak load demand(the maximum hourlydemand in a 24-hour period),weather variables(maximum temperature),calendar variables(day of week, holiday,month of a year)
Daily peakdemand forecast(STPLF)
Region(industrial commercialand domestic sectorsof South Africa)
Load values(monthly peakdemands fornext year)
MAPE:1.42%
[61]SARIMA modelswith different lengthof historical data
Daily peak load demandDaily peakdemand forecast(STPLF)
Region(New South Wales,Australia)
Load values(daily peak load demands)
MAPE:2.921%-7.946%(one to sevendays ahead)
backshift operator, which is used to represent the backshift of time. When B is used for yt, it means to reverse by oneunit of time (Byt = yt − 1). For monthly data, B12yt = yt − 12 represents data of the same month of the last year.�p(B) and P (BS ) are the non-seasonal and seasonal auto-regression operators, respectively. �q(B) and �Q(BS ) arethe non-seasonal and seasonal moving average operators, respectively. p, P , q, Q denote the maximum backshift orderfor the non-seasonal, seasonal, auto-regression, and moving average operators, respectively. �t is the white noise attime t. The above model can be represented by SARIMA(p, d, q)(P ,D,Q)s where s = 4 represents the seasonal timeseries, and s = 12 represents the monthly time series. When P = D = Q = 0, the SARIMA model degenerates intoan ARIMA model, and when P = D = Q = p = d = q = 0, the SARIMA model degenerates into the white noiseprocess.
It is worth pointing out that AR,MA, andARMAmodels are suitable for weak/wide stationary time series. ARIMAis used for non-stationary time series, and SARIMA can deal with non-stationary and cyclical time series.
[56] developed two models to forecast weekly peak load one year ahead, where MA model for the seasonal-cycliccomponent is utilized. In [57], ARMA was used for monthly peak load demand forecast by considering the seasonalpatterns and load fluctuations. Some hybrid methods combining ARMAwith other methods such as regression models[58] and ANN [59] have been seen in the peak demand forecast.
When practical conditions are considered such as economic and cultural factors, it often lead to nonstationary timeseries problems. For such cases, ARIMA and SARIMA, are widely used. [21] utilized ARIMA models to forecasthourly loads and daily peak load demand, incorporating human experience within the model. The proposed approachadopted ARIMA to produce a raw output as the initial input of the modified model, and also took temperature intoaccount to distinguish hot and cold days to perform a regression-based analysis. The results of the proposed modelswere compared with ANN, standard ARIMA, and human operators, and the accuracy of the modified ARIMA modelsoutperformed other models. [62] used load data from Dubai to build models based on ARIMA and dynamic regres-sion, to forecast monthly peak load where the R2 of method is 0.997. [63] developed a model based on SARIMA toforecast monthly peak load for Sulaimany Governorate in northern Iraq. The adequate SARIMAmodel they found was
Shuang Dai et al.: Preprint submitted to Elsevier Page 13 of 34
Electrical peak demand forecasting– A review
(1, 1, 0)(0, 2, 1)12, and the forecast results gave better opportunities for the power planners to determine the maximumgenerating capacity for peak load demand. The paper also pointed out that ARIMAwas suitable for short-term forecast-ing since it prioritized the closer time series. [64] utilized SARIMA to forecast monthly peak load demand for India.The SARIMA model outperformed the official load forecasting provided by the Central Electricity Authority (CEA)for both static and dynamic horizons in all five regional grids in India. [65] compared SARIMA with Holt-Wintersmultiplicative exponential smoothing, and it showed that the SARIMA model produced better forecast results.
Although ARIMA and SARIMAmodels have promising forecast results such as in [21][63][66][67][68], they usu-ally do not take into account trend fluctuations in the data. Following this, variations based on ARIMA and SARIMAhave been proposed in some studies to overcome the limitation and to further improve the forecast accuracy. [69] com-bine generalized autoregressive conditional heteroskedastic errors (GARCH) with ARIMA to define the maximumpeak load demand level by considering the unexpected randomness of the load series. [60] presented a regression-SARIMA model with generalized autoregressive conditional heteroskedastic errors (Reg-SARIMA-GARCH), whichcould accommodate the volatility of the daily peak load demand and the multiple seasonality of the mid and long termpeak demand. The proposed model was used to conduct daily peak forecast for South Africa, and the comparativeexperiment showed that the proposed model produced better prediction accuracy than the piecewise linear regressionmodel, the SARIMA model, and the SARIMA-GARCH model.
Some representative stochastic time series methods for peak load forecast are summarized in TABLE 4.As aforementioned, the historical load data for peak load demand forecast are characterized by its high randomness.
Therefore, the stochastic time series model is widely used in peak load demand forecast as an effective method to dealwith random sequences. However, there are some limitations in the stochastic time series methods. For instance, forMA model, it gives the same weight to all the time series data, which does not necessarily reflect the actual situation.As such, a more flexible weights assignment of the data needs to be considered. In the next subsection, we will discussthe exponential smoothing, which can overcome the above limitation.3.2.4. Exponential smoothing
Exponential smoothing is a time series analysis method developed based on MA. Exponential smoothing predictsthe future peak load according to the weighted average of the historical time series. The recent data are given a largerweight whereas the previous data are given a smaller weight. This is based on the principle that the influence of acertain variable on subsequent behavior is gradually attenuating [70].
A general exponential smoothing model for peak load demand forecast can be written as [36]:yt+1 = �yt + �(1 − �)yt−1 + �(1 − �)2yt−2 + ⋅ ⋅ ⋅ (12)
where yt+1 is the forecasted peak load demand at time t + 1, and � ∈ [0, 1] is the smoothing parameter that controlsthe weights decrease (exponentially).
Exponential smoothing can be divided into several different forms. [71] provides a comprehensive review of ex-ponential smoothing methods, in which 17 basic methods and some extensions based on these methods are describedin detail. In general, single exponential smoothing is applied to sequences without trends or seasonality, and secondexponential smoothing is applied to time series that only have trends. The triple exponential smoothing (also known asthe Holt-Winters) targets sequences with both trends and seasonality. Whenmodeling the seasonal data, a Holt-Wintersmodel consists of three smoothing equations each having its smoothing parameters: trend, level, and seasonality com-ponents [72]. When the seasonal variations are constant and uncorrelated with time series, the additive Holt-Wintersmodel can be hired. However, if the seasonal variables change proportionally with time series, the multiplicationmodel can be chosen to predict the seasonal data.
The triple exponential smoothing is the most commonly used method in the reviewed papers. [39] used exponentialsmoothing to correct the forecast values that were consistently too high or too small, and the adjusted model showedgood capability to track the fast-changing load demand and produce hourly forecasts with higher accuracy. [73] pro-posed a decision support system based on a variety of time series techniques. The near-optimal monthly peak forecastmodels were built by exponential smoothing, Box-Jenkins vector, and dynamic regression to perform short-term peakload demand forecast. Moreover, a comprehensive assessment of the models was provided by using several evalu-ation indicators such as MAPE, Akaike information criterion (AIC), Bayes information criterion (BIC), and MSE.The results of the proposed system showed that different models performed differently towards different regions of thecountry.
Shuang Dai et al.: Preprint submitted to Elsevier Page 14 of 34

Electrical peak demand forecasting– A review
When trends and seasonal variations dominate the time series, the Holt-Winters exponential smoothing usuallyoutperforms the ARIMA. This was confirmed by [74], which used the Holt-Winters Smoothing to forecast peak loaddemand for England and Wales. The model they built described the intra-daily and intra-weekly seasonal cycles, andthe comparative results showed that this approach achieved a better accuracy than the ARIMA model.
Exponential smoothing is often used in combination with other methods to build composite models. [39] appliedexponential smoothing to a regression model and compared it with the regression model with ARIMA, and the exper-iment revealed that most of the initial forecasts were corrected after applying the exponential smoothing. However,the smoothing coefficient of exponential smoothing needs to be artificially selected, and if the time series fluctuateswildly (e.g., the peak load), it will produce unsatisfactory prediction results [75].3.2.5. Kalman filter and grey prediction
Kalman filter (KF) is a linear system state equation that can estimate the system state optimally through the inputand output observations of the system. Since the observed data include the noise, the optimal estimation can also beregarded as the filtering process. KF comprises two processes: prediction and correction. During the prediction, thefilter makes a forecast of the current state using the estimation of the state from the previous timestep. The correctionwas performed using observations of the current state to correct the predicted value acquired in the prediction phaseto obtain an improved estimation. Besides, apart from being known as the recursive state estimator for linear systems,some KF variants are also capable of non-linear systems [76].
[77] presented a hybrid learning scheme that consists of unsupervised and supervised learning phases to forecastdaily and weekly peak/average load profiles. The KF-based learning algorithm was engaged to find the optimumparameters and functions in the supervised learning phase. [33] selected KF as one of the benchmarks to carry out anintegrated hybrid model for STPLF.
The grey system is between a white box model and a black box model, where it focuses on learning the internalstructure, parameters, and general characteristics, and tries to decipher known information as much as possible. Greytime series prediction model was constructed based on the observed historical time series reflecting the predicted peakload characteristics.
[78] used grey correlation theory in sensitivity analysis to select relevant meteorological variables for daily peakload demand forecast. [30] developed a variable weight combination forecasting model by combining the grey modelandARIMAmodel, whichwas used to forecast load consumption in the peak loadmonth forMTPLF. The hybridmodelwas proved reliable to handle the non-smooth characteristics of monthly load data and achieved satisfactory forecastaccuracy. [34] proposed a hybrid grey model to forecast yearly peak load and its occurring date simultaneously forLTPLF. The model only needed a small amount of historical annual peak load data to produce the forecast results, andit was claimed the model was highly adaptive to dynamic changes of yearly peak load.3.3. Advanced peak load demand forecast stage
With the emergence of artificial intelligence (AI) and big data, traditional AI-based techniques such as fuzzy logic(FL), expert system (ES) and genetic algorithm (GA) and modern AI and machine learning based methods such asartificial neural network (ANN) and deep learning, support vector machines (SVMs), and ensemble models have beenadopted for peak load demand forecast.3.3.1. Traditional AI-based methods
As a bridging stage between the classic and advanced methods, there are a few studies in the reviewed literatureusing traditional AI-based methods for peak load forecast.
Fuzzy logic imitates the uncertainty concept of judging and reasoning of the human brain. It applies fuzzy rulesto the reasoning of the system with the uncertain model to deal with the fuzzy information that is difficult to handleby conventional methods. [45] adopted separate fuzzy models to predict the peak and valley load, and the simulationresults showed a good prediction accuracy. [48] proposed a fuzzy regression approach to peak load estimation. Theeffectiveness of the proposed method was demonstrated by forecasting daily load consumption and daily peak loaddemand at the distribution level.
Expert system has also been used in peak load forecast. An ES is a computer system, which is a knowledge-basedprogramming method that absorbs the domain knowledge and experience of experts and makes intelligent decisionsbased on the reasoning of such knowledge and experience. A complete ES consists of the knowledge base, the reasoningmachine, the knowledge acquisition part, and the interpretation interface. [23] implemented a knowledge-based ES to
Shuang Dai et al.: Preprint submitted to Elsevier Page 15 of 34

Electrical peak demand forecasting– A review
forecast yearly peak load for both typical fast-developing system and regular developing system, and the knowledgebase of this system was composed of both static and dynamic variables. The results proved that the knowledge-basedES yielded the best performance among all considered models (time series model, traditional ES model, econometricmodel).
Fuzzy logic has been combined with ES to produce better prediction results. [79] built an ES based on fuzzy settheory to forecast hourly load in Taiwan by improving the estimation accuracy of the peak and trough loads. Theproposed ES could handle uncertain weather variables and heuristic rules, and it could update peak and trough loadsiteratively to produce a more accurate forecast. [80] proposed a fuzzy ES to forecast morning and afternoon valley,noon and evening peak based on weather information and historical load data from the Greek power system. The resultsshowed that fuzzy ES could forecast daily peak and valley loads reasonably well compared with neural networks.
Genetic Algorithm has also been adopted in buildingmodels for peak load forecast. GA is based on natural selectionand population genetics, which makes the population evolve to the optimal region in the searching space throughselection, crossover, variation, evaluation, and other operations. GA can also be used to optimize the parameters ofthe forecast models such as initial connection weights of the networks and the threshold values of nodes for neuralnetworks. In [33], 13 years of regional data from France were utilized for training a real-valued genetic algorithm(RGA)-based neural network with support vector machine (NN-SVM) model. Daily load profile forecast and monthlypeak load demand forecast were generated, and the comparative experiments showed that the proposed model wassuitable for forecasting long-term peak load. [81] implemented a comparative analysis for yearly peak load demandforecast based on the unified Egyptian network data. In the experiment, models based on GA, least-square, and leastabsolute value filtering were trained separately. The results showed that the model developed based on GA gave thebest performance with the lowest forecast error of 0.70%.3.3.2. Artificial neural network and deep learning-based methods
ANN was proposed in 1991, and it has attracted much attention in the peak load demand forecast. Many advancedmethods based on ANN such as deep learning methods have since been proposed with good performance.
Artificial neural network (ANN) is inspired by the anatomy of the human brain, and it consists of artificial neuronsin multi-layers for information communication. An example structure of ANN is shown in Figure 6.
Figure 6: An example structure of ANN.
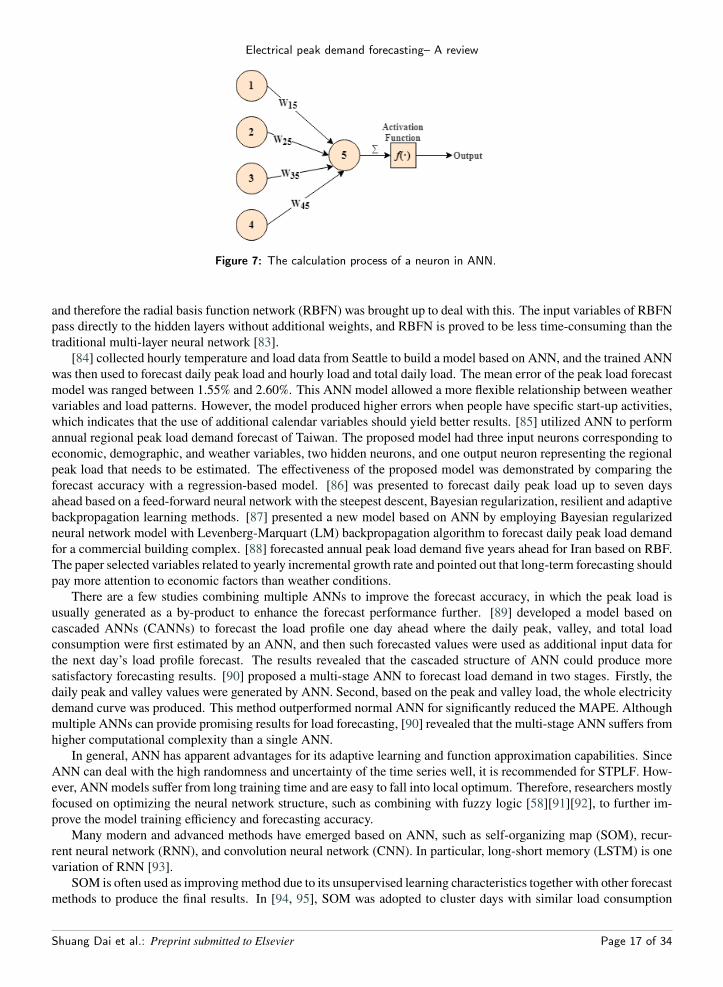
A typical ANN consists of the input layer, the hidden layer, and the output layer. Except for the input layer, eachneuron in ANN is connected to neurons of the former layer (i.e. the input neurons), with each connection correspondingto a weight. The sum of the product of all input and the corresponding connection weights are passed to an activefunction to calculate each neuron’s final value, as is shown in Figure 7.
The activation function needs to be selected according to data characteristics, and the Sigmoid function is themost commonly used active function of ANN models [82]. One of the well-known ANN is the backpropagation (BP)neural network, a multi-layer neural network with error backward propagation. BP is widely used for its satisfyingperformance on prediction tasks. It, however, suffers from high computational cost and low computational efficiency,
Shuang Dai et al.: Preprint submitted to Elsevier Page 16 of 34
Electrical peak demand forecasting– A review
Figure 7: The calculation process of a neuron in ANN.
and therefore the radial basis function network (RBFN) was brought up to deal with this. The input variables of RBFNpass directly to the hidden layers without additional weights, and RBFN is proved to be less time-consuming than thetraditional multi-layer neural network [83].
[84] collected hourly temperature and load data from Seattle to build a model based on ANN, and the trained ANNwas then used to forecast daily peak load and hourly load and total daily load. The mean error of the peak load forecastmodel was ranged between 1.55% and 2.60%. This ANN model allowed a more flexible relationship between weathervariables and load patterns. However, the model produced higher errors when people have specific start-up activities,which indicates that the use of additional calendar variables should yield better results. [85] utilized ANN to performannual regional peak load demand forecast of Taiwan. The proposed model had three input neurons corresponding toeconomic, demographic, and weather variables, two hidden neurons, and one output neuron representing the regionalpeak load that needs to be estimated. The effectiveness of the proposed model was demonstrated by comparing theforecast accuracy with a regression-based model. [86] was presented to forecast daily peak load up to seven daysahead based on a feed-forward neural network with the steepest descent, Bayesian regularization, resilient and adaptivebackpropagation learning methods. [87] presented a new model based on ANN by employing Bayesian regularizedneural network model with Levenberg-Marquart (LM) backpropagation algorithm to forecast daily peak load demandfor a commercial building complex. [88] forecasted annual peak load demand five years ahead for Iran based on RBF.The paper selected variables related to yearly incremental growth rate and pointed out that long-term forecasting shouldpay more attention to economic factors than weather conditions.
There are a few studies combining multiple ANNs to improve the forecast accuracy, in which the peak load isusually generated as a by-product to enhance the forecast performance further. [89] developed a model based oncascaded ANNs (CANNs) to forecast the load profile one day ahead where the daily peak, valley, and total loadconsumption were first estimated by an ANN, and then such forecasted values were used as additional input data forthe next day’s load profile forecast. The results revealed that the cascaded structure of ANN could produce moresatisfactory forecasting results. [90] proposed a multi-stage ANN to forecast load demand in two stages. Firstly, thedaily peak and valley values were generated by ANN. Second, based on the peak and valley load, the whole electricitydemand curve was produced. This method outperformed normal ANN for significantly reduced the MAPE. Althoughmultiple ANNs can provide promising results for load forecasting, [90] revealed that the multi-stage ANN suffers fromhigher computational complexity than a single ANN.
In general, ANN has apparent advantages for its adaptive learning and function approximation capabilities. SinceANN can deal with the high randomness and uncertainty of the time series well, it is recommended for STPLF. How-ever, ANNmodels suffer from long training time and are easy to fall into local optimum. Therefore, researchers mostlyfocused on optimizing the neural network structure, such as combining with fuzzy logic [58][91][92], to further im-prove the model training efficiency and forecasting accuracy.
Many modern and advanced methods have emerged based on ANN, such as self-organizing map (SOM), recur-rent neural network (RNN), and convolution neural network (CNN). In particular, long-short memory (LSTM) is onevariation of RNN [93].
SOM is often used as improvingmethod due to its unsupervised learning characteristics together with other forecastmethods to produce the final results. In [94, 95], SOM was adopted to cluster days with similar load consumption
Shuang Dai et al.: Preprint submitted to Elsevier Page 17 of 34

Electrical peak demand forecasting– A review
patterns. Then, based on a feed-forward multilayer neural network, daily peak load and valley load were estimated tocompute the desired hourly load. [96] adopted SOM to cluster load profiles, and principal components analysis (PCA)for reducing the dimensions of the data. Then, separate feed-forward neural network was trained for each cluster. Thecomparative analysis demonstrated the superiority of the proposed method.
RNN and CNN are commonly used deep learning methods, which have more complex network structures, such asmore hidden layers and recurrent structures. Deep learning models can better capture the dynamic characteristics ofpeak load to provide a more accurate and stable prediction and have more robust learning and generalization abilitythan the standard ANN, especially in the big data era. [20] proposed a method to combine RNN with dynamic timewarping (DTW) for short-term peak load demand forecast. The DTW was introduced to identify load curves withsimilar trends, and a bespoke gated RNN was trained to forecast daily peak load demand one month ahead based onthe half-hourly load data. The proposed method achieved a satisfactory MAPE of 1.01%. In addition, comparativeanalysis suggested that the DTW distance had the ability to adapt to the dynamic change of non-stationary daily peakload series. In [97], the LSTM layer was adopted to forecast weekly peak load in Korea. In this study, input variablesincluding weekly peak load, weekly temperature, and weekly GDP of the previous year were used. The LSTM layerin this paper was proved to be able to capture more useful characteristics of the load data, and results showed goodforecast accuracy with the lowest forecast error of 2.16%.
About 60 studies have employed ANN and deep learning based methods to perform peak load demand forecasting,revealing its dominant popularity in the peak load forecast. Some representative references related to these methodsare listed in TABLE 5.3.3.3. Support Vector Machines
As one popular machine learning method, support vector machines can minimize actual risk by seeking risk min-imization so that to get satisfactory forecasting performance. The variation of SVMs for regression problems is repre-sented as support vector regression (SVR) [100], which is efficient for large-scale regression problems [101].
Given a training dataset T = (x1, y1), ..., (xi, yi), ..., (xm, ym)where xi∈Rn denotes the i-th observation (n-dimensionalinput vector), yi∈R is the output corresponding to xi, and m denotes the size of training set. For non-linear SVMs, thebasic idea is to introduce kernel as below:
y = ⟨w, �(x)⟩ + b (13)where �(x) is the hypothetical higher dimensional feature space. Coefficients w and b need to be estimated based onthe structure risk minimization principle.
[102] introduced local prediction based on SVM for electric daily peak load forecast. The local prediction can findthe approximation function in the reconstructed embedded space. The partitioned inputs were assigned with an SVMmodel in each sub-domains, and thus local prediction could make better forecasts than the single/global model. [103]developed a novel online-SVM model based on the standard SVM. The proposed model was used to forecast dailypeak load for the residential building in Surrey, and results showed that the model could be a more intelligent tool forsmart grid systems. [104] adopted SVM to build a model for monthly peak load prediction. Firstly, feature selectionwas implemented based on correlation analysis. Then the training set was reconstructed by the topology network andrandom walk with restart (RWR) algorithm. Moreover, a feed-forward correlation was utilized to minimize the effectof unknown errors. Finally, the preprocessed training data was fed into SVM to train a model with higher accuracy.
Similar to ANN, SVMs are more suitable for STPLF and can cope with nonlinear and high dimensional data[103][104]. The disadvantage of SVMs is also similar to that of ANN for suffering from long training time with largedata sets. Besides, the hyperparameters of SVMs need to be manually selected, which is also a complex step thatneeded to be optimized.3.3.4. Ensemble Learning
Ensemble learning trains multiple learners and aggregates each learner’s predicted results to obtain the final out-put through combining strategies, which generally involve averaging, voting, and stacking [105]. According to thedependencies between learners, one possible classification of the popular ensemble learning methods is as follows:(1) Learners have to be generated in sequence to satisfy the strong dependency between them (boosting).(2) Learners are allowed to be simultaneously generated since there is no strong dependence between them (bagging
and random forest).Shuang Dai et al.: Preprint submitted to Elsevier Page 18 of 34

Electrical peak demand forecasting– A review
Ensemble learning has been widely used in peak load demand forecast in recent years. Ensemble models used inthe reviewed studies mainly are: boosting, bagging, and random forest.
Boosting adjusts the sample distribution according to the performance of the initial learner so that samples withthe wrong prediction get more attention than others, and then it trains the next learner based on the adjusted sample.The process is iterated until a specified number of learner clusters are generated, or the aggregated learning criteriareaches the stop threshold [105]. Commonly used boosting algorithms in the reviewed papers are adaptive boosting(AdaBoost), boosting tree, gradient boosting (GB) and Extreme gradient boosting (XGBoost). [106] adopted threemachine learning models (ANN with nonlinear autoregressive exogenous multivariable inputs, multivariate linearregression, andAdaBoost) to predict load profile onemonth, one season, and one year ahead at the district level. Duringtraining, datasets with different sizes were utilized for training models for different prediction intervals. This paperalso adopted feature extraction to select essential variables, and the results showed that the AdaBoost outperformedother models significantly for all prediction intervals. Moreover, for seasonal forecasting, the error range of AdaBoostwas relatively narrow, which indicated that the model trained based on AdaBoost was more capable of capturing thedynamic change of load curves. [107] conducted short-term load forecasting for southern California. In this study,different models were adopted (multivariate linear regression, random forest, and GB) and the installed solar capacitywas identified to be an important feature during the forecasting. The comparative experiment results revealed twoinsights: (1) The fact that the installed solar capacity became an important feature suggested that new and cleanenergy resources are important components in the system that researchers need to pay more attention to; (2) Differentforecasting accuracy in different periods indicated that being able to capture the fluctuation of load curves is importantfor forecast. [108] combined complete ensemble empirical mode decomposition with XGBoost to predict daily loadconsumption, daily peak load, and daily water delivery. Compared to traditional XGBoost, the hybrid model showeda lower MAPE of 5.99% for the daily peak load demand forecast.
Bagging is based on bootstrap sampling. It carries out multiple times of put-back sampling for a given datasetand trains learners simultaneously based on the obtained sampling set. When bagging is applied to a regression task,a simple mean or median can be adopted to obtain the final output [109]. [110], for the first time, utilized baggingto forecast monthly load demand for countries with different development stages. The paper combined bagging withexponential smoothing and SARIMA and then used simple mean and median to aggregate the results from singlelearners. A new variation of bagging, Remainder Sieve Bootstrap (RSB) was also proposed to enhance the forecastingresults, and the result showed that the proposed method yielded the best MAPE for both developed and developingcountries.
Random forest (RF) can be seen as an extension of bagging, which further introduces random selection in con-structing individual decision tree learners based on bagging.
The RF firstly uses bootstrap to generate its training sets, and then a decision tree is constructed for each of thetraining set. Features are randomly selected and an optimization criteria is used to guide the split of nodes in construct-ing each decision tree learner. The prediction strategies of RF are: voting for the classification task, and averaging forthe regression task [105].
As the number of learners increases, RF generally converges to a smaller generalization error than bagging. More-over, the training efficiency of RF is often superior to bagging, benefiting from the randomness in constructing singlelearners. In [111], an ensemble method combining eight popular forecasting algorithms (multiple linear regression(MLR), ARIMA, SVM, RF, multi-layer perceptron, boosting tree, and multivariate adaptive regression splines) is pro-posed for peak load forecast. Each model in the studies was assigned to a weight by GA. The results showed thatSVM and RF had the largest weights, which indicates that these two algorithms contributed more potential gains forenhancing peak load demand forecast accuracy. [112] adopted RF to predict hourly load usage patterns for two educa-tional buildings in North Central Florida, and the feature importance distribution was also produced as a by-product.The proposed model was compared with the regression tree and SVM, and the results showed that RF had the bestsuperiority among all the trained models. Moreover, the feature importance distribution also proved that the influentialfeatures changed depending on different education periods, which indicated that the load usage behavior of educationalbuildings is highly related to different semesters.3.3.5. Hybrid techniques
Many novel hybrid models with satisfactory forecast performance have been proposed in the reviewed papers, andsome of the models have already been discussed in the previous section. TABLE 6 summarised papers utilizing hybridmodels according to combinations of methods in different forecast methods development stages.
Shuang Dai et al.: Preprint submitted to Elsevier Page 19 of 34

Electrical peak demand forecasting– A review
Manual + Classic stage. There are a few papers that proposed hybrid models based on the combination of manualstage and classic stage, in which [21] was the earliest work among the obtained papers that utilized the combinationof classic forecasting methods with human experience. In this paper, human experts’ opinions were selected as one ofthe initial input variables for the daily peak load demand forecast. The proposed modified ARIMA was compared withstandard ARIMA, and the results revealed that the former had the best performance with the lowest MAPE of 1.01%for predicting the daily peak load of cold Sunday to cold Wednesday.
Classic + Advanced stage. Some papers combined methods from the classic stage with methods from the advancedstage. Among which, [48] combined fuzzy logic with a regression model. The fuzzy set theory is good at representingthe uncertainty of the data, which allows the use of additional customer information as inputs to the forecast model,and could achieve more accurate forecasts. [116] used the combination of PCA and MLR to forecast weekly peakload at the distribution level. Firstly, the correlation analysis was utilized to select the important features, and the PCAwas adopted to reduce the redundancy of the input dimensions. Finally, the output from PCA was applied to MLR toperform mid-term peak load prediction. This hybrid model was simpler than many advanced AI-based methods, yetcould also achieve satisfactory forecast accuracy.
Advanced + Advanced stage. From TABLE 6 we can see that most of the proposed hybrid models are the com-binations of the advanced stage methods. Among which, [53] proposed a hybrid method to forecast daily peak loadfor Iran. The model was built using the combination of wavelet decomposition, NN, and GA. Historical load data andweather variables from three different cities were used to train the model. The proposed model was also comparedwith other advanced models, and the results showed that this model outperformed most of the models. [80], proposeda hybrid model combining fuzzy logic with the expert system. In this study, fuzzy logic has the advantage of obtain-ing the uncertain and incomplete information from the real-world data, which will be then considered as the input ofthe expert system, such that the hybrid model can make more accurate predictions based on the acquired knowledge.[58] and [92] both combined fuzzy logic with neural network. The advantage of the hybrid model is that the neuralnetwork has strong self-learning ability and can make good use of the expression provided by fuzzy logic to produceforecasts with higher accuracy. Moreover, the fuzzy neural network is effective when handling peak loads with strongfluctuations, and it is good at capturing the calendar effect than other advanced models. In [33], the real-valued geneticalgorithm (RGA) based neural network-SVM model was proposed. In the model, the neural network was responsiblefor producing the growth index for the forecast target, SVM was adopted to output the deviation value, and the RGAwas adopted to select optimal parameters for the neural network and SVM. The experiment demonstrated that theproposed hybrid model had good performance on both short and mid-term load demand forecast.
Shuang Dai et al.: Preprint submitted to Elsevier Page 20 of 34

Electrical peak demand forecasting– A review
Table 5ANN/ANN-based methods for peak load demand forecast
Reference Model detail Input variable Forecast horizon Geographic scope Forecast output Performance
[84]
Peak load: 3 input neurons,5 hidden neurons and theoutput peak load at a given day;total load: 3 input neurons,5 hidden neurons and the outputtotal load at a given day;hourly load: 6 input neurons,10 hidden neurons, the outputload at a given hour.
Predicted temperatures;peak load value, totalload of a day (a sum),hourly load (1-24 hour ahead),weather variables(average, peak and lowesttemperature at predicted day)
Daily peakdemand forecast(STPLF)
Region(Seattle/Tacoma)
Load values( peak load value,total load of a day(a sum), hourlyload (1-24 hourahead))
Error:Peak load:2.60%;Total load:3.39%;Hourly load:1.64%
[98]
The neural network has46 input nodes,60 hidden nodes,and the one outputlayer (peak/valley load)
Historical peak/valley loads,weather variables(high/low temperature)
Daily peakdemand forecast(STPLF)
Region(Taiwan)
Load value(next day’speak/valleyload value)
Error:1.19%
[35]
The lower ANNs:16 input neurons, 8 hiddenneuron, 3 output neurons;The upper ANNs:107 neurons, 2 hidden layerseach contains 35 neurons,48 outputs indicating48 half-hourly loads.
Historical loads,weather variables(maximum and minimumtemperatures,maximum humidity),calendar variables(time of the day,day of the week, specialevent and holidays)
Half-hourly loadfor the next day(STPLF)
Country(Kuwait)
Load values(peak load value,valley load value,daily load, half-hourlyload profile.
MPE forpeak load:3.18%
[23]
Feedforward neuralnetwork based on:Levenberg-Marquardtback-propagation algorithm,Quasi-Newtonback-propagation algorithm+ principle componentsanalysis (PCA)
Peak load of previous day,weather variables(temperature of the day(maximum. minimum),gross minimum temperature.rainfall, evaporation per day,sunshine hours ofthe previous day,wind speed, the dry bulbtemperature, the wet bulbtemperature. the vapour pressure,the relative humidity (%) andthe soil temperature ),calendar variables(seasons, year number,day of the year, day of the week,holiday)
Daily peakdemand forecast(STPLF)
Region(a 220 kV substationof Haryana VidyutPrasaran Nigam Ltd.(HVPNL) )
Load values(peak load valueof the current day/one to seven daysahead)
MAPE:LMBP:2.87%,Quasi-NewtonBP:2.38%-2.41%
[99]
Feedforward neural networkbased on the conjugategradient (CG) backpropagationalgorithm (Fletcher–Reevesconjugate gradientbackpropagation method(FRCGBP), Polak–Ribiereconjugate gradientbackpropagation method(PRCGBP), Powell–Bealeconjugate gradient backpropagationmethod (PBCGBP) and scaledconjugate gradient backpropagationmethod (SCGBP)) + PCA
Peak load of previous day,weather variables(temperature of the day(maximum. minimum),gross minimum temperature.rainfall, evaporation per day,sunshine hours ofthe previous day,wind speed, the dry bulbtemperature, the wet bulbtemperature. the vapour pressure,the relative humidity (%) andthe soil temperature ),calendar variables(seasons, year number,day of the year, day of the week,holiday)
Daily peakdemand forecast(STPLF)
Region(a 220 kV substationof Haryana VidyutPrasaran Nigam Ltd.(HVPNL) )
Load values(peak load valueof the current day/one to seven daysahead)
MAPE:FRCGBP:2.43%,PRCGBP:2.31%,PBCGBP:2.32%,SCGBP:2.40%
[96]Self-organizing map (SOM) +Feedforward neural network+ PCA
Peak load,weather variables(temperature, wind speed,cloud cover, relative humidity),calendar variables(day of the week,week of the month,month of year, year number,holidays)
Daily peakdemand forecast(STPLF)
Region(Tehran RegionalElectric UtilityCompany)
Load values(peak load valueone day ahead)
MAPE:1.5%-2.61%
[20]Dynamic time warping +Bespoke gated RecurrentNeural Network (RNN)
Historical load every 30 minutes,weather variables(daily average temperature),calendar variables(day of the week, holidays)Forecast output:single load value (daily peak load)
Daily peakdemand forecast(STPLF)
Country(competition datafrom the EuropeanNetwork on IntelligentTechnologies (EUNITE))
Load values(daily peak load)
MAPE:1.01%
Shuang Dai et al.: Preprint submitted to Elsevier Page 21 of 34

Electrical peak demand forecasting– A review
Table 6Summary of papers utilizing hybrid model
Combination of the stages Hybrid models with referencesManual/human expert stage
+ Classic stage Human knowledge + ARIMA [21]
Classic stage + Classic stageDecomposition + Regression [46]
ARIMA + Regression [58]
Classic stage + Advanced stage
Regression + FL [48][113]Regression + GA [114][115]Regression + PCA [116]
Exponential Smoothing + FL [117]
Advanced stage + Advanced stage
FL + ANN [91][45][58][92][29]FL + ES [77][80]FL + SOM [27]FL + GA [118]ANNs [90]
ANN + SOM [119]ANN + SOM + PCA [96]ANN + GA [17][53][120]GA + RBFN + SVM [33]
Shuang Dai et al.: Preprint submitted to Elsevier Page 22 of 34

Electrical peak demand forecasting– A review
4. Discussion and summaryThis section will first give a comparative analysis of the peak demand forecast methods. Then, improving methods
for peak load forecast models are discussed. Finally, a comprehensive summary and discussion of the papers reviewedwill be presented.4.1. Comparative studies of different models
Each forecasting method has its advantages and disadvantages, therefore, it is necessary to compare the perfor-mance of various forecasting methods to understand their advantages and limitations. To this end, we will summarizethe existing comparative studies in the literature. Some representative comparative studies are listed in TABLE 7including composite/combined models or comparison analysis. A composite model could refer to inter-methods com-posite models (i.e. hybrid models) and result-weighted composite models. Based on different development stagesof forecast methods (classic stage and advanced stage), existing comparative studies could be categorized into intra-comparison (e.g. methods within the classic stage) and inter-comparison (e.g. methods from both classic and advancedstage).
When compared with human expert opinions, the methods in the classic stage showed good performance, as pre-sented in [73]. In the classic stage, regression, as the most popular method in the reviewed papers, are often selected asthe benchmark for building hybrid models [39] [85] [115] [60]. For instance, [39] combined the exponential smooth-ing with regression to forecast the daily peak load demand, and compared the results with the combination of ARIMAand regression. Results showed that the former model could alleviate the bias caused by the latter. [60] also usedregression as a benchmark to compare its performance with the hybrid model (Reg-SARIMA-GARCH).
In comparing the methods in classic stage with methods in the advanced stage, [85] utilized ANN and regressionto forecast annual peak load demand for Taiwan and the results showed that ANN could achieve a better performance.For instance, [115] combined GA with symbolic regression to build an STPLF framework, and the results showed thehybrid model could achieve comparable performance to an ANN model.
Considering different distribution and diversity of the data and problem, hybrid methods are not always achievingsatisfactory performance and sometimes could be counterproductive. [58] compared ARMA with a hybrid model (FL+ANN) for daily peak load demand forecast. The obtained results showed that ARMA performed better when sampleswere trained with weekends whereas the proposed hybrid model gained better forecast accuracy when excluding theweekends. [33] combined real-valuedGAwith SVMandANN, and the hybridmodel was then used for producing dailypeak load and its occurring time. The experiment compared the proposed model with other models (real-valued GA-SVM, KF, RBFN). Under the same experimental conditions, surprisingly the real-valued GA-SVM model producedthe worst results.
There are also a few studies that conducted the comparative analysis based on methods in the advanced stageonly. For example, [31] formulated peak load forecast as a classification problem and compared several methodsincluding LSTM, SVM, RF, CNN, and Adaboost. The results showed that among all the methods, LSTM had thebest performance following by SVM, RF, and CNN, whereas Adaboost produced unsatisfactory forecast results. [108]proposed a hybrid model (complete ensemble empirical mode decomposition (CEEMDAN) combined with XGBoost),which was then compared with other models such as CEEMDAN-RF, RBFN. The results revealed that the proposedmodel generated the best performance, whereas RBFN had the largest MAPE among these three models.4.2. Improving methods for peak load demand forecast models
As aforementioned, hybrid methods by combing different methods could be an option to improve the forecastaccuracy. There are some other measures that could be taken to further improve the forecast performance such asthrough optimizing the model inputs (data normalization, feature selection and transformation), and improving themodels/algorithms (e.g. by integrating clustering methods).4.2.1. Data
The magnitude difference between the data set and various variables is likely to lead to the deviation predictionof the training algorithm. Many training algorithms, such as SVR, require input variables of a similar order of mag-nitude. Beside, in the real scenarios, load data often need to be normalized due to privacy requests [32]. Therefore,data normalization is a necessary preprocessing step for training the model. Among the reviewed papers, the com-monly used data normalizationmethods are: zeromean normalization (Z-score normalization) [96][103] andMin-Maxnormalization [121][122].Shuang Dai et al.: Preprint submitted to Elsevier Page 23 of 34

Electrical peak demand forecasting– A review
The training data size is another important factor that could affect the output accuracy of the model in the trainingprocess. If the training size is too small, information learned by the model will be insufficient, and the performancewill be poor as a consequence. On the other hand, too much training data will lead to low computational efficiency.Therefore, a good trade-off and balance between the training size and the computation time is worth investigating.[87] considers training data of four different lengths (one week to four weeks) in forecasting sub-hourly load usage anddaily peak load. The training results showed that the larger the training size, the higher the training accuracy of theneural network model. In [61], different training sizes were used to predict the peak load two days to one week ahead.Specifically, the training data are the hourly load from New South Wales in the past three months, six months, ninemonths, and one year, respectively. The results showed that the model trained with six months of historical data is thebest at predicting the peak load in the coming days among all the models.4.2.2. Feature transformation/Feature selection
As aforementioned, the input variables are often numerous especially in the big data era when training a forecastingmodel. However, many variables may have unrelated characteristics with the target/ response variable , and variablesmay also be interdependent, which may easily lead to long training time and decreased forecast performance.
Feature transformation and feature selection are usually adopted to address the problem [123].Feature transformation aims to get transformed features by creating a new feature space and the commonly used
methods include PCA, independent component analysis (ICA), and linear discriminant analysis (LDA). Feature selec-tion [124] is to select a subset from the original feature space and commonly used methods include filtering, wrapperand embedding.
Most of the reviewed studies utilizing feature selection on peak load forecast adopted filtering and wrapper [87]while those using feature transformation utilized PCA. For instance, PCA was compared with correlation analysis in[111], in which the original pattern matrix of the training data is 28×1095. Through correlation analysis, variableswith correlation factors greater than 0.95 were selected. By applying PCA, the dimension of the input matrix wasreduced to 11×100. After combining the user-defined neural network to train the model for daily peak load demandforecast, the forecasting accuracy showed that the trained model using PCA was superior to correlation analysis bothin computational time and training accuracy.4.2.3. Clustering methods
With the installation of smart meters, high resolution distributed energy consumption data (e.g. at building levels)becomes available, which provides opportunities in studying different behaviours of forecast models under differentbuildings. For instance, [125] compared performance of different forecast models on different buildings and concludedthat clustering buildings based on their historical load usage patterns should be considered to produce more meaninginsights (e.g. to improve forecast accuracy) instead of their predefined building use types. Clustering methods dividethe data into different clusters according to certain standards, such as distance criterion. After clustering, the datawithin the same cluster have great similarity, while the data belonging to different clusters have great difference [126].The accuracy of peak load forecast can be improved by training different models for different clusters and then obtainingthe aggregated final forecasts.
Clustering methods can be divided into partition based clustering (e.g. K-means), hierarchical clustering, density-based clustering (e.g. density-based spatial clustering of applications with noise (DBSCAN)), andmodel-based cluster-ing (e.g. Gaussian mixture models) [127]. Some studies employing clustering in the peak load forecast are summarizedin TABLE 8 where commonly used clustering algorithms in peak load forecast are K-means, hierarchical clustering,SOM, and fuzzy clustering (FC).
K-means is a classical algorithm of partition based clustering, which has high efficiency when handling large-scaledata. Some variants based onK-means, such as the entropy weightedK-means [111] have also been used in peak loadforecast. Hierarchical clustering can be classified into aggregation hierarchical clustering and splitting hierarchicalclustering [133]. For instance, [129] adopted hierarchical clustering to optimize the input daily data of a feed-forwardneural network (FNN) to predict load usage during a peak period, and the results demonstrated that the FNN couldconverge more quickly and produce more accurate results. SOM is a commonly used clustering method owing to itsunsupervised feature. [96] firstly utilized SOM to cluster peak loads, then each cluster was trained separately by FNNto get a specified model. Results showed that the proposed hybrid method is effective for daily peak load forecast.
The above methods belong to hard clustering since each data point can only be assigned to a single cluster. Instead,fuzzy clustering such as Fuzzy C-means is a soft clustering method where each observation can belong to multiple
Shuang Dai et al.: Preprint submitted to Elsevier Page 24 of 34

Electrical peak demand forecasting– A review
clusters with correspondingmembership coefficients [134]. For instance, [131] adopted fuzzy clustering to cluster peakload patterns according to the working/ non-working days. [132] combined fuzzy clustering with FNN to forecast loadcurves during peak load period.4.3. Summary of the reviewed studies
TABLE 9 gives a comprehensive summary of the reviewed papers including their forecasting periods, forecastoutputs, input variables, improving methods and geographical scope.
It is worth mentioning that the classification of peak load forecast methods into three stages (i.e. manual, classicand advanced) generally aligns with the evolving of power systems. In the manual and classic stage, the traditionalenergy-intensive industry dominated the electricity market with a relative stable peak demand patterns. Peak loadforecasting based on statistical methods were commonly used. With the development of smart grids and the changingenergy landscape at both demand side (e.g. demand side management and electric vehicles) and supply side (e.g.intermittent renewable energy supply at both transmission and distribution level), peak demand patterns become morerandom and less predictable. As such, more advanced methods that can better take advantage of big data and capturecomplex patterns such as deep learning and hybrid machine learning methods are preferable choices.
In addition, different from traditional load forecasting, the occurrence time and magnitudes of the peak demandare equally important in peak load forecasting. The peak load occurrence time is a field that may be more related toextreme value theories or quantile regression because of some rare events. Moreover, considering the uncertainty ofpeak load, it is also an effective forecasting method to take the peak load as anomalous data to quantify its occurrenceprobability and magnitude probability [135].
For the input variables, historical load data, weather variables, and calendar variables were usually used in STPLF.On the other hand, economic and other variables such as population growth rate were frequently used in MTPLF andLTPLF. Moreover, due to the high randomness of peak load, the forecast model is greatly affected by small probabilityevents such as extreme weather and accidental events. Accidental events vary among individuals/ entities, whoseimpact is often limited to a small range and therefore difficult to forecast. Although extreme weather also belongsto the small probability event, its impact is usually well studied. For instance, it is necessary to focus on climaticfactors such as the maximum (lowest) temperature, the duration of the high (low) temperature, and the humidity. Themaximum (lowest) temperature determines the peak load value. The duration of high (low) temperature affects thepeak occurring time range, and the humidity further aggravates the difference between the physical and the actualtemperature, thus affecting consumers’ electricity usage decisions.
Most of the forecast methods utilizing improving techniques (e.g. clustering) belong to the advanced stage of peakload demand forecast, which indicates that research attention to this field is increasing. However, it is worth pointingout that although there are many clustering methods available, the current load curvy-based clustering heavily relieson additional physical and social-economic information from entities/users (in other words, the domain knowledge) inorder to properly interpret clustering results. More efforts on how to effectively incorporate domain knowledge intothe forecast methods and improving techniques are needed.
As for the forecast geographic scope, researchers usually consider peak load forecast over a wide range of regionsor countries during the classic stage. With the development of smart grids and the installation of smart meters atthe local level, there are more high resolution temporal and spatial data becoming available [127]. In addition, theincreasing penetration of distributed energy resources (e.g. electric vehicles and microgrids) coupled with distributedintelligence and local energy applications [50] brings the operation and maintenance of power systems into a new eraof disaggregated environment. From the perspective of peak load forecast , the highly random human activities willhave higher impact on the forecast performance in small geographic areas (e.g. community level) than aggregated level(e.g. region/country) [174]. Therefore, more research efforts on the interaction between electricity usage decisions ofend users and disaggregated load forecasting are needed in the future.
Shuang Dai et al.: Preprint submitted to Elsevier Page 25 of 34

Electrical peak demand forecasting– A review
Table 7Papers with composite model/comparative analysis
Reference Model/Experiment type Detail Forecast contents Performance
[73] Composite model
Built an decision supportsystem (DSS) to compareARIMA, exponential smoothingand human expert suggestions
Monthly peak load demandfor UAE
Different models suited fordifferent areas (Abu-Dhabi:ARIMA(1,1,1)(0,1,2),Dubai: Exponential smoothing,Sharjah: ARIMA(1,0,2)(0,1,3));DSS outperformed human experts
[85] Comparative analysis ANN vs RegressionAnnual peak load demandfor 4 regions of Taiwan(Region of China)
MAPE of ANN vs Regression:Northern: 1.06% vs 2.45%Central: 1.73% vs 8.52%Southern: 2.48% vs 8.29%Eastern: 3.62% vs 4.10%
[39]Composite model +comparative analysis
Applied exponential smoothingto regression model.Regression + ARIMA vsRegression + exponential smoothing
Hourly load, daily peakdemand for PG&E
Regression + exponentialsmoothing could almost eliminatethe negative bias caused byregression + ARIMA
[115]Composite model +comparative analysis
GP + symbolic regressionvs MLP (ANN)
Daily peak load demand fora distribution power systemin Romania
Maximum APE of GP +symbolic regression vs MLP:10% vs 11%MPE of GP + symbolicregression vs MLP:0.2% vs 0.1%
[60]Composite model +comparative analysis
Piece-wise linear regression vsSARIMA vs a SARIMA withgeneralized autoregressive conditionalheteroskedastic errors(SARIMA-GARCH) vsregression-SARIMA-GARCH(Reg-SARIMA-GARCH)
Daily peak load demand forSouth Africa
MAPE for regression vs SARIMAvs SARIMA-GARCH vsReg-SARIMA-GARCH:2.77% vs 1.47% vs 1.43%vs 1.42%
[80]Composite model +comparative analysis
Fuzzy logic (FL) + expert system (ES)vs NN with similar structure
Morning and afternoonvalley, noon and eveningpeak for different seasons
Yearly ME for FL + ES vs NN:2.45% vs 2.56%
[58]Composite model +comparative analysis ANFIS (Fuzzy logic + NN) vs ARMA
Daily peak load demand forecastfor a utility companyin Malaysia
Average MAPE for ANFISvs ARMA:Including weekends:7.26% vs 2.45%Excluding weekends:1.95% vs 4.67%
[33]Composite model +comparative analysis
RGA-SVM (real-valued geneticalgorithm-SVM) vs KF vs RBFvs RGA based NN-SVM(NN thread to output yearly growthindex and SVM thread to outputmoment-specific forecast )
Daily peak load demandwith occurring time
MAPE for RGA-SVM vs KF vsRBF vs RGA based NN-SVM:one week:14.26% vs 6.63%vs 6.39% vs 3.20%Occurring time: Hit rate of RGAbased NN-SVM (one-hour timedeviation tolerance): 91.7%
[31] Comparative analysis
Regard peak hour forecastas a classification problem;Naive Bayes vs SVM vs RandomForest (RF) vs AdaBoost vs CNNvs LSTM vs StackedAutoEncoder (SAE)
Daily peak hour one day aheadfor Ontario
Accuracy for Naive Bayes vsSVM vs RF vs AdaBoostvs CNN vs LSTM vs SAE:Winter: 0.83 vs 0.97 vs 0.97vs 0.82 vs 0.97 vs 0.98 vs 0.97Summer: 0.66 vs 0.95 vs 0.94vs 0.63 vs 0.94 vs 0.95 vs 0.94
[108]Composite model +comparative analysis
CEEMDAN(complete ensembleempirical mode decomposition)-XGBoost vs CEEMDAN-RF vsRBFNN vs PSO-SVM vs LSSVM(least squares SVM)
Daily energy consumption+ daily peak power +daily water delivery
MAPE for CEEMDAN-XGBoostvs CEEMDAN-RF vs RBFNN vsPSO-SVM vs LSSVM vs XGBoost:daily energy consumption: 4.85%vs 6.26% vs 7.67% vs 7.92 vs7.87% vs 8.06%daily peak power: 5.99% vs6.40% vs 9.25% vs 8.15% vs8.89% vs 9.13%daily water delivery: 5.09% vs6.31% vs 8.30% vs 8.08%vs 8.37% vs 8.32%
Shuang Dai et al.: Preprint submitted to Elsevier Page 26 of 34

Electrical peak demand forecasting– A review
Table 8Clustering methods for improving the performance of peak load forecast
Clustering methods ReferencesK-means and its extensions [111],[128],[122]Hierarchical clustering [129],[130]Fuzzy clustering [117],[121],[131],[132],SOM [15],[94],[96]
Shuang Dai et al.: Preprint submitted to Elsevier Page 27 of 34

Electrical peak demand forecasting– A review
Table 9Comprehensive summary for the reviewed literature FS/FT: Feature Selection/FeatureTransformation; H: Historical load data; W: Weather variables; C: Calendar variables;E/O: Economic/Other variables; V: Peak values; V+T: Peak values+Occurring time; LP:Load Profiles.
Methods Forecastperiods
Improving methods Input variables Geographic scope Output ReferencesClustering FS/FT H W C E/O Region Country City
Building/Household V V+T LP
RegressionSTPLF ✓ ✓ ✓ ✓ ✓ ✓ ✓ ✓ ✓
[136],[46],[39],[42], [28], [45], [48],[41],[114],[131],[130],[32],[137],[40],[44],[138],[111], [122],[139], [140]
MTPLF ✓ ✓ ✓ ✓ ✓ ✓ ✓ ✓ ✓ [38],[116],[141],[142],[43]LTPLF ✓ ✓ ✓ ✓ ✓ ✓ ✓ ✓ [89],[143],[144],[16]
Stochastictime seriesmodels
STPLF ✓ ✓ ✓ ✓ ✓ ✓ ✓[61],[92],[68],[21],[69],[62], [65],[58],[59],[46][60],[66],[67]
MTPLF ✓ ✓ ✓ ✓ ✓ ✓ ✓ [30],[63],[57],[13],[50],[55],[64]LTPLF
Time seriesdecomposition
STPLF ✓ ✓ ✓ ✓ ✓ ✓ ✓ [54],[53],[52],[29]MTPLF ✓ ✓ ✓ ✓ ✓ [49],[50],[47],[51],[55]LTPLF
Exponentialsmoothing
STPLF ✓ ✓ ✓ ✓ ✓ [39],[74],[117]MTPLF ✓ ✓ ✓ ✓ ✓ ✓ [46],[57],[73]LTPLF
Kalmanfiltering
STPLF ✓ ✓ ✓ ✓ ✓ ✓ ✓ [77],[33]MTPLFLTPLF
Greyprediction
STPLF ✓ ✓ ✓ ✓ ✓ [78]MTPLF ✓ ✓ ✓ [30]LTPLF ✓ ✓ ✓ ✓ [34]
ANNSTPLF ✓ ✓ ✓ ✓ ✓ ✓ ✓ ✓ ✓ ✓ ✓
[45],[85],[145],[90],[92],[87],[146],[147],[139],[148],[94],[95],[149],[84],[150],[98],[151],[152],[153],[132],[115],[129],[119],[154],[155],[120],[156],[29],[157],[158],[59],[159],[160],[161],[52],[91],[23],[162],[163],[35],[27],[96],[23][116],[83],[88],[33]
MTPLF ✓ ✓ ✓ ✓ ✓ ✓ ✓ ✓ ✓ [164],[126],[24],[22],[165],[119]LTPLF ✓ ✓ ✓ ✓ ✓ ✓ ✓ ✓ [99]
Expertsystem
STPLF ✓ ✓ ✓ ✓ ✓ [79],[80]MTPLFLTPLF ✓ ✓ ✓ ✓ ✓ ✓ [166]
Fuzzylogic
STPLF ✓ ✓ ✓ ✓ ✓ ✓ ✓[79],[91],[45],[48],[113],[21],[167],[58],[121],[92],[117],[168]
MTPLF ✓ ✓ ✓ ✓ ✓ [118]LTPLF
Geneticalgorithm
STPLF ✓ ✓ ✓ ✓ ✓ ✓ ✓ [114],[115],[118],[17],[33],[53],[111]MTPLFLTPLF ✓ ✓ ✓ [81]
SVMsSTPLF ✓ ✓ ✓ ✓ ✓ ✓ ✓ ✓ ✓ ✓ [26],[78],[102],[103],[169],[104],[170],[31]MTPLFLTPLF
BoostingSTPLF ✓ ✓ ✓ ✓ ✓ ✓ ✓ ✓ [107],[108]MTPLF ✓ ✓ ✓ ✓ ✓ ✓ [106]LTPLF ✓ ✓ ✓ ✓ ✓ ✓ [106]
BaggingSTPLFMTPLF ✓ ✓ ✓ ✓ ✓ ✓ [110]LTPLF
RFSTPLF ✓ ✓ ✓ ✓ ✓ ✓ ✓ ✓ ✓ [111],[112],[171]MTPLFLTPLF
CNNSTPLF ✓ ✓ ✓ ✓ ✓ [31],[172]MTPLFLTPLF
RNNSTPLF ✓ ✓ ✓ ✓ ✓ ✓ ✓ [20],[173],[31]MTPLF ✓ ✓ ✓ ✓ ✓ ✓ ✓ [93],[97]LTPLF
Shuang Dai et al.: Preprint submitted to Elsevier Page 28 of 34

Electrical peak demand forecasting– A review
5. Conclusion and future workMotived by the importance of peak load demand forecast from the perspectives of electricity market stakeholders,
this paper carries out a systematic review of the peak load demand forecast, which aims to summarize existing studieson the topic and provide guidance for future research. First, we aim to provide an unified problem definition for peakdemand load forecast. Then, the peak load demand forecast methods were categorized into three stages based ontheir development timeline, and a thorough review of relevant methods in each stage was conducted. Moreover, acomparative analysis of different forecast methods was presented, and useful improving techniques for enhancing theforecast performance were discussed. Finally, a comprehensive summary of reviewed papers on the peak load forecastframework was presented with possible future research directions.
With high-resolution load data (e.g. residential smart meter data) becoming increasingly available, data privacy isan important issue that needs to be addressed. In the new digital era, using private encryption algorithms to protectthe consumers’ data has become an essential task that researchers must deal with [175]. There are challenges in termsof electricity data transmission and storage compliance, security and privacy protection [176]. In addition, it is wellknown that the data size and quality usually determines the training quality of machine learning models. However,in practice relevant data that are deemed necessary for a forecast task might be owned by different organizations. Tomake accurate predictions, it is necessary to combine diverse data sources from different organizations in building themodel. This could be achieved by aggregating all the data sources into a third party central database, however, it mayface inevitable security risks because of the central distribution of the data [177]. Therefore, designing the forecastingframework under the premise of meeting data privacy, security, and regulatory requirements (e.g. through federatedlearning [178]) is an important future research trend on peak load demand forecast.
References[1] S. Zhou, M. A. Brown, Smart meter deployment in europe: A comparative case study on the impacts of national policy schemes, Journal of
Cleaner Production 144 (2017) 22–32.[2] Office of gas and electricity markets (ofgem), transition to smart meters., https://www.ofgem.gov.uk/gas/retail-market/metering/transition-
smart-meters/, 2020. [accessed 18 December 2020].[3] F. Rahimi, A. Ipakchi, Demand response as a market resource under the smart grid paradigm, IEEE Transactions on Smart Grid 1 (2010)
82–88.[4] A. Sheffrin, H. Yoshimura, D. LaPlante, B. Neenan, Harnessing the power of demand, The Electricity Journal 21 (2008) 39–50.[5] M. J. C. Espinoza, J. U. Suykens, R. U. Belmans, B. U. J. De Moor, Electric load forecasting - using kernel based modeling for nonlinear
system identification, IEEE Control Systems Magazine 27 (2007) 43–57.[6] I. Koutsopoulos, L. Tassiulas, Control and optimization meet the smart power grid: Scheduling of power demands for optimal energy
management, in: Proceedings of the 2nd International Conference on Energy-efficient Computing and Networking, 2011, pp. 41–50.[7] J. Saebi, H. Taheri, J. Mohammadi, S. S. Nayer, Demand bidding/buyback modeling and its impact on market clearing price, in: 2010 IEEE
International Energy Conference, IEEE, 2010, pp. 791–796.[8] P. Cappers, C. Goldman, D. Kathan, Demand response in us electricity markets: Empirical evidence, Energy 35 (2010) 1526–1535.[9] S. L. Koh, Y. S. Lim, Evaluating the economic benefits of peak load shifting for building owners and grid operator, in: 2015 International
Conference on Smart Grid and Clean Energy Technologies (ICSGCE), IEEE, 2015, pp. 30–34.[10] J. Sardi, N. Mithulananthan, M. Gallagher, D. Q. Hung, Multiple community energy storage planning in distribution networks using a
cost-benefit analysis, Applied energy 190 (2017) 453–463.[11] H. Mao, X.-J. Zeng, G. Leng, Y.-J. Zhai, J. A. Keane, Short-term and midterm load forecasting using a bilevel optimization model, IEEE
Transactions on Power Systems 24 (2009) 1080–1090.[12] Sciencedirect (sd), https://www.sciencedirect.com/, 2020. [accessed 16 August 2020].[13] the institution of electrical and electronics engineers (ieee), https://www.ieee.org/, 2020. [accessed 16 August 2020].[14] P. E.Mcsharry, S. Bouwman, G. Bloemhof, Probabilistic forecasts of themagnitude and timing of peak electricity demand, IEEETransactions
on Power Systems (2005) 1166–1172.[15] Z. Wang, Developed case-based reasoning system for short-term load forecasting, in: 2006 IEEE Power Engineering Society General
Meeting, IEEE, 2006, pp. 6–pp.[16] R. J. Hyndman, S. Fan, Density forecasting for long-term peak electricity demand, IEEE Transactions on Power Systems 25 (2009) 1142–
1153.[17] G. M. Khan, S. Khan, F. Ullah, Short-term daily peak load forecasting using fast learning neural network, in: 2011 11th International
Conference on Intelligent Systems Design and Applications, IEEE, 2011, pp. 843–848.[18] T. Yalcinoz, U. Eminoglu, Short term and medium term power distribution load forecasting by neural networks, Energy Conversion and
Management 46 (2005) 1393–1405.[19] H. G. Stoll, L. J. Garver, Least-cost electric utility planning, Wiley New York, 1989.[20] Z. Yu, Z. Niu, W. Tang, Q. Wu, Deep learning for daily peak load forecasting–a novel gated recurrent neural network combining dynamic
time warping, Ieee Access 7 (2019) 17184–17194.
Shuang Dai et al.: Preprint submitted to Elsevier Page 29 of 34

Electrical peak demand forecasting– A review
[21] N. Amjady, Short-term hourly load forecasting using time-series modeling with peak load estimation capability, IEEE Transactions on PowerSystems 16 (2001) 798–805.
[22] S. Phimphachan, K. Chamnongthai, P. Kumhom, N. Jittiwarangkul, A. Sangswang, Energy and peak load forecast models using neuralnetwork for fast developing area, in: IEEE International Symposium on Communications and Information Technology, 2004. ISCIT 2004.,volume 1, IEEE, 2004, pp. 389–393.
[23] L. Saini, M. Soni, Artificial neural network based peak load forecasting using levenberg–marquardt and quasi-newton methods, IEEProceedings-Generation, Transmission and Distribution 149 (2002) 578–584.
[24] K. Nagasaka, M. Al Mamun, Long-term peak demand prediction of 9 japanese power utilities using radial basis function networks, in: IEEEPower Engineering Society General Meeting, 2004., IEEE, 2004, pp. 315–322.
[25] R. P. Broadwater, A. Sargent, Estimating substation peaks from load research data, IEEE Transactions on Power Delivery 12 (1997) 451–456.[26] J.-Z. Wang, L. Wu, H.-Y. Lu, Special periods peak load analysis and superior forecasting method based on ls-svm, in: 2007 International
Conference on Wavelet Analysis and Pattern Recognition, volume 1, IEEE, 2007, pp. 249–253.[27] E. Contaxi, C. Delkis, S. Kavatza, C. Vournas, The effect of humidity in a weather-sensitive peak load forecasting model, in: 2006 IEEE
PES Power Systems Conference and Exposition, 2006, pp. 1528–1534.[28] R. Ramanathan, R. Engle, C. W. J. Granger, F. Vahid-Araghi, C. Brace, Short-run forecasts of electricity loads and peaks, International
Journal of Forecasting 13 (1997) 161–174.[29] S. Nuchprayoon, Forecasting of daily load curve on monthly peak day using load research data and harmonics model, in: 2016 6th IEEE
International Conference on Control System, Computing and Engineering (ICCSCE), 2016, pp. 338–342.[30] J. Zhengyuan, Electricity consumption forecasting in peak load month based on variable weight combination forecasting model, in: 2008
IEEE International Conference on Automation and Logistics, IEEE, 2008, pp. 1265–1269.[31] J. Liu, L. E. Brown, Prediction of hour of coincident daily peak load, in: 2019 IEEE Power Energy Society Innovative Smart Grid Tech-
nologies Conference (ISGT), 2019, pp. 1–5.[32] A. Goia, C. May, G. Fusai, Functional clustering and linear regression for peak load forecasting, International Journal of Forecasting 26
(2010) 700 – 711.[33] J. Xue, Z. Xu, J. Watada, Building an integrated hybrid model for short-term and mid-term load forecasting with genetic optimization,
International journal of innovative computing, information & control: IJICIC 8 (2012) 7381–7391.[34] H.-T. Yang, T.-C. Liang, K.-R. Shih, C.-L. Huang, Power system yearly peak load forecasting: a grey system modeling approach, in:
Proceedings 1995 International Conference on Energy Management and Power Delivery EMPD’95, volume 1, IEEE, 1995, pp. 261–266.[35] A. S. Alfuhaid, M. A. El-Sayed, M. S. Mahmoud, Cascaded artificial neural networks for short-term load forecasting, Power Systems IEEE
Transactions on 12 (1997) 1524–1529.[36] R. J. Hyndman, G. Athanasopoulos, Forecasting: Principles and practice, London: Bowker-Saur. Pharo (2014).[37] D. K. A. Gillies, B. Bernholtz, P. J. Sandiford, A new approach to forecasting daily peak loads [includes discussion], Power Apparatus &
Systems Part III Transactions of the American Institute of Electrical Engineers 75 (1956).[38] J. E. Turner, D. J. Downing, J. S. Bogard, Statistical methods in radiation physics, Wiley Online Library, 2012.[39] A. D. Papalexopoulos, A regression-based approach to short-term system load forecasting, IEEE Transactions on Power Systems 5 (1990)
1535–1547.[40] V. Mtembo, G. A. Taylor, A. Ekwue, A novel econometric model for peak demand forecasting, in: 2014 49th International Universities
Power Engineering Conference (UPEC), 2014, pp. 1–6.[41] H. Alfares, M. Nazeeruddin, Regression-based methodology for daily peak load forecasting, in: Proceedings of the 2nd International
Conference on Operations and Quantitative Management, volume 3, 1999, pp. 468–471.[42] T. Haida, S. Muto, Regression based peak load forecasting using a transformation technique, IEEE Transactions on Power Systems 9 (1994)
1788–1794.[43] P. Atsawathawichok, P. Teekaput, T. Ploysuwan, Long term peak load forecasting in thailand using multiple kernel gaussian process, in:
2014 11th International Conference on Electrical Engineering/Electronics, Computer, Telecommunications and Information Technology(ECTI-CON), IEEE, 2014, pp. 1–4.
[44] Y. K. Bichpuriya, S. Soman, A. Subramanyam, Non-parametric probability density forecast of an hourly peak load during a month, in: 2014Power Systems Computation Conference, IEEE, 2014, pp. 1–6.
[45] T. Haida, S. Muto, Y. Takahashi, Y. Ishi, Peak load forecasting using multiple-year data with trend data processing techniques, ElectricalEngineering in Japan 124 (1998) 7–16.
[46] E. Barakat, M. Qayyum, M. Hamed, S. Al Rashed, Short-term peak demand forecasting in fast developing utility with inherit dynamicload characteristics. i. application of classical time-series methods. ii. improved modelling of system dynamic load characteristics, IEEETransactions on Power Systems 5 (1990) 813–824.
[47] E. Barakat, M. Eissa, Forecasting monthly peak demand in fast growing electric utility using a composite multiregression-decompositionmodel, in: IEE Proceedings C (Generation, Transmission and Distribution), volume 136, IET, 1989, pp. 35–41.
[48] J. Nazarko, W. Zalewski, The fuzzy regression approach to peak load estimation in power distribution systems, IEEE Transactions on PowerSystems 14 (1999) 809–814.
[49] P. Gupta, A stochastic approach to peak power-demand forecasting in electric utility systems, IEEE Transactions on Power Apparatus andSystems (1971) 824–832.
[50] S. Fong, H. Yang, The six technical gaps between intelligent applications and real-time data mining: a critical review, journal of emergingtechnologies in web intelligence 3 (2011) 63–73.
[51] N. Dongxiao, Z. Yunyun, L. Jinpeng, The application of time series seasonal multiplicative model and garch error amending model onforecasting the monthly peak load, in: 2009 International Forum on Computer Science-Technology and Applications, volume 3, IEEE, 2009,pp. 135–138.
Shuang Dai et al.: Preprint submitted to Elsevier Page 30 of 34

Electrical peak demand forecasting– A review
[52] J.-G. Choi, J.-K. Park, K.-H. Kim, J.-C. Kim, A daily peak load forecasting system using a chaotic time series, in: Proceedings of InternationalConference on Intelligent System Application to Power Systems, IEEE, 1996, pp. 283–287.
[53] M. Moazzami, A. Khodabakhshian, R. Hooshmand, A new hybrid day-ahead peak load forecasting method for iran’s national grid, AppliedEnergy 101 (2013) 489–501.
[54] M. O. M. Mahmoud, F. Mhamdi, M. Jaidane-Saidane, Long term multi-scale analysis of the daily peak load based on the empirical modedecomposition, in: 2009 IEEE Bucharest PowerTech, IEEE, 2009, pp. 1–6.
[55] M. Beiraghi, A. Ranjbar, Discrete fourier transform based approach to forecast monthly peak load, in: 2011 Asia-Pacific Power and EnergyEngineering Conference, IEEE, 2011, pp. 1–5.
[56] Z. El-Razaz, N. Al-Mohawes, Weekly peak load forecasting for fast-developing cities, Canadian Electrical Engineering Journal 11 (1986)184–187.
[57] E. Barakat, J. Al-Qassim, S. Al Rashed, New model for peak demand forecasting applied to highly complex load characteristics of a fastdeveloping area, in: IEE Proceedings C (Generation, Transmission and Distribution), volume 139, IET, 1992, pp. 136–140.
[58] A. R. Fadhilah, S. Suriawati, H. H. Amir, Z. A. Izham, S. Mahendran, Malaysian day-type load forecasting, in: 2009 3rd InternationalConference on Energy and Environment (ICEE), 2009, pp. 408–411.
[59] K. Mahmud, J. Ravishankar, M. J. Hossain, Z. Y. Dong, The impact of prediction errors in the domestic peak power demand management,IEEE Transactions on Industrial Informatics 16 (2020) 4567–4579.
[60] C. Sigauke, D. Chikobvu, Prediction of daily peak electricity demand in south africa using volatility forecasting models, Energy Economics33 (2011) 882–888.
[61] M. As’ ad, Finding the best arima model to forecast daily peak electricity demand, in: Proceedings of the Fifth Annual ASEARC Conference- Looking to the future - Programme and Proceedings, University of Wollongong, 2012, pp. 1–4.
[62] R. M. Roken, M. A. Badri, Time series models for forecasting monthly electricity peak-load for dubai, Chancellor’s Undergraduate ResearchAward (2006) 1–14.
[63] Y. Kareem, A. R.Majeed, Monthly peak-load demand forecasting for sulaimany governorate using sarima., in: 2006 IEEE/PES Transmission& Distribution Conference and Exposition: Latin America, IEEE, 2006, pp. 1–5.
[64] S. R. Rallapalli, S. Ghosh, Forecasting monthly peak demand of electricity in india—a critique, Energy Policy 45 (2012) 516–520.[65] S. Ghosh, Univariate time-series forecasting of monthly peak demand of electricity in northern india, International Journal of Indian Culture
and Business Management 1 (2008) 466–474.[66] F. A. Razak, A. H. Hashim, I. Z. Abidin, M. Shitan, Moving holidays’ effects on the malaysian peak daily load, in: 2010 IEEE International
Conference on Power and Energy, 2010, pp. 906–910.[67] C. Heylman, Y. G. Kim, J. Wang, Forecasting energy trends and peak usage at the university of virginia, in: 2015 Systems and Information
Engineering Design Symposium, 2015, pp. 362–368.[68] A. Ananthasingam, A. Atputharajah, Forecast daily night peak electric power demand in sri lankan power system, in: 2015 IEEE 10th
International Conference on Industrial and Information Systems (ICIIS), 2015, pp. 238–243.[69] C. Hor, S. J. Watson, S. Majithia, Daily load forecasting and maximum demand estimation using arima and garch, in: 2006 International
Conference on Probabilistic Methods Applied to Power Systems, 2006, pp. 1–6.[70] E. Ostertagová, O. Ostertag, The simple exponential smoothing model, in: The 4th International Conference on Modelling of Mechanical
and Mechatronic Systems, Technical University of Košice, Slovak Republic, Proceedings of conference, 2011, pp. 380–384.[71] E. S. Gardner Jr, Exponential smoothing: The state of the art, Journal of forecasting 4 (1985) 1–28.[72] R. A. Yaffee, M. McGee, An introduction to time series analysis and forecasting: with applications of SAS® and SPSS®, Elsevier, 2000.[73] M. A. Badri, A. Al-Mutawa, D. Davis, D. Davis, Edssf: A decision support system (dss) for electricity peak-load forecasting, Energy 22
(1997) 579–589.[74] J. W. Taylor, Short-term electricity demand forecasting using double seasonal exponential smoothing, Journal of the Operational Research
Society 54 (2003) 799–805.[75] B. Billah, M. L. King, R. D. Snyder, A. B. Koehler, Exponential smoothing model selection for forecasting, International journal of
forecasting 22 (2006) 239–247.[76] S. J. Julier, J. K. Uhlmann, New extension of the kalman filter to nonlinear systems, in: Signal processing, sensor fusion, and target
recognition VI, volume 3068, International Society for Optics and Photonics, 1997, pp. 182–193.[77] P. Dash, H. Satpathy, S. Rahman, Short term daily average and peak load predications using a hybrid intelligent approach, in: Proceedings
1995 International Conference on Energy Management and Power Delivery EMPD’95, volume 2, IEEE, 1995, pp. 565–570.[78] L. Ran, G. Chaoyun, The relevance analysis between electrical day peak load and meteorological index based on wavelet denoising and
svm, in: 2008 Third International Conference on Electric Utility Deregulation and Restructuring and Power Technologies, IEEE, 2008, pp.788–793.
[79] Y.-Y. Hsu, K.-L. Ho, Fuzzy expert systems: an application to short-term load forecasting, in: IEE Proceedings C (Generation, Transmissionand Distribution), volume 139, IET, 1992, pp. 471–477.
[80] S. Kiartzis, A. Bakirtzis, J. Theocharis, G. Tsagas, A fuzzy expert system for peak load forecasting. application to the greek power system,in: 2000 10th Mediterranean Electrotechnical Conference. Information Technology and Electrotechnology for the Mediterranean Countries.Proceedings. MeleCon 2000 (Cat. No. 00CH37099), volume 3, IEEE, 2000, pp. 1097–1100.
[81] K. M. El-naggar, K. A. Al-rumaih, Electric load forecasting using genetic based algorithm, optimal filter estimator and least error squarestechnique: Comparative study, World Academy of Science, Engineering and Technology 6 (2005) 138–142.
[82] S. Agatonovic-Kustrin, R. Beresford, Basic concepts of artificial neural network (ann) modeling and its application in pharmaceuticalresearch, Journal of Pharmaceutical & Biomedical Analysis 22 (2000) 717–727.
[83] M. Ghomi, M. Goodarzi, M. Goodarzi, Peak load forecasting of electric utilities for west province of iran by using neural network withoutweather information, in: 2010 12th International Conference on Computer Modelling and Simulation, IEEE, 2010, pp. 28–32.
Shuang Dai et al.: Preprint submitted to Elsevier Page 31 of 34

Electrical peak demand forecasting– A review
[84] S. Saeed Madani, Electric load forecasting using an artificial neural network, IEEE Transactions on Power Systems 6 (1991) 442–449.[85] C. C. Hsu, C. Y. Chen, Regional load forecasting in taiwan––applications of artificial neural networks, Energy Conversion & Management
44 (2003) 1941–1949.[86] L. M. Saini, Peak load forecasting using bayesian regularization, resilient and adaptive backpropagation learning based artificial neural
networks, Electric Power Systems Research 78 (2008) 1302–1310.[87] Y. T. Chae, R. Horesh, Y. Hwang, Y. M. Lee, Artificial neural network model for forecasting sub-hourly electricity usage in commercial
buildings, Energy & Buildings 111 (2016) 184–194.[88] L. Ghods, M. Kalantar, Long-term peak demand forecasting by using radial basis function neural networks, Iranian Journal of Electrical and
Electronic Engineering 6 (2010) 175–182.[89] H. K. Temraz, K. M. El-Nagar, M. M. A. Salama, Applications of noniterative least absolute value estimation for forecasting annual peak
electric power demand, Canadian Journal of Electrical and Computer Engineering 23 (1998) 141–146.[90] L. Hernández, C. Baladón, J. Aguiar, L. Calavia, B. Carro, A. Sánchez-Esguevillas, J. Sanjuán, á. González, J. Lloret, Improved short-term
load forecasting based on two-stage predictions with artificial neural networks in a microgrid environment, Energies 6 (2013) 4489–4507.[91] S. Mandal, A. Agrawal, Fuzzy-neural network based short term peak and average load forecasting (stpalf) system with network security,
in: IECEC-97 Proceedings of the Thirty-Second Intersociety Energy Conversion Engineering Conference (Cat. No. 97CH6203), volume 3,IEEE, 1997, pp. 2193–2196.
[92] Z. Tavassoli-Hojati, S. Ghaderi, H. Iranmanesh, P. Hilber, E. Shayesteh, A self-partitioning local neuro fuzzy model for short-term loadforecasting in smart grids, Energy 199 (2020) 117514.
[93] Ermatita, I. Pahendra, E. Darnila, M. Sadli, M. Sinambela, W. Fuadi, Peak load forecasting based on long short term memory, in: 2019International Conference on Informatics, Multimedia, Cyber and Information System (ICIMCIS), 2019, pp. 137–140.
[94] Y.-Y. Hsu, C.-C. Yang, Design of artificial neural networks for short-term load forecasting. part 1: Self-organising feature maps for day typeidentification, in: IEE Proceedings C (Generation, Transmission and Distribution), volume 138, IET, 1991, pp. 407–413.
[95] Y.-Y. Hsu, C.-C. Yang, Design of artificial neural networks for short-term load forecasting. part 2: Multilayer feedforward networks for peakload and valley load forecasting, in: IEE Proceedings C (Generation, Transmission and Distribution), volume 138, IET, 1991, pp. 414–418.
[96] M. Amin-Naseri, A. Soroush, Combined use of unsupervised and supervised learning for daily peak load forecasting, Energy Conversionand Management 49 (2008) 1302–1308.
[97] B. Kwon, R. Park, K. Song, Weekly peak load forecasting for 104 weeks using deep learning algorithm, in: 2019 IEEE PES Asia-PacificPower and Energy Engineering Conference (APPEEC), 2019, pp. 1–4.
[98] K. Ho, Y.-Y. Hsu, C.-C. Yang, Short term load forecasting using a multilayer neural network with an adaptive learning algorithm, IEEETransactions on Power Systems 7 (1992) 141–149.
[99] L. M. Saini, M. K. Soni, Artificial neural network-based peak load forecasting using conjugate gradient methods, IEEE Transactions onPower Systems 17 (2002) 907–912.
[100] H. Drucker, C. J. Burges, L. Kaufman, A. Smola, V. Vapnik, et al., Support vector regression machines, Advances in neural informationprocessing systems 9 (1997) 155–161.
[101] C. Coello, E. Mezura-Montes, Constraint-handling in genetic algorithms through the use of dominance-based tournament selection, Ad-vanced Engineering Informatics 16 (2002) 193–203.
[102] E. El-Attar, J. Goulermas, Q. Wu, Forecasting electric daily peak load based on local prediction, in: 2009 IEEE Power & Energy SocietyGeneral Meeting, IEEE, 2009, pp. 1–6.
[103] J. Dhillon, S. A. Rahman, S. U. Ahmad, M. J. Hossain, Peak electricity load forecasting using online support vector regression, in: 2016IEEE Canadian Conference on Electrical and Computer Engineering (CCECE), IEEE, 2016, pp. 1–4.
[104] P. Zeng, M. Jin, Peak load forecasting based on multi-source data and day-to-day topological network, IET Generation, TransmissionDistribution 12 (2018) 1374–1381.
[105] R. Polikar, Ensemble learning, in: Ensemble machine learning, Springer, 2012, pp. 1–34.[106] T. Ahmad, H. Chen, Potential of three variant machine-learning models for forecasting district level medium-term and long-term energy
demand in smart grid environment, Energy 160 (2018) 1008–1020.[107] N. Zhang, Z. Li, X. Zou, S. M. Quiring, Comparison of three short-term load forecast models in southern california, Energy 189 (2019)
116358.[108] H. Lu, F. Cheng, X. Ma, G. Hu, Short-term prediction of building energy consumption employing an improved extreme gradient boosting
model: a case study of an intake tower, Energy 203 (2020) 117756.[109] D. E. Rumelhart, G. E. Hinton, R. J. Williams, Learning Internal Representations by Error Propagation, MIT Press, 1988.[110] E. M. de Oliveira, F. L. Cyrino Oliveira, Forecasting mid-long term electric energy consumption through bagging arima and exponential
smoothing methods, Energy 144 (2018) 776–788.[111] C. Fan, F. Xiao, S. Wang, Development of prediction models for next-day building energy consumption and peak power demand using data
mining techniques, Applied Energy 127 (2014) 1–10.[112] Z. Wang, Y. Wang, R. Zeng, R. S. Srinivasan, S. Ahrentzen, Random forest based hourly building energy prediction, Energy and Buildings
171 (2018) 11–25.[113] G. Cartina, V. Alexandrescu, G. Grigoras, M. Moshe, Peak load estimation in distribution networks by fuzzy regression approach, in:
2000 10th Mediterranean Electrotechnical Conference. Information Technology and Electrotechnology for the Mediterranean Countries.Proceedings. MeleCon 2000 (Cat. No. 00CH37099), volume 3, IEEE, 2000, pp. 907–910.
[114] S. Kato, K. Yukita, Y. Goto, K. Ichiyanagi, Study of daily peak load forecasting by structured representation on genetic algorithms forfunction fitting, in: IEEE/PES Transmission and Distribution Conference and Exhibition, volume 3, IEEE, 2002, pp. 1686–1690.
[115] M. Gavrilas, C. V. Sfintes, O. Ivanov, Comparison of neural and evolutionary approaches to peak load estimation in distribution systems, in:EUROCON 2005-The International Conference on" Computer as a Tool", volume 2, IEEE, 2005, pp. 1461–1464.
Shuang Dai et al.: Preprint submitted to Elsevier Page 32 of 34
Electrical peak demand forecasting– A review
[116] R. Torkzadeh, A. Mirzaei, M. M. Mirjalili, A. S. Anaraki, M. R. Sehhati, F. Behdad, Medium term load forecasting in distribution systemsbased on multi linear regression principal component analysis: A novel approach, in: 2014 19th Conference on Electrical Power DistributionNetworks (EPDC), 2014, pp. 66–70.
[117] A. Laouafi, M. Mordjaoui, F. Laouafi, T. E. Boukelia, Daily peak electricity demand forecasting based on an adaptive hybrid two-stagemethodology, International Journal of Electrical Power & Energy Systems 77 (2016) 136–144.
[118] M.-R. Lee, S.-J. Wang, L. Yi-Yu, L.-I. Tai, H.-J. Shi, The maximum power demand forecasting with fuzzy theory, in: 2010 InternationalSymposium on Computer, Communication, Control and Automation (3CA), volume 2, IEEE, 2010, pp. 419–422.
[119] O. A. Carpinteiro, R. C. Leme, A. de Souza, et al., A hierarchical hybrid neural model with time integrators in long-term peak-load forecasting,in: Proceedings. 2005 IEEE International Joint Conference on Neural Networks, 2005., volume 5, IEEE, 2005, pp. 2960–2965.
[120] O. Ivanov, M. Gavrilaş, Multilayer perceptron architecture optimization for peak load estimation, in: 12th Symposium on Neural NetworkApplications in Electrical Engineering (NEUREL), 2014, pp. 67–72.
[121] J. Yu, H. Lee, Y. Jeong, S. Kim, Linguistic fuzzy modeling approach for daily peak load forecasting, in: 2013 International Conference onFuzzy Theory and Its Applications (iFUZZY), IEEE, 2013, pp. 116–121.
[122] J. R. G. Sarduy, K. G. D. Santo, M. A. Saidel, Linear and non-linear methods for prediction of peak load at university of são paulo,Measurement 78 (2016) 187–201.
[123] F. Escolano, P. Suau, B. Bonev, Feature selection and transformation, Information Theory in Computer Vision and Pattern Recognition(2009) 211–269.
[124] M. Dash, H. Liu, Feature selection for classification, Intelligent data analysis 1 (1997) 131–156.[125] S. Dai, F. Meng, Energy forecasting with building characteristics analysis, in: 2020 International Joint Conference on Neural Networks
(IJCNN), IEEE, 2020, pp. 1–7.[126] X. Fu, X.-J. Zeng, P. Feng, X. Cai, Clustering-based short-term load forecasting for residential electricity under the increasing-block pricing
tariffs in china, Energy 165 (2018) 76–89.[127] A. K. Jain, M. N. Murty, P. J. Flynn, Data clustering: a review, ACM computing surveys (CSUR) 31 (1999) 264–323.[128] A. Salimi-Beni, D. Farrokhzad, M. Fotuhi-Firuzabad, S. Alemohammad, A new approach to determine base, intermediate and peak-demand
in an electric power system, in: 2006 International Conference on Power System Technology, IEEE, 2006, pp. 1–5.[129] L. Jin, Y. Feng, Y. Jilai, Peak load forecasting using hierarchical clustering and rprop neural network, in: 2006 IEEE PES Power Systems
Conference and Exposition, IEEE, 2006, pp. 1535–1540.[130] L. Jin, Y. Jilai, L. Zhuo, Load forecast for system operation in peak load period, in: 2007 IEEE Power Engineering Society General Meeting,
IEEE, 2007, pp. 1–6.[131] L. Jin, Y. J. Lai, T. X. Long, Peak load forecasting based on robust regression model, in: 2004 International Conference on Probabilistic
Methods Applied to Power Systems, IEEE, 2004, pp. 123–128.[132] L. Jin, L. Ziyang, S. Jingbo, S. Xinying, An efficient method for peak load forecasting, in: 2005 International Power Engineering Conference,
IEEE, 2005, pp. 1–52.[133] C. Ding, X. He, Cluster merging and splitting in hierarchical clustering algorithms, in: 2002 IEEE International Conference on Data Mining,
2002. Proceedings., IEEE, 2002, pp. 139–146.[134] J. C. Bezdek, Pattern recognition with fuzzy objective function algorithms, Springer Science & Business Media, 2013.[135] L. Xu, S. Wang, R. Tang, Probabilistic load forecasting for buildings considering weather forecasting uncertainty and uncertain peak load,
Applied Energy 237 (2019) 180–195.[136] L. E. Stetson, G. L. Stark, Peak electrical demands of individuals and groups of rural residential customers, IEEE Transactions on Industry
Applications 24 (1988) 772–776.[137] J. Huang, Y. Li, Y. Liu, Summer daily peak load forecasting considering accumulation effect and abrupt change of temperature, in: 2012
IEEE Power and Energy Society General Meeting, IEEE, 2012, pp. 1–4.[138] T. Ploysuwan, Spectral mixture kernel for pattern discovery and time series forecasting of electricity peak load, in: TENCON 2014-2014
IEEE Region 10 Conference, IEEE, 2014, pp. 1–5.[139] K. Ogihara, S. Urano, A study of risk reduction for daily peak load demand forecasting, in: 2019 IEEE Milan PowerTech, IEEE, 2019, pp.
1–6.[140] C. Tairen, J. M. Lehr, L. Olga, M.-R. Manel, Distribution feeder-level day-ahead peak load forecasting methods and comparative study, IET
Generation Transmission & Distribution 12 (2018) 3270–3278.[141] T. Ploysuwan, P. Atsawathawichok, P. Teekaput, Peak load forecasting of electricity generating authority of thailand by gaussian process, in:
2014 International Electrical Engineering Congress (iEECON), IEEE, 2014, pp. 1–4.[142] M. N. S. K. Shabbir, M. Z. Ali, X. Liang, M. S. A. Chowdhury, A probabilistic approach considering contingency parameters for peak load
demand forecasting, Canadian Journal of Electrical and Computer Engineering 41 (2018) 224–233.[143] Y. K. Bichpuriya, S. Soman, A. Subramanyam, Robust probability density forecasts of yearly peak load using non-parametric model, in:
2016 IEEE Power and Energy Society General Meeting (PESGM), IEEE, 2016, pp. 1–5.[144] E. Khorsheed, Long-term energy peak load forecasting models: A hybrid statistical approach, in: 2018 Advances in Science and Engineering
Technology International Conferences (ASET), IEEE, 2018, pp. 1–6.[145] Z. Wang, Y. Cao, Mutual information and non-fixed anns for daily peak load forecasting, in: 2006 IEEE PES Power Systems Conference
and Exposition, IEEE, 2006, pp. 1523–1527.[146] K. Gajowniczek, R. Nafkha, T. Zabkowski, Electricity peak demand classification with artificial neural networks, in: 2017 Federated
Conference on Computer Science and Information Systems (FedCSIS), 2017, pp. 307–315.[147] K. Gajowniczek, R. Nafkha, T. Zabkowski, Seasonal peak demand classification with machine learning techniques, in: 2018 International
Conference on Applied Mathematics Computer Science (ICAMCS), 2018, pp. 101–1014.[148] S. Chemetova, P. Santos, A. J. Pires, Peak load forecasting in electrical deregulated market environment - the dynamic tariffs, in: IECON
Shuang Dai et al.: Preprint submitted to Elsevier Page 33 of 34

Electrical peak demand forecasting– A review
2019 - 45th Annual Conference of the IEEE Industrial Electronics Society, 2019, pp. 2227–2232.[149] D. C. Park, O. Mohammed, Artificial neural network based electric peak load forecasting, in: IEEE Proceedings of the SOUTHEAST-
CON’91, IEEE, 1991, pp. 225–228.[150] K. Y. Lee, Y. T. Cha, Short-term load forecasting using an artificial neural network, IEEE Transactions on Power Systems 7 (1992) 124–132.[151] I. Drezga, S. Rahman, Short-term load forecasting with local ann predictors, IEEE Transactions on Power Systems 14 (1999) 844–850.[152] M. A. Aboul-Magd, et al., An artificial neural network model for electrical daily peak load forecasting with an adjustment for holidays,
in: LESCOPE 01. 2001 Large Engineering Systems Conference on Power Engineering. Conference Proceedings. Theme: Powering Beyond2001 (Cat. No. 01ex490), IEEE, 2001, pp. 105–113.
[153] T. Matsui, T. Iizaka, Y. Fukuyama, Peak load forecasting using analyzable structured neural network, in: 2001 IEEE Power EngineeringSociety Winter Meeting. Conference Proceedings (Cat. No. 01CH37194), volume 2, IEEE, 2001, pp. 405–410.
[154] M. B. Tasre, P. P. Bedekar, V. N. Ghate, Daily peak load forecasting using ann, in: 2011 Nirma University International Conference onEngineering, IEEE, 2011, pp. 1–6.
[155] J. Milojković, I. Litovski, V. Litovski, Ann application for the next day peak electricity load prediction, in: 11th Symposium on NeuralNetwork Applications in Electrical Engineering, IEEE, 2012, pp. 237–241.
[156] S. Chemetova, P. Santos, M. Ventim-Neves, Load peak forecasting in different load patterns situations, in: 2016 10th International Conferenceon Compatibility, Power Electronics and Power Engineering (CPE-POWERENG), IEEE, 2016, pp. 148–151.
[157] A. Jarndal, S. Hamdan, Forecasting of peak electricity demand using annga and ann-pso approaches, in: 2017 7th International Conferenceon Modeling, Simulation, and Applied Optimization (ICMSAO), IEEE, 2017, pp. 1–5.
[158] M. H. Leak, G. K. Venayagamoorthy, Forecasting peak daily load in distribution feeders, in: 2018 Clemson University Power SystemsConference (PSC), IEEE, 2018, pp. 1–8.
[159] T. Onoda, Next day’s peak load forecasting using an artificial neural network, in: [1993] Proceedings of the Second International Forum onApplications of Neural Networks to Power Systems, IEEE, 1992, pp. 284–289.
[160] Y. Morioka, K. Sakurai, A. Yokoyama, Y. Sekine, Next day peak load forecasting using a multilayer neural network with an additionallearning, in: [1993] Proceedings of the Second International Forum on Applications of Neural Networks to Power Systems, IEEE, 1992, pp.60–65.
[161] Y. Mizukami, T. Nishimori, Maximum electric power demand prediction by neural network, in: [1993] Proceedings of the Second Interna-tional Forum on Applications of Neural Networks to Power Systems, IEEE, 1992, pp. 296–301.
[162] D. Abdellah, L. Djamel, Forecasting the algerian load peak profile using time series model based on backpropagation neural networks, in:4th International Conference on Power Engineering, Energy and Electrical Drives, IEEE, 2013, pp. 1734–1737.
[163] S. Takiyar, Grid reliability enhancement by peak load forecasting with a pso hybridized ann model, in: 2015 4th International Conferenceon Reliability, Infocom Technologies and Optimization (ICRITO) (Trends and Future Directions), 2015, pp. 1–6.
[164] O. A. S. Carpinteiro, R. C. Leme, A. C. Z. D. Souza, C. A. M. Pinheiro, E. M. Moreira, Long-term load forecasting via a hierarchical neuralmodel with time integrators, Electric Power Systems Research 77 (2006) 371–378.
[165] S. Phimphachanh, K. Chammongthai, P. Kumhom, A. Sangswang, Using neural network for long term peak load forecasting in vientianemunicipality, in: 2004 IEEE Region 10 Conference TENCON 2004., volume 100, IEEE, 2004, pp. 319–322.
[166] M. S. Kandil, S. M. El-Debeiky, N. E. Hasanien, Long-term load forecasting for fast developing utility using a knowledge-based expertsystem, IEEE Power Engineering Review 22 (2002) 78–78.
[167] M. Rashidi, F. Rashidi, H. Monavar, Peak load forecasting in power systems using emotional learning based fuzzy logic, in: SMC’03Conference Proceedings. 2003 IEEE International Conference on Systems, Man and Cybernetics. Conference Theme - System Security andAssurance (Cat. No.03CH37483), 2003, pp. 1985–1988.
[168] J. Jamaaluddin, D. Hadidjaja, I. Sulistiyowati, E. Suprayitno, I. Anshory, S. Syahrorini, Very short term load forecasting peak load timeusing fuzzy logic, in: IOP Conference Series: Materials Science and Engineering, volume 403, IOP Publishing, 2018, p. 012070.
[169] I. P. Panapakidis, G. C. Christoforidis, N. Asimopoulos, A. S. Dagoumas, Combining wavelet transform and support vector regression modelfor day-ahead peak load forecasting in the greek power system, in: 2017 IEEE International Conference on Environment and ElectricalEngineering and 2017 IEEE Industrial and Commercial Power Systems Europe (EEEIC/I&CPS Europe), IEEE, 2017, pp. 1–6.
[170] M. K. Azad, S. Uddin, M. Takruri, Support vector regression based electricity peak load forecasting, in: 2018 11th International Symposiumon Mechatronics and its Applications (ISMA), 2018, pp. 1–5.
[171] A. Satre-Meloy, M. Diakonova, P. Grünewald, Cluster analysis and prediction of residential peak demand profiles using occupant activitydata, Applied Energy 260 (2020) 114246.
[172] J. Liu, L. E. Brown, Effect of forecast accuracy on day ahead prediction of coincident peak days, in: 2019 IEEE Innovative Smart GridTechnologies - Asia (ISGT Asia), 2019, pp. 661–666.
[173] S. Ai, A. Chakravorty, C. Rong, Evolutionary ensemble lstm based household peak demand prediction, in: 2019 International Conferenceon Artificial Intelligence in Information and Communication (ICAIIC), IEEE, 2019, pp. 1–6.
[174] T. Chen, J. Lehr, O. Lavrova, M. Martinez-Ramonz, Distribution-level peak load prediction based on bayesian additive regression trees, in:2016 IEEE Power and Energy Society General Meeting (PESGM), IEEE, 2016, pp. 1–5.
[175] J. Lim, I. Doh, K. Chae, Security system architecture for data integrity based on a virtual smart meter overlay in a smart grid system, SoftComputing 20 (2016) 1829–1840.
[176] D. Banisar, S. Davies, Global trends in privacy protection: An international survey of privacy, data protection, and surveillance laws anddevelopments, J. Marshall J. Computer & Info. L. 18 (1999) 1.
[177] F. Hu, M. Qiu, J. Li, T. Grant, D. Taylor, S. Mccaleb, L. Butler, R. Hamner, A review on cloud computing: Design challenges in architectureand security, Journal of Computing & Information Technology 19 (2011) 25–55.
[178] Q. Yang, Y. Liu, T. Chen, Y. Tong, Federated machine learning: Concept and applications, ACM Transactions on Intelligent Systems andTechnology (TIST) 10 (2019) 1–19.
Shuang Dai et al.: Preprint submitted to Elsevier Page 34 of 34


