Embed Size (px)
Citation preview
GORDON K. MOEJOHN MERIDETH, CARLOS MENDEZ, WILLIAM J. MUELLER and
Electrical Excitability of Atrioventricular Nodal Cells
Print ISSN: 0009-7330. Online ISSN: 1524-4571 Copyright © 1968 American Heart Association, Inc. All rights reserved.
Avenue, Dallas, TX 75231is published by the American Heart Association, 7272 GreenvilleCirculation Research
doi: 10.1161/01.RES.23.1.691968;23:69-85Circ Res.
http://circres.ahajournals.org//subscriptions/
is online at: Circulation Research Information about subscribing to Subscriptions:
http://www.lww.com/reprints Information about reprints can be found online at: Reprints:
document. Permissions and Rights Question and Answer
page under Services. Further information about this process is available in therequested is located, click Request Permissions in the middle column of the Web Once the online version of the published article for which permission is beingRightsLink, a service of the Copyright Clearance Center, not the Editorial Office.
can be obtained viaCirculation Researcharticles originally published in Requests for permissions to reproduce figures, tables, or portions ofPermissions:
by guest on July 18, 2014http://circres.ahajournals.org/Downloaded from by guest on July 18, 2014http://circres.ahajournals.org/Downloaded from
http://circres.ahajournals.org/content/23/1/69services, is located on the World Wide Web at:
The online version of this article, along with updated information and
http://circres.ahajournals.org//subscriptions/
is online at: Circulation Research Information about subscribing to Subscriptions:
http://www.lww.com/reprints Information about reprints can be found online at: Reprints:
document. Permissions and Rights Question and Answer
page under Services. Further information about this process is available in therequested is located, click Request Permissions in the middle column of the Web Once the online version of the published article for which permission is beingRightsLink, a service of the Copyright Clearance Center, not the Editorial Office.
can be obtained viaCirculation Researcharticles originally published in Requests for permissions to reproduce figures, tables, or portions ofPermissions:
by guest on July 18, 2014http://circres.ahajournals.org/Downloaded from by guest on July 18, 2014http://circres.ahajournals.org/Downloaded from
Electrical Excitability of AtrioventricularNodal CellsBy John Merideth, M.D., Carlos Mendez, M.D.,
William J. Mueller, B.S.E.E., and Gordon K. Moe, M.D., Ph.D.
ABSTRACTThe electrical threshold of A-V nodal cells of isolated rabbit heart prepara-
tions was estimated by techniques which permitted stimulation and recordingthrough the same micropipette. Cells within the node were significantly lessexcitable than adjacent atrial and ventricular tissues; thresholds exceeded5 X 10~~° amp in some instances. Recovery of excitability was delayed wellbeyond repolarization; in cells of the midnodal region, "diastolic" thresholdwas not attained until 0.2 to 0.5 seconds after restoration of resting membranepotential. A cumulative effect of frequency upon excitability (fatigue) wasdemonstrated. At high driving rates, the lag in recovery was further delayed,and the late diastolic threshold was increased. Responses to single-cell stimula-tion indicate that summation may be an important feature of propagationwithin the node.
ADDITIONAL KEY WORDSfatigue of A-V transmission
atrioventricular conductionsummation in A-V node
• In muscle cells and in the specializedconducting tissues of atria and ventricles,electrical excitability is fully restored at themoment of complete repolarization (1). Inthe His-Purkinje system, and in the special-ized conducting tissue of Bachmann's in-teratrial band, a brief period of supernormalexcitability is demonstrable just prior to therestoration of the resting membrane poten-tial (2, 3). In the A-V node, on the otherhand, a number of observations suggest thatthe tissue remains relatively refractory for asignificant period of time after the termina-tion of the action potential (1). For example,the functional refractory period of the A-Vtransmission system, defined as the minimalattainable interval between two ventricularresponses, both propagated from the atrium,usually exceeds the action potential duration
From the Masonic Medical Research Laboratory,Utica, New York 13501.
This work was supported in part by a grant fromthe American Heart Association. Mr. Mueller was arecipient of U. S. Public Health Service GrantGM11413 from the National Institutes of Health.
Dr. Merideth was a U. S. Public Health ServicePostdoctoral Fellow during 1966-1967.
Accepted for publication April 19, 1968.
of any intranodal cell. Furthermore, theconduction time of a premature response fromatrium to ventricle may still be prolongedlong after the expiration of the A-V functionalrefractory period (4).
Frequency-dependent changes in A-V con-ductivity also support the hypothesis thatexcitability lags behind repolarization. TheP-R interval increases with the driving fre-quency (except, of course, for adrenergicallymediated rate changes), although the func-tional refractory period of the transmissionsystem diminishes. Furthermore, the effect offrequency on conductivity is cumulative.When the atrial driving frequency is abruptlyincreased, several or many beats may occurbefore the conduction time stabilizes at ahigher value. This observation suggests thatthe lag in the recovery of conductivity innodal cells is subjected to a further delay bya kind of fatigue (5, 6).
We may assume that conduction velocitywithin the node, as in any excitable tissue, isa function of the "margin of safety," andthat the latter is determined by the stimulat-ing efficacy of the action potential and bythe excitability of the tissue. Delay in the
Ruurcb, Vol. XXIII, Julj 1968 19
by guest on July 18, 2014http://circres.ahajournals.org/Downloaded from
70 MERIDETH, MENDEZ, MUELLER, MOE
A-V propagation of premature responsescould therefore represent incomplete recoveryeither of excitability, or of the amplitude orupstroke velocity of the action potential, orboth. The present study was undertaken todetermine whether the excitability of nodalcells could be directly assessed by intra-cellular stimuli, whether the recovery ofexcitability is in fact delayed beyond fullrepolarization, and whether the frequency-dependent depression of nodal conductivitycan be related to cumulative effects uponexcitability.
MethodsIN-VITRO STUDIES
Hearts were rapidly removed from rabbitsstunned by a blow on the head. Trimmed prep-arations of the excised tissue, with ample exposureof the A-V node (7) , were pinned in a paraffinbed and perfused with oxygenated Tyrode'ssolution at a temperature between 37° and38°C. The calcium concentration of the per-fusion medium was reduced to 1.8 mM/liter, toreduce the contractility of the preparation (8) .The sinus node was excised, and the preparationwas driven with bipolar silver electrodes on thecrista terminalis or on the bundle of His. Thedriving pulses were of 2-msec duration, providedby a Tektronix pulse generator, triggered atapproximate intervals by counting from a 100-kc
crystal oscillator (9) , and passed to the prepara-tion through an isolation transformer.
Microelectrodes were drawn from Pyrexcapillary glass and filled with either 3 M KC1 or2 M K citrate. Microelectrode resistance valuesranged from 4 to 20 megohms. Action potentialswere recorded through a negative capacitanceamplifier.1 Extracellular electrograms were re-corded from bipolar, silver electrodes on thecrista terminalis close to the ostium of thecoronary sinus, and in some experiments fromthe His bundle. The recordings were displayedon a Tektronix 565 oscilloscope and photographedwith a Grass camera.
The terminology used to define intranodalrecording sites is that applied to the subdivisionsof the A-V node by Paes de Carvalho and deAlmeida (10). We have used the term AN forcells which are anatomically and temporally closeto atrial tissue, in an area in which dissociationcommonly occurs (11). Cells referred to as Nwere classified not only by their temporal andspatial location and the configuration of theiraction potentials, but also on the basis of function.Cells which fired after the first 20* but beforethe final 20% of the total transnodal conductiontime were classified as N; block of prematureatrial responses could be readily demonstratedwithin this region, but not below it. Cells whichfired during the final 20$ of the normogradeconduction interval, in which action potentialsbegan to approach the configuration of His
iDesigned and constructed by William J. Mueller.
10 K 30K
100 K
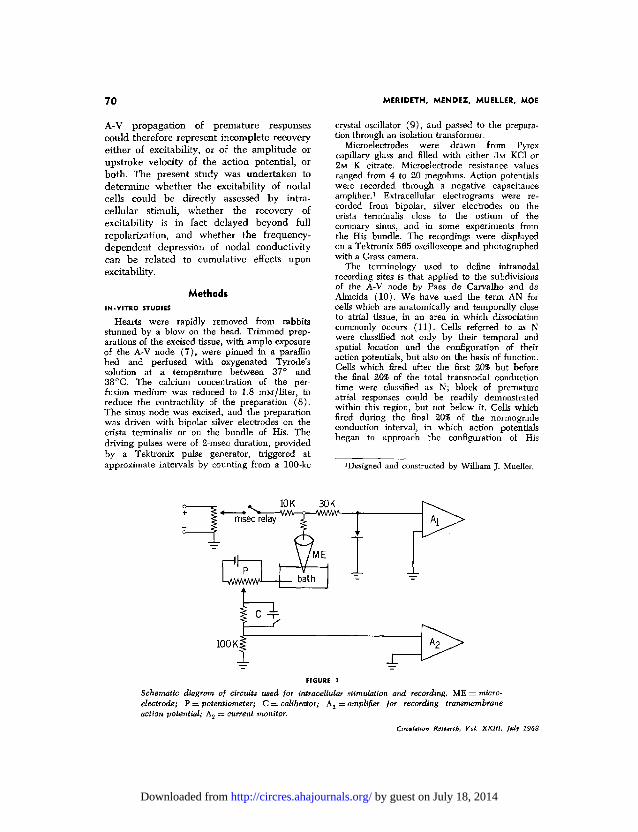
FIGURE I
Schematic diagram of circuits used for intraceUular stimulation and recording. ME = micro-electrode; P = potentiometer; C = calibrator; A2 = amplifier for recording transmembraneaction potential; Aj = current monitor.
CtrcuUtton Rssurcb, Vol. XXlll, July 1968
by guest on July 18, 2014http://circres.ahajournals.org/Downloaded from

ELECTRICAL EXCITABILITY OF A-V NODAL CELLS
bundle fibers, and in which transmission ap-peared to be obligatory were classified as NH.
The technique used for stimulating and re-cording through the same microelectrode is shownin Figure 1. The current source at the upper leftwas triggered at the desired interval to providea positive pulse which, applied within the cell,was a depolarizing stimulus. The millisecondrelay closed that portion of the circuit only forthe duration of the pulse. The amplificationcircuitry (Aj), protected by the diode shunt toground during the passage of stimulating pulses,recovered quickly enough to record the presenceor absence of an active response (see Figure3, A and B). In later experiments, the milli-second relay and diode were replaced by afield-effect transistor electronic switch which,when open, offered nearly infinite impedance inparallel with the microelectrode, and thus lessattenuation of recorded action potentials thanwhen the lower impedance diode was utilized.In Figure 1, the potentiometer (P) permittedbucking to zero potential. The calibrator (C)provided 100 mv calibration signals. The pulsecurrent strength monitor (A2) measured the po-tential drop across the 100-kilohm resistor. The30-kilohm resistor served as a load resistor forthe current source when the diode was in theconducting state and thus offered negligible re-sistance.
External stimulation of selected areas was ac-complished by passing cathodal pulses througha monopolar silver-silver chloride electrode witha tip diameter of 100 fi. Responses were moni-tored by recording an atrial electrogram fromthe crista terminalis, an electrogram or trans-membrane action potential from the His bundle,and a transmembrane action potential immediate-ly adjacent to the tip of the stimulating electrode,usually within 100 jx-
Strength-duration curves for both intracellularand external stimulation, constructed with pulsedurations from 0.5 to 40 msec, were essentiallyflat beyond 4 msec. Accordingly, strength-inter-val curves were obtained with pulses of 4, 5, or8 msec.
In the studies of frequency-dependent changes,the preparations were atropinized to preventpossible cholinergic effects of driving stimuli(12). Atropine sulfate was injected into the bathto achieve a concentration of 7 ju,g/ml, afterwhich perfusion was stopped for 5 minutes. Testdoses of acetylcholine in some experimentsdemonstrated that the tissue remained atropin-ized throughout the period of observation.1N-VIVO STUDIES
Cumulative effects of frequency on A-V con-duction were studied in six mongrel dogsranging in weight from 12 to 16.7 kg, anes-dtculation Research, Vol. XXlll, July 1968
thetized by sodium pentobarbital, 35 mg/kg iv.Under artificial respiration, the chest was openedin the midline, and the pericardium was openedwidely to expose the anterior surface of theheart. Extirpation of the stellate and upperthoracic sympathetic ganglia was carried out onboth sides, and the vagi were cut to reducereflex influences. The sinus node was clamped,and the preparation was driven through bipolarelectrodes on the surface of the right atrium.A combination of Tektronix waveform and pulsegenerators vvas arranged to provide pulses atvarying intervals, and these pulses were trans-mitted to the driving electrode through anisolation transformer. Bipolar electrodes wereplaced on the surface of the right atrium andright ventricle for recording atrial and ventricularelectrograms.
ResultsEXCITABILITY OF SINGLE CELLS
In preliminary studies, the electricalthresholds of excitability of single units inatrium, His bundle, peripheral Purkinje fi-bers, and ventricular myocardium weredetermined to serve as a basis of comparisonfor excitability measurements in intranodalcells. In all such experiments, the lowestthresholds were found in the specializedconducting tissue of the ventricle, and sig-nificantly higher values were found in myo-cardial cells of atrium and ventricle. Muchhigher thresholds were encountered as im-palements were made progressively closerto the midnodal region, and cells at thetemporal midpoint (in the "N" region) were
D DIASTOLIC
• AT FULL REPOLARIZATION1.2
1,0
01
0.4
0.2
2 |ATRIUM AN NHH1GH NH-LOW HIS PURKINJE VENTRICLE
FIGURE 2
Representative threshold values determined by intra-cellular stimulation.
by guest on July 18, 2014http://circres.ahajournals.org/Downloaded from
72 MERIDETH, MENDEZ, MUELLER, MOE
often not excited by the maximum currentpulses available through the stimulating net-work (3 to 5 /xamp).
Representative thresholds taken from anumber of experiments are shown in Figure2. These are plotted, not as statisticallysignificant means, but merely to give someidea of the order of magnitude of thedifferences observed. The open bars representthresholds determined with intracellularcurrent pulses delivered late in diastole, at atime when the strength-interval curve wasnearly flat. The shaded bars indicate thresh-olds determined at the termination of theprevious action potential; i.e., at the momentof full repolarization.
In atrial and ventricular myocardium, theexcitability was fully restored as soon as theresting membrane potential had beenreached, and no further change was apparentas the test pulse was delivered later indiastole. In peripheral Purkinje fibers, andoccasionally in cells of the His bundle, thecells were "supernormally" excitable just pre-ceding full repolarization. Intranodal cells,
on the other hand, were never fully excitableimmediately after repolarization, but re-covered slowly, sometimes for several hun-dred milliseconds, before the late diastolicthreshold was reached. This lag in therecovery of excitability appeared to begreater in magnitude and duration as the Nregion of the node was approached.
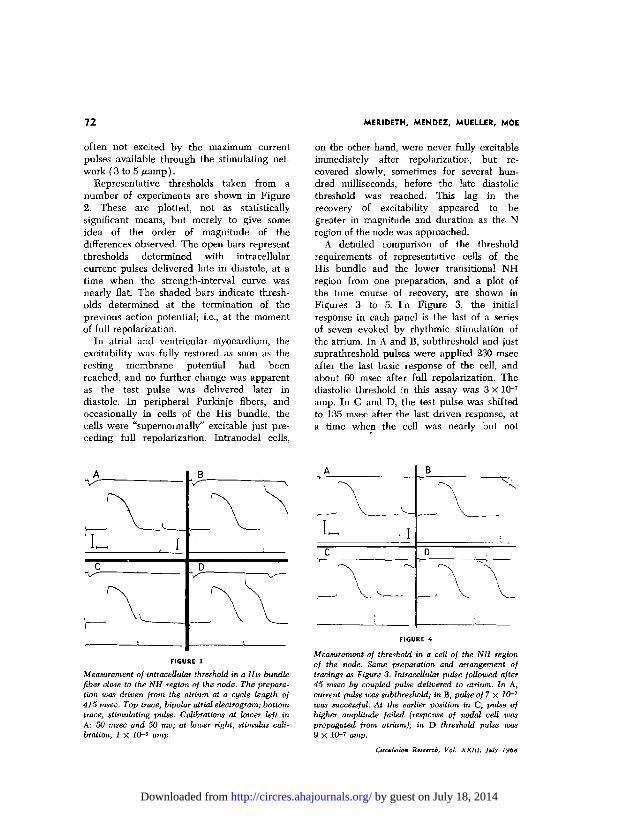
A detailed comparison of the thresholdrequirements of representative cells of theHis bundle and the lower transitional NHregion from one preparation, and a plot ofthe time course of recovery, are shown inFigures 3 to 5. I n Figure 3, the initialresponse in each panel is the last of a seriesof seven evoked by rhythmic stimulation ofthe atrium. In A and B, subthreshold and justsuprathreshold pulses were applied 230 msecafter the last basic response of the cell, andabout 60 msec after full repolarization. Thediastolic threshold in this assay was 3 X 10~7
amp. In C and D, the test pulse was shiftedto 135 msec after the last driven response, ata time when the cell was nearly but not
A
c
V
V
I
B'v
D
Measurement of intraceUular threshold in a His bundlefiber close to the NH region of the node. The prepara-tion was driven from the atrium at a cycle length of415 msec. Top trace, bipolar atrial electrogram; bottomtrace, stimulating, pulse. Calibrations at lower left inA: 50 msec and 50 mv; at lower right, stimulus cali-bration, 1 X 10-Q amp.
A
\
\_
I -C
• I
'—.
B
\
D
Measurement of threshold in a cell of the NH regionof the node. Same preparation and arrangement oftracings as Figure 3. IntraceUular pulse followed after45 msec by coupled pulse delivered to atrium. In A,current pulse was subthreshold; in B, pulse of 7 X 10~7
was successful. At the earlier position in C, pulse ofhigher amplitude failed (response of nodal cell waspropagated from atrium); in D threshold pulse was9 X 10-7 amp.
Circuit/ion Research, Vol. XXIU, July 1968
by guest on July 18, 2014http://circres.ahajournals.org/Downloaded from
ELECTRICAL EXCITABILITY OF A-V NODAL CELLS 73
2J0
2 1.5X
^ ID
05
1 WO MSEC '
100 200 300
TIME - MSEC
PULSE DURATION - 4 MSEC
100 MO 300
TIME - MSEC
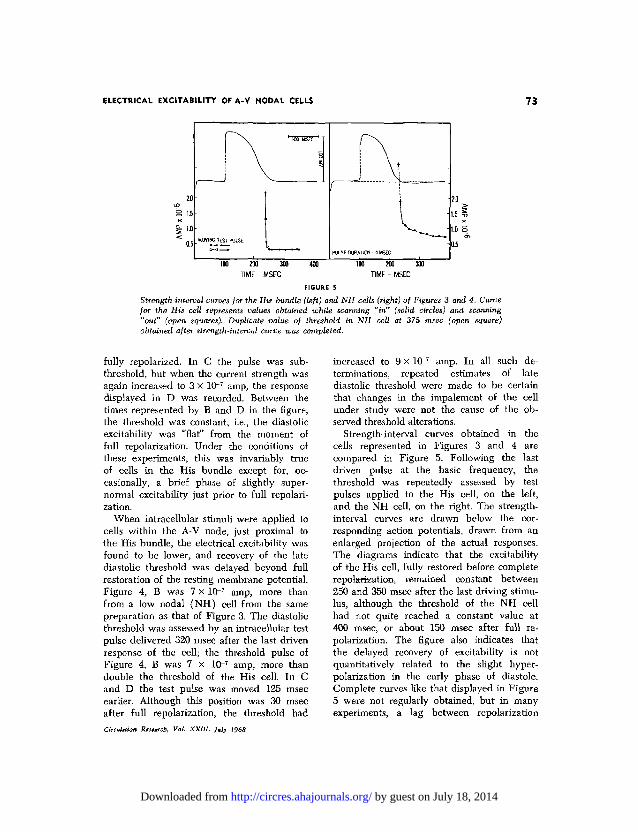
FIGURE 5
Strength-interval curves for the His bundle (left) and NH cells (right) of Figures 3 and 4. Curvefor the His cell represents values obtained while scanning, "in" (solid circles) and scanning"out" (open squares). Duplicate value of threshold in NH cell at 375 msec (open square)obtained after strength-interval curve was completed.
fully repolarized. In C the pulse was sub-threshold, but when the current strength wasagain increased to 3 x Kh7 amp, the responsedisplayed in D was recorded. Between thetimes represented by B and D in the figure,the threshold was constant; i.e., the diastolicexcitability was "flat" from the moment offull repolarization. Under the conditions ofthese experiments, this was invariably trueof cells in the His bundle except for, oc-casionally, a brief phase of slightly super-normal excitability just prior to full repolari-zation.
When intracellular stimuli were applied tocells within the A-V node, just proximal tothe His bundle, the electrical excitability wasfound to be lower, and recovery of the latediastolic threshold was delayed beyond fullrestoration of the resting membrane potential.Figure 4, B was 7 X 10~7 amp, more thanfrom a low nodal (NH) cell from the samepreparation as that of Figure 3. The diastolicthreshold was assessed by an intracellular testpulse delivered 320 msec after the last drivenresponse of the cell; the threshold pulse ofFigure 4, B was 7 X 10"7 amp, more thandouble the threshold of the His cell. In Cand D the test pulse was moved 125 msecearlier. Although this position was 30 msecafter full repolarization, the threshold had
Riiurcb, Vol. XXIII, July 1968
increased to 9 X 10~T amp. In all such de-terminations, repeated estimates of latediastolic threshold were made to be certainthat changes in the impalement of the cellunder study were not the cause of the ob-served threshold alterations.
Strength-interval curves obtained in thecells represented in Figures 3 and 4 arecompared in Figure 5. Following the lastdriven pulse at the basic frequency, thethreshold was repeatedly assessed by testpulses applied to the His cell, on the left,and the NH cell, on the right. The strength-interval curves are drawn below the cor-responding action potentials, drawn from anenlarged projection of the actual responses.The diagrams indicate that the excitabilityof the His cell, fully restored before completerepolarizatien, remained constant between250 and 350 msec after the last driving stimu-lus, although the threshold of the NH cellhad not quite reached a constant value at400 msec, or about 150 msec after full re-polarization. The figure also indicates thatthe delayed recovery of excitability is notquantitatively related to the slight hyper-polarization in the early phase of diastole.Complete curves like that displayed in Figure5 were not regularly obtained, but in manyexperiments, a lag between repolarization
by guest on July 18, 2014http://circres.ahajournals.org/Downloaded from
74 MERIDETH, MENDEZ, MUELLER, MOE
and recovery of full excitability was demon-strated by showing that a current pulsewhich was suprathreshold in late diastolefailed to excite the impaled cell when theinterval between driving and test pulses wasdiminished. Observations of this type wereconsidered valid only when the late pulsewas again shown to be effective.
Estimates of the excitability of NH cellswere relatively easy to obtain, but cells inthe AN and N regions of the node weredifficult to hold long enough for precisemeasurements. Threshold currents were con-siderably higher than in other cardiac tissues,so much so that in some of the earlier experi-ments, mechanical displacement of the micro-electrode regularly accompanied the injectionof current pulses approaching the presumedthreshold.
A
AJr~
c ,
B
AD
V
, E
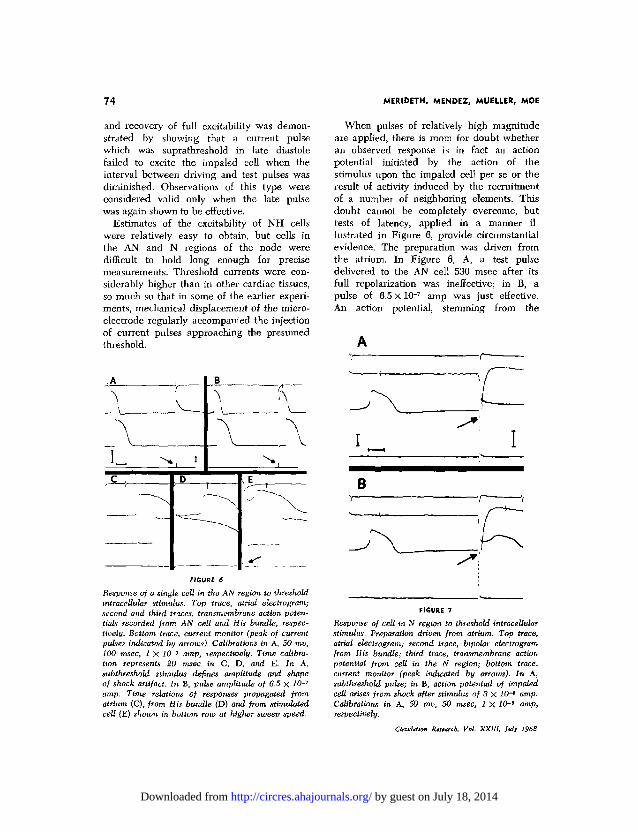
When pulses of relatively high magnitudeare applied, there is room for doubt whetheran observed response is in fact an actionpotential initiated by the action of thestimulus upon the impaled cell per se or theresult of activity induced by the recruitmentof a number of neighboring elements. Thisdoubt cannot be completely overcome, buttests of latency, applied in a manner il-lustrated in Figure 6, provide circumstantialevidence. The preparation was driven fromthe atrium. In Figure 6, A, a test pulsedelivered to the AN cell 530 msec after itsfull repolarization was ineffective; in B, apulse of 6.5 X 10~T amp was just effective.An action potential, stemming from the
Response of a single cell in the AN region to thresholdintraceUular stimulus. Top trace, atrial electrogram;second and third traces, transmembrane action poten-tials recorded from AN cell and His bundle, respec-tively. Bottom trace, current monitor (peak of currentpulses indicated by arrows). Calibrations in A, SO mv,100 msec, 1 X 10~° amp, respectively. Time calibra-tion represents 20 msec in C, D, and E. In A,subthreshold stimulus defines amplitude and shapeof shock artifact. In B, pxdse amplitude of 6.5 x I0~7
amp. Time relations of responses propagated fromatrium (C), from His bundle (D) and from stimulatedcell (E) shown in bottom row at higher sweep speed.
FIGURE 7
Response of cell in N region to threshold intraceUularstimtdits. Preparation driven from atrium. Top trace,atrial electrogram; second trace, bipolar electrogramfrom His bundle; third trace, transmembrane actionpotential from, cell in the N region; bottom trace,current monitor (peak indicated by arrows). In A,subthreshold pulse; in B, action potential of impaledcell arises from shock after stimulus of 3 X 10-* amp.Calibrations in A, 50 mv, 50 msec, 1 X 10-' amp,respectively.
Circulation Ristarcb, Vol. XXIII, July 1968
by guest on July 18, 2014http://circres.ahajournals.org/Downloaded from

ELECTRICAL EXCITABILITY OF A-V NODAL CELLS 75
shock artifact, yielded a response which waspropagated to the atrium and to the Hisbundle.
If the test response shown in Figure 6, B,originated in cells adjacent to the impaledcell or, by intracellular current flow, in cellsat some distance from it, then the latencyof the response propagated in both directionsfrom the impaled cell should be less than thecorresponding AN-H and AN-A intervals forresponses propagated through the node fromatrium and from His bundle, respectively. Acomparison of these propagation intervals isshown at higher sweep speed in C, D, andE. C indicates the conduction intervals forantegrade conduction, D the correspondingvalues for retrograde conduction of a re-sponse initiated in the bundle of His belowthe recording microelectrode. In E, the in-tervals resulting from application of the in-tracellular stimulus are shown on the sametime scale. Although it is difficult to pinpointthe moment at which the active response inthe AN cell begins, the conduction times tothe atrium and to the His bundle are clearlylonger than those for the same distances inC and D. The results imply that a responseinitiated in a single nodal cell, or in a re-stricted cluster of cells, propagates appre-ciably more slowly than a broad wave front
initiated by activation from the atrium orfrom the His bundle. In other words, spatialsummation appears to be a significant featureof intranodal conduction.
Intracellular stimulation of the N cells inthe middle of the A-V node of the rabbitwas exceedingly difficult. The impalementswere hard to maintain for sufficient periodsof time, and in many experiments currentpulses of 2 X 10"° amp and higher failed toelicit responses. However, it was possible insome experiments to stimulate cells clearlyidentifiable by their temporal and electricalcharacteristics as N cells, as distinguishedfrom AN or NH cells. When N cells couldbe stimulated, the thresholds were high-er than those of NH or AN cells in the samepreparations.
The response of an N cell to injection ofa threshold current pulse is shown in Figure7. In A, a large shock artifact accompaniesinjection of a subthreshold current pulse ata test interval of 400 msec. In B the currentwas increased to 3 x 10"° amp, and a re-sponse of the impaled cell appears. Propaga-tion times to the atrium and the His bundlewere 125 and 80 msec, considerably longerthan the corresponding intervals for prop-agation of the basic response at the left.
Cells low in the N region were sometimes
A
\
B C
~ —
t
Responses of an unusually excitable cell low in the N region. Arrangement of tracings as inFigure 6; N cell action potential in second trace from top. In A, threshold pulse is 6.8 X 10~7
amp. Time relations of responses propagated from atrium, His bundle, and from the stimulatedN cell shown at high sweep speed in B, C, and D. Current calibration in A, 1 X 10-* amp;time calibration in D, 100 msec for A, 20 for B, C, and D. Voltage calibration, 50 mv. Basiccycle length, 650 msec. In B conduction time from N cell to His bundle, 12 msec; in C,N cell to atrium, SO msec. In D conduction intervals, measured from beginning of stimuluswere 65 and 19.5 msec to atrium and His bundle, respectively; measured from end of stimulusartifact, corresponding intervals were 59 and 13.5 msec.
Rtiurcb, Vol. XXIII, July 1968
by guest on July 18, 2014http://circres.ahajournals.org/Downloaded from
7 6 MERIDETH, MENDEZ, MUELLER, MOE
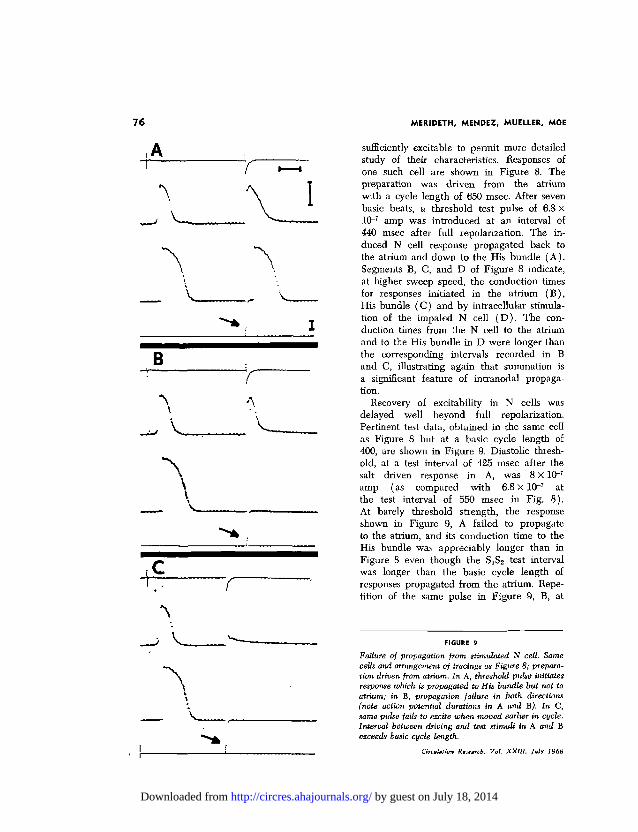
sufficiently excitable to permit more detailedstudy of their characteristics. Responses ofone such cell are shown in Figure 8. Thepreparat ion was dr iven from the atr iumwith a cycle length of 650 msec. After seven
• basic beats, a threshold test pulse of 6.8 x~̂— ^ * . - . . 10~7 amp was introduced at an interval of
440 msec after full repolarization. The in-duced N cell response propagated back tothe atrium and down to the His bund le ( A ) .Segments B, C, and D of F igure 8 indicate,at higher sweep speed, the conduction timesfor responses initiated in the a t r ium ( B ) ,His bundle ( C ) and by intracellular stimula-tion of the impaled N cell ( D ) . The con-duction times from the N cell to the atriumand to the His bund le in D were longer than
" \
r% the corresponding intervals recorded in Band C, illustrating again tha t summation is
I a significant feature of intranodal propaga-tion.
A A Recovery of excitability in N cells was'. delayed well beyond full repolarization.
\ \ ^ Pertinent test data , obtained in the same cellas Figure 8 bu t at a basic cycle length of400, are shown in F igure 9. Diastolic thresh-
* * \ old, at a test interval of 425 msec after the\ salt driven response in A, was 8 X10~ 7
\ amp (as compared wi th 6.8 X 10~7 at\ the test interval of 550 msec in Fig. 8 ) .
— V . i j \ t barely threshold strength, the responseshown in Figure 9, A failed to propagate
^^ . to the atrium, and its conduction time to the~^^^^^~~^^^^^^~~~~ His bundle was appreciably longer than in
C Figure 8 even though the SXS2 test interval
^ ^ ^ ^ ^ _ _ _ ^ was lODger than the basic cycle length ofI responses propagated from the atrium. Repe-
tition of the same pulse in Figure 9, B, at
Failure of propagation from stimulated N ceU. Samecells and arrangement of tracings as Figure 8; prepara-tion driven from atrium. In A, threshold pulse initiatesresponse which is propagated to His bundle but not toatrium; in B, propagation failure in both directions(note action potential durations in A and B). In C,same pulse fails to excite when moved earlier in cycle.Interval between driving and test stimuli in A and Bexceeds basic cycle length.
Circulation Rtsurcb, Vol. XX1U, ]ulj I±)68
by guest on July 18, 2014http://circres.ahajournals.org/Downloaded from
ELECTRICAL EXCITABILITY OF A-V NODAL CELLS 77
B
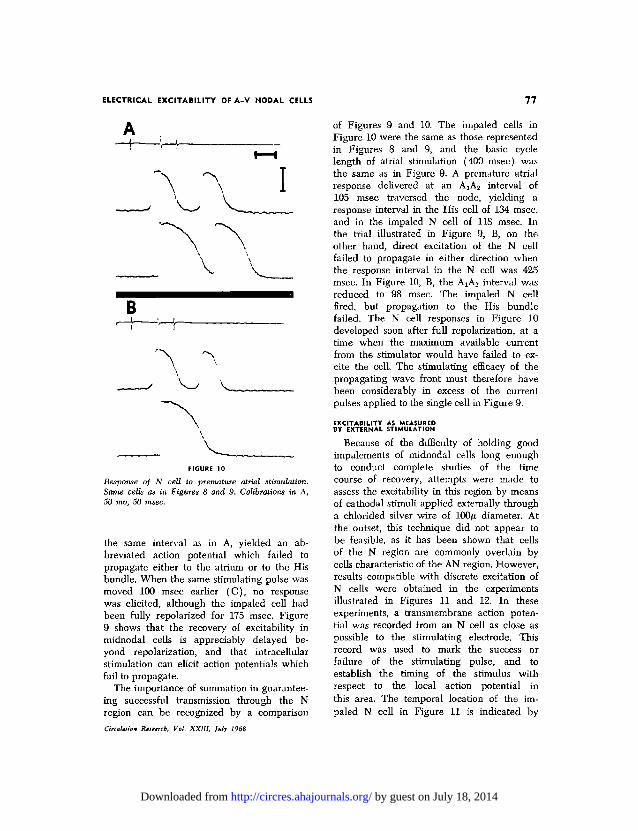
Response of N cell to premature atrial stimulation.Same cells as in Figures 8 and 9. Calibrations in A,50 mo, 50 msec.
the same interval as in A, yielded an ab-breviated action potential which failed topropagate either to the atrium or to the Hisbundle. When the same stimulating pulse wasmoved 100 msec earlier (C), no responsewas elicited, although the impaled cell hadbeen fully repolarized for 175 msec. Figure9 shows that the recovery of excitability inmidnodal cells is appreciably delayed be-yond repolarization, and that intracellularstimulation can elicit action potentials whichfail to propagate.
The importance of summation in guarantee-ing successful transmission through the Nregion can be recognized by a comparison
CircuUsio* Risetrcb, Vol. XX1I1, luij 1968
of Figures 9 and 10. The impaled cells inFigure 10 were the same as those representedin Figures 8 and 9, and the basic cyclelength of atrial stimulation (400 msec) wasthe same as in Figure 9. A premature atrialresponse delivered at an AxA2 interval of105 msec traversed the node, yielding aresponse interval in the His cell of 134 msec,and in the impaled N cell of 118 msec. Inthe trial illustrated in Figure 9, B, on theother hand, direct excitation of the N cellfailed to propagate in either direction whenthe response interval in the N cell was 425msec. In Figure 10, B, the AjA2 interval wasreduced to 98 msec. The impaled N cellfired, but propagation to the His bundlefailed. The N cell responses in Figure 10developed soon after full repolarization, at atime when the maximum available currentfrom the stimulator would have failed to ex-cite the cell. The stimulating efficacy of thepropagating wave front must therefore havebeen considerably in excess of the currentpulses applied to the single cell in Figure 9.
EXCITABILITY AS MEASUREDBY EXTERNAL STIMULATION
Because of the difficulty of holding goodimpalements of midnodal cells long enoughto conduct complete studies of the timecourse of recovery, attempts were made toassess the excitability in this region by meansof cathodal stimuli applied externally througha chlorided silver wire of 100/x diameter. Atthe outset, this technique did not appear tobe feasible, as it has been shown that cellsof the N region are commonly overlain bycells characteristic of the AN region. However,results compatible with discrete excitation ofN cells were obtained in the experimentsillustrated in Figures 11 and 12. In theseexperiments, a transmembrane action poten-tial was recorded from an N cell as close aspossible to the stimulating electrode. Thisrecord was used to mark the success orfailure of the stimulating pulse, and toestablish the timing of the stimulus withrespect to the local action potential inthis area. The temporal location of the im-paled N cell in Figure 11 is indicated by
by guest on July 18, 2014http://circres.ahajournals.org/Downloaded from

78 MERIDETH, MENDEZ, MUELLER, MOE
A
D,
Bl
A>>\
•f\ ^
c
"\
E
\
- * I
s VExternal stimulation of N region. Upper trace, atrial electrogram; second trace, transmembraneaction potential of N cell close to stimulating electrode; third trace, His bundle; bottom trace,current monitor. Response to atrial drive in A, His-bundle drive in B. In C, external stimulusfails. In D, action potential in N cell arises from shock artifact; propagation back to atrium butnot to His bundle. In E, propagation succeeds in both directions with slightly stronger stimulus.Calibrations in A, 50 me (applies to N cell only), 100 msec; in C, 5 X ICM amp.
the responses in A, in which the preparationwas driven by an atrial stimulus, and in B,in which the stimulus was applied to the Hisbundle distal to the impaled unit. In C, a latediastolic stimulus of subthreshold strengthwas applied to the N region. The shock arti-fact was large in the bipolar atrial record,but reasonably small in the transmembranerecordings. In D, the stimulus strength wasjust suprathreshold (3 X 1(H amp). An activeresponse is apparent in the adjacent N cell,and propagation back to the atrium occurredwith a conduction interval of 78 msec, ap-proximately the same as the retrograde con-duction time shown in B. Propagation to theHis bundle did not occur.
When the stimulus amplitude was slightlyincreased, propagation to the His bundle alsooccurred, with an interval of 26 msec, com-parable to that observed in A. Because theconduction intervals were not significantlydifferent from those for responses propagatedfrom the atrium or from the His bundle, it
700 1100100 300 500TIME-msecFIGURE 12
Strength-interval curve obtained by external stimula-tion in N region. Arrangement of tracings as in Figure5. Tracing of N cell action potential above; thresholdcurrent curve below Time and voltage calibrations,100 msec, 50 mv. Repeat estimate of diastolic thresh-old (at time 650 msec) indicated by open circle.
CircuUtion Rnvacb, Vol. XXIII, Mr 1968
by guest on July 18, 2014http://circres.ahajournals.org/Downloaded from
ELECTRICAL EXCITABILITY OF A-V NODAL CELLS 79
is apparent that: (1) a wave front of sub-stantial breadth was generated by the stimu-lus (i.e., excitation was more or less simul-taneously achieved in a cluster of cells), and(2) the stimulus did not "spread" to cellsin the AN or NH regions, in which case theantegrade and retrograde conduction intervalsshould have been appreciably less than thoserecorded.
In experiments of this type, a substantialincrement in the stimulus amplitude oftenresulted in an abrupt abbreviation of ante-grade or retrograde conduction times or both,clearly the result of recruitment of fibers muchcloser to the His bundle and atrium. This re-sult on occasion precluded the construction ofa strength-interval recovery curve, for as thestimulus strength was increased to assess earlydiastolic excitability, more excitable cellsremote from the stimulated site were fired. Acomplete curve in an experiment in which
this artifact did not occur is illustrated inFigure 12. The late diastolic threshold, at1100 msec, was estimated at .14 X 10"3 amp.As the test pulse interval was diminished,threshold values increased progressively to avalue of 0.78 at 105 msec. To check forpossible polarization of the stimulating elec-trode, the threshold at 655 msec was re-assessed. Although the effective stimulus am-plitude was now increased over the initialvalue (open circle), the broken line drawnat this level intersects the strength-intervalcurve at about 450 msec, indicating thatexcitability recovery lagged at least 300 msecbeyond full repolarization at the stimulatedsite.
FREQUENCY-DEPENDENCE OF A-V CONDUCTIVITY
In the absence of changes induced by auto-nomic nerve stimulation or other agencieswhich alter the specific conductivity of A-V
mses gsrCycle ngth - msec
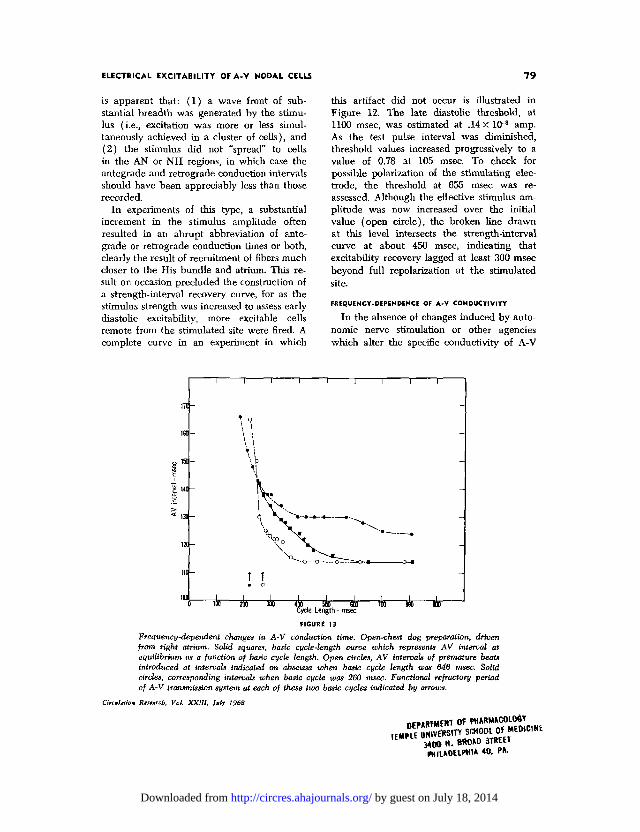
FIGURE 13Frequency-dependent changes in A-V conduction time. Open-chest dog preparation, drivenfrom right atrium. Solid squares, basic cycle-length curve which represents AV interval atequilibrium as a function of basic cycle length. Open circles, AV intervals of premature beatsintroduced at intervals indicated on abscissa when basic cycle length was 646 msec. Solidcircles, corresponding intervals when basic cycle was 260 msec. Functional refractory periodof A-V transmission system at each of these two basic cycles indicated by arrows.
• R t i u rcb, Vol. XX1U, ]*h 1968
OF PHMS S " SCHOOL Of W«C.«MM H. BftOM) 3IKH
by guest on July 18, 2014http://circres.ahajournals.org/Downloaded from
80 MERIDETH, MENDEZ, MUELLER, MOE
B
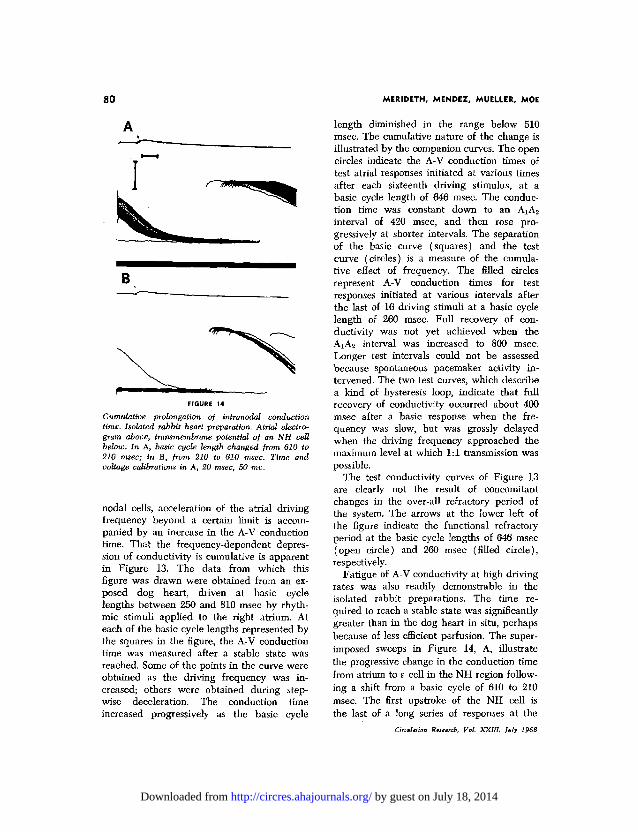
Cumulative prolongation of intranodal conductiontime. Isolated rabbit heart preparation. Atrial electro-gram above, transmembrane potential of an NH cellbelow. In A, basic cycle length changed from 610 to210 msec; in B, from 210 to 610 msec. Time andvoltage calibrations in A, 20 msec, 50 mv.
nodal cells, acceleration of the atrial drivingfrequency beyond a certain limit is accom-panied by an increase in the A-V conductiontime. That the frequency-dependent depres-sion of conductivity is cumulative is apparentin Figure 13. The data from which thisfigure was drawn were obtained from an ex-posed dog heart, driven at basic cyclelengths between 250 and 810 msec by rhyth-mic stimuli applied to the right atrium. Ateach of the basic cycle lengths represented bythe squares in the figure, the A-V conductiontime was measured after a stable state wasreached. Some of the points in the curve wereobtained as the driving frequency was in-creased; others were obtained during step-wise deceleration. The conduction timeincreased progressively as the basic cycle
length diminished in the range below 510msec. The cumulative nature of the change isillustrated by the companion curves. The opencircles indicate the A-V conduction times oftest atrial responses initiated at various timesafter each sixteenth driving stimulus, at abasic cycle length of 646 msec. The conduc-tion time was constant down to an AXA2
interval of 420 msec, and then rose pro-gressively at shorter intervals. The separationof the basic curve (squares) and the testcurve (circles) is a measure of the cumula-tive effect of frequency. The filled circlesrepresent A-V conduction times for testresponses initiated at various intervals afterthe last of 16 driving stimuli at a basic cyclelength of 260 msec. Full recovery of con-ductivity was not yet achieved when theAiA2 interval was increased to 800 msec.Longer test intervals could not be assessedbecause spontaneous pacemaker activity in-tervened. The two test curves, which describea kind of hysteresis loop, indicate that fullrecovery of conductivity occurred about 400msec after a basic response when the fre-quency was slow, but was grossly delayedwhen the driving frequency approached themaximum level at which 1:1 transmission waspossible.
The test conductivity curves of Figure 13are clearly not the result of concomitantchanges in the over-all refractory period ofthe system. The arrows at the lower left ofthe figure indicate the functional refractoryperiod at the basic cycle lengths of 646 msec(open circle) and 260 msec (filled circle),respectively.
Fatigue of A-V conductivity at high drivingrates was also readily demonstrable in theisolated rabbit preparations. The time re-quired to reach a stable state was significantlygreater than in the dog heart in situ, perhapsbecause of less efficient perfusion. The super-imposed sweeps in Figure 14, A, illustratethe progressive change in the conduction timefrom atrium to a cell in the NH region follow-ing a shift from a basic cycle of 610 to 210msec. The first upstroke of the NH cell isthe last of a long series of responses at the
Circultim Rttearcb, Vol. XXIII, Jtly 1968
by guest on July 18, 2014http://circres.ahajournals.org/Downloaded from
ELECTRICAL EXCITABILITY OF A-V NODAL CELLS 81
A •—
"""i I
C A
—* .
B
\
\
preparation was driven by stimuli appliedto the His bundle at a basic cycle lengthof 700 msec in A, and 200 msec in B, C, andD. In parts A, B, and C, the SiS2 test intervalwas constant at 500 msec. The threshold atthis interval at the slow frequency was 4 X10~7 amp (A). Between A and B the drivingfrequency was increased. The record in Bindicates that the previously successful stimu-lus was now subthreshold, although theSiS2 interval was unchanged. The new thresh-old was found to be 5 X Kh7 amp (C), anincrease of 20%. In D, at the same basic cyclelength as C, the same current pulse was
Frequency-dependent change in "diastolic" threshold.Isolated rabbit heart preparation. Transmembranepotential of NH cell. Lower trace, test current pulseamplitude, retouched (calibration tn A, 5 X 10~7 amp).Time and voltage calibrations in A, 100 msec, 50 mo.
610-msec cycle length; the A-NH conductioninterval was stable at 80 msec. The pro-gressively later upstrokes were inscribed ateach eighth cycle following the abrupt ac-celeration of the driving frequency. Equilibri-um was reached, at a conduction interval of156 msec, after about 200 beats (nearly 40seconds). In B, the much quicker reverseadaptation is illustrated. The latest actionpotential is the last of a series at a cyclelength of 210 msec; progressively shorter con-duction times were recorded when the cyclelengdi was abruptly increased to 610, andequilibrium was eventually reached at theoriginal A-NH interval of 80 msec.
Cumulative depression of conductivitycould represent a shift to the right of thestrength-interval curve, or to an elevation ofthe diastolic threshold, or to frequency-de-pendent alterations in the action potential,alone or in combination. Studies of single-cellexcitability as a function of driving frequencywere undertaken to test whether depressionof conductivity is associated with changes inthe diastolic threshold.
In the preparation represented by Figure15, intracellular stimuli were applied to a cellin the NH region of the rabbit node. The
Risitrcb. Vol. XXlll, July 1968
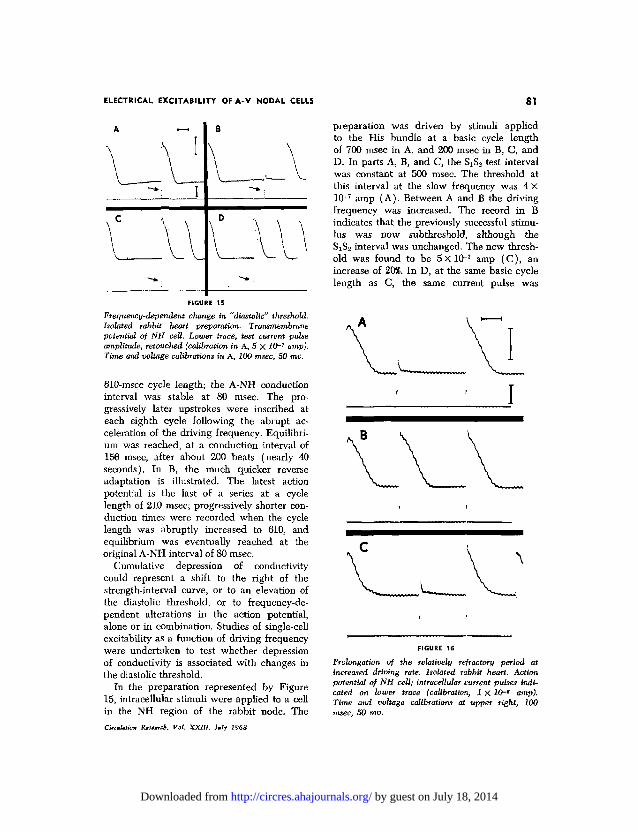
Prolongation of the relatively refractory period atincreased driving rate. Isolated rabbit heart. Actionpotential of NH cell; intracellular current pulses indi-cated on lower trace (calibration, 1 X 10~e amp).Time and voltage calibrations at upper right, 100msec, SO mv.
by guest on July 18, 2014http://circres.ahajournals.org/Downloaded from
MERIDETH, MENDEZ, MUELLER, MOE
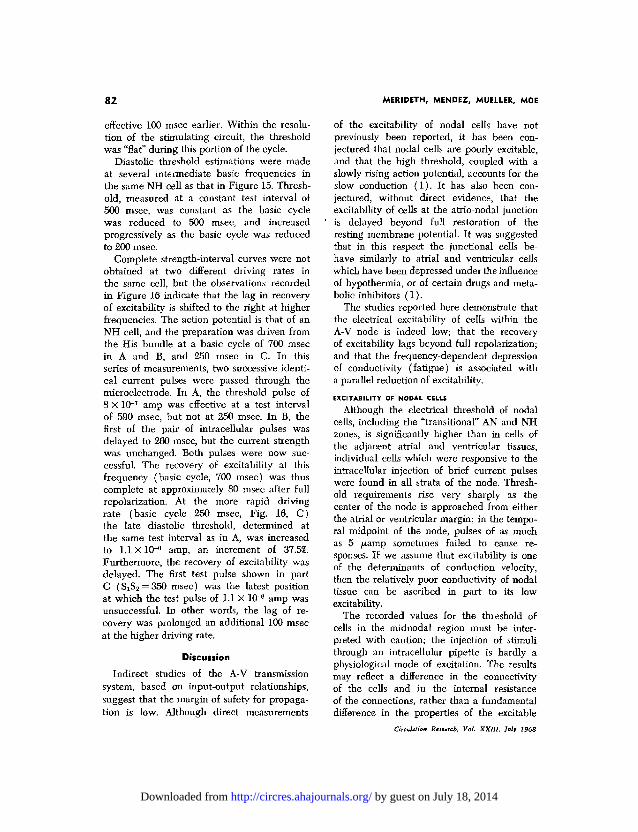
effective 100 msec earlier. Within the resolu-tion of the stimulating circuit, the thresholdwas "flat" during this portion of the cycle.
Diastolic threshold estimations were madeat several intermediate basic frequencies inthe same NH cell as that in Figure 15. Thresh-old, measured at a constant test interval of500 msec, was constant as the basic cyclewas reduced to 500 msec, and increasedprogressively as the basic cycle was reducedto 200 msec.
Complete strength-interval curves were notobtained at two different driving rates inthe same cell, but the observations recordedin Figure 16 indicate that the lag in recoveryof excitability is shifted to the right at higherfrequencies. The action potential is that of anNH cell, and the preparation was driven fromthe His bundle at a basic cycle of 700 msecin A and B, and 250 msec in C. In thisseries of measurements, two successive identi-cal current pulses were passed through themicroelectrode. In A, the threshold pulse of8 X 10~7 amp was effective at a test intervalof 590 msec, but not at 250 msec. In B, thefirst of the pair of intracellular pulses wasdelayed to 260 msec, but the current strengthwas unchanged. Both pulses were now suc-cessful. The recovery of excitability at thisfrequency (basic cycle, 700 msec) was thuscomplete at approximately 80 msec after fullrepolarization. At the more rapid drivingrate (basic cycle 250 msec, Fig. 16, C)the late diastolic threshold, determined atthe same test interval as in A, was increasedto 1.1 XlCh8 amp, an increment of 37.5%.Furthermore, the recovery of excitability wasdelayed. The first test pulse shown in partC (SiS2 = 350 msec) was the latest positionat which the test pulse of 1.1 X 10"° amp wasunsuccessful. In other words, the lag of re-covery was prolonged an additional 100 msecat the higher driving rate.
Discussion
Indirect studies of the A-V transmissionsystem, based on input-output relationships,suggest that the margin of safety for propaga-tion is low. Although direct measurements
of the excitability of nodal cells have notpreviously been reported, it has been con-jectured that nodal cells are poorly excitable,and that the high threshold, coupled with aslowly rising action potential, accounts for theslow conduction (1). It has also been con-jectured, without direct evidence, that theexcitability of cells at the atrio-nodal junctionis delayed beyond full restoration of theresting membrane potential. It was suggestedthat in this respect the junctional cells be-have similarly to atrial and ventricular cellswhich have been depressed under the influenceof hypothermia, or of certain drugs and meta-bolic inhibitors (1).
The studies reported here demonstrate thatthe electrical excitability of cells within theA-V node is indeed low; that the recoveryof excitability lags beyond full repolarization;and that the frequency-dependent depressionof conductivity (fatigue) is associated witha parallel reduction of excitability.
EXCITABILITY OF NODAL CELLS
Although the electrical threshold of nodalcells, including the "transitional" AN and NHzones, is significantly higher than in cells ofthe adjacent atrial and ventricular tissues,individual cells which were responsive to theintracellular injection of brief current pulseswere found in all strata of the node. Thresh-old requirements rise very sharply as thecenter of the node is approached from eitherthe atrial or ventricular margin; in the tempo-ral midpoint of the node, pulses of as muchas 5 fiamp sometimes failed to cause re-sponses. If we assume that excitability is oneof the determinants of conduction velocity,then the relatively poor conductivity of nodaltissue can be ascribed in part to its lowexcitability.
The recorded values for the threshold ofcells in the midnodal region must be inter-preted with caution; the injection of stimulithrough an intracellular pipette is hardly aphysiological mode of excitation. The resultsmay reflect a difference in the connectivityof the cells and in the internal resistanceof the connections, rather than a fundamentaldifference in the properties of the excitable
Circulation Rtjttrd, Vol. XXIII, July 1968
by guest on July 18, 2014http://circres.ahajournals.org/Downloaded from
ELECTRICAL EXCITABILITY OF A-V NODAL CELLS 83
membrane. If we can assume low resistanceconnections between cells in a 3-dimensionalsyncytium (13), then a depolarizing currentpulse introduced into one element may becountered by the flow of repolarizing currentfrom numerous neighboring elements. Inaccord with Noble's analysis of excitation ina branching system, the critical area of mem-brane which must be depolarized will dependnot only on the characteristics of the mem-brane itself, but also on the geometric re-lationship with adjacent cells (14). In theA-V node it is possible that a propagatedresponse to an intracellular stimulus canoccur only when a pulse delivered througha point source is sufficiently strong to de-polarize not only the impaled cell but itsneighbors as well.
In spite of these reservations, the observedchanges in excitability of single cells as afunction of time and of frequency must bephysiologically significant.
LAG IN RECOVERY OF EXCITABILITY
Unlike cells of the atrium or ventricle,which normally reach the diastolic level ofexcitability at or before full repolarization,cells within the node recover much moreslowly. The lag in recovery, already markedin the transitional NH region (Fig. 5), ex-tended several hundred milliseconds intophase 4 in cells of the N region. During partof this time, but not all of it, cells of the nodeaxe often slightly hyperpolarized (Figs. 5 and12).
The functional or effective refractory periodof the A-V transmission system can be de-fined as the shortest attainable interval be-tween two ventricular responses both propa-gated from the atrium (4). This measurementincludes the longest refractory period of anyelement in the conducting series plus theincrement in conduction time of the secondof the pair of responses. Although undercertain circumstances the limiting refractoryperiod is subnodal (for example, in the Hisbundle or its peripheral branches (15, 16),the barrier to propagation of premature atrialresponses can usually be assigned to the A-Vnode itself. Because the effective refractory
CiratUtion Risurcb, Vol. XXIII, ]*h 1968
period determined in this way often greatlyexceeds the action potential duration of anyintranodal cell, it is obvious that much of theresponse interval represents the delayedtransmission of the test response in tissuenot yet fully recovered; the demonstrated lagin the recovery of excitability must account,at least in part, for the delay.
FREQUENCY-DEPENDENT REDUCTION IN EXCITABILITY
The cumulative depression of conductivityat higher driving frequencies, also noted inclinical records by Jedlicka (17), is relatedto parallel changes in excitability. Thestrength-interval curve appears to be shiftedupward and to the right The results suggesttwo recovery processes with widely differenttime courses. The first, which we may identifywith the relatively refractory period or the"lag" in recovery of excitability, is shiftedto the right when the driving frequency isincreased (Fig. 16). Although completestrength-interval curves were not obtained atthe higher frequencies, it is clear that theslope of threshold recovery must change, foralthough the functional refractory period ofthe tissue diminishes as the cycle is reduced,the end of the relatively refractory period isdisplaced to the right. In other words, theduration of the relatively refractory phasemust be prolonged as the frequency is in-creased.
The second phase of excitability recovery,which we may ascribe to a frequency-de-pendent "fatigue," has a much more pro-tracted time course. Dissipation of fatiguewas so slow, in fact, that the "diastolic"excitability appeared to be constant for sever-al hundred milliseconds after the last of aseries of driven responses at a short basiccycle (Fig. 15). Clearly, the threshold mustdecline eventually, but the rate of changewas too slow to detect within the resolutionof the stimulating circuit. It is perhaps per-tinent that recovery from the cumulativeprolongation of A-V conduction time in thedog heart (Fig. 13) also passed through aplateau between 400 and 600 msec. A similarstep in the recovery of conductivity was ob-served in other experiments as welL
by guest on July 18, 2014http://circres.ahajournals.org/Downloaded from
84 MERIDETH, MENDEZ, MUELLER, MOE
The physico-chemical mechanism of theobserved time-dependent and frequency-de-pendent changes in excitability is not ap-parent, and it would be premature tospeculate about it, inasmuch as there is doubtwhether the generation of the action potentialin the node has the same ionic basis as inother cardiac cells (18).
THE WEAK LINK IN A-V TRANSMISSION
It is often stated that the weakest link inthe A-V conduction chain lies in the atrio-nodal junction (1, 19). The results of thepresent study do not support this conclusion,unless it be argued that the atrio-nodal junc-tion includes the temporal center of the node.The lowest excitability and the greatest lagin recovery were observed in the midnodalregion. Accordingly, it is this area, ratherthan the atrial margin, which should be ex-pected to determine the success or failureof propagation of premature beats, and todefine the minimal output interval betweensequential responses. In our experience (13),as in that of Paes de Carvalho and de Almeida(10), this is true; the latest atrial prematurebeat which fails to reach the His bundle diesat the margin of N and NH rather than inthe atrio-nodal transitional zone (Fig. 10).Indirect evidence also supports this concept;a late but blocked atrial premature beat canbe facilitated by very slight pre-excitationof the His bundle, just in advance of theprior basic response (15). Earlier prematureresponses can, of course, be extinguished athigher levels within the node (13, 16).
SUMMATION IN A-V NODAL PROPAGATION
Several of the observations made in thisstudy indicate the importance of summationas a feature of nodal transmission. Whenevera single cell was stimulated through a micro-electrode, no matter how late in the recoverycycle, the propagation time to the atrium andto the His bundle exceeded the correspondingconduction intervals for responses initiated inthe His bundle or the atrium. In a number ofcases, successful excitation of the impaled celloccurred without propagation to the atrium orthe His bundle (Fig. 9), although an earlier
response initiated in the atrium successfullytraversed the node (Fig. 10). In view ofprevious observations of the characteristics ofintranodal propagation of premature re-sponses (13), and of the nature of excitationin a branching system with low resistanceconnections (14), these results are not sur-prising. The action potential of a single unitin a field of fully polarized cells may notprovide enough energy to accomplish thedepolarization of its immediate neighbors; amore or less uniform wave front, involving alarge number of units in parallel, will providea much more effective stimulus.
References1. HOFFMAN, B. F., AND CBANEFIELD, P. F.: Elec-
trophysiology of the Heart. New York, Mc-Graw-Hill Book Co., Inc., 1960.
2. WETDMANN, S.: Effects of calcium ions andlocal anaesthetics on electrical properties ofPurkinje fibers. J. Physiol. (London) 129: 568,1955.
3. CHILDERS, R. W., MERIDETH, J., AND MOE, G. K.:
Supernormality in Bachmann's bundle: An invivo and in vitro study. Circulation Res. 22:363, 1968.
4. KRAYEH, O., MANDOKI, J. J., AND MENDEZ, C :
Studies on veratrum alkaloids: XVI. Theaction of epinephrine and of veratramine onthe functional refractory period of theauriculoventricular transmission in the heart-lung preparation of the dog. J. Pharmacol.Exptl. Therap. 103: 142, 1951.
5. LEWIS, T., AND MASTER, A. M.: Observations
upon conduction in the mammalian heart;A-V conduction. Heart 12: 209, 1925.
6. ROSENBLUETH, A., AND RUBIO, R.: La influencia
de la frecuencia de estimulaci6n sobre lostiempos de propagacion auriculo-ventricular yventriculo-auricular. Arch. Inst. CardioL Mex.25: 535,1955.
7. HOFFMAN, B. F., PAES DE CAHVALHO, A., MELLO,W. C, AND CRANEFTEID, P. F.: Electricalactivity of single fibers of the atrioventricularnode. Circulation Res. 7: 11, 1959.
8. MOORE, E. N., PRESTON, J. B., AND MOE, G. K.:
Durations of transmembrane action poten-tials and functional refractory periods ofcanine false tendon and ventricular myo-cardium; comparisons in single fibers. Circu-lation Res. 17: 259, 1965.
9. MUEIXER, W. J.: Microcircuit digitally controlledpulse interval generator. IEEE Trans, onBio-Med. Engineering, in press.
taml, Vol. XXIU, Jwty 1968
by guest on July 18, 2014http://circres.ahajournals.org/Downloaded from
ELECTRICAL EXCITABILITY OF A-V NODAL CELLS 85
10. PAES DE CARVALHO, A., AND D E ALMEIDA,
D. F.: Spread of activity through the atrio-ventricular node. Circulation Res. 8: 801,1960.
11. MENDEZ, C, AND MOE, G. K.: Demonstration of
a dual A-V nodal conduction system in theisolated rabbit heart. Circulation Res. 19:378, 1966.
12. WEST, T. C , AND TODA, N.: Response of the
A-V node of the rabbit to stimulation ofintracardiac cholinergic nerves. Circulation Res.20: 18, 1967.
13. MENDEZ, C , AND MOE, C. K.: Some character-istics of transmembrane potentials of AV nodalcells during propagation of premature beats.Circulation Res. 19: 993, 1966.
14. NOBLE, D.: Applications of Hodgkin-Huxleyequations to excitable tissues. Physiol. Rev.46: 1, 1966.
15. MENDEZ, C, HAN, J., AND MOE, G. K.: Com-
parison of the effects of epinephrine anilvagal stimulation upon the refractory periodsof the A-V node and the bundle of His.Arch. Exptl. Pathol. Phann'akol. 248: 99, 1964.
16. MOORE, E. N.: Microelectrode studies on con-cealment of multiple premature atrial responses.Circulation Res. 18i 660, 1966.
17. JEDLICXA, J.: RefTaktemi faze sinokomorovehoprevodnfho systemu. Acta Univ. CarolinaeMed. 6: 679, 1961.
18. PAES DE CARVALHO, A.: Excitation of the atrio-
ventricular node during normal rhythm; ef-fects of acetylcholine. In Mechanisms andTherapy of Cardiac Arrhythmias, edited byL. S. Dreifus and W. Likoff. New York,Grune & Stratton, 1966, p. 341.
19. SCHEB, A. M., RODRIGUEZ, M. I., LHKANE, J.,AND YOUNG, A. C : Mechanism of atrioven-tricular conduction. Circulation Res. 7: 54,1959.
CitcmUUtm Rtsurcb, Vol. XXIII, Jal, 1968


![EE -304 Electrical Network Theory (Nodal Analysis) [2016]](https://img.dokumen.tips/doc/110x75/6362d19c40b666b8ec0e8895/ee-304-electrical-network-theory-nodal-analysis-2016.jpg)


