Embed Size (px)
Citation preview

Policy Research Working Paper 5614
Electoral Accountability, Fiscal Decentralization and Service Delivery in Indonesia
Emmanuel SkoufiasAmbar NarayanBasab Dasgupta
Kai Kaiser
The World BankPoverty Reduction and Economic Management NetworkPoverty Reduction and Equity UnitMarch 2011
WPS5614P
ublic
Dis
clos
ure
Aut
horiz
edP
ublic
Dis
clos
ure
Aut
horiz
edP
ublic
Dis
clos
ure
Aut
horiz
edP
ublic
Dis
clos
ure
Aut
horiz
ed
Produced by the Research Support Team
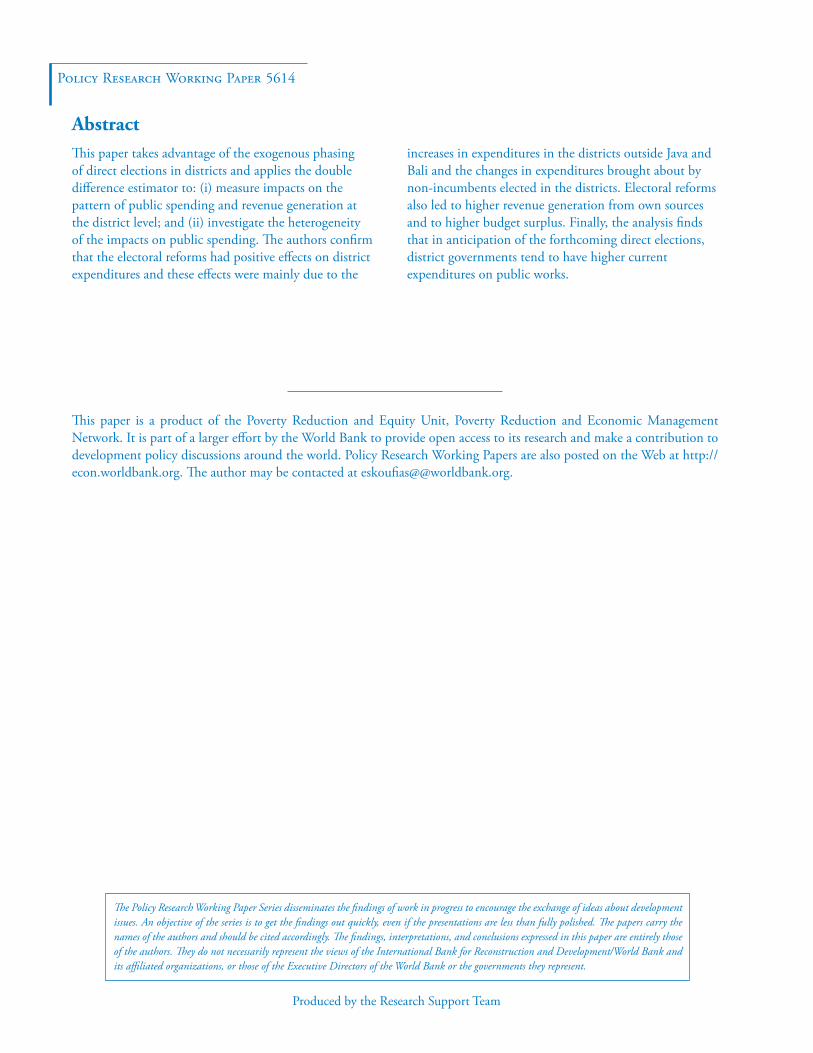
Abstract
The Policy Research Working Paper Series disseminates the findings of work in progress to encourage the exchange of ideas about development issues. An objective of the series is to get the findings out quickly, even if the presentations are less than fully polished. The papers carry the names of the authors and should be cited accordingly. The findings, interpretations, and conclusions expressed in this paper are entirely those of the authors. They do not necessarily represent the views of the International Bank for Reconstruction and Development/World Bank and its affiliated organizations, or those of the Executive Directors of the World Bank or the governments they represent.
Policy Research Working Paper 5614
This paper takes advantage of the exogenous phasing of direct elections in districts and applies the double difference estimator to: (i) measure impacts on the pattern of public spending and revenue generation at the district level; and (ii) investigate the heterogeneity of the impacts on public spending. The authors confirm that the electoral reforms had positive effects on district expenditures and these effects were mainly due to the
This paper is a product of the Poverty Reduction and Equity Unit, Poverty Reduction and Economic Management Network. It is part of a larger effort by the World Bank to provide open access to its research and make a contribution to development policy discussions around the world. Policy Research Working Papers are also posted on the Web at http://econ.worldbank.org. The author may be contacted at eskoufias@@worldbank.org.
increases in expenditures in the districts outside Java and Bali and the changes in expenditures brought about by non-incumbents elected in the districts. Electoral reforms also led to higher revenue generation from own sources and to higher budget surplus. Finally, the analysis finds that in anticipation of the forthcoming direct elections, district governments tend to have higher current expenditures on public works.
Electoral Accountability, Fiscal Decentralization
and Service Delivery in Indonesia
Emmanuel Skoufias
Ambar Narayan
Basab Dasgupta
Kai Kaiser1
1 Emmanuel Skoufias is a Lead Economist at the Poverty Reduction and Equity Unit of the PREM Network at the World Bank, Ambar Narayan is a Senior Economist at the Poverty Reduction and Equity Unit of the PREM Network at the World Bank, Basab Dasgupta is a Consultant for the World Bank, and Kai Kaiser is a Senior Economist at the Public Sector Governance Unit of the PREM Network at the World Bank: The authors are grateful to Sukmawah Yuningsih for her excellent research assistance, and to Wolfgang Fengler, William Wallace, Shubham Chaudhuri, Daan Pattinasarany, Bastian Zaini, and Cut Dian Agustina for encouraging and supporting this work. Stuti Khemani and Benjamin Olken provided very useful comments. The findings, interpretations, and conclusions in this paper are entirely those of the authors and do not reflect the views of the World Bank.
2
1. Introduction
The relationship between institutions of political accountability and government
performance remains a perennial concern for analysts and practitioners of public policy design.
Both developed and developing countries continue to confront the challenge of how best to
promote better basic service delivery with the objective of poverty reduction and the attainment of
the Millennium Development Goals (MDGs). The manner in which citizens can hold their service
providers accountable has increasingly been recognized as being critical to this equation (World
Bank, 2004). A confluence of these concerns can be found around two major on-going policy
debates. One has been concerned with the impacts of devolution, or the claims that bringing
government closer to the people has the potential to make government both more responsive and
efficient. The second policy debate has grappled with the extent and nature of electoral
accountability, whether at national or sub-national levels. Our paper is concerned with the
intersection of democracy and decentralization, and in particular with the question of how
institutional design for electoral accountability affects public sector spending choices and service
delivery outcomes.
Political institutions are clearly heterogeneous and endogenous to context. Transitions from
autocracy to democracy will be contingent on the balance of political and economic forces in a given
state-society relationship (Acemoglu and Robinson, 2006). Understanding the mechanisms of
political selection, i.e. of who takes the reins of leadership, is in turn also critical to understanding
the behavior of those taking positions of authority (Besley, 2005). A prominent concern of
comparative political analysis has been the role of different electoral and institutional arrangements,
notably parliamentary versus presidential systems. The former has tended to rely on the indirect
election of the head of the executive, whereas the latter has mainly relied on direct elections. Using
cross-country data, Lederman et. al. (2004) find that democracy, parliamentary systems, democratic
stability, and freedom of press are associated with lower corruption. Keefer and Vlaicu (2007)
highlight how the nature of democracies will matter significantly for national indicators of public
good provision. But a fundamental challenge for this empirical literature has been to establish a
more robust causal link between political institutions and governance or service delivery outcomes,
given the prevalence of endogeneity and likely unobserved country differences explaining public
sector behavior and outcomes.
3
A parallel challenge has been faced by the literature seeking to document the link between
political devolution and local service delivery (Kaiser, 2006). When decentralization and related
governance reforms occur at the national level, it is difficult to identify appropriate comparison
groups to construct a counterfactual for evaluating the impact of such reforms. Rather than being
driven by service delivery, decentralization reforms have been outcomes of a range of other political
forces (Eaton, et al., 2010). The literature has underscored that outcomes associated with
decentralization and local governance can be undermined by elite capture and partial
decentralization (Junaid Ahmad, et al., 2005, Bardhan and Mookherjee, 2006, Devarajan, et al.,
2009). The length of time that typically elapses before such reforms can have a measurable impact
on poverty and other welfare indicators adds to the difficulties in measuring impacts. Faguet (2005)
finds that decentralized governance in Bolivia has improved responsiveness of policy to citizen
needs through an analysis of sectoral spending trends relative to needs indicators. The evidence on
whether decentralization improves service delivery has been highly context specific and subject to
frequently rather unique identification settings (Ehtisham Ahmad and Brosio, 2009).
Indonesia‘s dual political transition to democratization and greater devolution from the late
1990s (Hofman and Kaiser, 2004, 2006) provides a unique opportunity to empirically assess reforms
in political institutions on government behavior. The reforms not only assigned several hundred
local governments across Indonesia with wide-ranging responsibilities over basic service delivery for
education, health, infrastructure, and general public administration, but also saw the phasing in--the
manner in which local executive leaders (i.e., mayors) were selected. Although decentralization was
implemented in a ―Big Bang‖ in 2001, local leaders were initially indirectly selected by the local
legislatures. Starting in 2005, mayors were selected along direct--and more ―presidential‖ rather than
―parliamentary‖—lines. The unique empirical aspect of this reform was that the change in political
selection occurred in a staggered manner, once the old terms subject to indirect elections had come
to an end. The timing of the shift to direct elections in a district was determined by whether the
district head selected by the previous system had served their full tenure, which resulted in direct
elections being held in a little more than one-third of all (434) districts in June 2005. The remaining
districts continued to be under the existing regime until the tenure of their heads were over. By
2007, around 70 percent of districts had undergone direct elections. The districts were also different
in terms of which of the previous systems they were transitioning from. Some districts moved to
direct election from a weaker version of democracy where the district head was indirectly elected,
4
while others moved directly from the older ‗New Order‘ (the system of appointing as opposed to
electing district heads) system to direct election. These transitions varied across localities, and the
phasing in of direct elections across local governments was effectively exogenous. By relating these
changes to evidence on local spending patterns, we are able to analyze the impact of changes in
political selection and electoral accountability of institutional arrangements.
Given these features, the implementation of political decentralization in Indonesia
approximates a ―natural experiment‖ that is, to the best of our knowledge, rare in the context of a
reform of this nature on a national scale. In most countries in which decentralization has occurred,
analysis of impacts has been limited to a ―before-after‖ comparison since the timing of the reform
has provided no scope for constructing separate ―treatment‖ and control/comparison groups. In
contrast to much of the work in randomized development intervention design, the political nature of
major public sector reforms such as decentralization and democratization typically makes it very
hard to socially engineer differential treatment across sub-national governments. The feature of
districts switching to direct elections in a phased manner allows us to empirically evaluate the impact
of increased electoral accountability on the performance of local governments. Our analysis also
utilizes the fact that the timing of when a district switches from the earlier system to direct election
was determined by a seemingly exogenous factor, namely the timing of when the tenure of the
existing district head would end.
The paper is structured as follows: Section 2 summarizes the transitions in sub-national
political accountability mechanisms and decentralization before and after Indonesia‘s ‗New Order‘
regime. Section 3 briefly summarizes the literature concerning the potential link between political
accountability and public spending and goods provision. Section 4 discusses the data and empirical
methodology we use to test whether democratic reform changed public expenditure patterns and
outcomes across Indonesian districts. Section 5 presents the results from the empirical exercise of
evaluating impacts, with a special focus on investments in health and education. Section 6 presents
the results from the analysis of factors that influence changes in investment pattern, including how
these changes were associated with the measurable indicators of ―needs‖ of the districts. Section 7
concludes the paper.
5
2. Political Accountability, Devolution, and Local Public Services in Indonesia
For over three decades (1965-1998), Indonesia‘s ‗New Order’ government under President
Soeharto could be characterized as a highly centralized and autocratic political regime. Politics were
controlled under the ruling Golkar party, and only two notional opposition parties were formally
allowed.2 The East Asia economic crisis of 1997/98 disrupted what had been overall a highly
successful development trajectory until then and highlighted a number of institutional weaknesses of
the prevailing political regime more of growth (Temple, 2001). The pressures culminated in the
downfall of President Suharto in 1998 and significant pressures for political reform (Reformasi).
Despite the highly centralized rule, the regime did historically allow some space for local
political representation and local government. The 1974 Law on Local Government (Law No.
5/74) provided some degree of bottom-up accountability, including through elections, even if these
were subject to a high degree of stage management. Local governments (pemdas) in Indonesia were
comprised of a regional head (kepala daerah), executive agencies (dinas), and the local assembly (Dewan
Perwakilan Rakyat Daerah or DPRDs). Prior to 1999, regional legislators were down from a closed
list of candidates and all political appointments were dictated by the Ministry of Home Affairs,
frequently from military backgrounds. Moreover, local governments were highly dependent on
earmarks and discretionary transfers, as well as limited own source revenues (Malley, 2003). The
bulk of basic service delivery at the local level was in the hands of deconcentrated central offices
(kanwils). Even in sectors where local governments had notional primary responsibility, they were in
effect the poor cousins of central government presence. But as de facto representatives of the central
government, local heads already enjoyed a significant degree of convening power.
Throughout the 1990s, economic progress and demand for greater political autonomy across
the far-flung archipelago saw growing pressures for greater democratization and decentralization. In
June 1999, Indonesia‘s first relatively free and fair elections in 44 years were held, sweeping in a new
batch of more assertive local legislatures (DPRDs).3 Elections for district and provincial legislatives
in Indonesia are conducted along the same 5-year cycle as the national elections, which implies that
all local legislatures are elected at the same time (i.e., 1999, 2004, and most recently 2009). In August
1999, two ground breaking decentralization laws were passed. These in effect transferred the bulk
2 These incorporated the more nationality-leftist and Islamist strands of Indonesia politics. 3 Power was transferred from Soeharto to his vice-president Habibie in May 1998, while 48 parties then took part in the June 1999 elections.
6
of basic service delivery to 300+ district governments (as opposed to provinces and governors),
folded the deconcentrated structures into these local government structures and provided them with
a significant block grant as well as natural resource revenue sharing (World Bank, 2003).
Although it was not until 2001 that local legislatures had general oversight of a larger
consolidated local budget (APBD), the newly empowered legislatures had greater control over
selecting new local heads whose terms were coming to an end (based on a five year cycle), more
open lists, and more limited edits by the Ministry of Home Affairs (Decree No. 22/1999). The 1999
DPRDs also had the right to impeach local heads, thereby prematurely ending their terms upon an
unsatisfactory delivery of an annual accountability speech. These cycles were different across local
governments. Deviations from this five year cycle, to which we turn in more detail later, were death,
illness, a no-confidence vote, or the creation of a new district. As local heads of the executive,
mayors/walikotas in urban areas and regents/bupatis in rural areas, have significant powers to set the
priorities of their governments, including the priorities set in the budget (including overall levels and
types of spending) as well as its execution. In popular terms they have often been described as raya
kecil, or little kings, although incumbents are subject to a maximum of two terms.
Although very much a part of the wave of flourishing democracy, the political powers of the
local legislatures to select, control, and potentially even dismiss local heads of government soon
raised a number of concerns. First, there was a sense that DPRDs were tending to over-reach their
powers, blurring an effective balance of governance between executive and legislative agencies.
Among the central and sub-national executive and civil service, there was a growing sense of the
need to re-balance this relationship. Second, local politics centered on DPRDs were seen as
becoming increasingly vulnerable to money politics. To secure the office of head of local
government, especially in the wake of larger central government block transfers, or to maintain
office, regional heads found it easier to pay off the balance of two dozen legislators or so (Mietzner,
1997). By narrowly targeting payments to swing legislators, a targeted reward equivalent to the price
of a car would guarantee staying in office or getting an election vote (Malley, 2003:110). Since
legislators themselves had short time horizons and limited programmatic party discipline, they may
have had limited incentives (and frankly options even in the under idealistic norms) to hold local
executives to account for greater public good provision.
7
The concerns around indirect political accountability triggered the second wave of local
government electoral reform toward direct elections (Pilkada Langsung) under Law No. 32/2004)
(Erb and Sulistiyanto, 2009). This reform made the local head (bupati/walikota) more directly
accountable to the people by stipulating that (s)he would be directly elected by citizens, and provided a
clearer definition of the head‘s political functioning. The law stipulated that the head should: (i)
administer the jurisdiction (daerah) as per the guidelines laid down by DPRD, (ii) implement local
laws, including budget, (iii) present accountability reports to the DPRD and central government, and
(iv) provide information to citizens on the government‘s performance. It was believed that this
democratic reform would make the district heads more accountable to their constituencies (Kaiser,
et al., 2005). Based on the new Pilkada amendment, the government decided to conduct the first
batch of direct elections in June 2005 in the districts where the DPRD heads were ending tenure.
The first batch of direct elections concerned all the regional head positions that had come due
between December 2004 and April 2005.4
Figure 1: Local Political-Accountability Transitions
By June 2005, 155 districts had directly elected heads. One important fact to note is the
concurrent creation of new districts, or pemakaran. From 2001 to 2007, the number of districts
increased from just over 300 to 434, which also saw new district head positions opening up in the
4 If the tenure of any DPRD head was ending within the first few months of 2005, the government extended their terms up to May, 2005.
Pre-1999 1999-2004 2005-2009 2009 Onwards
Fuller Devolution (2001ff)
Indirect Partial Direct Full Direct Selection New Order Autocratic
8
newly created child districts. These district splits were more pronounced outside Java, in larger
areas, as well as those that had significant resource endowments (Fitrani, et al., 2005).5 Given that it
is difficult to compare the spending structure and levels of districts affected by splits, our analysis
focuses on those districts that are unaffected by splits.6 By 2007, 304 out of a total of 434 districts –
including ―undivided‖ and split districts -- had held direct elections. Among the 264 districts that
remained undivided between 2005 and 2007, 182 districts had held direct elections for district heads
by 2007, including 77 that held their direct elections in June 2005 (Figure 3). All districts had been
subject to direct elections by the end of 2009. We define autocratic heads as those that were
selected by the old DPRDs.
Figure 2: Timing of direct elections of district heads in all 304 districts by 2007
Figure 3: Timing of direct elections of district heads in 182 undivided districts by 2007
Note: 304 districts out of 434 had a directly elected district head by 2007
Note: 182 out of 264 undivided districts had a directly elected district head by 2007
The timing of a direct election for undivided (and ―parent‖) local governments depended on
when the five year term of the previous head had come to an end. For example, if a district head
was last elected in January 1999 under the New Order ―autocratic‖ selection process, (s)he would
have been subject to indirect election by the 1999 elected DPRD in January 2004. Empirical analysis
5 Among the original 336 districts in 2001, 264 districts did not split during 2001-07. Fifty two districts split once and 20 districts split twice or more during this six year period. 6 Combining the newly split districts with each other would make them comparable in terms of geography and population with the ―old‖ district. However, governments of split districts are unlikely to behave the same way as the government of the old district would have if it had not been split, given that political, institutional and other factors that influence fiscal performance are likely to change as a result of the split. Furthermore, in many cases the parent districts continued with their existing government while the newly formed districts held direct elections. Combining the split districts may therefore lead to a mixing of different electoral regimes for the same district in the same time period, which would distort or dilute those very effects this study intends to measure.
155
36
12 16 229
27
2 4 7 14
020406080
100120140160180
20
05
_Q2
20
05
_Q3
20
05
_Q4
20
06
_Q1
20
06
_Q2
20
06
_Q3
20
06
_Q4
20
07
_Q1
20
07
_Q2
20
07
_Q3
20
07
_Q4
Frequency
77
26
914
21
511
2 4 49
0
10
20
30
40
50
60
70
80
90
20
05
_Q2
20
05
_Q3
20
05
_Q4
20
06
_Q1
20
06
_Q2
20
06
_Q3
20
06
_Q4
20
07
_Q1
20
07
_Q2
20
07
_Q3
20
07
_Q4
Frequency
9
indicates that whether a district had direct election by 2007 was determined by whether the tenure of
the existing district head (bupati) was due to end by that time, and not correlated to a range of pre-
existing economic, social, and geographic characteristics of the district (see Annex A, Table A-1).7
Similarly, whether a district had indirect election was also determined by whether the tenure of the
existing bupati was due to end between 1999 and 2004 and not by other district characteristics. These
results support the claim that whether a district had direct elections or not in a certain year is
exogenous for the purpose of our analysis, i.e. it is independent of district characteristics that can
potentially influence public investment and outcomes.
The identity of new district heads with the onset of democratic elections has also undergone
a number of changes, although the literature notes a persistence of elites. Local head elections are
based on slates of district head and vice-head. The structure of Pilkada elections is in effect first-
past-the post, meaning that even candidates with less than an outright majority can win if an election
has multiple candidates.8 A growing number of qualitative analysis have examined the particular
local dynamics and identities of both winning and losing candidates (Brown and Diprose, 2007, Erb
and Sulistiyanto, 2009).
3. Public Good Provision and Political Accountability
A growing cross-country, as well as intra-country, literature has examined the relationship
between political accountability and public good provision. A significant cross-country literature has
begun to emerge on associations between electoral mechanisms and economic policy, including
aggregate public spending and debt levels (Persson and Tabellini, 2006). A central concern of the
literature has been whether governments are inclined to provide public goods that are responsive to
broader citizens needs, versus more narrowly targeted ―private‖ goods or patronage. The
relationship between time-horizons and the incentives for politicians has figured prominently in this
7 In a probit regression of whether a district had direct election (as per Law No. 34/2004), the variable indicating whether the last government served full term before the direct election is highly statistically significant, whereas all other district level characteristics were insignificant. These include characteristics related to the economy (per capita GDP, unemployment, natural resources), urbanization, infrastructure (roads, telephone), physical characteristics (hilly/coastal/valley) and regional fixed effects. Similar results are also seen for a regression of whether a district has had indirect election (as per Law No. 22/1999). 8 Candidates must be at least 32 years old, healthy, and endorsed by one or more parties that together received at least 15 percent of the previous DPRD legislative vote of the 2004 and 2009 elections respectively.
10
literature. Especially for younger democracies in which politicians are not able to make credible
longer term commitments to provide public goods, there would be a greater propensity to provide
clientelistic expenditures (Keefer and Vlaicu, 2007). Over time, this type of public spending will be
less likely to result in improved development outcomes.
Public investment, which is often loosely referred to as development expenditures, has been
one area of focus for this literature. In developing countries this type of expenditure is seen as
critical to supporting basic service delivery indicators, but also as a source of significant rent
distribution. For example, Keefer and Knack (2007) find that higher public investment is associated
with more limited checks and balances.9 Delavallade (2006) suggests that higher country corruption
appears to distort spending away from social expenditures (health, education, social protection)
toward other public services, fuel, and energy. She argues that this indicates that social sectors may
offer less opportunity for embezzlement. De la Croix and Delavallde (2009) develop a model and
empirical test to show that more predatory/rent-seeking governments invest more in housing and
physical capital than in health and education.
The literature on local government is rife with examples of poor political accountability, and
a focus on ―jobs for the boys‖, rather than services for the people. Drawing on the infamous
example of James Michael Curley, a four-time mayor of Boston, Glaesser and Schleifer (2005) show
how he used wasteful redistribution to his poor Irish constituents and incendiary rhetoric to
encourage richer citizens to emigrate from Boston, thereby shaping the electorate in his favor. Many
residents of Washington, DC in the 1970s and 1980s would have felt similarly as their city was
driven into bankruptcy. As a consequence, Boston stagnated, but Curley kept winning elections.
Their model illustrates how using redistributive politics can help to shape the electorate. The model
yields a number of predictions that contradict those from more standard frameworks of political
competition, but consistent with empirical evidence.
The example of Bolivia‘s decentralization to the municipal level in the 1990s provides some
evidence that local governments were more responsive than centrally led allocation to local needs.
Faguet (2004) is able to document this by a careful comparison of shifts in local expenditure
priorities relative to indicators of local need. Tsai (2007) provides a fascinating account of how
informal mechanisms, including links with local temple groups, are associated with local leaders
9 They do note that governments may be attempting to compensate for weaker private investment,
11
providing public goods such as roads and schools. Zhang et. al. (2004) analyze the impact of the
introduction of local elections to some of China‘s villages. They find that the introduction of
electoral accountability does not increase the level of revenue mobilization, but shifts it from
individuals to enterprises.
The literature suggests that increased democratic accountability and the direct election of
regional heads could have a number of implications for policy choices by government. First, a shift
to direct elections holds the promise to increase political accountability to the broader electorate.
This would make governments more responsive to local needs. Second, directly accountable heads
would be expected to spend more on aggregate, either through decreasing savings or increasing
borrowing. Impacts on own-source revenue generation are expected to be ambiguous, given not
only the pressures to increase expenditures but also the political pain of increasing taxes on the local
population. Expectations about relative levels of development versus routine spending are highly
contingent on whether one views one type of spending as more or less of a rent distribution
mechanism than the other. Third, the shift to direct elections may trigger shifts in the policy choices
and spending of incumbent district heads who were indirectly appointed in this position and who
have ambitions to get re-elected in office through spending that is directed to better or more
services.
4. Data and Empirical Methodology
We first examine whether direct election for the district government (Pilkada) in Indonesia
has led to changes in the allocation and distribution of public resources by making the government
more accountable to its citizens. This involves isolating the changes in resource mobilization and
investment resulting from direct election. We use a difference-in-difference (DID) approach to measure
the impact, utilizing the ―natural experiment‖ element of how direct elections were implemented,
where the timing of when a district holds direct elections was determined by when the previous
district head‘s tenure was due to end. We also examine the heterogeneity of the impacts of Pilkada
along a few key dimensions, by looking at whether and how the impacts are different across districts
that are headed by incumbents or new entrants, and across districts that are geographically different
(those in Java and Bali versus those outside). Finally, we examine the question that if direct election
did bring change, are these changes consistent with (or responsive to) the (measurable) needs of the
12
district? To identify the drivers of changes in investment, we propose a simple, intuitive model and
use regressions to empirically estimate its reduced form.
For the first part of the exercise, the impacts are measured primarily on only a few fiscal
variables: expenditures (total and by sector), revenues from own sources, and budget deficit. On the
expenditure side, we focus on public investments in all eight sectors for which the district
governments make decisions on investments, with special emphasis on health and education that are
likely to have the most direct impact on human development outcomes. The primary reason for
including expenditure indicators is that higher expenditures on basic public services, on the average,
are likely to be an early indicator for a better performing or more responsive local government.
While higher expenditures are no guarantee for actual improvements in public services, improving
availability and quality of services more often than not requires additional investment. Expenditures
are especially likely to indicate better performance among local governments in the Indonesian
context, where the recent fiscal decentralization is likely to have increased the amount of resources
at the disposal of local governments. Higher spending on public services is therefore likely to
indicate more readiness on the part of a local government to utilize the available resources.
Local government financing is composed of a limited own-source revenue base, which
represents on average less than a tenth of total revenues. Local governments are highly dependent
on central transfers, notably a block grant (DAU); natural resource revenue sharing—which is
particularly important for a number of districts outside of Java; revenue sharing from income and
property taxes--a source of revenue which is especially important for urban districts; and other
sources of revenue.10 Local governments are able to engage in some borrowing, and also build up
cash reserves (Lewis, 2005, 2007). Aggregate spending decisions are therefore contingent on own-
source revenue base and effort, central transfer allocations, and savings/borrowing decisions.
The primary reason for including revenue generation from own sources in the analysis is that
it allows us to investigate the relationship between democratic reforms and own revenue generation.
Some of the literature on the subject appears to suggest an inverse relationship – in a democracy in a
developing country, since the median voter is usually poor, the government would like to commit to
low levels of future taxation. District level governments have very little control over the remaining
sources of revenue. Tax rates, for example, are determined by the central authorities and not district
10 A specific grant (DAK) is also established in the intergovernmental fiscal system, but its role has been limited to-date.
13
governments, although, in principle, district authorities could increase tax revenue by intensifying
efforts to collect revenue at the local level or through more effective negotiation with the central
authorities. Also, at the district level, the DAU block grant is the largest source of revenue for most
districts, 11 and its allocation is based on a formula aiming to address disparities between local
expenditures needs and local own fiscal potential (Hofman et al. 2006).
We also examine the impact of the electoral reform on the budget deficit of the district. For
our analysis, surplus is defined as the simple difference between total revenue and total expenditures
at the district level. Total revenue is defined as the sum of revenues from own sources, revenue from
tax sharing with the center, revenue from of non-tax (i.e. natural resource) revenue sharing with
center, the block grants (DAU and DAK) and revenue from other sources.
Measuring the impact of direct elections on public investments, revenue and budget deficit.
We focus on the post fiscal decentralization period – between 2001 and 2006 – considering
direct election for local government (Law No. 34/2004) in a district as the ―treatment‖ whose
impact needs to be analyzed. The fiscal variables on which we expect to see an impact are from the
years 2001-2006; the first round of direct election in 155 districts took place in June 2005 and 48
more had elections in the successive quarters in 2005. Thus, we choose the end of 2005 as the
switching point between ―pre‖ and ―post‖ Pilkada periods, which implies that our dataset includes
observations from both pre- and post-direct election periods. We define those districts as
―treatment‖ where direct election had occurred in 2005, while the control districts are those that did
not have direct elections until 2008 or later. This also implies that districts that had direct election in
2006 or 2007 are omitted from the regressions altogether. Omitting these from the regression
sample is justified in our view because they can arguably belong to either the treatment or control
groups and are therefore likely to bias the measured impacts of direct elections (see section 5 for
more discussion of this issue).
We use the following model to identify the impact of direct election:
(1)
11 In 2004, for example, DAU accounted for an average of 64 percent of total revenues.
14
The dependent variable represents a fiscal variable of interest – including the revenues
from own sources, the different components of realized expenditure and budget surplus/deficit –
for district m at time t (2001 to 2006). By construction, the binary variable takes the value 1 if
district m is in the treatment group (i.e. direct elections were held in the district between June and
December 2005) and equal to 0 otherwise. The binary variable takes the value 1 for post
Pilkada years (2006) and 0 otherwise (2001-2005), while denotes the district fixed-effect
summarizing the role of all observable and unobservable variables at the district level that do not
vary over time. The disturbance term summarizes the influence of all other unobserved
variables that vary across districts and over time, assumed to be uncorrelated with the variables in
the regression, though it is allowed to be correlated over time. In this framework, the parameter
then identifies the effect of any systemic difference between the treatment and control groups of
districts on the dependent variable in the pre-Pilkada reference year (i.e. 2001). The parameters
identify the ―year effect‖ on the dependent variable, namely the effect of any systemic changes that
affected all districts in the pre-Pilkada years. The parameter is the parameter of our interest since
this identifies the difference-in-differences (or DID) of the impact of direct election on the dependent
variable.12
Specifically, the DID estimate of the impact of Pilkada provides an estimate of the average
change in the outcome variable in the treated group from pre-Pilkada (denoted by the subscript
preE) to post-Pilkada years (denoted by the subscript postE) relative to changes in outcome variable
in the control group over the same period of time, i.e.,
. (2)
Data
To conduct the analysis, we assemble a large dataset, compiled from multiple sources and
linked at the district level. These are regional electoral information from the government (Ministry
of Home Affairs, MoHA), and regional budget data from SIKD for the period 2001 to 2006.
The district-level electoral information from the government has been compiled by the
Jakarta World Bank team with the collaboration of the Ministry of Home Affairs and a number of
12 The specification of (1) follows closely what is suggested by the literature on the use of DID method for impact evaluation. See, for example, Imbens and Wooldridge (Imbens and Wooldridge, 2009) (2009), pp. 67-70.
15
local institutions.13 The data set contains information for the period 1999 to 2007 on how the
current district head was selected (e.g. by pre-1999 DPRDs, indirect elections by post-1999 DPRDs,
direct elections, or whether (s)he is a caretaker head appointed by the central government until the
next elections), the name of the elected district head, whether (s)he was preceded by a caretaker
district head, whether the incumbent governor won or ran in the elections, the reason for the
incumbent governor not contending, the share of votes won, the number of candidates , the political
party, the date the term began and ends and some key personal characteristics such as gender, and
whether (s)he is in the military.
The SIKD regional budget data from 2001 to 2006 was derived from MoF‘s Regional
Financial Information System (Sistem Informasi Keuangan Daerah, SIKD).14 The Fiscal Year within this
time span runs from January to December. The introduction of a ―new‖ budget format according
to MoHA Decree no. 29/2002 changed the budget structure since 2003, with the changes mostly
affecting the classifications on the expenditure side.15 To enable comparison over time, we
converted the new dataset into the old format as per SIKD guidelines – by mapping the post-2003
expenditure data into the old categories of development and routine expenditures. To measure
changes in real terms, we also deflated the fiscal data for 2001 to 2006 using 2000 as the base year.
The changes in fiscal variables over time and across treatment and control districts estimated
in more detail by the regressions can be seen clearly from graphs showing trends for different
groups. Figure 4 traces the averages of selected fiscal variables over time and separately for
treatment and control groups. An implicit assumption behind the application of the DID estimator
is that the time trend (or year effect) is identical between the treatment and control groups in the
years prior to the elections. The graphs in figure 4 suggest that the assumption of common trends
between the treatment and control groups prior to the elections (2001-2005) is justified, a fact that
has also been confirmed by a variety of statistical tests. Average per capita total expenditure and
13 Special thanks go to Bambang Suharnoko (WB), Anstasia Soeryadinata and W. Paul Roland (NDI Indonesia), Natalia Warat, and Jeremy Gross (Asia Foundation). 14 SIKD is a facility provided by the Ministry of Finance to collect, validate, process, and analyze regional financial information. Regional governments have the legal obligation to report this data to the Ministry of Finance in a timely manner. 15 Before 2003, there were only two categories- revenues and expenditures with expenditure classified as either routine (recurrent) or development (investment). From 2003, the classification on the expenditure side changed from ―routine‖ and ―development‖ expenditures to ―public‖ and ―apparatus‖ expenditures. The other change introduced was the separation of ―financing‖ item from revenue and expenditure categories. Approximately 60 percent of all regions used the new budget format for the 2003 realizations, while 40 percent continued to use the old format. By 2004, 90 percent of regions were using the new budget format.
16
revenue show a sharp increase from 2005 to 2006 for treatment and control groups alike – in
contrast to nearly flat expenditures and revenues during 2001-2005. The increase is however larger
for the treatment group, suggesting a possibly significant impact of direct elections.16 While both
education and health expenditures increase between 2005 and 2006, the impact of direct elections
appears to be more significant for education than for health. Lastly, the two graphs at the bottom
suggest that direct elections also appear to be associated with an increase in the revenue from own
sources (PAD) and a substantial increase in the fiscal surplus.17
Figure 4: Changes in selected district level fiscal variables over time
Note: 1)The solid lines represent the treatment group and the dashed lines the control group 2) Vertical axes represent per capita real expenditure and revenue in ‗000 rupiah
16 Similar trends are also observed for average development expenditures and routine expenditures, and for expenditures in education and health over time and across treatment and control groups. 17 In 2006 the formula used to allocate the DAU block grant to districts, which makes up the bulk of the district revenues, was revised substantially resulting to substantial increases in district revenues(for more details see World Bank, 2007, pp.120-121.)
17
5. The Impact of Direct Elections: Difference in Difference Estimates
In the regressions estimating the DID impacts (see equation (1) above), the dependent
variable is a specific expenditure or revenue-related variable for district m at time t. The independent
variable T takes the value 1 when the observation pertains to a district that held a direct election by
end-2005 (treatment) and 0 when the district had no direct election (control) as of 2007. As
discussed earlier, the sample is restricted to observations from the districts that remained undivided
between till 2006, leaving 112 treatment districts and 122 control districts, covering the period 2001-
2006. We have also omitted from the sample the districts that had direct elections in 2006 or 2007,
which implies that the set of control districts consists of districts that did not hold local direct
elections until 2008 and later.18. In light of the concerns raised by Bertrand et al (2004) about the
reliability of the standard error estimate of the DID estimate of impact, we take into account the
potential serial correlation in the error term assuming a parametric autocorrelation structure
using the method proposed by Baltagi and Wu (1999) for unbalanced panels.19
Our DID estimates (summarized by the parameter ) indicate that per capita total
expenditures in districts with direct elections in 2005 have increased significantly from the pre- to
post-Pilkada period relative to districts that did not have direct election, suggesting that having a
direct election in a district had a positive and significant impact on expenditures of district
governments (Table 1a). Looking at expenditures disaggregated by sector, the DID estimate is at
least weakly significant (10 percent level or stronger) for 4 out of 8 sectors. Public works,
transportation, health, and industry are the sectors for which direct elections had no impact on
expenditures.
Tables 1a and 1b
The positive impact on government expenditure is attributable to increases in both
development and routine expenditures, but with their relative importance varying from sector to
18 Later in the paper, we also investigate whether the districts that had local elections in 2007 and 2006 (the last year of our data on district-level expenditures and revenues) differ on average in terms of revenue and expenditure allocations from the districts in the control group, i.e. the districts that had local elections in 2008 or later. 19 In general, the standard errors estimated based on fixed effects model with an AR(1) disturbance where higher than the standard errors estimated with a simple fixed effect model ignoring the potential serial correlation in the error term.
18
sector (see Table 1a). Routine expenditure refers to expenditures related to general administration,
including expenses on personnel, goods, and official travel, and repayment on borrowing and
interest. Development expenditures refer primarily to expenditures on O&M (operations and
maintenance) and capital spending. The impact of direct election is positive and significant on both
aggregate development and routine expenditures.
Disaggregating by sector, we find that the significant increase in education and industry
sector expenditures is attributable to increases in routine expenditures in these sectors. In contrast;
the increases in administration, agriculture and housing expenditures are driven by both development
and routine expenditures. The story that emerges on expenditures in the key sectors of health and
education is as follows. The increase in education expenditures was significantly larger in districts
where direct elections were held, mainly due to increases in routine (as opposed to development)
expenditures, relative to districts without direct election. In the case of health expenditures,
however, districts with direct elections did not have a significantly larger increase relative to the rest.
Direct elections therefore seemed to have an impact on routine expenditures in education, but not
on health expenditures of any type.
The DID estimates indicate that direct elections had a positive and significant impact on the
real per capita revenue from own sources of district governments.20 Moreover, the budget surplus in
per capita terms (defined here as the simple difference between total revenues and expenditures of
the district government) in treatment districts increased after the direct elections in comparison to
the control districts (Table 1b).
In sum, the positive impact of direct elections on expenditures appears to have been spread
across sectors, with 4 out of 8 sectors showing at least weakly significant impact. The impact is
strongly significant for the key service delivery sector of education (but not for health), where
increase in routine (as opposed to development) expenditures is the driving force. Since the increase
in expenditures is spread across a number of sectors, direct elections do not seem to have led to
significant shifts in the allocations of spending across sectors (see Annex, Table A-2a and 2b).
20 One important caveat for the interpretation of these results is that the reported revenue from own sources (PAD) in the SIKD data base is zero in 2004 and 2005. We have been unable to establish the reasons behind the absence of any revenues in these two years.
19
Rather surprisingly, in the immediate aftermath of the reform in Indonesia, we do find a
positive and significant impact of democratic reform on the amount of revenue generated from own
sources by the district governments. This result is contrary to the inverse relationship between own
sources of revenue and electoral reforms suggested by the literature cited in Section 2. The
statistically significant increase in the fiscal surplus also appears to contradict the prevailing notion in
the decentralization literature that fiscal deficits at the district level are likely to increase based on the
expectation that they will be absorbed by the central government.
Java and Bali vs. Other Regions
The analysis so far has focused on the average impact of Pilkada on the level of fiscal
expenditures and revenues by districts. The wide diversity of Indonesia in geography, culture,
ethnicity and religion warrants further investigation on the extent to which there is heterogeneity in
the impacts of Pilkada. For this purpose, equation (1) is estimated separately for the group of
districts that had direct elections in the Java and Bali region and the group districts that had direct
election in the other regions (Sumatra, Kalimantan, Sulawesi, Nusa Tenggara, Maluku and Papua).
Of the 174 districts in total for which we have expenditure and revenue data in 2006, about 53
percent (or 92 districts) are not in the Java and Bali islands and about 61 percent of these (or 56
districts) have directly elected heads. Each of these two groups of districts is compared against the
set of districts that did not have direct elections as of 2007 (irrespective of the region that
comparison districts belong to).21 A closer investigation of whether the impact of Pilkada varies by
region can shed light on an important question: In the geographic areas that benefitted the most, at
least in terms of revenue, from the fiscal decentralization that started in 2001, is it the case that
having elected local leaders led to greater impacts on expenditure (compared to having district heads
who were not elected)? For example, in 2002, approximately three-quarters of the total natural
resource revenue was distributed to the district governments in the provinces of Aceh, Riau, East
Kalimantan and Papua (Lewis, 2005). It is also the case that the fiscal decentralization was, in part,
motivated by secessionist sentiments and centrifugal tendencies in a number of the outlying
provinces like Aceh, and Papua.
Table 2a and 2b
21 We have also estimated an interaction model on the full sample of the treatment and control districts by allowing the treatment (Pilkada) effect to differ between districts in the Java and Bali islands and the districts in the outer islands. These comparable estimates are available directly from the authors upon request.
20
The estimates in Table 2a reveal that the trajectories of district government expenditures and
revenues in post-Pilkada years are quite different depending on the geographic location of the
district. DID estimates of the impact of direct elections on expenditures per capita in the districts
outside Java and Bali are qualitatively similar to, and more pronounced than, the impact of direct
elections in the pooled sample of districts. Total per capita expenditures in the districts outside Java
and Bali increased significantly from pre- to post-Pilkada period relative to the control districts.
Moreover, seven out of 8 sectors show significant impact of local elections on expenditures, with
transport being the only sector where there is no impact. In contrast, in the districts located in the
islands of Java and Bali, total per capita expenditures decreased significantly relative to the control
districts and the decrease seems to be more or less uniform across sectors. The higher expenditures
in the districts outside Java and Bali that had direct elections are also accompanied by an increase in
revenues from own sources and an increase in the budget surplus. In contrast, the districts that had
direct elections within Java and Bali, do not display any significant difference in the trajectories of
revenues from own sources or budget surplus from those in the comparison group (Table 2b).
Incumbents vs. non-Incumbents
Another potential source of heterogeneity in the choice of local expenditures, revenues, and
fiscal balance may be the incumbency status of the elected district head. As mentioned earlier,
district heads that were indirectly appointed by the local parliaments prior to 2004 were allowed to
run for re-election with many of the incumbents getting elected to continue in office. For example,
in 2006, out of the 174 districts in our data, 57 percent (or 100 districts) held indirect elections in
2005 and in just over a half of these districts (53 percent) the incumbent district heads were re-
elected. The political business cycle literature from industrialized countries suggests that incumbent
politicians are likely to manipulate government expenditures to either enhance their probability of
re-election or for the purpose of rewarding the groups that supported them after their re-election
(Alesina et al. 1997; Drazen, 2000).
To shed some light on this question, equation (1) is estimated separately for the group of
districts where the elected head was an incumbent prior to the 2005 local election and the group of
districts where the elected head was a non-incumbent. Each of these two groups of districts is
compared against the set of control districts, i.e. the districts that did not have direct elections as of
21
2007.22 DID estimates of the impact of Pilkada on expenditures reported in Table 3a reveal that the
results in the pooled sample (Table 1a) are driven mainly by the districts where non-incumbents are
elected. Per capita total expenditures in the districts with non-incumbents increased significantly
from pre- to post-Pilkada period relative to the control districts. Six out of eight sectors show a
significant impact of local elections on expenditures, with public works and transport being the only
sectors in which there is no impact. In contrast, the comparison of the trajectories of total
expenditures in districts where incumbents were elected are not significantly different from the
trajectories of expenditures in the control districts. 23 Also, for the sectors where there appears to
have been a significant increase in expenditures, the size of the increase is much lower than the
expenditure increase in the districts where non incumbents were elected.
The increased expenditures in the districts where non-incumbents were elected also appear
to be accompanied by significant increases in the revenues from own sources (Table 3b). While both
groups of districts with direct elections experienced a significant increase in budget surplus, it is only
in the group of districts where non-incumbents were elected that we observed a significant increase
in revenue from own sources, consistent with a more fiscally responsible behavior on the part of the
government.
Tables 3a and 3b
Overall, the preceding estimates suggest that the positive effects of the 2004/2005 electoral
reforms on the district expenditures are due mainly to (i) the increases in expenditures in the districts
outside Java and Bali; and (ii) the changes in expenditures brought about by the non-incumbents
elected in the districts. The finding that being directly elected had little or no impact on the spending
of a district head who is an incumbent (the previous district head) has two plausible explanations –
that direct elections actually had no impact for incumbents, or that expenditures had already been
manipulated prior to the election to improve their chance of re-election. The second explanation
seems unlikely--incumbents in the 2005 elections did not have much of a chance to manipulate the
22 We have also estimated equation (1) limited to the sample of the 100 districts that had direct elections in 2005. In almost all categories of expenditures, the trajectories of the expenditures of the incumbents are significantly lower than the trajectories of expenditures in the districts were non-incumbents were elected. These estimates are available upon request from the authors. 23 We also checked whether the expenditures of incumbents in 2005, the year of the election, were higher than the corresponding expenditures in districts where non-incumbents were elected. We found that in 2005 the expenditures on public works is the only category of expenditures higher than the expenditures in districts where non-incumbents were elected.
22
spending of district governments since the electoral reform law was passed in late 2004 and elections
started taking place less than six months after that. Thus, the likely story appears to be that the
reforms induced a change in incentives and performance (as proxied by spending) primarily when
the elections yielded a change in leadership, and not when the previous district head came back as
the elected head.
Expectations of Pilkada
The analysis so far excludes districts that had direct elections in 2006 or 2007 (70 districts)
from the regressions. It is important, however, to examine the extent to which the anticipation of
having local elections in the current or the next year affects the spending and revenue allocations of
the current district administration. The availability of information on district level expenditures and
revenues in 2006, the year after local direct elections begun to be implemented in some districts,
allows us to examine whether having direct elections in the current year (2006) or the expectation of
elections in the next year (in 2007) is associated with any differences in the level of district
expenditures and the sources of revenues, compared to the districts that are scheduled to have
direct elections in later years (i.e. in 2008 and after). Some authors argue that manipulation of
expenditures and policies for the purposes of re-election is more likely to occur after direct elections
at the local level have been in place for a while (e.g. Khemani, 2004; Grier and Grier, 2000).
Following the legislation and the implementation of the electoral reform in a number of districts in
2005, it is quite plausible that the incumbents in the districts where direct elections are about to take
place change their expenditures and policy choices so as to increase their chances of re-election.
Empirical evidence of significant changes in fiscal expenditures in the districts facing direct elections
in the near future (current or next year) as opposed to 2-3 years later, would suggest that there is a
―Pilkada anticipation effect‖ at work in these districts.
The available literature also provides some interesting insights about the effect of elections
on policy choices. Khemani (2004), for example, argues that close to election time, politicians are
less likely to use broad-based tax cuts and more likely to provide targeted benefits to voters in
exchange for political support during election time.
Tables 4a and 4b
23
To examine these issues, we re-estimate equation (1) by re-defining the treatment group as
the group of districts that was left out of the earlier analysis because this group held direct elections
in 2006 or 2007. The set of comparison districts used is identical to that used in the earlier
regressions, i.e. the districts that did not have direct elections until 2008 and later. The estimates in
Table 4a reveal that the fiscal expenditure trajectories of the districts where direct elections are
taking place (i.e. 2006) or are about to take place are very similar to the fiscal expenditure trajectories
of the districts that already held had local elections in 2005 and have a locally elected district head in
place (see Table 1a). Total expenditures as well as development and routine expenditures are higher
than in the control districts. In accordance with the patterns observed in other countries such as
India, the anticipation of elections in a district is associated with a significantly higher level of per
capita development expenditures, the category of spending that is particularly ―targetable‖ and more
discretionary. In addition, in the districts where elections are imminent the spending on public works
programs appears to constitute the major component of the (higher) development expenditures,
which implies that development spending on public works is the natural instrument for ―buying
support‖ from the broader public. Contrary to expectations, revenues from own sources are also
higher in these districts as is overall surplus, which suggests that the anticipation of district elections
is not sufficient to deter current district heads from raising revenues, or at least intensifying efforts
toward raising revenues from own sources (Table 4b).
6. Are the Changes in Expenditures Based on Need?
As acknowledged above, the estimated impacts of electoral reforms on district expenditures
are only a necessary condition for the impacts of increased accountability on service delivery. One
critical question is whether the shift to electoral accountability results in improvements in the
measured outcomes of service delivery. In Annex B we investigate this issue and find no significant
impacts on outcomes. One possible explanation for the absence of any measurable impacts on
outcomes is the fact that we only have two years of data (2006 and 2007) on outcome indicators
after the initiation of the electoral reforms. Two years is by all accounts too short of a time horizon
in which to expect measurable impacts, even if electoral reforms are ultimately successful at
improving outcomes. We can, however, examine whether expenditures in districts that had direct
elections are more responsive to the ―needs‖ of districts. Expenditures being responsive to unmet
needs for services would not necessarily imply that outcomes would improve, but make it more likely
that they would, in comparison to a situation in which investments are uncorrelated with needs.
24
For this purpose, we estimate the regression
, (3)
where the dependent variable is the difference between pre- and post- direct election local
government expenditures, denotes the vector of the initial stock of public goods, is a vector
of indicators summarizing the initial economic conditions in the district, political and institutional
environment and history of previous governments, and and are the vectors of coefficients of the
preceding vectors of variables. To normalize for price differences and population, we consider
investments in real and per capita terms.
The main coefficient of interest is given by the vector , which can be interpreted as an
indication of the extent to which investment is based on need (as in Faguet, 2004). Following
Faguet, two types of information are used as indicators of the stock of public services, PG0: (a) the
initial per capita stock of infrastructure (before Pilkada), and (b) the ―coverage rates‖ of public
services or benefits in the local population. For education, for example, (a) would include number of
school facilities of different types in a district, prior to electoral reform; examples of (b) would be
school enrollment and completion rates, distance to school, and years of education among the
population. The status of physical facilities is important because unmet needs in infrastructure or
facilities are usually the most visible and likely to be addressed through public investments. Type (b)
variables indicate the composite result of a combination of factors, including (but not limited to)
availability, usage, and utility from public investment for citizens in a district.
A negative and significant coefficient on would suggest that after political
decentralization a district government invests more heavily in a sector when public goods in that
sector are scarce and therefore the demand for public goods is higher. A significantly positive
coefficient would imply that after political decentralization, investment increases with the pre-
existing level of services, possibly accentuating pre-existing differences in public goods endowments
amongst municipalities. The coefficients of the variables in , summarized by the vector , can
provide useful insights into the economic, institutional and historic determinants of a local
government‘s investment decisions. These factors are likely to have influenced how the investment
decisions of the district government evolved since fiscal decentralization (see Faguet 2004). If
political decentralization actually led to greater political accountability and sensitivity to citizens‘
25
preferences, how these changes translate into investment decisions is then likely to be influenced by
the same set of economic, political and institutional factors.
We are primarily interested in identifying the factors that explain the increase in expenditures
between pre- and post-Pilkada periods in the districts that belong to the treatment groups most
relevant for our analysis – districts that held direct elections in 2005. However, for the purpose of
comparison, we also report the estimates of the same regression on the sample of the districts that
did not have direct elections until 2008 and later, i.e. the districts used as a comparison group thus
far. The explanatory variables used in the analysis are obtained from the Village Potential series
(PODES) and the National Socio-Economic Survey (SUSENAS) both administered by Central
Bureau of Statistics‘ (BPS). The PODES is a village census that collects detailed information every
three years on a range of characteristics – ranging from infrastructure to village finance – for all of
Indonesia‘s villages and neighborhoods (about 69,000). The survey is implemented by sub-district
level statistical agents, who work for BPS, and information is typically provided by the village heads
and neighborhood heads. The SUSENAS survey is an annual household survey covering around
205,000 households from all over Indonesia that is representative at the district (Kabupaten) level.
The survey collects household level data, such as household age and gender composition,
consumption expenditures in major food and non-food categories, as well as individual level data,
including school attendance and educational attainment, use of health facilities, participation in the
labor market, earnings and fertility-related questions for women.
The dependent variables in the regressions are the difference between post- and pre- Pilkada
expenditures (total, development and routine) for education, health and all sectors combined and
budget deficit for all sectors combined.24
Education and health sectors are considered separately
given that these represent key public services that are likely to matter for human development
outcomes. Even though no treatment effect (of direct elections) is found for health expenditures,
these are still important to analyze separately since average health expenditure for all districts
increased between pre- and post-Pilkada periods (see Figure 4 and Table 1). We do not attempt to
conduct a separate analysis for other sectors (e.g. transport, agriculture, housing) since information
on the pre-decentralization status of public services in these sectors is not available.
24 Actually, the dependent variable is (expenditures in 2006 - average expenditures during the period 2001-05).
26
Among the independent variables, a number of indicators capture the status of public
services in education and health in the district prior to decentralization (in or before 2001). These
include the actual stock of facilities such as the number of different types of schools, health facilities
and doctors; and the coverage rate of public services, proxied by enrollment and attendance rates,
access to nearest facilities, years of education for the population, proportion of births attended by
health professionals, and proportion of outpatients in public health facilities. The vector includes
variables that capture the initial economic and fiscal conditions of the district, namely the poverty
rate, per capita real GDP of the district and total expenditure of DPRD in 2001, an index of
industrialization, political and institutional conditions, proxied by a political fragmentation index
(2004), the size of bureaucracy and wage bill of civil servants, and variables related to corruption and
its coverage by the media (see Annex C for detailed description of variables).25
A rural/urban
dummy and dummies for the different regions (islands) are added to allow for spatial differences.
Table 5
The full set of regression estimates can be found in Annex C, Tables C1-C3. Table 5
summarizes the regressions estimates for the main variables of interest. Overall, we do not find any
strong evidence that in the districts that had direct elections, the changes in expenditures of district
governments from pre- to post-direct election periods are responsive to the observable needs of
districts (Table 5). It should be noted, that at least the results do not suggest a perverse relationship,
which is to say higher investment in districts with lower need. Change in education expenditures, for
example, is negatively correlated with the initial stock of senior high schools in the district,
suggesting some responsiveness to the educational needs of a district. However, almost all of the
other indicators for the pre-decentralization status of public services in education or health are
insignificant as determinants of change in expenditures.
Political and institutional factors have some influence on changes in expenditures from pre-
to post-Pilkada period, and more frequently so in the districts that had direct elections than in the
districts that did not. However, the implications of these coefficients are unclear. The change in
health expenditures is smaller when the extent of political fragmentation, size of bureaucracy and
incidence of corruption cases are lower in the district. Size of bureaucracy and corruption also
25 Access to schools and health facilities and level of industrialization are proxied by principal component indices constructed from multiple variables (see Annex C, Table C-3 for a description of each index).
27
influence the change in education and total expenditures in the same direction. DPRD expenditures
and real per capita GDP of the district in the pre-decentralization period (2001) have a strong
influence on sectoral and total expenditures. Expenditures on health and education increase more
for districts that were richer and had higher DPRD expenditures before decentralization started.
The role of the above factors in explaining expenditure trends, while less relevant to our
primary question of whether expenditures are responsive to needs, hints at interesting relationships
that merit future research. The inverse relationship seen between expenditure increases, and size of
bureaucracy and incidence of corruption, indirectly implies that higher post-Pilkada expenditures in
treatment districts may not have led to greater corruption and inefficiencies. On the other hand, the
strong positive relationship between increase in expenditures, and the initial value of district
government expenditure and district GDP, suggests a path dependency of fiscal outcomes. This may
imply that any pre-existing inefficiencies in expenditures and inequities in the allocation of public
resources (favoring better-off districts) would have persisted in the post-Pilkada period as well.
Thus, after controlling for the role played by economic, political and institutional factors, we
do not find any strong evidence that district government expenditures in education and health
correlate with the status of public services in a district. The direction of correlations is consistent
with the proposition that the increase in expenditures in districts where direct elections were held,
from pre- to post- Pilkada periods, was in part responsive to the needs of citizens. However, the
degree of responsiveness appears to be small, both in terms of the number of indicators that
influence expenditure trends and the size of the effects, and overshadowed by the effects of the pre-
existing economic condition and expenditures of the districts.
7. Conclusions
Our results suggest that electoral reforms that promote grassroots democracy did make a
difference in the way local governments function in Indonesia. The reforms, which introduced direct
elections to elect district government heads in a phased manner, raised the district governments‘
performance in terms of spending. While average expenditures and revenues of district governments
increased between 2005 and 2006 when all districts are considered, districts in which direct elections
were held experienced an additional and significant increase in expenditures and revenues. Also,
28
revenues outpaced spending, with the result that the net impact was a widening (shrinking) of the
budget surplus (deficit) as a result of the reform.
Our analysis also suggests that electoral reforms led to higher revenue generation from own
sources. A priori (as argued in Section 3), we were ambiguous about the direction of the impact of
direct elections on own source revenue generation, due to the competing effects of the need to
increase expenditures on the one hand and the political difficulty of increasing local taxes on the
other. That we find revenues from own sources increasing in the districts with directly elected heads
seems to suggest that the former effect dominates in the case of Pilkada. The idea that local
politicians may reduce local tax raising efforts to increase their chances of re-election is also
contradicted by our finding that revenue from own sources increases even in the case of districts with
local elections in the near horizon (1-2 years away). These results, along with the findings of positive
impacts on budget surplus, seem to suggest that increased electoral accountability for local
governments was associated with a more prudent approach to fiscal balances even as spending
increased.
Given the sequencing of reforms in Indonesia, our findings can be seen as the effects of
political decentralization in a setting where the legal and institutional framework of fiscal
decentralization was already in place. By isolating the impact of political decentralization in the form
of electoral reforms from other aspects of decentralization, our analysis complements a recent paper
that finds positive impact of decentralization on the investments and responsiveness of local
governments (Faguet, 2004 for Bolivia). The unique features and sequencing of political
decentralization in Indonesia also allows us to derive robust estimates of impact using a quasi-
experimental evaluation method, which is typically not possible for most countries in which such
reforms have occurred on a large scale.
A further investigation of the heterogeneity of the impacts of the electoral reform on district
expenditures and deficits revealed that the overall positive effect of electoral reforms on public
spending was primarily due to the increases in expenditures in the districts outside Java and Bali and
the changes in expenditure brought about by the non-incumbents (as opposed to incumbents or a
previous district heads) elected in the districts. The latter finding suggests that the reform influenced
the spending performance of district heads primarily when the elections resulted in a change in
leadership, and had little or no impact when an incumbent came back as the elected district head.
29
The results also suggest that the Pilkada electoral reform is an important complement to the fiscal
decentralization that originated in large part due to concerns about the secessionist sentiments in a
number of outlying provinces of the country.
A few more important questions emerge from our analysis that merit exploration in future
work. The first is related to our finding that changes in the fiscal decisions of district governments
between pre- and post-Pilkada periods are strongly affected not only by whether the district had
direct elections, but also by the expectation of direct election in the near future. In districts where
direct elections are imminent, district governments tend to have higher current expenditures on
public works. On the one hand, this finding has the positive implication that even the expectation of
a direct election in the predictable and near future is sufficient to change the incentives of district
governments, perhaps toward greater accountability and better performance. On the other hand, the
question that arises is whether the electoral reform could also have the perverse effect of inducing
spending cycles across the 434 districts of Indonesia (as of 2005) aligned with the electoral cycle, due
to the manipulation of district expenditures for the purpose of re-election. While it is far too soon to
address this question, future analysis using a longer series of electoral and fiscal data has the
potential of doing so.
The second unresolved question relates to the fact that while the impact of electoral reforms
is distributed among expenditures in a number of sectors including education, the health sector is a
notable exception. Is the lack of impact on health expenditures a reflection of citizens‘ priorities, or
are there other systemic factors that have made it hard for district governments to raise investments
in health?
Our analysis is also inconclusive about whether electoral reforms lead to better quality and
availability of services provided by the district government. While we do not find any impact of
direct elections on human development outcomes in the two years since direct elections, these
results may have explanations other than an absence of actual impact. The few indicators we
measure the impact on, namely outcomes in education and health, may not be the most appropriate
to capture improvements in the first place or take more time to change than what we have allowed
for. Tracking a more expanded set of outcome or service delivery indicators over a longer period of
time is therefore an important area for follow-up work.
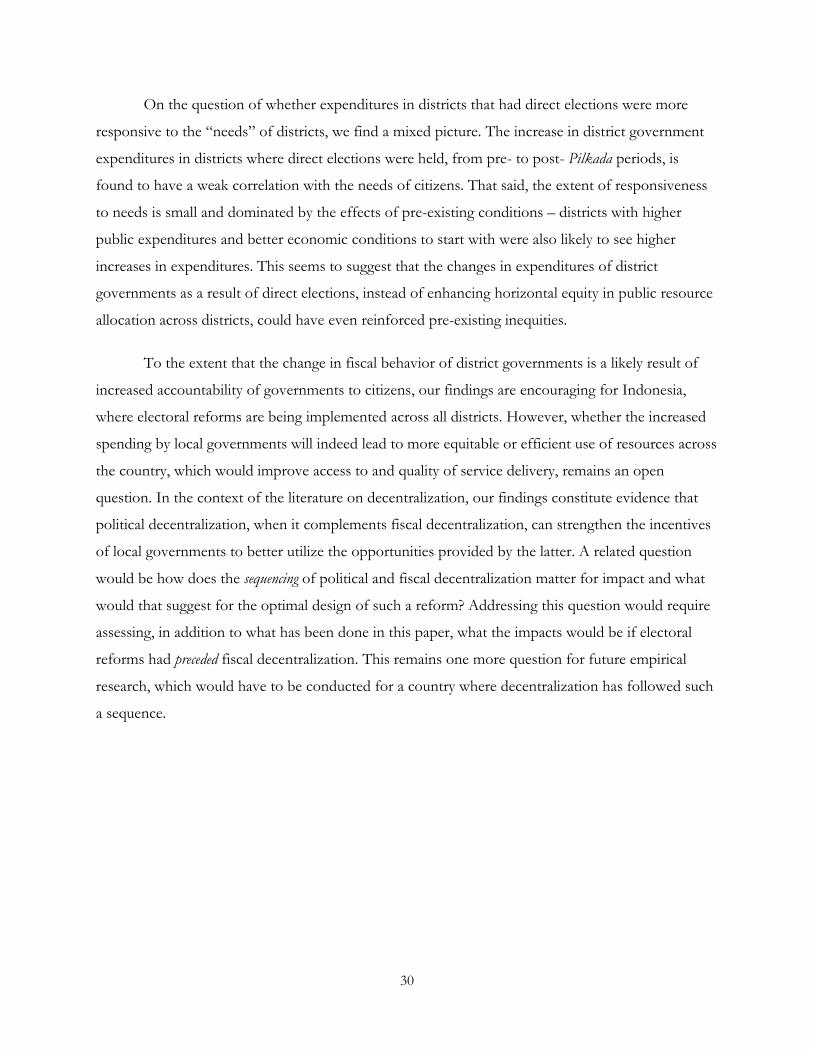
30
On the question of whether expenditures in districts that had direct elections were more
responsive to the ―needs‖ of districts, we find a mixed picture. The increase in district government
expenditures in districts where direct elections were held, from pre- to post- Pilkada periods, is
found to have a weak correlation with the needs of citizens. That said, the extent of responsiveness
to needs is small and dominated by the effects of pre-existing conditions – districts with higher
public expenditures and better economic conditions to start with were also likely to see higher
increases in expenditures. This seems to suggest that the changes in expenditures of district
governments as a result of direct elections, instead of enhancing horizontal equity in public resource
allocation across districts, could have even reinforced pre-existing inequities.
To the extent that the change in fiscal behavior of district governments is a likely result of
increased accountability of governments to citizens, our findings are encouraging for Indonesia,
where electoral reforms are being implemented across all districts. However, whether the increased
spending by local governments will indeed lead to more equitable or efficient use of resources across
the country, which would improve access to and quality of service delivery, remains an open
question. In the context of the literature on decentralization, our findings constitute evidence that
political decentralization, when it complements fiscal decentralization, can strengthen the incentives
of local governments to better utilize the opportunities provided by the latter. A related question
would be how does the sequencing of political and fiscal decentralization matter for impact and what
would that suggest for the optimal design of such a reform? Addressing this question would require
assessing, in addition to what has been done in this paper, what the impacts would be if electoral
reforms had preceded fiscal decentralization. This remains one more question for future empirical
research, which would have to be conducted for a country where decentralization has followed such
a sequence.
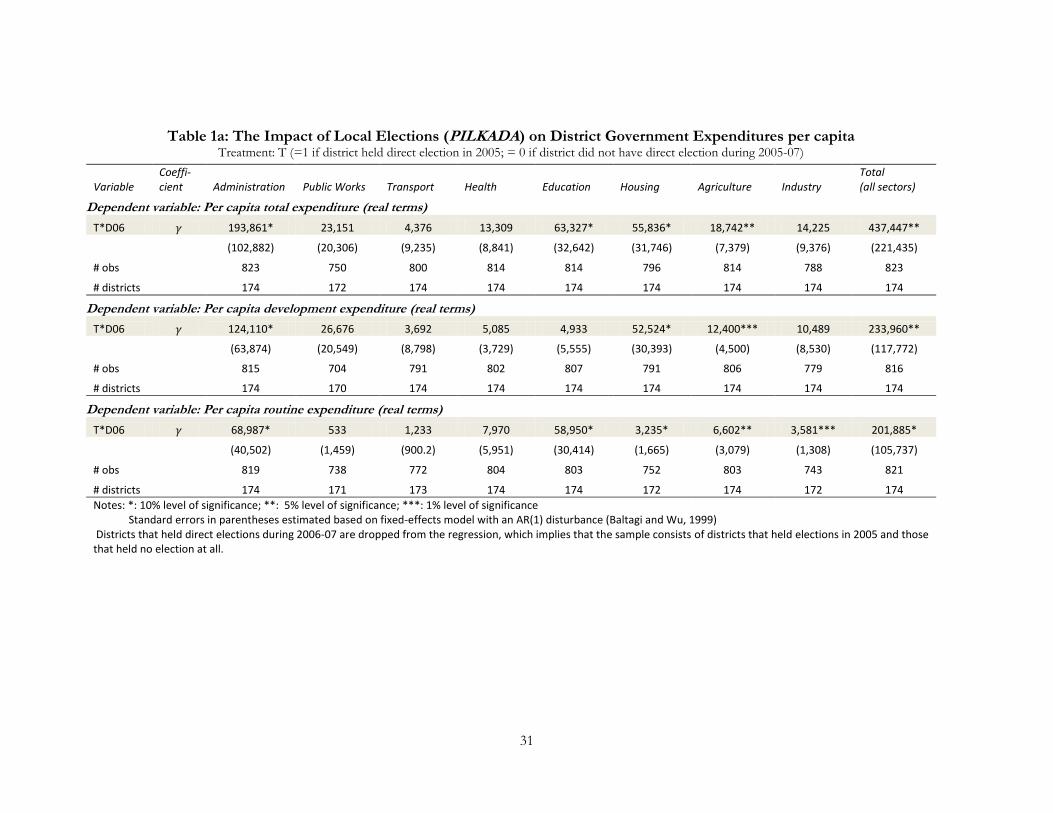
31
Table 1a: The Impact of Local Elections (PILKADA) on District Government Expenditures per capita Treatment: T (=1 if district held direct election in 2005; = 0 if district did not have direct election during 2005-07)
Variable Coeffi-cient Administration Public Works Transport Health Education Housing Agriculture Industry
Total (all sectors)
Dependent variable: Per capita total expenditure (real terms)
T*D06 193,861* 23,151 4,376 13,309 63,327* 55,836* 18,742** 14,225 437,447**
(102,882) (20,306) (9,235) (8,841) (32,642) (31,746) (7,379) (9,376) (221,435)
# obs 823 750 800 814 814 796 814 788 823
# districts 174 172 174 174 174 174 174 174 174
Dependent variable: Per capita development expenditure (real terms)
T*D06 124,110* 26,676 3,692 5,085 4,933 52,524* 12,400*** 10,489 233,960**
(63,874) (20,549) (8,798) (3,729) (5,555) (30,393) (4,500) (8,530) (117,772)
# obs 815 704 791 802 807 791 806 779 816
# districts 174 170 174 174 174 174 174 174 174
Dependent variable: Per capita routine expenditure (real terms)
T*D06 68,987* 533 1,233 7,970 58,950* 3,235* 6,602** 3,581*** 201,885*
(40,502) (1,459) (900.2) (5,951) (30,414) (1,665) (3,079) (1,308) (105,737)
# obs 819 738 772 804 803 752 803 743 821
# districts 174 171 173 174 174 172 174 172 174
Notes: *: 10% level of significance; **: 5% level of significance; ***: 1% level of significance Standard errors in parentheses estimated based on fixed-effects model with an AR(1) disturbance (Baltagi and Wu, 1999) Districts that held direct elections during 2006-07 are dropped from the regression, which implies that the sample consists of districts that held elections in 2005 and those that held no election at all.
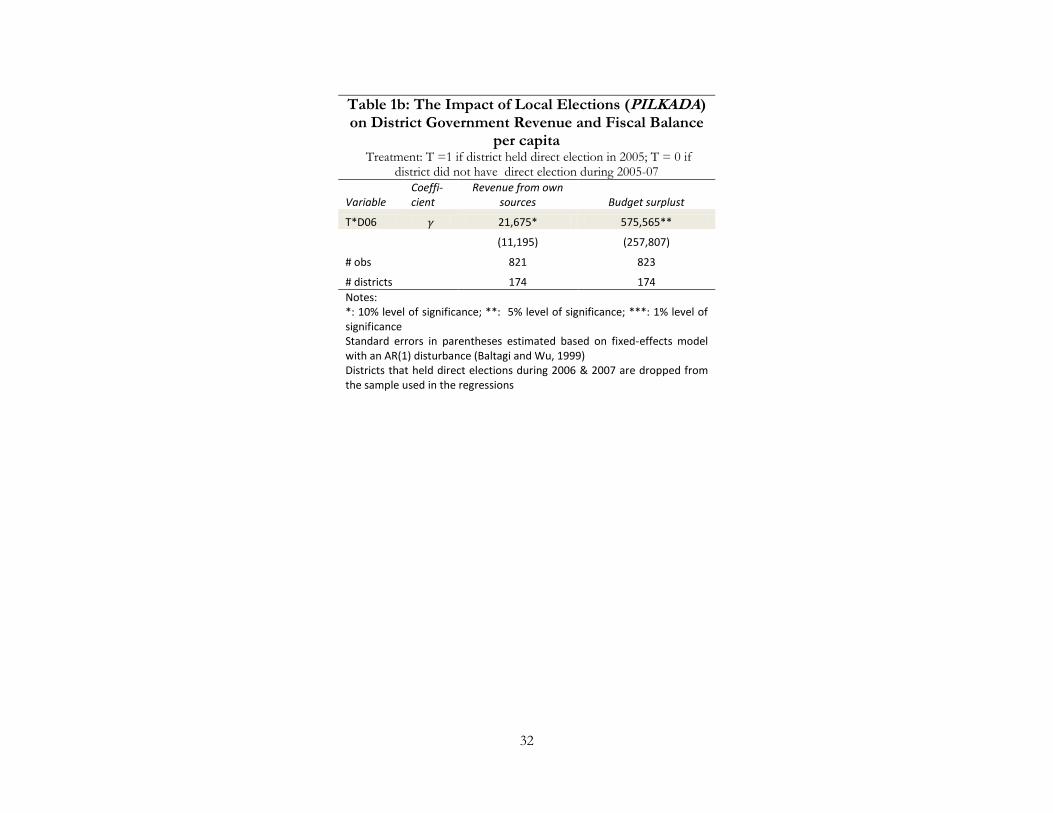
32
Table 1b: The Impact of Local Elections (PILKADA) on District Government Revenue and Fiscal Balance
per capita Treatment: T =1 if district held direct election in 2005; T = 0 if
district did not have direct election during 2005-07
Variable Coeffi-cient
Revenue from own sources Budget surplust
T*D06 21,675* 575,565**
(11,195) (257,807)
# obs 821 823
# districts 174 174
Notes: *: 10% level of significance; **: 5% level of significance; ***: 1% level of significance Standard errors in parentheses estimated based on fixed-effects model with an AR(1) disturbance (Baltagi and Wu, 1999) Districts that held direct elections during 2006 & 2007 are dropped from the sample used in the regressions
33
Table 2a: The impact of Local Elections (PILKADA) on District Government Expenditures per capita by Region Treatment: T =1 if district held direct election in 2005; T = 0 if district did not have direct election during 2005-07
Variable Coeffi-cient Administration Public Works Transport Health Education Housing Agriculture Industry
Total (all sectors)
Districts outside Java and Bali vs. Comparison Districts
T*D06 378,894*** 86,316*** 7,178 35,983*** 135,161*** 108,830** 38,318*** 26,828** 905,669***
(138,985) (27,941) (12,396) (11,819) (43,910) (43,298) (9,890) (12,888) (298,317)
# obs 607 542 592 599 599 583 599 577 607
# districts 130 128 130 130 130 130 130 130 130
Districts in Java and Bali vs. Comparison Districts
T*D06 -28,573** -44,367*** 2,925 -13,667*** -22,708** -5,871 -4,664** 766.6 -123,761***
(14,085) (11,426) (4,476) (4,032) (9,734) (3,956) (1,860) (2,184) (38,177)
# obs 569 535 551 564 564 555 564 555 569
# districts 118 118 118 118 118 118 118 118 118
Notes: *: 10% level of significance; **: 5% level of significance; ***: 1% level of significance Standard errors in parentheses estimated based on fixed-effects model with an AR(1) disturbance (Baltagi and Wu, 1999) Districts that held direct elections during 2006 and 2007 are dropped from the sample used in the regressions
34
Table 2b: The Impact of Local Elections (PILKADA) on District Government Revenue and Fiscal Balance per capita
by Region Treatment: T =1 if district held direct election in 2005; T = 0 if district did not
have direct election during 2005-07
Variable Coeffi-cient Revenue from own sources Budget surplus
Districts outside Java and Bali vs. Comparison Districts
T*D06 45,725*** 1.056e+06***
(14,764) (348,511)
# obs 605 607
# districts 130 130
Districts in Java and Bali vs. Comparison Districts
T*D06 -6,532 312.5
(5,496) (23,262)
# obs 567 569
# districts 118 118 Notes: *: 10% level of significance; **: 5% level of significance; ***: 1% level of significance Standard errors in parentheses estimated based on fixed-effects model with an AR(1) disturbance (Baltagi and Wu, 1999) Districts that held direct elections during 2006 & 2007 are dropped from the sample used in the regressions
35
Table 3a: The impact of Local Elections (PILKADA) on District Government Expenditures per capita: Incumbents vs. Controls and Non-Incumbents vs. Controls
Treatment: T =1 if district held direct election in 2005; T = 0 if district did not have direct election during 2005-07
Variable Coeffi-cient Administration Public Works Transport Health Education Housing Agriculture Industry
Total (all sectors)
PILKADA Districts where incumbents were re-elected vs. Comparison Districts
T*D06 41,015* 24,515 -4,659 1,467 32,346 14,835* 6,593** 5,342* 125,201
(21,132) (20,605) (6,478) (4,903) (20,091) (7,623) (3,218) (2,772) (76,477)
# obs 605 563 593 600 600 584 600 587 605
# districts 127 126 127 127 127 127 127 127 127
PILKADA Districts where non-incumbents (new heads) were elected vs. Comparison Districts
T*D06 370,642** 16,109 14,920 27,237** 99,389** 102,368** 32,934*** 25,268* 800,965**
(149,375) (22,259) (12,532) (12,449) (43,785) (45,751) (10,389) (13,744) (315,556)
# obs 571 514 550 563 563 554 563 545 571
# districts 121 120 121 121 121 121 121 121 121
Notes: *: 10% level of significance; **: 5% level of significance; ***: 1% level of significance Standard errors in parentheses estimated based on fixed-effects model with an AR(1) disturbance (Baltagi and Wu, 1999) Districts that held direct elections during 2006 & 2007 are dropped from the sample used in the regressions.
36
Table 3b: The Impact of Local Elections (PILKADA) on District Government Revenue and Fiscal Balance
per capita: Incumbents vs. Controls and Non-Incumbents vs. Controls
Treatment: T =1 if district held direct election in 2005; T = 0 if district did not have direct election during 2005-07
Variable Coeffi-cient
Revenue from own sources Budget surplus
PILKADA Districts where incumbents were re-elected vs. Comparison Districts
T*D06 12,499 202,093***
(7,958) (74,650)
# obs 603 605
# districts 127 127
PILKADA Districts where non-incumbents (new heads) were elected vs. Comparison Districts
T*D06 32,696* 1.009e+06***
(14,610) (369,377)
# obs 569 571
# districts 121 121
Notes: *: 10% level of significance; **: 5% level of significance; ***: 1% level of significance Standard errors in parentheses estimated based on fixed-effects model with an AR(1) disturbance (Baltagi and Wu, 1999) Districts that held direct elections during 2006 & 2007 are dropped from the sample used in the regressions.
37
Table 4a: The Impact of Expected Local Elections on District Government Expenditures per capita Treatment: T =1 if district held direct election in 2006 or 2007; T =0 if district did not have direct election during 2005-2007
Variable Coeffi-cient Administration Public Works Transport Health Education Housing Agriculture Industry
Total (all sectors)
Dependent variable: Per capita total expenditure (real terms)
T*D06 129,244** 227,473** -28.10 14,562 71,919* 35,087** 33,648** 7,009* 526,141**
(62,521) (92,267) (14,569) (9,849) (42,642) (16,522) (14,113) (4,009) (219,858)
# obs 598 546 583 594 594 572 594 576 598
# districts 133 131 132 133 133 132 133 133 133
Dependent variable: Per capita development expenditure (real terms)
T*D06 68,352* 227,993** 499.5 6,746 31,929* 28,722* 24,707** 5,367 329,402**
(40,315) (95,717) (14,559) (5,949) (16,383) (15,256) (11,800) (3,991) (146,076)
# obs 594 511 578 587 589 570 586 570 596
# districts 133 128 132 133 133 132 133 133 133
Dependent variable: Per capita routine expenditure (real terms)
T*D06 63,648** 2,904 741.3 7,948* 46,414 7,060*** 10,587*** 1,873*** 194,073**
(25,171) (1,853) (694.4) (4,791) (28,329) (2,044) (3,038) (501.9) (77,148)
# obs 592 533 559 585 585 542 584 547 597
# districts 133 131 131 133 133 131 133 131 133
Note: *: 10% level of significance; **: 5% level of significance; ***: 1% level of significance Standard errors in parentheses estimated based on fixed-effects model with an AR(1) disturbance (Baltagi and Wu, 1999)
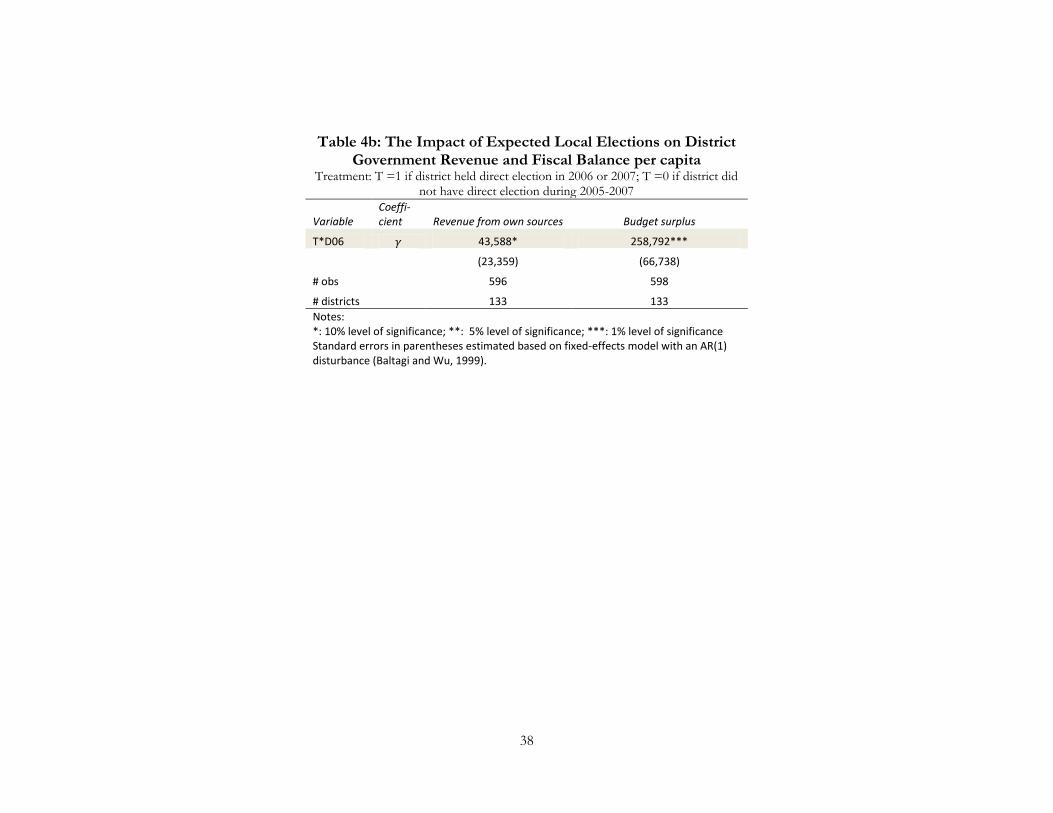
38
Table 4b: The Impact of Expected Local Elections on District Government Revenue and Fiscal Balance per capita
Treatment: T =1 if district held direct election in 2006 or 2007; T =0 if district did not have direct election during 2005-2007
Variable Coeffi-cient Revenue from own sources Budget surplus
T*D06 43,588* 258,792***
(23,359) (66,738)
# obs 596 598
# districts 133 133
Notes: *: 10% level of significance; **: 5% level of significance; ***: 1% level of significance Standard errors in parentheses estimated based on fixed-effects model with an AR(1) disturbance (Baltagi and Wu, 1999).
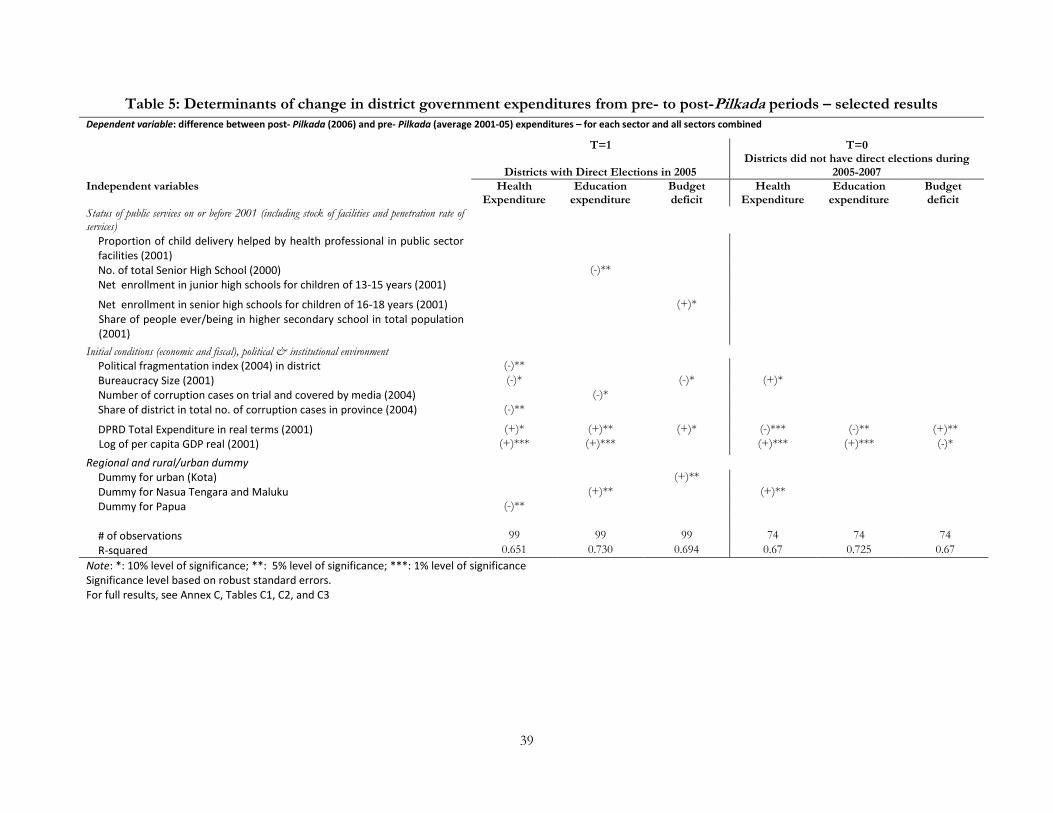
39
Table 5: Determinants of change in district government expenditures from pre- to post-Pilkada periods – selected results
Dependent variable: difference between post- Pilkada (2006) and pre- Pilkada (average 2001-05) expenditures – for each sector and all sectors combined
T=1
Districts with Direct Elections in 2005
T=0 Districts did not have direct elections during
2005-2007
Independent variables Health Expenditure
Education expenditure
Budget deficit
Health Expenditure
Education expenditure
Budget deficit
Status of public services on or before 2001 (including stock of facilities and penetration rate of services)
Proportion of child delivery helped by health professional in public sector facilities (2001)
No. of total Senior High School (2000) (-)**
Net enrollment in junior high schools for children of 13-15 years (2001)
Net enrollment in senior high schools for children of 16-18 years (2001) (+)*
Share of people ever/being in higher secondary school in total population (2001)
Initial conditions (economic and fiscal), political & institutional environment
Political fragmentation index (2004) in district (-)**
Bureaucracy Size (2001) (-)* (-)* (+)*
Number of corruption cases on trial and covered by media (2004) (-)*
Share of district in total no. of corruption cases in province (2004) (-)**
DPRD Total Expenditure in real terms (2001) (+)* (+)** (+)* (-)*** (-)** (+)**
Log of per capita GDP real (2001) (+)*** (+)*** (+)*** (+)*** (-)*
Regional and rural/urban dummy Dummy for urban (Kota) (+)**
Dummy for Nasua Tengara and Maluku (+)** (+)**
Dummy for Papua (-)**
# of observations 99 99 99 74 74 74
R-squared 0.651 0.730 0.694 0.67 0.725 0.67
Note: *: 10% level of significance; **: 5% level of significance; ***: 1% level of significance Significance level based on robust standard errors. For full results, see Annex C, Tables C1, C2, and C3
- 40 -
References
Acemoglu, Daron, James A. Robinson, 2006. Economic origins of dictatorship and democracy. Cambridge
University Press, Cambridge ; New York.
Ahmad, Ehtisham, Giorgio Brosio, 2009. Does decentralization enhance service delivery and poverty
reduction? Edward Elgar (Studies in fiscal federalism and state-local finance), Cheltenham:
Northampton.
Ahmad, Junaid, Shanta Devarajan, Stuti Khemani, Shekhar Shah, 2005. Decentralization and Service Delivery,
Policy Research Working Paper. World Bank, Washington, DC.
Alesina,A., Roubini, N., and Cohen, G.D. 1997. Political Cycles and the Macrcoeconomy. MIT Press,
Cambridge and London.
Baltagi, B.H., and P. X. Wu, 1999, "Unequally Spaced Panel data Regressiosn with AR(1) Disturbances,"
Econometric Theory, 15: 814-823
Bardhan, P., D. Mookherjee, 2006. Decentralization and Accountability in Infrastructure Delivery in
Developing Countries. Economic Journal 116, 101-127.
Bertrand, Marianne, Esther Duflo, and Senhil Mullainathan, 2004 "How Much Should we Trust Differences
in Differences Estimates?" The Quarterly Journal of Economics, (February), , pp. 249-275.
Besley, Timothy, and Anne Case , 1995. "Does Electoral accountability Affect Economic Policy Choices?
Evidence from Gubernatorial Terms Limits," The Quarterly Journal of Economics, (August), , pp. 769-798
Besley, Timothy, and Anne Case , 1993. "Does Electoral accountability Affect Economic Policy Choices?
Evidence from Gubernatorial Terms Limits," National Bureau of Economic Research
(Cambridge,MA) Working Paper No. 4575.
Besley, Timothy, 2005. Political Selection. Journal of Economic Perspectives 19, 43-60.
Brown, Graham, Rachael Diprose, 2007. Bare-Chested Politics in Central Sulawesi, Indonesia: The Dynamics
of Local Elections in a ‗Post‘-Conflict Region. Centre for Research on Inequality, Human Security
and Ethnicity, CRISE Working Paper 37 (November), Oxford.
Delavallade, Clara, 2006. Corruption and Distribution of Public Spending in Developing Countries. Journal
of Economics and Finance 30, 222-239.
Delavallade, Clara, 2009. Corruption and Distribution of Public Spending in Developing Countries.
Economics of Governance.
Devarajan, Shanta, Stuti Khemani, Shekar Shah, 2009. The Politics of Partial Decentralization. In: Ahmad,
Ehtisham, Giorgio Brosio, (Eds.), Does decentralization enhance service delivery and poverty
reduction? Edward Elgar, Cheltenham ; Northampton, pp. 79-101.
- 41 -
Drazen, A. 2000. The Political Business Cycle After 25 Years. NBER Macroeconomic Annual. MIT Press,
Cambridge, MA
Eaton, Kent, Kai Kaiser, Paul Smoke, 2010. The Political-Economy of Decentralization Reforms: A
Development Partner Perspective. Workshop Draft for World Bank, DC on April 12, pp. 114,
Washington, DC.
Erb, Maribeth, Priyambudi Sulistiyanto, 2009. Deepening Democracy in Indonesia? Direct Elections for
Local Leaders (Pilkada). Institute for South East Asian Studies, Signapore.
Faguet, Jean-Paul, 2004. Does Decentralization Increase Government Responsiveness to Local Needs?
Evidence from Bolivia. Journal of Public Economics 88, 867-893.
Fitrani, Fitria, Bert Hofman, Kai Kaiser, 2005. Unity in Diversity? The Creation of New Regions in a
Decentralizing Indonesia. Bulletin of Indonesia Economic Studies 41, 57-79.
Glaesser, Edward L., Andrei Schleifer, 2005. The Curley Effect: The Economics of Shaping the Electorate.
Journal of Law, Economics, and Organization.
Grier R., and Grier, K. 2000. "Political Cycles, in Non-Traditional Settings: Theory and Evidence from the
case of Mexico," Journal of Law and Economcis, 43, (1), 239-263.
Hofman, Bert, Kai Kaiser, 2004. The Making of the Big Bang and its Aftermath: A Political Economy
Perspective, Reforming intergovernmental fiscal relations and the rebuilding of Indonesia : the "big
bang" program and its economic consequences. Edward Elgar (Studies in fiscal federalism and state-
local finance), Cheltenham, UK ; Northampton, MA, pp. viii, 360 p.
Hofman, Bert, Kadjatmiko, Kai Kaiser, and Bambang Suharnoko Sjahrir 2006. "Evaluating Fiscal
Decentralization in Indonesia" Policy Research Working Paper no. 3911, (May) World Bank,
Washington, DC.
Hofman, Bert, Kai Kaiser, 2006. Decentralization, Democratic Transition, and Local Governance in
Indonesia. In: Bardhan, Pranab, Dilip Mookherjee, (Eds.), Decentralization and Local Governance in
Developing Countries: A Comparative Perspective. MIT Press, Cambridge, MA.
Imbens, G., J. M. Wooldridge, 2009. Recent Developments in the Econometrics of Program Evaluation.
Journal of Economic Literature 47, 5-86.
Kaiser, Kai, 2006. Decentralization Reforms, Analyzing the Distributional Impact of Selected Service
Reforms. The World Bank Group, Washington, DC, pp. 313-353.
Kaiser, Kai, Daan Pattinasarany, Günther G. Schulze, 2005. Decentralization, Governance and Public
Services in Indonesia. In: Peterson, George, Paul Smoke, Eduardo J. Gómez, (Eds.),
Decentralization in Latin America and Asia: An Inter-Disciplinary Perspective Edward Elgar Press
(draft, prepared for forthcoming volume), Cheltenham/UK.
- 42 -
Keefer, Philip, Stephen Knack, 2007. Boondoggles, Rent-Seeking, and Political Checks and Balances: Public
Investment Under Unaccountable Governments. Review of Economics and Statistics 89, 566-571.
Keefer, Philip, Razvan Vlaicu, 2007. Democracy, Credibility and Clientelism. Journal of Law, Economics, and
Organization 24, 371-406.
Khemani, Stuti, 2004. "Political Cycles in a Developing Economy: Effect of Elections in the Indian States,"
Journal of Development Economics, 73, 125-154.
Lederman, Daniel, Norman Loayza, Rodrigo R. Soares, 2004. Accountability and Corruption: Political
Institutions Matter. Policy Working Paper, Washington, DC.
Lewis, Blane, 2005. Indonesia Local Government Spending, Taxing and Saving: An Explanation of Pre- and
Post-Decentralization Fiscal Outcomes. Asian Economic Journal 19, 291-317.
Lewis, Blane, 2007. On-Lending in Indonesia: Past Performance and Future Prospects. Bulletin of Indonesia
Economic Studies 43, 35-57.
Malley, Michael, 2003. New Rules, Old Structures and the Limits of Democratic Decentralization. In:
Aspinall, Edward, Greg Fealy, (Eds.), Local Power and Politics in Indonesia: Decentralization &
Democratisation. Indonesia Update Series, Research School of Pacific and Asian Studies, The
Australian National University, Jakarta, pp. 102-118.
Mietzner, Marcus, 1997. Party Financing in Post Soeharto Indonesia: Between State Subsidies and Political
Corruption. Contemporary Southeast Asia 29, 238-263.
Persson, Torsten, Guido Tabellini, 2006. Electoral Systems and Economic Policy. In: Weingast, Barry R.,
Donald A. Wittman, (Eds.), The Oxford Handbook of Political Economy. Oxford University Press,
Oxford, pp. 723-738.
Temple, Jonathan, 2001. Growing into trouble: Indonesia after 1966. University of Bristol, Bristol.
Tsai, Lili, 2007. Accountability without Democracy: Solidarity Groups and Public Goods Provision in Rural
China. Cambridge University Press, Cambridge, MA.
World Bank, 2003. Decentralizing Indonesia: A Regional Public Expenditure Overview Report. The World
Bank, Washington D.C.
World Bank, 2007. Spending for Development: Making the Most of Indonesia's New Opportunities.
Indomesia Public Expenditure Review 2007. The World Bank, Washington D.C. .
World Bank, 2004. World Development Report 2004 -- Making Services Work for Poor People. The World
Bank, Washington, D.C.
Zhang, X., S. Fan, L. Zhang, J. Huang, 2004. Local Governance and public goods provision in rural China.
Journal of Public Economics 88, 2857-2871.
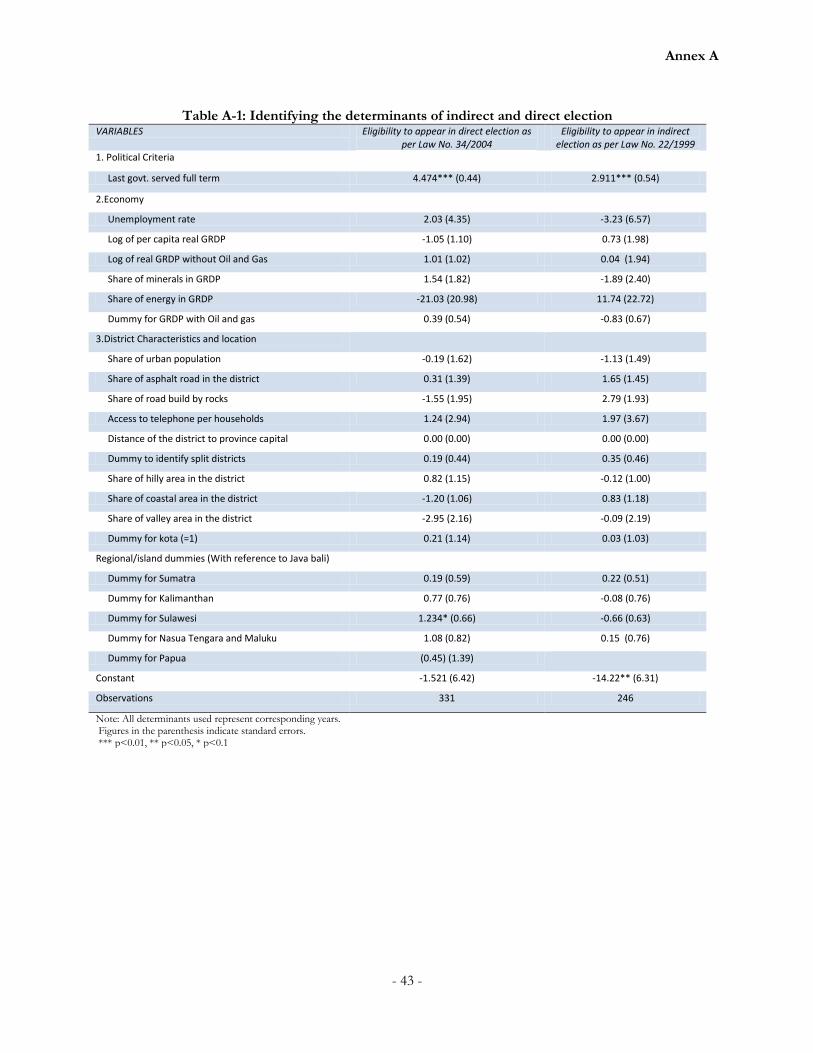
Annex A
- 43 -
Table A-1: Identifying the determinants of indirect and direct election
VARIABLES Eligibility to appear in direct election as per Law No. 34/2004
Eligibility to appear in indirect election as per Law No. 22/1999
1. Political Criteria
Last govt. served full term 4.474*** (0.44) 2.911*** (0.54)
2.Economy
Unemployment rate 2.03 (4.35) -3.23 (6.57)
Log of per capita real GRDP -1.05 (1.10) 0.73 (1.98)
Log of real GRDP without Oil and Gas 1.01 (1.02) 0.04 (1.94)
Share of minerals in GRDP 1.54 (1.82) -1.89 (2.40)
Share of energy in GRDP -21.03 (20.98) 11.74 (22.72)
Dummy for GRDP with Oil and gas 0.39 (0.54) -0.83 (0.67)
3.District Characteristics and location
Share of urban population -0.19 (1.62) -1.13 (1.49)
Share of asphalt road in the district 0.31 (1.39) 1.65 (1.45)
Share of road build by rocks -1.55 (1.95) 2.79 (1.93)
Access to telephone per households 1.24 (2.94) 1.97 (3.67)
Distance of the district to province capital 0.00 (0.00) 0.00 (0.00)
Dummy to identify split districts 0.19 (0.44) 0.35 (0.46)
Share of hilly area in the district 0.82 (1.15) -0.12 (1.00)
Share of coastal area in the district -1.20 (1.06) 0.83 (1.18)
Share of valley area in the district -2.95 (2.16) -0.09 (2.19)
Dummy for kota (=1) 0.21 (1.14) 0.03 (1.03)
Regional/island dummies (With reference to Java bali)
Dummy for Sumatra 0.19 (0.59) 0.22 (0.51)
Dummy for Kalimanthan 0.77 (0.76) -0.08 (0.76)
Dummy for Sulawesi 1.234* (0.66) -0.66 (0.63)
Dummy for Nasua Tengara and Maluku 1.08 (0.82) 0.15 (0.76)
Dummy for Papua (0.45) (1.39)
Constant -1.521 (6.42) -14.22** (6.31)
Observations 331 246
Note: All determinants used represent corresponding years. Figures in the parenthesis indicate standard errors. *** p<0.01, ** p<0.05, * p<0.1
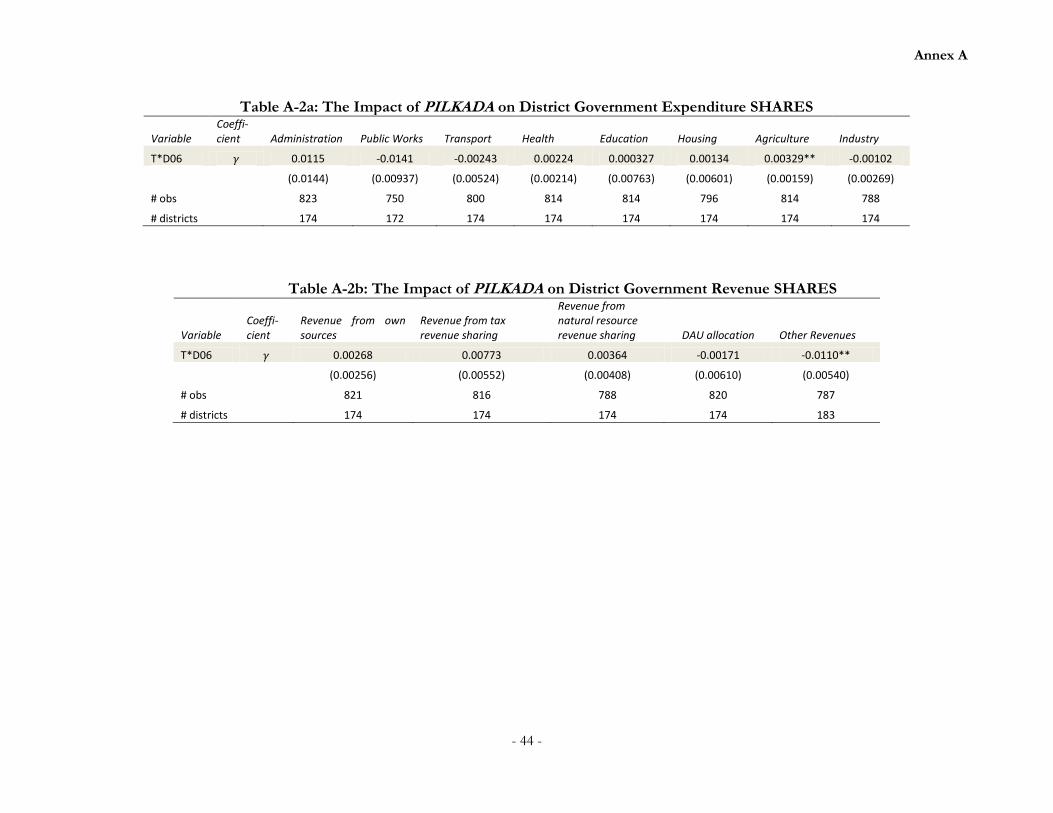
Annex A
- 44 -
Table A-2a: The Impact of PILKADA on District Government Expenditure SHARES
Variable Coeffi-cient Administration Public Works Transport Health Education Housing Agriculture Industry
T*D06 0.0115 -0.0141 -0.00243 0.00224 0.000327 0.00134 0.00329** -0.00102
(0.0144) (0.00937) (0.00524) (0.00214) (0.00763) (0.00601) (0.00159) (0.00269)
# obs 823 750 800 814 814 796 814 788
# districts 174 172 174 174 174 174 174 174
Table A-2b: The Impact of PILKADA on District Government Revenue SHARES
Variable Coeffi-cient
Revenue from own sources
Revenue from tax revenue sharing
Revenue from natural resource revenue sharing DAU allocation Other Revenues
T*D06 0.00268 0.00773 0.00364 -0.00171 -0.0110**
(0.00256) (0.00552) (0.00408) (0.00610) (0.00540)
# obs 821 816 788 820 787
# districts 174 174 174 174 183
Annex B
- 45 -
Impact of direct elections on education and health outcomes
To measure the impact of direct elections on human development outcomes, we estimate equations analogous to (1) and (2) above, with the main difference that we now include observations from both 2006 and 2007 as post-Pilkada observations. This is done because any impact on outcome indicators is likely to take more time to occur than on fiscal indicators, and the availability of district level outcome indicators (from SUSENAS) up to 2007 allows us to analyze impacts over a slightly longer time horizon. The model to estimate the impact when the treatment is ―direct election‖ is given by:
mtmmt YDTYDTYDYDTO 07*06*0706 21210 (1)
where Omt is an education or health outcome for district m at time t (2001 to 2007); T and YD06 have the same definition as in (1); and YD07 takes the value 1 if the observation is for 2007 and 0 otherwise. The parameter β has the same interpretation as in (1). Parameters δ1 and δ2 identify the ―time effect‖ on the dependent variable for 2006 and 2007 respectively. DID estimates of the impact of the direct election on the dependent variable are given by γ1 and γ2 for the years 2006 and 2007, respectively.
To identify impacts of direct elections on outcomes, as opposed to expenditures and revenues, we estimate equations (3). The dependent variable is a specific education or health outcome variable for district m at time t. The health outcomes considered as dependent variables are the proportions of outpatients in public facilities and deliveries helped by public health professionals. The education outcomes considered are net enrollment and attendance rates in primary, junior secondary, and senior secondary schools.
We find that the DID estimate is insignificant for all outcomes and for both types of treatment definitions and post-Pilkada years 2006 and 2007. In other words, being in the treatment group had no impact on education and health outcomes post-Pilkada, relative to the control group (Table B-1). The time dummies (for both years 2006 and 2007) are positive and strongly significant for all outcomes and both types of definitions of treatment – with the sole exception of the dummy for 2006 on net primary enrollment rate. This suggests that while the treatment group did not show any additional improvement post-Pilkada, the average outcomes for all districts improved significantly in both 2006 and 2007.
Therefore, although we find evidence that expenditure on public services increased in districts with direct elections, the spending has not yet been translated into better outcomes in service delivery. This may because the expenditures are ineffective in improving outcomes. Alternatively, as argued before, these outcomes may not be the most appropriate to capture improvements in the first place, particularly in the quality dimension, or perhaps enough time has not elapsed for the impacts to show on outcome indicators that are often slow to change.
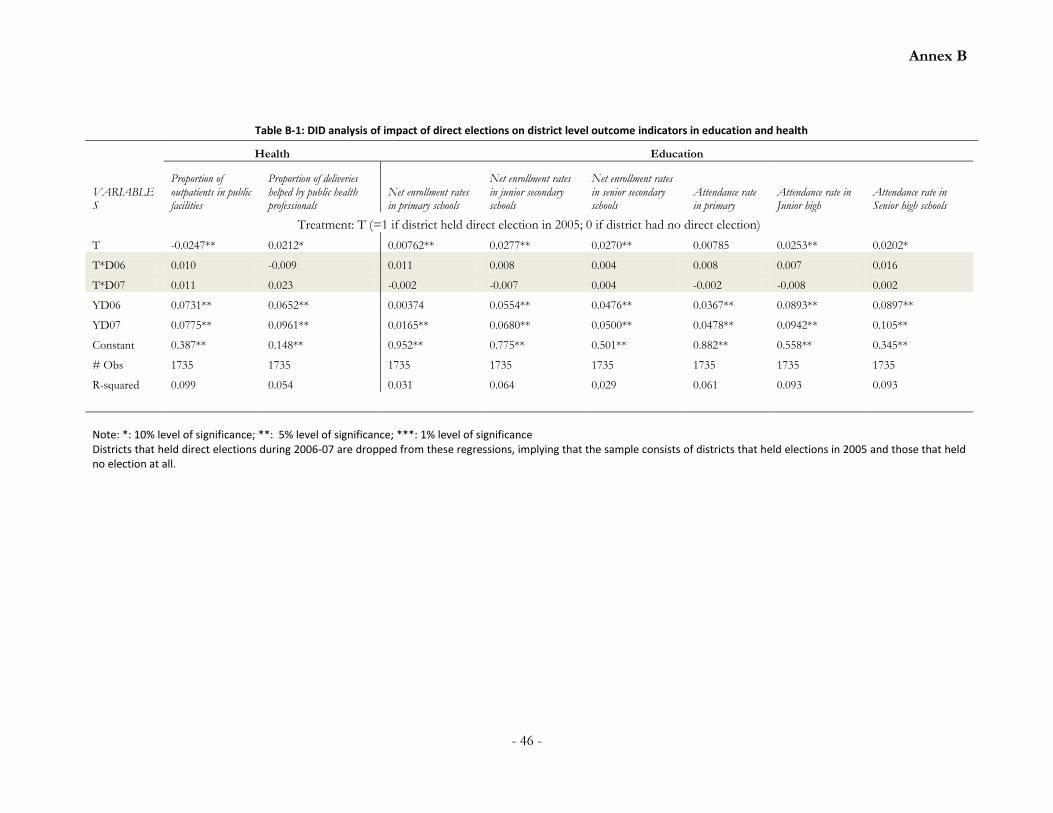
Annex B
- 46 -
Table B-1: DID analysis of impact of direct elections on district level outcome indicators in education and health
Health Education
VARIABLES
Proportion of outpatients in public facilities
Proportion of deliveries helped by public health professionals
Net enrollment rates in primary schools
Net enrollment rates in junior secondary schools
Net enrollment rates in senior secondary schools
Attendance rate in primary
Attendance rate in Junior high
Attendance rate in Senior high schools
Treatment: T (=1 if district held direct election in 2005; 0 if district had no direct election)
T -0.0247** 0.0212* 0.00762** 0.0277** 0.0270** 0.00785 0.0253** 0.0202*
T*D06 0.010 -0.009 0.011 0.008 0.004 0.008 0.007 0.016
T*D07 0.011 0.023 -0.002 -0.007 0.004 -0.002 -0.008 0.002
YD06 0.0731** 0.0652** 0.00374 0.0554** 0.0476** 0.0367** 0.0893** 0.0897**
YD07 0.0775** 0.0961** 0.0165** 0.0680** 0.0500** 0.0478** 0.0942** 0.105**
Constant 0.387** 0.148** 0.952** 0.775** 0.501** 0.882** 0.558** 0.345**
# Obs 1735 1735 1735 1735 1735 1735 1735 1735
R-squared 0.099 0.054 0.031 0.064 0.029 0.061 0.093 0.093
Note: *: 10% level of significance; **: 5% level of significance; ***: 1% level of significance Districts that held direct elections during 2006-07 are dropped from these regressions, implying that the sample consists of districts that held elections in 2005 and those that held no election at all.
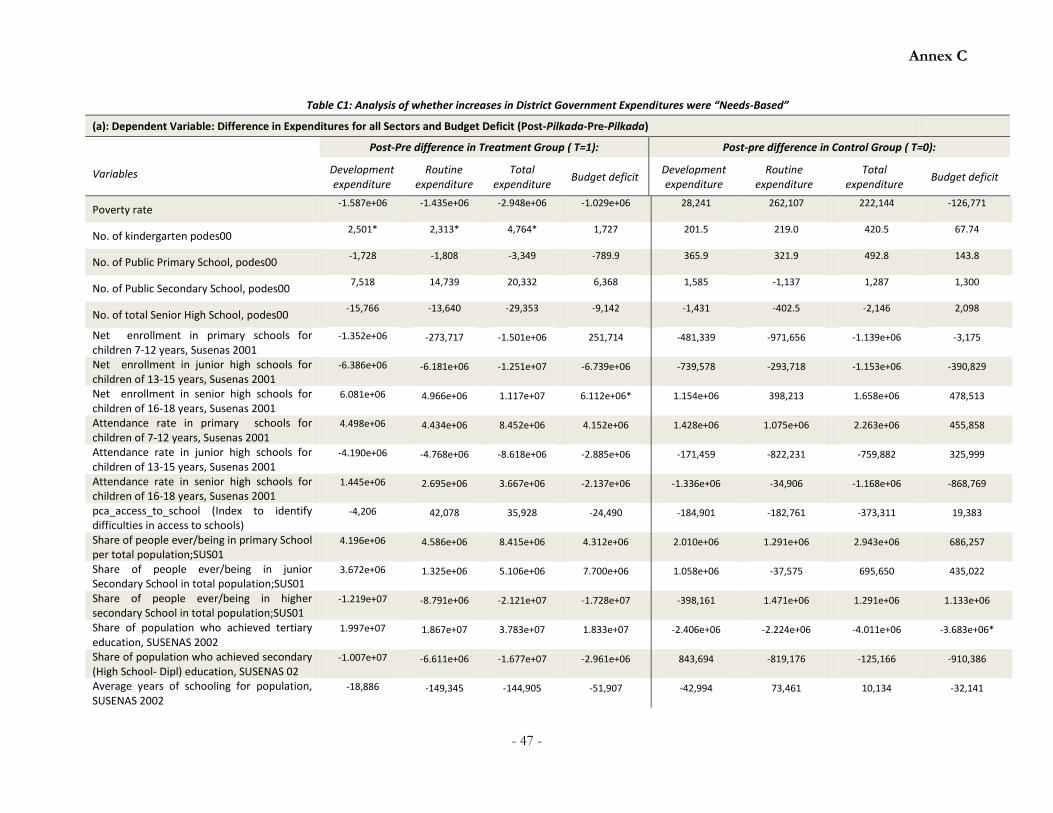
Annex C
- 47 -
Table C1: Analysis of whether increases in District Government Expenditures were “Needs-Based”
(a): Dependent Variable: Difference in Expenditures for all Sectors and Budget Deficit (Post-Pilkada-Pre-Pilkada)
Variables
Post-Pre difference in Treatment Group ( T=1): Post-pre difference in Control Group ( T=0):
Development expenditure
Routine expenditure
Total expenditure
Budget deficit Development expenditure
Routine expenditure
Total expenditure
Budget deficit
Poverty rate -1.587e+06 -1.435e+06 -2.948e+06 -1.029e+06 28,241 262,107 222,144 -126,771
No. of kindergarten podes00 2,501* 2,313* 4,764* 1,727 201.5 219.0 420.5 67.74
No. of Public Primary School, podes00 -1,728 -1,808 -3,349 -789.9 365.9 321.9 492.8 143.8
No. of Public Secondary School, podes00 7,518 14,739 20,332 6,368 1,585 -1,137 1,287 1,300
No. of total Senior High School, podes00 -15,766 -13,640 -29,353 -9,142 -1,431 -402.5 -2,146 2,098
Net enrollment in primary schools for children 7-12 years, Susenas 2001
-1.352e+06 -273,717 -1.501e+06 251,714 -481,339 -971,656 -1.139e+06 -3,175
Net enrollment in junior high schools for children of 13-15 years, Susenas 2001
-6.386e+06 -6.181e+06 -1.251e+07 -6.739e+06 -739,578 -293,718 -1.153e+06 -390,829
Net enrollment in senior high schools for children of 16-18 years, Susenas 2001
6.081e+06 4.966e+06 1.117e+07 6.112e+06* 1.154e+06 398,213 1.658e+06 478,513
Attendance rate in primary schools for children of 7-12 years, Susenas 2001
4.498e+06 4.434e+06 8.452e+06 4.152e+06 1.428e+06 1.075e+06 2.263e+06 455,858
Attendance rate in junior high schools for children of 13-15 years, Susenas 2001
-4.190e+06 -4.768e+06 -8.618e+06 -2.885e+06 -171,459 -822,231 -759,882 325,999
Attendance rate in senior high schools for children of 16-18 years, Susenas 2001
1.445e+06 2.695e+06 3.667e+06 -2.137e+06 -1.336e+06 -34,906 -1.168e+06 -868,769
pca_access_to_school (Index to identify difficulties in access to schools)
-4,206 42,078 35,928 -24,490 -184,901 -182,761 -373,311 19,383
Share of people ever/being in primary School per total population;SUS01
4.196e+06 4.586e+06 8.415e+06 4.312e+06 2.010e+06 1.291e+06 2.943e+06 686,257
Share of people ever/being in junior Secondary School in total population;SUS01
3.672e+06 1.325e+06 5.106e+06 7.700e+06 1.058e+06 -37,575 695,650 435,022
Share of people ever/being in higher secondary School in total population;SUS01
-1.219e+07 -8.791e+06 -2.121e+07 -1.728e+07 -398,161 1.471e+06 1.291e+06 1.133e+06
Share of population who achieved tertiary education, SUSENAS 2002
1.997e+07 1.867e+07 3.783e+07 1.833e+07 -2.406e+06 -2.224e+06 -4.011e+06 -3.683e+06*
Share of population who achieved secondary (High School- Dipl) education, SUSENAS 02
-1.007e+07 -6.611e+06 -1.677e+07 -2.961e+06 843,694 -819,176 -125,166 -910,386
Average years of schooling for population, SUSENAS 2002
-18,886 -149,345 -144,905 -51,907 -42,994 73,461 10,134 -32,141
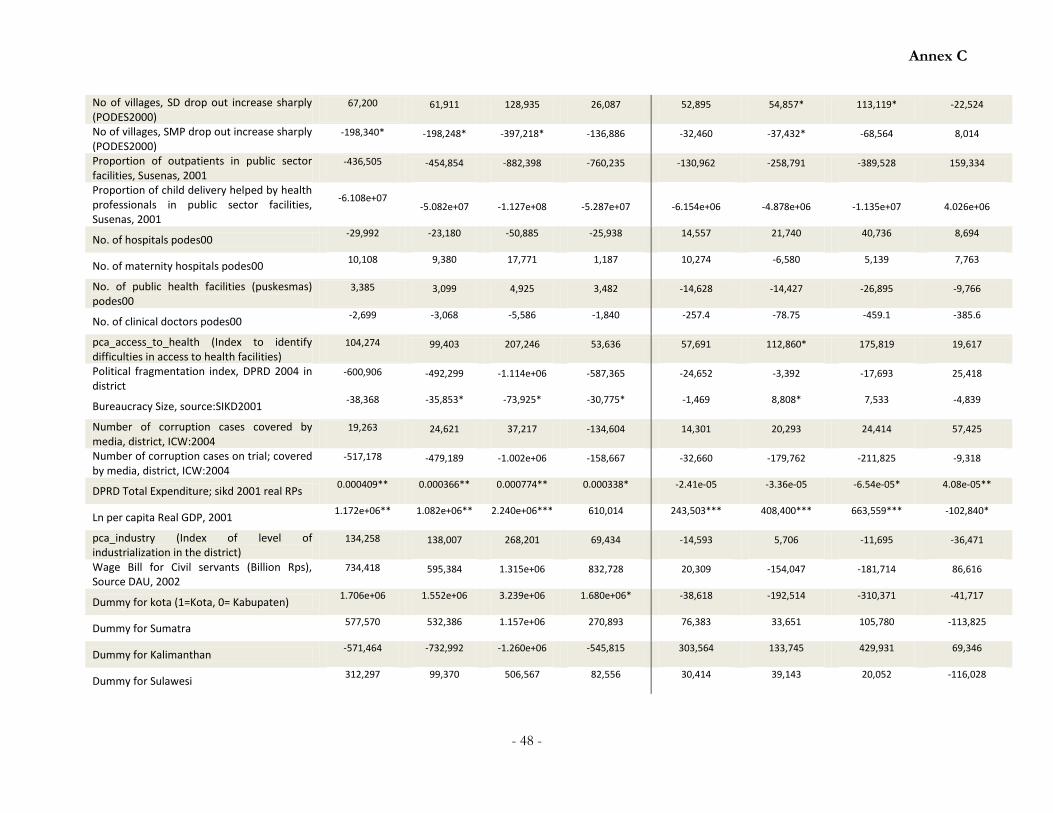
Annex C
- 48 -
No of villages, SD drop out increase sharply (PODES2000)
67,200 61,911 128,935 26,087 52,895 54,857* 113,119* -22,524
No of villages, SMP drop out increase sharply (PODES2000)
-198,340* -198,248* -397,218* -136,886 -32,460 -37,432* -68,564 8,014
Proportion of outpatients in public sector facilities, Susenas, 2001
-436,505 -454,854 -882,398 -760,235 -130,962 -258,791 -389,528 159,334
Proportion of child delivery helped by health professionals in public sector facilities, Susenas, 2001
-6.108e+07 -5.082e+07 -1.127e+08 -5.287e+07 -6.154e+06 -4.878e+06 -1.135e+07 4.026e+06
No. of hospitals podes00 -29,992 -23,180 -50,885 -25,938 14,557 21,740 40,736 8,694
No. of maternity hospitals podes00 10,108 9,380 17,771 1,187 10,274 -6,580 5,139 7,763
No. of public health facilities (puskesmas) podes00
3,385 3,099 4,925 3,482 -14,628 -14,427 -26,895 -9,766
No. of clinical doctors podes00 -2,699 -3,068 -5,586 -1,840 -257.4 -78.75 -459.1 -385.6
pca_access_to_health (Index to identify difficulties in access to health facilities)
104,274 99,403 207,246 53,636 57,691 112,860* 175,819 19,617
Political fragmentation index, DPRD 2004 in district
-600,906 -492,299 -1.114e+06 -587,365 -24,652 -3,392 -17,693 25,418
Bureaucracy Size, source:SIKD2001 -38,368 -35,853* -73,925* -30,775* -1,469 8,808* 7,533 -4,839
Number of corruption cases covered by media, district, ICW:2004
19,263 24,621 37,217 -134,604 14,301 20,293 24,414 57,425
Number of corruption cases on trial; covered by media, district, ICW:2004
-517,178 -479,189 -1.002e+06 -158,667 -32,660 -179,762 -211,825 -9,318
DPRD Total Expenditure; sikd 2001 real RPs 0.000409** 0.000366** 0.000774** 0.000338* -2.41e-05 -3.36e-05 -6.54e-05* 4.08e-05**
Ln per capita Real GDP, 2001 1.172e+06** 1.082e+06** 2.240e+06*** 610,014 243,503*** 408,400*** 663,559*** -102,840*
pca_industry (Index of level of industrialization in the district)
134,258 138,007 268,201 69,434 -14,593 5,706 -11,695 -36,471
Wage Bill for Civil servants (Billion Rps), Source DAU, 2002
734,418 595,384 1.315e+06 832,728 20,309 -154,047 -181,714 86,616
Dummy for kota (1=Kota, 0= Kabupaten) 1.706e+06 1.552e+06 3.239e+06 1.680e+06* -38,618 -192,514 -310,371 -41,717
Dummy for Sumatra 577,570 532,386 1.157e+06 270,893 76,383 33,651 105,780 -113,825
Dummy for Kalimanthan -571,464 -732,992 -1.260e+06 -545,815 303,564 133,745 429,931 69,346
Dummy for Sulawesi 312,297 99,370 506,567 82,556 30,414 39,143 20,052 -116,028
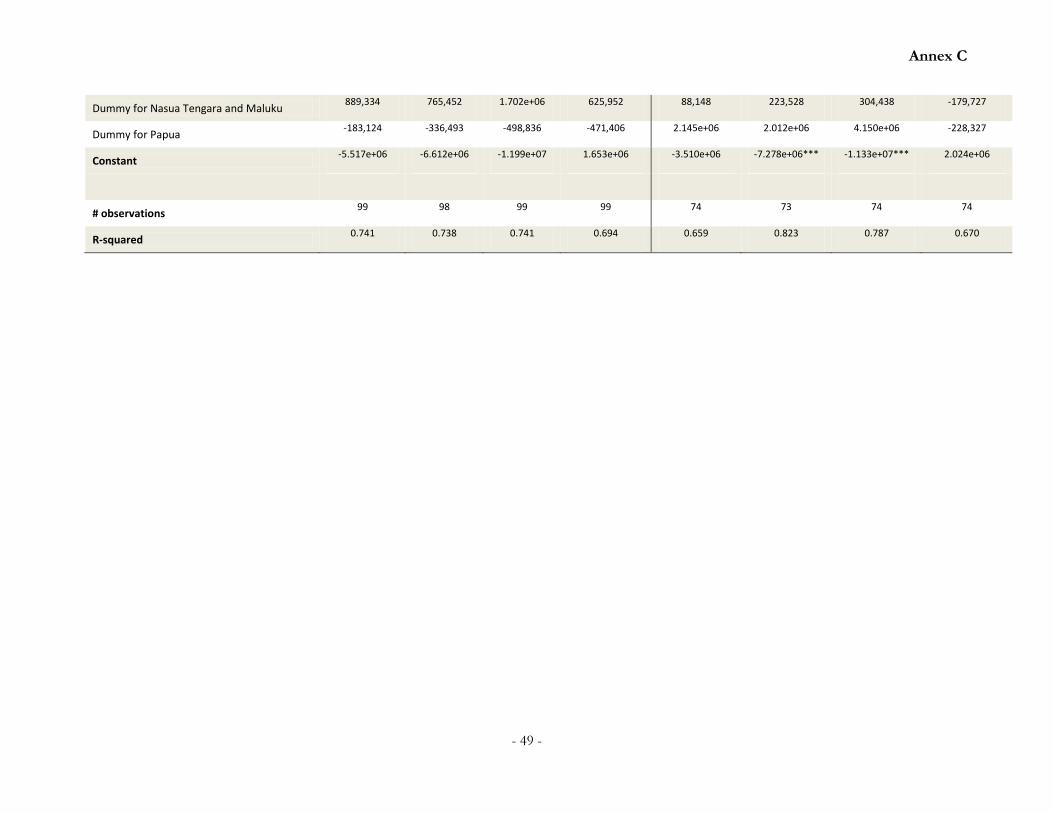
Annex C
- 49 -
Dummy for Nasua Tengara and Maluku 889,334 765,452 1.702e+06 625,952 88,148 223,528 304,438 -179,727
Dummy for Papua -183,124 -336,493 -498,836 -471,406 2.145e+06 2.012e+06 4.150e+06 -228,327
Constant -5.517e+06 -6.612e+06 -1.199e+07 1.653e+06 -3.510e+06 -7.278e+06*** -1.133e+07*** 2.024e+06
# observations 99 98 99 99 74 73 74 74
R-squared 0.741 0.738 0.741 0.694 0.659 0.823 0.787 0.670
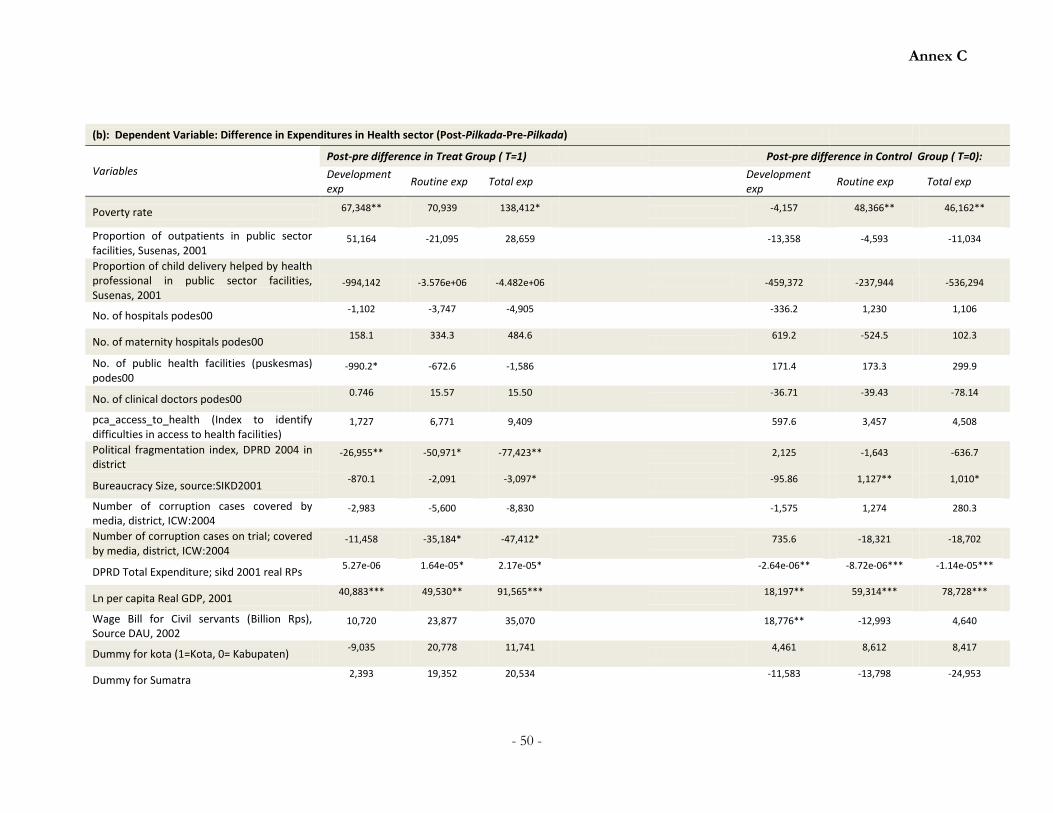
Annex C
- 50 -
(b): Dependent Variable: Difference in Expenditures in Health sector (Post-Pilkada-Pre-Pilkada)
Variables Post-pre difference in Treat Group ( T=1) Post-pre difference in Control Group ( T=0):
Development exp
Routine exp Total exp
Development exp
Routine exp Total exp
Poverty rate 67,348** 70,939 138,412*
-4,157 48,366** 46,162**
Proportion of outpatients in public sector facilities, Susenas, 2001
51,164 -21,095 28,659
-13,358 -4,593 -11,034
Proportion of child delivery helped by health professional in public sector facilities, Susenas, 2001
-994,142 -3.576e+06 -4.482e+06 -459,372 -237,944 -536,294
No. of hospitals podes00 -1,102 -3,747 -4,905
-336.2 1,230 1,106
No. of maternity hospitals podes00 158.1 334.3 484.6
619.2 -524.5 102.3
No. of public health facilities (puskesmas) podes00
-990.2* -672.6 -1,586
171.4 173.3 299.9
No. of clinical doctors podes00 0.746 15.57 15.50
-36.71 -39.43 -78.14
pca_access_to_health (Index to identify difficulties in access to health facilities)
1,727 6,771 9,409
597.6 3,457 4,508
Political fragmentation index, DPRD 2004 in district
-26,955** -50,971* -77,423**
2,125 -1,643 -636.7
Bureaucracy Size, source:SIKD2001 -870.1 -2,091 -3,097*
-95.86 1,127** 1,010*
Number of corruption cases covered by media, district, ICW:2004
-2,983 -5,600 -8,830
-1,575 1,274 280.3
Number of corruption cases on trial; covered by media, district, ICW:2004
-11,458 -35,184* -47,412*
735.6 -18,321 -18,702
DPRD Total Expenditure; sikd 2001 real RPs 5.27e-06 1.64e-05* 2.17e-05*
-2.64e-06** -8.72e-06*** -1.14e-05***
Ln per capita Real GDP, 2001 40,883*** 49,530** 91,565***
18,197** 59,314*** 78,728***
Wage Bill for Civil servants (Billion Rps), Source DAU, 2002
10,720 23,877 35,070
18,776** -12,993 4,640
Dummy for kota (1=Kota, 0= Kabupaten) -9,035 20,778 11,741
4,461 8,612 8,417
Dummy for Sumatra 2,393 19,352 20,534
-11,583 -13,798 -24,953
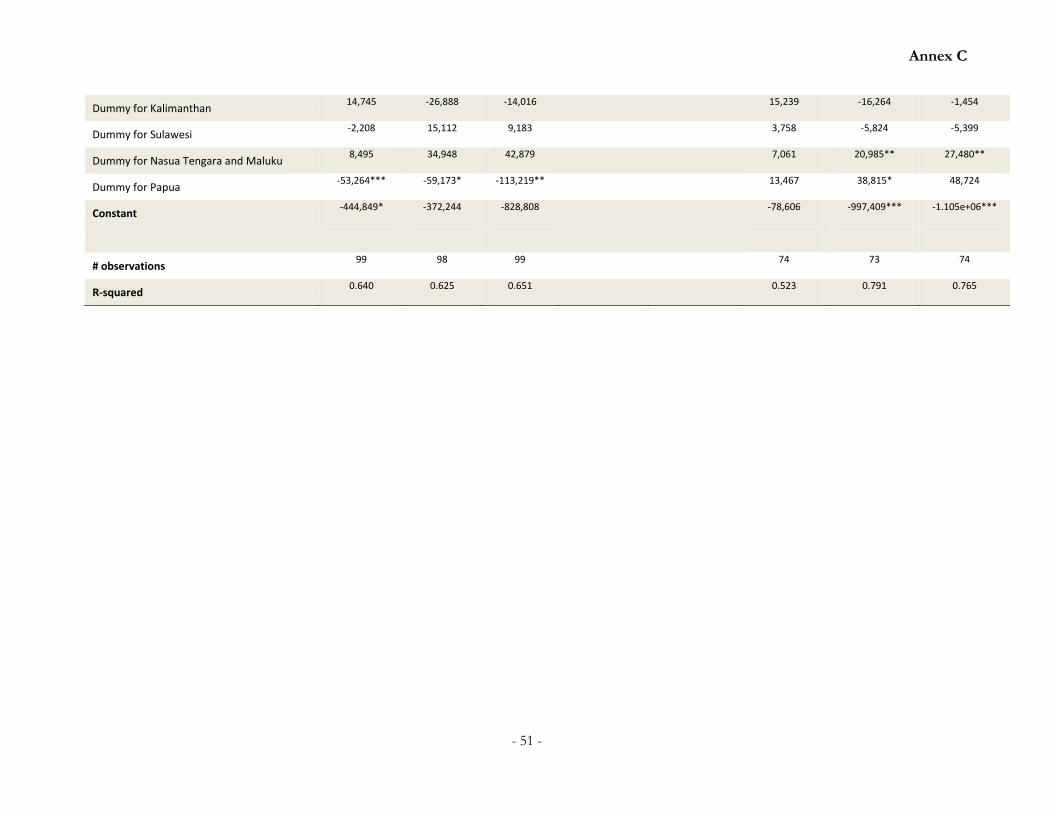
Annex C
- 51 -
Dummy for Kalimanthan 14,745 -26,888 -14,016
15,239 -16,264 -1,454
Dummy for Sulawesi -2,208 15,112 9,183
3,758 -5,824 -5,399
Dummy for Nasua Tengara and Maluku 8,495 34,948 42,879
7,061 20,985** 27,480**
Dummy for Papua -53,264*** -59,173* -113,219**
13,467 38,815* 48,724
Constant -444,849* -372,244 -828,808
-78,606 -997,409*** -1.105e+06***
# observations 99 98 99
74 73 74
R-squared 0.640 0.625 0.651
0.523 0.791 0.765
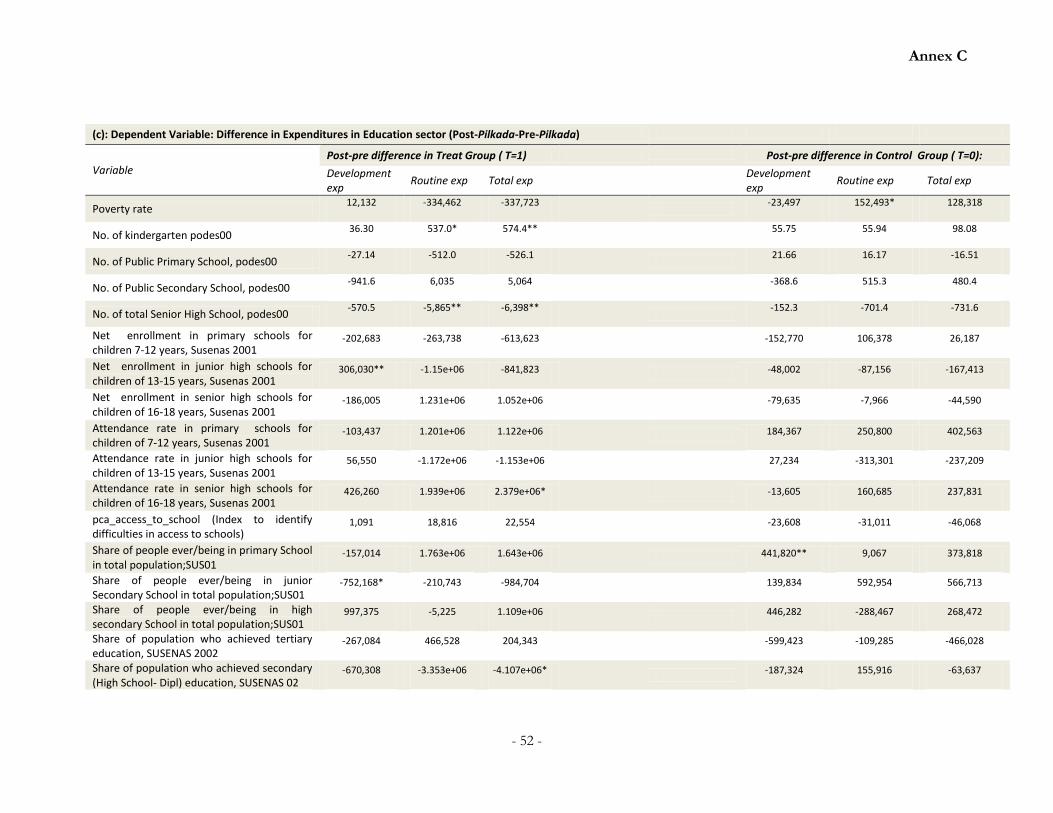
Annex C
- 52 -
(c): Dependent Variable: Difference in Expenditures in Education sector (Post-Pilkada-Pre-Pilkada)
Variable Post-pre difference in Treat Group ( T=1) Post-pre difference in Control Group ( T=0):
Development exp
Routine exp Total exp
Development exp
Routine exp Total exp
Poverty rate 12,132 -334,462 -337,723
-23,497 152,493* 128,318
No. of kindergarten podes00 36.30 537.0* 574.4**
55.75 55.94 98.08
No. of Public Primary School, podes00 -27.14 -512.0 -526.1
21.66 16.17 -16.51
No. of Public Secondary School, podes00 -941.6 6,035 5,064
-368.6 515.3 480.4
No. of total Senior High School, podes00 -570.5 -5,865** -6,398**
-152.3 -701.4 -731.6
Net enrollment in primary schools for children 7-12 years, Susenas 2001
-202,683 -263,738 -613,623
-152,770 106,378 26,187
Net enrollment in junior high schools for children of 13-15 years, Susenas 2001
306,030** -1.15e+06 -841,823
-48,002 -87,156 -167,413
Net enrollment in senior high schools for children of 16-18 years, Susenas 2001
-186,005 1.231e+06 1.052e+06
-79,635 -7,966 -44,590
Attendance rate in primary schools for children of 7-12 years, Susenas 2001
-103,437 1.201e+06 1.122e+06
184,367 250,800 402,563
Attendance rate in junior high schools for children of 13-15 years, Susenas 2001
56,550 -1.172e+06 -1.153e+06
27,234 -313,301 -237,209
Attendance rate in senior high schools for children of 16-18 years, Susenas 2001
426,260 1.939e+06 2.379e+06*
-13,605 160,685 237,831
pca_access_to_school (Index to identify difficulties in access to schools)
1,091 18,816 22,554
-23,608 -31,011 -46,068
Share of people ever/being in primary School in total population;SUS01
-157,014 1.763e+06 1.643e+06
441,820** 9,067 373,818
Share of people ever/being in junior Secondary School in total population;SUS01
-752,168* -210,743 -984,704
139,834 592,954 566,713
Share of people ever/being in high secondary School in total population;SUS01
997,375 -5,225 1.109e+06
446,282 -288,467 268,472
Share of population who achieved tertiary education, SUSENAS 2002
-267,084 466,528 204,343
-599,423 -109,285 -466,028
Share of population who achieved secondary (High School- Dipl) education, SUSENAS 02
-670,308 -3.353e+06 -4.107e+06*
-187,324 155,916 -63,637
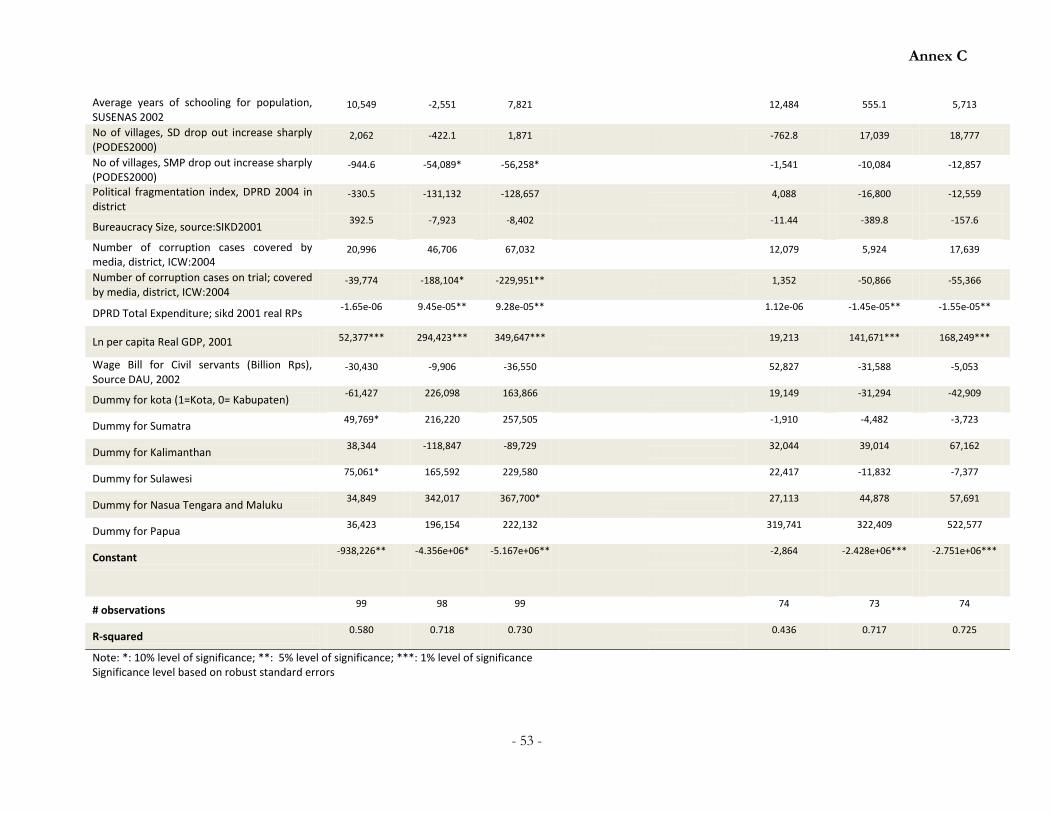
Annex C
- 53 -
Average years of schooling for population, SUSENAS 2002
10,549 -2,551 7,821
12,484 555.1 5,713
No of villages, SD drop out increase sharply (PODES2000)
2,062 -422.1 1,871
-762.8 17,039 18,777
No of villages, SMP drop out increase sharply (PODES2000)
-944.6 -54,089* -56,258*
-1,541 -10,084 -12,857
Political fragmentation index, DPRD 2004 in district
-330.5 -131,132 -128,657
4,088 -16,800 -12,559
Bureaucracy Size, source:SIKD2001 392.5 -7,923 -8,402
-11.44 -389.8 -157.6
Number of corruption cases covered by media, district, ICW:2004
20,996 46,706 67,032
12,079 5,924 17,639
Number of corruption cases on trial; covered by media, district, ICW:2004
-39,774 -188,104* -229,951**
1,352 -50,866 -55,366
DPRD Total Expenditure; sikd 2001 real RPs -1.65e-06 9.45e-05** 9.28e-05**
1.12e-06 -1.45e-05** -1.55e-05**
Ln per capita Real GDP, 2001 52,377*** 294,423*** 349,647***
19,213 141,671*** 168,249***
Wage Bill for Civil servants (Billion Rps), Source DAU, 2002
-30,430 -9,906 -36,550
52,827 -31,588 -5,053
Dummy for kota (1=Kota, 0= Kabupaten) -61,427 226,098 163,866
19,149 -31,294 -42,909
Dummy for Sumatra 49,769* 216,220 257,505
-1,910 -4,482 -3,723
Dummy for Kalimanthan 38,344 -118,847 -89,729
32,044 39,014 67,162
Dummy for Sulawesi 75,061* 165,592 229,580
22,417 -11,832 -7,377
Dummy for Nasua Tengara and Maluku 34,849 342,017 367,700*
27,113 44,878 57,691
Dummy for Papua 36,423 196,154 222,132
319,741 322,409 522,577
Constant -938,226** -4.356e+06* -5.167e+06**
-2,864 -2.428e+06*** -2.751e+06***
# observations 99 98 99
74 73 74
R-squared 0.580 0.718 0.730
0.436 0.717 0.725
Note: *: 10% level of significance; **: 5% level of significance; ***: 1% level of significance Significance level based on robust standard errors
Annex C
- 54 -
Variables in needs analysis regressions (Table C1,a,b,c above)
Initial stock variables (1) “Coverage rate” or socio-economic development indicators pre-decentralization: shares of population who have ever been in primary, junior high, and secondary schools (2001); shares of population who achieved tertiary education and secondary (high school-diploma) education (2002); average years of schooling of population (2002); net enrollment rate in primary, junior high and secondary (2001); attendance rate in primary, junior high, and secondary (2001); no. of villages where primary or junior high school dropouts increase sharply (2000); proportion of deliveries helped by public health professionals and proportion of outpatients in public sector facilities (2001).
(2) Stock of public facilities in education and health (all for 2000): no. of kindergartens, public primary, secondary, and senior high schools, difficulty in accessing schools measured by distance; no. of hospital and maternity hospitals, public primary health facilities (puskesmas) and clinic doctors, difficulties in accessing health facilities.
Initial economic and fiscal conditions, institutional and civic variables ( ) Political Fragmentation Index for each district (2004), size of bureaucracy (2001) wage bill for civil servants in 2002 (billion Rps); no. of corruption cases covered by media for each district, no. of corruption cases on trial and covered by media; log of per capita real GDP, poverty rate, total expenditure of DPRD (2001) and level of industrialization.
Table C-4 below lists the variables used to construct first principal component indices for access to school, health facilities and industrialization.
Table C-4: Interpretation of principle component indices Index (The first principal component) Variables used
Access to school: Index to identify difficulty in accessing schools
Distances of primary, junior high, and secondary schools from the village
Access to health: Index to identify difficulty in accessing health facilities
Number of villages in the district with difficulties in accessing hospitals, other public health facilities like puskesmas, maternity hospitals, and difficulties in access to pharmacies.
Pca_industry: Level of industrialization in the district
No. of manufacturing, leather, food, brick, and other industrial units in the district