Embed Size (px)
Citation preview
Efficacy and Safety of Memantine Treatment forReduction of Changes Associated with ExperimentalGlaucoma in Monkey, II: Structural Measures
William A. Hare,1 Elizabeth WoldeMussie,1 Robert N. Weinreb,2 Hau Ton,1
Guadalupe Ruiz,1 Mercy Wijono,1 Barbara Feldmann,1 Linda Zangwill,2 andLarry Wheeler1
PURPOSE. To determine, using anatomic measurements,whether daily oral dosing with memantine is both safe andeffective to reduce the injury associated with experimentalglaucoma in primates.
METHODS. Argon laser treatment of the anterior chamber anglewas used to induce chronic ocular hypertension (COHT) in theright eyes of 18 macaque monkeys. Nine animals were dailyorally dosed with 4 mg/kg memantine while the other nineanimals received vehicle only. Measurements of intraocularpressure (IOP) from both eyes of all animals were made atregular intervals. Appearance of the optic nerve head, retinalvessels, and surrounding retina was documented with stereofundus photographs obtained at multiple time points through-out the study. Measurements of optic nerve head topographywere obtained from confocal laser scans made from animalswith the highest IOPs at approximately 3, 5, and 10 monthsafter elevation of IOP. At approximately 16 months after IOPelevation, animals were killed and histologic counts of cells inthe retinal ganglion cell (RGC) layer were made.
RESULTS. Histologic measurements showed that, for animalswith moderate elevation of IOP, memantine treatment wasassociated with an enhanced survival of RGCs in the inferiorretina. Measurements of optic nerve head topography showedless IOP-induced change in memantine-treated animals. Thiseffect was seen in measurements of both the cup and theneuroretinal rim. A comparison of these same histologic andmorphologic measurements in normotensive eyes from thetwo treatment groups showed that memantine treatment wasnot associated with any significant effects on these eyes.
CONCLUSIONS. Histologic measurements of RGC survival as wellas tomographic measurements of nerve head topography showthat systemic treatment with memantine, a compound whichdoes not lower intraocular pressure, is both safe and effectiveto reduce changes associated with experimental glaucoma.(Invest Ophthalmol Vis Sci. 2004;45:2640–2651) DOI:10.1167/iovs.03-0567
Electrophysiological evidence has been presented to showthat oral treatment with memantine (1-amino-3,5-dimeth-
yladamantane) was effective for the reduction of functionalloss associated with experimental glaucoma in monkeys.1 Thisarticle reports on anatomic measurements made in these sameanimals in an effort to further ascertain the safety and efficacyof memantine treatment. Stereoscopic fundus photographswere made from both eyes of all animals at multiple timesduring the study. Using confocal scanning laser tomography,noninvasive measurements of optic nerve head topographywere made at three time points. These measurements arecorrelated with visual field loss in clinical glaucoma studies2–10
and also with the degree of optic nerve axonal loss in monkeyswith experimental glaucoma.11 Since glaucomatous injury re-sults in a loss of retinal ganglion cells (RGCs) in patients12–14 aswell as in monkeys with experimental glaucoma,15–18 histo-logic measurements of retinal ganglion cell (RGC) survivalwere also made from retinal samples obtained from both eyesof all animals in each treatment group at the termination of thestudy.
METHODS
All procedures conformed to the guidelines in the Statement for Use ofAnimals in Ophthalmic and Vision Research provided by the Associa-tion for Research in Vision and Ophthalmology and were also reviewedby an institutional review committee.
Animal Subjects
Eighteen young adult cynomolgous monkeys, Macaca fascicularis,were randomly divided into two groups and baseline measurements ofIOP were made under light ketamine sedation (5 mg/kg, i.m.) using apneumatonometer (Digilab, Norwell, MA). Daily oral dosing with 4mg/kg memantine was begun in one group while animals in the othergroup received vehicle only. Argon laser cautery of the anterior cham-ber angle was performed on the right eyes of all animals in bothtreatment groups to induce chronic ocular hypertension according tothe method originally described by Gaasterland and Kupfer.19 IOP wasmeasured under sedation with i.m. ketamine (5 mg/kg) using a ModelRT pneumatonometer (Digilab, Norwell, MA) for IOP � 45 mm Hg ora different pneumatonometer (Alcon, Fort Worth, TX) for IOP �45mm Hg at regular intervals, indicated in Figure 1, throughout theduration of the study (see Methods section in preceding paper1 forgreater detail regarding IOP measurements). Blood samples were ob-tained from all animals at 2 months after the onset of oral dosing andat 2-month intervals thereafter. Immediately before the animals werekilled, vitreous samples were also obtained from all eyes. The quantityof memantine in the plasma and vitreous samples was determined, intriplicate, using an internal standard method in combination withHPLC. Memantine-treated animals had blood and vitreal concentrationson the order of 1 �M for all measurement time points more than 2months after laser treatment. For a detailed description of the proce-dure for measuring memantine levels in plasma and vitreous, as well as
From the 1Department of Biological Sciences, Allergan Inc., Irvine,California; and 2Hamilton Glaucoma Center, University of California,San Diego, La Jolla, California.
Submitted for publication June 5, 2003; revised December 21,2003 and March 2, 2004; accepted March 17, 2004.
Disclosure: W.A. Hare, Allergan, Inc. (E); E. WoldeMussie, Al-lergan, Inc. (E); R.N. Weinreb, (C, R); H. Ton, Allergan, Inc. (E); G.Ruiz, Allergan, Inc. (E); M. Wijono, Allergan, Inc. (E); B. Feldmann,Allergan, Inc. (E); L. Zangwill, None; L. Wheeler, Allergan, Inc. (E)
The publication costs of this article were defrayed in part by pagecharge payment. This article must therefore be marked “advertise-ment” in accordance with 18 U.S.C. §1734 solely to indicate this fact.
Corresponding author: William A. Hare, Department of BiologicalSciences, MS RD-2C, Allergan, Inc., 2525 Dupont Drive, Irvine, Califor-nia 92612; [email protected].
Investigative Ophthalmology & Visual Science, August 2004, Vol. 45, No. 82640 Copyright © Association for Research in Vision and Ophthalmology
the results of those measurements, see the Methods section and Table3 in the preceding paper.1
Estimation of Mean IOP
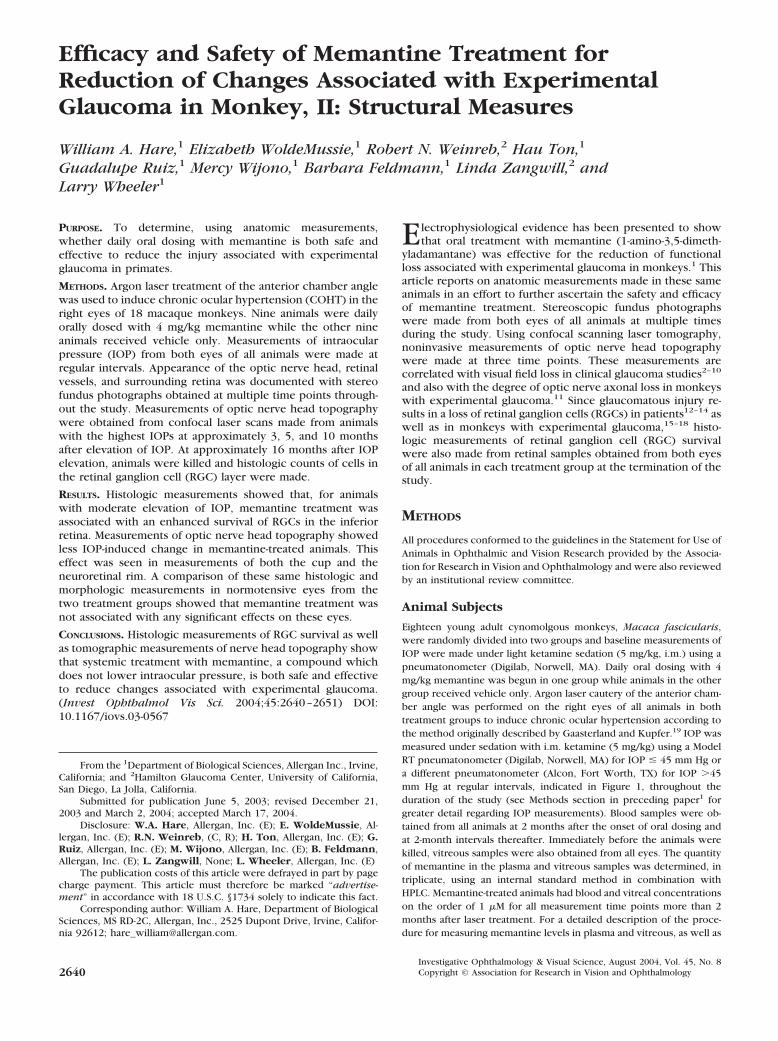
For each animal, IOP was plotted as a function of time over the courseof the study (approximately 16 months). Since HRT measurementswere obtained at three time points, mean IOP was estimated for eachtime interval (t1 � 3 months, t2 � 5 months, and t3 � 10 months) byfirst integrating the area of this plot over the limits extending from thetime at which the first elevation of IOP above baseline was obtained(t0; soon after laser treatment) to the time at which the HRT measure-ments were obtained (either t1, t2, or t3; see Fig. 1 in this article andFig. 1 in the preceding article1). This integral was then divided by thenumber of days in that interval to yield an estimate of the mean IOPover the duration of each time period. For comparison with results ofhistologic measurements, mean IOP for each animal was estimated forthe duration of the study by integrating the IOP plots from the peakIOP to the last IOP measure obtained immediately before sacrifice.
Stereoscopic Fundus Photos
Simultaneous stereo pair fundus images were obtained using a stereofundus camera (Nidek Inc., Fremont, CA) through pupils dilated toapproximately 6 mm diameter with 1% tropicamide. Animals wereanesthetized by i.m. injection of ketamine (10 mg/kg). Rigid contactlenses were used to provide an optimal optical surface for retinalimaging. Images were captured using Kodak Lumiere 100 ASA colorslide film (Kodak, Rochester, NY) in combination with a flash level(intensity) of 3.
Optic Disc Tomography
Optic disc morphology measurements were made using a confocalscanning laser opthalmoscope (Heidelberg Retina Tomograph [HRT];Heidelberg Engineering GmbH, Heidelberg, Germany). Image acquisi-tion and processing have been described in detail previously.11,20
Briefly, each image series was comprised of 32 transverse optic sec-tions obtained at consecutive height planes over a scan depth of 1.5 to2.5 mm. For each eye, three separate 15° images were taken and meantopography was determined using HRT software version 2.01 (Heidel-berg Engineering GmbH). For each image, disc margins were manuallyoutlined with the aid of stereo optic disc photographs obtained atapproximately the same time. Image magnification errors were cor-rected using keratometric measurements of corneal anterior surfacecurvature. The standard reference plane was positioned at 50 �mposterior to the mean height of the optic disc margin contour over thetemporal segment from 350° to 356°. Scans were made under generalanesthesia induced with i.m. ketamine (10 mg/kg) in combination withparalysis maintained with continuous IV infusion of norcuronium bro-mide (0.04 mg/kg per h). Scans were obtained at approximately 3, 5,and 10 months after laser treatment to induce ocular hypertension asindicated in Figure 1. Measurements were made on both eyes of tenanimals including the five animals with the highest IOPs (OD) in eachof the two treatment groups. Only eyes having the highest mean IOPswere measured because, due to the limited availability of the HRTinstrument, only 10 animals could be followed and these eyes wereexpected to show the greatest change in nerve head morphology overthe course of the study. Analysis of all scans was made by persons whowere masked with regard to the treatment group to which each animalbelonged.
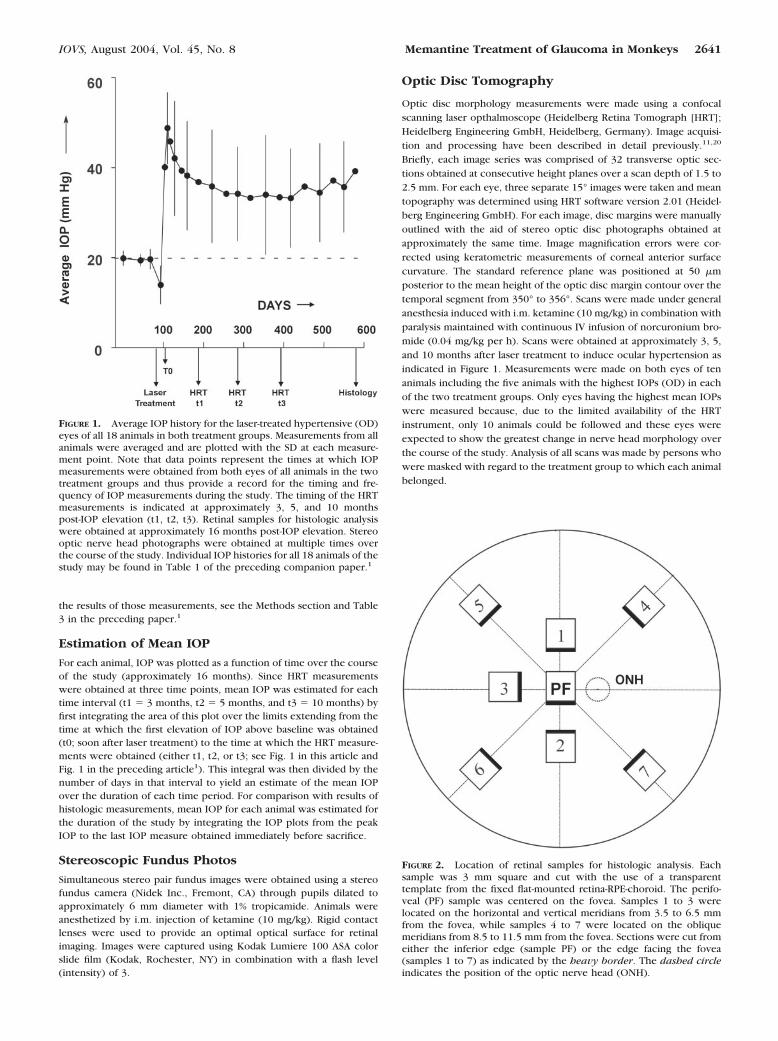
FIGURE 2. Location of retinal samples for histologic analysis. Eachsample was 3 mm square and cut with the use of a transparenttemplate from the fixed flat-mounted retina-RPE-choroid. The perifo-veal (PF) sample was centered on the fovea. Samples 1 to 3 werelocated on the horizontal and vertical meridians from 3.5 to 6.5 mmfrom the fovea, while samples 4 to 7 were located on the obliquemeridians from 8.5 to 11.5 mm from the fovea. Sections were cut fromeither the inferior edge (sample PF) or the edge facing the fovea(samples 1 to 7) as indicated by the heavy border. The dashed circleindicates the position of the optic nerve head (ONH).
FIGURE 1. Average IOP history for the laser-treated hypertensive (OD)eyes of all 18 animals in both treatment groups. Measurements from allanimals were averaged and are plotted with the SD at each measure-ment point. Note that data points represent the times at which IOPmeasurements were obtained from both eyes of all animals in the twotreatment groups and thus provide a record for the timing and fre-quency of IOP measurements during the study. The timing of the HRTmeasurements is indicated at approximately 3, 5, and 10 monthspost-IOP elevation (t1, t2, t3). Retinal samples for histologic analysiswere obtained at approximately 16 months post-IOP elevation. Stereooptic nerve head photographs were obtained at multiple times overthe course of the study. Individual IOP histories for all 18 animals of thestudy may be found in Table 1 of the preceding companion paper.1
IOVS, August 2004, Vol. 45, No. 8 Memantine Treatment of Glaucoma in Monkeys 2641
Histology
At the termination of the study, all animals were deeply anesthetizedwith a combination of ketamine (15 mg/kg), xylazine (1 mg/kg), andacepromazine (0.2 mg/kg) and transcardially perfused with heparin-ized saline, followed by a mixture of paraformaldehyde (4%) andglutaraldehyde (0.1%) in phosphate buffer. The fixed retina/choroidwas flat-mounted on a glass slide and 3-mm square samples wereobtained from eight regions including one sample centered on thefovea (PF), three perimacular samples (1 to 3), and four samples fromthe periphery (4 to 7) as shown in Figure 2. Note that for samples 1 to7, the plane of section is orthogonal to the meridian which bisects thatsample, whereas the plane of section for sample PF is orthogonal withthe vertical meridian. All samples were paraffin-embedded for section-ing. For samples 1 to 7, ten radial sections of 7 �m thickness wereobtained, beginning at the edge indicated by the heavy border, at 50�m intervals and stained with hematoxylin/eosin. Cells in the ganglioncell layer (GCL) were manually counted over the entire 3 mm sectionfor all ten sections. Glia and vascular cell nuclei were easily identifiedusing size (�4 � diameter) and morphologic (not round) criteria andwere not counted. Perifoveal (PF) cell counts were made on tensections from the region of highest cell density between 0.5 to 0.7 mmfrom the center of the foveal pit. Examples of PF sections obtained
from the hypertensive (OD) and normotensive (OS) eyes of a vehicle-treated animal are shown in Figure 3. Note that almost all the darklystained nuclei in the RGC layer (GCL) are of similar size and appear-ance. Cell counts in the GCL from these perifoveal sections were madeusing a BIOQUANT imaging system and stereology software (R & MBiometrics, Inc., Nashville, TN). The software displayed an activeimage window and tagged objects that had been identified as cellnuclei according to the image analysis algorithm. This image wasinspected by the operator and edited to include or exclude objects thatdid not meet the size and morphology criteria. For PF sections fromeyes with severe RGC loss where the RGC layer was reduced to a singlelayer of cell nuclei, cells counts were made manually without the useof BIOQUANT. Using these methods, summed counts from all eightretinal sample regions totaled, on average, approximately 15,000 cellsin the normotensive eyes of both treatment groups. All histologicanalysis was performed by persons who were masked with regard tothe treatment regimen for any animal.
Statistical Analysis
The method of least squares21 was used for linear regression analysis ofdata sets which express either histologic (Fig. 3) or morphologicmeasurements from the two treatment groups (vehicle or memantine)
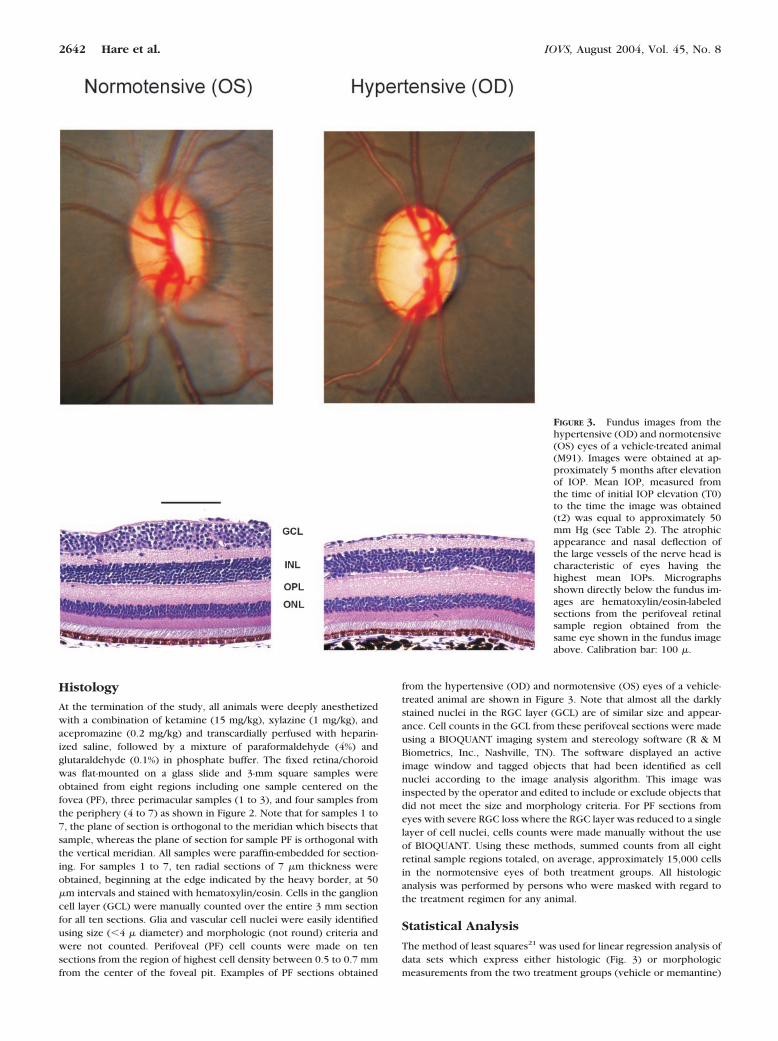
FIGURE 3. Fundus images from thehypertensive (OD) and normotensive(OS) eyes of a vehicle-treated animal(M91). Images were obtained at ap-proximately 5 months after elevationof IOP. Mean IOP, measured fromthe time of initial IOP elevation (T0)to the time the image was obtained(t2) was equal to approximately 50mm Hg (see Table 2). The atrophicappearance and nasal deflection ofthe large vessels of the nerve head ischaracteristic of eyes having thehighest mean IOPs. Micrographsshown directly below the fundus im-ages are hematoxylin/eosin-labeledsections from the perifoveal retinalsample region obtained from thesame eye shown in the fundus imageabove. Calibration bar: 100 �.
2642 Hare et al. IOVS, August 2004, Vol. 45, No. 8
as a function of mean IOP. This method provided measurements ofslope (m) and correlation coefficient (r) for each data set. The hypoth-esis that the slopes for regressions of the two treatment groups wereequivalent was then tested using analysis of covariance with bothtreatment group and mean IOP as covariates.22 In this model, eitherRGC counts or HRT measurements are the dependent variable whilemean IOP and treatment group are independent variables. This com-parison includes interaction between IOP and treatment group in themodel. When data sets from the two treatment groups were comparedin this manner, it was concluded that they were significantly differentif the P value for the analysis of covariance was � 0.05.
A Hochberg adjustment23 (“stepdown Bonferroni method”) wasused to control for possible errors associated with comparisons of RGCcounts from multiple regions of the retinas from the two treatmentgroups. Significance levels for P values obtained from the Student’stwo-tailed t-test for comparisons of RGC counts from each sampleregion were adjusted according to this method. A model for Multivar-iate Analysis of Covariance24,25 was used to control for possible errorsassociated with comparisons of multiple HRT measurements in thetwo treatment groups. An analysis of covariance with treatment, meanIOP, and interaction between mean IOP and treatment was performedjointly for either the five cup measurements or for the five neuroretinalrim measurements obtained from the two treatment groups. Thisanalysis was made for measurements obtained at each of the threemeasurement time points. A significance level of P � 0.05 was adoptedfor these comparisons.
RESULTS
Histology
Optic disc photographs and histologic sections from a vehicle-treated animal (M91; see Table 2) are shown in Figure 3. Thedisc images were obtained at approximately 5 months afterelevation of IOP (near HRT measurement time point t2) atwhich point the mean IOP history for the hypertensive eye wasapproximately 50 mm Hg. A single image from the stereo pairfor the hypertensive (OD) and normotensive (OS) eye is pre-sented in the top panels. Note the atrophic appearance of thedisc and nasal deflection of the vessels in the hypertensive eye.Directly below each fundus photograph is a micrograph of asection from the PF sample region of that eye. Sections used forRGC counts in the PF region were obtained from that regionwhere RGC density is highest (see Methods). This is readilyapparent from inspection of the section from the normotensive(OS) eye, where the RGC layer is seen to consist of six or sevenlayers of RGC nuclei. A section from the identical retinal regionin the hypertensive (OD) eye shows that ocular hypertensiveinjury has reduced the RGC layer to a single layer of nuclei.Note that while most of the perifoveal RGCs have been lost inthis hypertensive eye, there is no gross evidence for loss ofcells in either the outer nuclear layer (ONL; photoreceptorcells) or inner nuclear layer (INL; horizontal cells, bipolar cells,Mueller cells, and amacrine cells). This apparently selectiveloss of cells in the RGC layer was evident in histologic sectionsfrom all eight retinal sample regions.
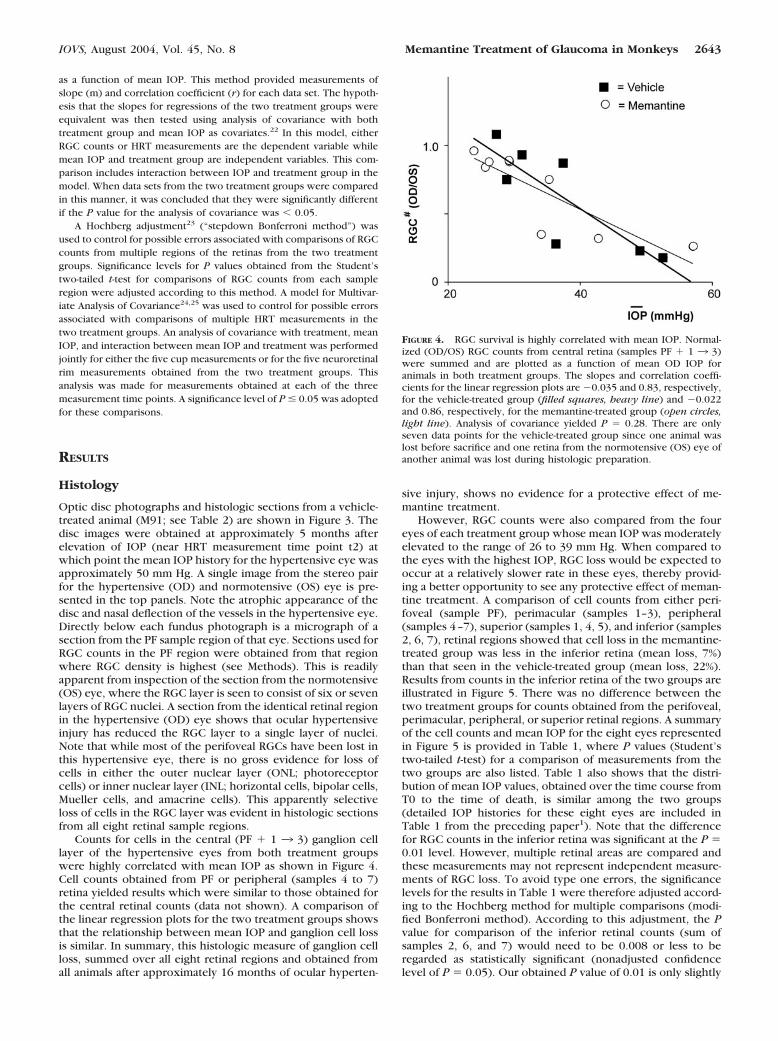
Counts for cells in the central (PF � 1 3 3) ganglion celllayer of the hypertensive eyes from both treatment groupswere highly correlated with mean IOP as shown in Figure 4.Cell counts obtained from PF or peripheral (samples 4 to 7)retina yielded results which were similar to those obtained forthe central retinal counts (data not shown). A comparison ofthe linear regression plots for the two treatment groups showsthat the relationship between mean IOP and ganglion cell lossis similar. In summary, this histologic measure of ganglion cellloss, summed over all eight retinal regions and obtained fromall animals after approximately 16 months of ocular hyperten-
sive injury, shows no evidence for a protective effect of me-mantine treatment.
However, RGC counts were also compared from the foureyes of each treatment group whose mean IOP was moderatelyelevated to the range of 26 to 39 mm Hg. When compared tothe eyes with the highest IOP, RGC loss would be expected tooccur at a relatively slower rate in these eyes, thereby provid-ing a better opportunity to see any protective effect of meman-tine treatment. A comparison of cell counts from either peri-foveal (sample PF), perimacular (samples 1–3), peripheral(samples 4–7), superior (samples 1, 4, 5), and inferior (samples2, 6, 7), retinal regions showed that cell loss in the memantine-treated group was less in the inferior retina (mean loss, 7%)than that seen in the vehicle-treated group (mean loss, 22%).Results from counts in the inferior retina of the two groups areillustrated in Figure 5. There was no difference between thetwo treatment groups for counts obtained from the perifoveal,perimacular, peripheral, or superior retinal regions. A summaryof the cell counts and mean IOP for the eight eyes representedin Figure 5 is provided in Table 1, where P values (Student’stwo-tailed t-test) for a comparison of measurements from thetwo groups are also listed. Table 1 also shows that the distri-bution of mean IOP values, obtained over the time course fromT0 to the time of death, is similar among the two groups(detailed IOP histories for these eight eyes are included inTable 1 from the preceding paper1). Note that the differencefor RGC counts in the inferior retina was significant at the P �0.01 level. However, multiple retinal areas are compared andthese measurements may not represent independent measure-ments of RGC loss. To avoid type one errors, the significancelevels for the results in Table 1 were therefore adjusted accord-ing to the Hochberg method for multiple comparisons (modi-fied Bonferroni method). According to this adjustment, the Pvalue for comparison of the inferior retinal counts (sum ofsamples 2, 6, and 7) would need to be 0.008 or less to beregarded as statistically significant (nonadjusted confidencelevel of P � 0.05). Our obtained P value of 0.01 is only slightly
FIGURE 4. RGC survival is highly correlated with mean IOP. Normal-ized (OD/OS) RGC counts from central retina (samples PF � 1 3 3)were summed and are plotted as a function of mean OD IOP foranimals in both treatment groups. The slopes and correlation coeffi-cients for the linear regression plots are �0.035 and 0.83, respectively,for the vehicle-treated group (filled squares, heavy line) and �0.022and 0.86, respectively, for the memantine-treated group (open circles,light line). Analysis of covariance yielded P � 0.28. There are onlyseven data points for the vehicle-treated group since one animal waslost before sacrifice and one retina from the normotensive (OS) eye ofanother animal was lost during histologic preparation.
IOVS, August 2004, Vol. 45, No. 8 Memantine Treatment of Glaucoma in Monkeys 2643
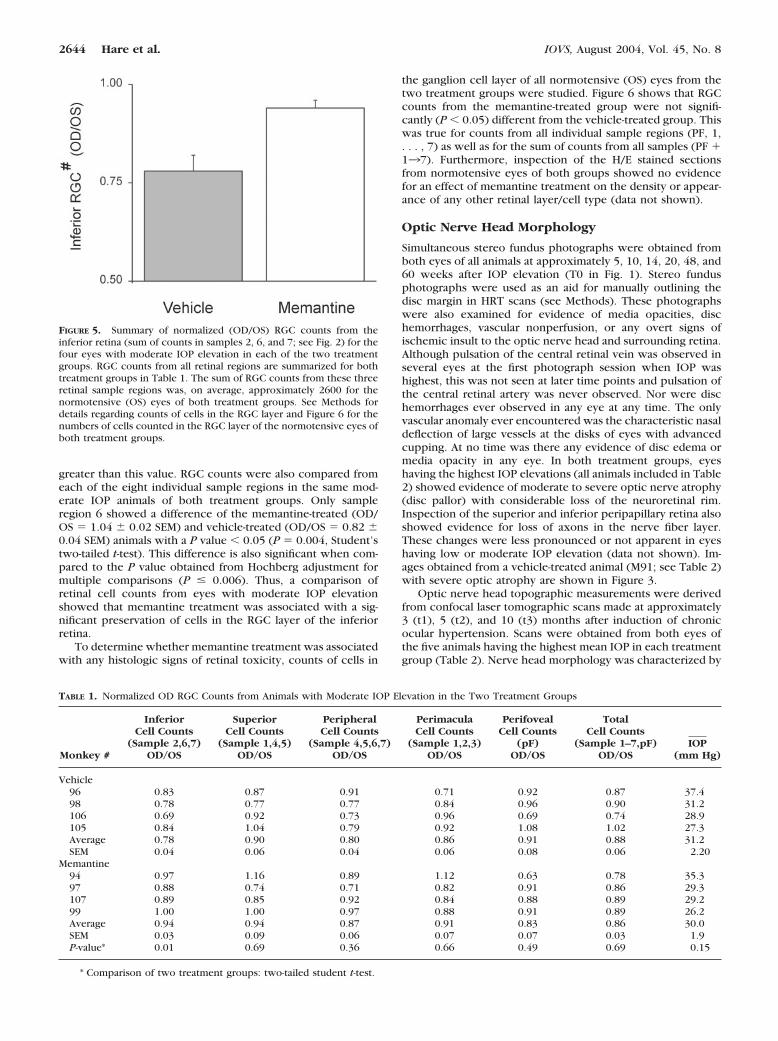
greater than this value. RGC counts were also compared fromeach of the eight individual sample regions in the same mod-erate IOP animals of both treatment groups. Only sampleregion 6 showed a difference of the memantine-treated (OD/OS � 1.04 � 0.02 SEM) and vehicle-treated (OD/OS � 0.82 �0.04 SEM) animals with a P value � 0.05 (P � 0.004, Student’stwo-tailed t-test). This difference is also significant when com-pared to the P value obtained from Hochberg adjustment formultiple comparisons (P � 0.006). Thus, a comparison ofretinal cell counts from eyes with moderate IOP elevationshowed that memantine treatment was associated with a sig-nificant preservation of cells in the RGC layer of the inferiorretina.
To determine whether memantine treatment was associatedwith any histologic signs of retinal toxicity, counts of cells in
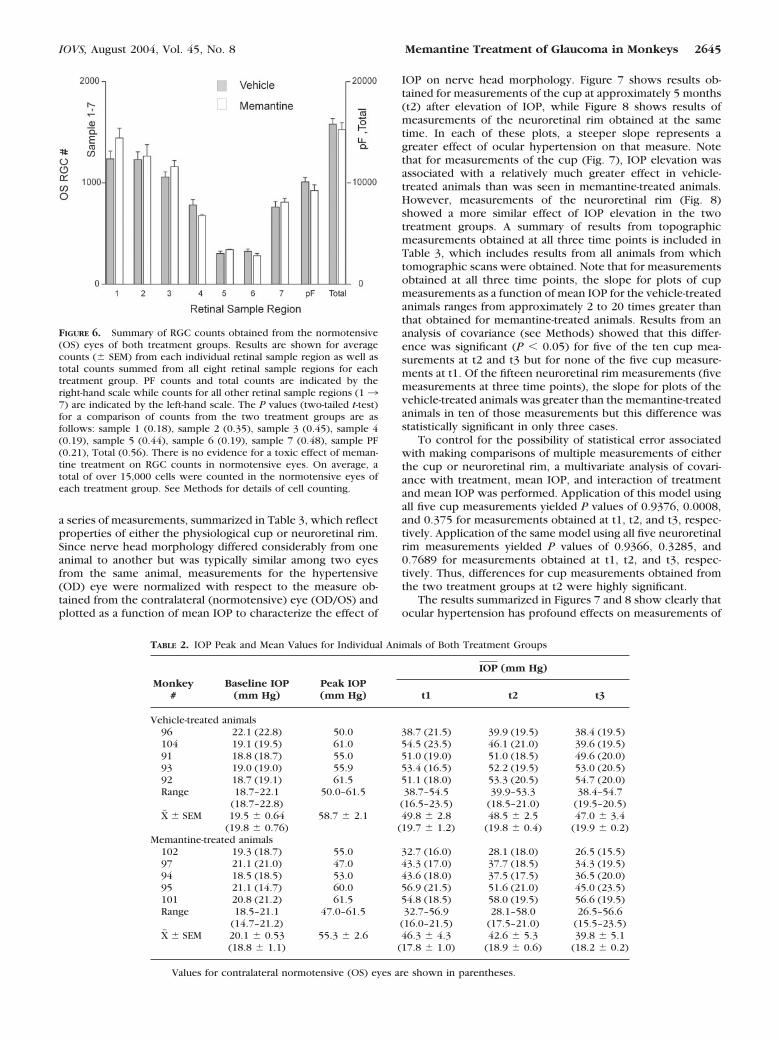
the ganglion cell layer of all normotensive (OS) eyes from thetwo treatment groups were studied. Figure 6 shows that RGCcounts from the memantine-treated group were not signifi-cantly (P � 0.05) different from the vehicle-treated group. Thiswas true for counts from all individual sample regions (PF, 1,. . . , 7) as well as for the sum of counts from all samples (PF �137). Furthermore, inspection of the H/E stained sectionsfrom normotensive eyes of both groups showed no evidencefor an effect of memantine treatment on the density or appear-ance of any other retinal layer/cell type (data not shown).
Optic Nerve Head Morphology
Simultaneous stereo fundus photographs were obtained fromboth eyes of all animals at approximately 5, 10, 14, 20, 48, and60 weeks after IOP elevation (T0 in Fig. 1). Stereo fundusphotographs were used as an aid for manually outlining thedisc margin in HRT scans (see Methods). These photographswere also examined for evidence of media opacities, dischemorrhages, vascular nonperfusion, or any overt signs ofischemic insult to the optic nerve head and surrounding retina.Although pulsation of the central retinal vein was observed inseveral eyes at the first photograph session when IOP washighest, this was not seen at later time points and pulsation ofthe central retinal artery was never observed. Nor were dischemorrhages ever observed in any eye at any time. The onlyvascular anomaly ever encountered was the characteristic nasaldeflection of large vessels at the disks of eyes with advancedcupping. At no time was there any evidence of disc edema ormedia opacity in any eye. In both treatment groups, eyeshaving the highest IOP elevations (all animals included in Table2) showed evidence of moderate to severe optic nerve atrophy(disc pallor) with considerable loss of the neuroretinal rim.Inspection of the superior and inferior peripapillary retina alsoshowed evidence for loss of axons in the nerve fiber layer.These changes were less pronounced or not apparent in eyeshaving low or moderate IOP elevation (data not shown). Im-ages obtained from a vehicle-treated animal (M91; see Table 2)with severe optic atrophy are shown in Figure 3.
Optic nerve head topographic measurements were derivedfrom confocal laser tomographic scans made at approximately3 (t1), 5 (t2), and 10 (t3) months after induction of chronicocular hypertension. Scans were obtained from both eyes ofthe five animals having the highest mean IOP in each treatmentgroup (Table 2). Nerve head morphology was characterized by
FIGURE 5. Summary of normalized (OD/OS) RGC counts from theinferior retina (sum of counts in samples 2, 6, and 7; see Fig. 2) for thefour eyes with moderate IOP elevation in each of the two treatmentgroups. RGC counts from all retinal regions are summarized for bothtreatment groups in Table 1. The sum of RGC counts from these threeretinal sample regions was, on average, approximately 2600 for thenormotensive (OS) eyes of both treatment groups. See Methods fordetails regarding counts of cells in the RGC layer and Figure 6 for thenumbers of cells counted in the RGC layer of the normotensive eyes ofboth treatment groups.
TABLE 1. Normalized OD RGC Counts from Animals with Moderate IOP Elevation in the Two Treatment Groups
Monkey #
InferiorCell Counts
(Sample 2,6,7)OD/OS
SuperiorCell Counts
(Sample 1,4,5)OD/OS
PeripheralCell Counts
(Sample 4,5,6,7)OD/OS
PerimaculaCell Counts
(Sample 1,2,3)OD/OS
PerifovealCell Counts
(pF)OD/OS
TotalCell Counts
(Sample 1–7,pF)OD/OS
IOP(mm Hg)
Vehicle96 0.83 0.87 0.91 0.71 0.92 0.87 37.498 0.78 0.77 0.77 0.84 0.96 0.90 31.2106 0.69 0.92 0.73 0.96 0.69 0.74 28.9105 0.84 1.04 0.79 0.92 1.08 1.02 27.3Average 0.78 0.90 0.80 0.86 0.91 0.88 31.2SEM 0.04 0.06 0.04 0.06 0.08 0.06 2.20
Memantine94 0.97 1.16 0.89 1.12 0.63 0.78 35.397 0.88 0.74 0.71 0.82 0.91 0.86 29.3107 0.89 0.85 0.92 0.84 0.88 0.89 29.299 1.00 1.00 0.97 0.88 0.91 0.89 26.2Average 0.94 0.94 0.87 0.91 0.83 0.86 30.0SEM 0.03 0.09 0.06 0.07 0.07 0.03 1.9P-value* 0.01 0.69 0.36 0.66 0.49 0.69 0.15
* Comparison of two treatment groups: two-tailed student t-test.
2644 Hare et al. IOVS, August 2004, Vol. 45, No. 8
a series of measurements, summarized in Table 3, which reflectproperties of either the physiological cup or neuroretinal rim.Since nerve head morphology differed considerably from oneanimal to another but was typically similar among two eyesfrom the same animal, measurements for the hypertensive(OD) eye were normalized with respect to the measure ob-tained from the contralateral (normotensive) eye (OD/OS) andplotted as a function of mean IOP to characterize the effect of
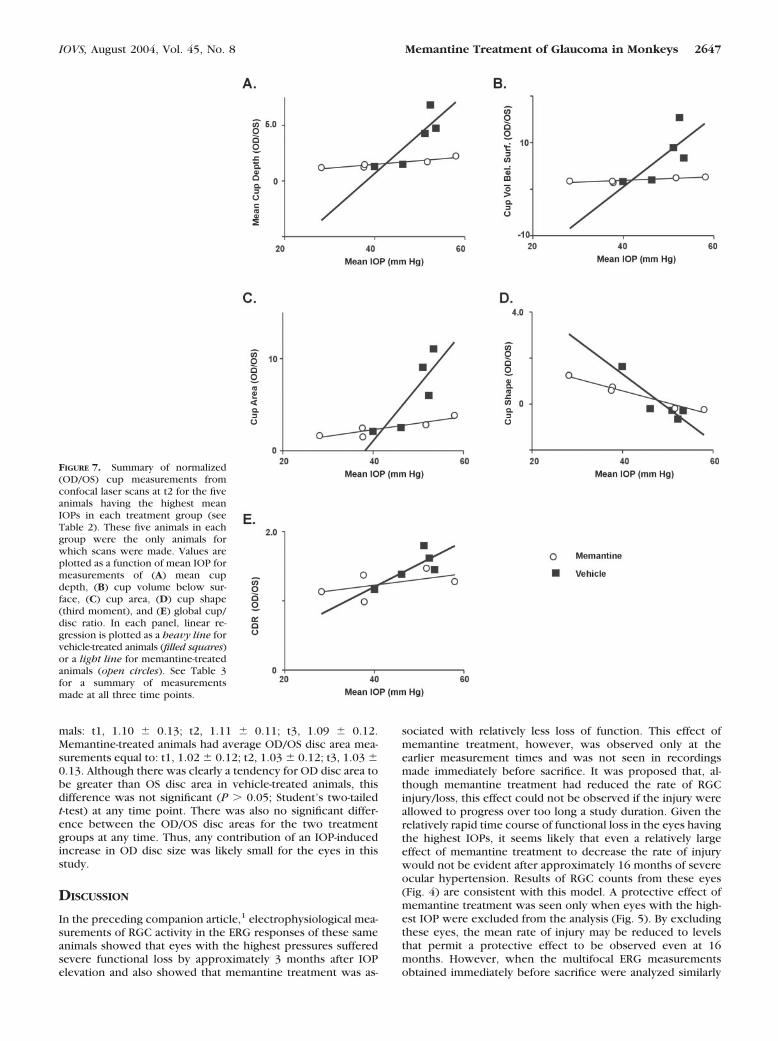
IOP on nerve head morphology. Figure 7 shows results ob-tained for measurements of the cup at approximately 5 months(t2) after elevation of IOP, while Figure 8 shows results ofmeasurements of the neuroretinal rim obtained at the sametime. In each of these plots, a steeper slope represents agreater effect of ocular hypertension on that measure. Notethat for measurements of the cup (Fig. 7), IOP elevation wasassociated with a relatively much greater effect in vehicle-treated animals than was seen in memantine-treated animals.However, measurements of the neuroretinal rim (Fig. 8)showed a more similar effect of IOP elevation in the twotreatment groups. A summary of results from topographicmeasurements obtained at all three time points is included inTable 3, which includes results from all animals from whichtomographic scans were obtained. Note that for measurementsobtained at all three time points, the slope for plots of cupmeasurements as a function of mean IOP for the vehicle-treatedanimals ranges from approximately 2 to 20 times greater thanthat obtained for memantine-treated animals. Results from ananalysis of covariance (see Methods) showed that this differ-ence was significant (P � 0.05) for five of the ten cup mea-surements at t2 and t3 but for none of the five cup measure-ments at t1. Of the fifteen neuroretinal rim measurements (fivemeasurements at three time points), the slope for plots of thevehicle-treated animals was greater than the memantine-treatedanimals in ten of those measurements but this difference wasstatistically significant in only three cases.
To control for the possibility of statistical error associatedwith making comparisons of multiple measurements of eitherthe cup or neuroretinal rim, a multivariate analysis of covari-ance with treatment, mean IOP, and interaction of treatmentand mean IOP was performed. Application of this model usingall five cup measurements yielded P values of 0.9376, 0.0008,and 0.375 for measurements obtained at t1, t2, and t3, respec-tively. Application of the same model using all five neuroretinalrim measurements yielded P values of 0.9366, 0.3285, and0.7689 for measurements obtained at t1, t2, and t3, respec-tively. Thus, differences for cup measurements obtained fromthe two treatment groups at t2 were highly significant.
The results summarized in Figures 7 and 8 show clearly thatocular hypertension has profound effects on measurements of
FIGURE 6. Summary of RGC counts obtained from the normotensive(OS) eyes of both treatment groups. Results are shown for averagecounts (� SEM) from each individual retinal sample region as well astotal counts summed from all eight retinal sample regions for eachtreatment group. PF counts and total counts are indicated by theright-hand scale while counts for all other retinal sample regions (137) are indicated by the left-hand scale. The P values (two-tailed t-test)for a comparison of counts from the two treatment groups are asfollows: sample 1 (0.18), sample 2 (0.35), sample 3 (0.45), sample 4(0.19), sample 5 (0.44), sample 6 (0.19), sample 7 (0.48), sample PF(0.21), Total (0.56). There is no evidence for a toxic effect of meman-tine treatment on RGC counts in normotensive eyes. On average, atotal of over 15,000 cells were counted in the normotensive eyes ofeach treatment group. See Methods for details of cell counting.
TABLE 2. IOP Peak and Mean Values for Individual Animals of Both Treatment Groups
Monkey#
Baseline IOP(mm Hg)
Peak IOP(mm Hg)
IOP (mm Hg)
t1 t2 t3
Vehicle-treated animals96 22.1 (22.8) 50.0 38.7 (21.5) 39.9 (19.5) 38.4 (19.5)104 19.1 (19.5) 61.0 54.5 (23.5) 46.1 (21.0) 39.6 (19.5)91 18.8 (18.7) 55.0 51.0 (19.0) 51.0 (18.5) 49.6 (20.0)93 19.0 (19.0) 55.9 53.4 (16.5) 52.2 (19.5) 53.0 (20.5)92 18.7 (19.1) 61.5 51.1 (18.0) 53.3 (20.5) 54.7 (20.0)Range 18.7–22.1 50.0–61.5 38.7–54.5 39.9–53.3 38.4–54.7
(18.7–22.8) (16.5–23.5) (18.5–21.0) (19.5–20.5)X� � SEM 19.5 � 0.64 58.7 � 2.1 49.8 � 2.8 48.5 � 2.5 47.0 � 3.4
(19.8 � 0.76) (19.7 � 1.2) (19.8 � 0.4) (19.9 � 0.2)Memantine-treated animals
102 19.3 (18.7) 55.0 32.7 (16.0) 28.1 (18.0) 26.5 (15.5)97 21.1 (21.0) 47.0 43.3 (17.0) 37.7 (18.5) 34.3 (19.5)94 18.5 (18.5) 53.0 43.6 (18.0) 37.5 (17.5) 36.5 (20.0)95 21.1 (14.7) 60.0 56.9 (21.5) 51.6 (21.0) 45.0 (23.5)101 20.8 (21.2) 61.5 54.8 (18.5) 58.0 (19.5) 56.6 (19.5)Range 18.5–21.1 47.0–61.5 32.7–56.9 28.1–58.0 26.5–56.6
(14.7–21.2) (16.0–21.5) (17.5–21.0) (15.5–23.5)X� � SEM 20.1 � 0.53 55.3 � 2.6 46.3 � 4.3 42.6 � 5.3 39.8 � 5.1
(18.8 � 1.1) (17.8 � 1.0) (18.9 � 0.6) (18.2 � 0.2)
Values for contralateral normotensive (OS) eyes are shown in parentheses.
IOVS, August 2004, Vol. 45, No. 8 Memantine Treatment of Glaucoma in Monkeys 2645
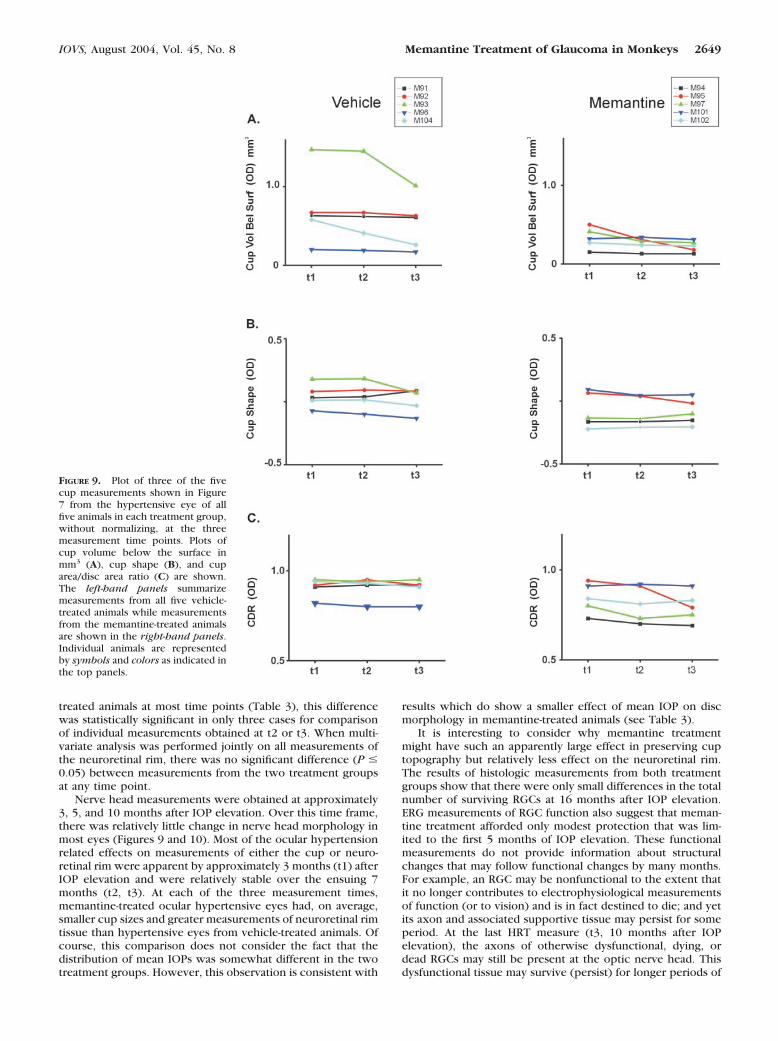
the optic nerve head. In memantine-treated animals, ocularhypertension is associated with much less effect on measure-ments of the cup than that seen in vehicle-treated animals,whereas effects of ocular hypertension on measurements ofthe neuroretinal rim are more similar in the two treatmentgroups. Although these results are summarized for the threemeasurement time points in Table 3, it is difficult to tell fromthis summary how the individual measurements are changingover this time frame. For this reason, values (not normalized)for measurements obtained from the hypertensive eyes of thefive animals in each treatment group were plotted at the threemeasurement time points in Figure 9 for measurements of thecup, and Figure 10 for measurements of the neuroretinal rim.The left-hand panels of Figure 9 show results for measurementsof cup volume below the surface (A), cup shape (B), and cuparea to disc area ratio (C), from vehicle-treated animals, whilethe right-hand panels show results for the same measurementsfrom memantine-treated animals. A comparison of results fromthe two treatment groups shows clearly that memantine-treated animals had, on average, smaller measurements of cupvolume and relative cup area. In fact, the average values for allmeasurements of cup volume or cup area in memantine-treatedanimals were smaller than those of the vehicle-treated animalsat all three time points though these differences were notstatistically significant (P � 0.05; Student’s two-tailed t-test). Itis also clear that cup morphology, in almost all animals, wasrelatively stable over the time frame of these measurements;
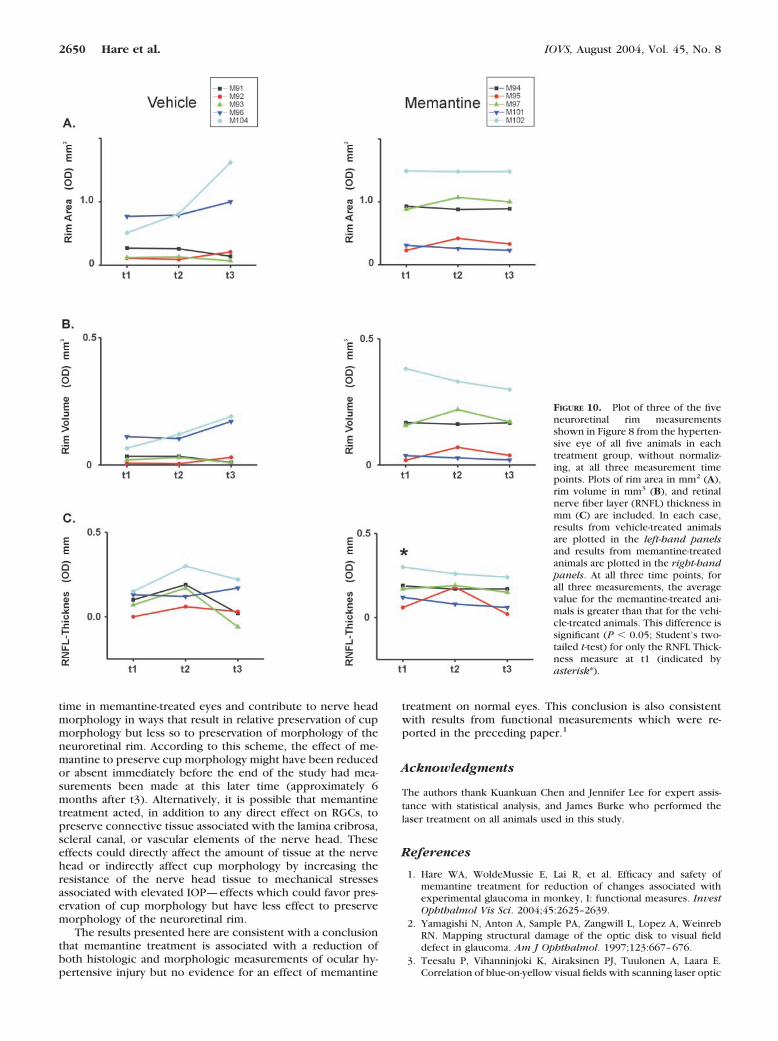
that is, most pressure-related change in cup morphology hadalready occurred by approximately 3 months after IOP eleva-tion and there was relatively little change over the ensuing 7months. A similar pattern is apparent in Figure 10 where it canbe seen that, although some measurements vary somewhatmore over the three time points, memantine-treated animalshad, on average, larger measurements for rim area, rim volume,and RNFL thickness. RNFL thickness at t1 was the only mea-sure of cup or rim morphology for which this difference wasstatistically significant (P � 0.05; Student’s two-tailed t-test). Itis also clear that most IOP-related effects on rim morphologywere apparent by 3 months after induction of chronic ocularhypertension.
It is unlikely that an ocular hypertension-induced increasein OD disc size made any significant contribution to the discmeasurements in this study. Disc size was very stable over thetime course of our measurements from approximately 3months to 10 months after induction of ocular hypertension.For any given hypertensive eye from either treatment group,disc size never varied by �7% over the three measurementtime points. For any given normotensive eye from either treat-ment group, disc area never varied by �2% (data not shown).Any effect of ocular hypertension on disc size would be appar-ent from comparison of the hypertensive (OD) and normoten-sive (OS) disc area in the same animal. When OD/OS disc areameasurements were averaged at each time point, the followingvalues (average � SD) were obtained for vehicle-treated ani-
TABLE 3. Summary for Linear Regression Analysis of Optic Nerve Head Tomography Measures
Memantine Vehicle
P Value**Slope* r* Slope* r*
Cup measuresMean cup depth t1 0.050 0.85 0.206 0.61 0.282
t2 0.033 0.94 0.356 0.85 0.018t3 0.008 0.06 0.250 0.94 0.057
Cup volume below surface t1 0.067 0.72 0.438 0.54 0.314t2 0.038 0.87 0.756 0.74 0.059t3 0.029 0.62 0.524 0.86 0.019
CDR t1 0.012 0.66 0.023 0.59 0.580t2 0.008 0.52 0.033 0.77 0.217t3 0.003 0.19 0.029 0.83 0.116
Cup area t1 0.055 0.98 0.305 0.56 0.294t2 0.071 0.90 0.597 0.84 0.023t3 0.072 0.75 0.578 0.94 0.004
Cup shape t1 �0.073 0.98 �0.101 0.95 0.201t2 �0.052 0.98 �0.147 0.90 0.029t3 �0.050 0.98 �0.076 0.89 0.261
Neuroretinal rim measuresRim area t1 �0.040 0.99 �0.041 0.88 0.955
t2 �0.031 0.99 �0.049 0.99 0.010t3 �0.033 0.95 �0.059 0.95 0.085
Rim/disc t1 �0.031 0.96 �0.039 0.87 0.554t2 �0.024 0.99 �0.048 0.98 0.006t3 �0.026 0.94 �0.059 0.94 0.039
Rim volume t1 �0.057 0.94 �0.037 0.90 0.328t2 �0.035 0.92 �0.031 0.97 0.800t3 �0.032 0.93 �0.039 0.95 0.553
RNFL thickness t1 �0.035 0.92 �0.024 0.50 0.637t2 �0.017 0.68 �0.042 0.64 0.409t3 �0.029 0.84 �0.060 0.94 0.125
RNFL cross section t1 �0.042 0.91 �0.024 0.50 0.497t2 �0.021 0.74 �0.039 0.60 0.564t3 �0.033 0.84 �0.062 0.93 0.195
* Determined from linear regression analysis.** Determined from analysis of covariance.Values represent measures from all five animals in each treatment group for which HRT measures
were made.
2646 Hare et al. IOVS, August 2004, Vol. 45, No. 8
mals: t1, 1.10 � 0.13; t2, 1.11 � 0.11; t3, 1.09 � 0.12.Memantine-treated animals had average OD/OS disc area mea-surements equal to: t1, 1.02 � 0.12; t2, 1.03 � 0.12; t3, 1.03 �0.13. Although there was clearly a tendency for OD disc area tobe greater than OS disc area in vehicle-treated animals, thisdifference was not significant (P � 0.05; Student’s two-tailedt-test) at any time point. There was also no significant differ-ence between the OD/OS disc areas for the two treatmentgroups at any time. Thus, any contribution of an IOP-inducedincrease in OD disc size was likely small for the eyes in thisstudy.
DISCUSSION
In the preceding companion article,1 electrophysiological mea-surements of RGC activity in the ERG responses of these sameanimals showed that eyes with the highest pressures sufferedsevere functional loss by approximately 3 months after IOPelevation and also showed that memantine treatment was as-
sociated with relatively less loss of function. This effect ofmemantine treatment, however, was observed only at theearlier measurement times and was not seen in recordingsmade immediately before sacrifice. It was proposed that, al-though memantine treatment had reduced the rate of RGCinjury/loss, this effect could not be observed if the injury wereallowed to progress over too long a study duration. Given therelatively rapid time course of functional loss in the eyes havingthe highest IOPs, it seems likely that even a relatively largeeffect of memantine treatment to decrease the rate of injurywould not be evident after approximately 16 months of severeocular hypertension. Results of RGC counts from these eyes(Fig. 4) are consistent with this model. A protective effect ofmemantine treatment was seen only when eyes with the high-est IOP were excluded from the analysis (Fig. 5). By excludingthese eyes, the mean rate of injury may be reduced to levelsthat permit a protective effect to be observed even at 16months. However, when the multifocal ERG measurementsobtained immediately before sacrifice were analyzed similarly
FIGURE 7. Summary of normalized(OD/OS) cup measurements fromconfocal laser scans at t2 for the fiveanimals having the highest meanIOPs in each treatment group (seeTable 2). These five animals in eachgroup were the only animals forwhich scans were made. Values areplotted as a function of mean IOP formeasurements of (A) mean cupdepth, (B) cup volume below sur-face, (C) cup area, (D) cup shape(third moment), and (E) global cup/disc ratio. In each panel, linear re-gression is plotted as a heavy line forvehicle-treated animals (filled squares)or a light line for memantine-treatedanimals (open circles). See Table 3for a summary of measurementsmade at all three time points.
IOVS, August 2004, Vol. 45, No. 8 Memantine Treatment of Glaucoma in Monkeys 2647
(exclusion of animals with the highest IOPs), any global orregional effect of memantine treatment could not be demon-strated (data not shown). This is likely due to the fact that thehistologic evidence for protection was seen in perimacular andperipheral retina while the component of the ERG that issensitive to RGC injury could be reliably measured only in themacula where RGC densities are greatest.17 It is not clear whymemantine treatment was associated with a relative preserva-tion of RGC numbers in only the inferior retina. This observa-tion may reflect a greater sensitivity of RGCs in this region toNMDA-type glutamatergic excitotoxic injury. However, apurely random variation in cell counts from either the superioror inferior sample regions cannot be completely excluded.
The finding that memantine treatment was not associatedwith any histologic evidence for toxicity to RGCs (or any otherretinal cell type) in the normotensive eyes (Fig. 6) is consistentwith the observation, based on electrophysiological measure-ments of the ERG and VECP in these same animals (see pre-ceding article1), that memantine treatment had no effect onnormal function of the retina and central visual pathways.
Thus, both functional and histologic/anatomic measurementsshow no evidence for a toxic effect of chronic systemic dosingwith memantine.
Memantine treatment was also associated with a relativepreservation of normal optic nerve head morphology whencompared to vehicle-treated animals; that is, elevated IOP wasassociated with changes in nerve head cup topography (i.e.,cup area, depth, or volume) which were smaller in memantine-treated animals when compared to changes seen in vehicle-treated animals (Fig. 7). When individual measurements of thecup were compared, this effect of memantine treatment wassignificant (P � 0.05) for half of the cup measurements at 5 and10 months after induction of ocular hypertension (Table 3).This memantine treatment effect was highly significant (P �0.0008) at the 10-month measurement point if a model formultivariate analysis of all cup measurements jointly was ap-plied to control for statistical errors associated with multiplecomparisons. Although the slope of IOP-induced change formeasurements of the neuroretinal rim from the memantine-treated group was smaller than that obtained from vehicle-
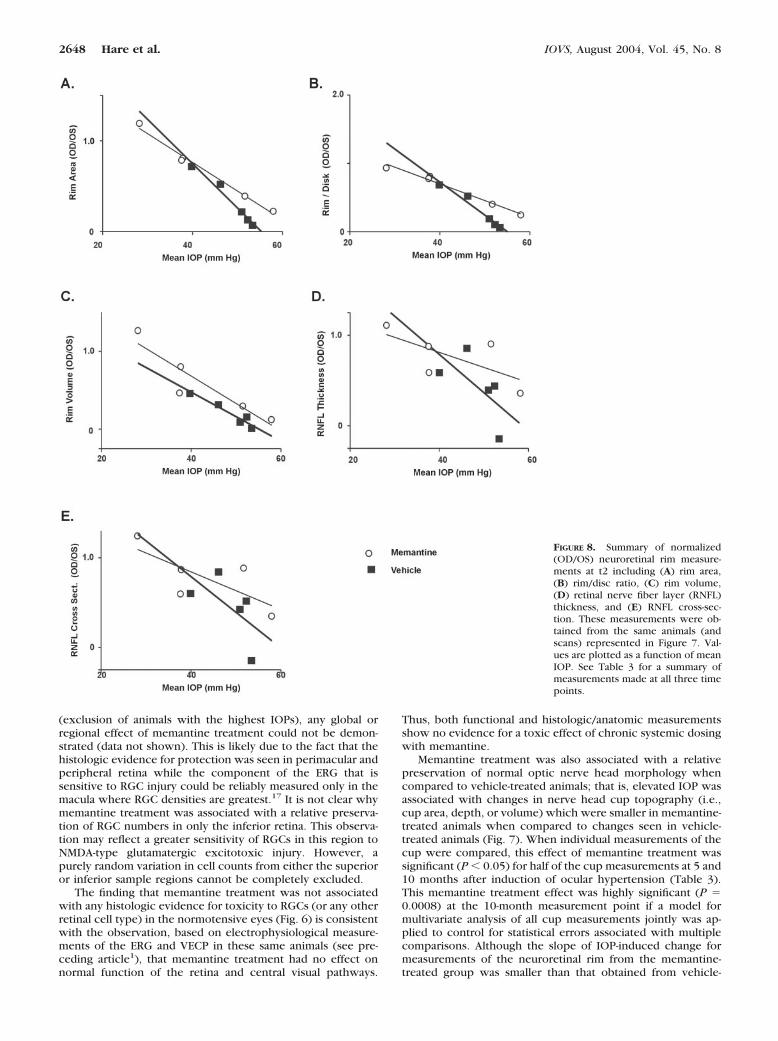
FIGURE 8. Summary of normalized(OD/OS) neuroretinal rim measure-ments at t2 including (A) rim area,(B) rim/disc ratio, (C) rim volume,(D) retinal nerve fiber layer (RNFL)thickness, and (E) RNFL cross-sec-tion. These measurements were ob-tained from the same animals (andscans) represented in Figure 7. Val-ues are plotted as a function of meanIOP. See Table 3 for a summary ofmeasurements made at all three timepoints.
2648 Hare et al. IOVS, August 2004, Vol. 45, No. 8
treated animals at most time points (Table 3), this differencewas statistically significant in only three cases for comparisonof individual measurements obtained at t2 or t3. When multi-variate analysis was performed jointly on all measurements ofthe neuroretinal rim, there was no significant difference (P �0.05) between measurements from the two treatment groupsat any time point.
Nerve head measurements were obtained at approximately3, 5, and 10 months after IOP elevation. Over this time frame,there was relatively little change in nerve head morphology inmost eyes (Figures 9 and 10). Most of the ocular hypertensionrelated effects on measurements of either the cup or neuro-retinal rim were apparent by approximately 3 months (t1) afterIOP elevation and were relatively stable over the ensuing 7months (t2, t3). At each of the three measurement times,memantine-treated ocular hypertensive eyes had, on average,smaller cup sizes and greater measurements of neuroretinal rimtissue than hypertensive eyes from vehicle-treated animals. Ofcourse, this comparison does not consider the fact that thedistribution of mean IOPs was somewhat different in the twotreatment groups. However, this observation is consistent with
results which do show a smaller effect of mean IOP on discmorphology in memantine-treated animals (see Table 3).
It is interesting to consider why memantine treatmentmight have such an apparently large effect in preserving cuptopography but relatively less effect on the neuroretinal rim.The results of histologic measurements from both treatmentgroups show that there were only small differences in the totalnumber of surviving RGCs at 16 months after IOP elevation.ERG measurements of RGC function also suggest that meman-tine treatment afforded only modest protection that was lim-ited to the first 5 months of IOP elevation. These functionalmeasurements do not provide information about structuralchanges that may follow functional changes by many months.For example, an RGC may be nonfunctional to the extent thatit no longer contributes to electrophysiological measurementsof function (or to vision) and is in fact destined to die; and yetits axon and associated supportive tissue may persist for someperiod. At the last HRT measure (t3, 10 months after IOPelevation), the axons of otherwise dysfunctional, dying, ordead RGCs may still be present at the optic nerve head. Thisdysfunctional tissue may survive (persist) for longer periods of
FIGURE 9. Plot of three of the fivecup measurements shown in Figure7 from the hypertensive eye of allfive animals in each treatment group,without normalizing, at the threemeasurement time points. Plots ofcup volume below the surface inmm3 (A), cup shape (B), and cuparea/disc area ratio (C) are shown.The left-hand panels summarizemeasurements from all five vehicle-treated animals while measurementsfrom the memantine-treated animalsare shown in the right-hand panels.Individual animals are representedby symbols and colors as indicated inthe top panels.
IOVS, August 2004, Vol. 45, No. 8 Memantine Treatment of Glaucoma in Monkeys 2649
time in memantine-treated eyes and contribute to nerve headmorphology in ways that result in relative preservation of cupmorphology but less so to preservation of morphology of theneuroretinal rim. According to this scheme, the effect of me-mantine to preserve cup morphology might have been reducedor absent immediately before the end of the study had mea-surements been made at this later time (approximately 6months after t3). Alternatively, it is possible that memantinetreatment acted, in addition to any direct effect on RGCs, topreserve connective tissue associated with the lamina cribrosa,scleral canal, or vascular elements of the nerve head. Theseeffects could directly affect the amount of tissue at the nervehead or indirectly affect cup morphology by increasing theresistance of the nerve head tissue to mechanical stressesassociated with elevated IOP—effects which could favor pres-ervation of cup morphology but have less effect to preservemorphology of the neuroretinal rim.
The results presented here are consistent with a conclusionthat memantine treatment is associated with a reduction ofboth histologic and morphologic measurements of ocular hy-pertensive injury but no evidence for an effect of memantine
treatment on normal eyes. This conclusion is also consistentwith results from functional measurements which were re-ported in the preceding paper.1
Acknowledgments
The authors thank Kuankuan Chen and Jennifer Lee for expert assis-tance with statistical analysis, and James Burke who performed thelaser treatment on all animals used in this study.
References
1. Hare WA, WoldeMussie E, Lai R, et al. Efficacy and safety ofmemantine treatment for reduction of changes associated withexperimental glaucoma in monkey, I: functional measures. InvestOphthalmol Vis Sci. 2004;45:2625–2639.
2. Yamagishi N, Anton A, Sample PA, Zangwill L, Lopez A, WeinrebRN. Mapping structural damage of the optic disk to visual fielddefect in glaucoma. Am J Ophthalmol. 1997;123:667–676.
3. Teesalu P, Vihanninjoki K, Airaksinen PJ, Tuulonen A, Laara E.Correlation of blue-on-yellow visual fields with scanning laser optic
FIGURE 10. Plot of three of the fiveneuroretinal rim measurementsshown in Figure 8 from the hyperten-sive eye of all five animals in eachtreatment group, without normaliz-ing, at all three measurement timepoints. Plots of rim area in mm2 (A),rim volume in mm3 (B), and retinalnerve fiber layer (RNFL) thickness inmm (C) are included. In each case,results from vehicle-treated animalsare plotted in the left-hand panelsand results from memantine-treatedanimals are plotted in the right-handpanels. At all three time points, forall three measurements, the averagevalue for the memantine-treated ani-mals is greater than that for the vehi-cle-treated animals. This difference issignificant (P � 0.05; Student’s two-tailed t-test) for only the RNFL Thick-ness measure at t1 (indicated byasterisk*).
2650 Hare et al. IOVS, August 2004, Vol. 45, No. 8
disk measurements. Invest Ophthalmol Vis Sci. 1997;38:2452–2459.
4. Lester M, Swindale NV, Mikelberg FS. Sector-based analysis of opticnerve head shape parameters and visual field indices in healthy andglaucomatous eyes. J Glaucoma. 1997;6:371–376.
5. Lester M, Mikelberg FS, Courtright P, Drance SM. Correlationbetween the visual field indices and Heidelberg Retina Tomographparameters. J Glaucoma. 1997;6:78–82.
6. Anton A, Yamagishi N, Zangwill L, Sample PA, Weinreb RN. Map-ping structural to functional damage in glaucoma with standardautomated perimetry and confocal scanning laser ophthalmos-copy. Am J Ophthalmol. 1998;125:436–446.
7. Kono Y, Zangwill L, Sample PA, et al. Relationship between para-papillary atrophy and visual field abnormality in primary open-angle glaucoma. Am J Ophthalmol. 1999;127:674–680.
8. Bosworth CF, Sample PA, Williams JM, Zangwill L, Lee B, WeinrebRN. Spatial relationship of motion automated perimetry and opticdisk topography in patients with glaucomatous optic neuropathy.J Glaucoma. 1999;8:281–289.
9. Rolle T, Salvini S, Favero C, et al. Topographic sector-by-sectoranalysis of the optic nerve head by HRT and correlation with frankglaucoma perimetric indices. ACTA Ophthalmol Scand. 2000;232:29–31.
10. Martin LM, Lindblom B, Gedda UK. Concordance between resultsof optic disk tomography and high-pass resolution perimetry inglaucoma. J Glaucoma. 2000;9:28–33.
11. Yucel YH, Gupta N, Kalichman MW, et al. Relationship of opticdisk topography to optic nerve fiber number in glaucoma. ArchOphthalmol. 1998;116:493–497.
12. Quigley HA, Dunkelberger GR, Green WR. Chronic human glau-coma causing selectively greater loss of large optic nerve fibers.Ophthalmol. 1988;95:357–363.
13. Quigley HA, Dunkelberger GR, Green WR. Retinal ganglion cellatrophy correlated with automated perimetry in human eyes withglaucoma. Am J Ophthalmol. 1989;107:453–464.
14. Kerrigan-Baumrind LA, Quigley HA, Pease ME, Kerrigan DF, Mitch-ell RS. Number of ganglion cells in glaucoma eyes compared withthreshold visual field tests in the same persons. Invest OphthalmolVis Sci. 2000;41:741–748.
15. Desatnik H, Quigley HA, Glovinsky Y. Study of central retinalganglion cell loss in experimental glaucoma in monkey eyes. JGlaucoma. 1996;5:46–53.
16. Harwerth RS, Carter-Dawson L, Shen F, Smith EL, Crawford MLJ.Ganglion cell losses underlying visual field defects from exper-imental glaucoma. Invest Ophthalmol Vis Sci. 1999;40:2242–2250.
17. Hare WA, Ton H, Ruiz G, Feldmann B, Wijono M, WoldeMussie E.Characterization of retinal injury using measurements obtainedwith both conventional and multifocal methods in chronic ocularhypertensive primates. Invest Ophthalmol Vis Sci. 2001;42:127–136.
18. Harwerth RS, Crawfors MLJ, Frishman LJ, Viswanathan S, Smith EL,Carter-Dawson L. Visual field defects and neural losses from ex-perimental glaucoma. Prog Retina Eye Res. 2002;21:91–125.
19. Gaasterland D, Kupfer C. Experimental glaucoma in the rhesusmonkey. Invest Ophthalmol. 1974;13:455–457.
20. Weinreb RN, Lusky M, Bartsch DU, Morsman D. Effect of repetitiveimaging on topographic measurements of the optic nerve head.Arch Ophthalmol. 1993;111:636–638.
21. Snedecor GW, Cochran WG. Statistical Methods. 8th ed. Ames, IA:Iowa State University Press;1989:158–160.
22. Snedecor GW, Cochran WG. Statistical Methods. 8th ed. Ames, IA:Iowa State University Press;1989:390–393.
23. Hochberg Y. A sharper Bonferroni procedure for multiple signifi-cance testing. Biometrika. 1988;75:800–803.
24. Morrison DF. Multivariate Statistical Methods. 2nd ed. New York:McGraw-Hill; 1976.
25. Mardia KV, Kent JT, Bibby JM. Multivariate Analysis. London:Academic Press; 1979.
IOVS, August 2004, Vol. 45, No. 8 Memantine Treatment of Glaucoma in Monkeys 2651