Embed Size (px)
Citation preview
International Journal of Environmental Monitoring and Protection 2014; 1(5): 68-75
Published online January 20, 2015 (http://www.openscienceonline.com/journal/ijemp)
The effects of lead, cadmium and mercury on Moolgardaseheli and seawater in Khawr-Mukalla, Hadhramout Coast, Gulf of Aden
Mohammed Al-Dohail*, Abdullah Bawazir, Nabil Al-Hodaifi
Department of Marine Biology, Group Research, Faculty of Environmental Sciences and Marine Biology, Hadhramout University, Mukalla,
Yemen
Email address
[email protected] (M. Al-Dohail)
To cite this article Mohammed Al-Dohail, Abdullah Bawazir, Nabil Al-Hodaifi. The Effects of Lead, Cadmium and Mercury on Moolgardaseheli and
Seawater in Khawr-Mukalla, Hadhramout Coast, Gulf of Aden. International Journal of Environmental Monitoring and Protection.
Vol. 1, No. 5, 2014, pp. 68-75.
Abstract
This experiment was carried out to determine the concentration of lead (Pb2+),
cadmium (Cd2+)
and mercury (Hg2+)
in
muscles, liver and gills of Blue spot mullet, Moolgardaseheli and filtered surface water in Khawr-Mukalla (Man-Made
Creek), Hadhramout coast. Three stations at Khawr-Mukalla were studied including End-Khawr, Mid-Khawr and Mouth-
Khawr. The trial were undertaken along the four seasons of the year 2012, during which a total of 108 specimens of fish and
108 sample of surface seawater were collected and analyzed. The results showed that there were no significant differences
(P>0.05), regarding the concentration of Pb2+
, Cd2+
and Hg2+
in muscles of M.seheli throughout the seasons: winter, spring,
summer and autumn in Khawr-Mukalla, whereas there were significant differences (P<0.05) in liver and gills of M.seheli.
Besides, there were no significant differences (P>0.05), regarding the concentration of Pb2+
, Cd2+
and Hg2+
in the filtered
surface water of Mid-Khawr and Mouth-Khawr except End-Khawr, for the period of all seasons. From these results, we
conclude that the heavy metals (Pb2+
, Cd2+
and Hg2+
) in the muscles and gills of M.seheli, at Khawr-Mukalla stations were
still in range scale of international pollution standard except in the liver of M.seheli which was high a little bit, whereas
filtered surface seawater at Khawr-Mukalla stations were polluted. Therefore, the treatment of sewage before drain into
Khawr-Mukalla is necessary to save the marine ecosystem in better condition in order to reduce pollution, as well as further
studies are necessary to monitoring the pollution by heavy metals in this area.
Keyword
Heavy Metals, Moolgardaseheli, Surface Seawater, Seasons
1. Introduction
In the last few decades, the environmental contaminations
by means of heavy metals have been taken a large attention.
Marine ecosystems are contaminated with heavy metals,
which caused by different factors (Sekwele, 2008). These
elements such as lead (Pb2+
), cadmium (Cd2+
) and mercury
(Hg2+
) released from different sources that are from runoff,
sewage, industrial waste, mining operations and other human
activities, which reach to the aquatic ecosystem, caused
contamination (Reichelt & Jones, 1994); (Velez & Montoro,
1998). Also, some studies(Lokhande & Kelkar, 1999);
(Henning, Snyman, & Aveling, 2001)reported that heavy
metals such as Pb2+
, Cd2+
and Hg2+
are obtained in high
concentrations in sewage sludge.
Besides, (Conacher, Page , & Ryam, 1993) claimed that
contamination of aquatic ecosystems with heavy metals have
been known as a serious problem of pollutions. (Lata &
Rohindra, 2002)stated that heavy metals such as, Pb2+
, Cd2+
and Hg2+
are hazardous to the human health and the
environment. Because the heavy metals are toxicity, they are
considered one of the most serious pollutants (Pekey, 2006).
69 Mohammed Al-Dohailet al.: The Effects of Lead, Cadmium and Mercury on Moolgardaseheli and Seawater in Khawr-Mukalla,
Hadhramout Coast, Gulf of Aden
Non-essential heavy metals such as Pb2+
, Cd2+
and Hg2+
have ability to accumulate in living organisms (Shanthi &
Gajendran, 2009); however, cumulative rate of heavy
metals in aquatic organisms, which stay over a long period
in large amounts, depends on the ability of living
organisms to absorb minerals and the concentration of
minerals in water systems (King & Jonathan, 2003).Also,
(Odoemelam, Iwuazor, & Ozuo, 1999) mentioned that the
age of fish, the lipid content in the tissue and the feeding
habits are the important factors that affect the
accumulation of heavy metals in fish that they are
transferred to humans through the food chain; the quantity
of these metals between fish species depend on age,
developmental stage and other physiological factors (J. &
Abbasi, 2010).
Moreover, (Nisha & Pandey, 1984) and (Duruibe &
Ogwuegbu, 2007)reported that Pb2+
, Cd2+
, Hg2+
are toxic
to living organisms even at low concentrations. Heavy
metals can be also deposited in the organs of aquatic
organisms and become toxic when its accumulation
reaches high levels through the effects of bioaccumulation
by the food chain process (Huang, 2003). Most of heavy
metals may accumulate in fish tissues (Mansour & Sidky,
2002); they move in fish body through several ways: skin,
gills, oral pathway of water, food and non-food particles
(Obasohan, 2008).Therefore, numerous fish type has been
used as bio-indicators of heavy metal contamination
(Svobodova, Celechovska, & Kolarova, 2004). Hence,
concentrations of heavy metals in the fish organs could be
indicated the level of pollution in water and food (Farkas,
Salanki, & Varanka, 2000).
Blue spot mullet, Moolgardaseheli that feed on
microalgae, diatoms, filamentous algae and detritus
associated with sand and mud. It enters creeks and rivers,
and put the eggs in pelagic zone and non-adhesive. These
fish caught by using barrier nets, stakenets, and pouch nets
(Breder & Rosen, 1966); (Harrison & Senou, 1997)
The major sources of proteins in Mukalla city are fish,
which consumed in high demand in Hudramout
governorate; however, it is believed that fish (M. seheli)
contaminated with heavy metals due to increasing industry
and human wastes in Khawr-Mukalla. Recently,
population is increasing in the city of Mukalla.
Accordingly, in the marine ecosystem, the amounts of
industrial and household sewage may lead to more
concentrations of heavy metals such as Pb2+
, Cd2+
and
Hg2+
, causing severe pollution source in Khawr-Mukalla
that transport pollutants to humans through the food chain.
Information regarding the concentrations of heavy metals
such as Pb2+
, Cd2+
and Hg2+
is therefore none in the
Khawr-Mukalla and its scope merits examination.
Therefore, the present study was thus conducted to
determine concentration of the most important heavy
metal pollutants (Pb2+
, Cd2+
and Hg2+
) in the M.seheli ,
which wide food consumption in Mukalla city, and in the
surface seawater in Khawr-Mukalla creek.
2. Materials and Methods
2.1. Study Area
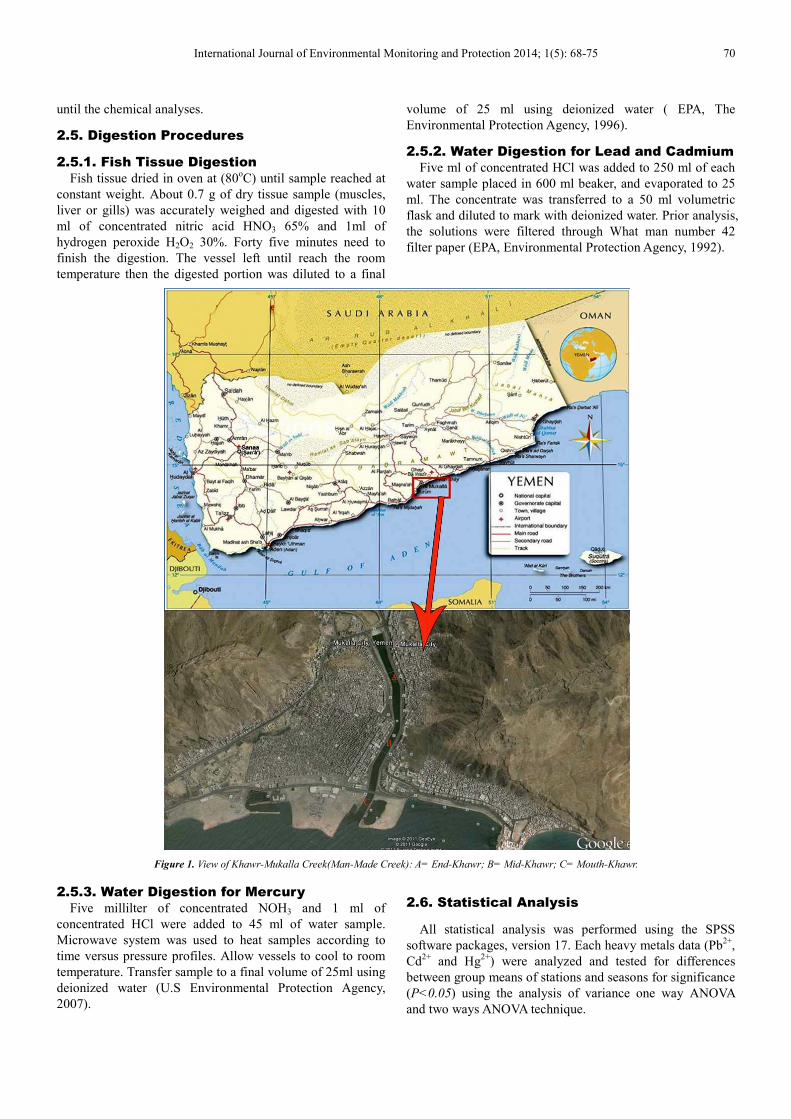
The Khawr-Mukalla is a man-made creek in Mukalla city
which is situated on longitude 49.100 and latitude 14.33
0,
about 480 km east of Aden. Khawr-Mukalla, which divided
Mukalla city into two halves mediates the city and its channel
extends along more than 1,500 meters and an average width
60 m, changed water by tides phenomenon. Khawr-Mukalla
could be divided to three stations. The first station is called
Mouth-Khawr, which connected to open sea; the second one
is called Mid-Khawr, which sewage pipe drain in, and the
third station is End-Khawr, which adjacent to land (Fig.1).
The main purpose of Khawr-Mukalla is to get rid of the
sewage and a tourist outlet.
2.2. Sampling
The first sampling was chosen on the 4th
of January 2012
and the last sampling was taken on the 4th
of December 2012.
During the surveys, fish and seawater samples were collected
monthly to determine heavy metals including Pb2+
, Cd2+
and
Hg2+
. The concentration of these heavy metals in muscles,
liver and gills of Moolgardaseheli and surface seawater
samples in Khawr-Mukalla were measured by using the
Atomic Absorption Spectrophotometer (The Buck Scientific
Single Beam, U. S. A.)in Marine Pollution Lab in faculty of
Environmental Sciences and Marine Biology, Hadhramout
University. And temperature was also determined from water
at each site during sampling period.
2.3. Fish Sampling
A total of 108 specimens of fish were collected with
helping of a local fisherman from Khawr-Mukalla monthly;
then placed immediately in poly-ethylene bags, put into a
polystyrene icebox, after that brought to the laboratory at the
faculty of Environmental Sciences and Marine Biology,
Hadramout University. Fish were washed with deionized
water, sealed in polyethylene bags and kept in a freezer at -20
Co until chemical analysis ( U. S. Environmental Protection
Agency, 2000).
2.4. Water Sampling
A total of 108 of surface seawater samples were collected
for analysis monthly from the three Khawr-Mukalla stations.
The bottles (1 liter polyethylene bottles) were rinsed at least
three times with water from the sampling site and then the
bottles were immersed to about 20-30 cm below the water
surface to prevent contamination of heavy metals from air.
For mercury analysis water samples kept in sealable glasses, using specially for mercury test (Tsuguyoshi, 2004). All
water samples were immediately brought to the laboratory
where they filtered through What man No.41 (0.45 µm pore
size) filter paper. The samples were acidified with 2 ml nitric
acid to prevent precipitation of metals, reduce adsorption of
the analysts onto the walls of containers and to avoid
microbial activity, and then water samples were stored at 4°C
International Journal of Environmental Monitoring and Protection 2014; 1(5): 68-75 70
until the chemical analyses.
2.5. Digestion Procedures
2.5.1. Fish Tissue Digestion
Fish tissue dried in oven at (80oC) until sample reached at
constant weight. About 0.7 g of dry tissue sample (muscles,
liver or gills) was accurately weighed and digested with 10
ml of concentrated nitric acid HNO3 65% and 1ml of
hydrogen peroxide H2O2 30%. Forty five minutes need to
finish the digestion. The vessel left until reach the room
temperature then the digested portion was diluted to a final
volume of 25 ml using deionized water ( EPA, The
Environmental Protection Agency, 1996).
2.5.2. Water Digestion for Lead and Cadmium
Five ml of concentrated HCl was added to 250 ml of each
water sample placed in 600 ml beaker, and evaporated to 25
ml. The concentrate was transferred to a 50 ml volumetric
flask and diluted to mark with deionized water. Prior analysis,
the solutions were filtered through What man number 42
filter paper (EPA, Environmental Protection Agency, 1992).
Figure 1. View of Khawr-Mukalla Creek(Man-Made Creek): A= End-Khawr; B= Mid-Khawr; C= Mouth-Khawr.
2.5.3. Water Digestion for Mercury
Five millilter of concentrated NOH3 and 1 ml of
concentrated HCl were added to 45 ml of water sample.
Microwave system was used to heat samples according to
time versus pressure profiles. Allow vessels to cool to room
temperature. Transfer sample to a final volume of 25ml using
deionized water (U.S Environmental Protection Agency,
2007).
2.6. Statistical Analysis
All statistical analysis was performed using the SPSS
software packages, version 17. Each heavy metals data (Pb2+
,
Cd2+
and Hg2+
) were analyzed and tested for differences
between group means of stations and seasons for significance
(P<0.05) using the analysis of variance one way ANOVA
and two ways ANOVA technique.

71 Mohammed Al-Dohailet al.: The Effects of Lead, Cadmium and Mercury on Moolgardaseheli and Seawater in Khawr-Mukalla,
Hadhramout Coast, Gulf of Aden
3. Results
3.1. Fish Tissues
The results showed that there were no significant
differences (P>0.05), using one way ANOVA, regarding the
concentration of lead (Pb2+
), cadmium(Cd2+
) and mercury
(Hg2+
) in the muscles of fish, Blue spot mullet,
Moolgardaseheli throughout the seasons: winter, spring,
summer and autumn at Khawr-Mukalla; however, the highest
concentration of Pb2+
in the muscles of fish was 0.098 ppm
on summer and the lowest concentration was 0.057 ppm on
autumn. Also, the highest concentration of Cd2+
in the
muscles of fish was 0.01 ppm on summer, whereas the lowest
concentration was 0.007 ppm on autumn; besides, the highest
concentration of Hg2+
in the muscles of fish was 0.017 ppm
on summer, whereas the lowest concentration was 0.006 ppm
on spring, as summarized in Table 1.
On the other hand, in the liver of fish, M.seheli was
significant differences (P<0.05), using one way ANOVA,
regarding the concentration of Pb2+
, Cd2+
except
Hg2+
throughout the seasons: winter, spring, summer and
autumn at Khawr-Mukalla. The highest concentration of Pb2+
in the liver of fish was 0.64 ppm on summer and the lowest
concentration was 0.14 ppm on winter. The same pattern
occurs regarding Cd2+
, the highest concentration in the liver
of fish was 0.031 ppm on summer and the lowest
concentration was 0.021 ppm on winter; but, there was no
significant difference (P>0.05) regarding the concentration
of Hg2+
in the liver of fish, as summarized in Table 1.
There were significant differences (P<0.05), using one
way ANOVA, regarding the concentration of Pb2+
in gills of
fish, M.seheli for the duration of the seasons: winter, spring,
summer and autumn at Khawr-Mukalla. The highest
concentration in the gills of fish was 0.24 ppm on summer
and the lowest concentration was 0.09 ppm on winter;
however, there was no significant difference (P>0.05)
regarding the concentration of Cd2+
and Hg2+
in the gills of
fish, whereas they had the same pattern of Pb2+
, as
summarized in Table 1.
Table 1. The mean of concentration (ppm ) for lead, cadmium and mercury in fish body, Moolgardaseheliduring during seasons at Khawr-Mukalla,
Hadramout coast
Winter Spring Summer Autumn
Muscles
Pb2+ 0.061 ± 0.02 a 0.084 ± 0.03 a 0.098 ± 0.03 a 0.057 ± 0.02 a
Cd2+ 0.007 ± 0.002 a 0.008 ± 0.003 a 0.01 ± 0.002 a 0.007 ± 0.004 a
Hg2+ 0.007 ± 0.004 a 0.017 ± 0.005 a 0.017 ± 0.003 a 0.006 ± 0.01 a
Liver
Pb2+ 0.141 ± 0.03 a 0.466 ± 0.23 b c 0.642 ± 0.06 c 0.312 ± 0.19 ab
Cd2+ 0.021 ± 0.002 a 0.020 ± 0.001 ab 0.031 ± 0.003 b 0.019 ± 0.01 ab
Hg2+ 0.011 ± 0.001 a 0.013 ± 0.01 a 0.016 ± 0.003 a 0.015 ± 0.005 a
Gills
Pb2+ 0.086 ± 0.02 a 0.171 ± 0.08 ab 0.237 ± 0.01 b 0.158 ± 0.08 ab
Cd2+ 0.023 ± 0.02 a 0.024 ± 0.01 a 0.026 ± 0.01 a 0.025 ± 0.02 a
Hg2+ 0.01 ± 0.003 a 0.011 ± 0.001 a 0.015 ± 0.005 a 0.014 ± 0.01 a
Results are expressed as mean ± SD.
Mean values in the same row with different superscript letters indicate significant (P<0.05) difference.
Table 2. The mean of concentration (ppm) for lead, cadmium and mercury during the seasons in the filtered surface water of Khawr-Mukalla stations,
Hadramout coast
Winter Spring Summer Autumn
End-Khawr
Pb2+ 0.071 ± 0.01 a 0.076 ± 0.015 a 0.166 ± 0.082 b 0.084 ± 0.009 a
Cd2+ 0.015 ± 0.01 a 0.031 ± 0.024 a 0.031 ± 0.014 a 0.020 ± 0.012 a
Hg2+ 0.006 ± 0.001 a 0.005 ± 0.002 a 0.009 ± 0.001 a 0.008 ± 0.003 a
Mid-Khawr
Pb2+ 0.063 ± 0.015 a 0.081 ± 0.013 a 0.152 ± 0.084 a 0.103 ± 0.032 a
Cd2+ 0.020 ± 0.011 a 0.023 ± 0.016 a 0.043 ± 0.024 a 0.027 ± 0.01 a
Hg2+ 0.005 ± 0.001 a 0.006 ± 0.001 a 0.009 ± 0.006 a 0.006 ± 0.001 a
Mouth-Khawr
Pb2+ 0.040 ± 0.009 a 0.044 ± 0.022 a 0.077 ± 0.015 a 0.043 ± 0.042 a
Cd2+ 0.011 ± 0.001 a 0.011 ± 0.003 a 0.016 ± 0.008 a 0.012 ± 0.002 a
Hg2+ 0.006 ± 0.001 a 0.005 ± 0.002 a 0.007 ± 0.001 a 0.006 ± 0.002 a
Results are expressed as mean ± SD.
Mean values in the same row with different superscript letters indicate significant (P<0.05) difference.
3.2. Surface Seawater
The results of the present study showed that there were
significant differences (P<0.05), using one way ANOVA,
regarding the concentration of Pb2+
in the filtered surface water
of End-Khawr, for the period of seasons: winter, spring,
summer and autumn. The highest concentration of Pb2+
in
filtered water surface of End-Khawr was 0.17 ppm on summer
and the lowest concentration was 0.07 ppm on winter; however,
there were no significant differences (P>0.05) regarding the
concentration of Cd2+
and Hg2+
in filtered surface water of
End-Khawr. The highest concentration of Cd2+
in filtered
surface water of End-Khawr was 0.03 ppm on summer and the
lowest concentration was 0.01 ppm on winter; nevertheless,
the concentration of Hg2+
in filtered surface water of End-
Khawr including the highest concentration was 0.009 ppm on
summer and the lowest concentration was 0.005 ppm on spring,
as summarized in Table 2.
International Journal of Environmental Monitoring and Protection 2014; 1(5): 68-75 72
Further, there were no significant differences (P>0.05),
using one way ANOVA, regarding the concentration of Pb2+
,
Cd2+
and Hg2+
in the filtered surface water of Mid-Khawr in
seasons: winter, spring, summer and autumn; however, the
highest concentration of Pb2+
in the filtered surface water of
Mid-Khawr was 0.15 ppm on summer and the lowest
concentration was 0.06 ppm on winter. The concentration of
Cd2+
in the filtered surface water of Mid-Khawr had the same
pattern as Pb2+
.The highest concentration of Cd2+
in the
surface water was 0.04 ppm on summer and the lowest
concentration was 0.02 ppm on winter; nonetheless, the
highest concentration of Hg2+
in the filtered surface water of
Mid-Khawr was 0.009 ppm on autumn and the lowest
concentration was 0.005 ppm on winter, as summarized in
Table 2.
On the other hand, the results showed that there were no
significant differences (P>0.05), using one way ANOVA,
regarding the concentration ofPb2+
, Cd2+
and Hg2+
in the
filtered surface water of Mouth-Khawr throughout seasons:
winter, spring, summer and autumn. The highest
concentration of Pb2+
in the filtered surface water of Mouth-
Khawr was 0.08 ppm on summer and the lowest
concentration was 0.04 ppm on winter; however, the highest
concentration of Cd2+
in the filtered surface water of Mouth-
Khawr was 0.016 ppm on summer and the lowest
concentration was 0.01 ppm on winter. Besides, the highest
concentration of Hg2+
in filtered surface water of Mouth-
Khawr was 0.007 ppm on summer and the lowest
concentration was 0.005 ppm on spring, as summarized in
Table 2.
Table 3. The mean of concentration (ppm) for lead, cadmium and mercury in
the filtered surface water of Khawr-Mukalla stations, Hadramout coast
End-Khawr Mid-Khawr Mouth-Khawr
Pb2+ 0.11 ± 0.05 b 0.1 ± 0.04 b 0.052 ± 0.02 a
Cd2+ 0.025 ± 0.006 b 0.027 ± 0.012 b 0.012 ± 0.003 a
Hg2+ 0.007 ± 0.002 a 0.007 ± 0.002 a 0.006 ± 0.002 a
Results are expressed as mean ± SD.
Mean values in the same row with different superscript letters indicate
significant (P<0.05) difference.
In the present study the results showed that there were
significant differences (P<0.05) , analyze by using two ways
ANOVA, regarding the concentration of Pb2+
and Cd2+
in
filtered surface water of Mouth-Khawr, Mid-Khawr and
End-Khawr station, whereas there was no significant
differences (P>0.05) regarding the concentration of Hg2+
in
filtered surface water of these stations. The highest
concentration of Pb2+
in filtered surface water of End-Khawr
was 0.11 ppm, whereas the lowest concentration was 0.052
ppm of Mouth-Khawr station; however, the highest
concentration of Cd2+
in filtered surface water of Mid-Khawr
was 0.027 ppm, whereas the lowest concentration was 0.012
ppm of Mouth-Khawr station. The concentration of Hg2+
in
filtered surface water had the same pattern of Pb2+
and Cd2+
;
but, the highest concentration of Hg2+
in the filtered surface
water of Mid-Khawr was 0.007 ppm, whereas the lowest
concentration was 0.006 ppm of Mouth-Khawr station, as
summarized in Table 3.
In addition, when the results of present study were
analyzed by using two ways ANOVA in filtered surface
water of Khawr-Mukalla stations during the seasons, it
showed that there were significant differences (P<0.05)
regarding the concentration of Pb2+
, Cd2+
and Hg2+
. The
highest concentration of Pb2+
in the filtered surface water was
0.132 ppm on summer, whereas the lowest concentration was
0.058 ppm on winter; however, the highest concentration of
Cd2+
in filtered surface water was 0.030 ppm on summer,
whereas the lowest concentration was 0.014 ppm on winter
regarding the all Khawr-Mukalla stations (End-Khawr , Mid-
Khawr and Mouth-Khawr). Also, the concentration of Hg2+
in the filtered surface water had the same pattern of Pb2+
and
Cd2+
; but, the highest concentration of Hg2+
in surface water
of Khawr-Mukalla was 0.008ppm on autumn, whereas the
lowest concentration was 0.005 ppm on spring, as
summarized in Table 4.
Table 4. The mean of concentration (ppm) for lead, cadmium and mercury
during the seasons in the filtered surface water of Khawr-Mukalla,
Hadramout coast
Winter Spring Summer Autumn
Pb2+ 0.058 ± 0.02 a 0.067 ± 0.02 a 0.132 ± 0.05 b 0.078 ± 0.03 ab
Cd2+ 0.014 ± 0.004 a 0.021 ± 0.01 ab 0.030 ± 0.01 b 0.019 ± 0.007 a
Hg2+ 0.006 ± 0.001 a 0.005 ± 0.001 a 0.007± 0.001 ab 0.008 ± 0.001b
Results are expressed as mean ± SD.
Mean values in the same row with different superscript letters indicate
significant (P<0.05) difference.
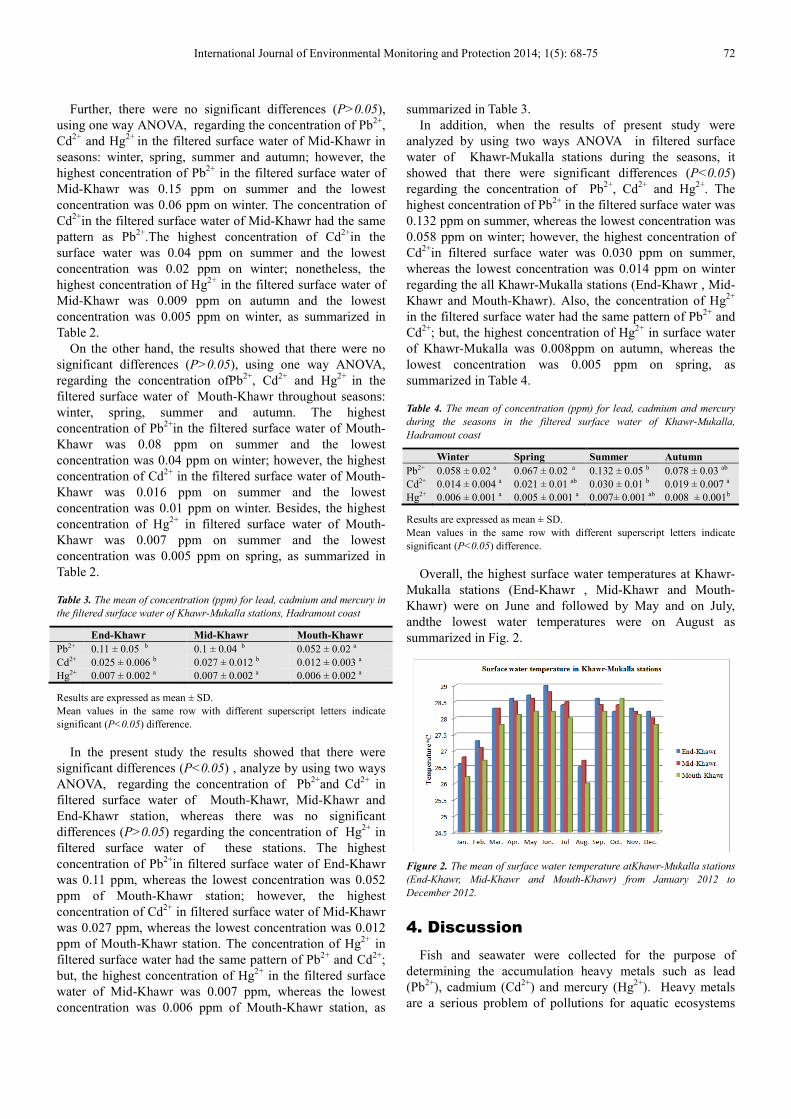
Overall, the highest surface water temperatures at Khawr-
Mukalla stations (End-Khawr , Mid-Khawr and Mouth-
Khawr) were on June and followed by May and on July,
andthe lowest water temperatures were on August as
summarized in Fig. 2.
Figure 2. The mean of surface water temperature atKhawr-Mukalla stations
(End-Khawr, Mid-Khawr and Mouth-Khawr) from January 2012 to
December 2012.
4. Discussion
Fish and seawater were collected for the purpose of
determining the accumulation heavy metals such as lead
(Pb2+
), cadmium (Cd2+
) and mercury (Hg2+
). Heavy metals
are a serious problem of pollutions for aquatic ecosystems

73 Mohammed Al-Dohailet al.: The Effects of Lead, Cadmium and Mercury on Moolgardaseheli and Seawater in Khawr-Mukalla,
Hadhramout Coast, Gulf of Aden
(Conacher, Page , & Ryam, 1993)because they are toxicity
(Pekey, 2006), and are hazardous to the human health and the
environment (Lata & Rohindra, 2002).
4.1. Fish Tissues
The present study showed that there were no significant
differences (P>0.05),regarding the concentration of Pb2+
,
Cd2+
and Hg2+
in muscles of fish, Blue spot mullet,
Moolgardaseheli (Table 1) throughout the seasons: winter,
spring, summer and autumn at Khawr-Mukalla. This
observation probably indicates that the muscles could be
accumulated the heavy metals and however in fluenced by
the habitat of fish, feeding behavior and migration; as
mentioned by (Mansour & Sidky, 2002)who said that the
most of heavy metals may accumulate in fish tissues.
Overall, the results also showed that the highest
concentration ofPb2+
, Cd2+
and Hg2+
in muscles of M. seheli
was on summer and the lowest concentration was on autumn.
This observation probably indicates that the amount of
sewage which drain off into Khawr-Mukallaon summer were
so much as a result of using a lot of water in these hot months
by residents of Mukalla city as well as seawater are more
mixing by moving currents(upwelling phenomena) on
autumn that lead to dispersion the heavy metals in seawater
column. This suggestion supported by environmental data
which showed that the temperatures of water were the
highest on June followed by May, and also drops on August
due to upwelling phenomena (Fig.2). The previous studies
showed that the concentration of Pb2+
and Cd2+
in a Sardinella
spp. and in a Sardinella aurita were higher than the
concentration of Pb2+
and Cd2+
in the present study in a
M.seheli . For example, in the present study the concentration
of Pb2+
was 0.08 ppm and Cd2+
was 0.01 ppm in dry weight in
a M.seheli, where as in the previous studies the concentration
of Pb2+
was1.67 ppm and Cd2+
was 1.27ppm in dry weight in
a Sardinella spp. in the Red sea, Suez Egypt (El-Moselhy,
Othman, Abd El-Azem, & El-Metwally, 2014); and in a
Sardinella aurita, Pb2+
was16.49 ppm and Cd2+
was1.49 ppm
in dry weight in the Mediterranean sea west of Alexandria (El
Mex Bay and Eastern Harbour)Egypt(Abdallah, 2008). These
high different between the results may reference to different
area,the habitat of fish, feeding behavior and migration; and
this confirms that the area of present study is low polluted by
sewage and other sources such as crude oil tanks (balancing
waters) as supported by (El-Moselhy, Othman, Abd El-Azem,
& El-Metwally, 2014)who reported that the main source of
pollution in Egypt are human waste, industrial activities,
tourism industry and shipping of ores.
In liver of M. seheli was significant differences (P<0.05),
regarding the concentration of Pb2+
and Cd2+
except
Hg2+
throughout the seasons: winter, spring, summer and
autumn at Khawr-Mukalla. In spite of seasons, the present
study (Table1) agrees with previous study which reported
that high concentration of Pb2+
and Cd2+
obtained in the liver
of fish (El-Moselhy, Othman, Abd El-Azem, & El-Metwally,
2014).This observation probably indicates that due to the
liver has ability to accumulate the heavy metals, and then
itsexcrete from liver is difficult as mentioned by (Khaled,
2004).
The highest concentration of Pb2+
, Cd2+
and Hg2+
in liver of
M.seheli was found on summer and the lowest concentration
was obtained on winter. This observation probably indicates
that the amount of draining sewage on summer were higher
compared with other seasons as a result of using water in this
season by population of Mukalla city as well as seawater are
more mixing by moving current (upwelling) in autumn that
lead to dispersion the metals in seawater column. This
suggestion also supported by environmental data as
mentioned above.
There were significant differences regarding the
concentration of Pb2+
in the gills of fish, M. seheli(Table1) for
the duration of the seasons: winter, spring, summer and
autumn at Khawr-Mukalla. Also, the highest concentration of
Pb2+
, Cd2+
and Hg2+
in the gills of fish was found on summer
and the lowest concentration was obtained on winter. These
observations probably indicate that the same reasons of liver
which mentioned above as well as in water, gills are the main
surface during exchange of metals ions as reported by (Qadir
& Malik, 2011).
It is interesting to note that the concentration of Hg2+
in the
muscles, livers and gills of M. seheliwere lowestthanPb2+
and
Cd2+
in the same fish (Table1). These observations probably
indicate that the Hg2+
has different character than Pb2+
and
Cd2+
and has ability to evaporate in air; as supported by (Wang,
Liu, Yu, , Tang, Xu, & Wang, 2012)who reported that Hg2+
is
easy to vaporize and to move from one place to another.
4.2. Filtered Surface Water
Overall, the results of the present study showed that the
were no significant differences (P>0.05), using one way
ANOVA, regarding the concentration of Pb2+
, Cd2+
and
Hg2+
in the filtered surface water of Khawr-Mukalla (Mid-
Khawr and Mouth-Khawr) except End-Khawr, for the period
of seasons: winter, spring, summer and autumn (Table 2).
The highest concentration of Pb2+
and Cd2+
in the filtered
surfacewater of Khawr-Mukalla was obtained on summer and
the lowest concentration was gotten on winter, where as the
highest concentration of Hg2+
in the filtered surface water of
Khawr-Mukalla was achieved on summer and the lowest
concentration was found on spring (Table 2). These
observations probably indicates that the amount of draining
sewage on summer were higher compared with other
seasons and also due to high water temperature on summer
season as mentioned above as well as the water could be not
concentrated the heavy metals; also Hg2+
has different
character than Pb2+
and Cd2+
. As supported by (Cullinane,
Doyle, & Whelen, 1987)who reported that the concentration
of heavy metals in biota indicator is higher than
concentration in the water samples; and(Jordanova, Strezov,
Ayranov, Petkov, & Stoilova, 1999)reported that the
concentrations of metals are increased during summer due to
increase the water temperature. As supported also by Wang et
al., (2012)who pointed out that the distribution of Hg2+
was
different to the other heavy metals due to Hg2+
is easy to
International Journal of Environmental Monitoring and Protection 2014; 1(5): 68-75 74
vaporize and to move from one place to another.
The concentration of Pb2+
and Cd2+
in the filtered
surfacewater of Khawr-Mukalla (Mouth-Khawr, Mid-Khawr
and End-Khawr) stations, using two ways ANOVA, showed
that there were significant differences (P<0.05), whereas
there were no significant differences (P>0.05) between these
stations regarding the concentration ofHg2+
. The highest
concentration ofCd2+
and Hg2+
(Table 3) in the filtered surface
water were found in Mid-Khawr, whereas the lowest
concentration was gotten in Mouth-Khawr station; butthe
highest concentration ofPb2+
was achieved in End-Khawr,
whereas the lowest concentration was obtained in Mouth-
Khawr station. These observations could be appeared due to
drain sewage at first time into Mid-Khawr, non-coastal
currents, whereas Mouth-Khawr is connected with open sea,
mixingsurface water by coastal currents. However, our
results (Table 6) were low concentration compared with other
studies which mentioned by (Esslemont, 2000)who reported
that the concentration of Pb2+
of filtered surface seawater was
9 ppm and Cd2+
was 7.9 ppm in the Pioneer Bay, Australia;
and in the Nelly Bay, the concentration of Pb2+
inthe filtered
surface seawater was 4.3ppmand Cd2+
was 7.9ppm; also in
the Townsville Harbour, the concentration of Pb2+
in the
filtered surface seawater was 10ppm and Cd2+
was 8ppm.
Besides, (Wang, Liu, Yu, , Tang, Xu, & Wang, 2012)pointed
out that the concentration of Pb2+
was 0.61 ppm, Cd2+
was
0.92 ppm and Hg2+
was 0.030 ppmin Jinzhou bay, China.
Based on these information, Khawr-Mukalla of the present
study is low polluted when it is compared with previous
studies; however Khawr-Mukalla is polluted according to the
background value of natural surface seawater of Pb2+
is
0.005-0.015 ppm, Cd2+
is 0.01 ppm and Hg2+
is 0.00 ppm(Wu
& Zeng, 1983).
In the other hand, when the results of present study during
the seasons were analyzed by using two ways ANOVA in the
surface water of Khawr-Mukalla (End-Khawr , Mid-Khawr
and Mouth-Khawr) stations, showed that there were
significant differences (P<0.05) regarding the concentration
of Pb2+
, Cd2+
and Hg2+
in all seasons. The highest
concentration of Pb2+
and Cd2+
in the filtered surface water
was obtained on summer, whereas the lowest concentration
was found on winter; butthe highest concentration of Hg2+
was obtained on autumn and the lowest concentration was
found on spring(Table 4). These observations probably
indicate that the high temperature and more amount of
draining sewage during summer at Khawr-Mukalla; also
Hg2+
has different character than Pb2+
and Cd2+
as described
above.
5. Conclusion
From the results of this trial, it is logical to conclude that
the heavy metals (Pb2+
, Cd2+
and Hg2+
) in the muscles and
gills of M.seheli, (Table1)are still in range scale of
international pollution standard except in the liver of fish
which was high a little bit, out range scale; asmentioned by
(FAO, 1983) according to international standard that are:
Pb2+
is 0.5 ppm, Cd2+
is 0.05 ppm and Hg2+
is 0.05 ppm; and
also (Community, 2005)reported that Pb2+
is 0.2 ppm, Cd2+
is
0.05 ppm and Hg2+
is 0.05; however, we should put in the
account of thatM.seheli is considered of fish which migrating
from and to Creeks. On the other hand, the filtered surface
seawater of Khawr-Mukalla (Table3;4)is polluted as
mentioned by (Wu & Zeng, 1983) according to the
background value of natural surface seawater that are: Pb2+
is
0.005-0.015 ppm, Cd2+
is 0.01 ppm and Hg2+
is 0.00 ppm.
Pollution with heavy metals could be damaged liver and
kidney (Agency & Disease Registery, 2004); and the
accumulation of cadmium in body of human could be caused
kidney failure or sterility (Vos, Hovens, & Delft,
1987).Unfortunately, the sewage drains into Khawr-Mukalla
without treatment; therefore, the treatment of sewage before
drain off into Khawr-Mukalla is necessary to protect the
human health, to save the marine ecosystem in better
condition and low polluted, as well as further studies are
necessary to monitoring the pollution by heavy metals in this
area.
Acknowledgements
The author would like to thank Nabil Al-Hodaificandidate
for M.Sc. degree who collected and analyzed samples in lab
and extended my thanks to group research of marine biology.
This study was funded by Hadhramout University under
programme of M.Sc. study in department of marine biology
of Faculty of Environmental Sciences and Marine Biology.
References
[1] EPA, The Environmental Protection Agency. (1996). Method 3052 Microwave assisted acid digestion of siliceous and organically based matrices. The Environmental Protection Agency.
[2] U. S. Environmental Protection Agency. (2000). Environmental Protection Agency Chemical Contaminant Data for Use in Fish Advisories Volume 1 Fish Sampling and Analysis Third Edition. Washington, DC: Office of Science and Technology.
[3] Abdallah, M. M. (2008). Trace element levels in some commercially valuable fish species from coastal waters of Mediterranean Sea, Egypt. J Mar Syst, 73, 114-122.
[4] Agency, T. S., & Disease Registery. (2004). Agency for Toxic Substances and Disease Registry, Division of Toxicology. Clifton Road, NE, Atlanta, GAAgency for Toxic Substances and Disease Registry, Available from http://www.atsdr. cdc.gov/toxprofiles/.
[5] Breder, C., & Rosen, D. E. (1966). Modes of reproduction in fishes. Neptune City, New Jersey.: T.F.H. Publications, Neptune City, New Jersey.
[6] Community, E. (2005). Commission regulation No 78/2005. Official J Eur Union, 43-45.
[7] Conacher, H. B., Page , B. D., & Ryam, J. J. (1993). Industrial chemical contamination of foods (Review). Food Addit. Contam., 10, 129-143.
75 Mohammed Al-Dohailet al.: The Effects of Lead, Cadmium and Mercury on Moolgardaseheli and Seawater in Khawr-Mukalla,
Hadhramout Coast, Gulf of Aden
[8] Cullinane, J. P., Doyle, T. M., & Whelen, P. M. (1987). Uses of Seaweeds as Biomonitors of Zinc Levels in Cork Harbour, Ireland. Hydrobiologia, 285,, 15l-152.
[9] Duruibe, J. O., & Ogwuegbu, M. C. (2007). Heavy metal pollution and human biotoxic effects. International Journal of Physical Sciences, 2, 112-118.
[10] El-Moselhy, K. M., Othman, A. I., Abd El-Azem, H., & El-Metwally, M. E. (2014). Bioaccumulation of heavy metals in some tissues of fish in the Red Sea, Egypt. E g y p t i a n journal of basic and applied sciences xxx (Article in press), 1-9.
[11] EPA, Environmental Protection Agency. (1992). Method 3010A Acid digestion of aqueous samples and extracts for total metals for analysis by flaa or icp spectroscopy. U. S. Environmental Protection Agency.
[12] Esslemont, G. (2000). Heavy metals in seawater, marine sediments and corals from the Townsville section, Great Barrier Reef Marine Park, Queensland. Marine Chemistry, 71, 215–231.
[13] FAO. (1983). Compilation of legal limits for hazardous substances in fish and fishery products. FAO Fishery Circular No. 464. Food and Agriculture Organization, 5-100.
[14] Farkas, A., Salanki, J., & Varanka, I. (2000). Heavy metal concentrations in fish of Lake Balaton. Research & Management, 5(4), 271-279.
[15] Harrison, I., & Senou, H. (1997). Order Mugiliformes. Mugilidae. Mullets. . In K.E. Carpenter and V.H. Niem (eds.) FAO species identification guide for fishery purposes. FAO, 2069-2108.
[16] Henning, B. J., Snyman, H. G., & Aveling, T. S. (2001). Plant-soil interactions of sludge-borne heavy metals and the effect on maize (Zed mays L) seedling growth. Water SA, 27., 71-78.
[17] Huang, B. W. (2003). Heavy metal concentrations in the common benthic fishes caught from the coastal waters of Eastern Taiwan . Journal of food and drug analysis 11(3) , 324-330 .
[18] J., K., & Abbasi, E. (2010). The Effects of Heavy Metals on Aquatic Animals. The 1 st International Applied Geological Congress, Department of Geology, Islamic Azad Universit.
[19] Jordanova, A., Strezov, A., Ayranov, M., Petkov, N., & Stoilova. (1999). Heavy Metal Assessment in Algae Sediments and Water From The Bulgarian Black Sea Coast. Wat SCL. Tech. Vol. 39, No. 8, 207-212.
[20] Khaled, A. (2004). Seasonal determination of some heavy metals in muscle tissues of Siganus rivulatus and Sargus sargus fish from El-Mex Bay and Eastern Harbor, Alexandria, Egypt. Egypt J Aquat Biol Fish, 8(1), 65-81.
[21] King, R. P., & Jonathan, G. E. (2003). Aquatic environmental perturbations and monitoring. African experience.
[22] Lata, R., & Rohindra, D. (2002). Heavy Metals. In Major Environmental Issues. An Outreach to the South Pacific.
[23] Lokhande, R. S., & Kelkar, N. (1999). Studies on heavy metals in water of Vasai Creek, Maharashtra. Indian J Environ Protect, 19(03), 664-668.
[24] Mansour, S. A., & Sidky, M. M. (2002). Heavy metals contaminating water and fish from Fayoum Governorate,Egypt. Food Chememistry 78, 15-22.
[25] Nisha, & Pandey, G. N. (1984). Environmental Engineering Division. Journal of the Institute of Engineers: India, 64: 99.
[26] Obasohan, E. E. (2008). Bioaccumulation of chromium, copper, maganese, nickel and lead in a freshwater cichlid, hemichromis fasciatus from Ogba River in Benin City, Nigeria. African Journal of General Agriculture 4(3) , 141-152.
[27] Odoemelam, S., Iwuazor, C. C., & Ozuo, J. U. (1999). Tropical Environmental Forum. held at Calabar.
[28] Pekey, H. (2006). The distribution and sources of heavy metals in Izmit Bay surface sediments affected by a polluted stream . Marine Pollution Bulletin, 52 , 1197-1208.
[29] Qadir, A., & Malik, R. N. (2011). Heavy metals in eight edible fish speciesfr om two polluted tributaries (Aik and Palkhu) of the River Chenab, Pakistan. Biol Trace Elem Res ,143:, 1524-1540.
[30] Reichelt, A. J., & Jones, G. (1994). Trace metals as tracers of dredging activity in Cleveland Bay- field and laboratory studies. Australian Journal of Marine and Freshwater Research, 45, 1237-1257.
[31] Sekwele, R. C. (2008). Selected Heavy metals consentrations on Selected Samples of Naboom Spurit, Tobias Spruit and the Nyl Floodplain, South Africa. puplshed Master thesis, University of Limpopo.
[32] Shanthi, V., & Gajendran, N. (2009). The impact of water pollution on the socio-economic status of the stakeholders of Ennore Creek, Bay of Bengal (India). Ind. J. Sci. Technol., 2(3), 66-79.
[33] Svobodova, Z., Celechovska, O., & Kolarova, J. (2004). Assessment of metal contamination in the upper reaches of the Tichá Orlice River. Czech Journal of Animal Science, 49, 458-464.
[34] Tsuguyoshi, S. (2004). Mercury Analysis Manual . Ministry of the Environment, Japan.
[35] U.S Environmental Protection Agency. (2007). Method 3015a Microwave assisted acid digestion of aqueous samples and extracts. The U.S Environmental Protection Agency.
[36] Velez, D., & Montoro, R. (1998). Arsenic speciation in manufactured seafood products: a review. J. Food. Protect., 61(9), 1240-1245.
[37] Vos, G., Hovens, J. P., & Delft, W. V. (1987). Arsenic, cadmium, leads and mercury in meat, livers and kidneys of cattle slaughtered in The Netherlands during 1980–1985. Food Additives and Contaminants 4, 73–88.
[38] Wang, J., Liu, R. H., Yu, , P., Tang, A. K., Xu, L. Q., & Wang. (2012). The 18th Biennial Conference of International Society for Ecological Modelling Study on the Pollution Characteristics of Heavy Metals in Seawater of Jinzhou Bay. Procedia Environmental Sciences, 13,, 1507 – 1516.
[39] Wu, Y., & Zeng, J. Y. (1983). ) Heavy metal pollution and the background value on the stuaries, bays and coastal waters. Marine Environmental Science,12, 60-70.


![Sensory and physicochemical analyses of roasted marama beans [Tylosema esculentum (Burchell) A. Schreiber] with specific focus on compounds that may contribute to bitterness](https://img.dokumen.tips/doc/110x75/63598da4debc1859f604d607/sensory-and-physicochemical-analyses-of-roasted-marama-beans-tylosema-esculentum.jpg)


