Embed Size (px)
Citation preview

TRANSLATIONAL RESEARCH
Effects of High-frequency Oscillatory Ventilation on Systemicand Cerebral Hemodynamics and Tissue Oxygenation:An Experimental Study in Pigs
Jan Florian Heuer • Philip Sauter • Jurgen Barwing •
Peter Herrmann • Thomas A. Crozier • Annalen Bleckmann •
Tim Beißbarth • Onnen Moerer • Michael Quintel
� Springer Science+Business Media, LLC 2011
Abstract
Background In this study, we compare the effects of high
frequency oscillatory ventilation (HFOV) with those of
lung-protective volume-controlled ventilation (VCV) on
cerebral perfusion, tissue oxygenation, and cardiac func-
tion with and without acute intracranial hypertension
(AICH).
Methods Eight pigs with healthy lungs were studied
during VCV with low tidal volume (VT: 6 ml kg-1) at four
PEEP levels (5, 10, 15, 20 cmH2O) followed by HFOV at
corresponding transpulmonary pressures, first with normal
ICP and then with AICH.
Systemic and pulmonary hemodynamics, cardiac function,
cerebral perfusion pressure (CPP), cerebral blood flow
(CBF), cerebral tissue oxygenation, and blood gases were
measured after 10 min at each level. Transpulmonary
pressures (TPP) were calculated at each PEEP level. The
measurements were repeated with HFOV using continuous
distending pressures (CDP) set at TPP plus 5 cmH2O for
the corresponding PEEP level. Both measurement series
were repeated after intracranial pressure (ICP) had been
raised to 30–40 cmH2O with an intracranial balloon
catheter.
Results Cardiac output, stroke volume, MAP, CPP, and
CBF were significantly higher during HFOV at normal
ICP. Systemic and cerebral hemodynamics was signifi-
cantly altered by AICH, but there were no differences
attributable to the ventilatory mode.
Conclusion HFOV is associated with less hemodynamic
compromise than VCV, even when using small tidal vol-
umes and low mean airway pressures. It does not impair
cerebral perfusion or tissue oxygenation in animals with
J. F. Heuer (&) � P. Sauter � J. Barwing � P. Herrmann �T. A. Crozier � O. Moerer � M. Quintel
Department of Anaesthesiology, Emergency- and Intensive Care
Medicine, University of Gottingen Medical School,
Gottingen, Germany
e-mail: [email protected]
P. Sauter
e-mail: [email protected]
J. Barwing
e-mail: [email protected]
P. Herrmann
e-mail: [email protected]
T. A. Crozier
e-mail: [email protected]
O. Moerer
e-mail: [email protected]
M. Quintel
e-mail: [email protected]
A. Bleckmann � T. Beißbarth
Department of Medical Statistics, University Medical Center
Gottingen, Gottingen, Germany
e-mail: [email protected]
T. Beißbarth
e-mail: [email protected]
A. Bleckmann
Department of Hematology and Oncology, University Medical
Center Gottingen, Gottingen, Germany
123
Neurocrit Care
DOI 10.1007/s12028-011-9566-z

AICH, and could, therefore, be a useful ventilatory strategy
to prevent lung failure in patients with traumatic brain
injury.
Keywords Volume controlled ventilation � HFOV �Cerebral blood flow � Cerebral tissue oxygenation �Hemodynamics
Introduction
Up to 40% of the patients with an isolated head injury
develop ARDS and require mechanical ventilation with high
positive end-expiratory pressures (PEEP) [1, 2]. Volume-
controlled ventilation with PEEP improves oxygenation and
reduces pulmonary morbidity [3], but it can also increase
intracranial pressure (ICP) and impair cerebral perfusion
[4, 5]. A lung-protective ventilatory strategy with small tidal
volumes at higher respiratory rates reduces the risk of pul-
monary damage [6] and helps to avoid the detrimental effects
of high airway pressures on cerebral perfusion [5].
High frequency oscillatory ventilation (HFOV) takes the
lung-protective approach to an extreme with very low tidal
volumes and very small pressure changes [7] around a
higher continuous distending pressure (CDP). Studies have
demonstrated the efficacy of HFOV in patients with ARDS
[8–10], and there is an evidence that the outcome improves
when HFOV is initiated earlier [11, 12]. It is therefore
reasonable to hypothesize that it would be beneficial to
implement HFOV immediately and not just use it as a
rescue measure after lung failure has set in. This is sup-
ported by the data from a study in very-low-birth-weight
infants [13]. There is some concern that the high constant
mean airway pressures of HFOV might impair cerebral
perfusion and brain tissue oxygenation [14, 15] or con-
tribute to right ventricular failure. The results of the small
case series have been encouraging [16, 17], and a direct
comparison of HFOV and pressure-controlled ventilation
in an animal model, albeit with clinically obsolete large
tidal volumes, showed both methods to be equivalent with
regard to cerebral hemodynamics [18]. However, there are
no controlled studies comparing the effects of HFOV on
cerebral and systemic hemodynamics with those of VCV
using a lung-protective, low tidal volume mode in animals
with intracranial hypertension and normal lung function.
The following hypotheses were tested:
(a) HFOV has a negative effect on cardiac function, ICP,
cerebral perfusion pressure, and tissue oxygenation at
higher CDP levels;
(b) There is a difference between the effects of HFOV
and those of low tidal volume VCV on these
parameters;
(c) The effects of VCV and HFOV respond differently to
acutely induced intracranial hypertension.
Materials and Methods
The study was approved by our institutional animal study
review board. Throughout the study, animals were handled
according to the Helsinki convention for the use and care of
animals.
Animal Preparation
Eight healthy pigs (Gottinger mini-pigs, mean weight
37.3 ± 4.2 kg) were premedicated with 40 mg i.m.
azaperonium. An ear vein was cannulated, and anesthesia
was induced with thiopental (3–5 mg kg-1 i.v.) and keta-
mine (4 mg kg-1 i.v.), and maintained with ketamine
(10 mg kg-1 h-1) and midazolam (1 mg kg-1 h-1) infu-
sions. Ringer acetate was infused at an average rate of
4–5 ml kg-1 h-1.
A cuffed tracheal tube was inserted, and the lungs were
ventilated (Servo I�, Maquet, Rastatt, Germany) in VCV
mode (PEEP 5 cmH2O; inspiratory:expiratory ratio
I:E = 1:1.5; FiO2 = 0.5; respiratory rate 15 min-1; con-
stant inspiratory flow; tidal volume VT = 6 ml kg-1). The
respiratory rate was adjusted to maintain normocapnia with a
maximum rate of 20 min-1. End-tidal CO2 (Datex Capno-
mac Ultima�, Finland), peripheral oxygen saturation, ECG,
and non-invasive blood pressure were monitored continu-
ously (Datex—Ohmeda S/3 patient monitor, GE, USA).
A thermistor-tipped fiberoptic catheter (Pulsiocath�, 4F
FT PV 2024, Pulsion Medical System, Munich, Germany)
was placed in a femoral artery. A pulmonary catheter
(Volef�, Pulsion Medical System, Munich, Germany) was
inserted through a 5 F sheath introducer in the right internal
jugular vein, and the position of the catheter tip confirmed
by pressure tracing. The catheters were connected to
pressure transducers and to an integrated bedside monitor
(PiCCO�, Volef, Pulsion Medical Systems).
Three burr holes were made in the right frontal region to
insert an intracranial pressure catheter (Codman, Monitor:
Codman ICP Express�, Catheter: Codman MicrosensorTM,
Ryhnam, MA, USA), a Licox� micro oxygen electrode for
measuring oxygen tension (ptiO2) in brain tissue (Integra
Neuroscience, Integra GmbH, 40880 Ratingen, Germany),
and a 22 F Fogarty catheter. The tips of the two microprobes
were placed approximately 15 mm below the dura with a
distance of 15 mm to each other. The Fogarty catheter was
placed 20 mm lateral to the medial microprobe [19].
After the neuromonitoring was established, the animals
were turned into the supine position for the remaining
Neurocrit Care
123

duration of the experiment. Both carotid arteries were
exposed, and two ultrasound flow sensors (Transonic sys-
tems Inc., model: T 106, Maastricht, Netherland) were
placed on the arteries and calibrated according to the
manufacturer’s recommendation.
An esophageal balloon catheter (Spiegelberg-Sonde Typ
1, Spiegelberg KG, Hamburg, Germany) was inserted to
measure esophageal pressure. The correct placement of the
catheter was confirmed by gentle mechanical compression
of the abdomen [20].
Experimental Protocol
Four sets of measurements were performed under the two
ventilatory modes in the following order: (1) VCV and (2)
HFOV in animals with normal ICP, then (3) VCV and (4)
HFOV after induction of intracranial hypertension. It was
not possible to randomize the order due to the nature of the
study design.
For each series, baseline values were recorded at a PEEP
of 5 cmH2O after all parameters had been constant for
30 min. The animals were then ventilated at consecutive
PEEP levels of 10, 15, and 20 cmH2O. Final measurements
at PEEP 5 cmH2O were made at the end of each series to
measure the effects of pressure release. Measurements
were performed after 10 min ventilation at each PEEP
level. Airway and esophageal pressures were recorded, and
the mean transpulmonary pressure (TPP) was calculated.
At the end of the measurements at each PEEP level, the
lungs were allowed to collapse by disconnecting the tra-
cheal tube from the respirator for 30 s. A recruitment
maneuver was then performed by inflating the lungs to a
pressure of 40 cmH2O for 40 s, and ventilation was started
at the next PEEP level.
VCV was performed as described above. HFOV was
performed with a CDP set at 5 cmH2O over the TPP
determined during VCV at the corresponding PEEP level
as described by Talmor et al. [20]. The ventilator (Sen-
sorMedics�-Ventilator 3100B, Care Fusion, Hong Kong)
was initially set with a bias flow of 20 l min-1, a power
of 70%, an inspiration time of 44%, and a frequency of
5 Hz.
Acute Intracranial Hypertension
Intracranial hypertension was induced by inflating the
Fogarty catheter until the ICP was constant between 30
and 40 cmH2O. Baseline ICP values are slightly elevated
even during the control series, since ICP increased sig-
nificantly when the animals were turned into the supine
position.
Measurements and Data Acquisition
Cardiac output (CO), stroke volume, global ejection frac-
tion, left and right end-diastolic volumes, right ventricular
ejection fraction, systemic and pulmonary artery pressures,
extravascular lung water index (ELWI), and intrathoracic
blood volume index (ITBI) were measured. Cardiac output
measurements were performed in triplicate by the same
investigator using 20 ml ice-cold 0.9% saline.
Arterial and mixed venous samples were collected, and
blood gases were analyzed immediately (ABL 510, Radi-
ometer, Copenhagen, Denmark). ICP and ptiO2 were
recorded continuously, and cerebral perfusion pressure
(CPP) was calculated.
Data recording and analysis was performed using the
Modular Intensive Care Data Acquisition System (MIDAS)
developed by Herrmann and Nguyen (Institut fur Bio-
medizinische Technik, Hochschule Mannheim, Germany).
Statistical Analysis
Data analysis was performed with the statistical software R
(http://www.r-project.org). The influence of PEEP, Disease,
and Treatment on each individual variable was assessed by
ANOVA. A multivariate linear regression model (lm) of the
form (Variable * Animal + PEEP * Treatment * Disease)
was individually fitted for each of the analyzed variables.
Here ‘‘Animal’’ denotes the coefficients for the individual
eight animals, ‘‘PEEP’’ denotes a factor variable for the
different PEEP levels, ‘‘Treatments’’ are HFOV or VCV, and
‘‘Diseases’’ are the presence or absence of intracranial
hypertension (AICH). The interactions of PEEP, Treatment,
and Disease were modeled. The P-values computed for the
variables were adjusted to control the family wise error rate
using the Holm method. Changes from baseline in each
individual series were assessed with the Wilcoxon-test for
paired samples. Figures were performed with Statistica for
Windows (9.0; StatSoft; Europe).
Results
Gas Exchange
Gas exchange parameters remained constant in the indi-
vidual groups, except that PaO2 was higher than baseline at
a PEEP of 15 and 20 cmH2O in group HFOV + AICH.
Arterial oxygen tension was significantly higher and
PaCO2 significantly lower in the HFOV groups (Table 1).
CDP based on transpulmonary pressure (TPP) was lower
than a CDP based on mean airway pressure (Table 1).
Neurocrit Care
123

Table 1 Pulmonary gas exchange, serum lactate, and airway pressures
T0 = PEEP 5 PEEP 10 PEEP 15 PEEP 20 PEEP 5
pHa#, +, -
VCV 7.49 ± 0.08 7.49 ± 0.08 7.46 ± 0.07* 7.41 ± 0.07* 7.46 ± 0.05*
HFOV 7.48 ± 0.06 7.52 ± 0.08 7.48 ± 0.09 7.50 ± 0.06 7.47 ± 0.08
VCV + AICH 7.46 ± 0.09 7.46 ± 0.07 7.45 ± 0.05 7.41 ± 0.05 7.44 ± 0.04
HFOV + AICH^ 7.45 ± 0.10 7.48 ± 0.10 7.49 ± 0.09* 7.45 ± 0.06 7.46 ± 0.04
PaCo2, mmHg
VCV 39 ± 4 38 ± 5 40 ± 3 39 ± 14 38 ± 2
HFOV� 36 ± 4 36 ± 8 37 ± 7 35 ± 7 38 ± 7
VCV + AICH 39 ± 7 39 ± 5 38 ± 3 42 ± 6 39 ± 3
HFOV + AICH^ 40 ± 10 36 ± 8 35 ± 6 38 ± 5 36 ± 7
PaO2, mmHg
VCV 293 ± 28 292 ± 29 299 ± 29 302 ± 32 304 ± 32*
HFOV� 31 ± 11 313 ± 13 314 ± 12 311 ± 21 313 ± 14
VCV + AICH 301 ± 25 304 ± 28 305 ± 26 298 ± 24 300 ± 31
HFOV + AICH^ 302 ± 1 311 ± 17 317 ± 14* 310 ± 13 321 ± 12*
pO2/FiO2
VCV 587 ± 56 584 ± 59 598 ± 59 605 ± 64 608 ± 64*
HFOV� 623 ± 22 626 ± 26 627 ± 24 622 ± 43 627 ± 28
VCV + AICH 602 ± 59 608 ± 55 611 ± 53 596 ± 48 600 ± 63
HFOV + AICH^ 604 ± 32 622 ± 34 634 ± 29* 620 ± 27* 641 ± 24*
Lactat, mmol l-1#
VCV 2.2 ± 0.7 2.4 ± 0.8* 2.5 ± 0.8* 2.5 ± 0.7* 2.6 ± 0.7*
HFOV 2.4 ± 0.8 2.3 ± 0.8 2.3 ± 0.7 2.3 ± 0.7 2.3 ± 0.6
VCV + AICH 2.2 ± 0.7 2.2 ± 0.6 2.1 ± 0.6 2.0 ± 0.5* 2.1 ± 0.6*
HFOV + AICH 2.1 ± 0.6 2.2 ± 0.5 2.1 ± 0.5 2.1 ± 0.5 2.1 ± 0.5
VCV
Paw 7.1 ± 0.9 11.9 ± 0.8 17.3 ± 0.7 22.5 ± 0.9 6.6 ± 0.5
Esophageal pressure 2.0 ± 1.2 3.7 ± 1.4 5.8 ± 1.6 8.3 ± 1.7 1.7 ± 1.1
TPP 5.1 ± 1.1 8.2 ± 1.8 11.5 ± 1.7 14.2 ± 1.9 4.8 ± 1.2
CDP 10.1 ± 1.1 13.2 ± 1.8 16.5 ± 1.7 19.2 ± 1.9 9.8 ± 1.2
CDP conventional 12.1 ± 0.9 16.9 ± 0.8 22.3 ± 0.7 27.5 ± 0.9 11.6 ± 0.5
Delta CDP 2.0 ± 1.2 3.7 ± 1.4 5.8 ± 1.6 8.3 ± 1.7 1.7 ± 1.1
VCV + AICH
Paw 6.8 ± 0.5 11.6 ± 0.6 17.4 ± 0.5 22.4 ± 1.0 6.6 ± 0.5
Esophageal pressure 2.2 ± 1.4 3.9 ± 1.7 5.5 ± 1.7 8.2 ± 2.0 2.6 ± 1.4
TPP 4.6 ± 1.4 7.7 ± 1.9 11.9 ± 2.1 14.2 ± 2.2 4.0 ± 0.9
CDP 9.6 ± 1.4 12.7 ± 1.9 16.9 ± 2.1 19.2 ± 2.2 9.0 ± 0.9
CDP conventional 11.8 ± 0.5 16.6 ± 0.6 22.4 ± 0.5 27.4 ± 1.0 11.6 ± 0.5
Delta CDP 2.2 ± 1.4 3.9 ± 1.7 5.5 ± 1.7 8.2 ± 2.0 2.6 ± 1.4
Values are mean (SD) of 8. VCV Conventional volume controlled ventilation group, HFOV high frequency oscillatory ventilation group,
VCV + AICH conventional volume controlled ventilation + acute intracranial hypertension group, HFOV + AICH high frequency oscillatory
ventilation + acute intracranial hypertension group, PHa arterial pH value, PaCO2 partial arterial carbon dioxide pressure, PaO2 partial arterial
oxygen pressure Paw mean airway pressure, TPP transpulmonary pressure (TPP = Paw-esophageal pressure); CDP continuous distending
pressure (TPP + 5 cmH2O), CDP conventional continuous distending pressure (PAW + 5 cmH2O), Delta CPD difference between CDP
conventional and CDP. Levels of significance: * P < 0.05 vs. T0/PEEP 5 (*Wilcoxon-test for paired samples); # P < 0.05 influence of AICH;+ P < 0.05 influence of PEEP without AICH; 2 P < 0.05 influence of PEEP with AICH; Inter-group comparison: � P < 0.05 VCV vs.
HFOV; ^ P < 0.05 VCV + AICH vs. HFOV + AICH; (#, +, 2, �, ^assessed by ANOVA/multivariate linear regression model)
Neurocrit Care
123

Hemodynamics
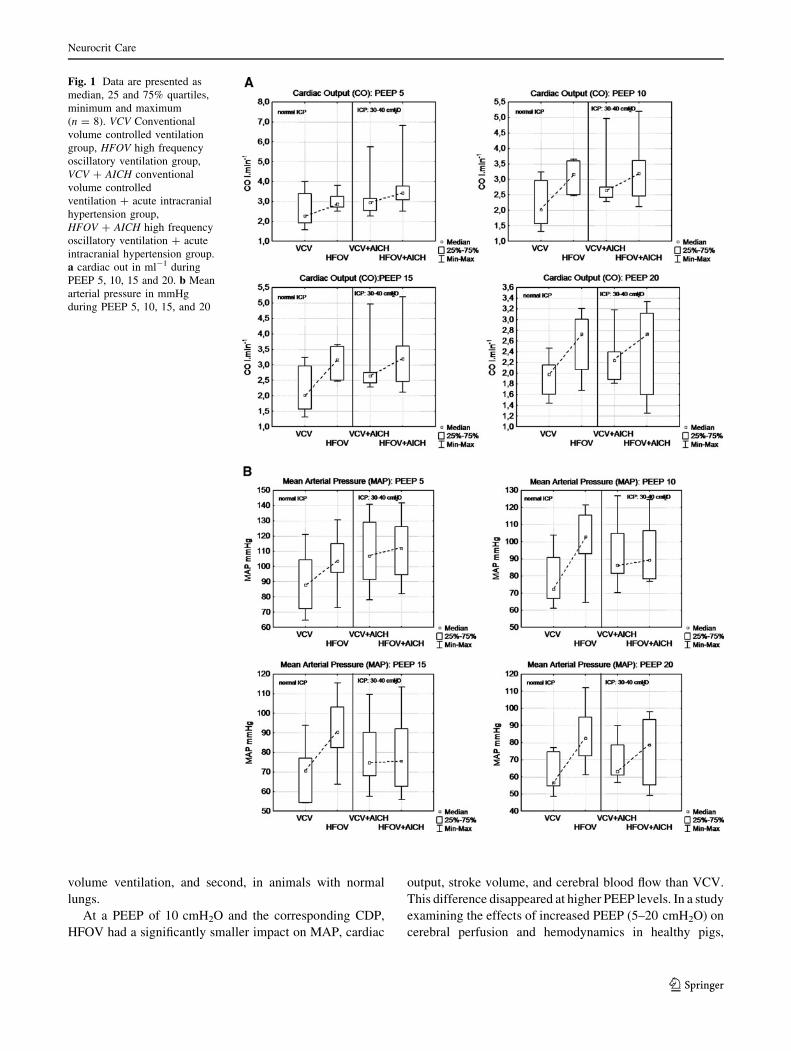
There was a significant reduction of MAP during VCV with a
PEEP of 10 cmH2O with both normal and elevated ICP
(Table 2; Fig. 1). MAP was significantly reduced in all series
at PEEP 15 cmH2O and higher. Central venous pressure
remained constant during HFOV but increased significantly
under VCV and was significantly higher during VCV in ani-
mals with normal ICP. Mean pulmonary arterial pressure
was significantly lower in HFOV + AICH compared with
VCV + AICH. Pulmonary wedge pressure was higher (P <
0.05) in VCV in comparison to HFOV. ITBI decreased in both
AICH groups at higher PEEP levels (P < 0.05).
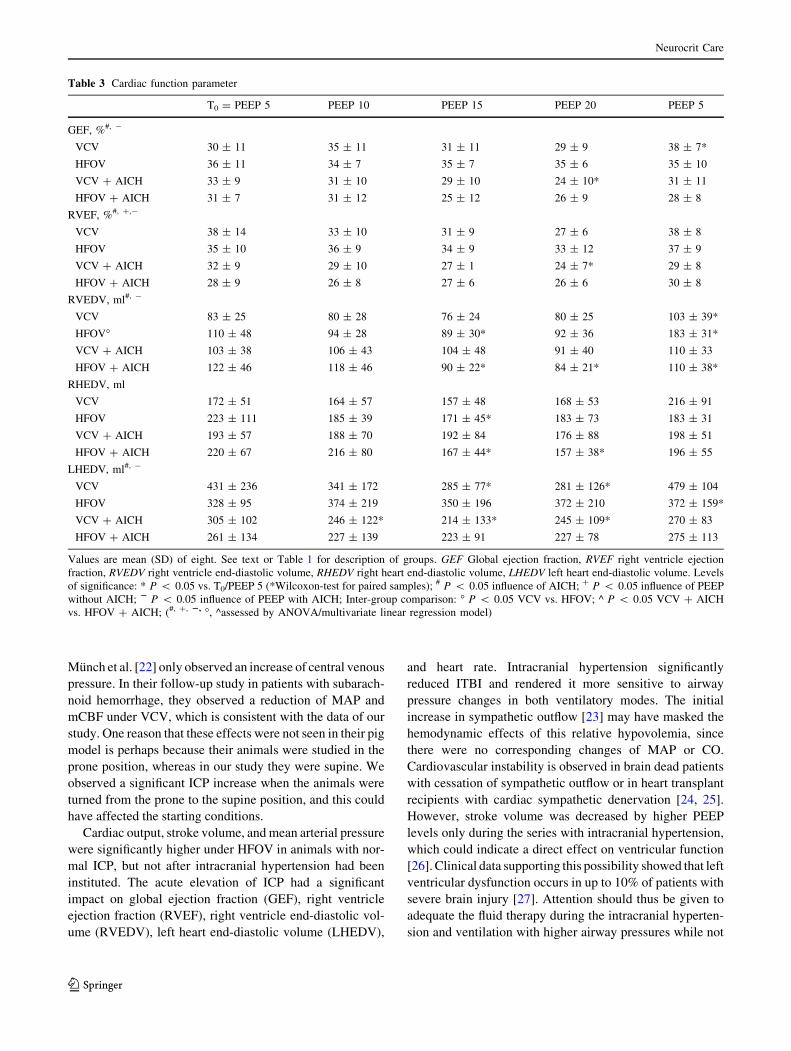
Cardiac Function
Cardiac output decreased significantly during VCV at higher
PEEP values with normal ICP but the changes were similar
in both modes with elevated ICP (Table 2; Fig. 1). Stroke
volume decreased significantly during VCV + AICH at
PEEP 15 cmH2O and with both ventilatory modes at PEEP
20 cmH2O. It differed significantly between the groups with
normal ICP. Intracranial hypertension significantly reduced
global and right ventricular ejection fractions, and they were
further decreased by VCV at PEEP 20 cmH2O (Table 3).
RVEDV differed significantly between VCV and HFOV. It
increased during intracranial hypertension but was reduced
at higher PEEP levels (Fig. 2). LHEDV was significantly
lower in animals with increased ICP. End-diastolic volumes
and ejection fractions increased sharply on the reduction of
PEEP from 20 to 5 cmH2O. The changes were not tested for
significance.
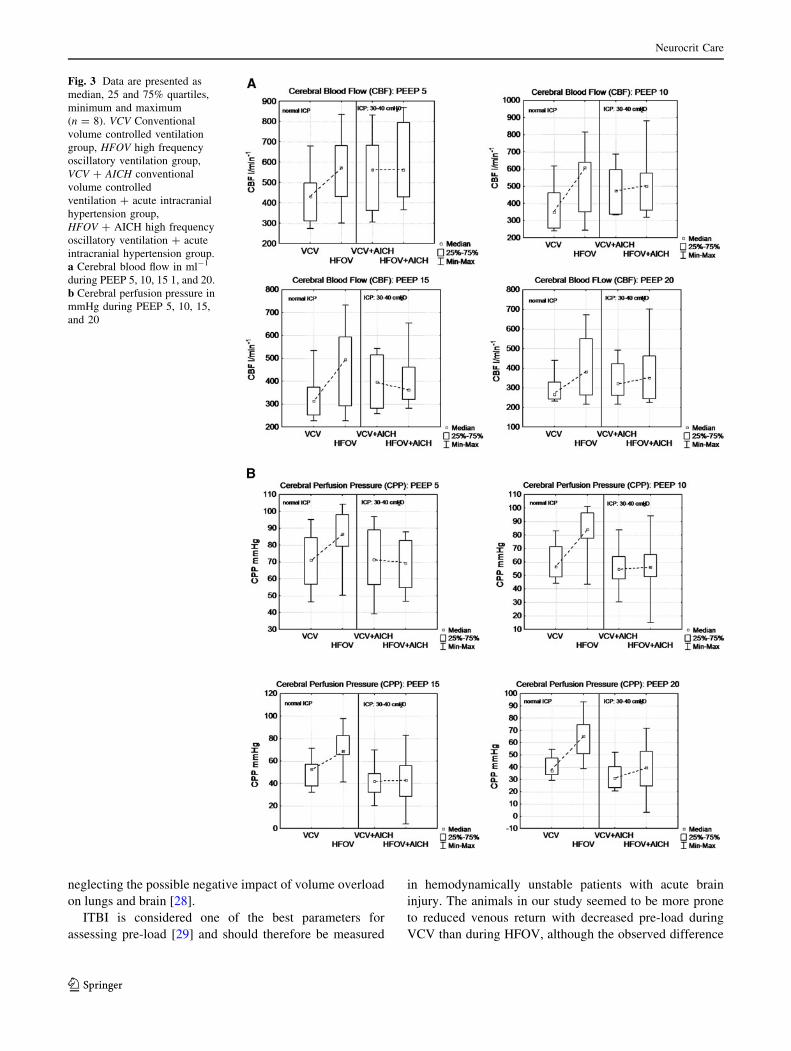
Cerebral Blood Flow, Perfusion Pressure, Oxygenation,
and ICP
CPP and mean cerebral blood flow (mCBF) were consis-
tently higher under HFOV than under VCV (Table 4;
Fig. 3). Cerebral tissue oxygen tension was higher under
HFOV than under VCV at all PEEP levels in animals with
normal ICP. This parameter decreased significantly with
increased mean airway pressures in animals with intracranial
hypertension, but there was no difference between the two
ventilatory modes (Table 4). Reducing PEEP from 20 to
5 cmH2O at the end of a series led to a surge in CPP, mCBF,
and PtiO2, in some cases exceeding baseline values (Fig. 3).
Discussion
To our knowledge, this is the first study comparing the effects
of low tidal volume, lung-protective ventilation (VCV), and
HFOV on systemic and cerebral hemodynamics. This is a
relevant issue since lung-protective ventilation is used pro-
phylactically, whereas HFOV is usually initiated as a rescue
measure in patients with severe ARDS when conventional
ventilatory strategies with large tidal volumes and high PEEP
have failed. A study comparing HFOV and high tidal volumes,
and pressure-controlled ventilation in animals with acute lung
injury revealed no differences between the two ventilatory
methods with regard to the observed variables [18].
The main finding of the present study is that HFOV did
not have detrimental effects on cerebral hemodynamics or
right ventricular function in experimental animals, even in
the presence of intracranial hypertension. The effects of
increasing mean airway pressure on systemic hemody-
namics, CBF, and ptiO2 were similar to the two ventilatory
methods. Gas exchange parameters and ptiO2 were better
under HFOV than under VCV. Similar effects were pre-
viously described in a small case series [17].
Many studies on HFOV employ a CDP that is set
according to the mean airway pressure at each corresponding
PEEP level [12, 14]. They also employ large tidal volumes of
10–12 ml kg-1 BW which give higher mean airway pres-
sures. In this study, CDP during HFOV was based on mean
transpulmonary pressures and not on mean airway pressures
at the corresponding PEEP level. Talmor et al. [20] had
demonstrated that TPP-guided ventilation was superior to the
conventional algorithms for mechanical ventilation. The
CDP levels in our study were, therefore, 25% lower at PEEP
15 cmH2O and 30% lower at PEEP 20 cmH2O than they
would have been if they had been based on mean airway
pressures. Mean airway pressures and subsequently mean
TPP were, of course, lower due to the small tidal volumes.
This leads to a further reduction of CDP that may be partially
responsible for the less pronounced circulatory effects than
those observed in a recently published study [14].
One factor limiting comparability of our study with most
others was that we did not induce lung injury in our animals.
The rationale for this study design was that we wished to
test the feasibility of HFOV as a prophylactic measure
because a large proportion of patients with traumatic brain
injury develop lung failure during controlled ventilation
[1, 2]. This has been shown to be due to the shear and
distension stresses associated with large tidal volumes
[3, 21]. The lung-protective ventilation strategy effectively
reduces the incidence and the severity of lung damage by
using small tidal volumes to minimize these injury mech-
anisms [3, 21]. HFOV takes the reduction of the tidal
volume to an extreme and virtually eliminates the shear
stresses involved in alveolar damage, and could therefore
possibly be even more effective as a prophylactic measure.
Although HFOV compared favorably to conventional
ventilation with high tidal volumes with regard to cerebral
hemodynamics in animals with lung injury, it was not
certain how it would compare, first of all, to small tidal
Neurocrit Care
123
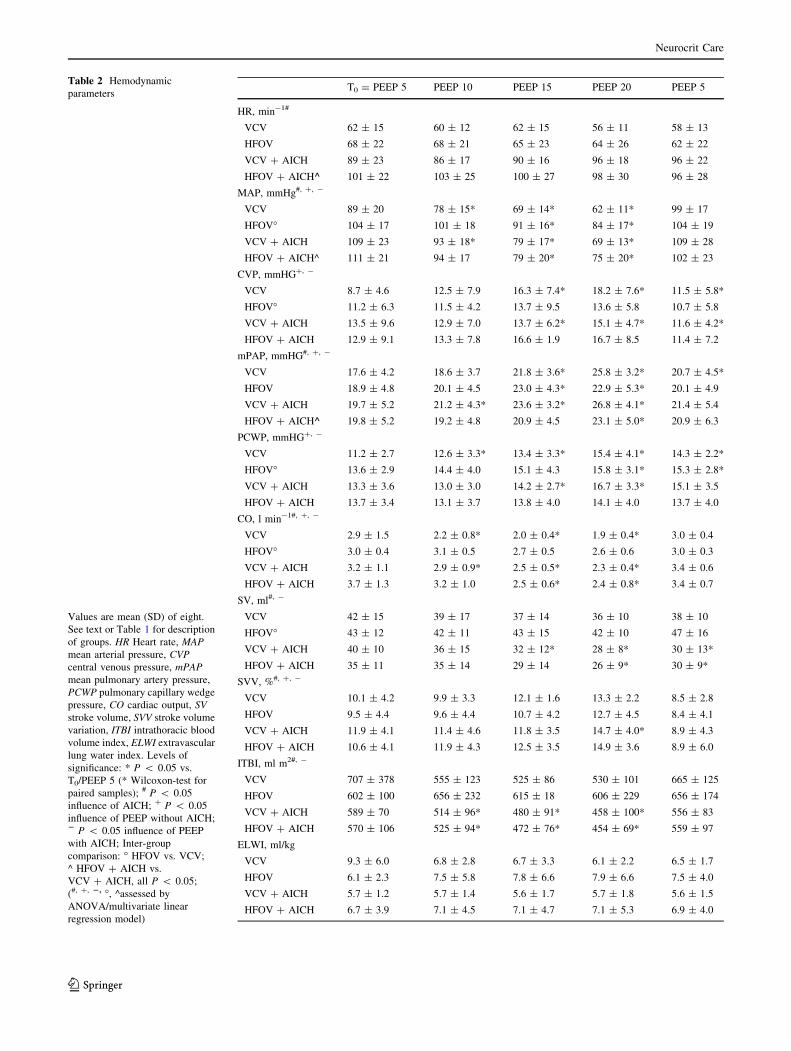
Table 2 Hemodynamic
parameters
Values are mean (SD) of eight.
See text or Table 1 for description
of groups. HR Heart rate, MAPmean arterial pressure, CVPcentral venous pressure, mPAPmean pulmonary artery pressure,
PCWP pulmonary capillary wedge
pressure, CO cardiac output, SVstroke volume, SVV stroke volume
variation, ITBI intrathoracic blood
volume index, ELWI extravascular
lung water index. Levels of
significance: * P < 0.05 vs.
T0/PEEP 5 (* Wilcoxon-test for
paired samples); # P < 0.05
influence of AICH; + P < 0.05
influence of PEEP without AICH;2 P < 0.05 influence of PEEP
with AICH; Inter-group
comparison: � HFOV vs. VCV;
^ HFOV + AICH vs.
VCV + AICH, all P < 0.05;
(#, +, 2, �, ^assessed by
ANOVA/multivariate linear
regression model)
T0 = PEEP 5 PEEP 10 PEEP 15 PEEP 20 PEEP 5
HR, min-1#
VCV 62 ± 15 60 ± 12 62 ± 15 56 ± 11 58 ± 13
HFOV 68 ± 22 68 ± 21 65 ± 23 64 ± 26 62 ± 22
VCV + AICH 89 ± 23 86 ± 17 90 ± 16 96 ± 18 96 ± 22
HFOV + AICH^ 101 ± 22 103 ± 25 100 ± 27 98 ± 30 96 ± 28
MAP, mmHg#, +, -
VCV 89 ± 20 78 ± 15* 69 ± 14* 62 ± 11* 99 ± 17
HFOV� 104 ± 17 101 ± 18 91 ± 16* 84 ± 17* 104 ± 19
VCV + AICH 109 ± 23 93 ± 18* 79 ± 17* 69 ± 13* 109 ± 28
HFOV + AICH^ 111 ± 21 94 ± 17 79 ± 20* 75 ± 20* 102 ± 23
CVP, mmHG+, -
VCV 8.7 ± 4.6 12.5 ± 7.9 16.3 ± 7.4* 18.2 ± 7.6* 11.5 ± 5.8*
HFOV� 11.2 ± 6.3 11.5 ± 4.2 13.7 ± 9.5 13.6 ± 5.8 10.7 ± 5.8
VCV + AICH 13.5 ± 9.6 12.9 ± 7.0 13.7 ± 6.2* 15.1 ± 4.7* 11.6 ± 4.2*
HFOV + AICH 12.9 ± 9.1 13.3 ± 7.8 16.6 ± 1.9 16.7 ± 8.5 11.4 ± 7.2
mPAP, mmHG#, +, -
VCV 17.6 ± 4.2 18.6 ± 3.7 21.8 ± 3.6* 25.8 ± 3.2* 20.7 ± 4.5*
HFOV 18.9 ± 4.8 20.1 ± 4.5 23.0 ± 4.3* 22.9 ± 5.3* 20.1 ± 4.9
VCV + AICH 19.7 ± 5.2 21.2 ± 4.3* 23.6 ± 3.2* 26.8 ± 4.1* 21.4 ± 5.4
HFOV + AICH^ 19.8 ± 5.2 19.2 ± 4.8 20.9 ± 4.5 23.1 ± 5.0* 20.9 ± 6.3
PCWP, mmHG+, -
VCV 11.2 ± 2.7 12.6 ± 3.3* 13.4 ± 3.3* 15.4 ± 4.1* 14.3 ± 2.2*
HFOV� 13.6 ± 2.9 14.4 ± 4.0 15.1 ± 4.3 15.8 ± 3.1* 15.3 ± 2.8*
VCV + AICH 13.3 ± 3.6 13.0 ± 3.0 14.2 ± 2.7* 16.7 ± 3.3* 15.1 ± 3.5
HFOV + AICH 13.7 ± 3.4 13.1 ± 3.7 13.8 ± 4.0 14.1 ± 4.0 13.7 ± 4.0
CO, l min-1#, +, -
VCV 2.9 ± 1.5 2.2 ± 0.8* 2.0 ± 0.4* 1.9 ± 0.4* 3.0 ± 0.4
HFOV� 3.0 ± 0.4 3.1 ± 0.5 2.7 ± 0.5 2.6 ± 0.6 3.0 ± 0.3
VCV + AICH 3.2 ± 1.1 2.9 ± 0.9* 2.5 ± 0.5* 2.3 ± 0.4* 3.4 ± 0.6
HFOV + AICH 3.7 ± 1.3 3.2 ± 1.0 2.5 ± 0.6* 2.4 ± 0.8* 3.4 ± 0.7
SV, ml#, -
VCV 42 ± 15 39 ± 17 37 ± 14 36 ± 10 38 ± 10
HFOV� 43 ± 12 42 ± 11 43 ± 15 42 ± 10 47 ± 16
VCV + AICH 40 ± 10 36 ± 15 32 ± 12* 28 ± 8* 30 ± 13*
HFOV + AICH 35 ± 11 35 ± 14 29 ± 14 26 ± 9* 30 ± 9*
SVV, %#, +, -
VCV 10.1 ± 4.2 9.9 ± 3.3 12.1 ± 1.6 13.3 ± 2.2 8.5 ± 2.8
HFOV 9.5 ± 4.4 9.6 ± 4.4 10.7 ± 4.2 12.7 ± 4.5 8.4 ± 4.1
VCV + AICH 11.9 ± 4.1 11.4 ± 4.6 11.8 ± 3.5 14.7 ± 4.0* 8.9 ± 4.3
HFOV + AICH 10.6 ± 4.1 11.9 ± 4.3 12.5 ± 3.5 14.9 ± 3.6 8.9 ± 6.0
ITBI, ml m2#, -
VCV 707 ± 378 555 ± 123 525 ± 86 530 ± 101 665 ± 125
HFOV 602 ± 100 656 ± 232 615 ± 18 606 ± 229 656 ± 174
VCV + AICH 589 ± 70 514 ± 96* 480 ± 91* 458 ± 100* 556 ± 83
HFOV + AICH 570 ± 106 525 ± 94* 472 ± 76* 454 ± 69* 559 ± 97
ELWI, ml/kg
VCV 9.3 ± 6.0 6.8 ± 2.8 6.7 ± 3.3 6.1 ± 2.2 6.5 ± 1.7
HFOV 6.1 ± 2.3 7.5 ± 5.8 7.8 ± 6.6 7.9 ± 6.6 7.5 ± 4.0
VCV + AICH 5.7 ± 1.2 5.7 ± 1.4 5.6 ± 1.7 5.7 ± 1.8 5.6 ± 1.5
HFOV + AICH 6.7 ± 3.9 7.1 ± 4.5 7.1 ± 4.7 7.1 ± 5.3 6.9 ± 4.0
Neurocrit Care
123
volume ventilation, and second, in animals with normal
lungs.
At a PEEP of 10 cmH2O and the corresponding CDP,
HFOV had a significantly smaller impact on MAP, cardiac
output, stroke volume, and cerebral blood flow than VCV.
This difference disappeared at higher PEEP levels. In a study
examining the effects of increased PEEP (5–20 cmH2O) on
cerebral perfusion and hemodynamics in healthy pigs,
Fig. 1 Data are presented as
median, 25 and 75% quartiles,
minimum and maximum
(n = 8). VCV Conventional
volume controlled ventilation
group, HFOV high frequency
oscillatory ventilation group,
VCV + AICH conventional
volume controlled
ventilation + acute intracranial
hypertension group,
HFOV + AICH high frequency
oscillatory ventilation + acute
intracranial hypertension group.
a cardiac out in ml-1 during
PEEP 5, 10, 15 and 20. b Mean
arterial pressure in mmHg
during PEEP 5, 10, 15, and 20
Neurocrit Care
123
Munch et al. [22] only observed an increase of central venous
pressure. In their follow-up study in patients with subarach-
noid hemorrhage, they observed a reduction of MAP and
mCBF under VCV, which is consistent with the data of our
study. One reason that these effects were not seen in their pig
model is perhaps because their animals were studied in the
prone position, whereas in our study they were supine. We
observed a significant ICP increase when the animals were
turned from the prone to the supine position, and this could
have affected the starting conditions.
Cardiac output, stroke volume, and mean arterial pressure
were significantly higher under HFOV in animals with nor-
mal ICP, but not after intracranial hypertension had been
instituted. The acute elevation of ICP had a significant
impact on global ejection fraction (GEF), right ventricle
ejection fraction (RVEF), right ventricle end-diastolic vol-
ume (RVEDV), left heart end-diastolic volume (LHEDV),
and heart rate. Intracranial hypertension significantly
reduced ITBI and rendered it more sensitive to airway
pressure changes in both ventilatory modes. The initial
increase in sympathetic outflow [23] may have masked the
hemodynamic effects of this relative hypovolemia, since
there were no corresponding changes of MAP or CO.
Cardiovascular instability is observed in brain dead patients
with cessation of sympathetic outflow or in heart transplant
recipients with cardiac sympathetic denervation [24, 25].
However, stroke volume was decreased by higher PEEP
levels only during the series with intracranial hypertension,
which could indicate a direct effect on ventricular function
[26]. Clinical data supporting this possibility showed that left
ventricular dysfunction occurs in up to 10% of patients with
severe brain injury [27]. Attention should thus be given to
adequate the fluid therapy during the intracranial hyperten-
sion and ventilation with higher airway pressures while not
Table 3 Cardiac function parameter
T0 = PEEP 5 PEEP 10 PEEP 15 PEEP 20 PEEP 5
GEF, %#, -
VCV 30 ± 11 35 ± 11 31 ± 11 29 ± 9 38 ± 7*
HFOV 36 ± 11 34 ± 7 35 ± 7 35 ± 6 35 ± 10
VCV + AICH 33 ± 9 31 ± 10 29 ± 10 24 ± 10* 31 ± 11
HFOV + AICH 31 ± 7 31 ± 12 25 ± 12 26 ± 9 28 ± 8
RVEF, %#, +,-
VCV 38 ± 14 33 ± 10 31 ± 9 27 ± 6 38 ± 8
HFOV 35 ± 10 36 ± 9 34 ± 9 33 ± 12 37 ± 9
VCV + AICH 32 ± 9 29 ± 10 27 ± 1 24 ± 7* 29 ± 8
HFOV + AICH 28 ± 9 26 ± 8 27 ± 6 26 ± 6 30 ± 8
RVEDV, ml#, -
VCV 83 ± 25 80 ± 28 76 ± 24 80 ± 25 103 ± 39*
HFOV� 110 ± 48 94 ± 28 89 ± 30* 92 ± 36 183 ± 31*
VCV + AICH 103 ± 38 106 ± 43 104 ± 48 91 ± 40 110 ± 33
HFOV + AICH 122 ± 46 118 ± 46 90 ± 22* 84 ± 21* 110 ± 38*
RHEDV, ml
VCV 172 ± 51 164 ± 57 157 ± 48 168 ± 53 216 ± 91
HFOV 223 ± 111 185 ± 39 171 ± 45* 183 ± 73 183 ± 31
VCV + AICH 193 ± 57 188 ± 70 192 ± 84 176 ± 88 198 ± 51
HFOV + AICH 220 ± 67 216 ± 80 167 ± 44* 157 ± 38* 196 ± 55
LHEDV, ml#, -
VCV 431 ± 236 341 ± 172 285 ± 77* 281 ± 126* 479 ± 104
HFOV 328 ± 95 374 ± 219 350 ± 196 372 ± 210 372 ± 159*
VCV + AICH 305 ± 102 246 ± 122* 214 ± 133* 245 ± 109* 270 ± 83
HFOV + AICH 261 ± 134 227 ± 139 223 ± 91 227 ± 78 275 ± 113
Values are mean (SD) of eight. See text or Table 1 for description of groups. GEF Global ejection fraction, RVEF right ventricle ejection
fraction, RVEDV right ventricle end-diastolic volume, RHEDV right heart end-diastolic volume, LHEDV left heart end-diastolic volume. Levels
of significance: * P < 0.05 vs. T0/PEEP 5 (*Wilcoxon-test for paired samples); # P < 0.05 influence of AICH; + P < 0.05 influence of PEEP
without AICH; 2 P < 0.05 influence of PEEP with AICH; Inter-group comparison: � P < 0.05 VCV vs. HFOV; ^ P < 0.05 VCV + AICH
vs. HFOV + AICH; (#, +, 2, �, ^assessed by ANOVA/multivariate linear regression model)
Neurocrit Care
123
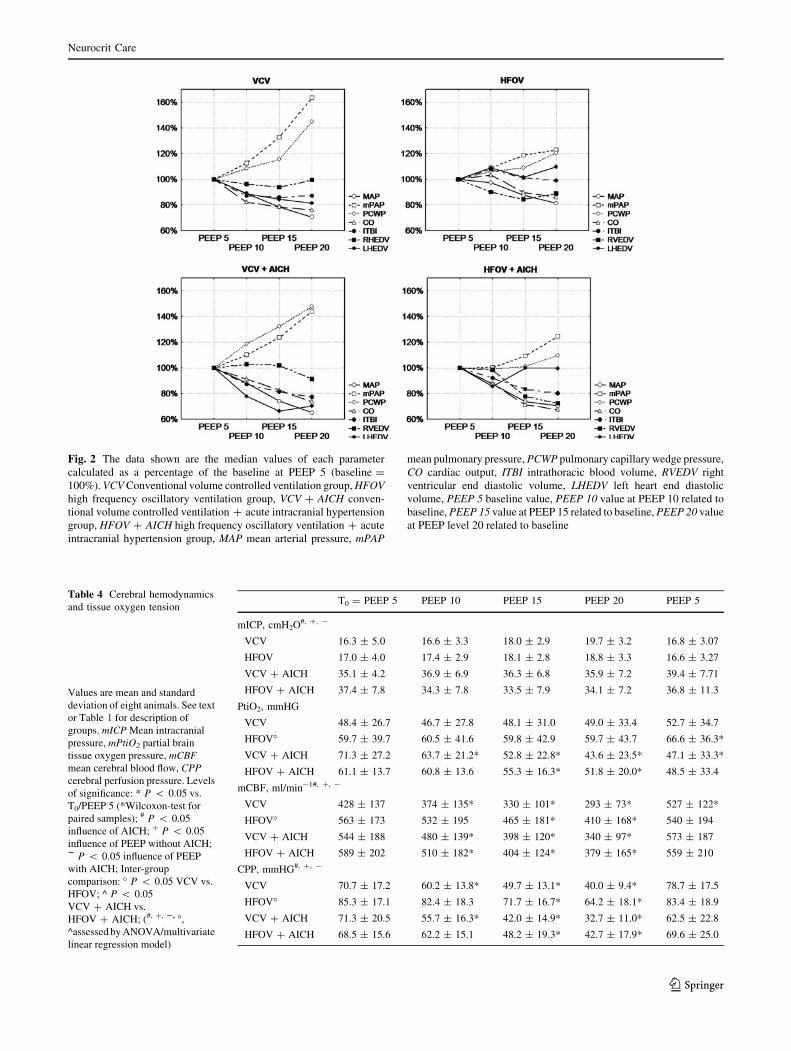
Fig. 2 The data shown are the median values of each parameter
calculated as a percentage of the baseline at PEEP 5 (baseline =
100%). VCV Conventional volume controlled ventilation group, HFOVhigh frequency oscillatory ventilation group, VCV + AICH conven-
tional volume controlled ventilation + acute intracranial hypertension
group, HFOV + AICH high frequency oscillatory ventilation + acute
intracranial hypertension group, MAP mean arterial pressure, mPAP
mean pulmonary pressure, PCWP pulmonary capillary wedge pressure,
CO cardiac output, ITBI intrathoracic blood volume, RVEDV right
ventricular end diastolic volume, LHEDV left heart end diastolic
volume, PEEP 5 baseline value, PEEP 10 value at PEEP 10 related to
baseline, PEEP 15 value at PEEP 15 related to baseline, PEEP 20 value
at PEEP level 20 related to baseline
Table 4 Cerebral hemodynamics
and tissue oxygen tension
Values are mean and standard
deviation of eight animals. See text
or Table 1 for description of
groups. mICP Mean intracranial
pressure, mPtiO2 partial brain
tissue oxygen pressure, mCBFmean cerebral blood flow, CPPcerebral perfusion pressure. Levels
of significance: * P < 0.05 vs.
T0/PEEP 5 (*Wilcoxon-test for
paired samples); # P < 0.05
influence of AICH; + P < 0.05
influence of PEEP without AICH;2 P < 0.05 influence of PEEP
with AICH; Inter-group
comparison: � P < 0.05 VCV vs.
HFOV; ^ P < 0.05
VCV + AICH vs.
HFOV + AICH; (#, +, 2, �,
^assessed by ANOVA/multivariate
linear regression model)
T0 = PEEP 5 PEEP 10 PEEP 15 PEEP 20 PEEP 5
mICP, cmH2O#, +, -
VCV 16.3 ± 5.0 16.6 ± 3.3 18.0 ± 2.9 19.7 ± 3.2 16.8 ± 3.07
HFOV 17.0 ± 4.0 17.4 ± 2.9 18.1 ± 2.8 18.8 ± 3.3 16.6 ± 3.27
VCV + AICH 35.1 ± 4.2 36.9 ± 6.9 36.3 ± 6.8 35.9 ± 7.2 39.4 ± 7.71
HFOV + AICH 37.4 ± 7.8 34.3 ± 7.8 33.5 ± 7.9 34.1 ± 7.2 36.8 ± 11.3
PtiO2, mmHG
VCV 48.4 ± 26.7 46.7 ± 27.8 48.1 ± 31.0 49.0 ± 33.4 52.7 ± 34.7
HFOV� 59.7 ± 39.7 60.5 ± 41.6 59.8 ± 42.9 59.7 ± 43.7 66.6 ± 36.3*
VCV + AICH 71.3 ± 27.2 63.7 ± 21.2* 52.8 ± 22.8* 43.6 ± 23.5* 47.1 ± 33.3*
HFOV + AICH 61.1 ± 13.7 60.8 ± 13.6 55.3 ± 16.3* 51.8 ± 20.0* 48.5 ± 33.4
mCBF, ml/min-1#, +, -
VCV 428 ± 137 374 ± 135* 330 ± 101* 293 ± 73* 527 ± 122*
HFOV� 563 ± 173 532 ± 195 465 ± 181* 410 ± 168* 540 ± 194
VCV + AICH 544 ± 188 480 ± 139* 398 ± 120* 340 ± 97* 573 ± 187
HFOV + AICH 589 ± 202 510 ± 182* 404 ± 124* 379 ± 165* 559 ± 210
CPP, mmHG#, +, -
VCV 70.7 ± 17.2 60.2 ± 13.8* 49.7 ± 13.1* 40.0 ± 9.4* 78.7 ± 17.5
HFOV� 85.3 ± 17.1 82.4 ± 18.3 71.7 ± 16.7* 64.2 ± 18.1* 83.4 ± 18.9
VCV + AICH 71.3 ± 20.5 55.7 ± 16.3* 42.0 ± 14.9* 32.7 ± 11.0* 62.5 ± 22.8
HFOV + AICH 68.5 ± 15.6 62.2 ± 15.1 48.2 ± 19.3* 42.7 ± 17.9* 69.6 ± 25.0
Neurocrit Care
123
neglecting the possible negative impact of volume overload
on lungs and brain [28].
ITBI is considered one of the best parameters for
assessing pre-load [29] and should therefore be measured
in hemodynamically unstable patients with acute brain
injury. The animals in our study seemed to be more prone
to reduced venous return with decreased pre-load during
VCV than during HFOV, although the observed difference
Fig. 3 Data are presented as
median, 25 and 75% quartiles,
minimum and maximum
(n = 8). VCV Conventional
volume controlled ventilation
group, HFOV high frequency
oscillatory ventilation group,
VCV + AICH conventional
volume controlled
ventilation + acute intracranial
hypertension group,
HFOV + AICH high frequency
oscillatory ventilation + acute
intracranial hypertension group.
a Cerebral blood flow in ml-1
during PEEP 5, 10, 15 1, and 20.
b Cerebral perfusion pressure in
mmHg during PEEP 5, 10, 15,
and 20
Neurocrit Care
123

was not statistically significant. Mean PAP was higher
during VCV than during HFOV with and without intra-
cranial hypertension. This might have reduced left
ventricular filling and could explain the moderate differ-
ences between the two groups in left and right end-diastolic
volumes (Table 2).
Limitations
The primary limitation of this study was that we were
unable to randomize the order of the applied ventilatory
modes, since the transpulmonary pressures used for the
HFOV settings were determined during the preceding
phase with conventional ventilation. The sequence of PEEP
settings could have been randomized, but we believe that
the period of deflation and following alveolar recruitment
was sufficient to minimize memory effects in the lung.
There is the possibility that using each animal for all
ventilator modes might induce factors relating to the his-
tory of the lung, which as a consequence might influence
subsequent measurements. This could be reflected by dif-
ferences seen in the baseline values. However, performing
all measurements in a single animal has the advantage of
reducing inter-individual variability and allows the use of
paired-data analysis that gives a higher statistical power
and reduces the risk of type II error.
We did not induce ARDS in the study animals, as has
been done in other studies, because we were not interested
in the effects of HFOV in the injured lung but in its effects
before lung injury sets in.
Conclusions
The study results show that HFOV guided by transpul-
monary pressure is equal or superior to conventional
ventilatory regimens with regard to systemic and cerebral
hemodynamics and cerebral tissue oxygenation in animals
with increased ICP. It might therefore be useful as a pro-
phylactic approach to also prevent lung failure, not only as
a rescue strategy once lung failure has set in. The prom-
ising results in neonates and from small clinical studies
justify large scale trials with HFOV initiated immediately
after admission of the patient to the ICU.
References
1. Bratton SL, Davis RL. Acute lung injury in isolated traumatic
brain injury. Neurosurgery. 1997;40:707–12. discussion 12.
2. Zygun DA, Kortbeek JB, Fick GH, Laupland KB, Doig CJ. Non-
neurologic organ dysfunction in severe traumatic brain injury.
Crit Care Med. 2005;33:654–60.
3. Amato MB, Barbas CS, Medeiros DM, et al. Effect of a protec-
tive-ventilation strategy on mortality in the acute respiratory
distress syndrome. N Engl J Med. 1998;338:347–54.
4. Georgiadis D, Schwarz S, Baumgartner RW, Veltkamp R,
Schwab S. Influence of positive end-expiratory pressure on
intracranial pressure and cerebral perfusion pressure in patients
with acute stroke. Stroke. 2001;32:2088–92.
5. Huseby JS, Pavlin EG, Butler J. Effect of positive end-expiratory
pressure on intracranial pressure in dogs. J Appl Physiol.
1978;44:25–7.
6. Malhotra A. Low-tidal-volume ventilation in the acute respiratory
distress syndrome. N Engl J Med. 2007;357:1113–20.
7. Krishnan JA, Brower RG. High-frequency ventilation for acute
lung injury and ARDS. Chest. 2000;118:795–807.
8. Derdak S, Mehta S, Stewart TE, et al. High-frequency oscillatory
ventilation for acute respiratory distress syndrome in adults: a
randomized, controlled trial. Am J Respir Crit Care Med.
2002;166:801–8.
9. Nelle M, Zilow EP, Linderkamp O. Effects of high-frequency
oscillatory ventilation on circulation in neonates with pulmonary
interstitial emphysema or RDS. Intensive Care Med. 1997;23:671–6.
10. Fort P, Farmer C, Westerman J, et al. High-frequency oscillatory
ventilation for adult respiratory distress syndrome—a pilot study.
Crit Care Med. 1997;25:937–47.
11. David M, Weiler N, Heinrichs W, et al. High-frequency oscil-
latory ventilation in adult acute respiratory distress syndrome.
Intensive Care Med. 2003;29:1656–65.
12. Mehta S, Lapinsky SE, Hallett DC, et al. Prospective trial of
high-frequency oscillation in adults with acute respiratory distress
syndrome. Crit Care Med. 2001;29:1360–9.
13. Courtney SE, Durand DJ, Asselin JM, Hudak ML, Aschner JL,
Shoemaker CT. High-frequency oscillatory ventilation versus
conventional mechanical ventilation for very-low-birth-weight
infants. N Engl J Med. 2002;347:643–52.
14. David M, von Bardeleben RS, Weiler N, et al. Cardiac function
and haemodynamics during transition to high-frequency oscilla-
tory ventilation. Eur J Anaesthesiol. 2004;21:944–52.
15. Traverse JH, Korvenranta H, Adams EM, Goldthwait DA, Carlo
WA. Impairment of hemodynamics with increasing mean airway
pressure during high-frequency oscillatory ventilation. Pediatr
Res. 1988;23:628–31.
16. David M, Karmrodt J, Weiler N, Scholz A, Markstaller K, Eberle
B. High-frequency oscillatory ventilation in adults with traumatic
brain injury and acute respiratory distress syndrome. Acta Ana-
esthesiol Scand. 2005;49:209–14.
17. Bennett SS, Graffagnino C, Borel CO, James ML. Use of high
frequency oscillatory ventilation (HFOV) in neurocritical care
patients. Neurocrit Care. 2007;7:221–6.
18. David M, Markstaller K, Depta AL, et al. Initiation of high-frequency
oscillatory ventilation and its effects upon cerebral circulation in
pigs: an experimental study. Br J Anaesth. 2006;97:525–32.
19. Rohde V, Rohde I, Thiex R, et al. Fibrinolysis therapy achieved
with tissue plasminogen activator and aspiration of the liquefied
clot after experimental intracerebral hemorrhage: rapid reduction
in hematoma volume but intensification of delayed edema for-
mation. J Neurosurg. 2002;97:954–62.
20. Talmor D, Sarge T, Malhotra A, et al. Mechanical ventilation
guided by esophageal pressure in acute lung injury. N Engl J
Med. 2008;359:2095–104.
21. Amato MB, Barbas CS, Medeiros DM, et al. Beneficial effects of
the ‘‘open lung approach’’ with low distending pressures in acute
respiratory distress syndrome. A prospective randomized study
on mechanical ventilation. Am J Respir Crit Care Med. 1995;
152:1835–46.
22. Muench E, Bauhuf C, Roth H, et al. Effects of positive end-
expiratory pressure on regional cerebral blood flow, intracranial
Neurocrit Care
123

pressure, and brain tissue oxygenation. Crit Care Med. 2005;33:
2367–72.
23. Dauber IM, Weil JV. Lung injury edema in dogs. Influence of
sympathetic ablation. J Clin Invest. 1983;72:1977–86.
24. Hall SR, Wang L, Milne B, Hong M. Left ventricular dysfunction
after acute intracranial hypertension is associated with increased
hydroxyl free radical production, cardiac ryanodine hyperphosph-
orylation, and troponin I degradation. J Heart Lung Transplant.
2005;24:1639–49.
25. Szabo G, Hackert T, Buhmann V, et al. Downregulation of myo-
cardial contractility via intact ventriculo–arterial coupling in the
brain dead organ donor. Eur J Cardiothorac Surg. 2001;20:170–6.
26. Baumann A, Audibert G, McDonnell J, Mertes PM. Neurogenic
pulmonary edema. Acta Anaesthesiol Scand. 2007;51:447–55.
27. Huttemann E, Schelenz C, Chatzinikolaou K, Reinhart K. Left
ventricular dysfunction in lethal severe brain injury: impact of
transesophageal echocardiography on patient management.
Intensive Care Med. 2002;28:1084–8.
28. Huseby JS, Luce JM, Cary JM, Pavlin EG, Butler J. Effects of
positive end-expiratory pressure on intracranial pressure in dogs
with intracranial hypertension. J Neurosurg. 1981;55:704–5.
29. Wiesenack C, Prasser C, Keyl C, Rodig G. Assessment of
intrathoracic blood volume as an indicator of cardiac preload:
single transpulmonary thermodilution technique versus assess-
ment of pressure preload parameters derived from a pulmonary
artery catheter. J Cardiothorac Vasc Anesth. 2001;15:584–8.
Neurocrit Care
123


