Embed Size (px)
Citation preview
foods
Article
Effects of Enzymatic Hydrolysis on Physicochemical Propertiesand Solubility and Bitterness of Milk Protein Hydrolysates
Qiang Cui 1, Yuxue Sun 1 , Zengjia Zhou 1, Jianjun Cheng 1 and Mingruo Guo 1,2,*
�����������������
Citation: Cui, Q.; Sun, Y.; Zhou, Z.;
Cheng, J.; Guo, M. Effects of
Enzymatic Hydrolysis on
Physicochemical Properties and
Solubility and Bitterness of Milk
Protein Hydrolysates. Foods 2021, 10,
2462. https://doi.org/10.3390/
foods10102462
Academic Editors:
Abderrahmane AIT KADDOUR,
Sandra Abreu and Ivano De Noni
Received: 11 August 2021
Accepted: 13 October 2021
Published: 15 October 2021
Publisher’s Note: MDPI stays neutral
with regard to jurisdictional claims in
published maps and institutional affil-
iations.
Copyright: © 2021 by the authors.
Licensee MDPI, Basel, Switzerland.
This article is an open access article
distributed under the terms and
conditions of the Creative Commons
Attribution (CC BY) license (https://
creativecommons.org/licenses/by/
4.0/).
1 Key Laboratory of Dairy Science, Northeast Agricultural University, Harbin 150030, China;[email protected] (Q.C.); [email protected] (Y.S.); [email protected] (Z.Z.);[email protected] (J.C.)
2 Department of Nutrition and Food Sciences, College of Agriculture and Life Sciences, University of Vermont,Burlington, VT 05405, USA
* Correspondence: [email protected]
Abstract: Milk protein concentrate (MPC) is a high-protein dairy product. It is underutilized dueto its poor solubility compared with other milk protein products. This study aimed to investigatethe effect of enzymatic hydrolysis on the physicochemical properties and solubility of MPC. Resultsshowed that Alcalase hydrolysates possessed a higher degree of hydrolysis (DH) than Protamexand Flavourzyme hydrolysates. Similar results could be obtained using sodium dodecyl sulfate–polyacrylamide gel electrophoresis (SDS-PAGE). The molecular weight of the hydrolysate of Alcalasewas less than 10 kDa. Changes to the molecular weight thereby led to a modification in the fluores-cence intensity, Fourier-transform infrared spectrometry, and ultraviolet absorption. The solubilityof all hydrolysates was significantly increased (p < 0.05). Correlation analysis showed a positivecorrelation between solubility, DH, and bitterness; the correlation coefficients were 0.81 for DH and0.61 for bitterness. Electronic tongue analysis showed that the bitterness of Alcalase hydrolysateswas the highest, while the values for Protamex hydrolysates were the lowest.
Keywords: milk protein concentrate; solubility; bitterness; physicochemical properties
1. Introduction
Milk protein concentrate (MPC) is an ideal ingredient for high-protein foods. It hasexcellent functional properties, is rich in essential amino acids, and has high digestibility,thus making it an ideal choice for various nutritional products [1]. MPC is differentfrom whole milk powder (WMP) and skim milk powder (SMP). It is a product withminimum levels of lactose prepared from skim milk by physical separation techniques,such as membrane filtration [2,3]. The protein content is higher, generally 42–85% [4].The main proteins in MPC are whey protein and casein, and the ratio of casein to wheyprotein (80:20) is similar to that in skim milk [5]. At present, MPC is widely used in high-protein products, such as nutrition bars, coffee creamers, beverages, processed cheese, andGreek-style yogurt [6]. However, solubility is affected by a combination of temperature,relatively high relative humidity, and water activity. McKenna [7] reported the formationof insoluble substances in the MPC powder. It was found that the insoluble matter wasformed by casein micelles, with a particle size of up to 100 µm, and these micelles appearto aggregate through some form of protein-protein interaction. Havea [8] observed that theinsoluble matter in the MPC powder increased with the storage time at high temperatures.This substance is mainly composed of α-casein and β-casein. Anema, Pinder, Hunter,and Hemar [9] found that the insolubility in MPC might be caused by the protein cross-linking on the surface. Additional evidence showed that protein dissociates from caseinmicelles (especially κ-casein) and aggregates with β-lactoglobulin, forming a “skin” on thesurface of the powder particles and causing insolubility [10]. However, other mechanisms
Foods 2021, 10, 2462. https://doi.org/10.3390/foods10102462 https://www.mdpi.com/journal/foods
Foods 2021, 10, 2462 2 of 13
cannot be excluded, such as cross-linking of the proteins by hydrophobic and/or hydrogenbonding [10].
The solubility of a protein is the result of a balance between hydrophobic and ionicinteractions. Hydrophobic interaction facilitates the interaction between the proteins, andionic interaction promotes the interaction between protein and water [11]. In general,protein-protein interactions are more unfavorable for dissolution than protein-water inter-actions. A decrease in solubility will have a higher impact on other functional properties(gelation, foaming, emulsification, and surface activity) of the protein [12], thus limit-ing their use in yogurt, nutritional beverages, gel food, and cheese. Le, Bhandari, andDeeth [13] found that the Maillard reaction between lactose and protein may be one of thereasons for a decrease in the solubility of MPC powder. Ye [14] studied the relationshipbetween calcium content in MPC and casein aggregation and found that the total proteinconcentration on the surface of low-calcium MPC emulsions was lower in comparison. Theprotein composition of the droplet surface had changed, and the aggregation state of caseininfluenced the emulsifying ability of MPC. Sun et al. [15] found that longer ultrasoundpretreatment time induced more significant changes in the MPC function, such as gelation,solubility, and emulsification. These changes may be due to a destruction of the aggregationstate of the MPC protein by sonication. Since caseins in MPC are easy to digest, it is easier tobe hydrolyzed by the enzymes than the dense spherical structure of the whey protein [16].Therefore, enzyme treatment decreases the aggregation state and improves the functionalproperties of MPC. A number of studies reported an improvement in protein solubilityby enzymatic hydrolysis [17–19]. The functional properties of MPC and its hydrolysatesare of extreme importance. Flavourzyme, Alcalase, and Promatex are widely used in theproduction of hydrolyzed products. Flavourzyme is produced from Aspergillus oryzaestrains and is used for the hydrolysis of protein under neutral or slightly acid conditions.It is an aminopeptidase, i.e., a mixture of peptidase, endopeptidase, and exopeptidase.Flavourzyme hydrolyzed products formed by being mixed with bitter peptidase are diverseand usually small peptides and amino acids. Alcalase has a high specificity for aromatic(Phe, Trp, and Tyr), acidic (Glu), sulfur-containing (Met), aliphatic (Leu and Ala), hydroxyl(Ser), and basic (Lys) residues, which preferentially hydrolyses peptide bonds containingaromatic amino acid residues. Promatex is suggested for animal protein extraction asit contains vastly broad-spectrum endo-proteases, allowing an extensive hydrolysis ofproteins. Severin and Xia [20] studied Alcalase and Protamex hydrolysates of whey proteinconcentrate (WPC80) at different degrees of hydrolysis (DH). They reported improvedprotein solubility due to the formation of small particles. However, it is well known thatprotein hydrolysis may result in a bitter taste, mainly due to the presence of bitter peptides.Therefore, the choice of enzymes is a highly crucial factor.
Understanding the hydrolysis of the two main proteins of casein and whey protein inMPC is necessary to improve the applicability of dairy products. However, the literatureon the enzyme hydrolysis of MPC is limited [21], especially the knowledge of the structureand functional properties of MPC. Therefore, this study aimed to investigate: (1) the effectsof different hydrolysis times (30, 60, 90, 120, or 180 min) on the structural properties by UVspectra, intrinsic fluorescence spectroscopy, surface hydrophobicity, and FTIR test; and (2)three enzymes—Alcalase (endopeptidase), Flavourzyme, and Protamex—containing bothendo- and exo-peptidase on the physicochemical properties and the relationship betweenthe solubility and bitterness of MPC.
2. Materials and Methods2.1. Materials
Milk protein concentrate-85 was purchased from Ingredia Pte Ltd. (Midview, Singa-pore; manufacture date: 27 November 2019). The conditions of storage were 25 ± 3 ◦C,and the MPC was stored for 6 months and then studied. Flavourzyme (500 LAPU g−1,both with endo- and exo-peptidase), Protamex (1.5 AU g−1, both with endo- and exo-peptidase), and Alcalase (2.4 AU g−1, endopeptidase) were purchased from Novo Co.
Foods 2021, 10, 2462 3 of 13
(NovoNordisk, Bagsvaerd, Denmark). Other chemicals and reagents used in this studywere analytical grades.
2.2. Enzyme Hydrolysates
MPC was mixed into ultrapure water (MilliQ system; Millipore, Billerica, MA, USA)to obtain a 5% solution (w/v). We used 1 M HCl and 1 M NaOH to maintain the pH of thetotal volume of the MPC solutions (300 mL). The Alcalase (enzyme/substrate weight ratio,1:50) was hydrolyzed at 55 ◦C and pH 8.5. Protamex (enzyme/substrate weight ratio, 1:50)was hydrolyzed at 50 ◦C and pH 6.5, and Flavourzyme (enzyme/substrate weight ratio,1:50) at 50 ◦C and pH 7. The pH of the total volume of the MPC solutions was maintainedat the optimum value for each enzyme during the hydrolysis process. Based on preliminaryhydrolysis work, the aliquots hydrolysates (50 mL) were collected at time intervals of 30,60, 90, 120, 150, and 180 min and the aliquots were heated in a water bath (90 ◦C) for 15 minto deactivate enzymes. Its pH was then adjusted to 7.0 using HCl or NaOH. The sampleswere centrifuged at 8000× g for 15 min and the supernatant was collected and freeze-dried.All experiments were repeated three times.
2.3. Degree of Hydrolysis (DH)
The DH of the samples was determined according to the method of Zheng et al. [19]:briefly, at room temperature (22–28 ◦C), mixed with o-phthaldialdehyde (OPA) reagent(3 mL) and MPC hydrolysate (400 µL), and then incubated accurately for 2 min. At 340 nm,the absorbance of the mixed solution was measured with a UV spectrophotometer.
2.4. SDS-PAGE
Electrophoresis of MPC hydrolysate was determined according to the method re-ported by Laemmli [22]. In particular, the concentrated gel (5%) and separated gel (12%)were prepared for SDS-PAGE electrophoresis experiments and the sample was diluted to5 mg/mL (10 µL), mixed with SDS loading buffer, and boiled for 5 min. The voltage wasset as 80 V when electrophoresis was initiated, and as 120 V when the strip entered theseparation gel. At the end of electrophoresis, we stained the gel with Coomassie BrilliantBlue Rapid Staining Solution (Solarbio Co., Ltd., Beijing, China) for 1 h. De-staining: withan ultrapure water for decolorization treatment; each treatment was 30 min; a total offive treatments.
2.5. Ultraviolet (UV) Spectra
The MPC hydrolysates were dissolved in 0.01 mol/L, pH 7.0 phosphate-bufferedsaline (PBS), and the protein content was diluted to 0.1 mg/mL. Then, following themethod of Avramenko, Low, and Nickerson [23], we set the scanning wavelength range of250–480 nm to UV scanning.
2.6. Intrinsic Fluorescence Spectroscopy
MPC hydrolysates were dissolved in 0.01 mol/L, pH 7.0 PBS and the protein contentwas diluted to 0.2 mg/mL. We then set the excitation wavelength to 290 nm and theemission wavelength was from 300 to 450 nm. The fluorescence spectrophotometer (F-4500,Hitachi, Tokyo, Japan) performed the scanning [24].
2.7. Surface Hydrophobicity (H0) Measurements
H0 of MPC hydrolysate was determined according to the method reported by Hu,Cheung, Pan, and Li [25]. Briefly, MPC hydrolysate protein content was adjusted to 0.025,0.050, 0.100, and 0.200 mg/mL, then mixed with 1-aniline naphthalene-8-sulfonic acidsolution (ANS, 20 µL) and kept in the dark for 15 min. The emission wavelength was470 nm and the excitation wavelength was 390 nm. The surface hydrophobicity of theprotein was expressed as the initial slope of relative fluorescence intensity (RFI) relativeprotein concentration (calculated by linear regression analysis).
Foods 2021, 10, 2462 4 of 13
2.8. Fourier Infrared Spectrum (FTIR)
FTIR of MPC hydrolysate samples was determined by Silva, Zisu, and Chandra-pala [26]. We mixed the MPC hydrolysate sample (1 mg) with potassium bromide, thenset the measurement range at 4000–400 cm−1. FTIR-8400 S spectrometer was used forFTIR measurement.
2.9. Static Laser Light Scattering for Particle Size
MPC hydrolysates were dissolved in 0.2 mol/L, pH 7.0 PBS and the protein contentwas diluted to 0.1 mg/mL. Then untreated MPC was measured by Master Sizer 3000 E laserparticle size analyzer (Malvern Instruments Ltd., Malvern, UK), and the MPC hydrolysatessamples were measured by NANO ZS 90 laser particle size analyzer (Malvern InstrumentsLtd., Malvern, UK) [27].
2.10. Electronic Tongue Measurements
The taste changes of samples were determined according to the method reportedby Liu, Zhu, Peng, Guo, and Zhou [28]. Briefly, MPC hydrolysate protein content wasadjusted to 0.02 g/mL. Electronic Tongue TS-5000 Z (Insent Inc., Tokyo, Japan) was usedfor taste measurement. The reference solution was prepared by dissolving tartaric acid andpotassium chloride in ultrapure water. Each sample was measured four times with thesensors of bitterness aftertaste (aftertaste-B), astringency, astringent aftertaste (aftertaste-A),and bitterness.
2.11. Soluble Protein Determination
The untreated MPC and MPC hydrolysates were magnetically stirred for 30 min tofully disperse in ultrapure water (1%, w/v). Briefly, the content of soluble protein in thesupernatant was determined with the Biuret method. The calculation formulations ofsolubility were as follows [29]:
Solubility = Soluble protein content in hydrolysate × Volume of hydrolysate/Total protein × 100 (1)
2.12. Statistical Analysis
Experiments were carried out three times and the mean and standard deviation werecalculated from this data. Differences between the values at different incubation timesfor each enzyme were analyzed using ANOVA, and p < 0.05 was identified as beingsignificantly different. All figures were plotted using Origin 2020 (OriginLab Corporation,Northampton, MA, USA).
3. Results3.1. Degree of Hydrolysis and Analysis of Soluble Protein
The DH of MPC hydrolysates obtained from Alcalase, Protamex, and Flavourzymedigestion are presented in Table 1. The DH showed increasing trends in different hydrolysistimes and exhibited a sharp increase in the first 30 min. Alcalase showed a much fasterrate of hydrolysis than Protamex and Flavorzyme, which was consistent with the resultsof Al-Ruwaih, Ahmed, Mulla, and Arfat [30]. After 120 min, the DH displayed a relativeplateau-like pattern. The change process of DH in this study was similar to those inprevious studies [17,31–33]. The DH (180 min) of 15.72% was observed when hydrolyzingMPC with Alcalase, while the DH (180 min) of Protamex and Flavourzyme were 13.62%and 11.87%, respectively. The aforementioned proteases behaved differently even at theoptimum temperature and pH, further indicating that the difference in hydrolysates wasdetermined by the specific reaction site of the protease.
Foods 2021, 10, 2462 5 of 13
Table 1. Degree of hydrolysis and solubility of should be milk protein concentrate (MPC) hydrolysates by Alcalase,Flavourzyme, and Protamex.
Sample (min)DH Solubility
Alcalase Protamex Flavourzyme Alcalase Protamex Flavourzyme
control - - - 48.2 ± 0.51a 48.2 ± 0.51a 48.2 ± 0.51a30 12.9 ± 0.51a 10.1 ± 0.97a 9.9 ± 0.79a 72.1 ± 2.3b 68.2 ± 1.1d 64.3 ± 0.19b60 13.2 ± 0.42a 12.60 ± 1.2ab 10.1 ± 1.1a 74.1 ± 1.1c 61.6 ± 2.1b 64.9 ± 1.2b90 14.7 ± 1.1ab 13.3 ± 0.76b 10.4 ± 1.1a 78.0 ± 3.20d 67.3 ± 1.2d 67.6 ± 0.87c
120 15.3 ± 0.95b 13.3 ± 0.83b 11.5 ± 1.1a 86.3 ± 2.1e 64.1 ± 2.2c 70.8 ± 0.94d150 15.6 ± 0.12b 13.4 ± 1.2b 11.6 ± 0.21a 90.2 ± 1.1f 81.1 ± 1.1e 72.6 ± 1.2d180 15.7 ± 1.3b 13.6 ± 0.93b 11.9 ± 0.13a 91.1 ± 0.91f 85.1 ± 1.2f 75.2 ± 2.1e
All experiments were done in parallel for at least three times. Data represent mean ± standard deviations. Different lowercase letters in thesame column indicate the significant differences of different hydrolysis times (p < 0.05).
MPC powders gradually lose protein solubility upon storage [34]. Table 1 shows thesolubility of MPC. As the insoluble material was formed, more of the soluble protein turnedinsoluble and was lost to the sediment during centrifugation. Following the hydrolysis ofMPC, the solubility of the hydrolysate increased simultaneously with the incubation time.After Alcalase hydrolysis, the solubility of MPC reached the highest value (91.01%). Thesolubility of Fravourenzyme hydrolysates also increased significantly after hydrolysis, butthe rate of increase was less than that of Alcalase and Protamex. Untreated MPC had thelowest solubility (48.23%). Generally, the conformational modification of protein moleculesduring storage is linked with the loss of solubility [34]. The reason for the solubility changesof MPC after enzymatic hydrolysis may be due to the caseins in MPC that are more sensitiveto the enzymes compared with whey protein and are easily hydrolyzed by enzymes. Inaddition, interactions between the proteins may be reduced after hydrolysis, resulting inchanges to the original characteristics of the MPC so that it increases in solubility.
3.2. SDS-PAGE
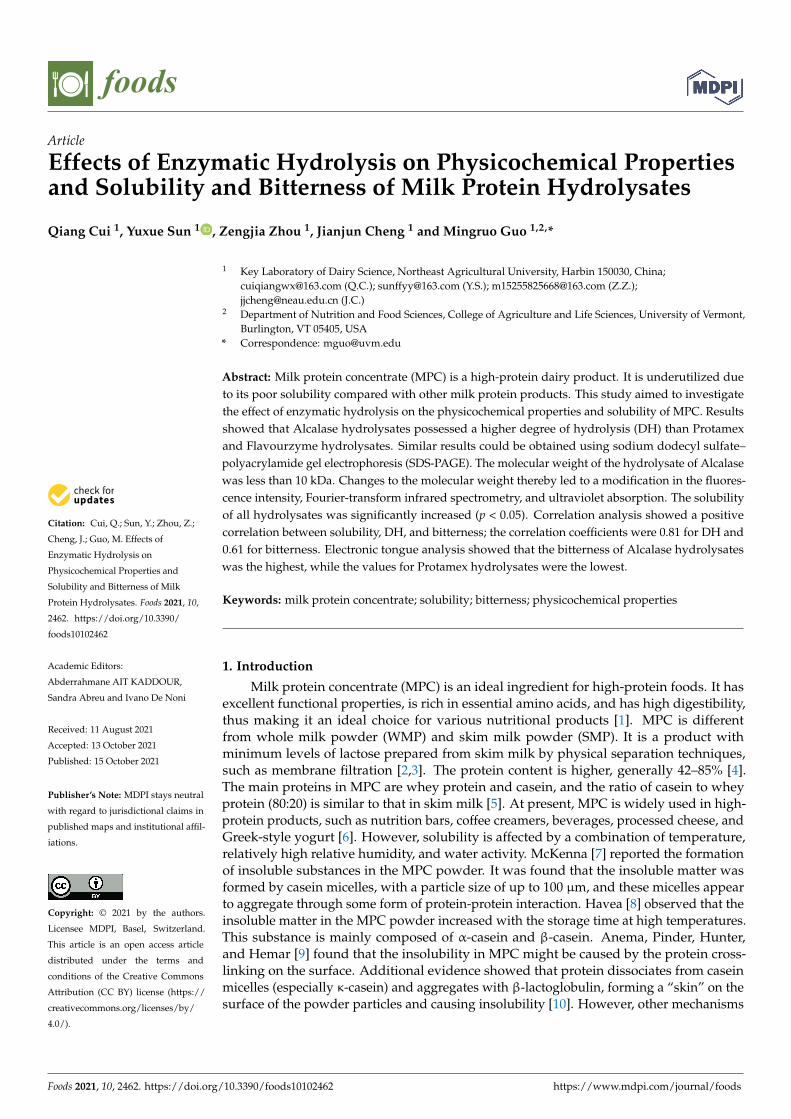
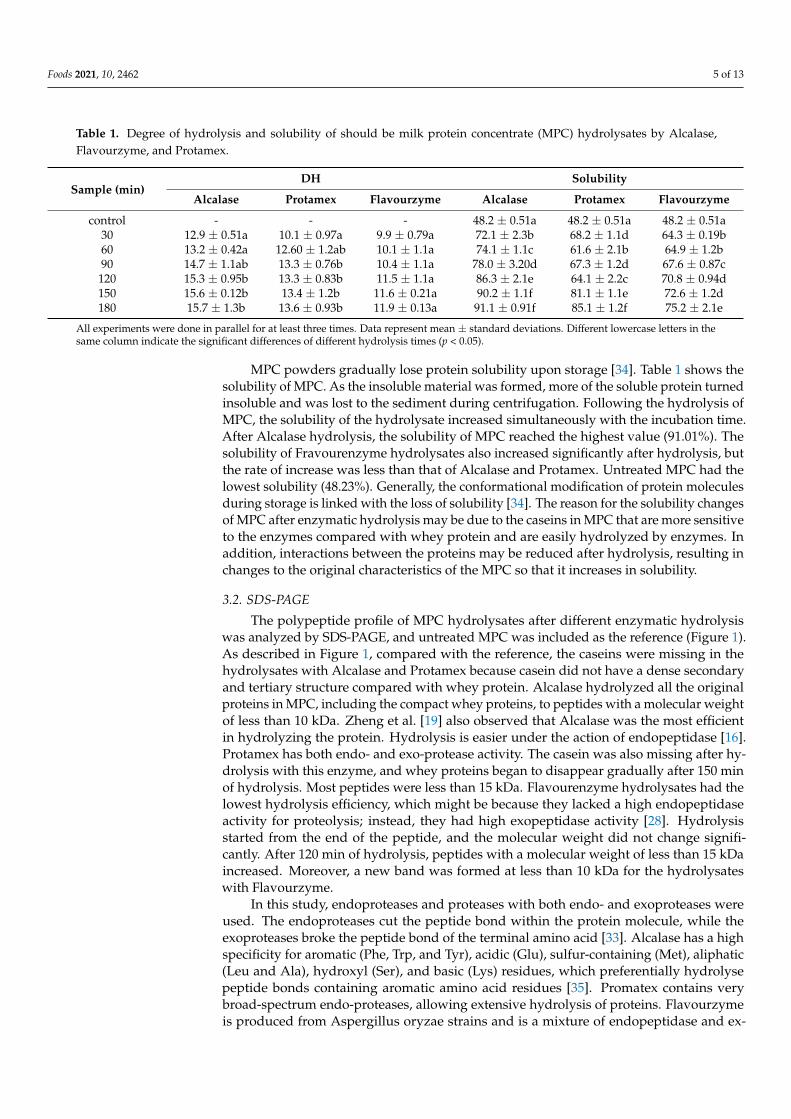
The polypeptide profile of MPC hydrolysates after different enzymatic hydrolysiswas analyzed by SDS-PAGE, and untreated MPC was included as the reference (Figure 1).As described in Figure 1, compared with the reference, the caseins were missing in thehydrolysates with Alcalase and Protamex because casein did not have a dense secondaryand tertiary structure compared with whey protein. Alcalase hydrolyzed all the originalproteins in MPC, including the compact whey proteins, to peptides with a molecular weightof less than 10 kDa. Zheng et al. [19] also observed that Alcalase was the most efficientin hydrolyzing the protein. Hydrolysis is easier under the action of endopeptidase [16].Protamex has both endo- and exo-protease activity. The casein was also missing after hy-drolysis with this enzyme, and whey proteins began to disappear gradually after 150 minof hydrolysis. Most peptides were less than 15 kDa. Flavourenzyme hydrolysates had thelowest hydrolysis efficiency, which might be because they lacked a high endopeptidaseactivity for proteolysis; instead, they had high exopeptidase activity [28]. Hydrolysisstarted from the end of the peptide, and the molecular weight did not change signifi-cantly. After 120 min of hydrolysis, peptides with a molecular weight of less than 15 kDaincreased. Moreover, a new band was formed at less than 10 kDa for the hydrolysateswith Flavourzyme.
In this study, endoproteases and proteases with both endo- and exoproteases wereused. The endoproteases cut the peptide bond within the protein molecule, while theexoproteases broke the peptide bond of the terminal amino acid [33]. Alcalase has a highspecificity for aromatic (Phe, Trp, and Tyr), acidic (Glu), sulfur-containing (Met), aliphatic(Leu and Ala), hydroxyl (Ser), and basic (Lys) residues, which preferentially hydrolysepeptide bonds containing aromatic amino acid residues [35]. Promatex contains verybroad-spectrum endo-proteases, allowing extensive hydrolysis of proteins. Flavourzymeis produced from Aspergillus oryzae strains and is a mixture of endopeptidase and ex-
Foods 2021, 10, 2462 6 of 13
opeptidase [36]. Therefore, MPC produced different hydrolysates following hydrolysisby various proteases. This is the main reason for the distinct structures and functionalproperties of the hydrolysates.
Foods 2021, 10, x FOR PEER REVIEW 6 of 14
(Leu and Ala), hydroxyl (Ser), and basic (Lys) residues, which preferentially hydrolyse peptide bonds containing aromatic amino acid residues [35]. Promatex contains very broad-spectrum endo-proteases, allowing extensive hydrolysis of proteins. Flavourzyme is produced from Aspergillus oryzae strains and is a mixture of endopeptidase and exo-peptidase [36]. Therefore, MPC produced different hydrolysates following hydrolysis by various proteases. This is the main reason for the distinct structures and functional prop-erties of the hydrolysates.
Figure 1. Sodium dodecyl sulfate–polyacrylamide gel electrophoresis (SDS-PAGE) of MPC and samples hydrolyzed by Alcalase, Flavorzyme, and Protamex at 30, 60, 90, 120, 150, and 180 min, respectively. The molecular weight of standard markers employed were 170, 130, 100, 70, 55, 40, 35, 25, 15, and 10 kDa, respectively.
3.3. Surface Hydrophobicity Surface hydrophobicity (H0) is one of the important influencing factors for protein
structural properties, functional properties, and stability. The H0 of unmodified MPC and MPC hydrolysates is represented in Figure 2. The H0 of Alcalase hydrolysate was found to be the lowest. Alcalase preferentially hydrolyzes aromatic amino acid residues. The H0 of the Alcalase hydrolysate product was not protruding, which was related to the content of the anionic protein. The hydrolysis solution obtained by Flavourzyme had the highest H0. Compared with other enzymes, Flavourzyme could easily expose anion sites; there-fore, the hydrolysate of Flavourzyme showed strong hydrophobicity [31]. After MPC was hydrolyzed by Alcalase and Protamex, H0 decreased with time. Zang, Yue, Wang, Shao, and Yu [37] found that H0 decreased with the increase in DH, which might be due to the free hydrophobic amino acids produced by enzymatic hydrolysis and the increased hy-drophobic interaction leading to protein rearrangement. A change in surface hydropho-bicity indicated the modified protein conformation. H0 increased after being hydrolyzed for 90 min by Flavourenzyme, which may be because of the exposed hydrophobic sites buried in the protein structure due to enzymatic cleavage [38]. Banach et al. [4] found that the decrease in the surface hydrophobicity contributed to the increased solubility. This was consistent with the results of the experiment. Proteins with fewer hydrophobic func-tional groups on the surface had better solubility in water. The change in surface hydro-phobicity after enzymatic hydrolysis could be due to the release of more polar hydrophilic functional groups, thus improving the protein solubility [4].
Figure 1. Sodium dodecyl sulfate–polyacrylamide gel electrophoresis (SDS-PAGE) of MPC andsamples hydrolyzed by Alcalase, Flavorzyme, and Protamex at 30, 60, 90, 120, 150, and 180 min,respectively. The molecular weight of standard markers employed were 170, 130, 100, 70, 55, 40, 35,25, 15, and 10 kDa, respectively.
3.3. Surface Hydrophobicity
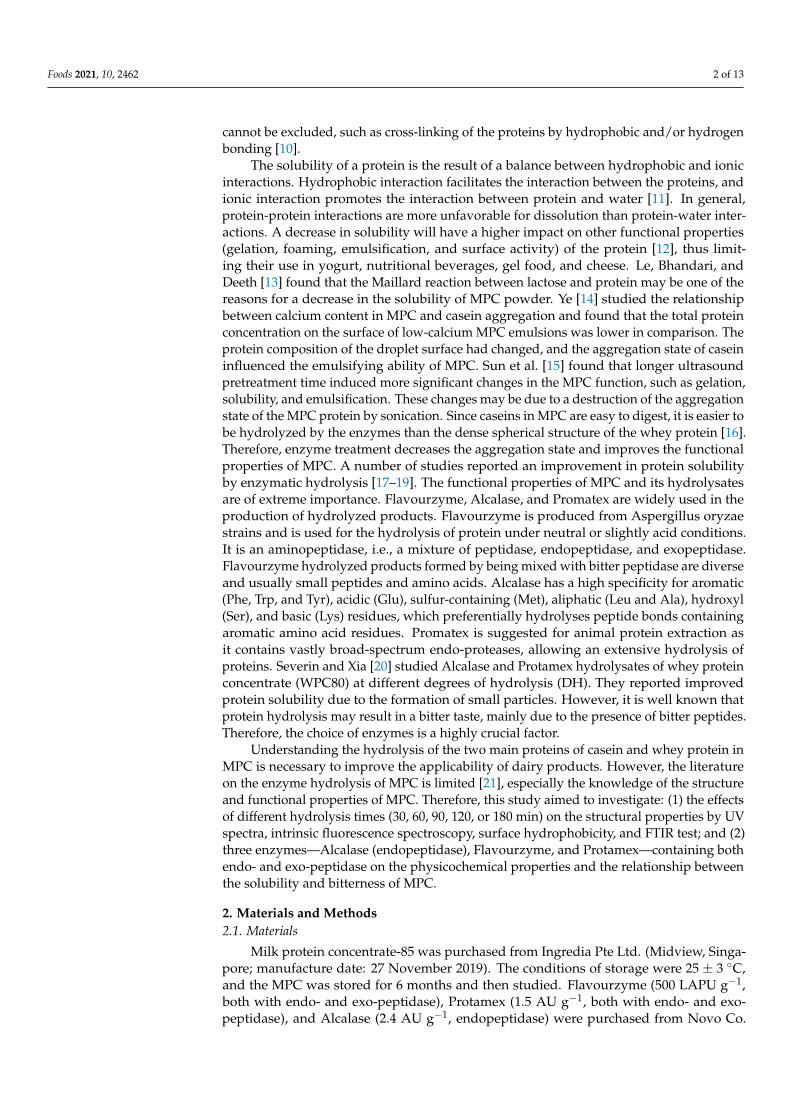
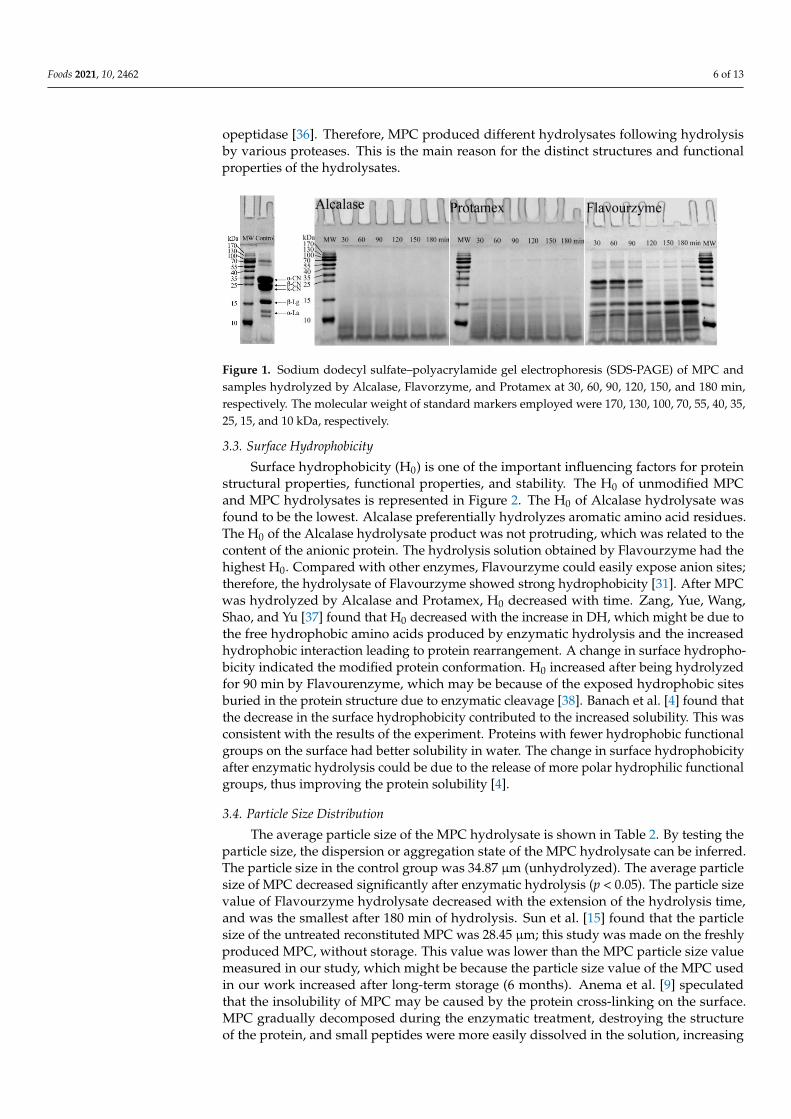
Surface hydrophobicity (H0) is one of the important influencing factors for proteinstructural properties, functional properties, and stability. The H0 of unmodified MPCand MPC hydrolysates is represented in Figure 2. The H0 of Alcalase hydrolysate wasfound to be the lowest. Alcalase preferentially hydrolyzes aromatic amino acid residues.The H0 of the Alcalase hydrolysate product was not protruding, which was related to thecontent of the anionic protein. The hydrolysis solution obtained by Flavourzyme had thehighest H0. Compared with other enzymes, Flavourzyme could easily expose anion sites;therefore, the hydrolysate of Flavourzyme showed strong hydrophobicity [31]. After MPCwas hydrolyzed by Alcalase and Protamex, H0 decreased with time. Zang, Yue, Wang,Shao, and Yu [37] found that H0 decreased with the increase in DH, which might be due tothe free hydrophobic amino acids produced by enzymatic hydrolysis and the increasedhydrophobic interaction leading to protein rearrangement. A change in surface hydropho-bicity indicated the modified protein conformation. H0 increased after being hydrolyzedfor 90 min by Flavourenzyme, which may be because of the exposed hydrophobic sitesburied in the protein structure due to enzymatic cleavage [38]. Banach et al. [4] found thatthe decrease in the surface hydrophobicity contributed to the increased solubility. This wasconsistent with the results of the experiment. Proteins with fewer hydrophobic functionalgroups on the surface had better solubility in water. The change in surface hydrophobicityafter enzymatic hydrolysis could be due to the release of more polar hydrophilic functionalgroups, thus improving the protein solubility [4].
3.4. Particle Size Distribution
The average particle size of the MPC hydrolysate is shown in Table 2. By testing theparticle size, the dispersion or aggregation state of the MPC hydrolysate can be inferred.The particle size in the control group was 34.87 µm (unhydrolyzed). The average particlesize of MPC decreased significantly after enzymatic hydrolysis (p < 0.05). The particle sizevalue of Flavourzyme hydrolysate decreased with the extension of the hydrolysis time,and was the smallest after 180 min of hydrolysis. Sun et al. [15] found that the particlesize of the untreated reconstituted MPC was 28.45 µm; this study was made on the freshlyproduced MPC, without storage. This value was lower than the MPC particle size valuemeasured in our study, which might be because the particle size value of the MPC usedin our work increased after long-term storage (6 months). Anema et al. [9] speculatedthat the insolubility of MPC may be caused by the protein cross-linking on the surface.MPC gradually decomposed during the enzymatic treatment, destroying the structureof the protein, and small peptides were more easily dissolved in the solution, increasing
Foods 2021, 10, 2462 7 of 13
the solubility. The peptide further decomposed or aggregated with the extension of thehydrolysis time. Shen et al. [18] found that the particle size of soy protein increased withthe increase in DH after Alcalase hydrolysis. Similarly, the particle size of MPC increasedafter hydrolysis with Alcalase and Protamex.
Foods 2021, 10, x FOR PEER REVIEW 7 of 14
Figure 2. The surface hydrophobicity of control MPC and samples hydrolyzed by Flavorzyme, Al-calase, and Protamex at 30, 60, 90, 120, 150, and 180 min, respectively.
3.4. Particle Size Distribution The average particle size of the MPC hydrolysate is shown in Table 2. By testing the
particle size, the dispersion or aggregation state of the MPC hydrolysate can be inferred. The particle size in the control group was 34.87 μm (unhydrolyzed). The average particle size of MPC decreased significantly after enzymatic hydrolysis (p < 0.05). The particle size value of Flavourzyme hydrolysate decreased with the extension of the hydrolysis time, and was the smallest after 180 min of hydrolysis. Sun et al. [15] found that the particle size of the untreated reconstituted MPC was 28.45 μm; this study was made on the freshly produced MPC, without storage. This value was lower than the MPC particle size value measured in our study, which might be because the particle size value of the MPC used in our work increased after long-term storage (6 months). Anema et al. [9] speculated that the insolubility of MPC may be caused by the protein cross-linking on the surface. MPC gradually decomposed during the enzymatic treatment, destroying the structure of the protein, and small peptides were more easily dissolved in the solution, increasing the sol-ubility. The peptide further decomposed or aggregated with the extension of the hydrol-ysis time. Shen et al. [18] found that the particle size of soy protein increased with the increase in DH after Alcalase hydrolysis. Similarly, the particle size of MPC increased after hydrolysis with Alcalase and Protamex.
Table 2. Particle size of MPC hydrolysates by Alcalase, Flavorzyme, and Protamex.
Sample (min)
Particle Size (nm) Alcalase Protamex Flavourzyme
control 34.87 ± 1.21 (μm) 30 245.8 ± 2.9a 226.4 ± 4.6bc 220.1 ± 4.3c 60 261.7 ± 1.5b 221.3 ± 1.7ab 213.3 ± 4.9c 90 258.8 ± 41b 218.9 ± 3.9a 221.7 ± 16.8c
Figure 2. The surface hydrophobicity of control MPC and samples hydrolyzed by Flavorzyme,Alcalase, and Protamex at 30, 60, 90, 120, 150, and 180 min, respectively.
Table 2. Particle size of MPC hydrolysates by Alcalase, Flavorzyme, and Protamex.
Sample (min)Particle Size (nm)
Alcalase Protamex Flavourzyme
control 34.87 ± 1.21 (µm)30 245.8 ± 2.9a 226.4 ± 4.6bc 220.1 ± 4.3c60 261.7 ± 1.5b 221.3 ± 1.7ab 213.3 ± 4.9c90 258.8 ± 41b 218.9 ± 3.9a 221.7 ± 16.8c
120 261.9 ± 4.20b 229.1 ± 4.3cd 221.1 ± 3.4c150 275.8 ± 3.2c 243.9 ± 2.6e 199.8 ± 1.1b180 286.9 ± 3.3d 234.7 ± 3.3d 183.3 ± 2.3a
All experiments were done in parallel for at least three times. Data represent mean ± standard deviations.Different lowercase letters in the same column indicate the significant differences between various hydrolysistimes (p < 0.05).
3.5. Relative Fluorescence Intensity and Ultraviolet Absorption Spectroscopy
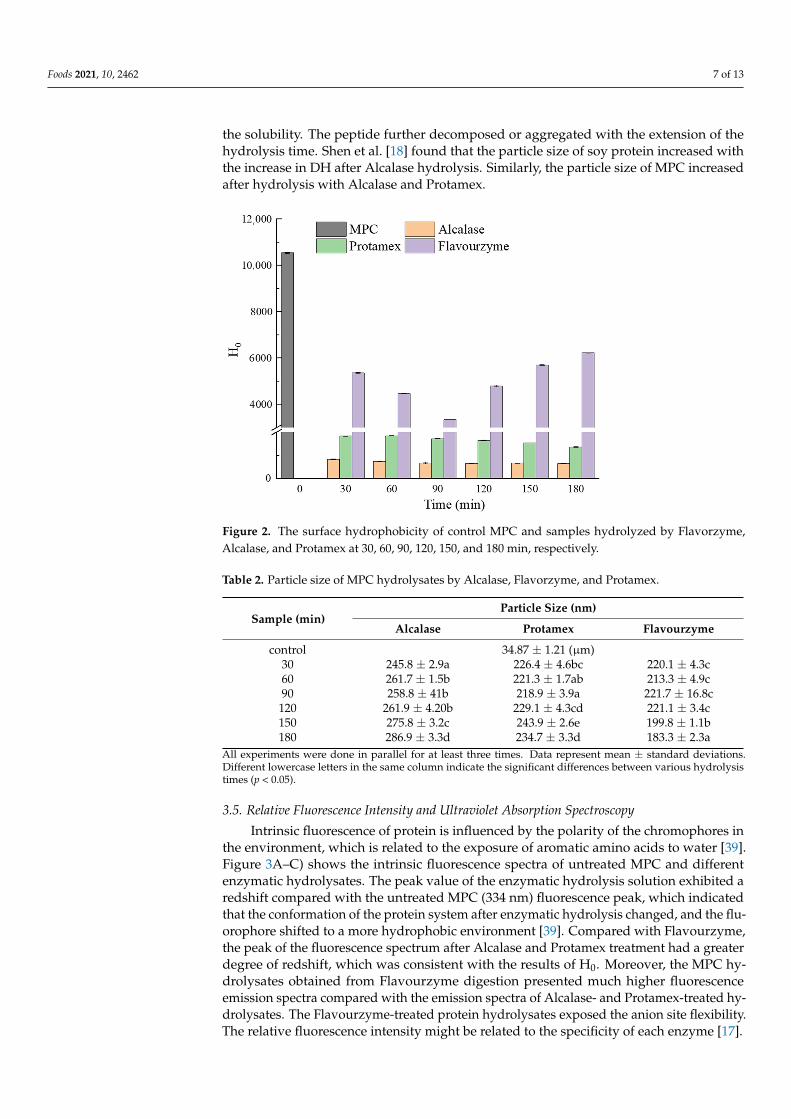
Intrinsic fluorescence of protein is influenced by the polarity of the chromophores inthe environment, which is related to the exposure of aromatic amino acids to water [39].Figure 3A–C) shows the intrinsic fluorescence spectra of untreated MPC and differentenzymatic hydrolysates. The peak value of the enzymatic hydrolysis solution exhibited aredshift compared with the untreated MPC (334 nm) fluorescence peak, which indicatedthat the conformation of the protein system after enzymatic hydrolysis changed, and the flu-orophore shifted to a more hydrophobic environment [39]. Compared with Flavourzyme,the peak of the fluorescence spectrum after Alcalase and Protamex treatment had a greaterdegree of redshift, which was consistent with the results of H0. Moreover, the MPC hy-drolysates obtained from Flavourzyme digestion presented much higher fluorescenceemission spectra compared with the emission spectra of Alcalase- and Protamex-treated hy-drolysates. The Flavourzyme-treated protein hydrolysates exposed the anion site flexibility.The relative fluorescence intensity might be related to the specificity of each enzyme [17].
Foods 2021, 10, 2462 8 of 13
Foods 2021, 10, x FOR PEER REVIEW 8 of 14
120 261.9 ± 4.20b 229.1 ± 4.3cd 221.1 ± 3.4c 150 275.8 ± 3.2c 243.9 ± 2.6e 199.8 ± 1.1b 180 286.9 ± 3.3d 234.7 ± 3.3d 183.3 ± 2.3a
All experiments were done in parallel for at least three times. Data represent mean ± standard de-viations. Different lowercase letters in the same column indicate the significant differences be-tween various hydrolysis times (p < 0.05).
3.5. Relative Fluorescence Intensity and Ultraviolet Absorption Spectroscopy Intrinsic fluorescence of protein is influenced by the polarity of the chromophores in
the environment, which is related to the exposure of aromatic amino acids to water [39]. Figure 3A–C) shows the intrinsic fluorescence spectra of untreated MPC and different en-zymatic hydrolysates. The peak value of the enzymatic hydrolysis solution exhibited a redshift compared with the untreated MPC (334 nm) fluorescence peak, which indicated that the conformation of the protein system after enzymatic hydrolysis changed, and the fluorophore shifted to a more hydrophobic environment [39]. Compared with Fla-vourzyme, the peak of the fluorescence spectrum after Alcalase and Protamex treatment had a greater degree of redshift, which was consistent with the results of H0. Moreover, the MPC hydrolysates obtained from Flavourzyme digestion presented much higher flu-orescence emission spectra compared with the emission spectra of Alcalase- and Prota-mex-treated hydrolysates. The Flavourzyme-treated protein hydrolysates exposed the an-ion site flexibility. The relative fluorescence intensity might be related to the specificity of each enzyme [17].
The results of ultraviolet (UV) absorption spectra of MPC hydrolysates obtained with Alcalase, Protamex, and Flavourzyme are shown in Figure 3D–F). The maximum absorp-tion peak of untreated MPC was at 275 nm. Predictably, the enzymatic hydrolysis caused a significant shift in the UV absorption bands. This shift was most likely caused by the conformational changes in protein after enzymatic treatment [19]. Compared with Al-calase and Protamex, the UV spectrum of Flavourzyme hydrolysis was significantly dif-ferent, which highlighted that the hydrolyzed products of MPC were different for differ-ent enzymes.
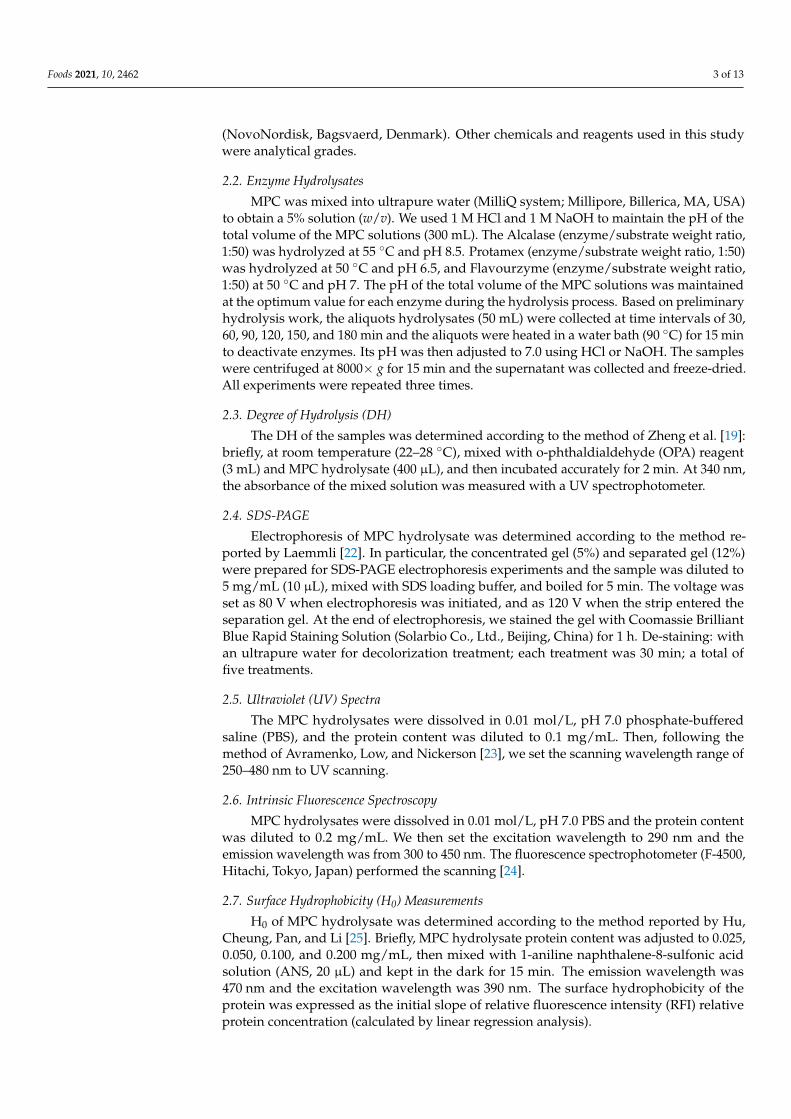
Figure 3. Structural characterization of MPC and hydrolysates. Relative fluorescence spectra of milk protein concentrate and hydrolysates prepared with Alcalase (A), Protamex (B), and Flavorzyme (C); as well as UV–visible spectra of MPC and hydrolysates prepared with Alcalase (D), Protamex (E), and Flavorzyme (F).
Figure 3. Structural characterization of MPC and hydrolysates. Relative fluorescence spectra of milk protein concentrateand hydrolysates prepared with Alcalase (A), Protamex (B), and Flavorzyme (C); as well as UV–visible spectra of MPC andhydrolysates prepared with Alcalase (D), Protamex (E), and Flavorzyme (F).
The results of ultraviolet (UV) absorption spectra of MPC hydrolysates obtainedwith Alcalase, Protamex, and Flavourzyme are shown in Figure 3D–F). The maximumabsorption peak of untreated MPC was at 275 nm. Predictably, the enzymatic hydrolysiscaused a significant shift in the UV absorption bands. This shift was most likely causedby the conformational changes in protein after enzymatic treatment [19]. Compared withAlcalase and Protamex, the UV spectrum of Flavourzyme hydrolysis was significantlydifferent, which highlighted that the hydrolyzed products of MPC were different fordifferent enzymes.
3.6. FTIR
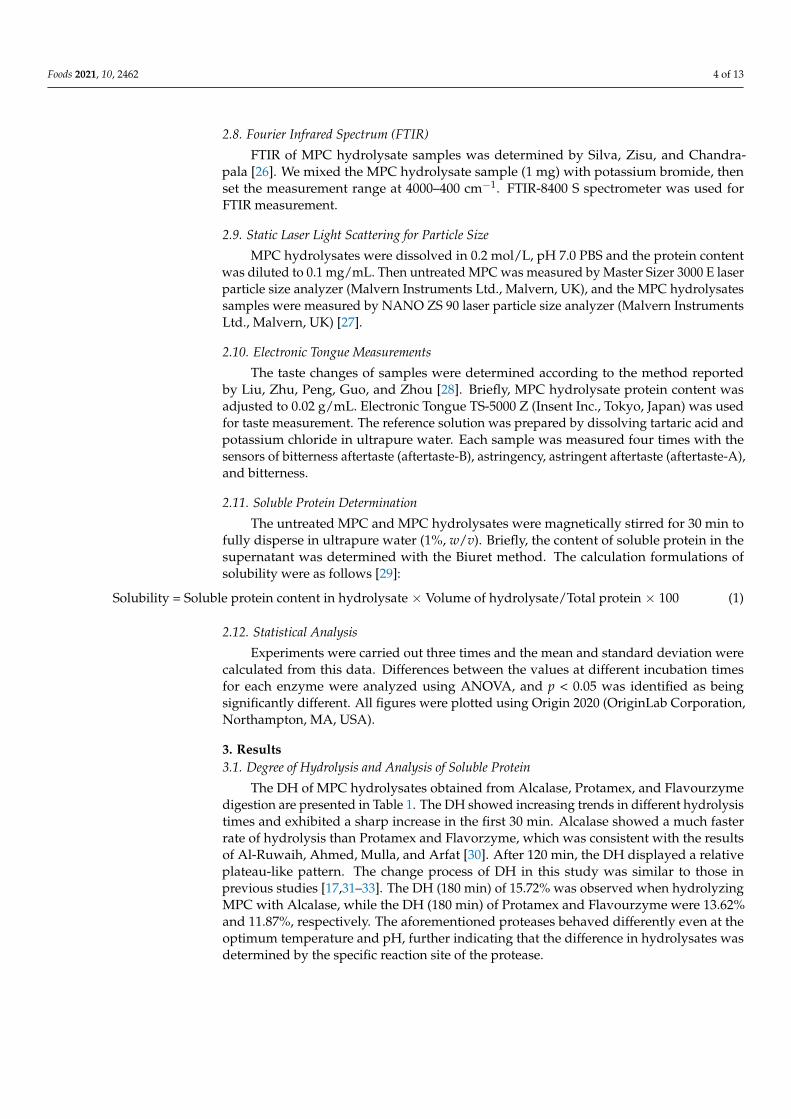
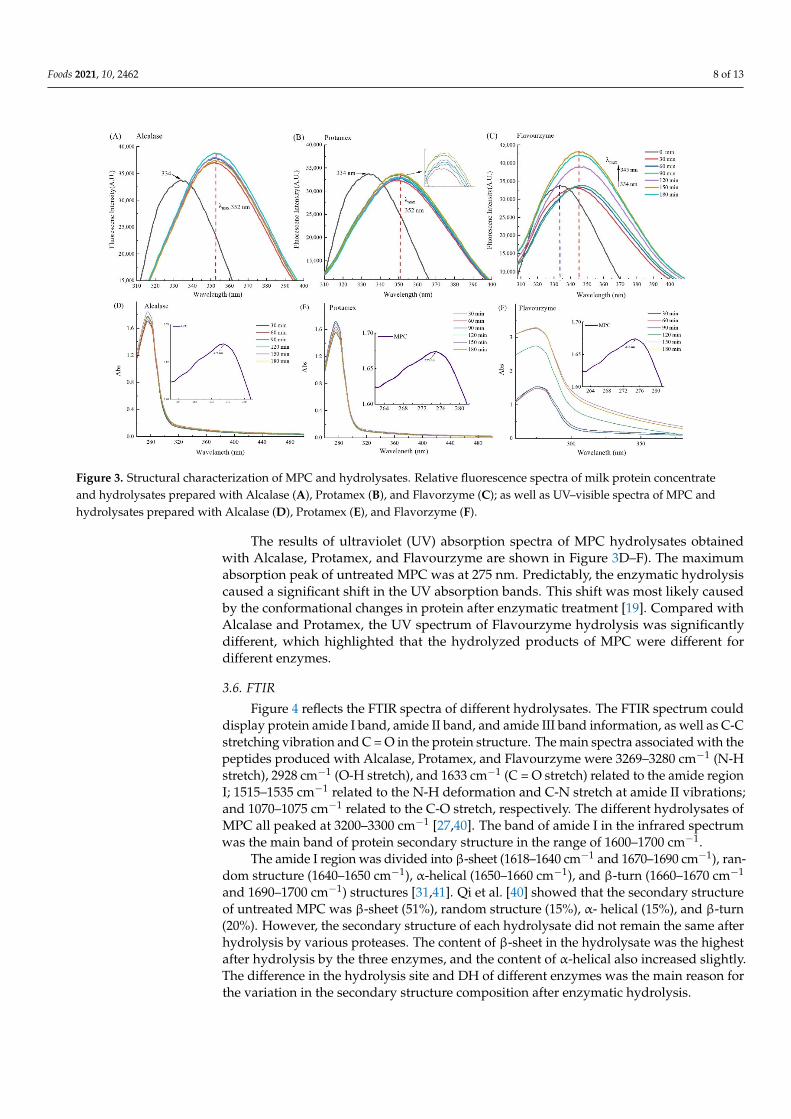
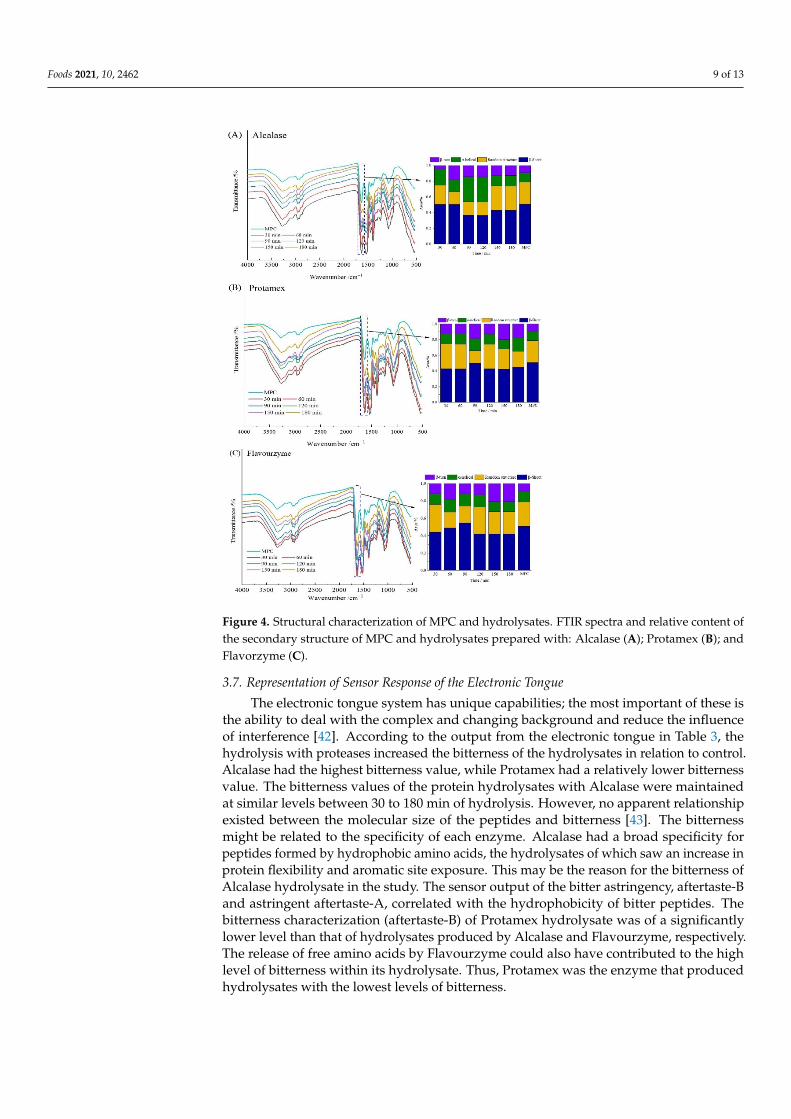
Figure 4 reflects the FTIR spectra of different hydrolysates. The FTIR spectrum coulddisplay protein amide I band, amide II band, and amide III band information, as well as C-Cstretching vibration and C = O in the protein structure. The main spectra associated with thepeptides produced with Alcalase, Protamex, and Flavourzyme were 3269–3280 cm−1 (N-Hstretch), 2928 cm−1 (O-H stretch), and 1633 cm−1 (C = O stretch) related to the amide regionI; 1515–1535 cm−1 related to the N-H deformation and C-N stretch at amide II vibrations;and 1070–1075 cm−1 related to the C-O stretch, respectively. The different hydrolysates ofMPC all peaked at 3200–3300 cm−1 [27,40]. The band of amide I in the infrared spectrumwas the main band of protein secondary structure in the range of 1600–1700 cm−1.
The amide I region was divided into β-sheet (1618–1640 cm−1 and 1670–1690 cm−1), ran-dom structure (1640–1650 cm−1), α-helical (1650–1660 cm−1), and β-turn (1660–1670 cm−1
and 1690–1700 cm−1) structures [31,41]. Qi et al. [40] showed that the secondary structureof untreated MPC was β-sheet (51%), random structure (15%), α- helical (15%), and β-turn(20%). However, the secondary structure of each hydrolysate did not remain the same afterhydrolysis by various proteases. The content of β-sheet in the hydrolysate was the highestafter hydrolysis by the three enzymes, and the content of α-helical also increased slightly.The difference in the hydrolysis site and DH of different enzymes was the main reason forthe variation in the secondary structure composition after enzymatic hydrolysis.
Foods 2021, 10, 2462 9 of 13
Foods 2021, 10, x FOR PEER REVIEW 9 of 14
3.6. FTIR Figure 4 reflects the FTIR spectra of different hydrolysates. The FTIR spectrum could
display protein amide I band, amide II band, and amide III band information, as well as C-C stretching vibration and C = O in the protein structure. The main spectra associated with the peptides produced with Alcalase, Protamex, and Flavourzyme were 3269–3280 cm−1 (N-H stretch), 2928 cm−1 (O-H stretch), and 1633 cm−1 (C = O stretch) related to the amide region I; 1515–1535 cm−1 related to the N-H deformation and C-N stretch at amide II vibrations; and 1070–1075 cm−1 related to the C-O stretch, respectively. The different hydrolysates of MPC all peaked at 3200–3300 cm−1 [27,40]. The band of amide I in the infrared spectrum was the main band of protein secondary structure in the range of 1600–1700 cm−1.
The amide I region was divided into β-sheet (1618–1640 cm−1 and 1670–1690 cm−1), random structure (1640–1650 cm−1), α-helical (1650–1660 cm−1), and β-turn (1660–1670 cm−1 and 1690–1700 cm−1) structures [31,41]. Qi et al. [40] showed that the secondary structure of untreated MPC was β-sheet (51%), random structure (15%), α- helical (15%), and β-turn (20%). However, the secondary structure of each hydrolysate did not remain the same after hydrolysis by various proteases. The content of β-sheet in the hydrolysate was the highest after hydrolysis by the three enzymes, and the content of α-helical also increased slightly. The difference in the hydrolysis site and DH of different enzymes was the main reason for the variation in the secondary structure composition after enzymatic hydroly-sis.
Figure 4. Structural characterization of MPC and hydrolysates. FTIR spectra and relative content of the secondary structure of MPC and hydrolysates prepared with: Alcalase (A); Protamex (B); and Flavorzyme (C).
Figure 4. Structural characterization of MPC and hydrolysates. FTIR spectra and relative content ofthe secondary structure of MPC and hydrolysates prepared with: Alcalase (A); Protamex (B); andFlavorzyme (C).
3.7. Representation of Sensor Response of the Electronic Tongue
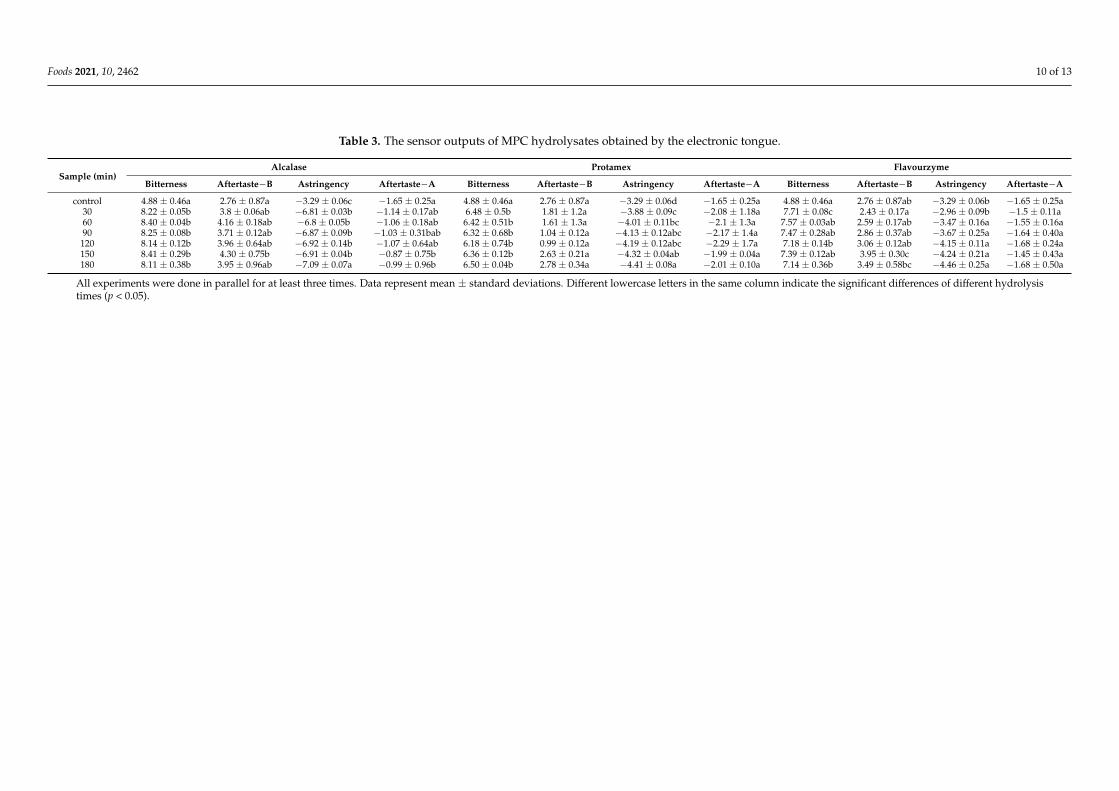
The electronic tongue system has unique capabilities; the most important of these isthe ability to deal with the complex and changing background and reduce the influenceof interference [42]. According to the output from the electronic tongue in Table 3, thehydrolysis with proteases increased the bitterness of the hydrolysates in relation to control.Alcalase had the highest bitterness value, while Protamex had a relatively lower bitternessvalue. The bitterness values of the protein hydrolysates with Alcalase were maintainedat similar levels between 30 to 180 min of hydrolysis. However, no apparent relationshipexisted between the molecular size of the peptides and bitterness [43]. The bitternessmight be related to the specificity of each enzyme. Alcalase had a broad specificity forpeptides formed by hydrophobic amino acids, the hydrolysates of which saw an increase inprotein flexibility and aromatic site exposure. This may be the reason for the bitterness ofAlcalase hydrolysate in the study. The sensor output of the bitter astringency, aftertaste-Band astringent aftertaste-A, correlated with the hydrophobicity of bitter peptides. Thebitterness characterization (aftertaste-B) of Protamex hydrolysate was of a significantlylower level than that of hydrolysates produced by Alcalase and Flavourzyme, respectively.The release of free amino acids by Flavourzyme could also have contributed to the highlevel of bitterness within its hydrolysate. Thus, Protamex was the enzyme that producedhydrolysates with the lowest levels of bitterness.
Foods 2021, 10, 2462 10 of 13
Table 3. The sensor outputs of MPC hydrolysates obtained by the electronic tongue.
Sample (min)Alcalase Protamex Flavourzyme
Bitterness Aftertaste−B Astringency Aftertaste−A Bitterness Aftertaste−B Astringency Aftertaste−A Bitterness Aftertaste−B Astringency Aftertaste−A
control 4.88 ± 0.46a 2.76 ± 0.87a −3.29 ± 0.06c −1.65 ± 0.25a 4.88 ± 0.46a 2.76 ± 0.87a −3.29 ± 0.06d −1.65 ± 0.25a 4.88 ± 0.46a 2.76 ± 0.87ab −3.29 ± 0.06b −1.65 ± 0.25a30 8.22 ± 0.05b 3.8 ± 0.06ab −6.81 ± 0.03b −1.14 ± 0.17ab 6.48 ± 0.5b 1.81 ± 1.2a −3.88 ± 0.09c −2.08 ± 1.18a 7.71 ± 0.08c 2.43 ± 0.17a −2.96 ± 0.09b −1.5 ± 0.11a60 8.40 ± 0.04b 4.16 ± 0.18ab −6.8 ± 0.05b −1.06 ± 0.18ab 6.42 ± 0.51b 1.61 ± 1.3a −4.01 ± 0.11bc −2.1 ± 1.3a 7.57 ± 0.03ab 2.59 ± 0.17ab −3.47 ± 0.16a −1.55 ± 0.16a90 8.25 ± 0.08b 3.71 ± 0.12ab −6.87 ± 0.09b −1.03 ± 0.31bab 6.32 ± 0.68b 1.04 ± 0.12a −4.13 ± 0.12abc −2.17 ± 1.4a 7.47 ± 0.28ab 2.86 ± 0.37ab −3.67 ± 0.25a −1.64 ± 0.40a120 8.14 ± 0.12b 3.96 ± 0.64ab −6.92 ± 0.14b −1.07 ± 0.64ab 6.18 ± 0.74b 0.99 ± 0.12a −4.19 ± 0.12abc −2.29 ± 1.7a 7.18 ± 0.14b 3.06 ± 0.12ab −4.15 ± 0.11a −1.68 ± 0.24a150 8.41 ± 0.29b 4.30 ± 0.75b −6.91 ± 0.04b −0.87 ± 0.75b 6.36 ± 0.12b 2.63 ± 0.21a −4.32 ± 0.04ab −1.99 ± 0.04a 7.39 ± 0.12ab 3.95 ± 0.30c −4.24 ± 0.21a −1.45 ± 0.43a180 8.11 ± 0.38b 3.95 ± 0.96ab −7.09 ± 0.07a −0.99 ± 0.96b 6.50 ± 0.04b 2.78 ± 0.34a −4.41 ± 0.08a −2.01 ± 0.10a 7.14 ± 0.36b 3.49 ± 0.58bc −4.46 ± 0.25a −1.68 ± 0.50a
All experiments were done in parallel for at least three times. Data represent mean ± standard deviations. Different lowercase letters in the same column indicate the significant differences of different hydrolysistimes (p < 0.05).

Foods 2021, 10, 2462 11 of 13
3.8. Correlation Analysis
The relationship between bitterness and different indicators of MPC hydrolysates wasaffected by many factors, such as enzyme activity, hydrolysis time, and enzyme type. Asshown in Figure 5, a positive correlation (r = 0.62) existed between bitterness and DH,which was in accordance with a previous study [44]. Proteins were hydrolyzed by proteasesinto small peptides, and the main substances producing bitterness were short peptides.Analysis of the correlations between the sensor outputs by the electronic tongue (Figure 5)showed a significant positive association (r = 0.71 and r = 0.82) between bitterness andaftertaste (aftertaste-B) and astringent aftertaste (aftertaste-A). The aftertaste (aftertaste-B)and astringent aftertaste (aftertaste-A) reflected the bitterness, which was related to thespecificity of each enzyme. According to the analysis by electronic tongue in Table 3, theAlcalase hydrolysate had the highest bitterness. Protein solubility had a positive correlation(r = 0.81 and r = 0.61) with DH and bitterness. Interactions between protein molecules maybe broken after hydrolysis, increasing the DH and protein solubility, but also increasing thebitterness value.
Foods 2021, 10, x FOR PEER REVIEW 12 of 14
3.8. Correlation Analysis The relationship between bitterness and different indicators of MPC hydrolysates
was affected by many factors, such as enzyme activity, hydrolysis time, and enzyme type. As shown in Figure 5, a positive correlation (r = 0.62) existed between bitterness and DH, which was in accordance with a previous study [44]. Proteins were hydrolyzed by prote-ases into small peptides, and the main substances producing bitterness were short pep-tides. Analysis of the correlations between the sensor outputs by the electronic tongue (Figure 5) showed a significant positive association (r = 0.71 and r = 0.82) between bitter-ness and aftertaste (aftertaste-B) and astringent aftertaste (aftertaste-A). The aftertaste (af-tertaste-B) and astringent aftertaste (aftertaste-A) reflected the bitterness, which was re-lated to the specificity of each enzyme. According to the analysis by electronic tongue in Table 3, the Alcalase hydrolysate had the highest bitterness. Protein solubility had a pos-itive correlation (r = 0.81 and r = 0.61) with DH and bitterness. Interactions between protein molecules may be broken after hydrolysis, increasing the DH and protein solubility, but also increasing the bitterness value.
Figure 5. Heatmap summarizing correlation coefficients between different indicators. Red repre-sents a positive correlation, blue represents a negative correlation, and the depth of color reflects the magnitude of the correlation coefficient. Pearson’s correlation analyses were performed. The R val-ues are shown in different colors in the figure, and the right legend provides a color interval with different R values. The p values are marked with asterisks (*) for p < 0.05.
4. Conclusions The results indicated that in the hydrolysates of MPC obtained by treatment with
Alcalase, the endopeptidase presented higher DH than those obtained by Protamex and Flavourzyme. The protein solubility of all hydrolysates significantly increased. In addi-tion to solubility, the bitterness of the hydrolysate is another main factor affecting the practical application of MPC. The solubility of hydrolysates of MPC was strongly corre-lated with DH and bitterness, especially solubility and DH. Compared with Alcalase and Flavourenzyme, the treatment with Protamex led to the hydrolysates with the lowest lev-els of bitterness. Considering solubility and bitterness properties, Protamex incubation for 120 min is best to hydrolyze MPC for use as an ingredient in different products. These results may help to better understand the effect of enzymes on the bitterness and solubility of MPC hydrolysates. This work could provide a new perspective on MPC utilization and
Figure 5. Heatmap summarizing correlation coefficients between different indicators. Red representsa positive correlation, blue represents a negative correlation, and the depth of color reflects themagnitude of the correlation coefficient. Pearson’s correlation analyses were performed. The Rvalues are shown in different colors in the figure, and the right legend provides a color interval withdifferent R values. The p values are marked with asterisks (*) for p < 0.05.
4. Conclusions
The results indicated that in the hydrolysates of MPC obtained by treatment withAlcalase, the endopeptidase presented higher DH than those obtained by Protamex andFlavourzyme. The protein solubility of all hydrolysates significantly increased. In additionto solubility, the bitterness of the hydrolysate is another main factor affecting the practicalapplication of MPC. The solubility of hydrolysates of MPC was strongly correlated with DHand bitterness, especially solubility and DH. Compared with Alcalase and Flavourenzyme,the treatment with Protamex led to the hydrolysates with the lowest levels of bitterness.Considering solubility and bitterness properties, Protamex incubation for 120 min is bestto hydrolyze MPC for use as an ingredient in different products. These results mayhelp to better understand the effect of enzymes on the bitterness and solubility of MPC
Foods 2021, 10, 2462 12 of 13
hydrolysates. This work could provide a new perspective on MPC utilization and thepotential application of MPC hydrolysates as a protein ingredient for food formulations.
Author Contributions: Q.C. and M.G. conceived and designed the experiments and reviewed andedited the manuscript; Q.C., Y.S., J.C. and Z.Z. contributed reagents, materials, and analytical toolsand participated in the experiments; Q.C. analyzed the data; and Q.C. and M.G. wrote the manuscript.All authors have read and agreed to the published version of the manuscript.
Funding: This research received no external funding.
Conflicts of Interest: The authors declare no conflict of interest.
References1. McGregor, R.A.; Poppitt, S.D. Milk protein for improved metabolic health: A review of the evidence. Nutr. Metab. 2013, 10, 46.
[CrossRef]2. Kameswaran, S.; Smith, D.E. Rennet clotting times of skim milk based rennet gels supplemented with an ultrafiltered milk protein
concentrate. Milchwiss. Milk Sci. Int. 1999, 54, 546–549.3. O’Donnell, S.; Butler, F. Viscosity of Reconstituted Milk Protein Concentrate Solutions as a Function of Shear, Temperature and
Concentration. Dev. Chem. Eng. Miner. Process. 2008, 7, 131–139. [CrossRef]4. Banach, J.; Lin, Z.; Lamsal, B. Enzymatic modification of milk protein concentrate and characterization of resulting functional
properties. LWT Food Sci. Technol. 2013, 54, 397–403. [CrossRef]5. Tari, N.R.; Gaygadzhiev, Z.; Guri, A.; Wright, A. Effect of pH and heat treatment conditions on physicochemical and acid gelation
properties of liquid milk protein concentrate. J. Dairy Sci. 2021, 104, 6609–6619. [CrossRef]6. Agarwal, S.; Beausire, R.L.W.; Patel, S.; Patel, H. Innovative Uses of Milk Protein Concentrates in Product Development. J. Food
Sci. 2015, 80, A23–A29. [CrossRef]7. McKenna, A.B. Effect of Processing and Storage on the Reconstitution Properties of Whole Milk and Ultrafiltered Skim Milk Powders;
Massey University: Palmerston North, New Zealand, 2002.8. Havea, P. Protein interactions in milk protein concentrate powders. Int. Dairy J. 2006, 16, 415–422. [CrossRef]9. Anema, S.; Pinder, D.; Hunter, R.; Hemar, Y. Effects of storage temperature on the solubility of milk protein concentrate (MPC85).
Food Hydrocoll. 2006, 20, 386–393. [CrossRef]10. Kelly, P. Milk protein products/milk protein concentrate. In Encyclopedia of Diary Sciences, 2nd ed.; Academic Press: Cambridge,
MA, USA, 2011; pp. 848–854.11. Wouters, A.G.; Rombouts, I.; Fierens, E.; Brijs, K.; Delcour, J. Relevance of the Functional Properties of Enzymatic Plant Protein
Hydrolysates in Food Systems. Compr. Rev. Food Sci. Food Saf. 2016, 15, 786–800. [CrossRef]12. Walstra, P. Physical Chemistry of Foods; Marcel Dekker, Inc.: New York, NY, USA, 2003.13. Le, T.T.; Bhandari, B.; Deeth, H.C. Chemical and Physical Changes in Milk Protein Concentrate (MPC80) Powder during Storage.
J. Agric. Food Chem. 2011, 59, 5465–5473. [CrossRef]14. Ye, A. Functional properties of milk protein concentrates: Emulsifying properties, adsorption and stability of emulsions. Int.
Dairy J. 2011, 21, 14–20. [CrossRef]15. Sun, Y.; Chen, J.; Zhang, S.; Li, H.; Lu, J.; Lu, L.; Lv, J. Effect of power ultrasound pre-treatment on the physical and functional
properties of reconstituted milk protein concentrate. J. Food Eng. 2014, 124, 11–18.16. Guo, M.R.; Fox, P.F.; Flynn, A.; Kindstedt, P.S. Susceptibility of beta-lactoglobulin and sodium caseinate to proteolysis by pepsin
and trypsin. J. Dairy Sci. 1995, 78, 2336–2344. [CrossRef]17. Evangelho, J.A.D.; Vanier, N.; Pinto, V.Z.; De Berrios, J.J.; Dias, A.R.G.; Zavareze, E.D.R. Black bean (Phaseolus vulgaris L.) protein
hydrolysates: Physicochemical and functional properties. Food Chem. 2017, 214, 460–467. [CrossRef]18. Shen, P.; Zhou, F.; Zhang, Y.; Yuan, D.; Zhao, Q.; Zhao, M. Formation and characterization of soy protein nanoparticles by
controlled partial enzymatic hydrolysis. Food Hydrocoll. 2020, 105, 105844. [CrossRef]19. Zheng, Z.; Li, J.; Li, J.; Sun, H.; Liu, Y. Physicochemical and antioxidative characteristics of black bean protein hydrolysates
obtained from different enzymes. Food Hydrocoll. 2019, 97, 105222. [CrossRef]20. Severin, S.; Xia, W. Enzymatic hydrolysis of whey proteins by two different proteases and their effect on the functional properties
of resulting protein hydrolysates. J. Food Biochem. 2006, 30, 77–97. [CrossRef]21. Urista, C.R.M.; Fernández, R.; Rodríguez, F.A.R.; Arana-Cuenca, A.; Tellez-Jurado, A. Review: Production and functionality of
active peptides from milk. Food Sci. Technol. Int. 2011, 17, 293–317. [CrossRef]22. Laemmli, U.K. Cleavage of Structural Proteins during the Assembly of the Head of Bacteriophage T4. Nature 1970, 227, 680–685.
[CrossRef]23. Avramenko, N.A.; Low, N.H.; Nickerson, M.T. The effects of limited enzymatic hydrolysis on the physicochemical and emulsifying
properties of a lentil protein isolate. Food Res. Int. 2013, 51, 162–169. [CrossRef]24. Liu, Y.; Zhao, G.; Zhao, M.; Ren, J.; Yang, B. Improvement of functional properties of peanut protein isolate by conjugation with
dextran through Maillard reaction. Food Chem. 2012, 131, 901–906. [CrossRef]
Foods 2021, 10, 2462 13 of 13
25. Hu, H.; Cheung, I.W.; Pan, S.; Li-Chan, E.C. Effect of high intensity ultrasound on physicochemical and functional properties ofaggregated soybean β-conglycinin and glycinin. Food Hydrocoll. 2014, 45, 102–110. [CrossRef]
26. Silva, M.; Zisu, B.; Chandrapala, J. Influence of low-frequency ultrasound on the physico-chemical and structural characteristicsof milk systems with varying casein to whey protein ratios. Ultrason. Sonochem. 2018, 49, 268–276. [CrossRef] [PubMed]
27. Mazloomi, S.N.; Mahoonak, A.S.; Ghorbani, M.; Houshmand, G. Physicochemical properties of chitosan-coated nanoliposomeloaded with orange seed protein hydrolysate. J. Food Eng. 2020, 280, 109976. [CrossRef]
28. Liu, B.-Y.; Zhu, K.-X.; Peng, W.; Guo, X.-N.; Zhou, H.-M. Effect of sequential hydrolysis with endo- and exo-peptidase onbitterness properties of wheat gluten hydrolysates. RSC Adv. 2016, 6, 27659–27668. [CrossRef]
29. Liang, G.; Chen, W.; Qie, X.; Zeng, M.; Qin, F.; He, Z.; Chen, J. Modification of soy protein isolates using combined pre-heattreatment and controlled enzymatic hydrolysis for improving foaming properties. Food Hydrocoll. 2020, 105, 105764. [CrossRef]
30. Al-Ruwaih, N.; Ahmed, J.; Mulla, M.F.; Arfat, Y.A. High-Pressure assisted enzymatic proteolysis of kidney beans protein isolatesand characterization of hydrolysates by functional, structural, rheological and antioxidant properties. LWT Food Sci. Technol. 2018,100, 231–236. [CrossRef]
31. Ai, M.; Tang, T.; Zhou, L.; Ling, Z.; Guo, S.; Jiang, A. Effects of different proteases on the emulsifying capacity, rheological andstructure characteristics of preserved egg white hydrolysates. Food Hydrocoll. 2018, 87, 933–942. [CrossRef]
32. Klompong, V.; Benjakul, S.; Kantachote, D.; Shahidi, F. Antioxidative activity and functional properties of protein hydrolysateof yellow stripe trevally (Selaroides leptolepis) as influenced by the degree of hydrolysis and enzyme type. Food Chem. 2007, 102,1317–1327. [CrossRef]
33. Tan, Y.; Chang, S.K.; Meng, S. Comparing the kinetics of the hydrolysis of by-product from channel catfish (Ictalurus punctatus)fillet processing by eight proteases. LWT Food Sci. Technol. 2019, 111, 809–820. [CrossRef]
34. Haque, E.; Bhandari, B.R.; Gidley, M.J.; Deeth, H.C.; Møller, S.M.; Whittaker, A.K. Protein Conformational Modifications andKinetics of Water−Protein Interactions in Milk Protein Concentrate Powder upon Aging: Effect on Solubility. J. Agric. Food Chem.2010, 58, 7748–7755. [CrossRef]
35. Doucet, D.; Otter, D.E.; Gauthier, S.F.; Foegeding, E.A. Enzyme-Induced Gelation of Extensively Hydrolyzed Whey Proteins byAlcalase: Peptide Identification and Determination of Enzyme Specificity. J. Agric. Food Chem. 2003, 51, 6300–6308. [CrossRef][PubMed]
36. Tavano, L.O. Protein hydrolysis using proteases: An important tool for food biotechnology. J. Mol. Cayal B Enzym. 2013, 90, 1–11.[CrossRef]
37. Zang, X.; Yue, C.; Wang, Y.; Shao, M.; Yu, G. Effect of limited enzymatic hydrolysis on the structure and emulsifying properties ofrice bran protein. J. Cereal Sci. 2018, 85, 168–174. [CrossRef]
38. Jung, S.; Murphy, P.A.; Johnson, L.A. Physicochemical and Functional Properties of Soy Protein Substrates Modified by LowLevels of Protease Hydrolysis. J. Food Sci. 2005, 70, C180–C187. [CrossRef]
39. Cui, Q.; Zhang, A.; Li, R.; Wang, X.; Sun, L.; Jiang, L. Ultrasonic treatment affects emulsifying properties and molecular flexibilityof soybean protein isolate-glucose conjugates. Food Biosci. 2020, 38, 100747. [CrossRef]
40. Barth, A. Infrared spectroscopy of proteins. Biochim. Biophys. Acta (BBA) Bioenerg. 2007, 1767, 1073–1101. [CrossRef] [PubMed]41. Qi, P.X.; Ren, D.; Xiao, Y.; Tomasula, P.M. Effect of homogenization and pasteurization on the structure and stability of whey
protein in milk. J. Dairy Sci. 2015, 98, 2884–2897. [CrossRef]42. Podrazka, M.; Baczynska, E.; Kundys, M.; Jelen, P.; Witkowska, N.E. Electronic Tongue—A tool for all tastes? Biosensors 2017, 8, 3.
[CrossRef]43. Humiski, L.; Aluko, R. Physicochemical and Bitterness Properties of Enzymatic Pea Protein Hydrolysates. J. Food Sci. 2007, 72,
S605–S611. [CrossRef]44. Tong, X.; Lian, Z.; Miao, L.; Qi, B.; Zhang, S.; Li, Y.; Wang, H.; Jiang, L. An innovative two-step enzyme-assisted aqueous
extraction for the production of reduced bitterness soybean protein hydrolysates with high nutritional value. LWT Food Sci.Technol. 2020, 134, 110151. [CrossRef]


