Embed Size (px)
Citation preview
Effectiveness and Best Practices of Lean and Six Sigma Methodologies in Hospitals
The Honors Program Senior Capstone Project
Student’s Name: Daniel Branco Faculty Sponsor: Professor Wicks
April 2012
Table of Contents Introduction ............................................................................................................................... 1 Literature review ....................................................................................................................... 2
Health Care Industry ............................................................................................................. 2 Government’s Impact on Health Care Industry .................................................................... 2 Medicaid ................................................................................................................................ 3 Baldrige Program and the Health Care Industry ................................................................... 4 100 Top Hospitals ................................................................................................................. 4 Magnet Nursing Hospitals .................................................................................................... 5 Lean Methodologies .............................................................................................................. 5 A3 Reports ............................................................................................................................ 7 Six Sigma .............................................................................................................................. 8
Research Methodology ............................................................................................................. 9 Data Analysis .......................................................................................................................... 11
Summary of Data and Hospital Characteristics .................................................................. 11 Six Sigma and Lean Methodology Usage ........................................................................... 12 Lean and Kaizen Tool Usage .............................................................................................. 13 Problem Identification Tool Usage ..................................................................................... 14 Significance Tests ............................................................................................................... 15
Recommendations ................................................................................................................... 19 Limitations of Research ...................................................................................................... 20 Further Research ................................................................................................................. 21
References ............................................................................................................................... 22 Appendecies ............................................................................................................................ 25
Appendix I: Survey ............................................................................................................. 25 Appendix II: Six Sigma and Lean Methodologies Definitions ........................................... 27 Appendix III: Kaizen and Lean Tools Definitions .............................................................. 28 Appendix IV: Problem Identification Tools Definitions .................................................... 28
Effectiveness and Best Practices of Lean and Six Sigma Methodologies in Health Care Senior Capstone Project for Daniel Branco
INTRODUCTION
Healthcare quality and costs are a growing problem in the United States. Healthcare
organizations are facing increasing costs combined with declining quality (Schoenbaum). This
unsustainable trend is putting a great burden on the health care system as a whole. The
improvement of quality within the healthcare system would increase the value of the care
(Schoenbaum).Improving healthcare quality, and thereby lowering the costs, is critical for the
sustainability of healthcare organizations.
There are many different ways that organizations can use quality to reduce costs and increase
the quality of service to their patients. There are also various ways an organization can
implement quality. The processes can lead to different results and focuses. The potential
processes include lean based A3 Report, Kaizen events, and Six Sigma. These processes focus
on continuous improvement of quality within a process. The ideal situation would utilize
these processes to create a high quality environment while lowering costs.
This report will investigate the impact of projects utilizing the A3, Kaizen, and Six
Sigmamethodologies in order to improve processes efficiency,increase quality, and reduce
costs of care.These methods can be applied in many different organizations, including the
health care industry. The impact of these process improvement projects should be substantial
and essential to the health care industry. The impact of the methodologies will be analyzed to
see if they substantially reduce the costs and increase the quality. The focus of this research is
on hospitals and will compare hospitals in a quality position, as defined by the 100 Top
hospitals list and the MalcolmBaldrigeQuality Award recipients nationwide, and other
regional hospitals in the Northeast not currently on the 100 Top lists or a Baldrige award
winner. The goal of any organization should be to increase the quality of their service.
An ACPE Quality of Care Surveyfound that 18.5% of respondents utilized Six Sigma to
improve quality, 13.3% utilized Lean processes, 12.2% used vendor-provided systems, 26.7%
used other methods including homegrown, and 29.2% did not utilize any programs (Martin).
This project looks to identify if there are trends between those that utilize the programs and
positioning as a top quality performance hospital and if so what quality management
programs had the biggest impact at the different types of hospitals. While this project focused
- 1 -
Effectiveness and Best Practices of Lean and Six Sigma Methodologies in Health Care Senior Capstone Project for Daniel Branco
on hospitals as the health care organization to be surveyed and examined, similar principals
would be expected to hold true for any patient facing organization.
LITERATURE REVIEW
This literature review will cover background information on the health care industry,
Medicaid, the Baldrige program’s health care award, 100 Tophospitals, Magnet Nursing
Hospitals, lean, Six Sigma, and A3. Following this will the research methodology outlining
the steps my research will follow.
Health Care Industry
Average household expenditure on services in the health care industry was $2,976 in 2008.
American households spent 5.9% of their budgets on health care services (Increasing Cost of
Health Care). According to the Bureau of Labor and Statistics the industry provided 14.3
million jobs in 2008. The industry is also one of the fastest growing, expected to increase by
3.2 million jobs from 2008 to 2018 (Healthcare). The industry has been the focus of much
government attention and regulation in recent years and is a huge component of the United
States economy. The health care sector comprised of nearly 8% of US GDP in 2010 (2012
Statistical Abstract).
Government’s Impact on Health Care Industry
The Federal Government spends billions of dollars a year on Medicare and Medicaid
programs. However, these programs do not look at the quality of care. With the exception of
the Baldrige program’s heath care award, the Federal Government has not focused on
improving the quality of health care as a solution to the growing costs of care. The focus has
been on cutting or minimizing the costs of health care. A stronger government influence to
push for quality as a solution to increasing costs could be needed in the future (Schoenbaum).
The Patient Protection and Affordable Care Act of 2010 and Health Care and Education
Reconciliation Act of 2010 were the most significant and sweeping law changes ever in the
health care industry. The two bills overhauled many health care regulations. The goals of the
bills were to reduce the number of uninsured and to reduce the cost of health care not only for
- 2 -
Effectiveness and Best Practices of Lean and Six Sigma Methodologies in Health Care Senior Capstone Project for Daniel Branco
individuals but also for the federal government (Jackson). The focus of the bills were very
heavy on reducing the costs, but not on the improvement of the quality of health care.
The Federal Government could take a more active role in the improvement of health care.
Many of the potential suggested solutions consist of improving or investing in research,
infrastructure, or public reporting (Schoenbaum). None of these solutions involve improving
the processes that can sometimes lead to redundancies, mistakes, or lost information.
However, these processes can be improved through quality improvement processes such as
Kaizen or A3.
Medicaid
Medicaid has its roots from during the great depression in the 1930’s. During that time period
federal and state governments began to take on the medical expenses of children, the elderly,
and the poor. In 1965, the Nineteenth Amendment of the Social Security Act created the
Medicaid program to extend health care to the poor. The program has quickly grown and in
2005 covered approximately 50 million people for a total cost of $300 billion (Quinlan-
Colwell). Through other laws the scope of the program has been expanded to include drug
rebates and complete coverage for certain cancers (Quinlan-Colwell).
Over the past 40 years there have been several attempts to lower the cost of Medicaid. In
1977, the Department of Health, Education, and Welfare attempted to merge Medicaid and
Medicare in order to control health care costs (Quinlan-Colwell). The merge was ultimately
unsuccessful but certain administrative areas were combined. The Deficit Reduction Act of
2005 attempted to reduce the federal costs of Medicaid by increasing co-pays and reducing
certain services (Quinlan-Colwell). This attempt was supposed to reduce spending on
Medicaid by approximately $1 billion per year over ten years (Quinlan-Colwell).
Errors in the implementation of the program are a significant issue that is leading to
increasing costs. As more private sector approaches are being implemented in Medicaid,
efficiency is improving. When Medicaid in Pennsylvania worked with Health Risk
Management the result was an improved, more efficient billing system. Fraudulent claims and
improper payments add on to the errors in the system. While fraudulent claims are being
- 3 -
Effectiveness and Best Practices of Lean and Six Sigma Methodologies in Health Care Senior Capstone Project for Daniel Branco
countered by technology that identifies trends in the fraud and abuse to identify those claims,
nothing is being done to analyze improper payments (Quinlan-Colwell).
Adding to cost problems is a lack of primary care providers. When a person with Medicaid
does not have a primary care provider,he or she can find it nearly impossible to schedule an
appointment with other physicians leading to nonemergency visits to the emergency
department. This brings with it higher cost of care and can overload emergency departments
with nonemergency patients (Quinlan-Colwell).
Baldrige Program and the Health Care Industry
The Malcolm Baldrige National Quality Award program was created by the Public Law 100-
107. The law was signed in 1987 with the goal of recognizing the achievements of
organizations that have high standards of quality and providing guidance and guidelines for
other organizations (Malcolm). The award focuses on a number of different sectors including
health care. The health care sector has a set of criteria for organizations to understand their
performance processes. The criteria includes leadership, strategic planning, customer focus,
measurement, analysis, performance management, workforce focus, operations focus, and
results. These criteria form the model for how organizations should look at their processes and
take steps to improve their quality (Health Care Criteria).
Studying the characteristics of Baldrige winners provides valuable information about the
success of their quality improvement programs. These organizations saw great improvements
in areas such as patient satisfaction, employee turnover, employee satisfaction, and an
increase in diversity among management. At Baptist Hospital, Inc. in Pensacola, Florida,
inpatient and outpatient satisfaction has improved up to the 99th percentile. In addition
ambulatory surgery satisfaction has also been in the 99th percentile (Institute). SSM Health
Care in St. Louis, Missouri experienced lower turnover rates. These cases showed that
improvement processes at these organizations culminated with the winning of the Baldrige
award.
100 Top Hospitals
Being listed as a “100 Top Hospital” is one of the key criteria that will be used to identify if a
hospital is in a quality position or not. 100 TopHospitals is a list of hospitals that Thompson
- 4 -
Effectiveness and Best Practices of Lean and Six Sigma Methodologies in Health Care Senior Capstone Project for Daniel Branco
Reuters has put together in order to identify the top performing hospitals in patient care
quality and as a business. The prestigious annual award evaluates hospitals on patient care,
operational efficiency, and financial stability. The hospitals are compared only to others of the
same size and teaching status. According to the 100 Top Hospitals website, “If all
Hospitalsperformed at the same level as the 100 Top Hospitals award winners: Nearly
116,000 additional patients would survive each year” (100 Top Hospitals). This highlights the
importance of increasing the quality of care for patients and this report will look to identify if
Lean and Six Sigma methodologies are a potential solution to increasing the quality of care.
The 100 Top Hospitals list, however, does not look into the underlying reasons for why these
hospitals perform in this way. The list simply analyzes the quality of the hospitals and ranks
them. This project will look to identify some of the underlying reasons for the high
performing hospitals, namely the impact of Lean and Six Sigma methodologies on their
performance. 100 Top Hospitals forms the comparison point for this research.These hospitals
are high quality performers and this report compares them to other hospitals to identify any
methodologies that are used significantly more by the high quality performers.
Magnet Nursing Hospitals
The Magnet Nursing Recognition program looks to bring recognition to hospitals who have
achieved quality patient care, excellent nursing, and innovations in nursing. The credential is
a symbol of high quality levels of care. Less than 7% of hospitals nationwide have achieved
this level of quality (ANCC). In this researchMagnet Nursing Hospitals are considered to
have superior levels of quality.Along with 100 Top Hospitals and Baldrige winners, they
comprise the quality group for the survey.
Lean Methodologies
A well-known quality improvement tool is the Kaizen process. Kaizen is a Japanese word that
translates to “continuous improvement”. The focus is on constantly evolving and improving to
ideally reach a state of zero defects. The system was pioneered by Toyota as a constant focus
on improving efficiency and innovation. This method was one of the reasons that Toyota
achieved such a high standard of quality with their products (Kissoon).
- 5 -
Effectiveness and Best Practices of Lean and Six Sigma Methodologies in Health Care Senior Capstone Project for Daniel Branco
However, recently Toyota has suffered a slew of recalls that have compromised the success of
Toyota’s Kaizen process. NiranjanKissoon attributes Toyota’s failures to their inability to
accept their mistakes, address the complaints of their customers, and the effects of Toyota’s
rapid growth on their Kaizen process. Toyota neglected to do these things as they rapidly
grew leading to their breakdown (Kissoon).
Toyota’s constant improvement processes have been put into practice in a variety of health
care organizations with proven success. Allegheny General Hospital has worked to implement
Toyota’s production techniques to improve the care of patients. Within three months of the
new procedures infections dropped 90%. The hospital also estimates the new procedures have
saved $500,000 per year. These processes are beginning to show their incredible value to
hospitals as a push comes from manufacturing and service businesses to reduce employee
health care costs (Bernard).
Lean methodologies work to redefine workflow processes. Health care facilities have utilized
lean to empower front line workers to improve quality and workflow. The results of the
process have helped to significantly reduce times for monitoring patients or
deliveringmedications. Different organizations have sought to target idle time, inventories,
confusion, and processing through different lean tools. These can be improved through the
empowering of workers and improvement of their processes (Cases).
Lean methodology seeks to remove non-value-added activities from the processes. These non-
value-added activities are considered to be waste. The seven types of waste are:
overproduction/underproduction, wasted inventory, rework, wasted motion, waste from
transport, and waste from processing. These wastes can be identified during the value stream
mapping of the processes and highlighted for improvement (Varkey).
Intermountain Health Care (IHC) in Salt Lake City, Utah underwent a project to apply lean
techniques to their processes. The project addressed a variety of issues and made a wide range
of improvements. The processes that were improved significantly reduced amounts of wasted
time by the workers. The reduction of hours required by employees can be translated into real
savings almost immediately. Other savings could include reduced numbers of errors or
increased patient satisfaction. Some examples of savings or benefits from the project included
- 6 -
Effectiveness and Best Practices of Lean and Six Sigma Methodologies in Health Care Senior Capstone Project for Daniel Branco
decreases in treatment delays and an immediate savings of nearly $1 million through the
implementation of an electronic payment system (Jimmerson et al, 2005).
There were three key factors in the success of the projects at IHC. The first key factor was
that the participants in the project were able to identify the waste in their daily activities and
the significance of the waste on the bottom line. The second key factor was the participant’s
and other staff’s willingness to change. There was not a lot of resistance to change within the
organization for the project. Finally, the third factor identified at IHC was the use of A3 as a
tool to clearly identify problems in a process and communicate those problems to those who
can make the change happen (Jimmerson et al, 2005).
Park Nicollet Medical Center in Minneapolis, MN utilized the Toyota Production System and
lean methodology to attempt to decrease wait times. They used a continuous flow system to
check in patientswithin 10 minute intervals. They scheduled appointments for the various staff
in sequence in order to achieve a continuous flow with minimal wait times. The medical
center also standardized instruments for surgical procedures allowing them to reduce
instrument inventory by 60%. The report estimates the Medical Center saved $7.5 million in
2004 (Varkey).
A3 Reports
One of the many different quality tools that can be used to increase quality and lower costs are
A3 reports. A3 reports were created by Toyota Motor Corporation through an evolution of
continuous improvement activity. The A3 Reports look at the current condition of processes.
The process is examined by direct observation and how exactly it is performed, instead ofhow
it should be or how someone else explains it. Through the diagramming of the current
condition problems with the processes can be identified easily and more objectively. The A3
report then looks at how the process could be improved. The improvements counter any
problems within the system and create a target condition for the process. Implementation and
follow up plans are then created in order to put into practice the target condition and monitor
the results of the new process (Sobek, Jimmerson, 2004).
The A3 report is useful because it looks at one process at a time. Through the breakdown of
the problems into smaller, more manageable pieces workers can make improvements more
- 7 -
Effectiveness and Best Practices of Lean and Six Sigma Methodologies in Health Care Senior Capstone Project for Daniel Branco
rapidly. An effective coach is also critical to the success of an A3 project. An effective coach
can help make sure the root of the problem is found and guide the problem solving to help
create the target condition. Many of the problems encountered can be addressed by the A3
report, especially since many have roots in, “poorlyspecified activity, a vague unreliable
connection, or a complex pathway” (Jimmerson et al, 2005).
The A3 report is set up into two halves of an 11” x 17” piece of paper. Drawn on the left side
is a diagram of the current process and on the right side a diagram of the target condition or
ideal process. The diagrams need to be very detailed and are visually oriented including the
use of storm clouds to show problems in the current process. The current process on the left
side is analyzed and asked Why?for every problem in order to identify the core cause of the
problems (Jimmerson, 2007) (Visich, et al, 2010).
The right side of the A3 report had the target condition drawn with improvements highlighted
by fluffy clouds. The necessary changes that must be made to reach the target condition are
identified as the countermeasures in the process. The next step in the process is to create an
implementation plan of the countermeasures in order to change the process to the ideal
condition and a cost/benefit analysis of the implementation plan in order to determine if the
changes are financially beneficial. Finally, a sample of how to test the implementation plan is
listed, and how and when a follow-up should be conducted on the process (Jimmerson, 2007).
Value Stream Mapping is another important piece of the A3 Method and it is used to help
identify where value is added or not added throughout a process. Through the minimization of
pieces of the process where value is not added the processis improved. In health care these
improved processes can help improve patient outcomes and satisfaction (Visich, et al, 2010).
Six Sigma
Six Sigma is quality philosophy pioneered by Motorola in order to greatly reduce the number
of defects in processes. Six Sigma looks to minimize the defects that occur in a process,by
using a Define, Measure, Analyze, Improve, and Control cycle (DMAIC), to improve quality
of the processes (Jacobs).Six Sigma can be utilized in a number of health care industry
applications. Looking at measurable processes the number of defects could be compared to
the Six Sigma standard of 3.4 defects per million opportunities. The defects could then be
- 8 -
Effectiveness and Best Practices of Lean and Six Sigma Methodologies in Health Care Senior Capstone Project for Daniel Branco
analyzed to see how to improve the process and minimize the number of defects ideally to
below 3.4 defects per million opportunities. One defect area that has been improved close to
the 3.4 defect per million opportunities rate was surgical anesthesia deaths. Once numbering
around 20 to 50 per million opportunities is estimated to be around 5 per million opportunities
nationwide (Chassin).
Applications of Six Sigma include combining innovation with Six Sigma to create a better,
higher quality, lean process that can also lower costs. This could be achieved by streamlining
the processes to reduce waste and mistakes. Combining the new innovations with the lean
processes would allow health care organizations to continue to bring together innovative new
technologies with lower process defect levels (Polk).
Using the measurement of defects within Six Sigma is a critical step to understanding the
current defect rates and the ideal goal defect rates within a given process. The number of
defects within a given observed process divided by the number of potential opportunities (the
number of potential failures within a single process times the total number of observations)
gives the rate of defect. Finding the total number of defects within a million potential
opportunities allows the observer to calculate how often the process will succeed. These
observations can be plotted on a chart to determine if the process is within a set criteria range
for the failure rates (Varkey).
One example of Six Sigma being applied to a health care process can be seen in the
Charleston Area Medical Center. Six Sigma was used to evaluate the rate of infections in
colon and vascular surgical sites. They followed the DMAIC method to develop a case study,
measure the results, analyze the results to create a new pre-operation checklist, usedreport
cards, and promptedsurgeons to identify potential improvements. The result of the process
was an infection reduction to a sigma of 2.86. The report promoted a potential annual savings
in excess of $1 million (Varkey).
RESEARCH METHODOLOGY
This research will examine the effectiveness of quality initiatives in improving cost and/or the
quality of care, and how institutions can be effective in improving the quality of care. This
- 9 -
Effectiveness and Best Practices of Lean and Six Sigma Methodologies in Health Care Senior Capstone Project for Daniel Branco
will be achieved by looking at the different methodologies used by healthcare institutions and
determining if there are statistically significant differences in methodologies. Improving the
quality of care will be judged as lowering wait times, lowering the number of hospital errors
(misdiagnoses, wrong medicines, infections, etc.), and improving patient satisfaction.
Lowering cost will be elvaluated as lowering cost of care to the hospital, lowering the cost of
care to the patient, or requiring fewer inventories for the hospital. These will be identified
through the subject’s beliefs of the initiative’s impact on these metrics.
After the initial research and literature review were completed, a hypothesis was developed
that was used to test the results of the survey data.The hypothesis developed was that the
hospitals in the quality group would utilize the methodologies more than those in the non-
quality group.Those organizations were then contacted to gather the necessary data. This data
was obtained from the surveys of Baldrige winners,100 Top hospitals, and Magnet Nursing
hospitals as hospitals in a quality position and other hospitals in the Northeast that will be
defined as the non-quality group.The survey was administered online using Google Docs and
analyzed with Microsoft Excel and statistical tests from MiniTab.
The survey that was administered began with a question regarding informed consent. If the
subject gave their consent the survey continued, if they did not give their consent the survey
ended. After the subject gave their consent the survey began by asking the subject about the
categorization of their hospital, the candidate’s position at the hospital, the size of the
hospital, and the performance status of the hospitals. These questions helped define the
different variables for comparing the responses. See Appendix I for the survey instrument and
appendices II-IV for definitions of the survey item.
Following these questions the survey asked, “What Lean or Six Sigma Methodologies have
you utilized at your hospital? What Kaizen or Lean Tools have you utilized? What problem
ID tools have you utilized?” Following these questions the respondentwas asked what kind of
an impact they believed quality improvement initiatives have had on patient satisfaction,
patient outcomes, and financial measures. These questions were measured on a Likert Scale
with a 1 being a great negative impact, a 7 being a great positive impact, and a 4 being no
impact. Finally, there was an open-ended question asking the subjects to provide any
- 10 -
Effectiveness and Best Practices of Lean and Six Sigma Methodologies in Health Care Senior Capstone Project for Daniel Branco
additional information that they would like to disclose relating to quality improvement
initiatives at their hospitals.
The data was then analyzed to determine if there was difference between the usage and beliefs
of the impact of quality process improvement projects between those hospitals in quality
positions and those that are not.2-sample t-tests were conducted to determine the level of
statistical significance of the findings. These 2-sample t-tests utilized pooled variances if the
variances were found to not be statistically significant based upon the values of Levene’s test
and the F-Test. The statistically significant methodologies or tools will be identified and form
the foundation for the identification of the best practices. Then a framework will be developed
for future applications of these methodologies to raise the quality of hospitals.
DATA ANALYSIS The following section will stratify and analyze the data compiled from the surveys. It will
look at the summary of the data, the usage of methodologies and tools in the quality group
and non-quality group. It will then look at the significance tests conducted on the data in order
to determine which methodologies and tools were used statistically more frequently by the
quality group.
Summary of Data and Hospital Characteristics
A total of 280 hospitals were surveyed including 88 that were identified as 100 Top Hospitals,
Baldrige winners, and Magnet Nursing Hospitals located nationwide. The remaining 192 were
hospitals that were located in the northeast of the United States (NY, CT, MA, RI, VT, NH,
and ME). Out of these 280 hospitals, 32 responses were received through the GoogleDocs
survey giving a good response rate of 11.4%. The data set was then analyzed and separated
into 16 “Quality” hospitals (those that were identified as being a 100 Top Hospital, Baldrige
winner, or Magnet Nursing hospital) and 16 “Non-Quality” hospitals (all others). Of the 16
quality hospitals, 37.5% were Baldrige winners, 62.5% 100 Top Hospital winners, and
56.25% Magnet Nursing Hospitals. Seven of the quality hospitals won two awards while one
had won all three. From these two groups I looked at what quality methodologies and
processes were the most commonly used, identified the statistical significance of their usages.
- 11 -
Effectiveness and Best Practices of Lean and Six Sigma Methodologies in Health Care Senior Capstone Project for Daniel Branco
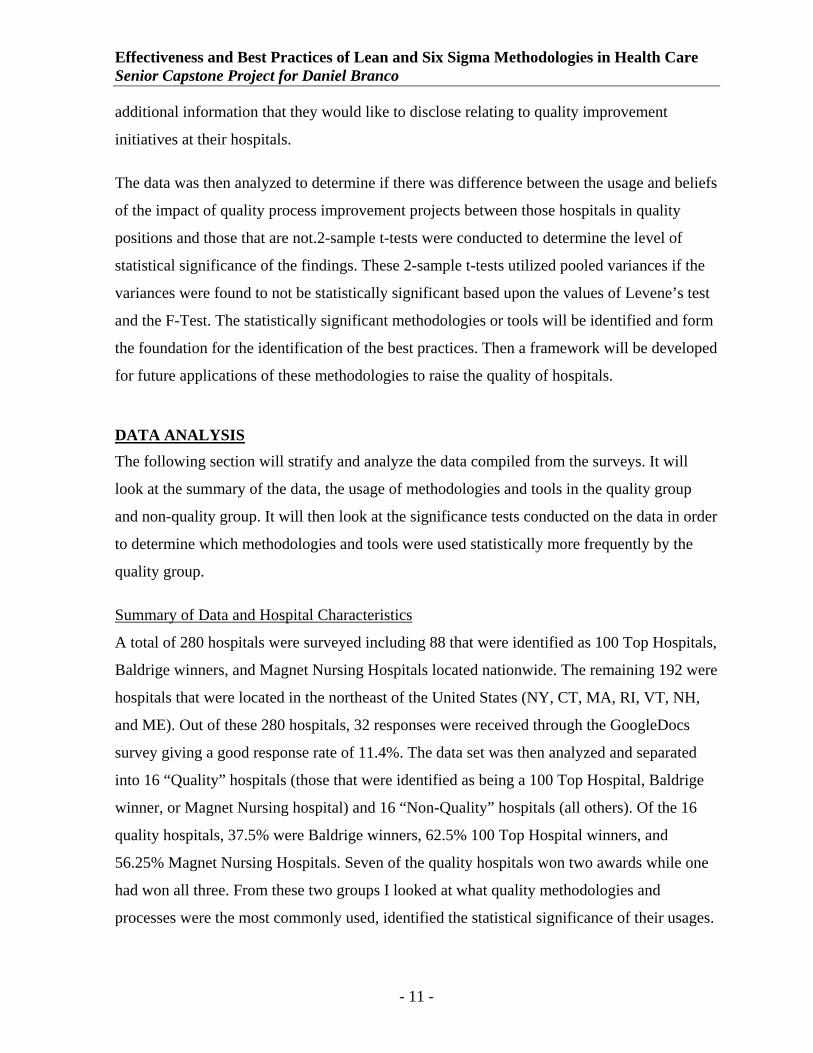
The hospital type and hospital size varied greatly in both the quality and non-quality groups.
Fifty percent of the quality group identified themselves as being urban hospitals and 62.5%
identified themselves as being a large hospital (>250 beds). In the non-quality group, 50%
identified themselves as rural hospitals and 43.75% identified themselves as small hospitals
(<100 beds). In addition,37.5% of the quality hospitals identified themselves as non-teaching
hospitals.See Table 1below for a more detailed look at the hospital characteristics.
Table 1 - Hospital Characteristics
Urban Rural TeachingNon‐
TeachingSmall Medium Large
Non-Quality 18.75% 50.00% 18.75% 6.25% 43.75% 25.00% 31.25%Quality 50.00% 12.50% 18.75% 37.50% 6.25% 31.25% 62.50%
Hospital Type Hospital Size
Six Sigma and Lean Methodology Usage
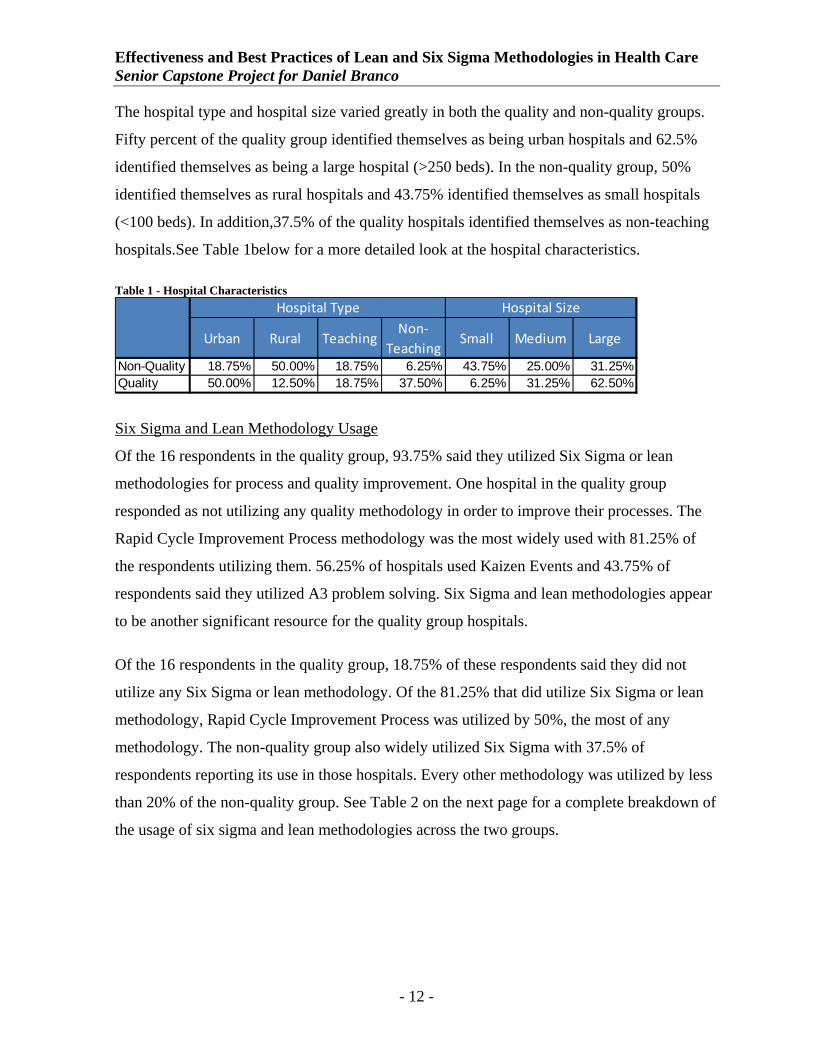
Of the 16 respondents in the quality group, 93.75% said they utilized Six Sigma or lean
methodologies for process and quality improvement. One hospital in the quality group
responded as not utilizing any quality methodology in order to improve their processes. The
Rapid Cycle Improvement Process methodology was the most widely used with 81.25% of
the respondents utilizing them. 56.25% of hospitals used Kaizen Events and 43.75% of
respondents said they utilized A3 problem solving. Six Sigma and lean methodologies appear
to be another significant resource for the quality group hospitals.
Of the 16 respondents in the quality group, 18.75% of these respondents said they did not
utilize any Six Sigma or lean methodology. Of the 81.25% that did utilize Six Sigma or lean
methodology, Rapid Cycle Improvement Process was utilized by 50%, the most of any
methodology. The non-quality group also widely utilized Six Sigma with 37.5% of
respondents reporting its use in those hospitals. Every other methodology was utilized by less
than 20% of the non-quality group. See Table 2 on the next page for a complete breakdown of
the usage of six sigma and lean methodologies across the two groups.
- 12 -
Effectiveness and Best Practices of Lean and Six Sigma Methodologies in Health Care Senior Capstone Project for Daniel Branco
Table 2 – Six Sigma and Lean Methodology Usage
Quality Mean
Non‐Quality Mean
A3 43.75% 12.50%
Kaizen Event 56.25% 18.75%
Kaizen Blitz 12.50% 12.50%
Kaizen Burst 6.25% 12.50%
Rapid Cycle Improvement 81.25% 50.00%
Six Sigma 37.50% 37.50%
None 6.25% 18.75%
CQI 0.00% 6.25%
DMAIC 6.25% 0.00%
Workout 0.00% 12.50%
TPS 6.25% 0.00%
Lean 6.25% 6.25%
Six Sigma and Lean Methodologies
Lean and Kaizen Tool Usage
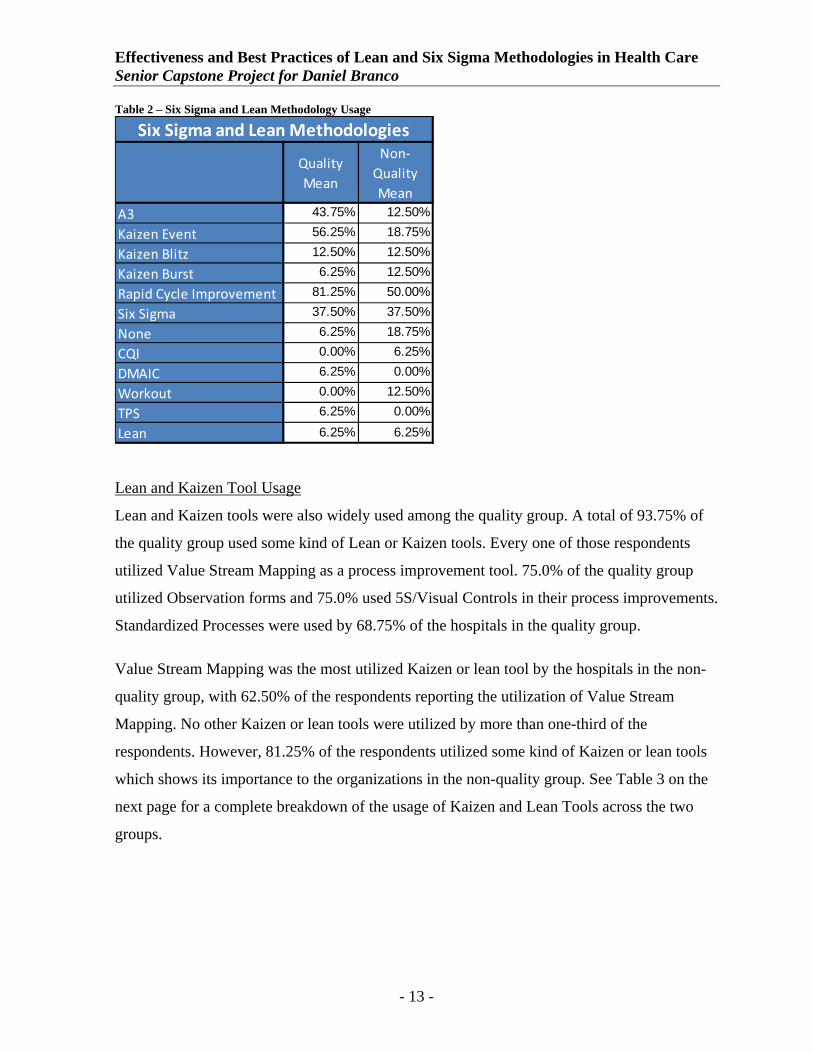
Lean and Kaizen tools were also widely used among the quality group. A total of 93.75% of
the quality group used some kind of Lean or Kaizen tools. Every one of those respondents
utilized Value Stream Mapping as a process improvement tool. 75.0% of the quality group
utilized Observation forms and 75.0% used 5S/Visual Controls in their process improvements.
Standardized Processes were used by 68.75% of the hospitals in the quality group.
Value Stream Mapping was the most utilized Kaizen or lean tool by the hospitals in the non-
quality group, with 62.50% of the respondents reporting the utilization of Value Stream
Mapping. No other Kaizen or lean tools were utilized by more than one-third of the
respondents. However, 81.25% of the respondents utilized some kind of Kaizen or lean tools
which shows its importance to the organizations in the non-quality group. See Table 3 on the
next page for a complete breakdown of the usage of Kaizen and Lean Tools across the two
groups.
- 13 -
Effectiveness and Best Practices of Lean and Six Sigma Methodologies in Health Care Senior Capstone Project for Daniel Branco
Table 3 – Kaizen and Lean Tool Usage
Quality Mean
Non‐Quality Mean
Observation Forms 75.00% 25.00%
Value Stream Mapping 93.75% 62.50%
5S 75.00% 31.25%
Standardized Processes 68.75% 31.25%
Poke‐Yoke 31.25% 12.50%
Pull Systems 37.50% 12.50%
Cause & Effects Matrix 0.00% 6.25%
Waste/ Gemba Walks 0.00% 12.50%
Just‐In‐Time 0.00% 6.25%
None 6.25% 18.75%
Kaizen and Lean Tools
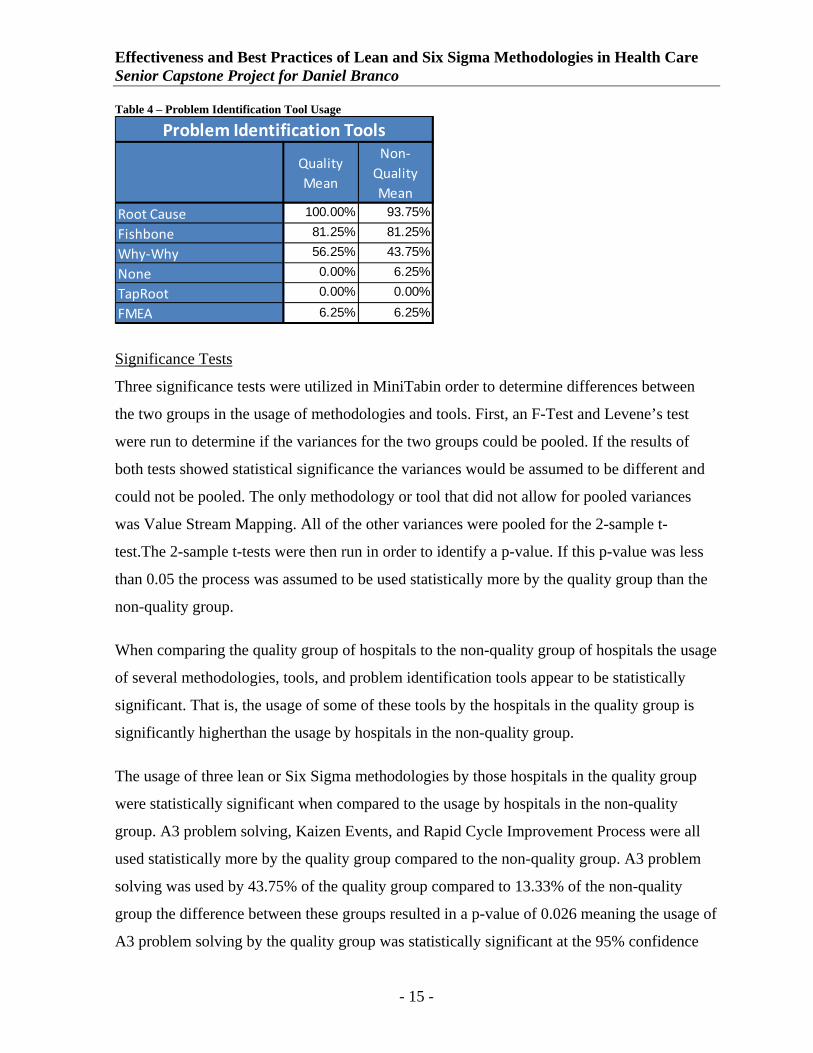
Problem Identification Tool Usage
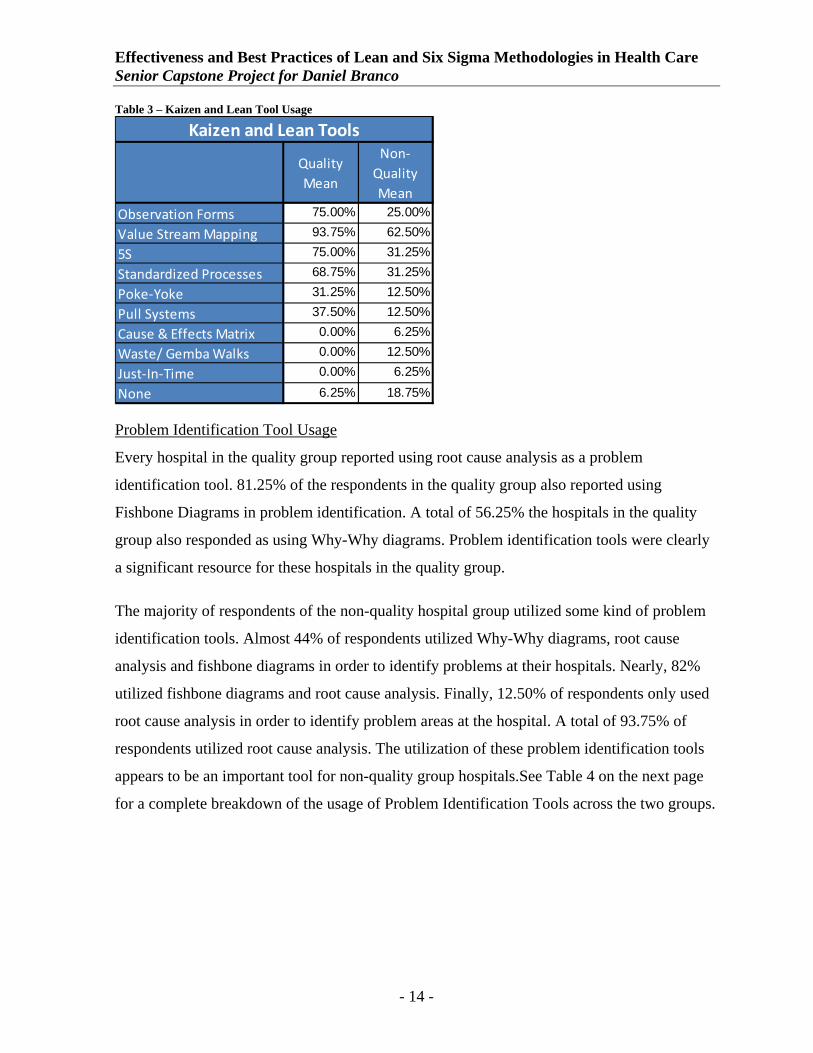
Every hospital in the quality group reported using root cause analysis as a problem
identification tool. 81.25% of the respondents in the quality group also reported using
Fishbone Diagrams in problem identification. A total of 56.25% the hospitals in the quality
group also responded as using Why-Why diagrams. Problem identification tools were clearly
a significant resource for these hospitals in the quality group.
The majority of respondents of the non-quality hospital group utilized some kind of problem
identification tools. Almost 44% of respondents utilized Why-Why diagrams, root cause
analysis and fishbone diagrams in order to identify problems at their hospitals. Nearly, 82%
utilized fishbone diagrams and root cause analysis. Finally, 12.50% of respondents only used
root cause analysis in order to identify problem areas at the hospital. A total of 93.75% of
respondents utilized root cause analysis. The utilization of these problem identification tools
appears to be an important tool for non-quality group hospitals.See Table 4 on the next page
for a complete breakdown of the usage of Problem Identification Tools across the two groups.
- 14 -
Effectiveness and Best Practices of Lean and Six Sigma Methodologies in Health Care Senior Capstone Project for Daniel Branco
Table 4 – Problem Identification Tool Usage
Quality Mean
Non‐Quality Mean
Root Cause 100.00% 93.75%
Fishbone 81.25% 81.25%
Why‐Why 56.25% 43.75%
None 0.00% 6.25%
TapRoot 0.00% 0.00%
FMEA 6.25% 6.25%
Problem Identification Tools
Significance Tests
Three significance tests were utilized in MiniTabin order to determine differences between
the two groups in the usage of methodologies and tools. First, an F-Test and Levene’s test
were run to determine if the variances for the two groups could be pooled. If the results of
both tests showed statistical significance the variances would be assumed to be different and
could not be pooled. The only methodology or tool that did not allow for pooled variances
was Value Stream Mapping. All of the other variances were pooled for the 2-sample t-
test.The 2-sample t-tests were then run in order to identify a p-value. If this p-value was less
than 0.05 the process was assumed to be used statistically more by the quality group than the
non-quality group.
When comparing the quality group of hospitals to the non-quality group of hospitals the usage
of several methodologies, tools, and problem identification tools appear to be statistically
significant. That is, the usage of some of these tools by the hospitals in the quality group is
significantly higherthan the usage by hospitals in the non-quality group.
The usage of three lean or Six Sigma methodologies by those hospitals in the quality group
were statistically significant when compared to the usage by hospitals in the non-quality
group. A3 problem solving, Kaizen Events, and Rapid Cycle Improvement Process were all
used statistically more by the quality group compared to the non-quality group. A3 problem
solving was used by 43.75% of the quality group compared to 13.33% of the non-quality
group the difference between these groups resulted in a p-value of 0.026 meaning the usage of
A3 problem solving by the quality group was statistically significant at the 95% confidence
- 15 -
Effectiveness and Best Practices of Lean and Six Sigma Methodologies in Health Care Senior Capstone Project for Daniel Branco
level. Kaizen events were used by 56.25% of the quality group while 20.0% of non-quality
group utilized them.This resulted in a p-value of 0.014 meaning the usage of Kaizen events by
the quality group was statistically significant 95% confidence level compared to the non-
quality group. Finally, Rapid Cycle Improvement Process was used by 81.25% of the quality
group compared to 46.67% of the non-quality group with a p-value of 0.033. See Table 5
below for a detailed look at the means, standard deviations and resulting p-values of the
significance tests.
Table 5 – Six Sigma and Lean Methodologies Means, Standard Deviations, and P-Values
Quality Mean
Quality Std Dev
Non‐Quality Mean
Non‐Quality Std
DevF‐Test
Levene's Test
P‐Value of T‐Test
Degrees of Freedom
A3 0.438 0.512 0.125 0.342 0.127 0.051 0.026 30
Kaizen Event 0.563 0.512 0.188 0.403 0.363 0.136 0.014 30
Kaizen Blitz 0.125 0.342 0.125 0.342 1.000 1.000 0.500 30
Kaizen Burst 0.063 0.250 0.125 0.342 0.238 0.559 0.720 30
Rapid Cycle Improvement
0.813 0.403 0.500 0.516 0.348 0.004 0.033 30
Six Sigma 0.375 0.500 0.375 0.500 1.000 1.000 0.500 30
None 0.063 0.250 0.188 0.403 0.074 0.300 0.850 30
CQI - - 0.063 0.250 - - - -
DMAIC 0.063 0.250 - - - - - -
Workout - - 0.125 0.342 - - - -
TPS 0.063 0.250 - - - - - -
Lean 0.063 0.250 0.063 0.250 1.000 1.000 0.500 30
Six Sigma and Lean Methodologies Means, Standard Deviations and P‐Values
(Bold Values are Statistically Significant at 95% Confidence Level) Four of the Kaizen or Lean tools were used statistically more by the quality group compared
to the non-quality group. Observation Forms, Value Stream Mapping/Process Flow Charts,
5S/Visual Controls, and Standardized Processes were all used significantly more by the
quality group. Observation forms were used by 75% of the quality group compared to the
26.67% of the non-quality group. This resulted in a p-value of 0.002. Value Stream
Mapping/Process Flow Charts were utilized by 93.75% of the quality group while only
66.67% of the non-quality group used them. This was statistically significant with a p-value
of 0.018. 5S/Visual Controls were used by 75.0% of the quality group compared to 33.33% of
the non-quality group.The p-value for this tool was 0.006 showing its statistical significance
at the 95% confidence level.Finally, Standardized Processes were also a significant tool with
68.75% of the quality group utilizing them and 33.33% of the non-quality group. The
- 16 -
Effectiveness and Best Practices of Lean and Six Sigma Methodologies in Health Care Senior Capstone Project for Daniel Branco
difference was statistically significant with a p-value of 0.017.See Table 6 below for a
detailed look at the means, standard deviations, and p-values of the significance tests.
Table 6 – Kaizen and Lean Tools Means, Standard Deviations, and P-Values
Quality Mean
Quality Std Dev
Non‐Quality Mean
Non‐Quality Std
DevF‐Test
Levene's Test
P‐Value of T‐Test
Degrees of Freedom
Observation Forms
0.750 0.447 0.250 0.447 1.000 1.000 0.002 30
Value Stream Mapping
0.938 0.250 0.625 0.500 0.011 0.033 0.018 22
5S 0.750 0.447 0.313 0.479 0.796 0.705 0.006 30
Standardized Processes
0.688 0.479 0.313 0.479 1.000 1.000 0.017 30
Poke‐Yoke 0.313 0.479 0.125 0.342 0.203 0.212 0.106 30
Pull Systems 0.375 0.500 0.125 0.342 0.151 0.109 0.055 30
Cause & Effects Matrix
- - 0.063 0.250 - - - -
Waste/ Gemba Walks
- - 0.125 0.342 - - - -
Just‐In‐Time - - 0.063 0.250 - - - -
None 0.063 0.250 0.188 0.403 0.074 0.300 0.850 30
Kaizen and Lean Tools Means, Standard Deviations and P‐Values
(Bold Values are Statistically Significant at 95% Confidence Level) None of Problem identification tools were used significantly more by the quality group
compared to the non-quality group. Root Cause Analysis and Fishbone diagrams were widely
used by both groups. Root Cause Analysis was used by 100% of the quality group and 93.8%
of the non-quality group.Fishbone diagrams are used by 81.25% of the quality group and
80.0% of the non-quality group. The p-value for this tool was 0.500 showing the lack of
statistical significance. See Table 7on the next page for a detailed look at the means, standard
deviations, and p-values of these significance tests.
- 17 -
Effectiveness and Best Practices of Lean and Six Sigma Methodologies in Health Care Senior Capstone Project for Daniel Branco
Table 7 – Problem Identification Tools Means, Standard Deviations, and P-Values
Quality Mean
Quality Std Dev
Non‐Quality Mean
Non‐Quality Std
DevF‐Test
Levene's Test
P‐Value of T‐Test
Degrees of Freedom
Root Cause 1.000 - 0.938 0.242 - - - -
Fishbone 0.813 0.390 0.813 0.390 1.000 1.000 0.500 30
Why‐Why 0.563 0.496 0.438 0.496 1.000 1.000 0.248 30
None - - 0.063 0.242 - - - -
TapRoot - - - - - - - -
FMEA 0.063 0.242 0.063 0.242 1.000 1.000 0.500 30
Problem Identification Tools Means, Standard Deviations and P‐Values
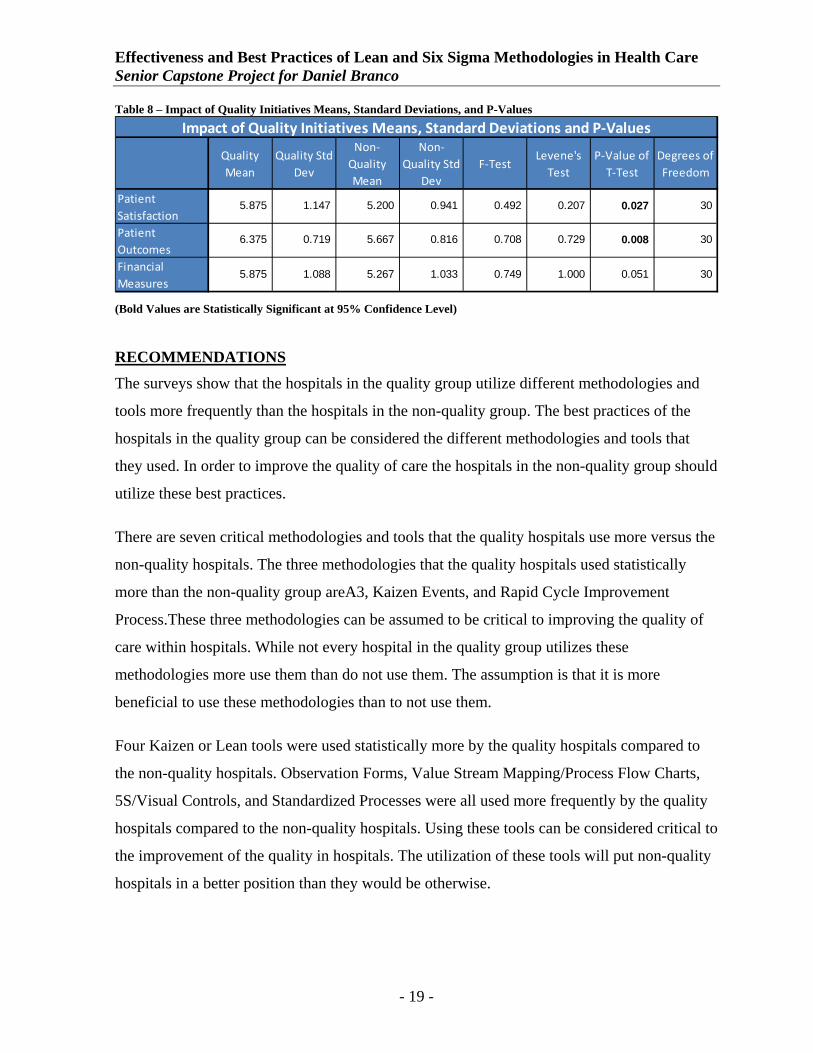
(Bold Values are Statistically Significant at 95% Confidence Level) Opinions of the quality improvement initiatives varied greatly between the different outcomes
and the two groups.Respondents were asked of their opinion of how have quality
improvement initiatives impacted patient satisfaction, patient outcomes, and financial
measures. In response to how have they impacted patient satisfaction the quality group had an
average response of 5.875 out of 7. This means they believed patient satisfaction was
positively improved by the quality improvement initiatives. The non-quality group had an
average response of 5.2 out of 7. The non-quality group also believed that patient satisfaction
was improved by the quality improvement initiatives but not as greatly as the quality group
believed. The quality group also believed financial measures were improved with an average
response of 5.875 out of 7. The non-quality group believed the quality improvement measures
improved financial measures with an average response of 5.2667 out of 7. Patient outcomes
saw the highest ratings with an average score of 6.375 from the quality group and 5.667 from
the non-quality group.
The difference between quality groups and non-quality groups was statistically significant in
two of the three opinion categories. The difference in patient satisfaction was significant with
a p-value of 0.027. The other category where the quality group had a significantly higher
response was in patient outcomes with a p-value of 0.008. Finally, the difference in financial
measures between the quality group and non-quality group was not statistically significant
with a p-value of 0.051.However, this was very close to the significance level and may be a
significant difference in a larger sample. See Table 8on the next page for a detailed look at the
means, standard deviations, and p-values of the significance tests.
- 18 -
Effectiveness and Best Practices of Lean and Six Sigma Methodologies in Health Care Senior Capstone Project for Daniel Branco
Table 8 – Impact of Quality Initiatives Means, Standard Deviations, and P-Values
Quality Mean
Quality Std Dev
Non‐Quality Mean
Non‐Quality Std
DevF‐Test
Levene's Test
P‐Value of T‐Test
Degrees of Freedom
Patient Satisfaction
5.875 1.147 5.200 0.941 0.492 0.207 0.027 30
Patient Outcomes
6.375 0.719 5.667 0.816 0.708 0.729 0.008 30
Financial Measures
5.875 1.088 5.267 1.033 0.749 1.000 0.051 30
Impact of Quality Initiatives Means, Standard Deviations and P‐Values
(Bold Values are Statistically Significant at 95% Confidence Level)
RECOMMENDATIONS The surveys show that the hospitals in the quality group utilize different methodologies and
tools more frequently than the hospitals in the non-quality group. The best practices of the
hospitals in the quality group can be considered the different methodologies and tools that
they used. In order to improve the quality of care the hospitals in the non-quality group should
utilize these best practices.
There are seven critical methodologies and tools that the quality hospitals use more versus the
non-quality hospitals. The three methodologies that the quality hospitals used statistically
more than the non-quality group areA3, Kaizen Events, and Rapid Cycle Improvement
Process.These three methodologies can be assumed to be critical to improving the quality of
care within hospitals. While not every hospital in the quality group utilizes these
methodologies more use them than do not use them. The assumption is that it is more
beneficial to use these methodologies than to not use them.
Four Kaizen or Lean tools were used statistically more by the quality hospitals compared to
the non-quality hospitals. Observation Forms, Value Stream Mapping/Process Flow Charts,
5S/Visual Controls, and Standardized Processes were all used more frequently by the quality
hospitals compared to the non-quality hospitals. Using these tools can be considered critical to
the improvement of the quality in hospitals. The utilization of these tools will put non-quality
hospitals in a better position than they would be otherwise.
- 19 -
Effectiveness and Best Practices of Lean and Six Sigma Methodologies in Health Care Senior Capstone Project for Daniel Branco
Through the utilization of these tools and methodologies non-quality hospitals can help
improve their quality initiatives in order to positively impact patient satisfaction and
outcomes. While using these tools donot guarantee success, the proper use of them in critical
areas could greatly improve the quality of care. It must be said that in order to obtain a higher
quality of care a hospital does not need to utilize these tools and methodologies. One Urban,
non-teaching hospital did manage to obtain 100 Top Hospitals and Magnet Nursing Hospital
status using only Root Cause Analysis out of the surveyed items. However, it was the only
hospital surveyed that was able to achieve this status without using any of the tools or
methodologies. It is possible that this hospital used a homegrown quality program.
Many of the hospitals surveyed both in the quality group and non-quality group utilized some
methodologies or tools. However, this survey has shown that the quality hospitals utilize
different methodologies or tools more than the non-quality group.The assumption is that the
discrepancy can be accounted for the in the quality position of the hospitals. However,
because some of the non-quality hospitals do utilize the same methodologies that the quality
group do the assumption becomes that either they have not been adapted properly (utilized in
wrong areas, not completely open, staff not knowledgeable enough about the processes) or
they are in the early stages of use and development.
Limitations of Research
There were a few limitations to the scope of this research. The small sample size made it
difficult to see how widespread the discrepancy between some of the methodologies and tools
used by the quality hospitals compared to the non-quality. The small sample was also further
diluted when I split the respondents into two groups to be compared.The survey was limited
in that it did not define each individual item which could have led to people not selecting
things they were using, just under a different name. The survey and research is also limited
because it was difficult to identify how well each methodology or tool was implemented. This
could have an impact on why certain hospitals performed better than others or how the quality
hospitals were able to distinguish themselves. Finally, the non-quality hospitals surveyed were
all located in the New England region which may not be the best representation of hospitals
nationwide.
- 20 -
Effectiveness and Best Practices of Lean and Six Sigma Methodologies in Health Care Senior Capstone Project for Daniel Branco
Further Research
Further research would have to be done to confirm or deny these assumptions. A larger
sample size would add more power to the statistical tests done. This would add more validity
to our results. Consolidating certain categories and containing more explicit definitions would
make the survey more user friendly and limit the potential error of choosing a methodology or
tool the hospital might have used under a different or even incorrect name. Finally, more
reliance on actual case studies would have been beneficial to see the actual application of the
methodologies or tools. This would allow us to identify how well the hospitals implemented
the methodologies and how dedicated they were to making them successful. This could have
an impact as it may have been that using the methodologies was advantageous but utilizing
them and implementing them successfully was the true point of differentiation between the
quality and non-quality groups.
- 21 -
Effectiveness and Best Practices of Lean and Six Sigma Methodologies in Health Care Senior Capstone Project for Daniel Branco
REFERENCES
"100 Top Hospitals." 100 Top Hospitals. Thompson Reuters, 2011. Web. 20Nov. 2011. <http://www.100tophospitals.com/>.
"The 2012 Statistical Abstract: Gross Domestic Product (GDP)." Census Bureau Home Page. 2011. Web. 07 Oct. 2011. <http://www.census.gov/compendia/statab/cats/income_expenditures_poverty_wealth/gross_domestic_product_gdp.html>.
"ANCC Magnet Recognition Program."ANCC Magnet Recognition Program. 2012. Web. 26 Apr. 2012. <http://www.nursecredentialing.org/Magnet.aspx>.
Bernard WysockiJr.. "Industrial Strength: To Fix Health Care, Hospitals Take Tips From Factory Floor; Adopting Toyota Techniques Can Cut Costs, Wait Times; Ferreting Out an Infection; What Paul O'Neill's Been Up To. " Wall Street Journal 9 Apr. 2004, Eastern edition: ABI/INFORM Global, ProQuest. Web. 9 Jan. 2011.
"The Case for Streamlining Workflow. " Hospitals & Health Networks : HEALTH CARE'S MOST WIRED magazine 1 Jul 2004: ABI/INFORM Global, ProQuest. Web. 27 Jan. 2011.
Chassin, Mark R. "Is Health Care Ready for Six Sigma Quality?" The Milbank Quarterly 76.4 (1998): 565-91. The Milbank Quarterly. 1998. Web. 20 Jan. 2011. <http://www.milbank.org/quarterly/764featchas.html>.
"Cause and Effect Analysis."MindTools.com. 2012.Web. 26 Apr. 2012. <http://www.mindtools.com/pages/article/newTMC_03.htm>.
"Healthcare."U.S. Bureau of Labor Statistics. 2 Feb. 2010. Web. 20 Jan. 2011. <http://www.bls.gov/oco/cg/cgs035.htm>.
"Health Care Criteria for Performance Excellence."National Institute of Standards and Technology. 27 Aug. 2009. Web. 20 Jan. 2011. <http://www.nist.gov/baldrige/publications/hc_criteria.cfm>.
"The Increasing Cost of Health Care." U.S. Bureau of Labor Statistics. Nov. 2009. Web. 11 Apr. 2012. <http://www.bls.gov/spotlight/2009/health_care/>.
"Institute for Healthcare Improvement: Lessons from the Baldrige Winners in Health Care." Institute for Healthcare Improvement. Web. 18 Jan. 2011. <http://www.ihi.org/IHI/Topics/Improvement/ImprovementMethods/ImprovementStories/LessonsfromtheBaldrigeWinnersinHealthCare.htm>.
Jackson, Jill, and John Nolen. "Health Care Reform Bill Summary: A Look At What's in the Bill - Political Hotsheet - CBS News." CBS News. 21 Mar. 2010. Web. 25 Jan. 2011. <http://www.cbsnews.com/8301-503544_162-20000846-503544.html>.
- 22 -
Effectiveness and Best Practices of Lean and Six Sigma Methodologies in Health Care Senior Capstone Project for Daniel Branco
Jacobs, F. Roberts, and Richard B. Chase. Operations and Supply Management The Core. New York: Irwin Professional Pub, 2006. Print.
Jimmerson, Cindy, Dorothy Weber, and DurwardSobek II. "Reducing Waste and Errors: Piloting Lean Principles at Intermountain Healthcare." Journal on Quality and Patient Safety 31.5 (2005): 249-57. Print.
Jimmerson, Cindy. A3 Problem Solving for Healthcare: a Practical Method for Eliminating Waste. New York: Healthcare Performance, 2007. Print.
Kissoon, N.. "The Toyota Way...or Not?-New Lessons for Health Care. " Physician Executive 36.6 (2010): 40-42. ABI/INFORM Global, ProQuest. Web. 27 Jan. 2011.
"Malcolm Baldrige National Quality Improvement Act of 1987."National Institute of Standards and Technology. 18 Feb. 2010. Web. 20 Jan. 2011. <http://www.nist.gov/baldrige/about/improvement_act.cfm>.
Martin, W. F. (2007). Quality models: Selecting the best model to deliver results. The Physician executive, 33(3), 24-31.
Polk, J.. "Lean Six Sigma, Innovation, and the Change Acceleration Process Can Work Together. " Physician Executive 37.1 (2011): 38-42. ABI/INFORM Global, ProQuest. Web. 27 Jan. 2011.
"Pull Systems." Pull Systems in Manufacturing. Web. 26 Apr. 2012. <http://catalystconnection.org/Continuous-improvement/lean-manufacturing-consulting/pull-systems.aspx>.
Quinlan-Colwell, Ann. "Medicaid 101." Home Health Care Management & Practice 21.5 (2009): 338-45. Print.
Robinson, Harry. "Using Poka-Yoke Techniquesfor Early Defect Detection."Berry College.Web. 26 Apr. 2012. <http://facultyweb.berry.edu/jgrout/pokasoft.html>.
"Root Cause Analysis."MindTools.com. 2012.Web. 26 Apr. 2012. <http://www.mindtools.com/pages/article/newTMC_80.htm>.
Schoenbaum, Stephen C., Anne-Marie J. Audet, and Karen Davis."Obtaining Greater Value from Health Care: The Roles of the U.S. Government." Health Affairs 22.6 (2003): 183-90. Print.
Sobek II, Durward K., and Cindy Jimmerson. "A3: Reports Tools for Process Improvement." Montana College of Engineering, 2004.Web. 23 Jan. 2011. <http://www.coe.montana.edu/ie/faculty/sobek/ioc_grant/ierc_2004.pdf>.
United States. U.S. Department of Commerce.Bureau of Economic Analysis. Gross Domestic Product: Third Quarter 2010 (Third Estimate) Corporate Profits: Third Quarter 2010
- 23 -
Effectiveness and Best Practices of Lean and Six Sigma Methodologies in Health Care Senior Capstone Project for Daniel Branco
(Revised Estimate). 2010. Web. 25 Jan. 2011. <http://www.bea.gov/newsreleases/national/gdp/2010/pdf/gdp3q10_3rd.pdf>.
Varkey, Prathibha, M. K. Reller, and Roger K. Resar."Basics of Quality Improvement in Health Care." Mayo Clinic Proceedings 82.6 (2007): 735-39. Print.
Visich, John K., Angela M. Wicks, and FaizaZalila."Practitioner Perceptions of the A3 Method for Process Improvement in Health Care." Decision Sciences Journal of Innovative Education 8.1 (2010): 191-213.
"Why-Why Diagram." Syque Quality. 2011. Web. 26 Apr. 2012. <http://syque.com/improvement/Why-Why%20Diagram.htm>.
- 24 -
Effectiveness and Best Practices of Lean and Six Sigma Methodologies in Health Care Senior Capstone Project for Daniel Branco
APPENDECIES
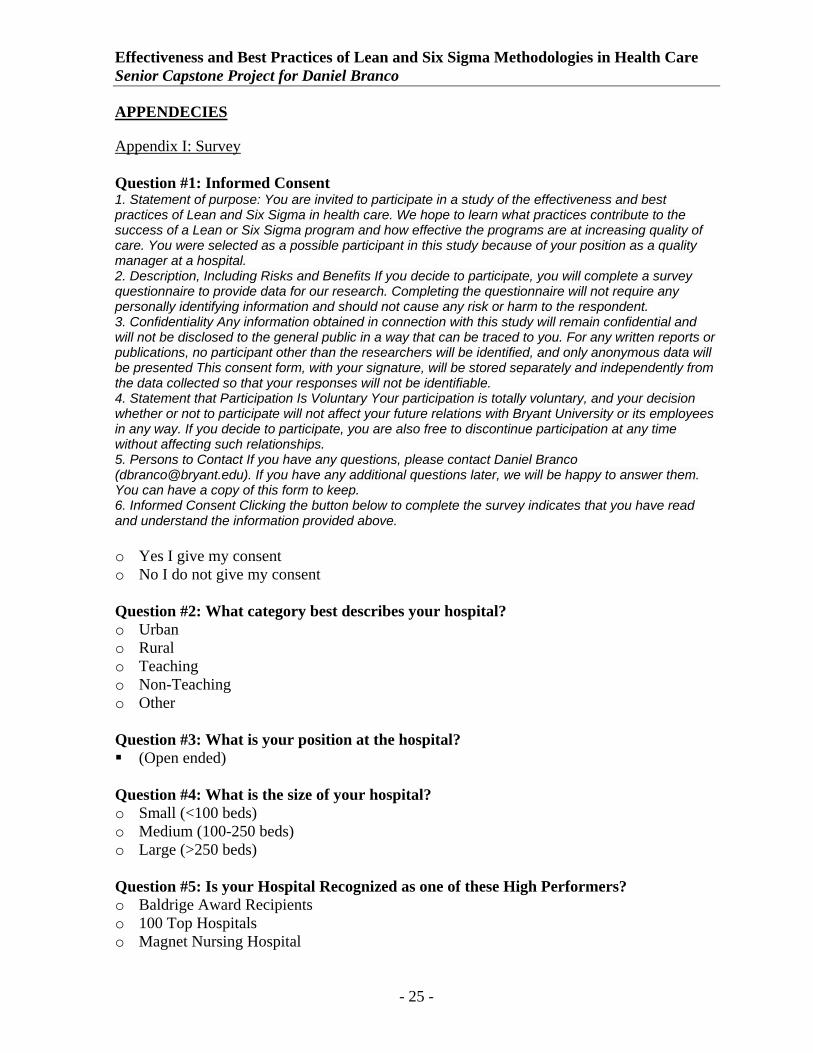
Appendix I: Survey Question #1: Informed Consent 1. Statement of purpose: You are invited to participate in a study of the effectiveness and best practices of Lean and Six Sigma in health care. We hope to learn what practices contribute to the success of a Lean or Six Sigma program and how effective the programs are at increasing quality of care. You were selected as a possible participant in this study because of your position as a quality manager at a hospital. 2. Description, Including Risks and Benefits If you decide to participate, you will complete a survey questionnaire to provide data for our research. Completing the questionnaire will not require any personally identifying information and should not cause any risk or harm to the respondent. 3. Confidentiality Any information obtained in connection with this study will remain confidential and will not be disclosed to the general public in a way that can be traced to you. For any written reports or publications, no participant other than the researchers will be identified, and only anonymous data will be presented This consent form, with your signature, will be stored separately and independently from the data collected so that your responses will not be identifiable. 4. Statement that Participation Is Voluntary Your participation is totally voluntary, and your decision whether or not to participate will not affect your future relations with Bryant University or its employees in any way. If you decide to participate, you are also free to discontinue participation at any time without affecting such relationships. 5. Persons to Contact If you have any questions, please contact Daniel Branco ([email protected]). If you have any additional questions later, we will be happy to answer them. You can have a copy of this form to keep. 6. Informed Consent Clicking the button below to complete the survey indicates that you have read and understand the information provided above. o Yes I give my consent o No I do not give my consent Question #2: What category best describes your hospital? o Urban o Rural o Teaching o Non-Teaching o Other Question #3: What is your position at the hospital? (Open ended)
Question #4: What is the size of your hospital? o Small (<100 beds) o Medium (100-250 beds) o Large (>250 beds) Question #5: Is your Hospital Recognized as one of these High Performers? o Baldrige Award Recipients o 100 Top Hospitals o Magnet Nursing Hospital
- 25 -
Effectiveness and Best Practices of Lean and Six Sigma Methodologies in Health Care Senior Capstone Project for Daniel Branco
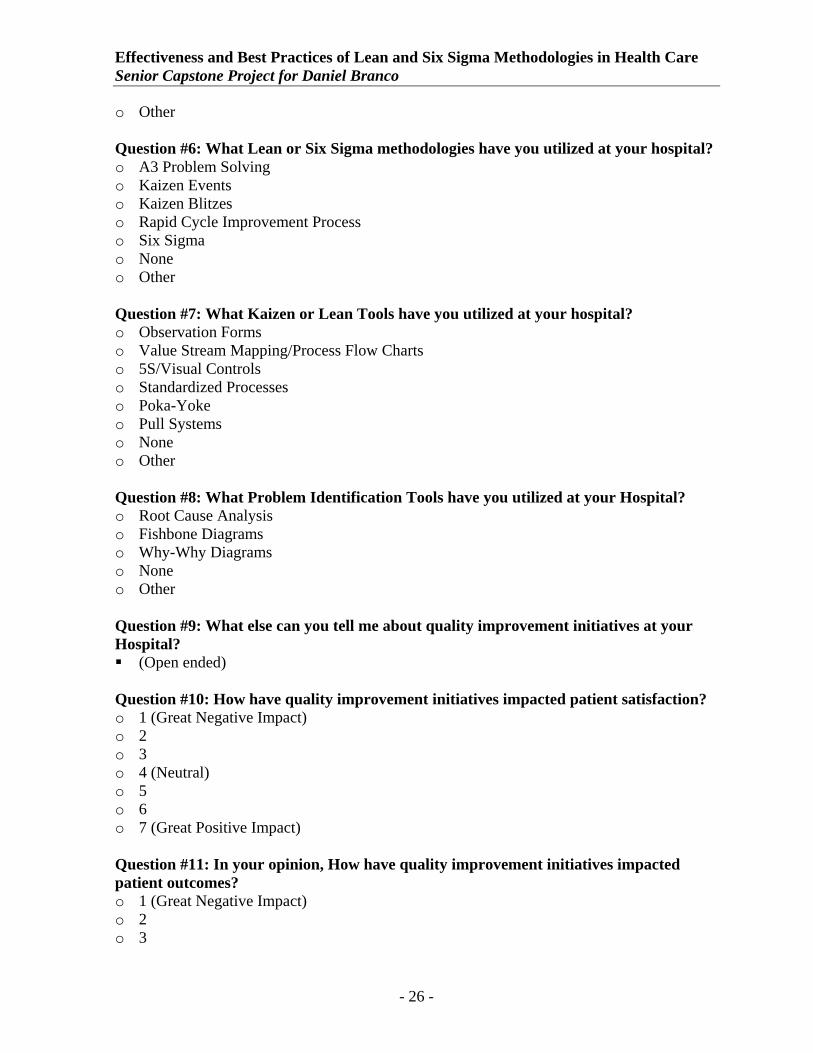
o Other Question #6: What Lean or Six Sigma methodologies have you utilized at your hospital? o A3 Problem Solving o Kaizen Events o Kaizen Blitzes o Rapid Cycle Improvement Process o Six Sigma o None o Other Question #7: What Kaizen or Lean Tools have you utilized at your hospital? o Observation Forms o Value Stream Mapping/Process Flow Charts o 5S/Visual Controls o Standardized Processes o Poka-Yoke o Pull Systems o None o Other Question #8: What Problem Identification Tools have you utilized at your Hospital? o Root Cause Analysis o Fishbone Diagrams o Why-Why Diagrams o None o Other Question #9: What else can you tell me about quality improvement initiatives at your Hospital? (Open ended)
Question #10: How have quality improvement initiatives impacted patient satisfaction? o 1 (Great Negative Impact) o 2 o 3 o 4 (Neutral) o 5 o 6 o 7 (Great Positive Impact) Question #11: In your opinion, How have quality improvement initiatives impacted patient outcomes? o 1 (Great Negative Impact) o 2 o 3
- 26 -
Effectiveness and Best Practices of Lean and Six Sigma Methodologies in Health Care Senior Capstone Project for Daniel Branco
o 4 (Neutral) o 5 o 6 o 7 (Great Positive Impact) Question #12: In your opinion, How have quality improvement initiatives impacted financial measures? o 1 (Great Negative Impact) o 2 o 3 o 4 (Neutral) o 5 o 6 o 7 (Great Positive Impact)
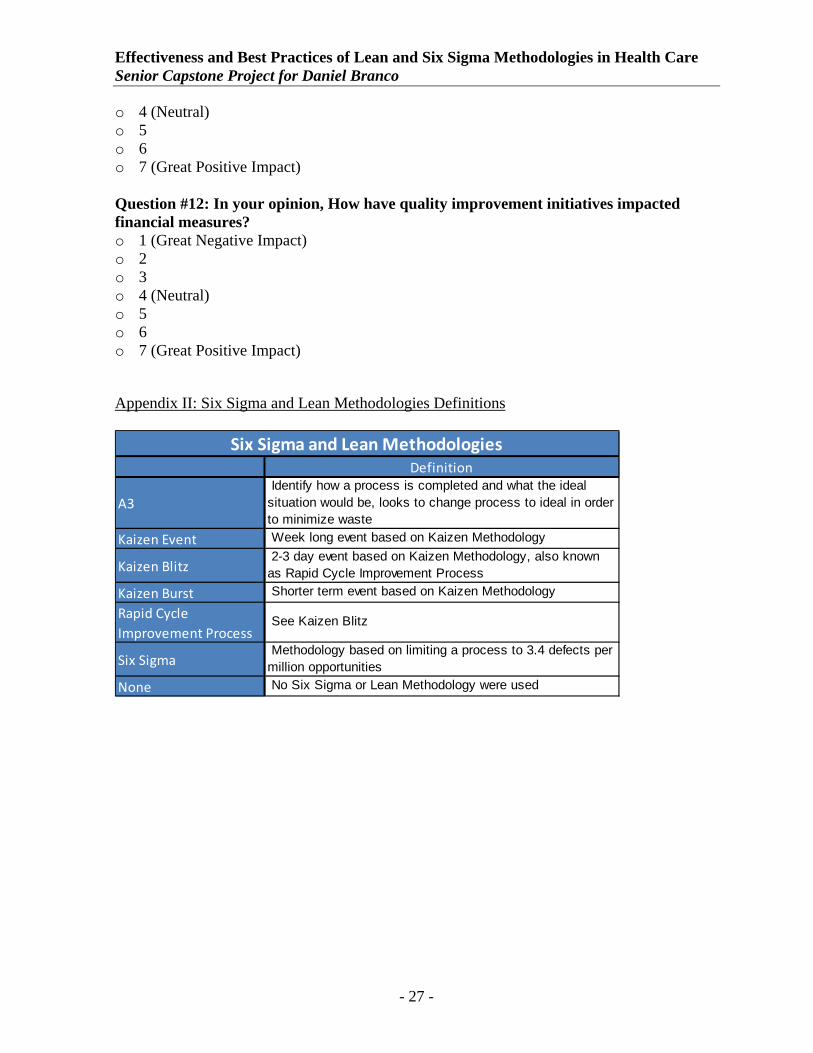
Appendix II: Six Sigma and Lean Methodologies Definitions
Definition
A3 Identify how a process is completed and what the ideal situation would be, looks to change process to ideal in order to minimize waste
Kaizen Event Week long event based on Kaizen Methodology
Kaizen Blitz 2-3 day event based on Kaizen Methodology, also known as Rapid Cycle Improvement Process
Kaizen Burst Shorter term event based on Kaizen Methodology
Rapid Cycle Improvement Process
See Kaizen Blitz
Six Sigma Methodology based on limiting a process to 3.4 defects per million opportunities
None No Six Sigma or Lean Methodology were used
Six Sigma and Lean Methodologies
- 27 -
Effectiveness and Best Practices of Lean and Six Sigma Methodologies in Health Care Senior Capstone Project for Daniel Branco
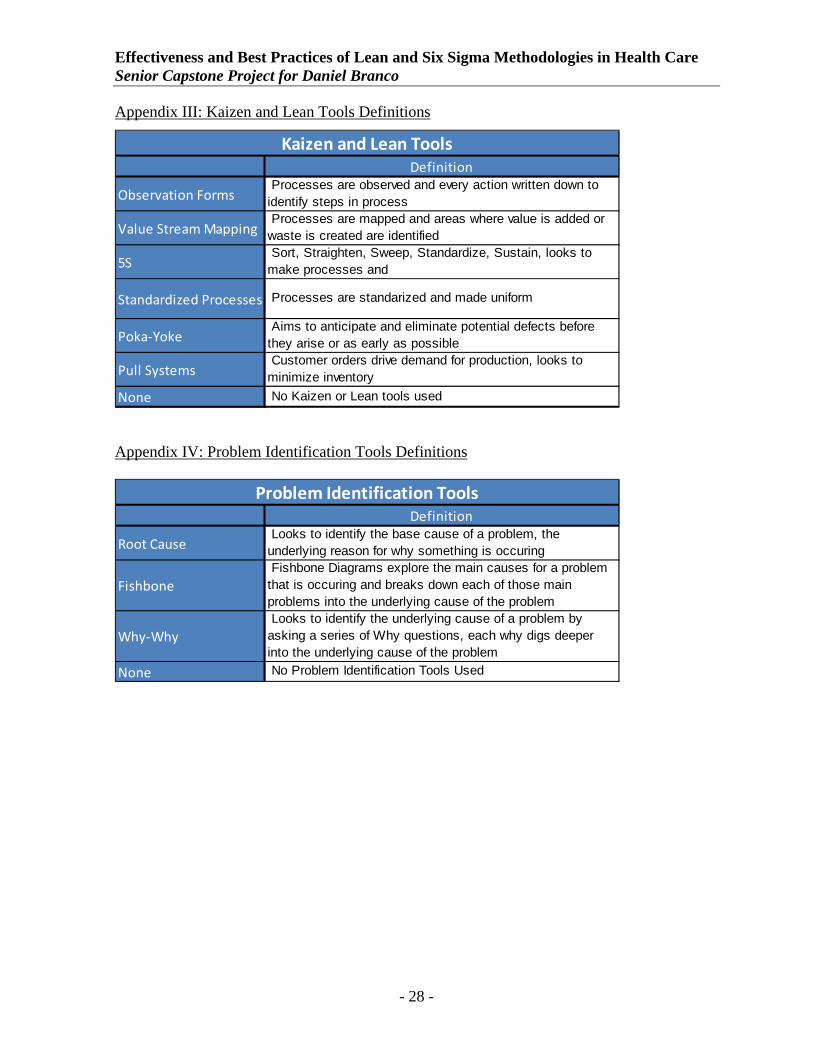
Appendix III: Kaizen and Lean Tools Definitions
Definition
Observation Forms Processes are observed and every action written down to identify steps in process
Value Stream Mapping Processes are mapped and areas where value is added or waste is created are identified
5S Sort, Straighten, Sweep, Standardize, Sustain, looks to make processes and
Standardized Processes Processes are standarized and made uniform
Poka‐Yoke Aims to anticipate and eliminate potential defects before they arise or as early as possible
Pull Systems Customer orders drive demand for production, looks to minimize inventory
None No Kaizen or Lean tools used
Kaizen and Lean Tools
Appendix IV: Problem Identification Tools Definitions
Definition
Root Cause Looks to identify the base cause of a problem, the underlying reason for why something is occuring
Fishbone Fishbone Diagrams explore the main causes for a problem that is occuring and breaks down each of those main problems into the underlying cause of the problem
Why‐Why Looks to identify the underlying cause of a problem by asking a series of Why questions, each why digs deeper into the underlying cause of the problem
None No Problem Identification Tools Used
Problem Identification Tools
- 28 -


