Embed Size (px)
Citation preview
Effect of Operating and Sampling Conditions on theExhaust Gas Composition of Small-Scale PowerGeneratorsMarianne Smits1*, Floris Vanpachtenbeke1,2, Benjamin Horemans3, Karolien De Wael3, Birger
Hauchecorne1, Herman Van Langenhove2, Kristof Demeestere2, Silvia Lenaerts1
1 Research Group Sustainable Energy and Air Purification, Department of Bioscience Engineering, University of Antwerp, Antwerp, Belgium, 2 Research Group EnVOC,
Department of Sustainable Organic Chemistry and Technology, Faculty of Bioscience Engineering, Ghent University, Ghent, Belgium, 3 Environmental Analysis Group,
Department of Chemistry, University of Antwerp, Antwerp, Belgium
Abstract
Small stationary diesel engines, like in generator sets, have limited emission control measures and are therefore responsiblefor 44% of the particulate matter (PM) emissions in the United States. The diesel exhaust composition depends on operatingconditions of the combustion engine. Furthermore, the measurements are influenced by the used sampling method. Thisstudy examines the effect of engine loading and exhaust gas dilution on the composition of small-scale power generators.These generators are used in different operating conditions than road-transport vehicles, resulting in different emissioncharacteristics. Experimental data were obtained for gaseous volatile organic compounds (VOC) and PM massconcentration, elemental composition and nitrate content. The exhaust composition depends on load condition becauseof its effect on fuel consumption, engine wear and combustion temperature. Higher load conditions result in lower PMconcentration and sharper edged particles with larger aerodynamic diameters. A positive correlation with load conditionwas found for K, Ca, Sr, Mn, Cu, Zn and Pb adsorbed on PM, elements that originate from lubricating oil or engine corrosion.The nitrate concentration decreases at higher load conditions, due to enhanced nitrate dissociation to gaseous NO at higherengine temperatures. Dilution on the other hand decreases PM and nitrate concentration and increases gaseous VOC andadsorbed metal content. In conclusion, these data show that operating and sampling conditions have a major effect on theexhaust gas composition of small-scale diesel generators. Therefore, care must be taken when designing new experimentsor comparing literature results.
Citation: Smits M, Vanpachtenbeke F, Horemans B, De Wael K, Hauchecorne B, et al. (2012) Effect of Operating and Sampling Conditions on the Exhaust GasComposition of Small-Scale Power Generators. PLoS ONE 7(3): e32825. doi:10.1371/journal.pone.0032825
Editor: Loren E. Wold, Ohio State University, United States of America
Received December 7, 2011; Accepted February 6, 2012; Published March 19, 2012
Copyright: � 2012 Smits et al. This is an open-access article distributed under the terms of the Creative Commons Attribution License, which permitsunrestricted use, distribution, and reproduction in any medium, provided the original author and source are credited.
Funding: There are no current external funding sources for this study.
Competing Interests: The authors have declared that no competing interests exist.
* E-mail: [email protected]
Introduction
Stationary combustion engines are used for a wide variety of
applications including construction, farming and industrial
services. Diesel generator sets lower than 19 kW represent 18%
of the US non-road market in 2000 [1]. Although this seems a
small fraction compared to the total number of diesel engines in
operation, they emit a substantial fraction of the PM emission
because they have limited emission control measures. The US
Environmental Protection Agency (EPA) estimates that non-road
diesel engines contribute to about 44% of the diesel particulate
matter (PM) emissions nationwide [1].
Diesel engine emissions contain PM, nitrogen oxides (NOx) and
volatile organic compounds (VOCs), which exhibit a wide range of
negative influences on both human health and the environment.
NOx,, for example, contributes to acid deposition when dissolved
in atmospheric moisture and is noxious to the respiratory system.
Both NOx and VOCs are precursors for PM and tropospheric
ozone [2,3]. High concentrations of these pollutants are correlated
with an increasing number of respiratory and cardiovascular
problems [2,4]. Furthermore, air pollution is linked to oxidative
DNA-damage, which implies an increased risk for cancer [5,6].
Besides the mentioned health risks, supplementary effects are
caused by metals adsorbed on diesel PM. They originate from
lubricating oil, fuel additives or mechanical wear [7] and
contribute significantly to oxidative stress caused by PM [8]. To
study the mechanisms by which diesel exhaust and health effects
are linked, a profound knowledge of the physico-chemical nature
of the compounds in the exhaust is crucial.
Although the knowledge regarding diesel exhaust composition
from vehicle engines is substantial [9–12], there are still scientific
gaps in understanding the diesel exhaust composition in the
specific field of generator sets (gen-sets). The different operating
conditions of diesel engines in gen-sets and road-transport vehicles
result in different emission characteristics. This implies that the
emission studies of diesel engines in vehicles cannot be used for
understanding the emissions of diesel gen-sets.
The major dissimilarity lies in the operation mode. Vehicle
engines operate in transient conditions, while diesel gen-sets are
operated in near steady-state load conditions at a fixed number of
revolutions per minute and only slight variations in load [13].
Moreover, cold start and extended idling emissions occur during
PLoS ONE | www.plosone.org 1 March 2012 | Volume 7 | Issue 3 | e32825

maintenance operations and stand-by mode of diesel gen-sets.
Consequently, the emissions of small engine diesel gen-sets should
be studied as a separate case, because it is not possible to have a
model-engine for all different operating conditions.
This study will explore two important parameters by consider-
ing their impact on the diesel exhaust composition. On the one
hand, loading of the engine has an effect on the amount of PM and
the composition of the diesel exhaust gas [14,15]. To date,
relatively few studies concentrate on this effect for small diesel
engines. Chung et al. [10] revealed that particle mobility diameter
expand at higher load conditions. They also reported an
increasing ratio of elemental carbon to organic carbon with rising
load. Obuchi et al. [15] observed that the emission of particulates
increased steeply near the maximum speed and torque. There is
broad evidence that the metal concentration in the flow is higher
at elevated engine load [16–18], but to the best of our knowledge
only one study was conducted on a small stationary engine [19]
instead of on medium duty vehicles. This last study, however, did
not take into account the amount of particulate matter in the flow
to report the metal concentration.
On the other hand, an appropriate sampling and measurement
method is essential for a good PM analysis. As articulated by
Moosemuller et al. [20], the strength of the nephelometer
DustTrak is an excellent signal-to-noise ratio, freedom from
interference by other exhaust sample properties, good time
resolution (1 s), simplicity and low price. The vehicle-type
dependent calibration is however a disadvantage. By contrast,
the common gravimetric filter method is generally acknowledged
as Federal Reference Method by the US EPA [21]. The PM
concentration is not measured on-line, but the measurement is
very accurate and reproducible. Next to the measurement device,
sampling has an impact on the measured concentrations. Dilution
and cooling processes determine the relative amounts of material
adsorbing or condensing onto existing particles and nucleating to
form new particles [11]. Lipsky and Robinson [22] provide some
illustrations of the effect of diesel exhaust dilution on fine particle
mass and partitioning of semivolatile organics between gas and
adsorbed phase. The semivolatile organics largely occur in the
particle phase at low levels of dilution, but the species shift to the
gas phase as dilution increases. Consequently, large decreases in
fine particle mass concentration were observed at higher dilution
levels.
Nevertheless, the previous mentioned studies only fragmentarily
deal with the subject of concern. Less attention has been paid to
the effect of load and dilution in the specific case of one-cylinder
diesel exhaust. Additionally, studies of the effect of load and
dilution are usually limited to one parameter, but none of them
includes VOC, PM and chemical composition simultaneously.
Furthermore, the chemical composition of the PM is mostly
determined with atomic absorption spectroscopy (AAS) or
inductive coupled plasma spectroscopy (ICP), which limits the
choice of elements studied. To conclude, previous research tends
to focus on the analysis, rather than on the underlying combustion
mechanism causing the observed trends.
The effect of load and dilution on the exhaust composition of a
one-cylinder diesel engine of a gen-set is therefore studied here.
The considered parameters are PM mass concentration, gaseous
VOC concentration, nitrate content and the elemental composi-
tion of the PM. Also, attention will be paid to the mechanisms
responsible for the observed effects.
Materials and Methods
Generator set and fuel usedThe studied exhaust was produced by a diesel gen-set with a
four-stroke, one-cylinder motor without after-treatment device.
The used cylinder had a capacity of 418 cc and the motor was
operated at 3000 rpm. The generator had an output power of
6 kW and was loaded with electric radiators of 2 kW during the
experiment in order to obtain low and medium load conditions, at
2 kW and 4 kW respectively. Idling condition was tested by
applying no load to the gen-set.
All emission tests were conducted with Gasoil extra, supplied by
Argos Oil. The diesel fuel is comparable to low sulfur fuel as used
in Belgium for stationary engines. Details of the fuel properties are
provided in Table 1. The Multigrade 10W40 lubricating oil was
supplied by Brega. The elemental composition of the diesel and
lubricating oil was tested with X-ray fluorescence (Panalytical
MiniPal) and is summarized in Table 2.
SamplingThe sampling was undertaken at steady conditions with the
engine operated at least 45 min at the same load. Exhaust gas
temperature at the end of the exhaust tailpipe was in the range of
Table 1. Properties of Gasoil extra.
Properties Units Result Test method
Mass density at 15uC kg L21 0.845 ISO 3675/NBN T 52-005
Kinematic viscosity at 40uC mm2 s21 2.5 ISO 3104/NBN T52-100
Distilled condensed volume at 250uC – at 350uC % 30–90 ISO 3405/NBN T52-075
Cloud point uC +4 23 27 ISO 3015
Cold filter plugging point uC 25 213 220 EN 116/NBN T 52-118
Carbon Conradson % w ,0.05 ISO 6615/NBN 52-049
Sediment potential by filtration mg kg21 ,24 DIN 51419
Water content mg kg21 ,200 ASTM D 95/NBN T 52-092
Ash % m/m ,0.001 ASTM D 482/NBN T 52-119
Heating value MJ kg21 46.0 ASTM D240
Sulfur % m/m ,0.0050 ASTM D 1552/NBN T 52-050
Cetane number 51 ASTM D 976
doi:10.1371/journal.pone.0032825.t001
Exhaust Gas Composition of Small Power Generators
PLoS ONE | www.plosone.org 2 March 2012 | Volume 7 | Issue 3 | e32825

6065uC without load, 8765uC for low load and 11165uC for
medium load conditions, as measured with a K-type thermocou-
ple. Stainless steel tubing was used for the transportation and
dilution of the diesel exhaust gas. A 6 mm diameter tube was
placed 5 cm inside the exhaust pipe for sampling purposes. A
regulating valve with a membrane pump was used to approach an
isokinetically intake in order to achieve reproducible conditions.
The exhaust gas was diluted with filtered ambient air in a porous
tube diluter (residence time ,1 s) and the diluted exhaust gas was
sampled for analysis. The dilution ratio was determined by
dividing the non-diluted CO level with the diluted CO level. The
studied dilution ratios were 1, 5 and 30. This ensures a maximal
driving force for gas to particle conversion [23] and allowed to
perform measurements in the range of the used instruments.
MeasurementsGas analyses were performed continuously by implementing
sensors right after the dilution tunnel. The MSI Drager EM200
measured the CO and O2 concentrations and a Mexa-120NOx
sensor (Horiba) was used for NOx detection.
Every three seconds, the mass concentration of PM in the
diluted exhaust gas was determined with a nephelometer
(DustTrak model 8530, TSI Inc.), which was implemented after
the dilution tunnel. The DustTrak was used as an indicator for
reaching the steady state condition. The vehicle-type dependent
calibration is no obstruction here because all measurements were
performed on the same engine with the same fuel. The reported
data are averaged over 5 min measurement periods.
Teflon filters (37 mm Pallflex, Pall-Gelman) were used as a
second method for the quantification of total PM mass
concentrations. Samples and field blanks were weighed before
and after sampling using a microbalance (Sartorius) with an
accuracy of 0.01 mg in a temperature and relative humidity
controlled environment (4062% RH at 2561uC). The samples
were preconditioned in the aforementioned environment 48 h
prior to the measurement. For each combination of load and
dilution ratio, three different filters were sampled and this
weighing was performed in three-fold. The filters were placed in
a filter holder and a gas meter installed after the filter holder
measured the exhaust gas volume. The mass on the filter was
divided by the sampled exhaust gas volume to obtain the PM mass
concentration.
After weighing, 20 relevant elements were analyzed on the PM
loaded filters with energy dispersive X-ray fluorescence (EDXRF)
spectrometry. Detection limits ranged from 0.09 mg m23 to
7 mg m23. The relative standard deviation, which is a measure
for the precision of the analysis, was generally ,15% for undiluted
samples, except for K, Ti and Fe for which the relative standard
deviations ranged from 24% to 100%. The lower precision for
certain trace elements is due to the short collection time (30 min)
which was preferred in this study for practical reasons. Ion
chromatography was used to determine the amount of nitrate. The
limit of detection was 5 mg m23 with a relative standard deviation
better than 25%. More information on the EDXRF and IC
instrumentation and applied methods could be found elsewhere
[24,25].
To determine the VOC concentration, Tenax TA tubes
(Markes International) were pretreated for 1 h at 300uC in a flow
of 50 mL min21 He. Tol-d8 was used as internal standard. To
protect the equipment, the Tenax tubes were placed after a filter
to prevent PM to block the tubes. A small pump (GilAir) sampled
108.5 mL. For each combination of load and dilution ratio, two
samples were taken and the average value is reported. The relative
standard deviation for undiluted samples was generally ,25%.
The samples at a load of 2 kW for dilution ratio 1 and at a load of
4 kW for dilution ratio 30 could not be collected due to technical
problems. Thermal desorption gas chromatography with quadru-
pole mass spectrometric detection (GC/MS, Markes Internation-
al/Interscience) was used to analyze the samples. A description of
this method can be found in more detail in a previous paper [26].
For discussion of the results, the alkanes under study are n-hexane,
n-heptane, n-octane, n-nonane, n-decane, n-undecane and n-
dodecane, while the aromatic VOCs are benzene, toluene,
ethylbenzene, styrene, benzaldehyde, propylbenzene, benzonitrile
and phenol.
To analyze the morphology of the particles, a 7-stage May-type
cascade impactor was used to sample PM in several aerodynamic
cut-off diameter ranges on aluminum foils. The impactor was
placed in the exhaust gas directly after the tail pipe. Samples were
taken at 0 kW and 4 kW loading of the gen-set during a collection
period of 1 min. The surface morphology was studied by scanning
electron microscopy (SEM, JEM-5510, Jeol) with a resolution of
3.5 nm and equipped with an Inca X-ray microanalysis unit. A
gold coating was required for optimal imaging.
For comparison reasons, all the measurements are corrected for
the dilution ratio by multiplying them with the specific dilution
ratio to obtain the reported data. This does not imply that these
values occur in reality, but they illustrate the fact that the
concentrations do not increase or decrease proportional to the
applied dilution.
StatisticsResults are given as means with standard error (S.E.). The open-
source statistical environment R (www.r-project.org) was used to
perform linear regression analysis as well as to determine the
significance of Pearson correlation coefficients with a two-tailed
test. Values of p,0.05 were considered to be significant.
Results and Discussion
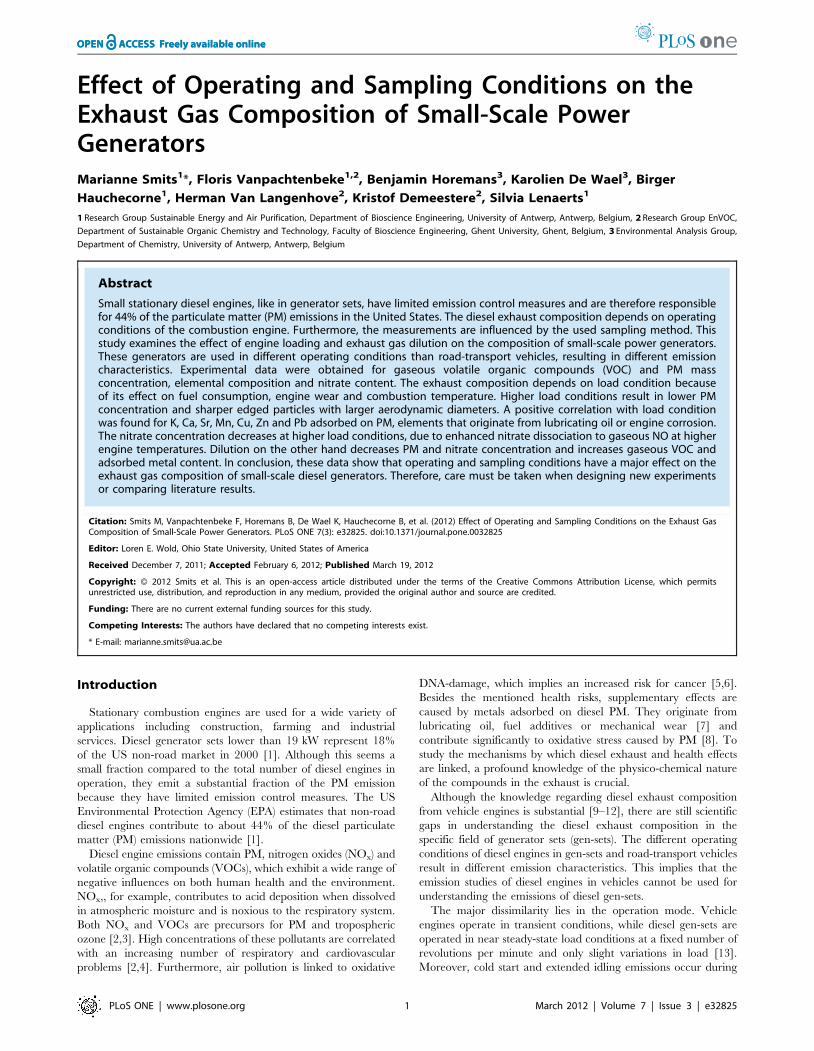
Particulate matter mass concentrationFig. 1 illustrates the effect of load and dilution ratio on the PM
mass concentrations obtained by the two independent methods .
For the gravimetric method, PM masses corresponding to a
dilution ratio of 30 were not considered, since they were below the
measurement accuracy of the microbalance.
As can be seen, PM mass concentrations decrease along with an
increasing engine load. The measurement at 4 kW with the
DustTrak is an exception to this general trend and will be
Table 2. Concentration of metals in Gasoil extra andlubricating oil.
ElementConc. indiesel (ppm)
Conc. in lubricatingoil (ppm)
Detectionlimit (ppm)
K 85620 70630 70
Ca 42610 385620 40
Cr 1061 1161 4
Fe 2261 2161 2
Ni 1.360.1 1.560.2 0.5
Cu 0.360.1 3.960.1 0.2
Zn 0.960.1 870610 0.2
Br ,0.2 0.560.1 0.2
doi:10.1371/journal.pone.0032825.t002
Exhaust Gas Composition of Small Power Generators
PLoS ONE | www.plosone.org 3 March 2012 | Volume 7 | Issue 3 | e32825
discussed later. The PM trend illustrates how fuel oxidation was
more efficient at higher engine loads. This is in agreement with
previous studies [13,17], where the lower PM mass emission rates
at medium load conditions were explained by the fact that
manufacturers optimize the engines for medium load applications.
Additionally, literature reported an average PM mass emission
rate for 18 back-up gen-sets which slightly increased when
switching from medium to high load conditions [13]. However
this effect was not observed in the present study, because the gen-
set was never used under full load conditions (6 kW). Important to
mention is that Dwivedi et al. [18] report an opposite trend for the
variation of PM mass with engine load. The diesel fuel they used
had a 10 times higher sulfur content, so probably the observed
increase of PM mass with higher engine load could be explained
by the additional formation of sulfates when more fuel is burned.
A higher dilution ratio results in a lower PM concentration,
despite the correction for dilution. This can nonetheless be
explained by the fact that dilution lowers the saturation ratio of the
PM precursors, which results in less nucleation and accumulation
processes and therefore in less PM [27]. This is in accordance with
the decreasing fuel-based PM mass emissions with increasing
dilution ratio, as described by Lipsky et al. [22].
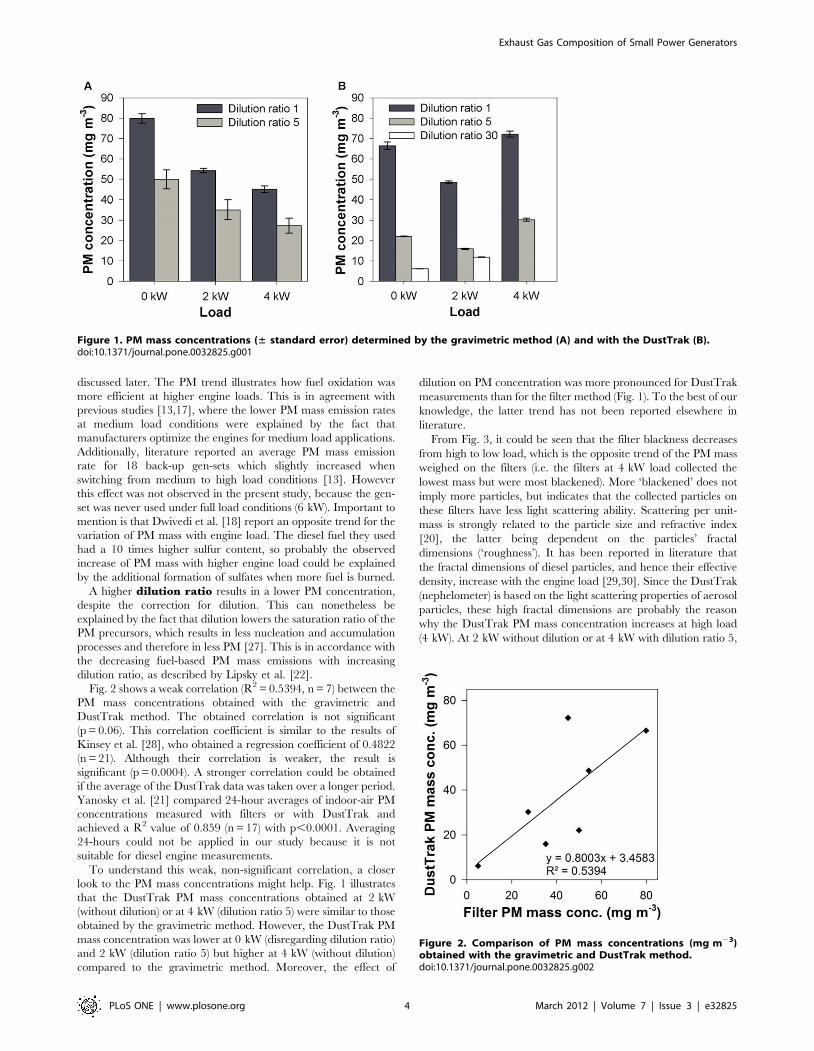
Fig. 2 shows a weak correlation (R2 = 0.5394, n = 7) between the
PM mass concentrations obtained with the gravimetric and
DustTrak method. The obtained correlation is not significant
(p = 0.06). This correlation coefficient is similar to the results of
Kinsey et al. [28], who obtained a regression coefficient of 0.4822
(n = 21). Although their correlation is weaker, the result is
significant (p = 0.0004). A stronger correlation could be obtained
if the average of the DustTrak data was taken over a longer period.
Yanosky et al. [21] compared 24-hour averages of indoor-air PM
concentrations measured with filters or with DustTrak and
achieved a R2 value of 0.859 (n = 17) with p,0.0001. Averaging
24-hours could not be applied in our study because it is not
suitable for diesel engine measurements.
To understand this weak, non-significant correlation, a closer
look to the PM mass concentrations might help. Fig. 1 illustrates
that the DustTrak PM mass concentrations obtained at 2 kW
(without dilution) or at 4 kW (dilution ratio 5) were similar to those
obtained by the gravimetric method. However, the DustTrak PM
mass concentration was lower at 0 kW (disregarding dilution ratio)
and 2 kW (dilution ratio 5) but higher at 4 kW (without dilution)
compared to the gravimetric method. Moreover, the effect of
dilution on PM concentration was more pronounced for DustTrak
measurements than for the filter method (Fig. 1). To the best of our
knowledge, the latter trend has not been reported elsewhere in
literature.
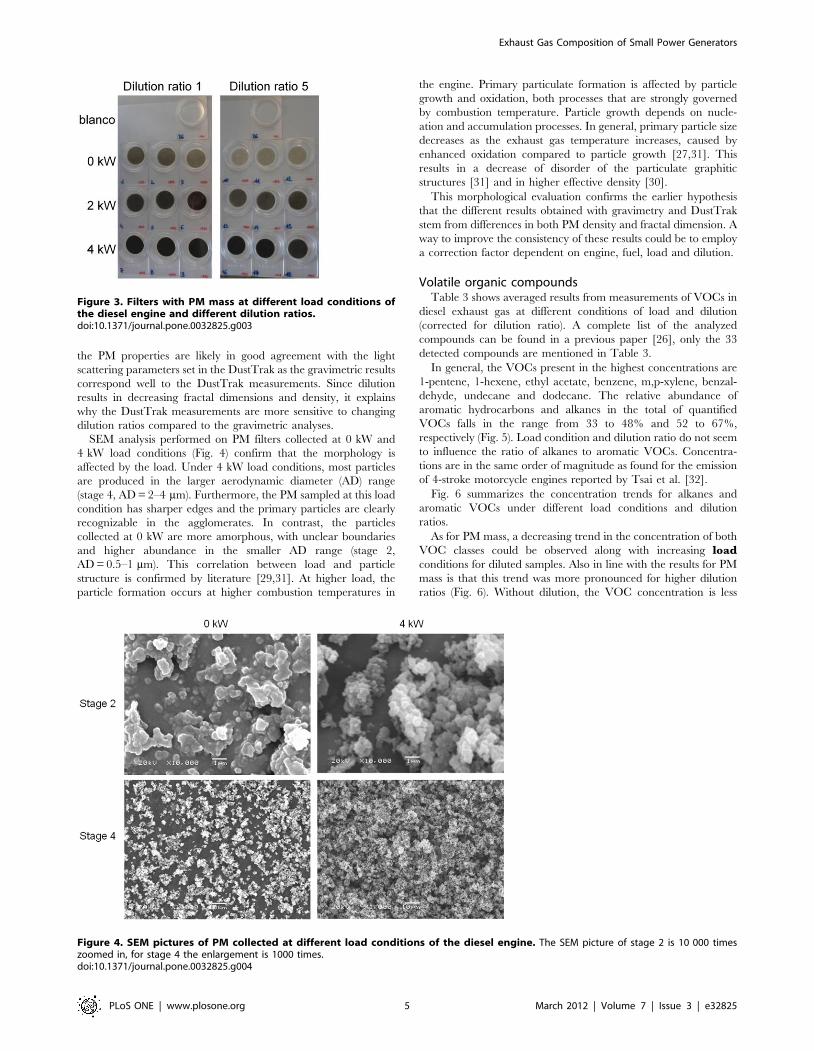
From Fig. 3, it could be seen that the filter blackness decreases
from high to low load, which is the opposite trend of the PM mass
weighed on the filters (i.e. the filters at 4 kW load collected the
lowest mass but were most blackened). More ‘blackened’ does not
imply more particles, but indicates that the collected particles on
these filters have less light scattering ability. Scattering per unit-
mass is strongly related to the particle size and refractive index
[20], the latter being dependent on the particles’ fractal
dimensions (‘roughness’). It has been reported in literature that
the fractal dimensions of diesel particles, and hence their effective
density, increase with the engine load [29,30]. Since the DustTrak
(nephelometer) is based on the light scattering properties of aerosol
particles, these high fractal dimensions are probably the reason
why the DustTrak PM mass concentration increases at high load
(4 kW). At 2 kW without dilution or at 4 kW with dilution ratio 5,
Figure 1. PM mass concentrations (± standard error) determined by the gravimetric method (A) and with the DustTrak (B).doi:10.1371/journal.pone.0032825.g001
Figure 2. Comparison of PM mass concentrations (mg m23)obtained with the gravimetric and DustTrak method.doi:10.1371/journal.pone.0032825.g002
Exhaust Gas Composition of Small Power Generators
PLoS ONE | www.plosone.org 4 March 2012 | Volume 7 | Issue 3 | e32825
the PM properties are likely in good agreement with the light
scattering parameters set in the DustTrak as the gravimetric results
correspond well to the DustTrak measurements. Since dilution
results in decreasing fractal dimensions and density, it explains
why the DustTrak measurements are more sensitive to changing
dilution ratios compared to the gravimetric analyses.
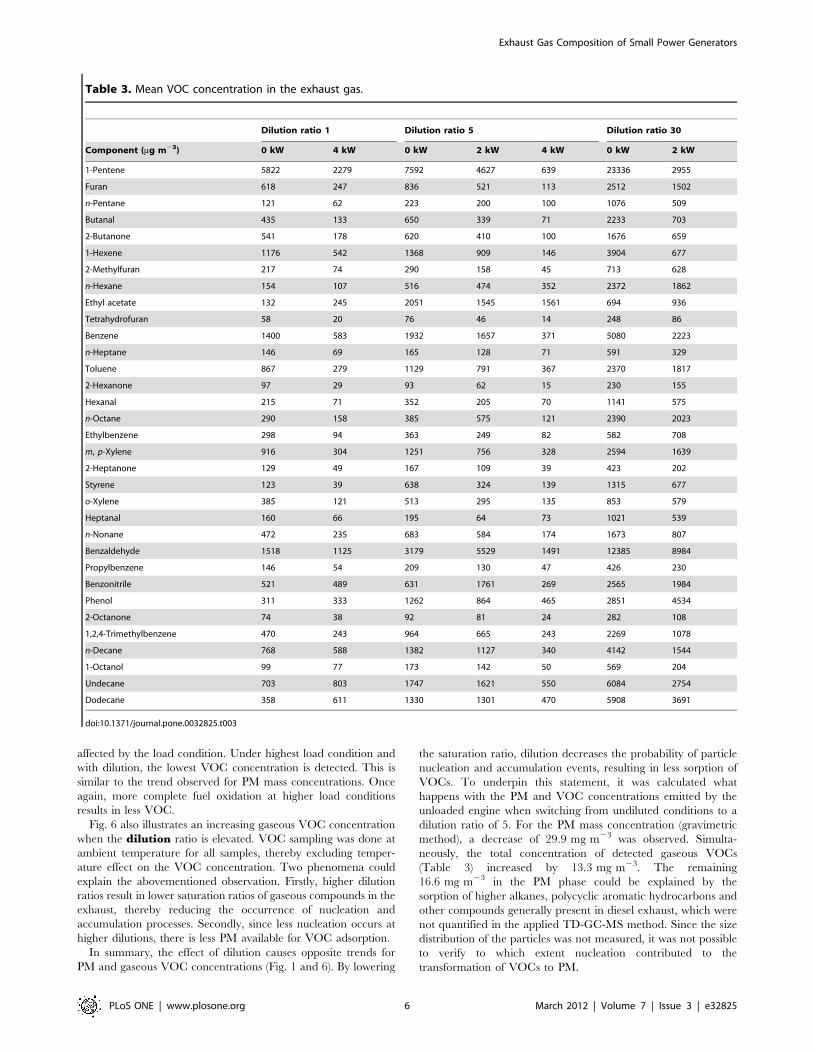
SEM analysis performed on PM filters collected at 0 kW and
4 kW load conditions (Fig. 4) confirm that the morphology is
affected by the load. Under 4 kW load conditions, most particles
are produced in the larger aerodynamic diameter (AD) range
(stage 4, AD = 2–4 mm). Furthermore, the PM sampled at this load
condition has sharper edges and the primary particles are clearly
recognizable in the agglomerates. In contrast, the particles
collected at 0 kW are more amorphous, with unclear boundaries
and higher abundance in the smaller AD range (stage 2,
AD = 0.5–1 mm). This correlation between load and particle
structure is confirmed by literature [29,31]. At higher load, the
particle formation occurs at higher combustion temperatures in
the engine. Primary particulate formation is affected by particle
growth and oxidation, both processes that are strongly governed
by combustion temperature. Particle growth depends on nucle-
ation and accumulation processes. In general, primary particle size
decreases as the exhaust gas temperature increases, caused by
enhanced oxidation compared to particle growth [27,31]. This
results in a decrease of disorder of the particulate graphitic
structures [31] and in higher effective density [30].
This morphological evaluation confirms the earlier hypothesis
that the different results obtained with gravimetry and DustTrak
stem from differences in both PM density and fractal dimension. A
way to improve the consistency of these results could be to employ
a correction factor dependent on engine, fuel, load and dilution.
Volatile organic compoundsTable 3 shows averaged results from measurements of VOCs in
diesel exhaust gas at different conditions of load and dilution
(corrected for dilution ratio). A complete list of the analyzed
compounds can be found in a previous paper [26], only the 33
detected compounds are mentioned in Table 3.
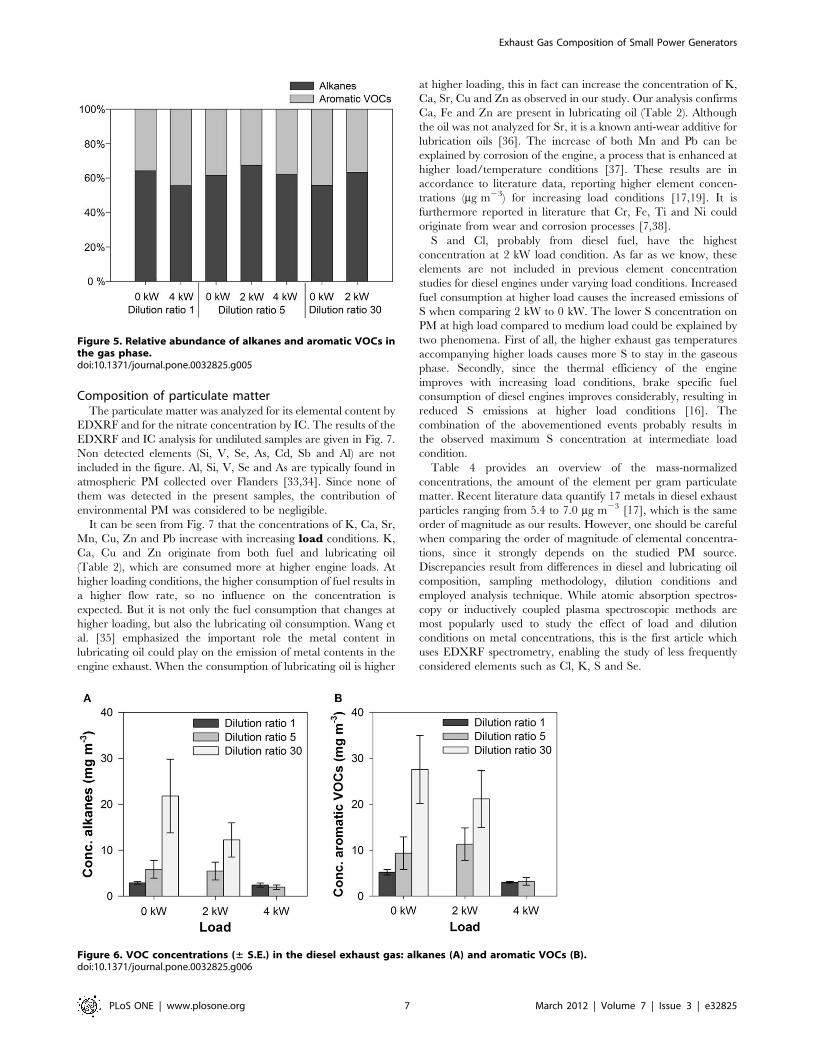
In general, the VOCs present in the highest concentrations are
1-pentene, 1-hexene, ethyl acetate, benzene, m,p-xylene, benzal-
dehyde, undecane and dodecane. The relative abundance of
aromatic hydrocarbons and alkanes in the total of quantified
VOCs falls in the range from 33 to 48% and 52 to 67%,
respectively (Fig. 5). Load condition and dilution ratio do not seem
to influence the ratio of alkanes to aromatic VOCs. Concentra-
tions are in the same order of magnitude as found for the emission
of 4-stroke motorcycle engines reported by Tsai et al. [32].
Fig. 6 summarizes the concentration trends for alkanes and
aromatic VOCs under different load conditions and dilution
ratios.
As for PM mass, a decreasing trend in the concentration of both
VOC classes could be observed along with increasing loadconditions for diluted samples. Also in line with the results for PM
mass is that this trend was more pronounced for higher dilution
ratios (Fig. 6). Without dilution, the VOC concentration is less
Figure 3. Filters with PM mass at different load conditions ofthe diesel engine and different dilution ratios.doi:10.1371/journal.pone.0032825.g003
Figure 4. SEM pictures of PM collected at different load conditions of the diesel engine. The SEM picture of stage 2 is 10 000 timeszoomed in, for stage 4 the enlargement is 1000 times.doi:10.1371/journal.pone.0032825.g004
Exhaust Gas Composition of Small Power Generators
PLoS ONE | www.plosone.org 5 March 2012 | Volume 7 | Issue 3 | e32825
affected by the load condition. Under highest load condition and
with dilution, the lowest VOC concentration is detected. This is
similar to the trend observed for PM mass concentrations. Once
again, more complete fuel oxidation at higher load conditions
results in less VOC.
Fig. 6 also illustrates an increasing gaseous VOC concentration
when the dilution ratio is elevated. VOC sampling was done at
ambient temperature for all samples, thereby excluding temper-
ature effect on the VOC concentration. Two phenomena could
explain the abovementioned observation. Firstly, higher dilution
ratios result in lower saturation ratios of gaseous compounds in the
exhaust, thereby reducing the occurrence of nucleation and
accumulation processes. Secondly, since less nucleation occurs at
higher dilutions, there is less PM available for VOC adsorption.
In summary, the effect of dilution causes opposite trends for
PM and gaseous VOC concentrations (Fig. 1 and 6). By lowering
the saturation ratio, dilution decreases the probability of particle
nucleation and accumulation events, resulting in less sorption of
VOCs. To underpin this statement, it was calculated what
happens with the PM and VOC concentrations emitted by the
unloaded engine when switching from undiluted conditions to a
dilution ratio of 5. For the PM mass concentration (gravimetric
method), a decrease of 29.9 mg m23 was observed. Simulta-
neously, the total concentration of detected gaseous VOCs
(Table 3) increased by 13.3 mg m23. The remaining
16.6 mg m23 in the PM phase could be explained by the
sorption of higher alkanes, polycyclic aromatic hydrocarbons and
other compounds generally present in diesel exhaust, which were
not quantified in the applied TD-GC-MS method. Since the size
distribution of the particles was not measured, it was not possible
to verify to which extent nucleation contributed to the
transformation of VOCs to PM.
Table 3. Mean VOC concentration in the exhaust gas.
Dilution ratio 1 Dilution ratio 5 Dilution ratio 30
Component (mg m23) 0 kW 4 kW 0 kW 2 kW 4 kW 0 kW 2 kW
1-Pentene 5822 2279 7592 4627 639 23336 2955
Furan 618 247 836 521 113 2512 1502
n-Pentane 121 62 223 200 100 1076 509
Butanal 435 133 650 339 71 2233 703
2-Butanone 541 178 620 410 100 1676 659
1-Hexene 1176 542 1368 909 146 3904 677
2-Methylfuran 217 74 290 158 45 713 628
n-Hexane 154 107 516 474 352 2372 1862
Ethyl acetate 132 245 2051 1545 1561 694 936
Tetrahydrofuran 58 20 76 46 14 248 86
Benzene 1400 583 1932 1657 371 5080 2223
n-Heptane 146 69 165 128 71 591 329
Toluene 867 279 1129 791 367 2370 1817
2-Hexanone 97 29 93 62 15 230 155
Hexanal 215 71 352 205 70 1141 575
n-Octane 290 158 385 575 121 2390 2023
Ethylbenzene 298 94 363 249 82 582 708
m, p-Xylene 916 304 1251 756 328 2594 1639
2-Heptanone 129 49 167 109 39 423 202
Styrene 123 39 638 324 139 1315 677
o-Xylene 385 121 513 295 135 853 579
Heptanal 160 66 195 64 73 1021 539
n-Nonane 472 235 683 584 174 1673 807
Benzaldehyde 1518 1125 3179 5529 1491 12385 8984
Propylbenzene 146 54 209 130 47 426 230
Benzonitrile 521 489 631 1761 269 2565 1984
Phenol 311 333 1262 864 465 2851 4534
2-Octanone 74 38 92 81 24 282 108
1,2,4-Trimethylbenzene 470 243 964 665 243 2269 1078
n-Decane 768 588 1382 1127 340 4142 1544
1-Octanol 99 77 173 142 50 569 204
Undecane 703 803 1747 1621 550 6084 2754
Dodecane 358 611 1330 1301 470 5908 3691
doi:10.1371/journal.pone.0032825.t003
Exhaust Gas Composition of Small Power Generators
PLoS ONE | www.plosone.org 6 March 2012 | Volume 7 | Issue 3 | e32825
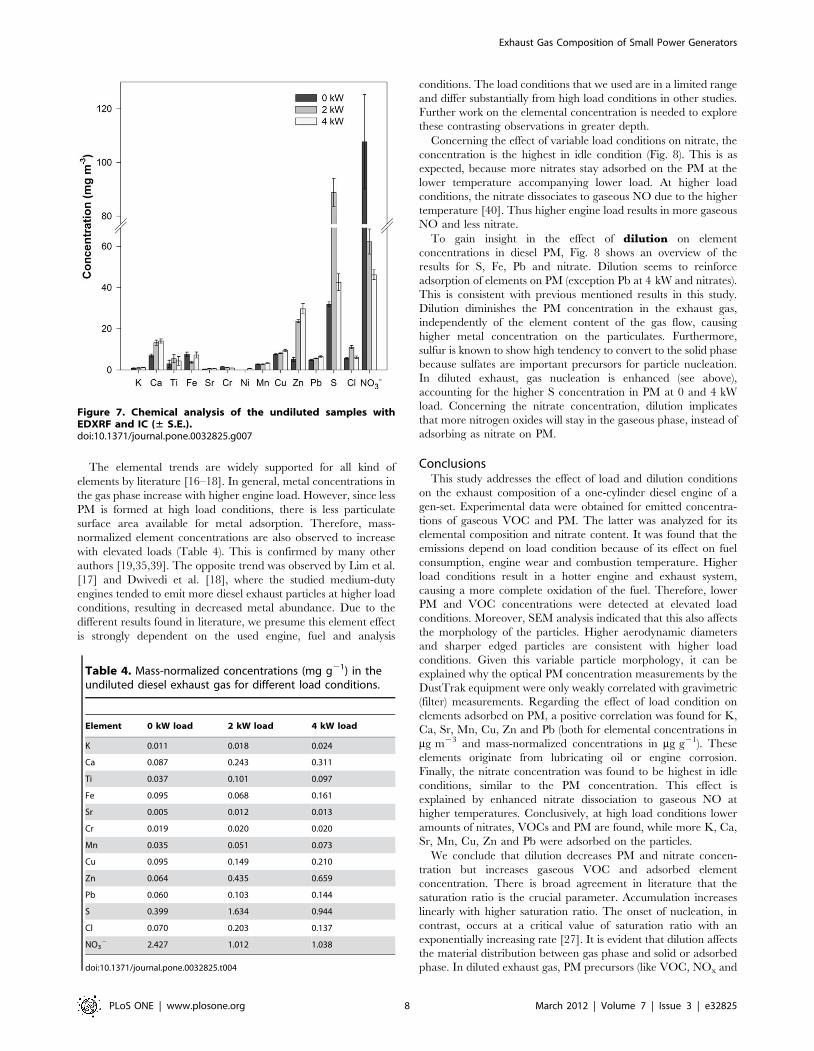
Composition of particulate matterThe particulate matter was analyzed for its elemental content by
EDXRF and for the nitrate concentration by IC. The results of the
EDXRF and IC analysis for undiluted samples are given in Fig. 7.
Non detected elements (Si, V, Se, As, Cd, Sb and Al) are not
included in the figure. Al, Si, V, Se and As are typically found in
atmospheric PM collected over Flanders [33,34]. Since none of
them was detected in the present samples, the contribution of
environmental PM was considered to be negligible.
It can be seen from Fig. 7 that the concentrations of K, Ca, Sr,
Mn, Cu, Zn and Pb increase with increasing load conditions. K,
Ca, Cu and Zn originate from both fuel and lubricating oil
(Table 2), which are consumed more at higher engine loads. At
higher loading conditions, the higher consumption of fuel results in
a higher flow rate, so no influence on the concentration is
expected. But it is not only the fuel consumption that changes at
higher loading, but also the lubricating oil consumption. Wang et
al. [35] emphasized the important role the metal content in
lubricating oil could play on the emission of metal contents in the
engine exhaust. When the consumption of lubricating oil is higher
at higher loading, this in fact can increase the concentration of K,
Ca, Sr, Cu and Zn as observed in our study. Our analysis confirms
Ca, Fe and Zn are present in lubricating oil (Table 2). Although
the oil was not analyzed for Sr, it is a known anti-wear additive for
lubrication oils [36]. The increase of both Mn and Pb can be
explained by corrosion of the engine, a process that is enhanced at
higher load/temperature conditions [37]. These results are in
accordance to literature data, reporting higher element concen-
trations (mg m23) for increasing load conditions [17,19]. It is
furthermore reported in literature that Cr, Fe, Ti and Ni could
originate from wear and corrosion processes [7,38].
S and Cl, probably from diesel fuel, have the highest
concentration at 2 kW load condition. As far as we know, these
elements are not included in previous element concentration
studies for diesel engines under varying load conditions. Increased
fuel consumption at higher load causes the increased emissions of
S when comparing 2 kW to 0 kW. The lower S concentration on
PM at high load compared to medium load could be explained by
two phenomena. First of all, the higher exhaust gas temperatures
accompanying higher loads causes more S to stay in the gaseous
phase. Secondly, since the thermal efficiency of the engine
improves with increasing load conditions, brake specific fuel
consumption of diesel engines improves considerably, resulting in
reduced S emissions at higher load conditions [16]. The
combination of the abovementioned events probably results in
the observed maximum S concentration at intermediate load
condition.
Table 4 provides an overview of the mass-normalized
concentrations, the amount of the element per gram particulate
matter. Recent literature data quantify 17 metals in diesel exhaust
particles ranging from 5.4 to 7.0 mg m23 [17], which is the same
order of magnitude as our results. However, one should be careful
when comparing the order of magnitude of elemental concentra-
tions, since it strongly depends on the studied PM source.
Discrepancies result from differences in diesel and lubricating oil
composition, sampling methodology, dilution conditions and
employed analysis technique. While atomic absorption spectros-
copy or inductively coupled plasma spectroscopic methods are
most popularly used to study the effect of load and dilution
conditions on metal concentrations, this is the first article which
uses EDXRF spectrometry, enabling the study of less frequently
considered elements such as Cl, K, S and Se.
Figure 5. Relative abundance of alkanes and aromatic VOCs inthe gas phase.doi:10.1371/journal.pone.0032825.g005
Figure 6. VOC concentrations (± S.E.) in the diesel exhaust gas: alkanes (A) and aromatic VOCs (B).doi:10.1371/journal.pone.0032825.g006
Exhaust Gas Composition of Small Power Generators
PLoS ONE | www.plosone.org 7 March 2012 | Volume 7 | Issue 3 | e32825
The elemental trends are widely supported for all kind of
elements by literature [16–18]. In general, metal concentrations in
the gas phase increase with higher engine load. However, since less
PM is formed at high load conditions, there is less particulate
surface area available for metal adsorption. Therefore, mass-
normalized element concentrations are also observed to increase
with elevated loads (Table 4). This is confirmed by many other
authors [19,35,39]. The opposite trend was observed by Lim et al.
[17] and Dwivedi et al. [18], where the studied medium-duty
engines tended to emit more diesel exhaust particles at higher load
conditions, resulting in decreased metal abundance. Due to the
different results found in literature, we presume this element effect
is strongly dependent on the used engine, fuel and analysis
conditions. The load conditions that we used are in a limited range
and differ substantially from high load conditions in other studies.
Further work on the elemental concentration is needed to explore
these contrasting observations in greater depth.
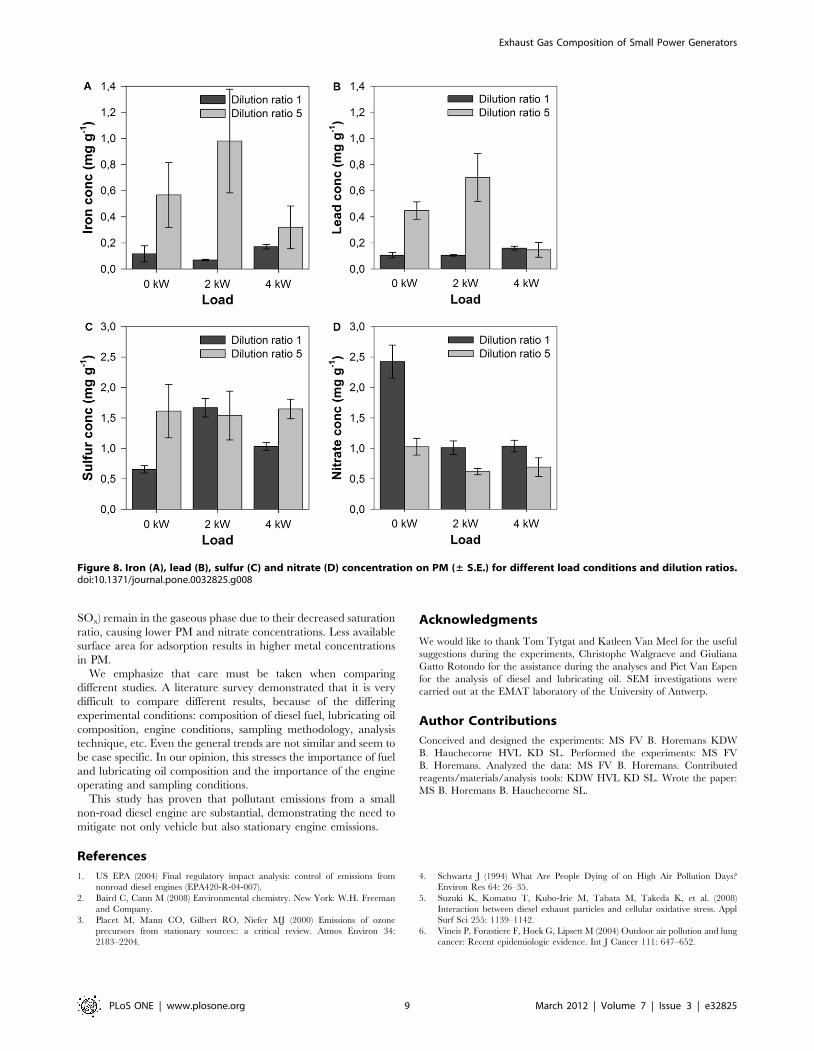
Concerning the effect of variable load conditions on nitrate, the
concentration is the highest in idle condition (Fig. 8). This is as
expected, because more nitrates stay adsorbed on the PM at the
lower temperature accompanying lower load. At higher load
conditions, the nitrate dissociates to gaseous NO due to the higher
temperature [40]. Thus higher engine load results in more gaseous
NO and less nitrate.
To gain insight in the effect of dilution on element
concentrations in diesel PM, Fig. 8 shows an overview of the
results for S, Fe, Pb and nitrate. Dilution seems to reinforce
adsorption of elements on PM (exception Pb at 4 kW and nitrates).
This is consistent with previous mentioned results in this study.
Dilution diminishes the PM concentration in the exhaust gas,
independently of the element content of the gas flow, causing
higher metal concentration on the particulates. Furthermore,
sulfur is known to show high tendency to convert to the solid phase
because sulfates are important precursors for particle nucleation.
In diluted exhaust, gas nucleation is enhanced (see above),
accounting for the higher S concentration in PM at 0 and 4 kW
load. Concerning the nitrate concentration, dilution implicates
that more nitrogen oxides will stay in the gaseous phase, instead of
adsorbing as nitrate on PM.
ConclusionsThis study addresses the effect of load and dilution conditions
on the exhaust composition of a one-cylinder diesel engine of a
gen-set. Experimental data were obtained for emitted concentra-
tions of gaseous VOC and PM. The latter was analyzed for its
elemental composition and nitrate content. It was found that the
emissions depend on load condition because of its effect on fuel
consumption, engine wear and combustion temperature. Higher
load conditions result in a hotter engine and exhaust system,
causing a more complete oxidation of the fuel. Therefore, lower
PM and VOC concentrations were detected at elevated load
conditions. Moreover, SEM analysis indicated that this also affects
the morphology of the particles. Higher aerodynamic diameters
and sharper edged particles are consistent with higher load
conditions. Given this variable particle morphology, it can be
explained why the optical PM concentration measurements by the
DustTrak equipment were only weakly correlated with gravimetric
(filter) measurements. Regarding the effect of load condition on
elements adsorbed on PM, a positive correlation was found for K,
Ca, Sr, Mn, Cu, Zn and Pb (both for elemental concentrations in
mg m23 and mass-normalized concentrations in mg g21). These
elements originate from lubricating oil or engine corrosion.
Finally, the nitrate concentration was found to be highest in idle
conditions, similar to the PM concentration. This effect is
explained by enhanced nitrate dissociation to gaseous NO at
higher temperatures. Conclusively, at high load conditions lower
amounts of nitrates, VOCs and PM are found, while more K, Ca,
Sr, Mn, Cu, Zn and Pb were adsorbed on the particles.
We conclude that dilution decreases PM and nitrate concen-
tration but increases gaseous VOC and adsorbed element
concentration. There is broad agreement in literature that the
saturation ratio is the crucial parameter. Accumulation increases
linearly with higher saturation ratio. The onset of nucleation, in
contrast, occurs at a critical value of saturation ratio with an
exponentially increasing rate [27]. It is evident that dilution affects
the material distribution between gas phase and solid or adsorbed
phase. In diluted exhaust gas, PM precursors (like VOC, NOx and
Figure 7. Chemical analysis of the undiluted samples withEDXRF and IC (± S.E.).doi:10.1371/journal.pone.0032825.g007
Table 4. Mass-normalized concentrations (mg g21) in theundiluted diesel exhaust gas for different load conditions.
Element 0 kW load 2 kW load 4 kW load
K 0.011 0.018 0.024
Ca 0.087 0.243 0.311
Ti 0.037 0.101 0.097
Fe 0.095 0.068 0.161
Sr 0.005 0.012 0.013
Cr 0.019 0.020 0.020
Mn 0.035 0.051 0.073
Cu 0.095 0.149 0.210
Zn 0.064 0.435 0.659
Pb 0.060 0.103 0.144
S 0.399 1.634 0.944
Cl 0.070 0.203 0.137
NO32 2.427 1.012 1.038
doi:10.1371/journal.pone.0032825.t004
Exhaust Gas Composition of Small Power Generators
PLoS ONE | www.plosone.org 8 March 2012 | Volume 7 | Issue 3 | e32825
SOx) remain in the gaseous phase due to their decreased saturation
ratio, causing lower PM and nitrate concentrations. Less available
surface area for adsorption results in higher metal concentrations
in PM.
We emphasize that care must be taken when comparing
different studies. A literature survey demonstrated that it is very
difficult to compare different results, because of the differing
experimental conditions: composition of diesel fuel, lubricating oil
composition, engine conditions, sampling methodology, analysis
technique, etc. Even the general trends are not similar and seem to
be case specific. In our opinion, this stresses the importance of fuel
and lubricating oil composition and the importance of the engine
operating and sampling conditions.
This study has proven that pollutant emissions from a small
non-road diesel engine are substantial, demonstrating the need to
mitigate not only vehicle but also stationary engine emissions.
Acknowledgments
We would like to thank Tom Tytgat and Katleen Van Meel for the useful
suggestions during the experiments, Christophe Walgraeve and Giuliana
Gatto Rotondo for the assistance during the analyses and Piet Van Espen
for the analysis of diesel and lubricating oil. SEM investigations were
carried out at the EMAT laboratory of the University of Antwerp.
Author Contributions
Conceived and designed the experiments: MS FV B. Horemans KDW
B. Hauchecorne HVL KD SL. Performed the experiments: MS FV
B. Horemans. Analyzed the data: MS FV B. Horemans. Contributed
reagents/materials/analysis tools: KDW HVL KD SL. Wrote the paper:
MS B. Horemans B. Hauchecorne SL.
References
1. US EPA (2004) Final regulatory impact analysis: control of emissions from
nonroad diesel engines (EPA420-R-04-007).
2. Baird C, Cann M (2008) Environmental chemistry. New York: W.H. Freeman
and Company.
3. Placet M, Mann CO, Gilbert RO, Niefer MJ (2000) Emissions of ozone
precursors from stationary sources:: a critical review. Atmos Environ 34:
2183–2204.
4. Schwartz J (1994) What Are People Dying of on High Air Pollution Days?
Environ Res 64: 26–35.
5. Suzuki K, Komatsu T, Kubo-Irie M, Tabata M, Takeda K, et al. (2008)
Interaction between diesel exhaust particles and cellular oxidative stress. Appl
Surf Sci 255: 1139–1142.
6. Vineis P, Forastiere F, Hoek G, Lipsett M (2004) Outdoor air pollution and lung
cancer: Recent epidemiologic evidence. Int J Cancer 111: 647–652.
Figure 8. Iron (A), lead (B), sulfur (C) and nitrate (D) concentration on PM (± S.E.) for different load conditions and dilution ratios.doi:10.1371/journal.pone.0032825.g008
Exhaust Gas Composition of Small Power Generators
PLoS ONE | www.plosone.org 9 March 2012 | Volume 7 | Issue 3 | e32825
7. Docekal B, Krivan V, Pelz N (1992) Trace and minor element characterization
of diesel soot. Fresen J Anal Chem 343: 873–878.8. Verma V, Shafer MM, Schauer JJ, Sioutas C (2010) Contribution of transition
metals in the reactive oxygen species activity of PM emissions from retrofitted
heavy-duty vehicles. Atmos Environ 44: 5165–5173.9. Kittelson DB, Watts WF, Johnson JP (2006) On-road and laboratory evaluation
of combustion aerosols–Part1: Summary of diesel engine results. J Aerosol Sci37: 913–930.
10. Chung A, Lall AA, Paulson SE (2008) Particulate emissions by a small non-road
diesel engine: Biodiesel and diesel characterization and mass measurementsusing the extended idealized aggregates theory. Atmos Environ 42: 2129–2140.
11. Kittelson DB (1998) Engines and nanoparticles: A review. J Aerosol Sci 29:575–588.
12. Sarvia A, Fogelholm CJ, Zevenhoven R (2008) Emissions from large-scalemedium-speed diesel engines: 1. Influence of engine operation mode and
turbocharger. Fuel Process Technol 89: 510–519.
13. Shah SD, Cocker DR, Johnson KC, Lee JM, Soriano BL, et al. (2006) Emissionsof regulated pollutants from in-use diesel back-up generators. Atmos Environ 40:
4199–4209.14. Neer A, Koylu UO (2006) Effect of operating conditions on the size,
morphology, and concentration of submicrometer particulates emitted from a
diesel engine. Combust Flame 146: 142–154.15. Obuchi A, Ohi A, Aoyama H, Ohuchi H (1987) Evaluation of gaseous and
particulate emission characteristics of a single cylinder diesel engine. CombustFlame 70: 215–224.
16. Sharma M, Agarwal AK, Bharathi KVL (2005) Characterization of exhaustparticulates from diesel engine. Atmos Environ 39: 3023–3028.
17. Lim J, Lim C, Yu LE (2009) Composition and size distribution of metals in diesel
exhaust particulates. J Environ Monit 11: 1614–1621.18. Dwivedi D, Agarwal AK, Sharma M (2006) Particulate emission characteriza-
tion of a biodiesel vs diesel-fuelled compression ignition transport engine: Acomparative study. Atmos Environ 40: 5586–5595.
19. Betha R, Balasubramanian R (2011) Emissions of particulate-bound elements
from stationary diesel engine: Characterization and risk assessment. AtmosEnviron 45: 5273–5281.
20. Moosmuller H, Arnott WP, Rogers CF, Bowen JL, Gillies JA, et al. (2001) Timeresolved characterization of diesel particulate emissions. 1. Instruments for
particle mass measurements. Environ Sci Technol 35: 781–787.21. Yanosky JD, Williams PL, MacIntosh DL (2002) A comparison of two direct-
reading aerosol monitors with the federal reference method for PM2.5 in indoor
air. Atmos Environ 36: 107–113.22. Lipsky EM, Robinson AL (2005) Effects of Dilution on Fine Particle Mass and
Partitioning of Semivolatile Organics in Diesel Exhaust and Wood Smoke.Environ Sci Technol 40: 155–162.
23. Khalek AI, Kittelson DB, Graskow BR, Wei Q, Bear F (1998) Diesel exhaust
particle size: measurement issues and trends. SAE paper.24. Horemans B, Worobiec A, Buczynska A, Van Meel K, Van Grieken R (2008)
Airborne particulate matter and BTEX in office environments. J Environ Monit10: 867–876.
25. Spolnik Z, Belikov K, Van Meel K, Adriaenssens E, De Roeck F, et al. (2005)
Optimization of measurement conditions of an energy dispersive X-rayfluorescence spectrometer with high-energy polarized beam excitation for
analysis of aerosol filters. Appl Spectrosc 59: 1465–1469.
26. Demeestere K, Dewulf J, De Roo K, De Wispelaere P, Van Langenhove H(2008) Quality control in quantification of volatile organic compounds analysed
by thermal desorption-gas chromatography-mass spectrometry. J Chromatogr A1186: 348–357.
27. Kittelson DB, Arnold M, Watts WF (1999) Review of diesel particulate matter
sampling methods. Final report.28. Kinsey JS, Mitchell WA, Squier WC, Linna K, King FG, et al. (2006)
Evaluation of methods for the determination of diesel-generated fine particulatematter: Physical characterization results. J Aerosol Sci 37: 63–87.
29. Zhu J, Lee KO, Yozgatligil A, Choi MY (2005) Effects of engine operatingconditions on morphology, microstructure, and fractal geometry of light-duty
diesel engine particulates. P Combust Inst 30: 2781–2789.
30. Olfert JS, Symonds JPR, Collings N (2007) The effective density and fractaldimension of particles emitted from a light-duty diesel vehicle with a diesel
oxidation catalyst. J Aerosol Sci 38: 69–82.31. Lee KO, Cole R, Sekar R, Choi MY, Kang JS, et al. (2002) Morphological
investigation of the microstructure, dimensions, and fractal geometry of diesel
particulates. P Combust Inst 29: 647–653.32. Tsai JH, Chiang HL, Hsu YC, Weng HC, Yang CY (2003) The speciation of
volatile organic compounds (VOCs) from motorcycle engine exhaust at differentdriving modes. Atmos Environ 37: 2485–2496.
33. Vercauteren J, Matheeussen C, Wauters E, Roekens E, van Grieken R, et al.(2011) Chemkar PM10: An extensive look at the local differences in chemical
composition of PM10 in Flanders, Belgium. Atmos Environ 45: 108–116.
34. Kunzli N, Mudway IS, Gotschi T, Shi T, Kelly FJ, et al. (2005) Comparison ofoxidative properties, light absorbance, and total and elemental mass concen-
tration of ambient PM2.5 collected at 20 European sites. Environ HealthPerspect 114.
35. Wang YF, Huang KL, Li CT, Mi HH, Luo JH, et al. (2003) Emissions of fuel
metals content from a diesel vehicle engine. Atmos Environ 37: 4637–4643.36. Mansot JL, Golabkan V, Romana L, Bilas P, Alleman E, et al. (2004)
Tribological and physicochemical characterization of strontium colloidaladditives in mild wear regime. Colloid Surface A 243: 67–77.
37. Singh SK, Agarwal AK, Sharma M (2006) Experimental investigations of heavymetal addition in lubricating oil and soot deposition in an EGR operated engine.
Appl Therm Eng 26: 259–266.
38. Yaroshchyk P, Morrison RJS, Body D, Chadwick BL (2005) Quantitativedetermination of wear metals in engine oils using LIBS: The use of paper
substrates and a comparison between single- and double-pulse LIBS. Spectro-chimica Acta Part B: Atomic Spectroscopy 60: 1482–1485.
39. Zhang J, He K, Shi X, Zhao Y (2011) Comparison of particle emissions from an
engine operating on biodiesel and petroleum diesel. Fuel 90: 2089–2097.40. Khoder MI (2002) Atmospheric conversion of sulfur dioxide to particulate
sulfate and nitrogen dioxide to particulate nitrate and gaseous nitric acid in anurban area. Chemosphere 49: 675–684.
Exhaust Gas Composition of Small Power Generators
PLoS ONE | www.plosone.org 10 March 2012 | Volume 7 | Issue 3 | e32825