Embed Size (px)
Citation preview
Economically Driven Simulation of Regional Water Systems:Friant-Kern, California
Guilherme F. Marques1; Jay R. Lund2; Mark R. Leu3; Marion Jenkins4; Richard Howitt5; Thomas Harter6;Steve Hatchett7; Nels Ruud8; and Susan Burke9
Abstract: This paper develops and applies an economically driven simulation model for California’s Friant-Kern system, a regioncharacterized by diverse water sources employed predominantly for commercial irrigated agriculture, with significant local water tradingactivity. The economic-engineering simulation approach highlights the importance of representing user economic decisions for watersystems in a context of complex physical and infrastructure systems dominated by economic water uses. The model simulates how waterusers conserve, select supplies and make water exchange and market decisions in response to water costs and availability, and providesestimates of economic and operational impacts of alternative policies for the Friant-Kern system. Results show that high surface waterprices cause farmers to pump more groundwater, disturbing an existing conjunctive use system and aggravating regional groundwateroverdraft.
DOI: 10.1061/�ASCE�0733-9496�2006�132:6�468�
CE Database subject headings: Water management; Simulation; Agriculture; Economic factors.
Introduction
Water resource systems are operated to provide water, food,power, transportation, recreation, and environmental protection�e.g., instream flows�. Users who employ water to produce theseoutputs are organized as farms, commercial enterprises, house-holds, and industries operating under market conditions for eco-nomic objectives.
Engineering simulation models commonly support decision
1Assistant Professor, Academic Dept. of Civil Engineering, CentroFederal de Educação Tecnológica, CEFET-MG Av. Amazonas, 7675,Belo Horizonte—Minas Gerais, Brazil 30510-000. E-mail: [email protected]
2Professor, Dept. of Civil and Environmental Engineering, Univ. ofCalifornia, Davis, CA 95616. E-mail: [email protected]
3Consultant, CH2MHILL, 2485 Natomas Park Dr., Suite 600,Sacramento, CA 95833-2937. E-mail: [email protected]
4Professional Research Engineer, Dept. of Civil and EnvironmentalEngineering, Univ. of California, Davis, CA 95616. E-mail: [email protected]
5Professor, Dept. of Agricultural and Resource Economics, Univ. ofCalifornia, Davis, CA 95616. E-mail: [email protected]
6Associate Cooperative Extension Specialist, Dept. of Land, Air, andWater Resources, Univ. of California, Davis, CA 95616. E-mail:[email protected]
7Consultant, Western Resource Economics.8Consultant, Fugro West, 3738 Ruffin Road, San Diego, CA 92123.
E-mail: [email protected] Economist, Northern Economics Inc., 1801 Roeder Ave.,
Bellingham, WA 98225-2257.Note. Discussion open until April 1, 2007. Separate discussions must
be submitted for individual papers. To extend the closing date by onemonth, a written request must be filed with the ASCE Managing Editor.The manuscript for this paper was submitted for review and possiblepublication on September 30, 2003; approved on October 21, 2005. Thispaper is part of the Journal of Water Resources Planning and Manage-ment, Vol. 132, No. 6, November 1, 2006. ©ASCE, ISSN 0733-9496/
2006/6-468–479/$25.00.468 / JOURNAL OF WATER RESOURCES PLANNING AND MANAGEMENT
making and water management, representing storage and convey-ance operations as well as physical, chemical, and biological pro-cesses. Models designed to simulate economic behavior have longincluded price-quantity relationships �Samuelson 1952; Takayamaand Judge 1964; Dupuit 1844�. In water management, employingprice-quantity relationships to drive water use decisions can im-prove engineering simulation of water systems and provide betterinsight regarding engineering operations such as water sourcechoice, water transfers, reservoir operation, and conjunctive useof surface and groundwater, and their economic impacts. Eco-nomic demands for water express water users’ behavior and re-actions to variations in water cost, availability, reliability, andtechnology. Water users commonly make decisions on water usequantity and supply sources, and in some regions users interact inwater markets, exchanges, and pricing schemes involving mul-tiple sources for mutual profit and benefit �Vaux 1986�.
Many economic models of water management, while properlyrepresenting the economic nature of water demands, have ratherlimited representation of the diverse water availability and opera-tion decisions occurring spatially and temporally in complex sys-tems �Burt 1964; Young and Bredehoeft 1972; Vaux and Howitt1984; McCarl et al. 1999; Gillig et al. 2001�. On the other hand,traditional engineering simulation models for water managementand operations typically represent water demands noneconomi-cally as requirements or strict priorities �Sigvaldason 1976;Chung et al. 1989; Andrews et al. 1992; Dai and Labadie 2001�.In some situations �e.g., systems dominated by economic wateruses�, it can be useful for engineering models to simulate theeconomic behavior of water users, including their selection ofsupply sources, water allocation decisions, and water conserva-tion measures in response to complex water cost, availability, andtechnology conditions.
This work combines economic representation of water de-mands with simulation of complex physical and infrastructurewater system within a contemporary engineering water resources
model, MODSIM �Labadie 1995�. This approach should provide© ASCE / NOVEMBER/DECEMBER 2006
engineers and water planners with a more integrated understand-ing of the physical, infrastructure, and economic aspects of com-plex water systems and a tool to estimate the economic andoperational impacts of various policy alternatives for a systemdriven by water users’ economic decisions.
The model simulates surface and groundwater use decisionsfor agricultural production, surface water contract structure, sur-face water allocation, exchanges and surface reservoir operation,and groundwater pumping cost variations as function volumespumped. The method is applied to investigate how changes insurface water pricing affect operational decisions of water supplymix and conjunctive use of surface and groundwater in the Friant-Kern region of California’s Central Valley. Results illustrate thevalue of this combined economic and engineering approach forexamining water scarcity and scarcity costs of specific water man-agement policies, such as surface water and groundwater prices.
The paper begins with a review of regional water system mod-eling approaches. This is followed by the theory of water systemsimulation driven by economic demands and application to theFriant-Kern agricultural region in California’s Central Valley.Friant-Kern is predominantly occupied by commercial irrigatedagriculture, and water users there often employ multiple watersources and engage in water exchanges and markets. The “Re-sults” section evaluates the impacts of changes in groundwaterpumping costs and surface water prices on surface and conjunc-tive use operations. Final sections discuss model limitations,promising extensions, and conclusions.
Regional Water System Simulation: Priority-Basedand Economically Driven Modeling
Simulation models have long allowed analysts to represent watersystem components and operations and to efficiently evaluate dif-ferent proposed operational strategies �Humphrey and Allan 1959;Labadie 1997�. Real systems operate based on diverse arrange-ments, including water rights, environmental laws, and economicrelationships. For system simulation, computer models often rep-resent such idiosyncratic rules either explicitly or implicitly byusing mathematical programming to operate and allocate wateraccording to a set of operational priorities �Labadie 1997�. Simu-lation models based on mathematical programming can connectmany system components in a single model and easily representdiverse goals that drive system operation through priorities oreconomic demands. To simulate a desired water allocation, opera-tions and demands can be prioritized through positive/negativeunit costs and upper/lower bounds on links. Simulation modelsbased on this approach perform sequential, short-term optimiza-tions that minimize deviations from defined goals, with resultsfrom one time step serving as initial conditions for the next timestep.
Sigvaldason �1976� represented predefined reservoir operationrules with priorities to capture operator decisions to simulate alarge multi-reservoir system. Penalties were assessed on devia-tions from predefined ideal conditions. A large California systemwas simulated similarly in Chung et al. �1989� to estimate wateroperations with priority-based water rights. To simulate moreelaborate systems in which users have different rights dependingon the water source, Andrews et al. �1992� applied a network flowoptimization model that allocates water sources sequentially, indifferent layers according to respective users’ access and rights.For such sequential priority optimization approaches, other mod-
els can be used between time steps or interactively to representJOURNAL OF WATER RESOURCES PLANNING
specific components, such as groundwater, �Andreu et al. 1996;Fredericks et al. 1998� and water quality �Dai and Labadie 2001�,in greater detail. These priority schemes must be able to representoperations under varied conditions with multiple users, a difficulttask for large systems in which operations involve gains andlosses �i.e., canal losses, return flows�. Labadie �1995� developeda generalized network flow model �MODSIM� that avoids thisproblem by considering gains and losses indirectly in a separate,iterative flow calculation algorithm. Israel and Lund �1999� pro-posed a generalized linear programming algorithm to determinepriority-based unit costs for network flow models with gains tocorrectly reproduce the desired operating priorities. These engi-neering models represent the diverse, often complex topology ofwater systems but are limited in capturing the real behavior be-hind water use decisions in a system that is largely economicallydriven. The model presented in this paper incorporates economicwater demand information to improve representation of users’behavior and simulation of operations and impacts for complexwater systems driven by economic motivations.
Economic representations of water demands have been appliedwith stochastic dynamic programming to maximize the expectedpresent value benefits of water allocation and conjunctive useoperations �Burt 1964� and with sequential linear programming tosimulate response of irrigation water users to variations in watersupply and cost coupled with a hydrologic stream-aquifer model�Young and Bredehoeft 1972�. Vaux and Howitt �1984� estimatesupply and demand functions for a spatial equilibrium model toevaluate interregional water trade benefits in agricultural regionsof California. McCarl et al. �1999� and Gillig et al. �2001� applytwo-stage discrete stochastic programming to simulate water usechoices, irrigated versus dryland production, and irrigation tech-nology with economic agricultural demands developed separatelyby linear programming models. These models seek to internallyrepresent economic benefits of agricultural water use and then toevaluate economic outcomes of different water management strat-egies. However, such economic models seldom fully representwater availability in complex systems and users’ access to mul-tiple water supplies. Young and Bredehoeft �1972� allocate waterto crops to maximize incremental net revenue, but in their analy-sis water constraints remain determined by priorities and pre-defined fixed cost penalties are used to quantify failure to meetdemands. Gillig et al. �2001� categorize crop water demands bysources of water supply and do not allow supply source substitu-tion. The model presented in this paper broadens such economicanalysis by simulating a diverse complex of 36 irrigation districtswith explicit representation of 17 water sources, 17 reservoirs andaquifers, numerous conveyance and recharge facilities, watertransfer and conjunctive use operations, and operating costs forthese facilities. Along with operations and water use decisionsimulation, the model tracks groundwater storage, head, andpumping cost sequentially based on subsurface physical proper-ties and hydrology, reflecting previous decisions on groundwateruse.
The model’s agricultural water demands are developed with aneconomic optimization model calibrated to observed data. Theeconomic water demands are embedded in an engineering opera-tions simulation model �MODSIM� to represent and drive users’economic motivation for water use, source selection, and localwater market activities. This economically driven simulation ex-tends now-common priority-based simulation to systems drivenby local water user decisions, extends existing economic model-ing to more diverse water supply decisions and complex infra-
structure systems, and should be useful for estimating economicAND MANAGEMENT © ASCE / NOVEMBER/DECEMBER 2006 / 469
and operational impacts of various policy alternatives in systemsin which users optimize water use based on economic value. Inintensely developed systems in which water is scarce, such asCalifornia’s Friant-Kern system, extensive conjunctive use opera-tions, water transfers, and exchanges already exist, and it is im-portant that the simulation models applied are able to representusers’ economic water use decisions in a context of complexphysical and infrastructure systems.
Friant-Kern System, California
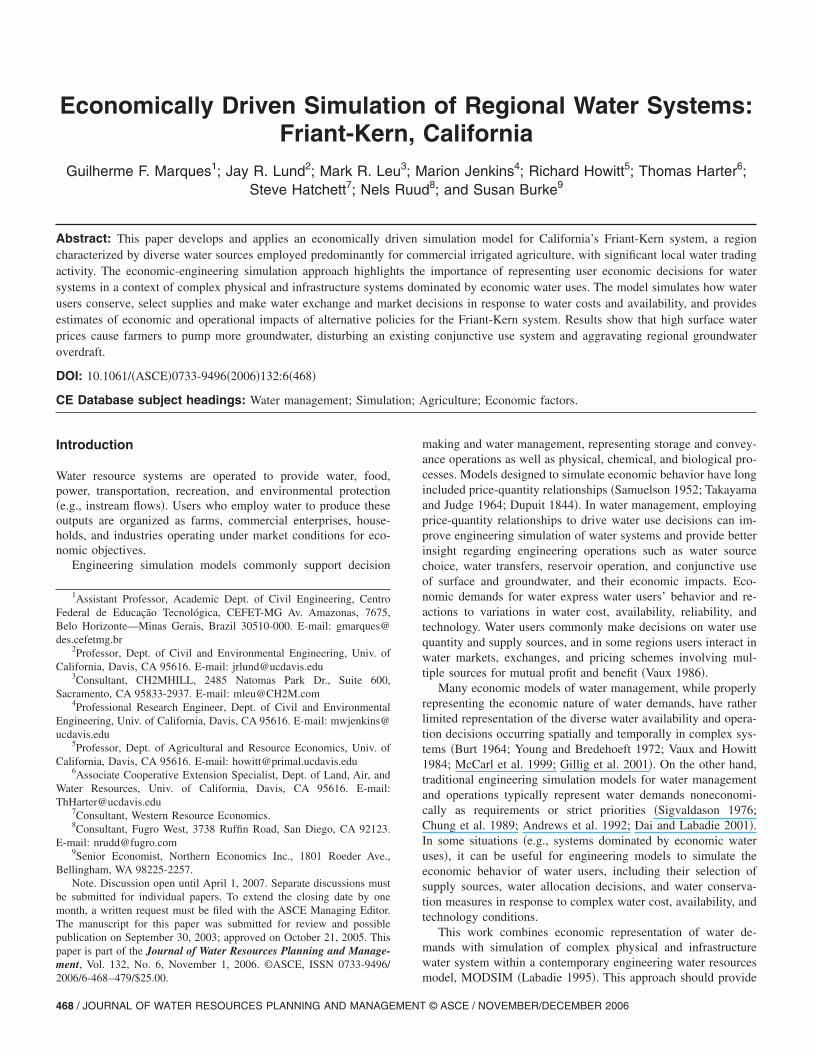
The Friant-Kern Division is a U.S. Bureau of Reclamation�USBR� project that includes irrigation and water utility districtslocated in California’s Tulare Basin, with over 400,000 ha of ir-rigable farmland on the east side of the southern San JoaquinValley. The districts have access to surface water through USBR’sFriant project infrastructure, whose main components are FriantDam �Millerton Lake� on the San Joaquin River, with 640 hm3 ofcapacity; the Friant-Kern Canal; and the Madera Canal �Fig. 1�.Friant Dam is operated for water supply, environmental conser-vation, flood control, and recreation. Other supplies includegroundwater and substantial local surface supplies from the Tule,Kings, Kaweah, and Kern rivers. Groundwater is important forthe region, and its intensive use has led to aquifer overdraft, landsubsidence, salinization, increasing groundwater pumping costs,and encroachment of poor quality groundwater into actively ex-ploited portions of aquifers �CDWR 2003�. Historically, this over-draft has provided water supply for the Central Valley’s economicdevelopment and now provides dewatered storage space for waterbanking programs and conjunctive operations with surface water�Brown et al. 2001�. However, this exploitation pattern may in-crease adverse impacts if groundwater use is not considered inte-grally in water management efforts. Conjunctive use motivatedthe development of a model to simulate the behavior of waterusers in the region, including how they react to system policy andcost changes, and to evaluate overall effects on system operationsand policies.
Surface Water Operations
Thirty-six irrigation and water districts have water supply con-
Fig. 1. Friant-Kern System, California
tracts with USBR in which water deliveries are classified by re-
470 / JOURNAL OF WATER RESOURCES PLANNING AND MANAGEMENT
liability. The first 800,000 acre-ft �986 hm3� are termed Class 1water and are considered the most reliable. The next1,400,000 acre-ft �1,726 hm3� are Class 2. Supplies beyond Class2 �usually winter surplus or flood control releases� are deliveredupon availability. Class 1 water is contracted at $44/acre-ft�$0.036/m3�, and Class 2 at $34/acre-ft �$0.028/m3� �Leu 2001�.Forecasts of annual runoff are made in March and updatedthroughout the irrigation season. If water is insufficient to fulfillthe contracts, each contractor’s allocation is reduced proportion-ally. At the end of the water year the delivery accounts are reset tozero �Leu 2001�.
Instream Flows
The only substantial instream flow for this system is downstreamof Millerton Dam. Much of the San Joaquin River has beenlargely dewatered by the Friant-Kern project. A small minimumflow requirement downstream of Millerton Reservoir is the onlyrequired outflow from the system. Other streams in the regionterminate in the Tulare Basin floor, a closed basin except in timesof extreme flooding.
Economic Demands in Simulation: Theoryand Method
Water use operations and allocations often are guided by water’seconomic value. Water users face withdrawal decisions related tothe spatial and temporal availability of water and production de-cisions. Under these circumstances the marginal value of waterincreases with scarcity and water demands reflect users’ deci-sions. If users are not limited by water availability and price andthere is no alternative use for water, water’s marginal value iszero.
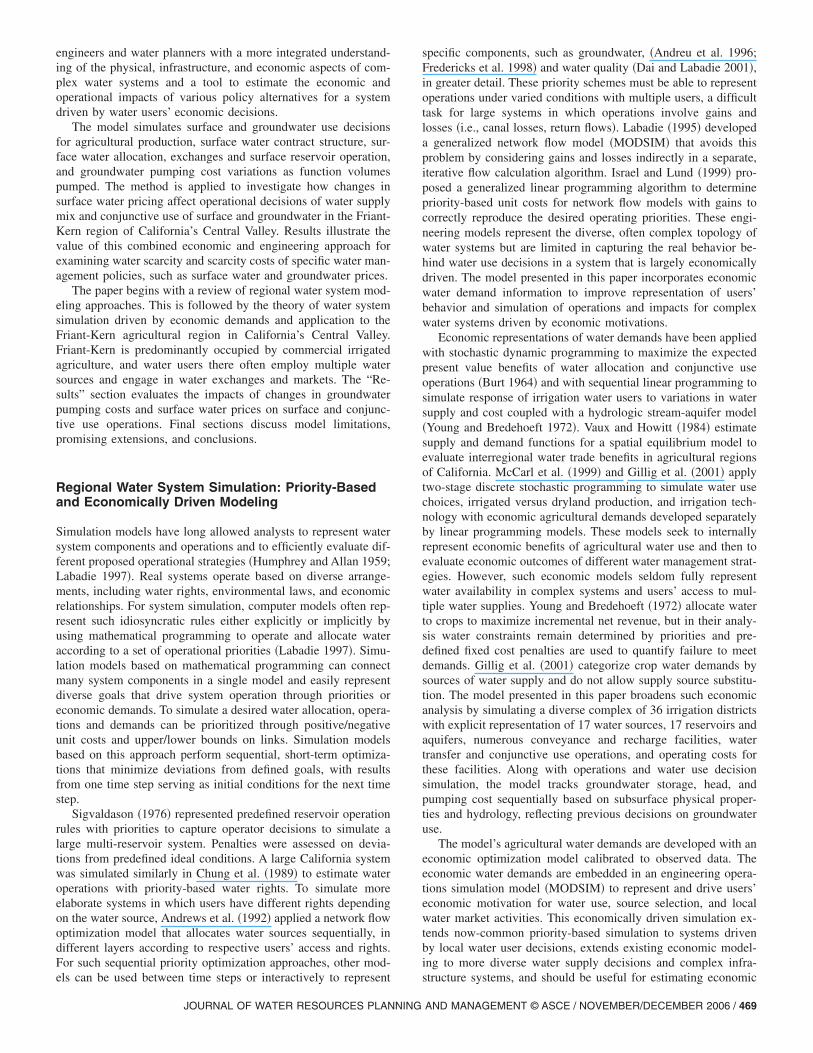
Based on economic values and costs, users decide on bothsupply source and quantity of use. Unless constrained in avail-ability, water will be used to a point at which the marginal benefitfrom water use equals the marginal cost of supply. An economi-cally driven simulation model captures this behavior using eco-nomic water demand curves to represent the marginal net benefitsof water use and users’ willingness-to-pay for water �Fig. 2�.The water scarcity quantity represents the difference between de-liveries and beneficial use if supplies were unrestricted and free�Jenkins et al. 2004�. Economic scarcity, or scarcity cost, is the
Fig. 2. Marginal net benefit and water scarcity
economic value to users of increasing deliveries to eliminate scar-
© ASCE / NOVEMBER/DECEMBER 2006
city. This scarcity cost is calculated as the area beneath the de-mand curve �Fig. 2� between the points of current water supplyand maximum water demand �Jenkins et al. 2003�.
The model’s calibration in this work assumes that the maxi-mum demand is the current water demand in the region, at currentprices. Scarcity is then calculated relative to the quantity de-manded at the current water price, which is assumed to be theequilibrium point.
Economic models exist for many water uses and can be usedto develop economic penalty functions. Agricultural penaltycurves can be estimated with economic models that maximizeagricultural profit subject to constraints on water and other inputs�USBR 1997; Howitt 1995; Howitt et al. 1999�. Economic pen-alty functions also can be estimated for urban demands �Jenkinset al. 2003�, flood control �Johnson et al. 1988�, navigation andrecreational uses �U.S. Water Resources Council 1983; James andLee 1971�.
Economically driven simulation presupposes that water usersare largely profit maximizers and price takers in a system inwhich water is scarce. Efficient water allocation in this case re-quires existence of well-defined property rights, informationabout prices and quantities, and access to water. In these circum-stances users can use and exchange water according to productionvalue and ideally reach equilibrium where the marginal value ofadditional water is the same for all users, except when limited byinfrastructure capacities.
However, not all water management objectives can be repre-sented economically. Operations designed for environmental andusers’ subsistence demands and operations for which no economicdata are available can still be represented with priorities or asconstraints. By simulating these objectives as fixed priorities orconstraints in an economically driven model, it is possible toevaluate the opportunity cost of noneconomic management activi-ties in terms of the marginal and total values of water in thesystem.
The penalty curves used in this work were developed with theStatewide Agricultural Production Model �SWAP�. SWAP modelsagricultural cropping and water, land, and capital use decisions. InSWAP, an objective function identifies the demand for water indifferent regions vs California, maximizing economic returns sub-ject to resource, production, and policy constraints. Then it cal-culates the monthly shadow value of water for each level of watersupply. The model uses quadratic production functions to allowdecreasing marginal returns and substitutability of inputs and cap-tures farmers’ adjustments in irrigated area, crop mix, and irriga-tion technology intensity to variations in water availability andprice �Howitt and Misangi 2002�. The production function usedhas the following form:
y = ��1 �2 �3� · �x1
x2
x3� − �x1 x2 x3� · ��11 �12 �13
�21 �22 �23
�31 �32 �33� · �x1
x2
x3�
where y=total regional output of a given crop; x=quantity ofinputs �land, water, and capital� allocated to production;�=Leontieff coefficients; and �=square, positive definite matrixthat captures decreasing marginal productivity of inputs and in-teraction effects between inputs. The formulation for G regionsand i crops for a single year is given by �Howitt and Misangi2002�.
Max � � pifGi�x1,x2,x3� − �1x1 − �2x2 − �3x3
G iJOURNAL OF WATER RESOURCES PLANNING
Such that �G
�i
x1,G,i � X1,G �land constraint�
�G
�i
x2,G,i � X2,G �water constraint�
where X1,G and X2,G=amounts of land and water available to eachregion G, respectively; �=the marginal production costs �inputprices�; and pi=price of crop i. The SWAP model is similar toother agricultural production models used in California waterstudies, but it provides monthly results with a production functioncalibrated against actual cropping decisions �Howitt et al. 1999;Howitt 1995; Draper and Lund 2004�. The penalty curves arebased on piece-wise linear economic value functions developedthrough parametric analysis with SWAP and are obtained by as-sociating, for each segment of the piece-wise linear demand func-tion, the increment on water supply to the average of the marginalvalues of the two extremes of the segment. Evapotranspirationdata used to estimate crop water requirements in SWAP was pro-vided by the LAIUZ �Land-Atmosphere Interface and Unsatur-ated Zone� model �Naugle 2001�.
Water System Simulation Method
The Friant-Kern system is modeled as a sequence of monthlynetwork flow optimizations that simulate water operations andallocations driven by economic decisions at the irrigation districtlevel. The model includes the physical system of canals, reser-voirs, streams, and demand points and the institutional frameworkof water contracts, and it is run on a monthly time step. Ground-water is represented dynamically with variations in water tableand pumping costs calculated based on storage change. Themodel is developed using the decision support system MODSIM�Labadie 1995� customized with perl script routines. Perl scriptroutines allow access and modifications to model variables duringrun time, simulating system features not available in the standardMODSIM. In MODSIM, perl script routines calculate waterdelivery contract accounting �Leu 2001� and perform additionalcalculations for more detailed groundwater representation.MODSIM uses a capacitated network flow approach for simula-tion and optimization of water systems that finds penalty mini-mizing network flows sequentially for each time step, with resultsused as initial conditions for the following time step. The soft-ware has been applied to simulate diverse river basin systems�Dai and Labadie 2001; Fredericks et al. 1998�.
Economics-based penalties indicate the benefits, in $ /m3, oftaking different supply quantities from alternative water sources.The penalty functions developed in SWAP drive the simulation offarmers’ decisions about how much water to use and from whichsources among various surface and groundwater sources and sup-ply contracts available. Each piece-wise curve indicates the eco-nomic benefit of increments in water supply. These functions arerepresented in MODSIM as a negative cost attached to an eco-nomic link delivering water to a given demand. Twelve monthlyeconomic functions are developed for each irrigation or waterdistrict. Each piece-wise segment of the penalty function is rep-resented by a link in the network. To minimize the objectivefunction �total costs�, water is delivered first through the highestbenefit link �represented in the model as a negative cost�. This isthe first segment in the demand function in which a higher valueis placed on the first amounts of water available. As more water is
available the first high value link reaches its upper bound givingAND MANAGEMENT © ASCE / NOVEMBER/DECEMBER 2006 / 471
the next unit of water available a smaller marginal value �Leu2001; Marques et al. 2003�.
Instream flow demands, downstream of Millerton Dam, areincluded as monthly reservoir water allocations in MODSIM andso are abstracted before the water available for allocation withinthe Friant-Kern system. Instream flows are generally representedas constrained flow dedications owing to controversies in estab-lishing demand curves for environmental flows.
Groundwater Representation
The groundwater representation updates water table elevationseach time step based on changes in storage due to pumping, arti-ficial recharge, deep percolation, and subsurface flows. The watertable at the end of a time step is used to calculate groundwaterpumping costs for the next time step. A 3D groundwater flowsimulation model developed separately �Ruud et al. 2002� esti-mated hydraulic conductance used as a response parameter. Theaquifer overlaid by the groundwater model was divided into sepa-rate “groundwater zones” based on specific yield information, andeach GW zone is represented in MODSIM as a storage node.
The 11 irrigation districts covered by the groundwater modelare simulated with variable pumping costs in some water systemssimulation model runs, while the remaining 25 irrigation districts�representing 73% of total water use� are always simulated withfixed unit pumping cost.
Model Results and Discussion
The model results explore the effects of surface water prices onconjunctive use and groundwater sustainability, and the effectsand implications of variable head representation of groundwaterpumping cost. Model runs are made with a variable groundwaterpumping �VP� model version and fixed head pumping cost�FPhigh and FPlow� model versions for comparison purposes. InVP, 11 irrigation districts are simulated with variable groundwaterpumping costs, and 25 irrigation districts are simulated with fixedupdated groundwater pumping costs. In FPlow, all 36 irrigationdistricts are simulated with fixed original groundwater pumpingcosts. In FPhigh, all 36 irrigation districts are simulated with fixedupdated groundwater pumping costs. The groundwater pumping
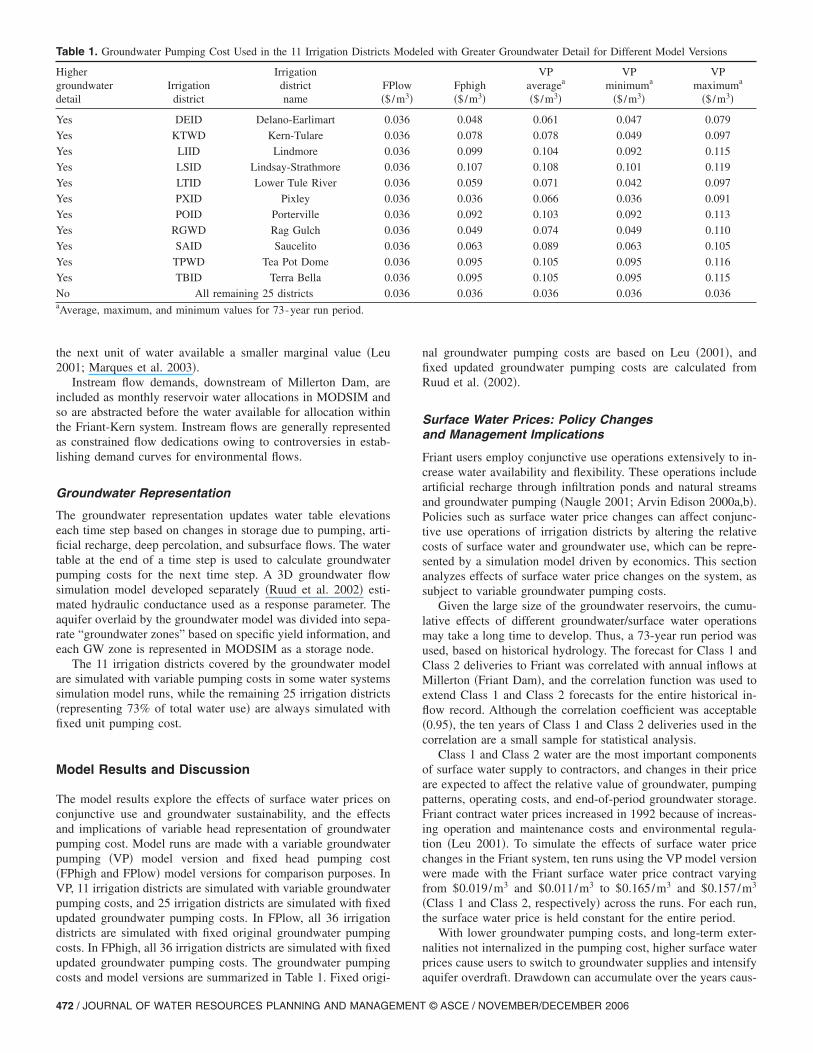
Table 1. Groundwater Pumping Cost Used in the 11 Irrigation Districts
Highergroundwaterdetail
Irrigationdistrict
Irrigationdistrictname
FP�$
Yes DEID Delano-Earlimart 0.
Yes KTWD Kern-Tulare 0.
Yes LIID Lindmore 0.
Yes LSID Lindsay-Strathmore 0.
Yes LTID Lower Tule River 0.
Yes PXID Pixley 0.
Yes POID Porterville 0.
Yes RGWD Rag Gulch 0.
Yes SAID Saucelito 0.
Yes TPWD Tea Pot Dome 0.
Yes TBID Terra Bella 0.
No All remaining 25 districts 0.aAverage, maximum, and minimum values for 73-year run period.
costs and model versions are summarized in Table 1. Fixed origi-
472 / JOURNAL OF WATER RESOURCES PLANNING AND MANAGEMENT
nal groundwater pumping costs are based on Leu �2001�, andfixed updated groundwater pumping costs are calculated fromRuud et al. �2002�.
Surface Water Prices: Policy Changesand Management Implications
Friant users employ conjunctive use operations extensively to in-crease water availability and flexibility. These operations includeartificial recharge through infiltration ponds and natural streamsand groundwater pumping �Naugle 2001; Arvin Edison 2000a,b�.Policies such as surface water price changes can affect conjunc-tive use operations of irrigation districts by altering the relativecosts of surface water and groundwater use, which can be repre-sented by a simulation model driven by economics. This sectionanalyzes effects of surface water price changes on the system, assubject to variable groundwater pumping costs.
Given the large size of the groundwater reservoirs, the cumu-lative effects of different groundwater/surface water operationsmay take a long time to develop. Thus, a 73-year run period wasused, based on historical hydrology. The forecast for Class 1 andClass 2 deliveries to Friant was correlated with annual inflows atMillerton �Friant Dam�, and the correlation function was used toextend Class 1 and Class 2 forecasts for the entire historical in-flow record. Although the correlation coefficient was acceptable�0.95�, the ten years of Class 1 and Class 2 deliveries used in thecorrelation are a small sample for statistical analysis.
Class 1 and Class 2 water are the most important componentsof surface water supply to contractors, and changes in their priceare expected to affect the relative value of groundwater, pumpingpatterns, operating costs, and end-of-period groundwater storage.Friant contract water prices increased in 1992 because of increas-ing operation and maintenance costs and environmental regula-tion �Leu 2001�. To simulate the effects of surface water pricechanges in the Friant system, ten runs using the VP model versionwere made with the Friant surface water price contract varyingfrom $0.019/m3 and $0.011/m3 to $0.165/m3 and $0.157/m3
�Class 1 and Class 2, respectively� across the runs. For each run,the surface water price is held constant for the entire period.
With lower groundwater pumping costs, and long-term exter-nalities not internalized in the pumping cost, higher surface waterprices cause users to switch to groundwater supplies and intensify
ed with Greater Groundwater Detail for Different Model Versions
Fphigh�$/m3�
VPaveragea
�$/m3�
VPminimuma
�$/m3�
VPmaximuma
�$/m3�
0.048 0.061 0.047 0.079
0.078 0.078 0.049 0.097
0.099 0.104 0.092 0.115
0.107 0.108 0.101 0.119
0.059 0.071 0.042 0.097
0.036 0.066 0.036 0.091
0.092 0.103 0.092 0.113
0.049 0.074 0.049 0.110
0.063 0.089 0.063 0.105
0.095 0.105 0.095 0.116
0.095 0.105 0.095 0.115
0.036 0.036 0.036 0.036
Model
low/m3�
036
036
036
036
036
036
036
036
036
036
036
036
aquifer overdraft. Drawdown can accumulate over the years caus-
© ASCE / NOVEMBER/DECEMBER 2006
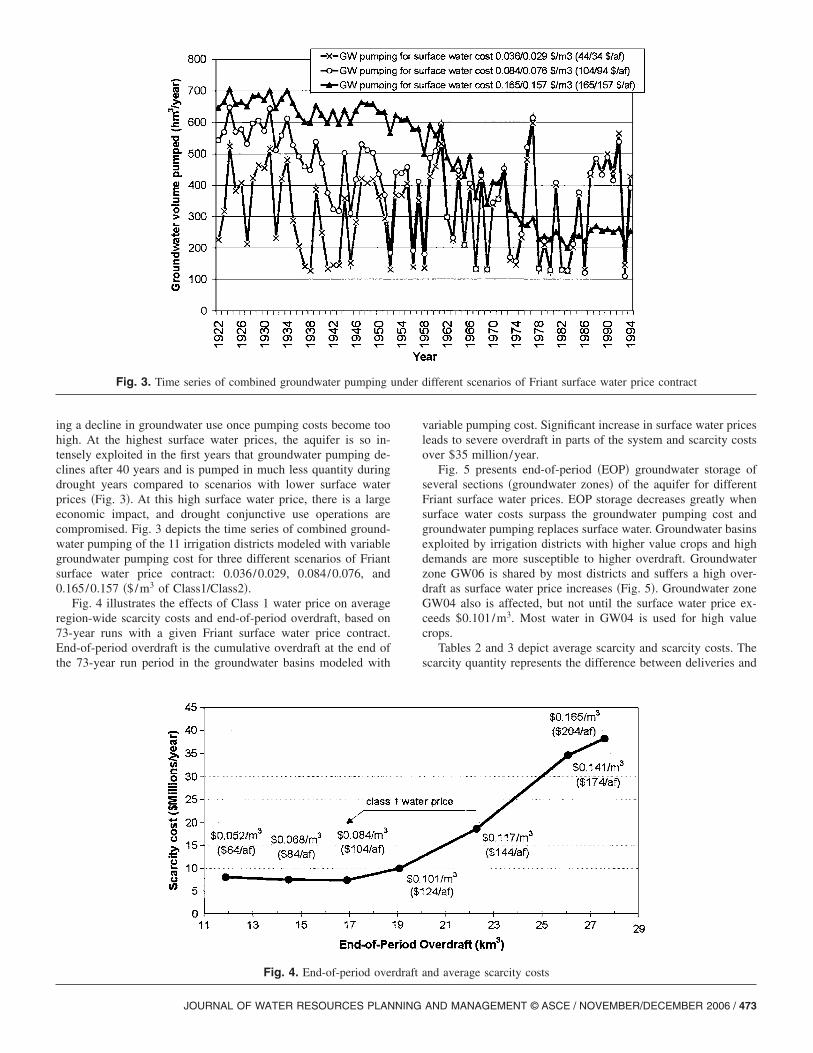
ing a decline in groundwater use once pumping costs become toohigh. At the highest surface water prices, the aquifer is so in-tensely exploited in the first years that groundwater pumping de-clines after 40 years and is pumped in much less quantity duringdrought years compared to scenarios with lower surface waterprices �Fig. 3�. At this high surface water price, there is a largeeconomic impact, and drought conjunctive use operations arecompromised. Fig. 3 depicts the time series of combined ground-water pumping of the 11 irrigation districts modeled with variablegroundwater pumping cost for three different scenarios of Friantsurface water price contract: 0.036/0.029, 0.084/0.076, and0.165/0.157 �$/m3 of Class1/Class2�.
Fig. 4 illustrates the effects of Class 1 water price on averageregion-wide scarcity costs and end-of-period overdraft, based on73-year runs with a given Friant surface water price contract.End-of-period overdraft is the cumulative overdraft at the end ofthe 73-year run period in the groundwater basins modeled with
Fig. 3. Time series of combined groundwater pumping u
Fig. 4. End-of-period ove
JOURNAL OF WATER RESOURCES PLANNING
variable pumping cost. Significant increase in surface water pricesleads to severe overdraft in parts of the system and scarcity costsover $35 million/year.
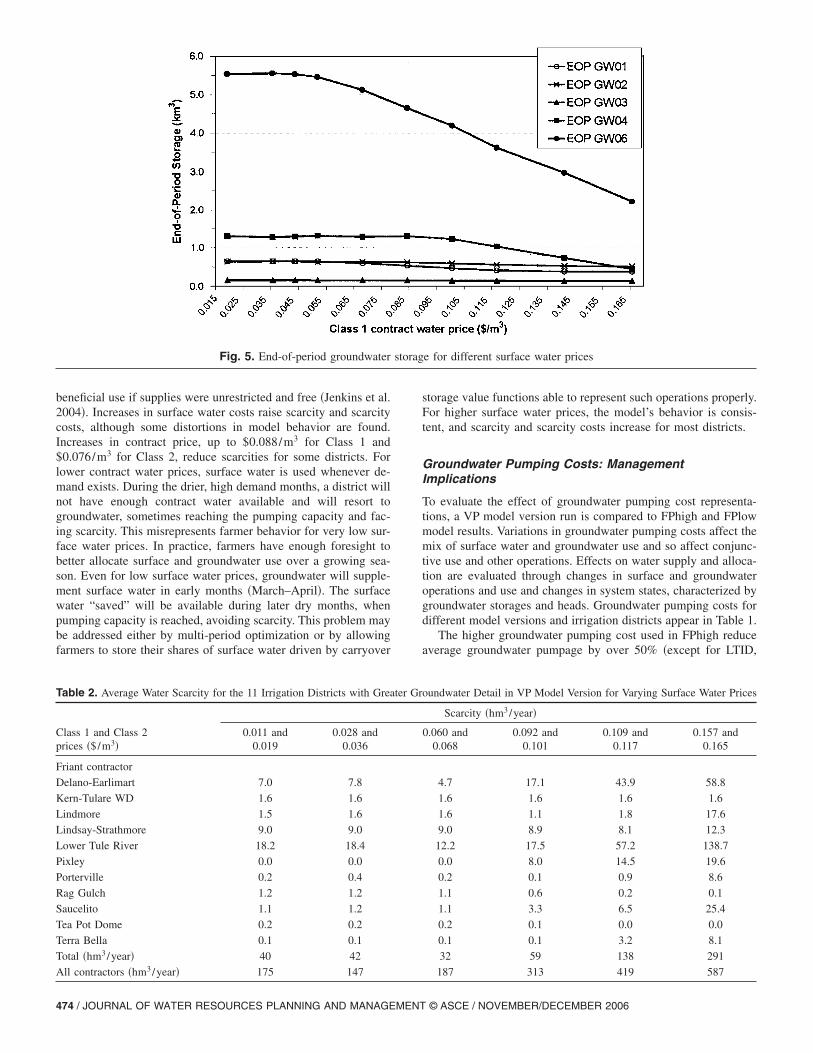
Fig. 5 presents end-of-period �EOP� groundwater storage ofseveral sections �groundwater zones� of the aquifer for differentFriant surface water prices. EOP storage decreases greatly whensurface water costs surpass the groundwater pumping cost andgroundwater pumping replaces surface water. Groundwater basinsexploited by irrigation districts with higher value crops and highdemands are more susceptible to higher overdraft. Groundwaterzone GW06 is shared by most districts and suffers a high over-draft as surface water price increases �Fig. 5�. Groundwater zoneGW04 also is affected, but not until the surface water price ex-ceeds $0.101/m3. Most water in GW04 is used for high valuecrops.
Tables 2 and 3 depict average scarcity and scarcity costs. Thescarcity quantity represents the difference between deliveries and
different scenarios of Friant surface water price contract
and average scarcity costs
nder
rdraft
AND MANAGEMENT © ASCE / NOVEMBER/DECEMBER 2006 / 473
beneficial use if supplies were unrestricted and free �Jenkins et al.2004�. Increases in surface water costs raise scarcity and scarcitycosts, although some distortions in model behavior are found.Increases in contract price, up to $0.088/m3 for Class 1 and$0.076/m3 for Class 2, reduce scarcities for some districts. Forlower contract water prices, surface water is used whenever de-mand exists. During the drier, high demand months, a district willnot have enough contract water available and will resort togroundwater, sometimes reaching the pumping capacity and fac-ing scarcity. This misrepresents farmer behavior for very low sur-face water prices. In practice, farmers have enough foresight tobetter allocate surface and groundwater use over a growing sea-son. Even for low surface water prices, groundwater will supple-ment surface water in early months �March–April�. The surfacewater “saved” will be available during later dry months, whenpumping capacity is reached, avoiding scarcity. This problem maybe addressed either by multi-period optimization or by allowingfarmers to store their shares of surface water driven by carryover
Table 2. Average Water Scarcity for the 11 Irrigation Districts with Grea
Class 1 and Class 2prices �$/m3�
0.011 and0.019
0.028 and0.036
Friant contractor
Delano-Earlimart 7.0 7.8
Kern-Tulare WD 1.6 1.6
Lindmore 1.5 1.6
Lindsay-Strathmore 9.0 9.0
Lower Tule River 18.2 18.4
Pixley 0.0 0.0
Porterville 0.2 0.4
Rag Gulch 1.2 1.2
Saucelito 1.1 1.2
Tea Pot Dome 0.2 0.2
Terra Bella 0.1 0.1
Total �hm3/year� 40 42
All contractors �hm3/year� 175 147
Fig. 5. End-of-period groundwater
474 / JOURNAL OF WATER RESOURCES PLANNING AND MANAGEMENT
storage value functions able to represent such operations properly.For higher surface water prices, the model’s behavior is consis-tent, and scarcity and scarcity costs increase for most districts.
Groundwater Pumping Costs: ManagementImplications
To evaluate the effect of groundwater pumping cost representa-tions, a VP model version run is compared to FPhigh and FPlowmodel results. Variations in groundwater pumping costs affect themix of surface water and groundwater use and so affect conjunc-tive use and other operations. Effects on water supply and alloca-tion are evaluated through changes in surface and groundwateroperations and use and changes in system states, characterized bygroundwater storages and heads. Groundwater pumping costs fordifferent model versions and irrigation districts appear in Table 1.
The higher groundwater pumping cost used in FPhigh reduceaverage groundwater pumpage by over 50% �except for LTID,
oundwater Detail in VP Model Version for Varying Surface Water Prices
Scarcity �hm3/year�
0.060 and0.068
0.092 and0.101
0.109 and0.117
0.157 and0.165
4.7 17.1 43.9 58.8
1.6 1.6 1.6 1.6
1.6 1.1 1.8 17.6
9.0 8.9 8.1 12.3
12.2 17.5 57.2 138.7
0.0 8.0 14.5 19.6
0.2 0.1 0.9 8.6
1.1 0.6 0.2 0.1
1.1 3.3 6.5 25.4
0.2 0.1 0.0 0.0
0.1 0.1 3.2 8.1
32 59 138 291
187 313 419 587
e for different surface water prices
ter Gr
storag
© ASCE / NOVEMBER/DECEMBER 2006
32%� compared to the FPlow run for the 11 districts with greatergroundwater detail. Terra Bella irrigation district �TBID� reducesgroundwater pumping by 97% as the cost increases from$0.036/m3 in FPlow to $0.095/m3 in FPhigh. This operation isfollowed by an increase in Class 1 TBID water use from10.4 hm3/year to 30 hm3/year, on average.
With higher groundwater pumping costs, irrigation districtsswitch to cheaper sources to maximize net revenue and avoidscarcity, affecting surface water operations. Following contractwater, the next least expensive supply source is other local, non-contract surface water supply. Irrigation districts with higher cropvalues will switch to other local surface supplies reducing theiravailability to other districts. Porterville Irrigation District �POID�and Lower Tule River Irrigation District �LTID� reduce ground-water pumping by 56 and 32%, respectively, and increase Class 1and other surface supplies �in this case, from Tule River�. Thisincrease in withdrawals from Tule River affects Pixley IrrigationDistrict �PXID�, whose average Tule River supply is reducedfrom 21.3 to 15.8 hm3/year. These results demonstrate the effectof each district’s operations on water allocation in the systemwhen users make economics-based decisions on water sources.
When groundwater pumping costs exceed costs for surfacesupply sources, further increase in groundwater costs has littleeffect on pumping until pumping costs exceed the district’s mar-ginal willingness to pay for irrigation water. This is because Class1 water and Class 2 water are constrained by contractual amounts�districts cannot trade USBR contract water among themselves inthe model� limiting the system’s flexibility to cope with increasesin groundwater costs by switching to surface water supplies.
Groundwater pumping costs calculated in run VP are higherthan the other runs and increase in time with overdraft, resultingin less groundwater use and higher scarcity. Of the 202 hm3/yearaverage reduction in groundwater use, 170 hm3/year are replacedby contract water �Table 4�, and the remaining 32 hm3/year arescarcity increases. This difference between modeling scenariosindicates the region can operationally accommodate the mostvariations in the groundwater pumping costs modeled/represented.
Minor differences from FPhigh to run VP are limited to irri-
Table 3. Average Scarcity Costs for the 11 Irrigation Districts with Grea
Class 1 and Class 2 prices�$/m3�
0.011 and0.019
0.028 and0.036
Friant contractor
Delano-Earlimart 928 1,062
Kern-Tulare WD 669 669
Lindmore 204 215
Lindsay-Strathmore 3,747 3,750
Lower Tule River 2,044 2,060
Pixley 0 0
Porterville 37 44
Rag Gulch 557 56
Saucelito 136 144
Tea Pot Dome 70 71
Terra Bella 17 18
Total �million$/year� 8.4 8.6
Total all contractors�million$/year�
26.2 24
gation districts highly dependent on groundwater supply, like Pix-
JOURNAL OF WATER RESOURCES PLANNING
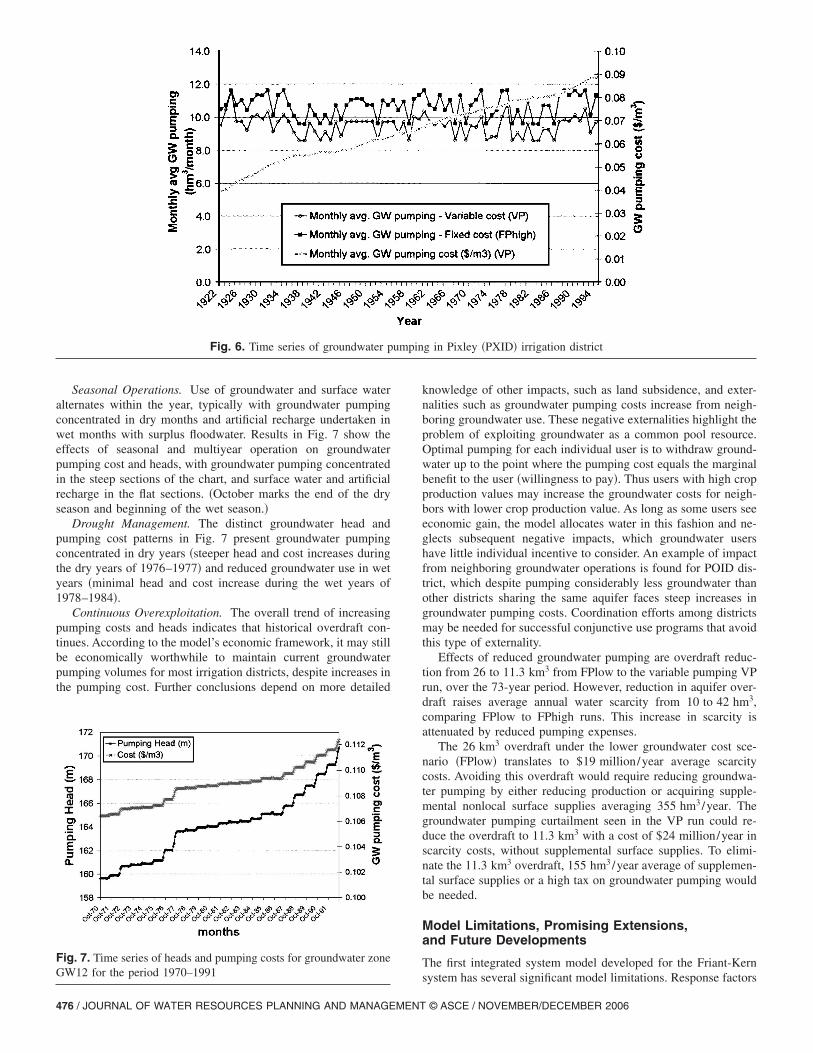
ley. Groundwater pumping in Pixley is reduced in March andApril and replaced by Class 1 water. In drier months Class 1water availability is reduced and Pixley resorts to groundwaterpumping. With fixed pumping cost, variations in groundwaterpumping are driven by surface water availability. With variablepumping cost, some change is seen in the pumping pattern �Fig.6�. Faster increases in cost during dry years reduces pumping inVP, as opposed to a more variable pumping pattern in the fixedpumping cost run FPhigh. Pixley is willing to pay $0.101/m3 forthe last portion of supply, and because pumping costs increase upto $0.088/m3 and groundwater remains economically attractive atthe margin, there is no reduction in pumping in run VP.
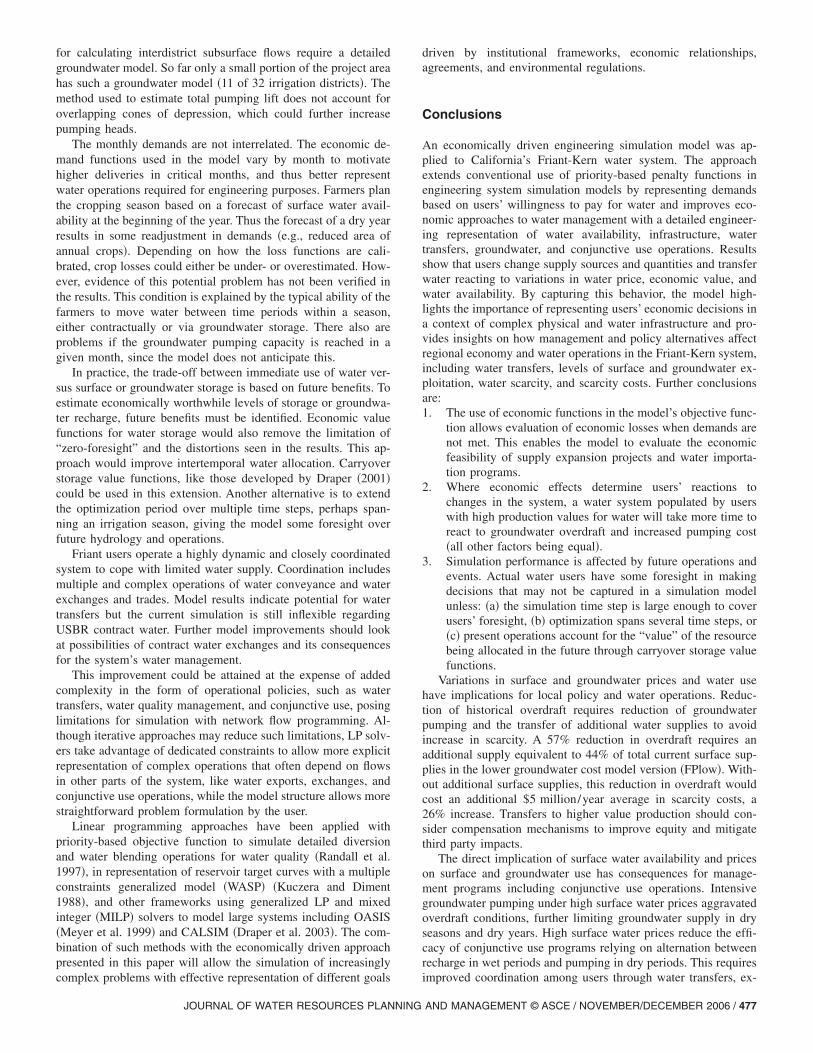
Conjunctive use operations in the region are presented inFig. 7, which depicts the time series of pumping heads andrespective pumping costs for groundwater zone GW12. To aidvisualization of seasonal variations in groundwater pumping andhead, a shorter time window �1970–1992� is displayed instead ofthe whole time series. This period includes both a very dry period�1976–1977� and a wet period �1987–1992�. Conjunctive useoperations include:
oundwater Detail in VP Model Version for Varying Surface Water Prices
Scarcity cost �$1,000/year�
0.060 and0.068
0.92 and0.101
0.109 and0.117
0.157 and0.165
626 1,782 4,826 7,010
669 669 669 669
215 152 255 2,469
3,750 3,696 3,411 2,372
1,369 1,958 6,429 17,368
0 877 1,606 2,197
31 21 111 1,153
523 304 97 41
134 406 820 3,819
71 46 15 2
18 18 401 1,134
7.4 9.9 18.6 38.2
25.6 36.7 48.2 69.6
Table 4. Overall Results, 73-Year Average: 11 Districts with GreaterGroundwater Detail
Year average
Fixed groundwaterpumping cost
FPlow run
Variable groundwaterpumping cost
VP run
Totals �taf� % total demand % total demand
Demand 979 100.0 979 100.0
Total supply 969 99.0 937 95.7
Scarcity 10 1.1 42 4.3
% total supply % total supply
Surface contract supply 335 34.6 506 53.9
Surface other supplya 115 11.8 115 12.2
GW supply 519 53.6 317 33.8a
ter Gr
Excluding artificial recharge.
AND MANAGEMENT © ASCE / NOVEMBER/DECEMBER 2006 / 475
Seasonal Operations. Use of groundwater and surface wateralternates within the year, typically with groundwater pumpingconcentrated in dry months and artificial recharge undertaken inwet months with surplus floodwater. Results in Fig. 7 show theeffects of seasonal and multiyear operation on groundwaterpumping cost and heads, with groundwater pumping concentratedin the steep sections of the chart, and surface water and artificialrecharge in the flat sections. �October marks the end of the dryseason and beginning of the wet season.�
Drought Management. The distinct groundwater head andpumping cost patterns in Fig. 7 present groundwater pumpingconcentrated in dry years �steeper head and cost increases duringthe dry years of 1976–1977� and reduced groundwater use in wetyears �minimal head and cost increase during the wet years of1978–1984�.
Continuous Overexploitation. The overall trend of increasingpumping costs and heads indicates that historical overdraft con-tinues. According to the model’s economic framework, it may stillbe economically worthwhile to maintain current groundwaterpumping volumes for most irrigation districts, despite increases inthe pumping cost. Further conclusions depend on more detailed
Fig. 6. Time series of groundwater p
Fig. 7. Time series of heads and pumping costs for groundwater zoneGW12 for the period 1970–1991
476 / JOURNAL OF WATER RESOURCES PLANNING AND MANAGEMENT
knowledge of other impacts, such as land subsidence, and exter-nalities such as groundwater pumping costs increase from neigh-boring groundwater use. These negative externalities highlight theproblem of exploiting groundwater as a common pool resource.Optimal pumping for each individual user is to withdraw ground-water up to the point where the pumping cost equals the marginalbenefit to the user �willingness to pay�. Thus users with high cropproduction values may increase the groundwater costs for neigh-bors with lower crop production value. As long as some users seeeconomic gain, the model allocates water in this fashion and ne-glects subsequent negative impacts, which groundwater usershave little individual incentive to consider. An example of impactfrom neighboring groundwater operations is found for POID dis-trict, which despite pumping considerably less groundwater thanother districts sharing the same aquifer faces steep increases ingroundwater pumping costs. Coordination efforts among districtsmay be needed for successful conjunctive use programs that avoidthis type of externality.
Effects of reduced groundwater pumping are overdraft reduc-tion from 26 to 11.3 km3 from FPlow to the variable pumping VPrun, over the 73-year period. However, reduction in aquifer over-draft raises average annual water scarcity from 10 to 42 hm3,comparing FPlow to FPhigh runs. This increase in scarcity isattenuated by reduced pumping expenses.
The 26 km3 overdraft under the lower groundwater cost sce-nario �FPlow� translates to $19 million/year average scarcitycosts. Avoiding this overdraft would require reducing groundwa-ter pumping by either reducing production or acquiring supple-mental nonlocal surface supplies averaging 355 hm3/year. Thegroundwater pumping curtailment seen in the VP run could re-duce the overdraft to 11.3 km3 with a cost of $24 million/year inscarcity costs, without supplemental surface supplies. To elimi-nate the 11.3 km3 overdraft, 155 hm3/year average of supplemen-tal surface supplies or a high tax on groundwater pumping wouldbe needed.
Model Limitations, Promising Extensions,and Future Developments
The first integrated system model developed for the Friant-Kern
g in Pixley �PXID� irrigation district
umpinsystem has several significant model limitations. Response factors
© ASCE / NOVEMBER/DECEMBER 2006
for calculating interdistrict subsurface flows require a detailedgroundwater model. So far only a small portion of the project areahas such a groundwater model �11 of 32 irrigation districts�. Themethod used to estimate total pumping lift does not account foroverlapping cones of depression, which could further increasepumping heads.
The monthly demands are not interrelated. The economic de-mand functions used in the model vary by month to motivatehigher deliveries in critical months, and thus better representwater operations required for engineering purposes. Farmers planthe cropping season based on a forecast of surface water avail-ability at the beginning of the year. Thus the forecast of a dry yearresults in some readjustment in demands �e.g., reduced area ofannual crops�. Depending on how the loss functions are cali-brated, crop losses could either be under- or overestimated. How-ever, evidence of this potential problem has not been verified inthe results. This condition is explained by the typical ability of thefarmers to move water between time periods within a season,either contractually or via groundwater storage. There also areproblems if the groundwater pumping capacity is reached in agiven month, since the model does not anticipate this.
In practice, the trade-off between immediate use of water ver-sus surface or groundwater storage is based on future benefits. Toestimate economically worthwhile levels of storage or groundwa-ter recharge, future benefits must be identified. Economic valuefunctions for water storage would also remove the limitation of“zero-foresight” and the distortions seen in the results. This ap-proach would improve intertemporal water allocation. Carryoverstorage value functions, like those developed by Draper �2001�could be used in this extension. Another alternative is to extendthe optimization period over multiple time steps, perhaps span-ning an irrigation season, giving the model some foresight overfuture hydrology and operations.
Friant users operate a highly dynamic and closely coordinatedsystem to cope with limited water supply. Coordination includesmultiple and complex operations of water conveyance and waterexchanges and trades. Model results indicate potential for watertransfers but the current simulation is still inflexible regardingUSBR contract water. Further model improvements should lookat possibilities of contract water exchanges and its consequencesfor the system’s water management.
This improvement could be attained at the expense of addedcomplexity in the form of operational policies, such as watertransfers, water quality management, and conjunctive use, posinglimitations for simulation with network flow programming. Al-though iterative approaches may reduce such limitations, LP solv-ers take advantage of dedicated constraints to allow more explicitrepresentation of complex operations that often depend on flowsin other parts of the system, like water exports, exchanges, andconjunctive use operations, while the model structure allows morestraightforward problem formulation by the user.
Linear programming approaches have been applied withpriority-based objective function to simulate detailed diversionand water blending operations for water quality �Randall et al.1997�, in representation of reservoir target curves with a multipleconstraints generalized model �WASP� �Kuczera and Diment1988�, and other frameworks using generalized LP and mixedinteger �MILP� solvers to model large systems including OASIS�Meyer et al. 1999� and CALSIM �Draper et al. 2003�. The com-bination of such methods with the economically driven approachpresented in this paper will allow the simulation of increasingly
complex problems with effective representation of different goalsJOURNAL OF WATER RESOURCES PLANNING
driven by institutional frameworks, economic relationships,agreements, and environmental regulations.
Conclusions
An economically driven engineering simulation model was ap-plied to California’s Friant-Kern water system. The approachextends conventional use of priority-based penalty functions inengineering system simulation models by representing demandsbased on users’ willingness to pay for water and improves eco-nomic approaches to water management with a detailed engineer-ing representation of water availability, infrastructure, watertransfers, groundwater, and conjunctive use operations. Resultsshow that users change supply sources and quantities and transferwater reacting to variations in water price, economic value, andwater availability. By capturing this behavior, the model high-lights the importance of representing users’ economic decisions ina context of complex physical and water infrastructure and pro-vides insights on how management and policy alternatives affectregional economy and water operations in the Friant-Kern system,including water transfers, levels of surface and groundwater ex-ploitation, water scarcity, and scarcity costs. Further conclusionsare:1. The use of economic functions in the model’s objective func-
tion allows evaluation of economic losses when demands arenot met. This enables the model to evaluate the economicfeasibility of supply expansion projects and water importa-tion programs.
2. Where economic effects determine users’ reactions tochanges in the system, a water system populated by userswith high production values for water will take more time toreact to groundwater overdraft and increased pumping cost�all other factors being equal�.
3. Simulation performance is affected by future operations andevents. Actual water users have some foresight in makingdecisions that may not be captured in a simulation modelunless: �a� the simulation time step is large enough to coverusers’ foresight, �b� optimization spans several time steps, or�c� present operations account for the “value” of the resourcebeing allocated in the future through carryover storage valuefunctions.
Variations in surface and groundwater prices and water usehave implications for local policy and water operations. Reduc-tion of historical overdraft requires reduction of groundwaterpumping and the transfer of additional water supplies to avoidincrease in scarcity. A 57% reduction in overdraft requires anadditional supply equivalent to 44% of total current surface sup-plies in the lower groundwater cost model version �FPlow�. With-out additional surface supplies, this reduction in overdraft wouldcost an additional $5 million/year average in scarcity costs, a26% increase. Transfers to higher value production should con-sider compensation mechanisms to improve equity and mitigatethird party impacts.
The direct implication of surface water availability and priceson surface and groundwater use has consequences for manage-ment programs including conjunctive use operations. Intensivegroundwater pumping under high surface water prices aggravatedoverdraft conditions, further limiting groundwater supply in dryseasons and dry years. High surface water prices reduce the effi-cacy of conjunctive use programs relying on alternation betweenrecharge in wet periods and pumping in dry periods. This requires
improved coordination among users through water transfers, ex-AND MANAGEMENT © ASCE / NOVEMBER/DECEMBER 2006 / 477
changes, and artificial recharge operations that increase flexibilityin local water operations and support conjunctive use operations.
Economically driven simulation can be applied to otherregions where water is scarce, economic water uses are predomi-nant, and data is available to calibrate supporting economic mod-els. Other productive sectors, such as hydropower, navigation,and urban uses can be modeled with this approach, while non-economic �e.g., environmental� demands and operations can stillbe included with priority-based penalties. The approach is recom-mended for supporting decision making on regional water re-sources systems where competition for water is intense, waterusers operate the system based on economic decisions, and theeconomic and operational impacts of proposed management alter-natives are of interest.
Acknowledgments
The writers thank Randi Field �USBR�, Mike Tansey �USBR�,Marc Baldo, Mark Jensen �HEC�, and Lenore Thomas for valu-able contributions during development of this work and severalanonymous reviewers for their suggestions.
References
Andreu, J., Capilla, J., and Sanchis, E. �1996�. “AQUATOOL, a general-ized decision-support system for water resources planning and opera-tional management.” J. Hydrol., 177, 269–291.
Andrews, E. S., Chung, F. I., and Lund, J. R. �1992�. “Multilayered,priority-based simulation of conjunctive facilities.” J. Water Resour.Plann. Manage., 118�1�, 32–53.
Arvin-Edison Water Storage District. �2000a�. “2000 Water Year Sum-mary Report.”
Arvin-Edison Water Storage District. �2000b�. “The Arvin-Edison WaterStorage District Water Resources Management Program.”
Brown, L. D., Pinhey, N. A., and Spaletta, J. L. �2001�. “Designingsuccessful groundwater banking programs in the Central Valley:Lessons from experience.” Natural Heritage Institute, Berkeley, Calif.
Burt, O. R. �1964�. “The economics of conjunctive use of ground andsurface water.” Hilgardia, 36�2�, 31–111.
California Department of Water Resources �CDWR�. �2003�. CaliforniaGroundwater, Bulletin 118, Public review draft.
Chung, F. I., Archer, M. C., and DeVries, J. J. �1989�. “Network flowalgorithm applied to California aqueduct simulation.” J. Water Resour.Plann. Manage., 115�2�, 131–147.
Dai, T., and Labadie, J. W. �2001�. “River basin network model for inte-grated water quantity/quality management.” J. Water Resour. Plann.Manage., 127�5�, 295–305.
Draper, A. �2001�. “Implicit stochastic optimization with limited fore-sight for reservoir systems.” Ph.D. dissertation, Dept. of Civil andEnvironmental Engineering, Univ. of California, Davis, Calif.
Draper, A., and Lund, J. R. �2004�. “Optimal hedging and carryoverstorage value.” J. Water Resour. Plann. Manage., 130�1�, 83–87.
Draper, A., Munevar, A., Arora, S. K., Reeves, E., Parker, N. L., Chung,F. I., and Peterson, L. E. �2003�. “CalSim: Generalized model forreservoir system analysis.” J. Water Resour. Plann. Manage., 130�3�,480–489.
Dupuit, J. �1844�. “De la mesure de l’utilité des travaux publics.” Annalesdes Ponts et Chaussées, Memoirs et Documents, 2nd ser., 8�2�,332–375.
Fredericks, J. W., Labadie, J. W., and Altenhofen, J. M. �1998�. “Decisionsupport system for conjunctive stream-aquifer management.” J. WaterResour. Plann. Manage., 124�2�, 68–78.
Gillig, D., McCarl, B. A., and Boadu, F. �2001�. “An economic, hydro-
logic, and environmental assessment of water management alternative478 / JOURNAL OF WATER RESOURCES PLANNING AND MANAGEMENT
plans for the south central Texas region.” J. Agricultural and AppliedEconomics, 33�1�, 59–78.
Howitt, R. E. �1995�. “Positive mathematical programming.” Am. J.Agric. Econom., 77, 329–342.
Howitt, R. E., and Misangi, S. M. �2002�. “Reconstructing disaggregateproduction functions.” X Congress of the European Association of
Agricultural Economists, Zaragoza, Spain.Howitt, R. E., Ward, K. B., and Msangi, S. M. �1999�. “Statewide water
and agricultural production model.” In Jenkins, M. W., et al. �2001�.Improving California water management: Optimizing value andflexibility, Appendix A. �http://cee.engr.ucdavis.edu/faculty/lund.CALVIN/Report1/Appendices/AppendixA.pdf�.
Israel, M. S., and Lund, J. R. �1999�. “Priority preserving unit penalties innetwork flow modeling.” J. Water Resour. Plann. Manage., 125�4�,205–214.
James, L. D., and Lee, R. R. �1971�. Economics of water resources plan-
ning, McGraw Hill, New York.Jenkins, M. W., et al. �2004�. “Optimization of California’s water supply
system: Results and insights.” J. Water Resour. Plann. Manage.,130�4�, 271–280.
Jenkins, M. W., Lund, J. R., and Howitt, R. E. �2003�. “Using economicloss functions to value water scarcity in California.” J. Am. WaterWorks Assoc., 95�2�, 58–70.
Johnson, N. B., Hansen, W. J., Warren, J., Reynolds, F. R. Jr., Foley,C. O., and Fulton, R. L. �1988�. National economic development pro-
cedures manual: Urban flood damage, Davis, S. A., ed. IWR Rep.88-R-2, U.S. Army Corps of Engineers, Water Resources SupportCenter, Institute for Water Resources.
Kuczera, G., and Diment, G. �1988�. “Model: WASP.” J. Water Resour.Plann. Manage., 114�4�, 365–382.
Labadie, J. W. �1995�. “MODSIM: River basin network flow model forconjunctive stream-aquifer management.” Program user manual and
documentation.Labadie, J. W. �1997�. “Reservoir system optimization models.” Water
Resour. Update, 108, 83–110.Leu, M. �2001�. “Economics-driven simulation of the Friant Division of
the Central Valley Project, California.” MS thesis, Dept. of Civil andEnvironmental Engineering, Univ. of California, Davis, Calif.
Marques, G. F., Jenkins, M. W., and Lund, J. R. �2003�. “Modeling ofFriant water management and Groundwater,” USBR technical rep.�http://cee.engr.ucdavis.edu/faculty/lund/papers/FREDSIM2003.pdf�.
McCarl, B. A., Dillon, C. R., Keplinger, K. O., and Williams, R. L.�1999�. “Limiting pumping from the Edwards Aquifer: An economicinvestigation of proposals, water markets, and spring flow guaran-tees.” Water Resour. Res., 35�4�, 1257–1268.
Meyer, J. K., Pulokas, A. P., Meyer, H. W., and Sheer, D. P. �1999�.“Optimizing using OASIS with OCL: California application.” Wilson,E. M., ed. Water Resources Planning and Management Conf., ASCE,Tempe, Ariz.
Naugle, A. W. �2001�. “A hydrologic budget model for the Tule Basinarea, southeastern San Joaquin Valley, California.” MS thesis, Dept.of Land, Air and Water Resources, Univ. of California, Davis, Calif.
Randall, D., Cleland, L., Kuehne, C. S., Link, G. W., and Sheer, D. P.�1997�. “Water supply planning simulation model using mixed-integerlinear programming ‘engine’.” J. Water Resour. Plann. Manage.,123�2�,116–124.
Ruud, N., Harter, T., and Naugle, A. �2002�. “A conjunctive use modelfor the Tule Groundwater Sub-Basin Area in the southern-eastern SanJoaquin Valley, California.” Technical Rep.
Sigvaldason, O. T. �1976�. “A simulation model for operating a multipur-pose multireservoir system.” Water Resour. Res., 12�2�,263–278.
U.S. Department of the Interior, Bureau of Reclamation �USBR�. �1997�.Central Valley Project Improvement Act draft programmatic environ-mental impact statement, Technical Appendix Vol. 8, Sacramento,
Calif.© ASCE / NOVEMBER/DECEMBER 2006

U.S. Water Resources Council. �1983�. Economic and environmentalprinciples and guidelines for water and related land resources imple-mentation studies, U.S. Government Printing Office, Washington D.C.
Vaux, H. J. �1986�. “Water scarcity and gains from trade in Kern County,California.” Frderick, K. D., ed. Scarce water and institutionalchange, Resources for the Future Inc., Washington, D.C.
JOURNAL OF WATER RESOURCES PLANNING
Vaux, H. J., and Howitt, R. E. �1984�. “Managing water scarcity: Anevaluation of interregional transfers.” Water Resour. Res., 20�7�,785–792.
Young, R. A., and Bredehoeft, J. D. �1972�. “Digital computer simulationfor solving management problems of conjunctive groundwater andsurface water systems.” Water Resour. Res., 8�3�, 533–556.
AND MANAGEMENT © ASCE / NOVEMBER/DECEMBER 2006 / 479


