Embed Size (px)
Citation preview
Economic Impact Analysis of Eldridge Enterprise Redevelopment of the
Sonoma Developmental Center (SDC) Sonoma County California
January 2022
Economic Forensics and Analytics, Inc. Petaluma, CA
Economic Impact Analysis of Eldridge Enterprise, a proposed redevelopment of the Sonoma Development Center (SDC)
in Sonoma County California December 2021
Executive Summary
This report illustrates the potential economic impacts and benefits to Sonoma County of an idea named the Eldridge Enterprise. This idea was created and developed in response to a call for possible ways to redevelop the Sonoma Developmental Center (SDC) site at Eldridge in the Sonoma Valley. Economic Forensics & Analytics (EFA) was contracted to estimate the economic impacts using specific assumptions about a specific commercial idea for this site. This study’s results provide a way for local decision makers, stakeholders, and leaders to evaluate the idea conceptually, economically and fiscally. Estimated economic benefits are concentrated on Sonoma County, but also shown for all of California.
The Eldridge Enterprise alternative is envisioned as a RD&D (Research, Design and Development) center focused on discovering mitigation and adaptation solutions to climate change. This enterprise would engage in scientific research, product and process design and development to reduce fossil-fuel use, lower energy consumption, optimize water efficiency, lessen the amount of waste versus recyclability of products, and conceive healthier products for both people and the planet.
Due to its proximity to Silicon Valley and San Francisco, the Eldridge Enterprise would attract financial investment from global equity and venture funding. The mission of the Eldridge Enterprise would also assist Sonoma County in taking advantage of state and federal government monies targeted at industrial and workforce development, climate change mitigation and adaptation investments, such as the federal Infrastructure Investment and Jobs Act passed in November 2021. In late 2020, the state of California created the Climate Catalyst Revolving Loan Fund through Assembly Bill 78 (AB 78), administered by the California Infrastructure and Economic Development Bank. National concerns about underinvestment in basic research and growing competition from China have prompted congressional action in the form of the Innovation and Competition Act of 2021. The Infrastructure Investment and Jobs Act of 2021 may also act as an ongoing funding source as this project matures during the 2020s. The effects of climate change are increasingly top of mind at the federal level due to the risks to national security of increased climate-related disasters. A public-private partnership is the framework for this center, with the following characteristics based on the current space and infrastructure:
• The main facility is similar to other scientific organizations with community benefits: o Sandia National Labs and the Buck Institute for Aging Research are examples in
California; • The building footprint to remain the same as previous land use:
1
o Infrastructure changes by Eldridge Enterprise increases conservation of natural resources on-site;
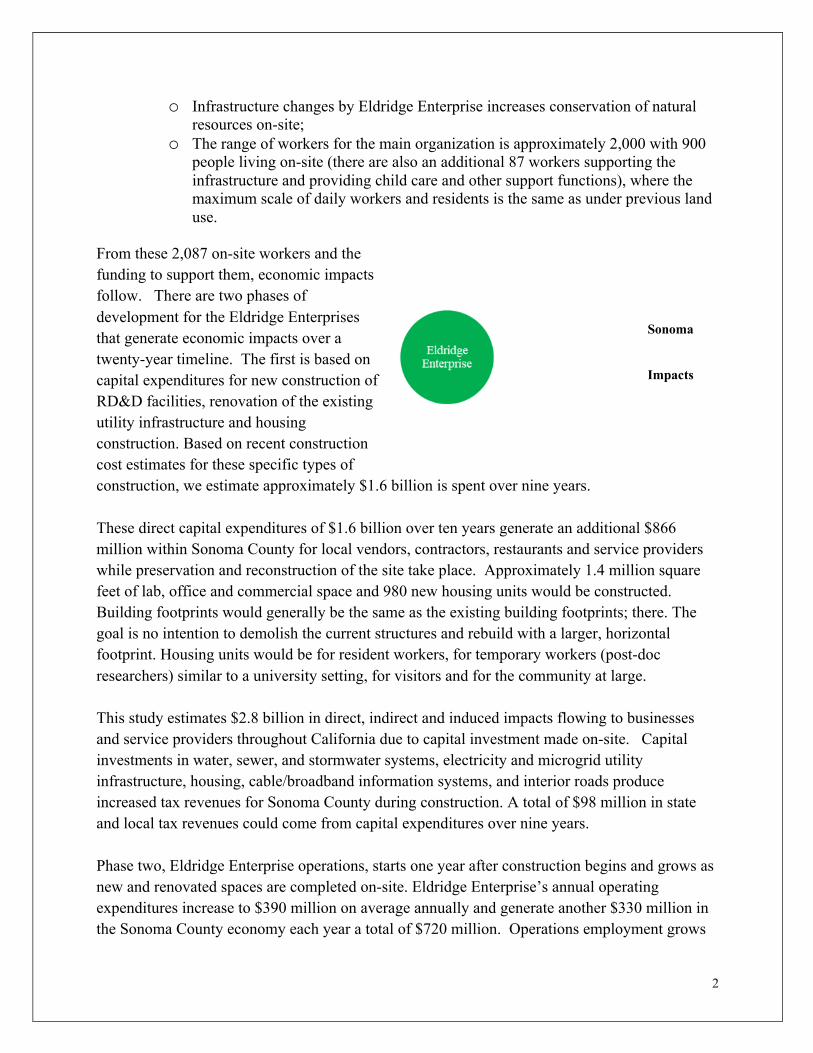
o The range of workers for the main organization is approximately 2,000 with 900 people living on-site (there are also an additional 87 workers supporting the infrastructure and providing child care and other support functions), where the maximum scale of daily workers and residents is the same as under previous land use.
From these 2,087 on-site workers and the funding to support them, economic impacts follow. There are two phases of development for the Eldridge Enterprises that generate economic impacts over a twenty-year timeline. The first is based on capital expenditures for new construction of RD&D facilities, renovation of the existing utility infrastructure and housing construction. Based on recent construction cost estimates for these specific types of construction, we estimate approximately $1.6 billion is spent over nine years.
These direct capital expenditures of $1.6 billion over ten years generate an additional $866 million within Sonoma County for local vendors, contractors, restaurants and service providers while preservation and reconstruction of the site take place. Approximately 1.4 million square feet of lab, office and commercial space and 980 new housing units would be constructed. Building footprints would generally be the same as the existing building footprints; there. The goal is no intention to demolish the current structures and rebuild with a larger, horizontal footprint. Housing units would be for resident workers, for temporary workers (post-doc researchers) similar to a university setting, for visitors and for the community at large.
This study estimates $2.8 billion in direct, indirect and induced impacts flowing to businesses and service providers throughout California due to capital investment made on-site. Capital investments in water, sewer, and stormwater systems, electricity and microgrid utility infrastructure, housing, cable/broadband information systems, and interior roads produce increased tax revenues for Sonoma County during construction. A total of $98 million in state and local tax revenues could come from capital expenditures over nine years.
Phase two, Eldridge Enterprise operations, starts one year after construction begins and grows as new and renovated spaces are completed on-site. Eldridge Enterprise’s annual operating expenditures increase to $390 million on average annually and generate another $330 million in the Sonoma County economy each year a total of $720 million. Operations employment grows
Sonoma
Impacts
2
from 50 to 2,087 workers over the first nine years for research, design and development activities, a mix of workers for on-site operations and support by providing building maintenance and childcare.
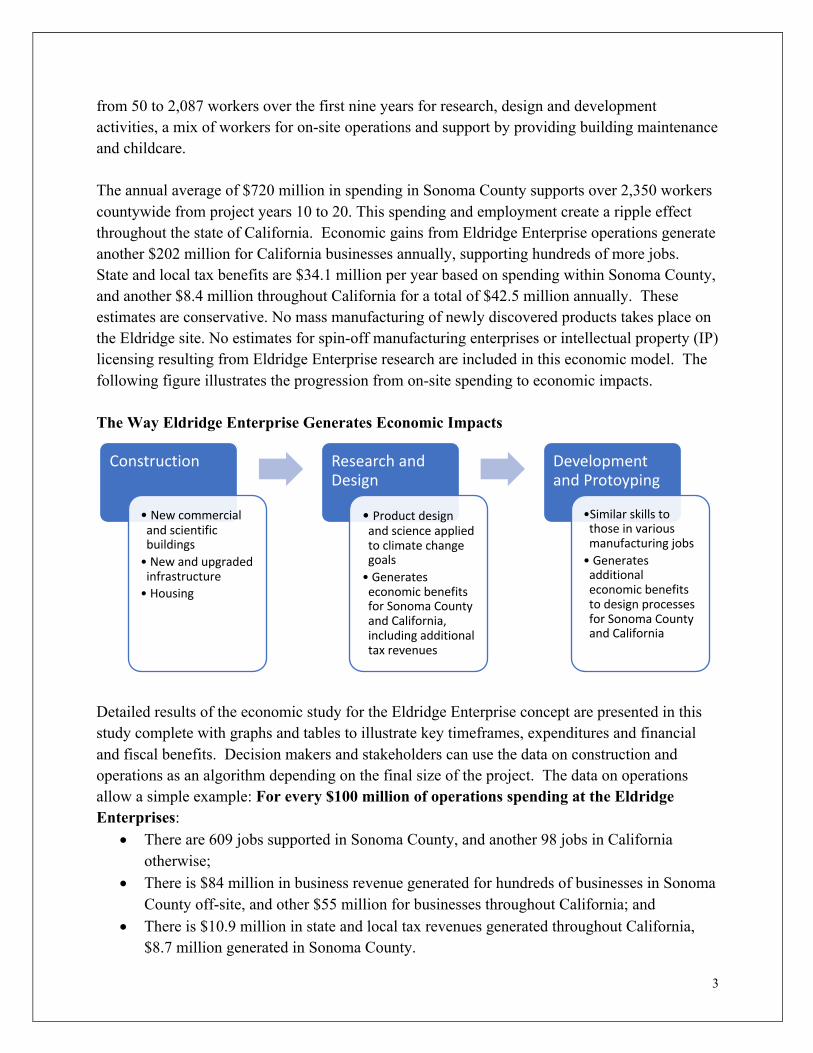
The annual average of $720 million in spending in Sonoma County supports over 2,350 workers countywide from project years 10 to 20. This spending and employment create a ripple effect throughout the state of California. Economic gains from Eldridge Enterprise operations generate another $202 million for California businesses annually, supporting hundreds of more jobs. State and local tax benefits are $34.1 million per year based on spending within Sonoma County, and another $8.4 million throughout California for a total of $42.5 million annually. These estimates are conservative. No mass manufacturing of newly discovered products takes place on the Eldridge site. No estimates for spin-off manufacturing enterprises or intellectual property (IP) licensing resulting from Eldridge Enterprise research are included in this economic model. The following figure illustrates the progression from on-site spending to economic impacts.
The Way Eldridge Enterprise Generates Economic Impacts
Construction
• New commercial and scientific buildings
• New and upgraded infrastructure
• Housing
Research and Design
• Product design and science applied to climate change goals
• Generates economic benefits for Sonoma County and California, including additional tax revenues
Development and Protoyping
•Similar skills to those in various manufacturing jobs
• Generates additional economic benefits to design processes for Sonoma County and California
Detailed results of the economic study for the Eldridge Enterprise concept are presented in this study complete with graphs and tables to illustrate key timeframes, expenditures and financial and fiscal benefits. Decision makers and stakeholders can use the data on construction and operations as an algorithm depending on the final size of the project. The data on operations allow a simple example: For every $100 million of operations spending at the Eldridge Enterprises:
• There are 609 jobs supported in Sonoma County, and another 98 jobs in California otherwise;
• There is $84 million in business revenue generated for hundreds of businesses in Sonoma County off-site, and other $55 million for businesses throughout California; and
• There is $10.9 million in state and local tax revenues generated throughout California, $8.7 million generated in Sonoma County.
3
Contents 1. INTRODUCTION...................................................................................................................................................... 5 2. OVERVIEW OF THE ELDRIDGE ENTERPRISE.................................................................................................. 7
Site Plan and Connections to Eldridge Enterprises.................................................................................................... 7 3. ECONOMIC STUDY AND ECONOMIC IMPACT RESULTS.............................................................................. 9
3.1 Direct Economic Benefits to Sonoma County ................................................................................................... 10 3.1.1 Direct Capital Expenditures (Capex) of $1.6 billion over ten years ........................................................... 10 3.1.2 Direct Operational Expenditures (Opex) Average Annual spending of $390 M over 20 years ................. 11
3.2 Broader Geographic Economic Impacts ............................................................................................................ 13 3.2.1 What are Indirect and Induced impacts? ..................................................................................................... 13 3.2.2. Sonoma County: Indirect and Induced Impacts of Capital Expenditures .................................................. 14 3.2.3. Economic Impacts of Operating Expenditures at the Eldridge Enterprises ............................................... 17 3.2.4. State of California: Indirect and Induced Impacts of Capital Expenditures .............................................. 19 3.2.5. State of California: Indirect and Induced Impacts of Operating Expenditures .......................................... 21
4. Conclusions .............................................................................................................................................................. 24 The Estimates as an Algorithm ................................................................................................................................ 25
Appendix 1: Explanation of Data & Methodology Used............................................................................................. 26 Economic Impact Methodology ............................................................................................................................... 26 Explanation of Capex Projections ............................................................................................................................ 27 Explanation of Opex Projections.............................................................................................................................. 28
Appendix 2: Current Sonoma County Economic Growth and Population Trends indicate a need for economic stimulus ........................................................................................................................................................................ 29 Appendix 3: Site Maps of Sonoma Developmental Center Buildings......................................................................... 31
4
1. INTRODUCTION
This study is an economic impact report estimating the economic size and effects of a potential research, design and development (RD&D) facility that designs goods to mitigate or help reverse climate change. What an economic impact study does is estimate additional business revenues, jobs and tax receipts supported by the creation or expansion of a specific industry or business in an area. This economic impact analysis estimates gains due to both construction and operations of the RD&D facility, including new housing units and the broader, economic reach on the surrounding areas’ businesses and workers and communities.
This facility would locate on the grounds previously home to the Sonoma Developmental Center (SDC) in Glen Ellen, California. The plan is to use the current structural footprint as a basis for the RD&D facility, called Eldridge Enterprise from here. The Eldridge Enterprise would be a first-of-its-type, public-private partnership dedicated to researching, designing and developing adaptive solutions to climate change. It is envisioned as a global hub for collaboration to accelerate the rate at which technological discoveries become the building blocks of a post-petroleum society. The model is similar to concentrated biomedical and genetic research centers that have enabled healthcare providers to find cures for once-deadly diseases. In order to understand the economic impacts from an organization such as the Eldridge Enterprise, the Sonoma County Water Agency (Sonoma Water) contracted Economic Forensics & Analytics (EFA) to estimate the economic impacts using specific assumptions about an alternative such as the Eldridge Enterprise for the site’s use. Support of this study is consistent with Sonoma Water’s Energy Policy to actively collaborate on regional energy projects and climate resiliency strategies that protect our watersheds, natural resources, energy resources, communities, economy, and infrastructure.
Recent economic data show demographic shifts occurring in Sonoma County that will contribute to slower economic growth. Lower net immigration and an aging workforce will adversely affect the county without a concerted effort to attract new industries, employers, workers, and resources. The Eldridge Enterprise's focus on mitigating and adapting to climate change could also diversify Sonoma County’s economy. This organization would create employment for 2,000 people in scientific research, engineering, product design, and process engineering; these jobs provide job opportunities for the county's youth and attract skilled workers.
This study makes assumptions about Eldridge Enterprise’s scale and economics to achieve the organization’s mission while fitting the site’s boundaries and planning parameters. Our analysis’ assumptions in short include:
• $1.2 billion in construction costs over nine years, including 940 housing units; • Annual sources of funds of approximately $300,000,000 for operations once at full scale
(year 10 after construction begins); and
5
• 2,087 workers on-site at full-scale operations, comprised of 87 workers on-site daily to provide support functions for the main operation of 2,000 RD&D facility workers:
o 1,000 workers focused on research and design, similar to a large scientific research facility (Sandia National Labs and Buck Institute are examples);
o 1,000 workers focused on product development, similar to a prototyping laboratory and facility (Qualcomm Institute Prototyping Lab at UC San Diego for example).
The site was occupied previously by the Sonoma Developmental Center (SDC). SDC was, from its establishment in 1891 until its closing in 2018, California’s first and longest-running facility created to serve the needs of individuals with developmental disabilities. At its peak scale, SDC had 3,200 residents and a 7-days-per-week staff of 1,300. There were also hundreds of families visiting on a regular basis. As models of care for the developmentally disabled grew smaller and more centrally located to community-residential neighborhoods, the state initiated a three-year shut-down period in 2015. SDC had a 200-acre campus, surrounded by over 700 acres of perpetually-preserved and managed forests, lakes and open space. The site currently includes 1.7 million square feet of educational, commercial and light-industrial spaces, interior roads, basic water/sewer and power/communication infrastructure, as well as existing housing units and space for more homes.
The Eldridge Enterprise alternative has two distinct phases of development: the capital improvement and expenditure (Capex) phase; and implementation of the RD&D operations (Opex). The IMPLAN® model evaluates the economic impact of both phases on Sonoma County and the State of California.1 The two phases overlap in years 2 through 10: the Capex phase runs years 1 through 10; the Opex phase starts in year 2 and runs though year 20 in the scenario presented here. When completed, the Eldridge Enterprises’ capital expenditure brings the water, sewer, power, and communications infrastructure up to current code including a solar-powered microgrid. This report’s economic analysis illustrates the monetary impact on Sonoma County of approximately 2,000 professional and skilled employees working at such an enterprise. This study considers the economic impacts on both Sonoma County and California of such a facility.
This study has the following sections. Section 2 is a brief overview, or the “why” of this alternative. Section 3 provides the direct economic impacts or the input data to analyze the broader, ripple effects from this alternative. Section 4 provides the economic impact estimates, including the effects on jobs and state and local tax revenues. Section 5 provides conclusions, followed by appendices.
1 See http://www.implan.com for more on the IMPLAN® model.
6
2. OVERVIEW OF THE ELDRIDGE ENTERPRISE
The Eldridge Enterprise (Eldridge) is envisioned to be a research, design and development (RD&D) center. Scientific labs that generate new theoretical ideas and products need a test space to develop and perfect products to make them viable for broader manufacturing. No mass manufacturing would happen at Eldridge. Research and design conducted at Eldridge would engage scientists, engineers and industrial designers to find new ways to power machines, construct buildings, warm homes, feed families, use water efficiently through water-efficient indoor and outdoor fixtures and systems, and provide clean transportation and materials. Product development at the Eldridge Enterprise would be done by skilled professionals that know current products and their applications to help perfect newly-designed more efficient product applications and ways to replace fossil-fuel based products and also conserve water.
Establishing an enterprise focused on human health and the natural environment’s preservation by finding ways to reduce or reverse climate change’s negative impacts carries on SDC’s legacy: a beautiful place where people and the community are cared for. The Eldridge Enterprise’s vision is to build a community where the children of Sonoma County can work in challenging, well-paid jobs near their families. As an inclusive community, housing for a number of its own employees and the community at large are to be provided. It would welcome people of all income levels, all ages, all abilities and all races; inclusion would be reflected in the types of housing and basic services available on site.
At its peak, the SDC had a minimum of 4,500 people on-site daily.2 The site and surrounding communities handily absorbed the impact of these activities. The Eldridge Enterprise alternative considered here stays within the boundaries of the former SDC, both physically and in terms of the number of people living and working on site. One reason for proposing the former Sonoma Developmental Center as the location for the Eldridge Enterprise is its proximity to the wealth and resources of Bay Area venture capital and technology companies. The Eldridge Enterprise can draw from global venture networks and investment capital to finance new product design and development on site. Such synergy and vitality will also attract skilled workers needed for innovation and commercialization.
Site Plan and Connections to Eldridge Enterprises
The Eldridge Enterprise idea is simple. Science designs products through research that are then developed to salable products to be finalized and produced off-site. The intellectual property designed and developed is meant to replace fossil fuel-based products at the fastest pace possible. There is no mass production on-site; there is likely small-scale production of
2 See WRT, SDC Assessment (2018). The larger WRT study is available at: https://transformsdc.com/sonoma-developmental-center-existing-conditions-assessment-wrt-august-2018/. We will refer to this report as the “Existing Conditions” report from here.
7
prototypes. Because there are so many categories of currently manufactured products that may be targeted for innovative replacements that do not use fossil fuel inputs (primarily petroleum), work on specific product replacement is to be prioritized by scalability and largest market effects.
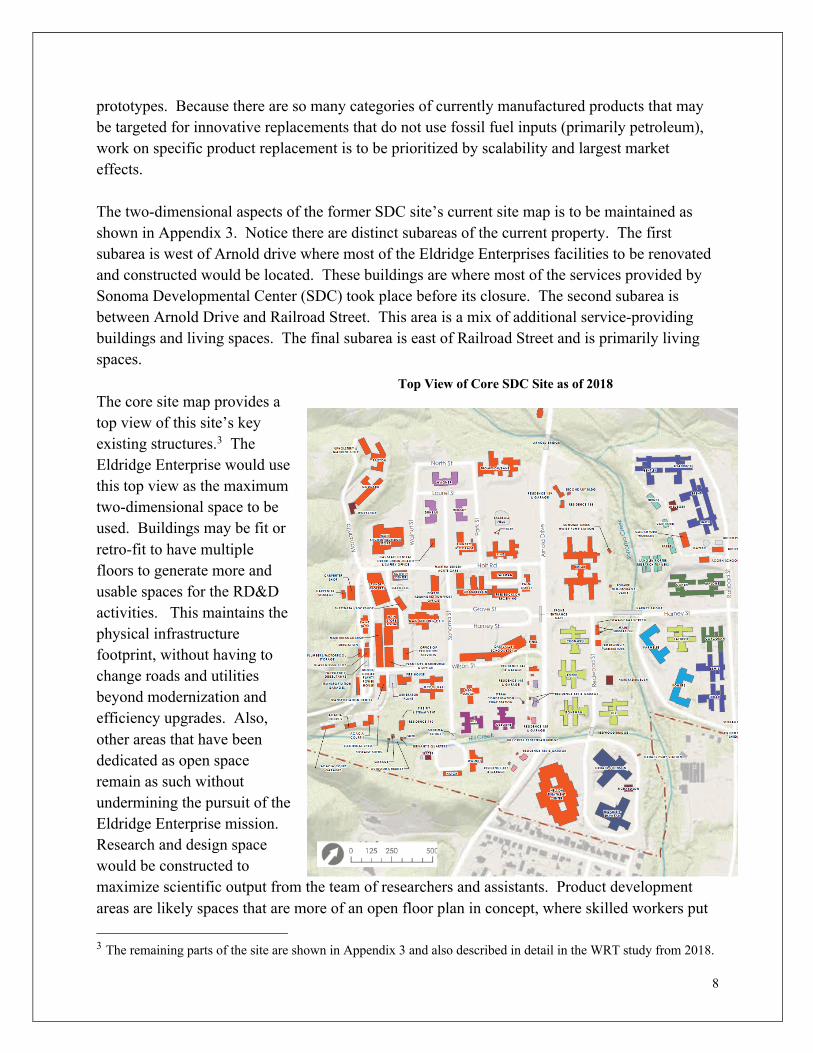
The two-dimensional aspects of the former SDC site’s current site map is to be maintained as shown in Appendix 3. Notice there are distinct subareas of the current property. The first subarea is west of Arnold drive where most of the Eldridge Enterprises facilities to be renovated and constructed would be located. These buildings are where most of the services provided by Sonoma Developmental Center (SDC) took place before its closure. The second subarea is between Arnold Drive and Railroad Street. This area is a mix of additional service-providing buildings and living spaces. The final subarea is east of Railroad Street and is primarily living spaces.
Top View of Core SDC Site as of 2018 The core site map provides a top view of this site’s key existing structures.3 The Eldridge Enterprise would use this top view as the maximum two-dimensional space to be used. Buildings may be fit or retro-fit to have multiple floors to generate more and usable spaces for the RD&D activities. This maintains the physical infrastructure footprint, without having to change roads and utilities beyond modernization and efficiency upgrades. Also, other areas that have been dedicated as open space remain as such without undermining the pursuit of the Eldridge Enterprise mission. Research and design space would be constructed to maximize scientific output from the team of researchers and assistants. Product development areas are likely spaces that are more of an open floor plan in concept, where skilled workers put
3 The remaining parts of the site are shown in Appendix 3 and also described in detail in the WRT study from 2018.
8
product designs through tests and also engage in small scale manufacturing of different prototype iterations.
The economic study and economic impact analyses below has assumptions that depends on the Eldridge Enterprise’s ability to scale. The site’s amenities and utilization evolve with the scale of Eldridge Enterprise; construction is slated to take approximately nine years to complete, and the operations scale to full size by year 10. For the local communities surrounding this site, the increase in activity brings with it more support for local businesses. There are also much needed housing units and additional tax revenues coming from a site that is currently fallow (as of 2021) and may have few serious suitors otherwise, given its size and scope.
3. ECONOMIC STUDY AND ECONOMIC IMPACT RESULTS
In this section, we consider assumptions for this alternative in its two phases, the levels of spending and employment, and the multiplier or ripple effects on both Sonoma County and the state of California during construction and subsequent operations at the Eldridge Enterprise. Let’s start by defining the direct spending on-site in both phases. These amounts are the core inputs to the economic impact modeling exercise below.
Construction investments includes re-purposing several of the 292 buildings on the campus, constructing labs and commercial structures for the main activities (1.4 million square feet), and also home building (980 units or approximately 1.2 million square feet). In keeping with the overarching goals of the Eldridge Enterprise, there will be a variety of multi-family and single-family housing types. Any increase in square footage on-site is achieved by building up and not out. The alternative is not to exceed the existing footprint in terms of total square feet.
The operations (Opex) phase model estimates the economic benefits of 2,000 workers engaged in the true, long-term work of this facility: research, design and development facility, discovering products and processes that use fewer natural resources and reverse climate-change problems. Eldridge Enterprise would employ many types of scientists, engineers, product and process engineers and designers as well as project managers, IT specialists and data analysts. A number of amenities that support the community are envisioned as part of the site, including a community market, health and fitness facilities, community center, and playing fields. The Eldridge Enterprise likely directly contracts for day-care services and building maintenance services, so these two functions are included in the operations (Opex) model. Support functions such as finance, accounting, legal and administrative staff, and maintenance engineers all work on site for an estimated total of 2,087 workers at peak scale.
We show significant economic benefits accruing to Sonoma County; we also estimate how the remainder of California could be affected as economic impacts extend beyond Sonoma County.
9
Once we describe the economics of both construction and scaling of operations, the IMPLAN®
model will estimate the economic impacts on Sonoma County and more broadly across California.
3.1 Direct Economic Benefits to Sonoma County
Eldridge Enterprise will generate substantial direct economic benefits for Sonoma County. The estimates below describe the Eldridge Enterprise Alternative and projects broader economic outcomes.4 In this section, we consider the basic plan for both phases of this project, the levels of spending and employment, and the multiplier or ripple effects on both Sonoma County and the state of California during construction and subsequent operations at the Eldridge Enterprise. Let’s start by defining the direct spending on-site in both phases. These amounts are the core input to the economic impact modeling exercise below.
3.1.1 Direct Capital Expenditures (Capex) of $1.6 billion over ten years
Capital Spending on-site at the Eldridge Enterprise includes upgrades for basic infrastructure like water/sewer/stormwater, power, communications, and interior roads. This alternative also proposes approximately 1.4 million square feet (s.f.) of research, design and development (RD&D) facilities including labs, model shops and office space.5 The Capex assumptions’ third portion builds on-site
Capital Expenditures Summary housing for Eldridge Enterprise employees and the community at large. Approximately 980 housing units are to be proposed, including both multi-family and single-family homes. The Capex phase is planned for years 1 to 10; references to specific years below are relative to year 1 when the Capex phase begins.
Direct capital expenditures include wages, building permits, plans, contractors, materials, construction expenses, and taxes paid by companies working on-site to create the physical
4 See Appendix 1 for a brief overview of the analysis conducted to estimate capital and operational spending. A 2-percent inflation rate over the 20 years is used. Given interest rates on 10-year Treasury Bonds are paying an average less than 2 percent from 2018 to 2020, 2 percent is a conservative estimate based on current expectations.5 Water and sewer modifications would be subject to approval and capacity available from local water (Valley of the Moon Water District) and sewer (Sonoma Valley County Sanitation District) entities. This may require funding efficiency upgrades outside this project but in the local service areas to free up systems capacity. The details of use of on-site water resources would be optimized during detail design.
10
community of the Eldridge Enterprise. Capital spending for infrastructure totals $123 million over three years. Year 1 of the Capex phase focuses on infrastructure replacement and modernization. Infrastructure project work includes: water and sewer systems, electric power and a microgrid, cable/broadband connections from Arnold Drive, and interior roads. Infrastructure spending is targeted for years 1 through 3 in the model.
Capital spending for RD&D facilities totals $745 million over eight years from year 1. RD&D facilities’ construction commences in year 2. RD&D facilities consist of laboratories, model shops, information technology (IT) control rooms, offices, and meeting spaces. Capital expenditure in RD&D facilities is spread over all ten years of construction. Additionally, total spending for housing is $746 million. Recognizing housing as a critical need for Sonoma County, the home construction phase runs years 3 through 8 to stay slightly ahead of the project’s commercial scale. Multi-family and single-family dwellings of various sizes and costs form the input for the model. Some housing would be for employees of the Eldridge Enterprise. Some housing would be for the community at large, reflecting the goal of building an inclusive community on site. All types of homes are part of this land-use alternative; affordable homes, housing for people with disabilities and senior housing are all envisioned for Eldridge.
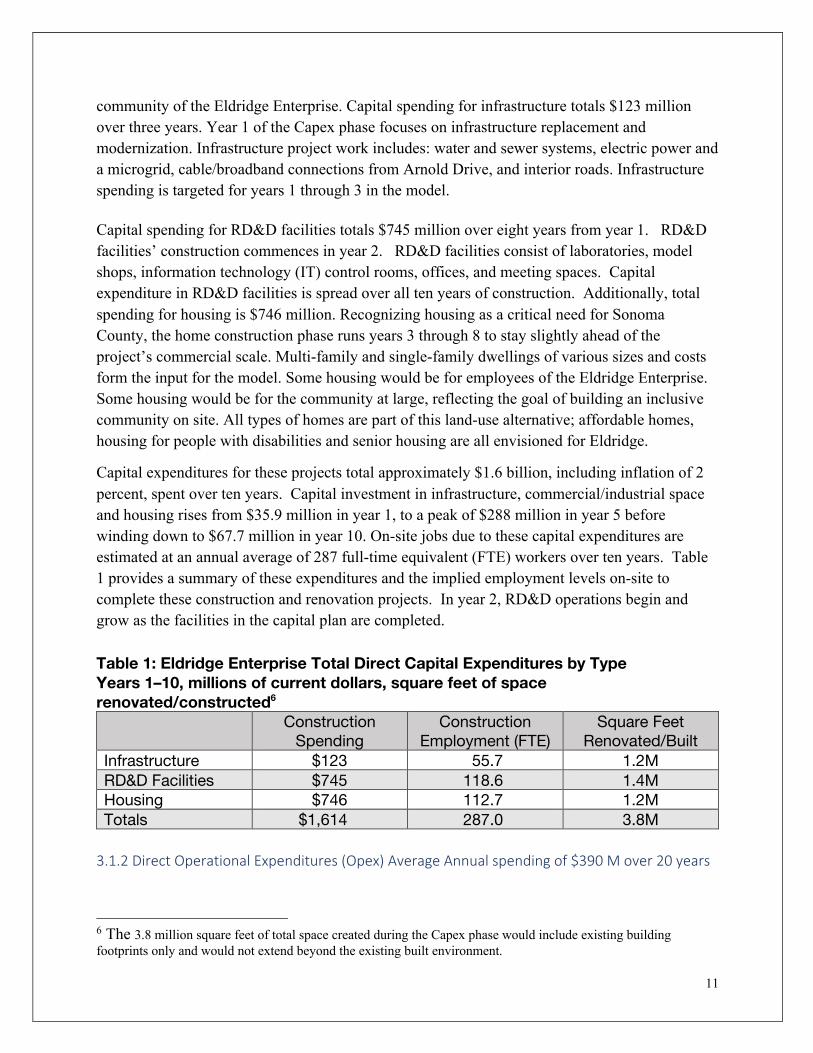
Capital expenditures for these projects total approximately $1.6 billion, including inflation of 2 percent, spent over ten years. Capital investment in infrastructure, commercial/industrial space and housing rises from $35.9 million in year 1, to a peak of $288 million in year 5 before winding down to $67.7 million in year 10. On-site jobs due to these capital expenditures are estimated at an annual average of 287 full-time equivalent (FTE) workers over ten years. Table 1 provides a summary of these expenditures and the implied employment levels on-site to complete these construction and renovation projects. In year 2, RD&D operations begin and grow as the facilities in the capital plan are completed.
Table 1: Eldridge Enterprise Total Direct Capital Expenditures by TypeYears 1–10, millions of current dollars, square feet of space renovated/constructed6
Construction Spending
Construction Employment (FTE)
Square FeetRenovated/Built
Infrastructure $123 55.7 1.2M RD&D Facilities $745 118.6 1.4M Housing $746 112.7 1.2M Totals $1,614 287.0 3.8M
3.1.2 Direct Operational Expenditures (Opex) Average Annual spending of $390 M over 20 years
6 The 3.8 million square feet of total space created during the Capex phase would include existing building footprints only and would not extend beyond the existing built environment.
11
Eldridge Enterprise operations begin in year 2, a year after the Capex plan described above begins. Years 2 to 10 show spending rising from $18 million in year 2 to just under $438 million in year 10. These numbers include inflation, which is estimated to be and average of 2 percent per year to match the assumptions above. Annual funding from various sources – investors, research institutes or foundations as examples – supports research, design and development (RD&D) teams. Two support services will be contracted directly by Eldridge Enterprise on-site: (1) day care services; and (2) building maintenance. Expenditures are mainly for wages paid to Enterprise employees. This includes the scientists, engineers, model shop workers, designers, managers, administrative staff, day-care employees, and building-maintenance engineers. These services also create new jobs and generate business incomes. By year 10, day-care services account for $6.9 million in annual operational spending and building maintenance accounts for $2.5 million annually.
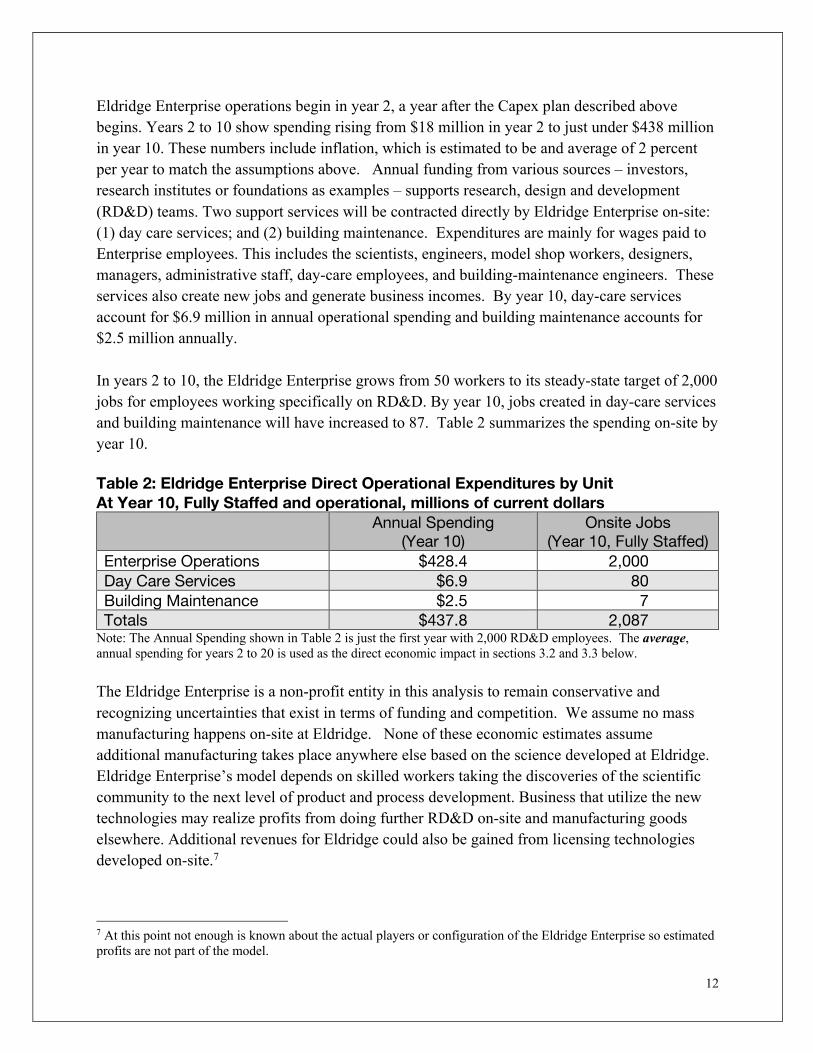
In years 2 to 10, the Eldridge Enterprise grows from 50 workers to its steady-state target of 2,000 jobs for employees working specifically on RD&D. By year 10, jobs created in day-care services and building maintenance will have increased to 87. Table 2 summarizes the spending on-site by year 10.
Table 2: Eldridge Enterprise Direct Operational Expenditures by UnitAt Year 10, Fully Staffed and operational, millions of current dollars
Annual Spending(Year 10)
Onsite Jobs (Year 10, Fully Staffed)
Enterprise Operations $428.4 2,000 Day Care Services $6.9 80 Building Maintenance $2.5 7 Totals $437.8 2,087
Note: The Annual Spending shown in Table 2 is just the first year with 2,000 RD&D employees. The average, annual spending for years 2 to 20 is used as the direct economic impact in sections 3.2 and 3.3 below.
The Eldridge Enterprise is a non-profit entity in this analysis to remain conservative and recognizing uncertainties that exist in terms of funding and competition. We assume no mass manufacturing happens on-site at Eldridge. None of these economic estimates assume additional manufacturing takes place anywhere else based on the science developed at Eldridge. Eldridge Enterprise’s model depends on skilled workers taking the discoveries of the scientific community to the next level of product and process development. Business that utilize the new technologies may realize profits from doing further RD&D on-site and manufacturing goods elsewhere. Additional revenues for Eldridge could also be gained from licensing technologies developed on-site.7
7 At this point not enough is known about the actual players or configuration of the Eldridge Enterprise so estimated profits are not part of the model.
12
3.2 Broader Geographic Economic Impacts
This section takes the core business model for Eldridge and uses an economic impact model to show how the construction and operations spending become support for hundreds of businesses, thousands of workers and every municipality in Sonoma County, as well as broader effects on California at large. The direct impacts shown above begin the economic impact process and represent Eldridge Enterprise business revenues and employment. These impacts in turn stimulate additional economic activity in Sonoma County and throughout California. The increased cash flows to Eldridge Enterprise vendors, workers, and contractors engaged to build Eldridge Enterprise facilities and supply goods and services needed for its research, design and development efforts create new business revenues and jobs that would not exist without the Eldridge Enterprise capital and operational expenditures.
3.2.1 What are Indirect and Induced impacts?
These added economic effects, after Eldridge Enterprise construction and operations begin, are called indirect impacts. These are direct vendor relationships; for example, if one of the housing units on-site needs plumbing services, there would be additional revenue for that plumber and her employees. Economic impacts broaden even more as Eldridge Enterprise employees and vendor’s employees spend some of their earnings in the county and statewide on a broad array of consumer goods and services. These rounds of additional spending create what are called induced impacts. Businesses benefitting from this increase in spending include everything from local farmers to hair salons, with the largest effects on retail, healthcare, and other “in-person” services (including restaurant meals and entertainment). Jobs are supported and more state and local tax revenue is generated from hundreds of industries and their employers. Eldridge Enterprises total impact on the Sonoma County economy is the sum of its direct, indirect and induced impacts. Very few parts of the local economy go untouched.
The graphic below shows a way to consider these impacts in sum. A smaller area (Sonoma County) can create economic impacts within a larger area (California). Figure 1 provides a way to visualize the ripple effects from the Eldridge Enterprise; notice the statewide impacts on California are slightly larger from the same source as they include the Sonoma County impacts.
The direct impact is Eldridge Enterprises revenues alone (which include payroll and other expenses). This is the same whether the indirect and induced impacts are measured only as far as Sonoma County or across the entire state. Clearly the indirect and induced effects become larger when the impact area measured is expanded to include the entire state. With this review and explanation of how economic impact analyses work, let’s now look at what the broader impacts of the Eldridge Enterprise could be on Sonoma County and California.
13
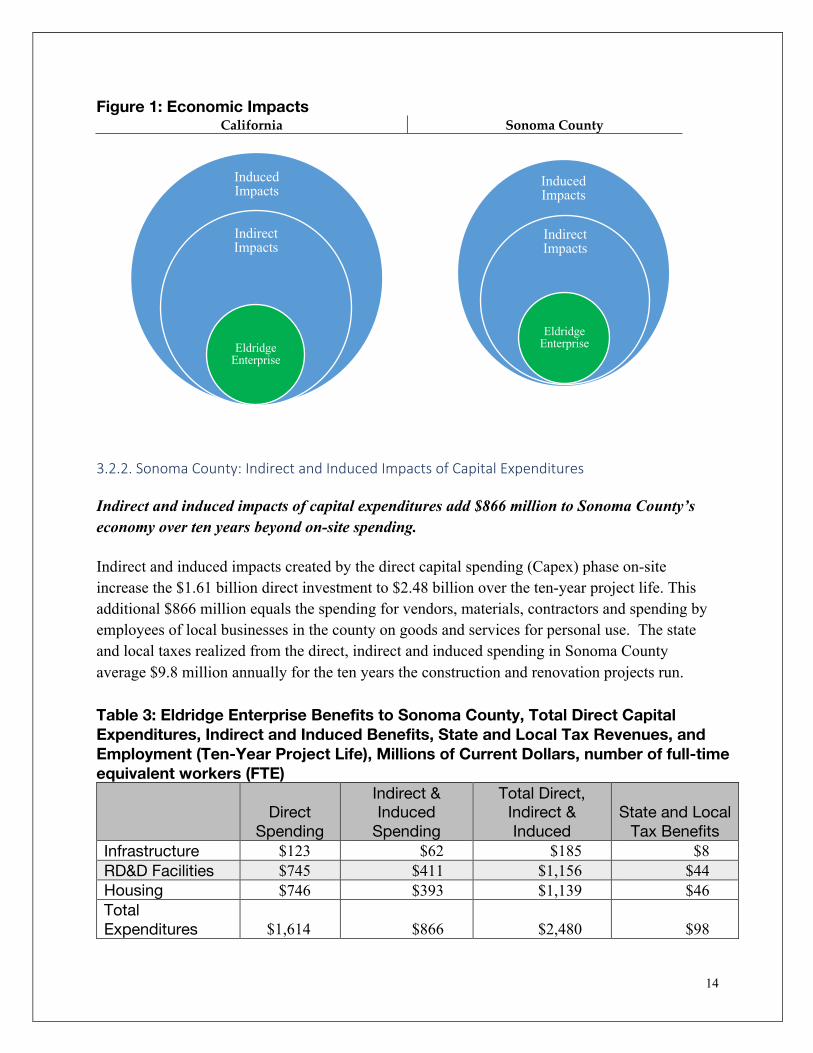
Figure 1: Economic ImpactsCalifornia Sonoma County
Induced Impacts
Indirect Impacts
EldridgeEnterprise
Induced Impacts
Indirect Impacts
EldridgeEnterprise
3.2.2. Sonoma County: Indirect and Induced Impacts of Capital Expenditures
Indirect and induced impacts of capital expenditures add $866 million to Sonoma County’s economy over ten years beyond on-site spending.
Indirect and induced impacts created by the direct capital spending (Capex) phase on-site increase the $1.61 billion direct investment to $2.48 billion over the ten-year project life. This additional $866 million equals the spending for vendors, materials, contractors and spending by employees of local businesses in the county on goods and services for personal use. The state and local taxes realized from the direct, indirect and induced spending in Sonoma County average $9.8 million annually for the ten years the construction and renovation projects run.
Table 3: Eldridge Enterprise Benefits to Sonoma County, Total Direct Capital Expenditures, Indirect and Induced Benefits, State and Local Tax Revenues, and Employment (Ten-Year Project Life), Millions of Current Dollars, number of full-time equivalent workers (FTE)
Direct Spending
Indirect & Induced
Spending
Total Direct, Indirect & Induced
State and Local Tax Benefits
Infrastructure $123 $62 $185 $8 RD&D Facilities $745 $411 $1,156 $44 Housing $746 $393 $1,139 $46 Total Expenditures $1,614 $866 $2,480 $98
14
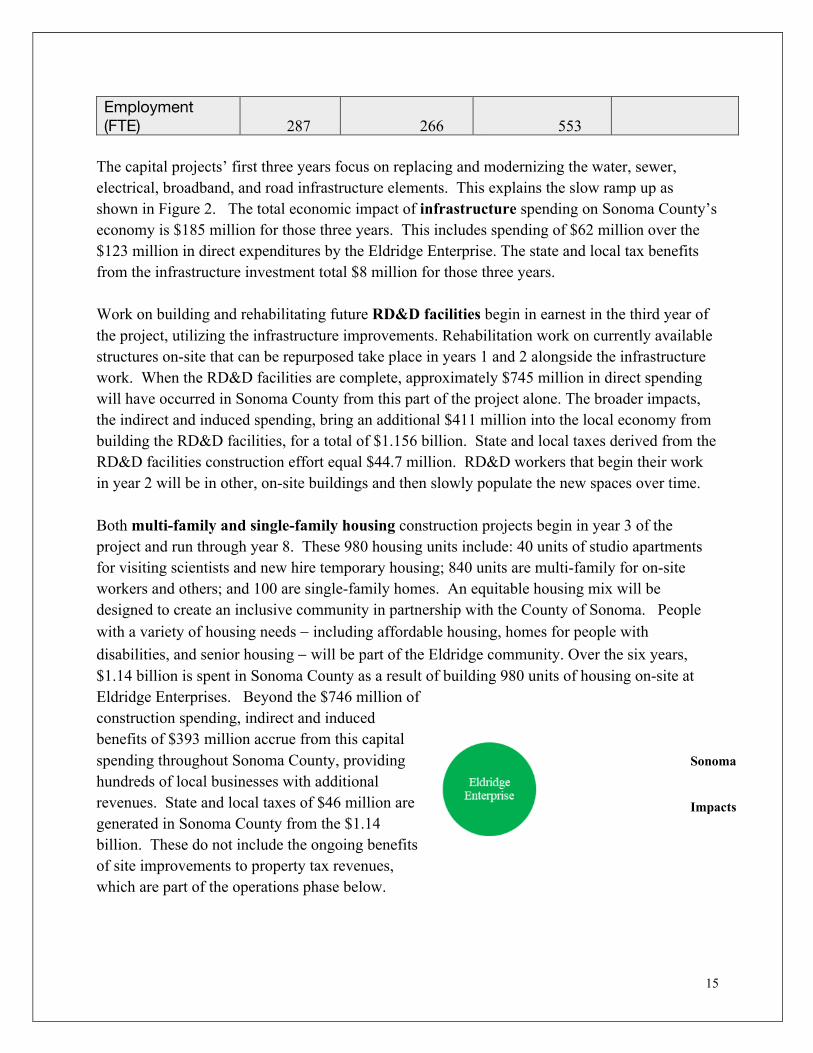
Employment(FTE) 287 266 553
The capital projects’ first three years focus on replacing and modernizing the water, sewer, electrical, broadband, and road infrastructure elements. This explains the slow ramp up as shown in Figure 2. The total economic impact of infrastructure spending on Sonoma County’s economy is $185 million for those three years. This includes spending of $62 million over the $123 million in direct expenditures by the Eldridge Enterprise. The state and local tax benefits from the infrastructure investment total $8 million for those three years.
Work on building and rehabilitating future RD&D facilities begin in earnest in the third year of the project, utilizing the infrastructure improvements. Rehabilitation work on currently available structures on-site that can be repurposed take place in years 1 and 2 alongside the infrastructure work. When the RD&D facilities are complete, approximately $745 million in direct spending will have occurred in Sonoma County from this part of the project alone. The broader impacts, the indirect and induced spending, bring an additional $411 million into the local economy from building the RD&D facilities, for a total of $1.156 billion. State and local taxes derived from the RD&D facilities construction effort equal $44.7 million. RD&D workers that begin their work in year 2 will be in other, on-site buildings and then slowly populate the new spaces over time.
Both multi-family and single-family housing construction projects begin in year 3 of the project and run through year 8. These 980 housing units include: 40 units of studio apartments for visiting scientists and new hire temporary housing; 840 units are multi-family for on-site workers and others; and 100 are single-family homes. An equitable housing mix will be designed to create an inclusive community in partnership with the County of Sonoma. People with a variety of housing needs - including affordable housing, homes for people with disabilities, and senior housing - will be part of the Eldridge community. Over the six years, $1.14 billion is spent in Sonoma County as a result of building 980 units of housing on-site at Eldridge Enterprises. Beyond the $746 million of construction spending, indirect and induced benefits of $393 million accrue from this capital spending throughout Sonoma County, providing hundreds of local businesses with additional revenues. State and local taxes of $46 million are generated in Sonoma County from the $1.14 billion. These do not include the ongoing benefits of site improvements to property tax revenues, which are part of the operations phase below.
Sonoma
Impacts
15
Construction efforts, as shown above, generate robust economic impacts on local communities. The IMPLAN® model provides detailed estimates as to the other industries indirectly affected by spending and those that see gains due to the induced spending. The number of workers on-site varies from year to year during the entire construction phase. The annual, average number of workers on-site is estimated to be 287. The overall project spending, as well as these workers spending their earnings, supports another 266 jobs in Sonoma County for an annual average of approximately 553 full-time equivalent jobs supported in years 1 to 10. These jobs end when the capital expenditures are complete. It is more conservative to estimate none of these 553 jobs continue after the construction efforts are complete, and that is what we do here. However, some of these jobs may become permanent due to the Eldridge Enterprise’s capital spending increasing Sonoma County’s overall economic capacity.
Table 4 shows the industries that are most affected by the Eldridge Enterprise’s Capex phase in terms of business revenues and employment. In some cases, these are the same; notice that the industries gaining the most in additional employment are mainly personal-services jobs.
Table 4: Industries Affected through Economic Impacts. Capex Phase, the Eldridge Enterprise Business Revenues Employment • Architectural, engineering, and related services • Real estate agency • Commercial/industrial machinery rental/leasing • Wholesale - Durable goods wholesalers • Retail - Building material supplies and stores • Hospitals • Tenant-occupied housing • Full-service restaurants • Employment services • Wholesale - Household appliances and
electronic goods
• Full-service restaurants • Other real estate • Employment services • Limited-service restaurants • Individual and family services • Wholesale - Durable goods wholesalers • Accounting, bookkeeping, payroll services • Legal services • Hospitals • Landscape and horticultural services • All other food and drinking places
Note: These are in descending order of effects from the Capex spending
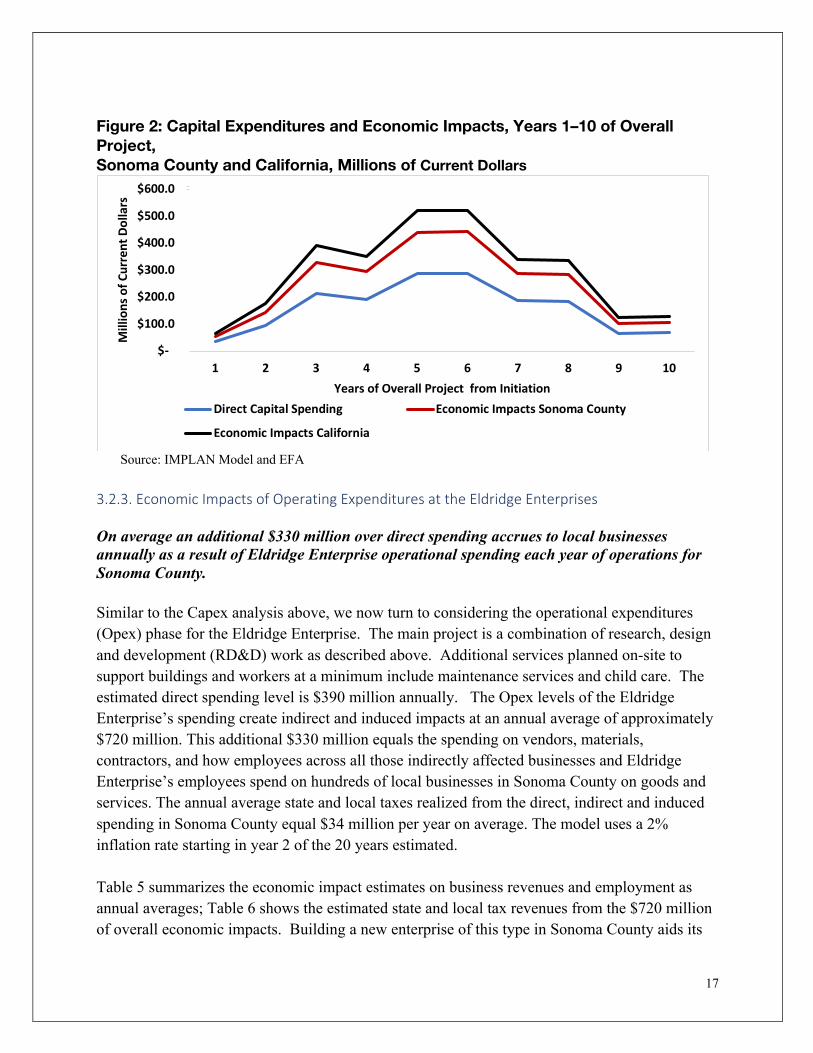
Figure 2 shows the annual spending as a way to guide the reader as to how these projects evolve over time. Figure 2 shows that the Capex spending peak is years 5 and 6. Direct capital expenditures and resulting impacts (indirect and induced) for Sonoma County start at $35.6 million in the first year of the project, peak at $287.6 million in the sixth year and then taper to $67.8 million in the tenth year as the Capex phase concludes.
16
Mill
ions
of C
urre
nt D
olla
rs
Figure 2: Capital Expenditures and Economic Impacts, Years 1–10 of Overall Project, Sonoma County and California, Millions of Current Dollars
$600.0
$500.0
$400.0
$300.0
$200.0
$100.0
$-1 2 3 4 5 6 7 8 9 10
Years of Overall Project from Initiation Direct Capital Spending Economic Impacts Sonoma County
Economic Impacts California
Source: IMPLAN Model and EFA
3.2.3. Economic Impacts of Operating Expenditures at the Eldridge Enterprises
On average an additional $330 million over direct spending accrues to local businesses annually as a result of Eldridge Enterprise operational spending each year of operations for Sonoma County.
Similar to the Capex analysis above, we now turn to considering the operational expenditures (Opex) phase for the Eldridge Enterprise. The main project is a combination of research, design and development (RD&D) work as described above. Additional services planned on-site to support buildings and workers at a minimum include maintenance services and child care. The estimated direct spending level is $390 million annually. The Opex levels of the Eldridge Enterprise’s spending create indirect and induced impacts at an annual average of approximately $720 million. This additional $330 million equals the spending on vendors, materials, contractors, and how employees across all those indirectly affected businesses and Eldridge Enterprise’s employees spend on hundreds of local businesses in Sonoma County on goods and services. The annual average state and local taxes realized from the direct, indirect and induced spending in Sonoma County equal $34 million per year on average. The model uses a 2% inflation rate starting in year 2 of the 20 years estimated.
Table 5 summarizes the economic impact estimates on business revenues and employment as annual averages; Table 6 shows the estimated state and local tax revenues from the $720 million of overall economic impacts. Building a new enterprise of this type in Sonoma County aids its
17
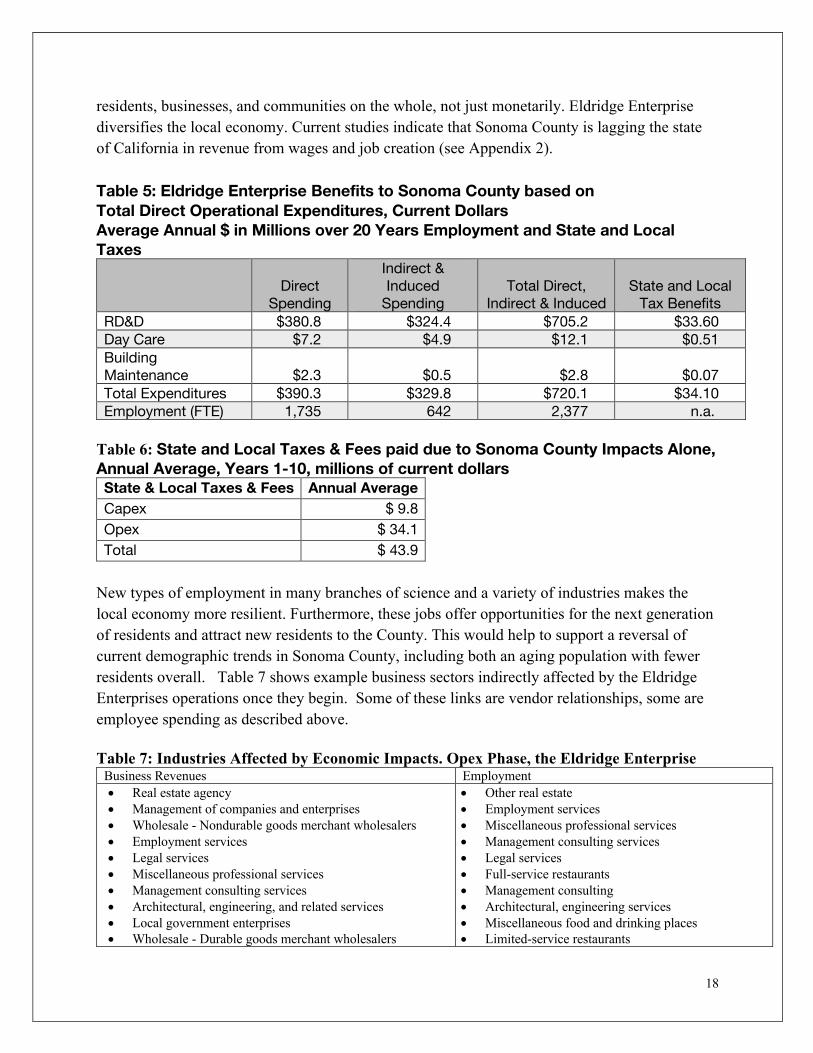
residents, businesses, and communities on the whole, not just monetarily. Eldridge Enterprise diversifies the local economy. Current studies indicate that Sonoma County is lagging the state of California in revenue from wages and job creation (see Appendix 2).
Table 5: Eldridge Enterprise Benefits to Sonoma County based on Total Direct Operational Expenditures, Current Dollars Average Annual $ in Millions over 20 Years Employment and State and Local Taxes
Direct Spending
Indirect & Induced
Spending Total Direct,
Indirect & Induced State and Local
Tax Benefits RD&D $380.8 $324.4 $705.2 $33.60 Day Care $7.2 $4.9 $12.1 $0.51 Building Maintenance $2.3 $0.5 $2.8 $0.07 Total Expenditures $390.3 $329.8 $720.1 $34.10 Employment (FTE) 1,735 642 2,377 n.a.
Table 6: State and Local Taxes & Fees paid due to Sonoma County Impacts Alone,Annual Average, Years 1-10, millions of current dollars State & Local Taxes & Fees Annual Average Capex $ 9.8 Opex $ 34.1 Total $ 43.9
New types of employment in many branches of science and a variety of industries makes the local economy more resilient. Furthermore, these jobs offer opportunities for the next generation of residents and attract new residents to the County. This would help to support a reversal of current demographic trends in Sonoma County, including both an aging population with fewer residents overall. Table 7 shows example business sectors indirectly affected by the Eldridge Enterprises operations once they begin. Some of these links are vendor relationships, some are employee spending as described above.
Table 7: Industries Affected by Economic Impacts. Opex Phase, the Eldridge Enterprise Business Revenues Employment • Real estate agency • Management of companies and enterprises • Wholesale - Nondurable goods merchant wholesalers • Employment services • Legal services • Miscellaneous professional services • Management consulting services • Architectural, engineering, and related services • Local government enterprises • Wholesale - Durable goods merchant wholesalers
• Other real estate • Employment services • Miscellaneous professional services • Management consulting services • Legal services • Full-service restaurants • Management consulting • Architectural, engineering services • Miscellaneous food and drinking places • Limited-service restaurants
18
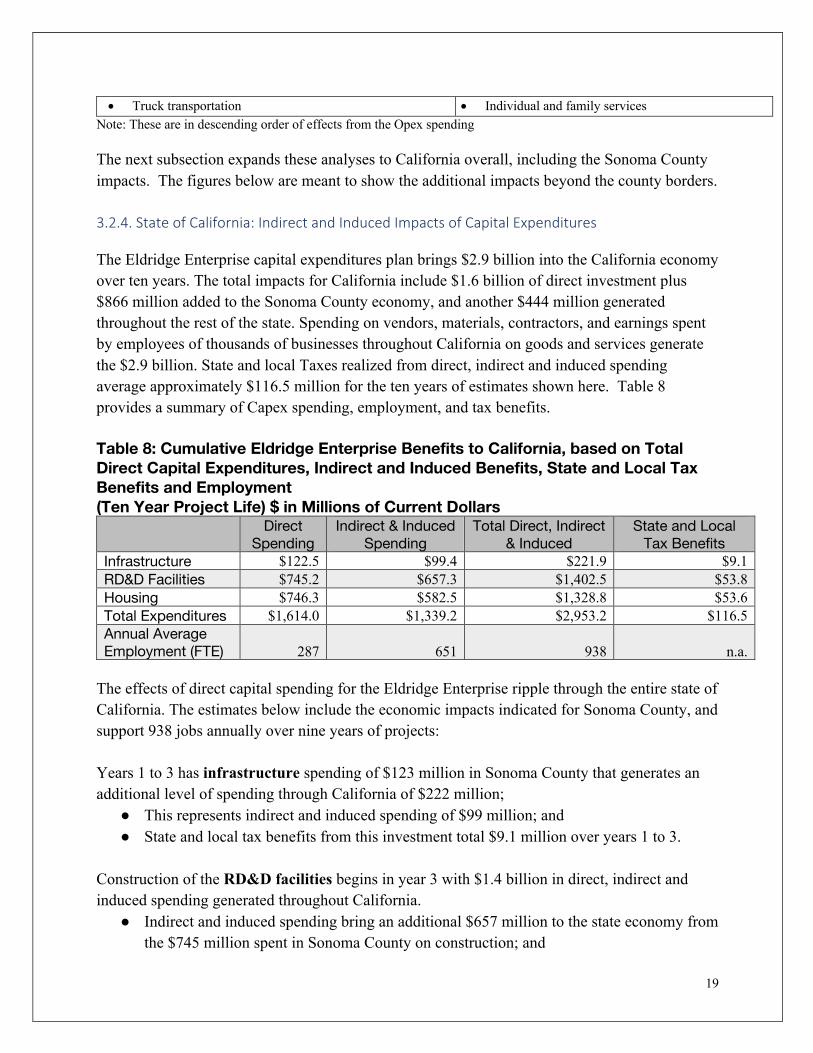
• Truck transportation • Individual and family services Note: These are in descending order of effects from the Opex spending
The next subsection expands these analyses to California overall, including the Sonoma County impacts. The figures below are meant to show the additional impacts beyond the county borders.
3.2.4. State of California: Indirect and Induced Impacts of Capital Expenditures
The Eldridge Enterprise capital expenditures plan brings $2.9 billion into the California economy over ten years. The total impacts for California include $1.6 billion of direct investment plus $866 million added to the Sonoma County economy, and another $444 million generated throughout the rest of the state. Spending on vendors, materials, contractors, and earnings spent by employees of thousands of businesses throughout California on goods and services generate the $2.9 billion. State and local Taxes realized from direct, indirect and induced spending average approximately $116.5 million for the ten years of estimates shown here. Table 8 provides a summary of Capex spending, employment, and tax benefits.
Table 8: Cumulative Eldridge Enterprise Benefits to California, based on Total Direct Capital Expenditures, Indirect and Induced Benefits, State and Local TaxBenefits and Employment(Ten Year Project Life) $ in Millions of Current Dollars
Direct Spending
Indirect & Induced Spending
Total Direct, Indirect & Induced
State and Local Tax Benefits
Infrastructure $122.5 $99.4 $221.9 $9.1 RD&D Facilities $745.2 $657.3 $1,402.5 $53.8 Housing $746.3 $582.5 $1,328.8 $53.6 Total Expenditures $1,614.0 $1,339.2 $2,953.2 $116.5 Annual AverageEmployment (FTE) 287 651 938 n.a.
The effects of direct capital spending for the Eldridge Enterprise ripple through the entire state of California. The estimates below include the economic impacts indicated for Sonoma County, and support 938 jobs annually over nine years of projects:
Years 1 to 3 has infrastructure spending of $123 million in Sonoma County that generates an additional level of spending through California of $222 million;
● This represents indirect and induced spending of $99 million; and ● State and local tax benefits from this investment total $9.1 million over years 1 to 3.
Construction of the RD&D facilities begins in year 3 with $1.4 billion in direct, indirect and induced spending generated throughout California.
● Indirect and induced spending bring an additional $657 million to the state economy from the $745 million spent in Sonoma County on construction; and
19
● State and local taxes are estimated to be $53.8 million over ten years for the state and numerous counties and cities.
Multi-family and single-family housing construction efforts begin in year 3 also. Over six years of construction to generate 980 units for California, $746 million in construction spending generates $1.2 billion throughout California of business revenues:
● Indirect and induced benefits of $438.8 million accrue to California from capital spending on housing; and
● State and local taxes of $47.8 million are generated inside the $1.2 billion during the Capex phase for the state overall.
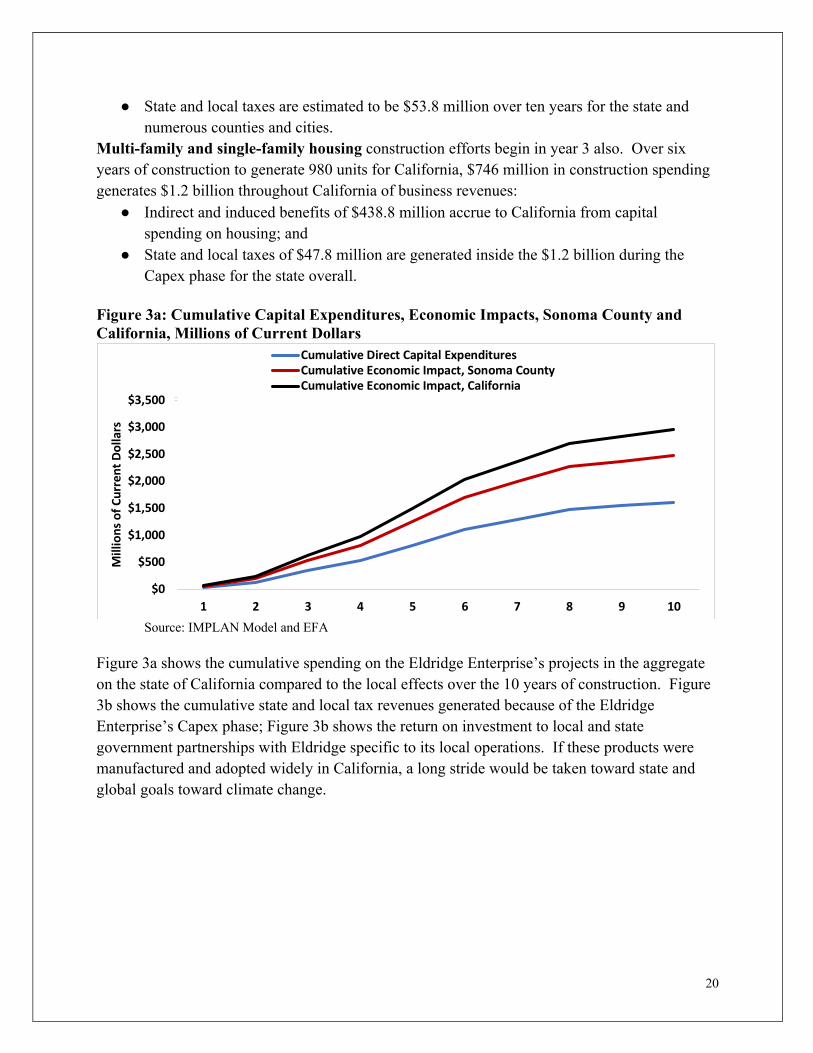
Figure 3a: Cumulative Capital Expenditures, Economic Impacts, Sonoma County and California, Millions of Current Dollars
Cumulative Direct Capital Expenditures Cumulative Economic Impact, Sonoma County Cumulative Economic Impact, California
$3,500
$3,000
$2,500
$2,000
$1,500
$1,000
$500
$0 1 2 3 4 5 6 7 8 9 10
Source: IMPLAN Model and EFA
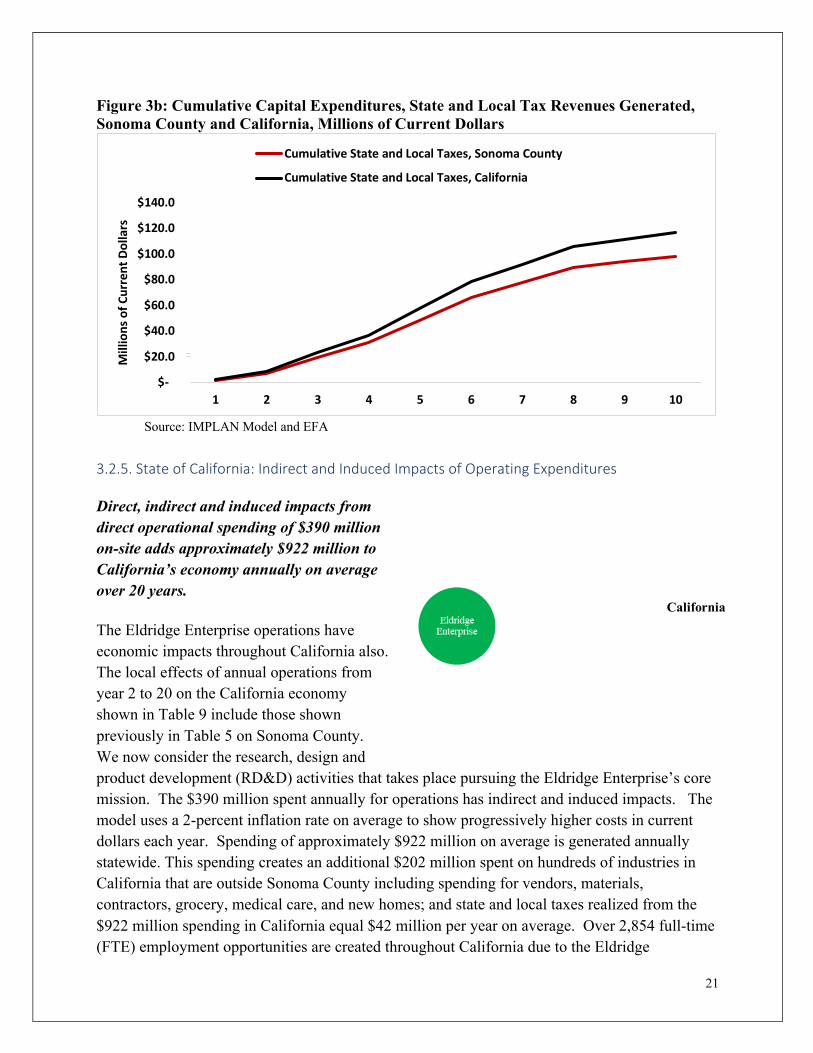
Figure 3a shows the cumulative spending on the Eldridge Enterprise’s projects in the aggregate on the state of California compared to the local effects over the 10 years of construction. Figure 3b shows the cumulative state and local tax revenues generated because of the Eldridge Enterprise’s Capex phase; Figure 3b shows the return on investment to local and state government partnerships with Eldridge specific to its local operations. If these products were manufactured and adopted widely in California, a long stride would be taken toward state and global goals toward climate change.
Mill
ions
of C
urre
nt D
olla
rs
20
--
Figure 3b: Cumulative Capital Expenditures, State and Local Tax Revenues Generated, Sonoma County and California, Millions of Current Dollars
Cumulative State and Local Taxes, Sonoma County
Cumulative State and Local Taxes, California
$140.0
$120.0
$100.0
$80.0
$60.0
$40.0
$20.0
$-1 2 3 4 5 6 7 8 9 10
Source: IMPLAN Model and EFA
3.2.5. State of California: Indirect and Induced Impacts of Operating Expenditures
Direct, indirect and induced impacts from direct operational spending of $390 million on-site adds approximately $922 million to California’s economy annually on average over 20 years.
The Eldridge Enterprise operations have economic impacts throughout California also. The local effects of annual operations from year 2 to 20 on the California economy shown in Table 9 include those shown previously in Table 5 on Sonoma County. We now consider the research, design and product development (RD&D) activities that takes place pursuing the Eldridge Enterprise’s core mission. The $390 million spent annually for operations has indirect and induced impacts. The model uses a 2-percent inflation rate on average to show progressively higher costs in current dollars each year. Spending of approximately $922 million on average is generated annually statewide. This spending creates an additional $202 million spent on hundreds of industries in California that are outside Sonoma County including spending for vendors, materials, contractors, grocery, medical care, and new homes; and state and local taxes realized from the $922 million spending in California equal $42 million per year on average. Over 2,854 full-time (FTE) employment opportunities are created throughout California due to the Eldridge
Mill
ions
of C
urre
nt D
olla
rs
California
21
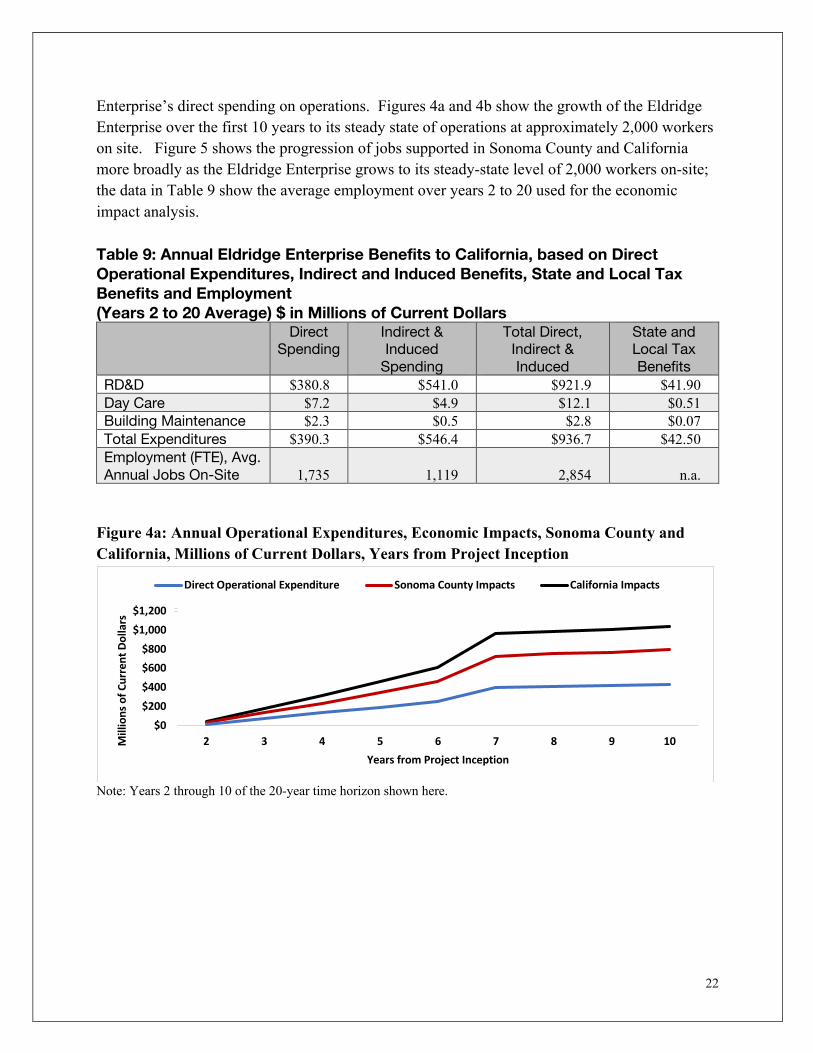
Enterprise’s direct spending on operations. Figures 4a and 4b show the growth of the Eldridge Enterprise over the first 10 years to its steady state of operations at approximately 2,000 workers on site. Figure 5 shows the progression of jobs supported in Sonoma County and California more broadly as the Eldridge Enterprise grows to its steady-state level of 2,000 workers on-site; the data in Table 9 show the average employment over years 2 to 20 used for the economic impact analysis.
Table 9: Annual Eldridge Enterprise Benefits to California, based on Direct Operational Expenditures, Indirect and Induced Benefits, State and Local Tax Benefits and Employment(Years 2 to 20 Average) $ in Millions of Current Dollars
Direct Spending
Indirect & Induced
Spending
Total Direct, Indirect & Induced
State and Local Tax Benefits
RD&D $380.8 $541.0 $921.9 $41.90 Day Care $7.2 $4.9 $12.1 $0.51 Building Maintenance $2.3 $0.5 $2.8 $0.07 Total Expenditures $390.3 $546.4 $936.7 $42.50 Employment (FTE), Avg. Annual Jobs On-Site 1,735 1,119 2,854 n.a.
Figure 4a: Annual Operational Expenditures, Economic Impacts, Sonoma County and California, Millions of Current Dollars, Years from Project Inception
Direct Operational Expenditure Sonoma County Impacts California Impacts
s $1,200
olla
r
$1,000
t D $800
rren $600
f Cu $400
o $200
llion
s
$0
Mi
2 3 4 5 6 7 8 9 10 Years from Project Inception
Note: Years 2 through 10 of the 20-year time horizon shown here.
22
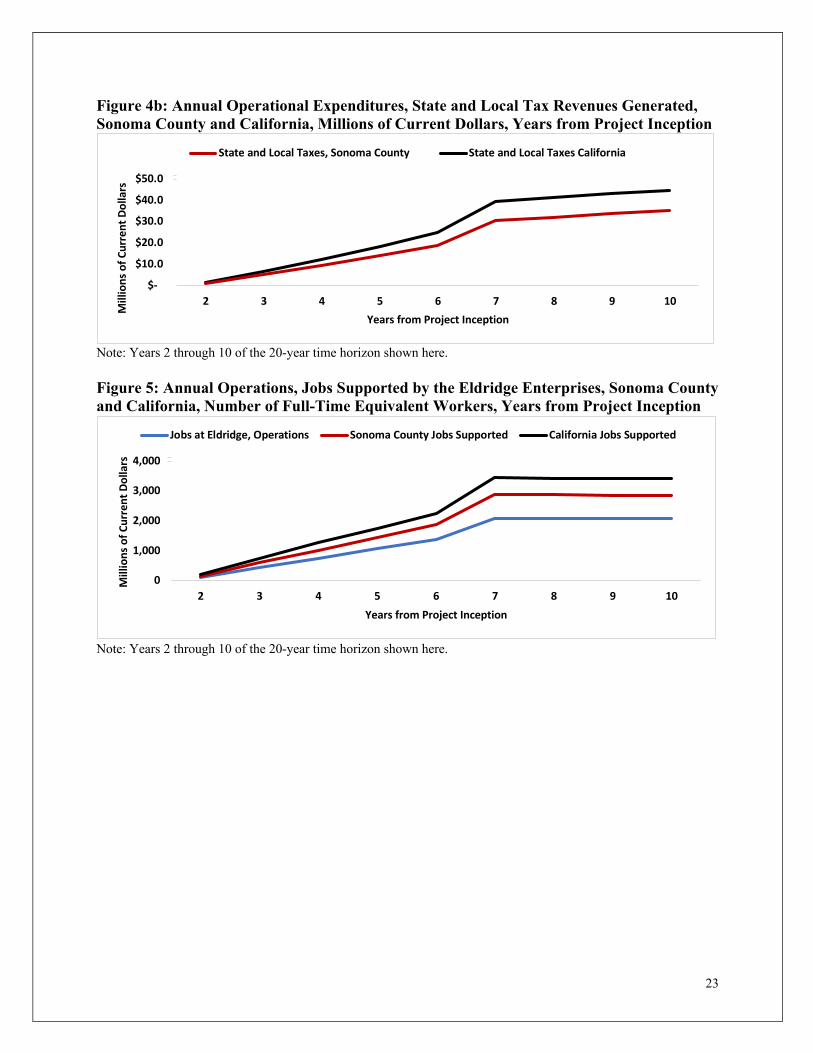
Figure 4b: Annual Operational Expenditures, State and Local Tax Revenues Generated, Sonoma County and California, Millions of Current Dollars, Years from Project Inception
State and Local Taxes, Sonoma County State and Local Taxes California
$50.0
Mill
ions
of C
urre
nt D
olla
rs
$40.0
$30.0
$20.0
$10.0
$-2 3 4 5 6 7 8 9 10
Years from Project Inception
Note: Years 2 through 10 of the 20-year time horizon shown here.
Figure 5: Annual Operations, Jobs Supported by the Eldridge Enterprises, Sonoma County and California, Number of Full-Time Equivalent Workers, Years from Project Inception
Jobs at Eldridge, Operations Sonoma County Jobs Supported California Jobs Supported
Mill
ions
of C
urre
nt D
olla
rs 4,000
3,000
2,000
1,000
0 2 3 4 5 6 7
Years from Project Inception 8 9 10
Note: Years 2 through 10 of the 20-year time horizon shown here.
23
4. Conclusions
Eldridge Enterprise generates significant economic benefits for both Sonoma County and California
The creation and operation of the Eldridge Enterprise produces meaningful economic benefits in Sonoma County. Significant capital expenditures result in new and upgraded infrastructure, light industrial space and new housing units. Direct capital expenditures of $1.6 billion over ten years generates an additional $866 million within Sonoma County for local vendors, contractors, restaurants and service providers while preservation and reconstruction of the site take place. On top of the billions of dollars put into the local economy and diverse set of high-paying jobs introduced, the Eldridge Enterprise plan establishes 980 units of new housing for the community as a whole.
Within ten years, this study estimates $2.8 billion in direct, indirect and induced impacts flowing to businesses and service providers throughout California due to capital investment made at Eldridge in infrastructure, facilities and housing. Capital investments in water, sewer and storm-water systems, electricity and microgrid utility infrastructure, cable/broadband information systems, and interior roads produce increased tax revenues for Sonoma County during construction. A total of $98 million in state and local tax revenues come from capital expenditures over ten years. Operations utilize the infrastructure over 20 years minimum.
Benefits over 20 Years Over a 20-year period, Eldridge Enterprise’s annual operating expenditures of $390 million, generating another $330 million in the Sonoma County economy each year. The annual average of $720 million in spending over 20 years in Sonoma County supports over 2,350 workers due to the Eldridge Enterprise’s operations. Another $202 million spills over into other parts of California annually, supporting more jobs. State and local tax benefits are $34.1 million per year based on spending within Sonoma County, and another $8.4 million throughout California, an annual total of $42.5 million.
Job Creation Jobs created at Eldridge Enterprise are primarily in scientific research, product design and engineering of new products, processes and equipment maintenance, project management, information technology (IT), and administrative, legal, and finance jobs necessary to run and support Eldridge Enterprise’s operations. At peak operations, over 2,850 workers are supported in Sonoma County by Eldridge Enterprise through its broader economic benefits.
Conservative Estimates These estimates are conservative. The model does not estimate subsequent manufacturing of new products from Eldridge Enterprise that could occur in California. The model does not calculate impacts from alternative energy, alternative water use efficiency, and cost-saving processes that
24
25
are developed at Eldridge Enterprise. There is also the possibility that new manufacturing facilities could grow up around the state to make the equipment, materials, and products researched, designed, and developed in Sonoma County. Strategic Economic Development and Catalyst for Future Investment and Growth Recent news articles indicate that new and established businesses are looking at products and processes for the next century - products that are not detrimental to the natural environment and processes that use less energy and water to create what’s equitably necessary for nine billion people soon to occupy the planet.8 An enterprise focused on discovering adaptive solutions to the effects of climate change and mitigating climate catastrophe would be positioned to take advantage of monies available from public and private sources for climate-change adaptation technologies. An enterprise like this would also position Sonoma County as a center that attracts new enterprises and knows how to create an equitably prosperous future for its people while caring for its natural environment. The Estimates as an Algorithm Because the amount of overall spending on this project may change over time, the above estimates allow an algorithm to be constructed to help policy makers consider the economic impacts on businesses and workers from different project spending levels. For the Capex impacts, one can simply use a fraction or multiple of the economic impact data in this study and generate new estimates. This is also true for the operational impacts. Each year of operations may have more or less expenses depending on efficiency gains, as well as more or fewer overall employees at the RD&D operations. A fraction or multiple of estimates in Tables 5 or 9 provides a way to use these data as an algorithm for policy makers to consider changes from these baseline estimates. An example using these numbers is for every $100 million of spending at the Eldridge Enterprises on operations:
• There are 609 jobs supported in Sonoma County, and another 98 jobs in California
otherwise; • There is $84 million in business revenue generated for hundreds of businesses in Sonoma
County off-site, and other $55 million for businesses throughout California; and • There is $10.9 million in state and local tax revenues generated throughout California,
$8.7 million of which is generated in Sonoma County.
8 Business priorities in the post pandemic era, Strategy & Corporate Finance Practice, John Waldron, Kevin Sneader, Carolyn Dewar, McKinsey & Company, April 2021 Citrine Partners with Siemens to Accelerate Digital Transformation in the Materials and Chemicals Industry, Business Wire, Feb. 25, 2021, https://citrine.io/media/citrine-siemens-digital-industries-partnership-announcement/ Morgan Stanley, Sustainable Investing: https://www.morganstanley.com/Themes/plastic-pollution-resolution
26
Appendix 1: Explanation of Data & Methodology Used Economic Impact Methodology
To envision the economic impact for Sonoma County and the State of California as a whole, proponents of Eldridge Enterprise (EE) engaged Economic Forensics and Analytics (EFA) to conduct an economic impact analysis of their proposed development. This document is intended to explain the data and methodology used in conducting this analysis. The analysis consists in the creation of two pro-forma projections made over a 10-year time horizon (see attached files):
1. One for the capital expenditures (Capex) required to renovate and expand the educational/research facilities, the common infrastructure (water/sewer/power/ communications) and envisioned residential housing; these data are summarized in an excel spreadsheet (Capex Eldridge Enterprise 042821.xlsx, Main Page); and
2. A second for the operational activities (Opex) occurring in the newly renovated research facilities and in their accompanying service operations (day are, grocery store, restaurant, gym/recreation facility); these data are summarized in an excel spreadsheet (Opex Eldridge Enterprise 042821.xlsx, Main Page).
For the Capex pro-forma, EFA examined data provided by a series of consultants describing the current status of the buildings and infrastructure on the Eldridge site and the order of magnitude of costs to redevelop these facilities to meet the goals of project managers. EFA then divided these costs (updated to current dollar per square foot estimates) among the relevant construction spending categories (infrastructure, educational, commercial, industrial and residential) and listed them annually is an excel spreadsheet over the projected 10-year build-out period. For the Opex pro-forma, EFA created a similar spreadsheet for a 19-year operations horizon. The driving force in this spreadsheet is the gradual increase of employment created by EE’s R&D activities in the renovated educational/commercial/light-industrial space from 0 in year 1 to 2,000 in year 10 - a number substantially less than the 4,500 people residing and working at SDC during its peak years from the 1940’s through the 1980’s Finally, EFA inserted these pro-forma expenditures into the IMPLAN economic impact model of Sonoma County to estimate the indirect (vender supply chain) and induced (employee spending) economic impacts on Sonoma County and (in a separate IMPLAN model run) on California as a whole. From these two sets of estimates, EFA then estimated the fiscal effects flowing from these total economic impacts (direct, indirect plus induced) flowing to local and state governmental entities from these EE-generated economic activities.
27
Explanation of Capex Projections
This section is intended to serve as an explanation of the timing and amount of projected EE Capex spending as listed in the spreadsheets accompanying this report. For the projected EE investment in Public Utilities (water/sewer, electricity, communications) the central assumptions are:
1. that construction is completed in year 1 (40%), year 2 (40%); and year 3 (20%); 2. that total cost per s.f. is $95 just above the $92 cited in Existing Conditions, Table 7-2
and increases at a rate of 3% annually. For the projected EE investment in the R&D facilities to be used in EE for manufacturing research (IMPLAN sector 51) the central assumptions used are:
1. that initial cost per s.f. is $400 for (at the high end as listed in Existing Conditions Table 7-3);
2. that costs per s.f. increase by 3% per year; 3. that construction is phased in gradually in anticipation of projected employment at the
R&D center. For the projected EE investment in the R&D facilities to be used in EE for education/commercial purposes (IMPLAN sector 53/55) the central assumptions used are:
1. that initial cost per s.f. is $500 for (at the high end as listed in Existing Conditions Table 7-3);
2. that costs per s.f. increase by 3% per year; 3. that construction is phased in anticipation of employment at the R&D.
For the projected EE-induced investment in multi-family housing to be used by workers employed at Eldridge Enterprise and others moving to the area because of the impact of the project the central assumptions are:
1. that initial cost per s.f. is $400 for multi-family construction (above average as listed in Existing Conditions Table 7-3)
2. that costs per s.f. increase by 3% per year; 3. that construction is phased in in anticipation of housing to be used by workers employed
at Eldridge Enterprise and others moving to the area because of the impact of the project. For the projected EE-induced investment in single-family homes, the central assumptions used are:
1. that initial cost per s.f. is $500 for single-family construction (combination of high for new construction and mid-level for rehab of existing homes as listed in Existing Conditions Table 7-3);
2. that costs per s.f. increase by 3% per year; 3. that construction is phased in in anticipation of housing to be used by workers employed
at Eldridge Enterprise and others moving to the area because of the impact of the project.
28
Explanation of Opex Projections
This section is intended to serve as an explanation of the timing and amount of projected EE Opex spending. Because EE is dedicated to discover and making commercially feasible new methods for currently carbon-intensive products, there is no single IMPLAN sector that reflects what it intends to do. For that reason, EFA modeled product development activities at the Eldridge Enterprise as a composite sector. The data used to estimate EE’s operational impact presumes that one-half of the workers of Eldridge Enterprise employees can be characterized by IMPLAN sector 464, Scientific Research & Development Services and one half by portions of thirty-seven different IMPLAN manufacturing and research service sectors related to product development and manufacturing that currently use large quantities of carbon. The estimated direct impact of EE’s operational activities is thus the combination (at full capacity) of the impact of 1,000 workers in traditional R&D research combined with another 1,000 workers divided among the selected manufacturing and service sectors estimated to represent the materials science, the manufacturing prototyping and development skills needed to meet EE’s climate-change reducing goals. In addition to its basic research activities, EE will also provide space for a day-care center and ongoing building maintenance, repair and other services to all structures on-site, including multi-family housing of managed by EE (in the economic impact estimates, we assume some other organization beyond EE managed any on-site home rentals). These relatively small number of employees will add to the R&D employees to together generate EE’s total operational impact. The central assumptions used in these projections are:
1. Employment in Eldridge Enterprise RD&D activities are divided equally between IMPLAN sector 464, Scientific R&D Services (50%) and 37 related manufacturing and service sectors (approximately 2.7% for each of the 37 sectors); and
2. Revenue for on-site services others is driven by income earned by on-site employees.
29
Appendix 2: Current Sonoma County Economic Growth and Population Trends indicate a need for economic stimulus
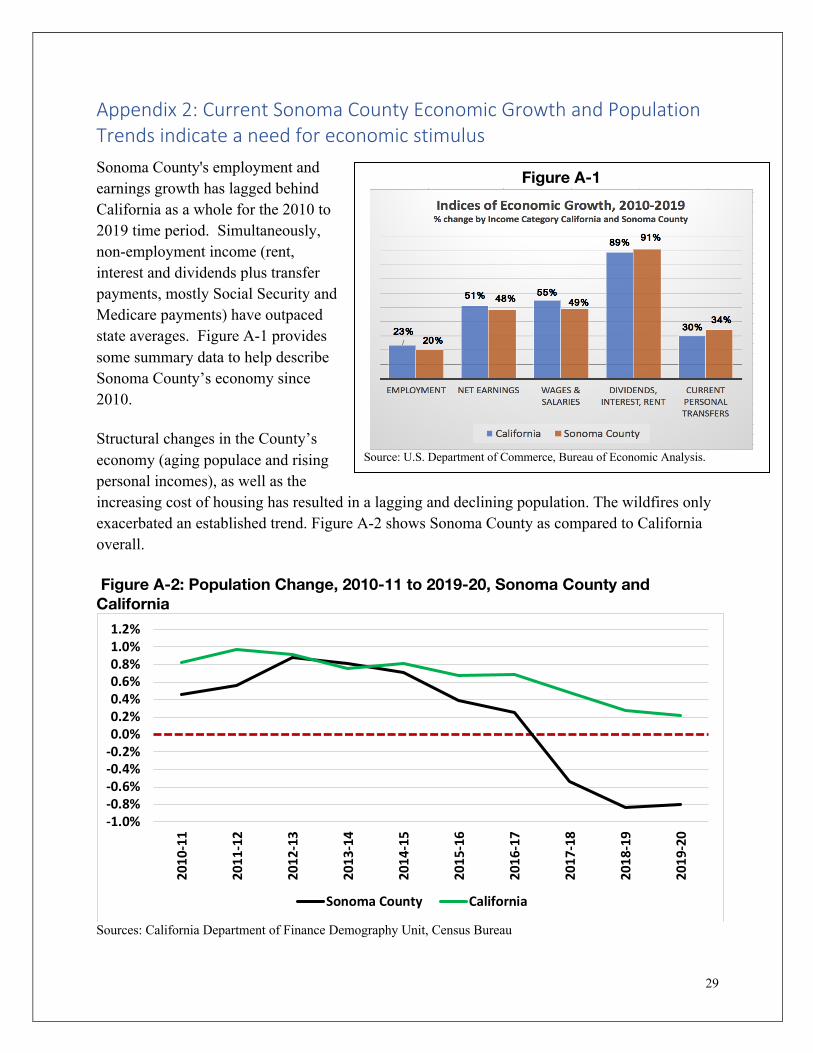
Sonoma County's employment and earnings growth has lagged behind California as a whole for the 2010 to 2019 time period. Simultaneously, non-employment income (rent, interest and dividends plus transfer payments, mostly Social Security and Medicare payments) have outpaced state averages. Figure A-1 provides some summary data to help describe Sonoma County’s economy since 2010. Structural changes in the County’s economy (aging populace and rising personal incomes), as well as the increasing cost of housing has resulted in a lagging and declining population. The wildfires only exacerbated an established trend. Figure A-2 shows Sonoma County as compared to California overall. Figure A-2: Population Change, 2010-11 to 2019-20, Sonoma County and California
Sources: California Department of Finance Demography Unit, Census Bureau
-1.0%-0.8%-0.6%-0.4%-0.2%0.0%0.2%0.4%0.6%0.8%1.0%1.2%
2010
-11
2011
-12
2012
-13
2013
-14
2014
-15
2015
-16
2016
-17
2017
-18
2018
-19
2019
-20
Sonoma County California
Figure A-1
Source: U.S. Department of Commerce, Bureau of Economic Analysis.
30
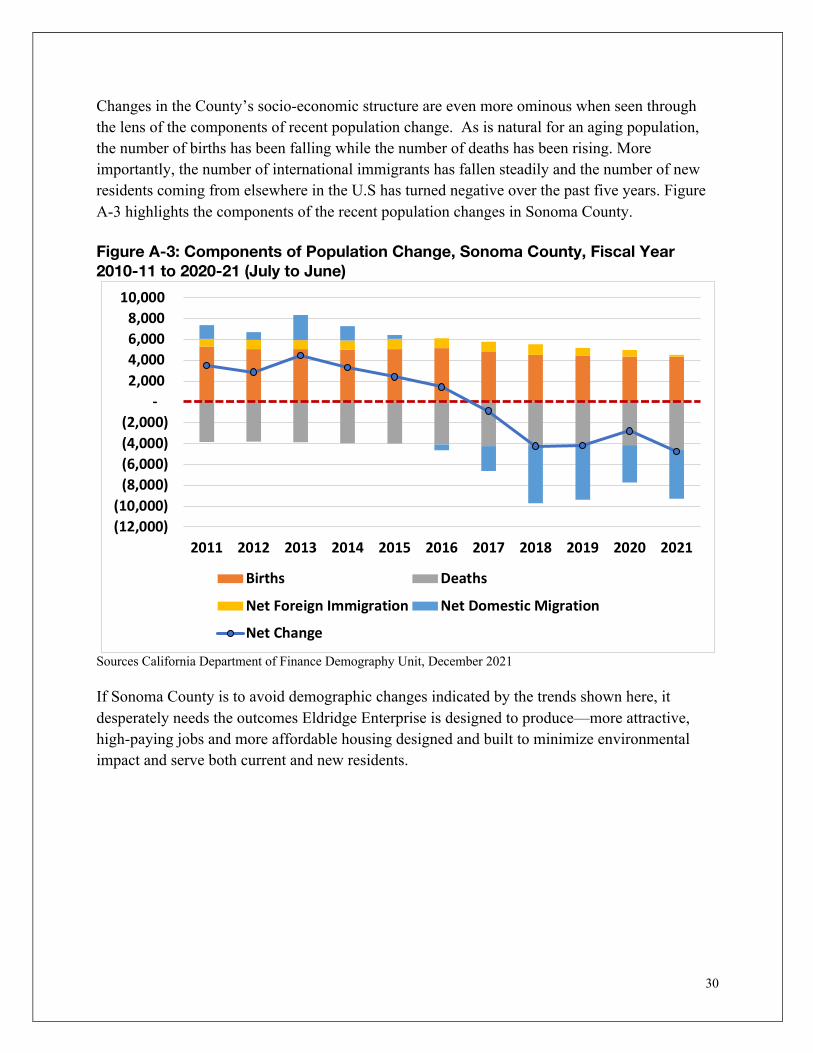
Changes in the County’s socio-economic structure are even more ominous when seen through the lens of the components of recent population change. As is natural for an aging population, the number of births has been falling while the number of deaths has been rising. More importantly, the number of international immigrants has fallen steadily and the number of new residents coming from elsewhere in the U.S has turned negative over the past five years. Figure A-3 highlights the components of the recent population changes in Sonoma County.
Figure A-3: Components of Population Change, Sonoma County, Fiscal Year 2010-11 to 2020-21 (July to June)
Sources California Department of Finance Demography Unit, December 2021 If Sonoma County is to avoid demographic changes indicated by the trends shown here, it desperately needs the outcomes Eldridge Enterprise is designed to produce—more attractive, high-paying jobs and more affordable housing designed and built to minimize environmental impact and serve both current and new residents.
(12,000) (10,000)
(8,000) (6,000) (4,000) (2,000)
- 2,000 4,000 6,000 8,000
10,000
2011 2012 2013 2014 2015 2016 2017 2018 2019 2020 2021
Births Deaths
Net Foreign Immigration Net Domestic Migration
Net Change
31
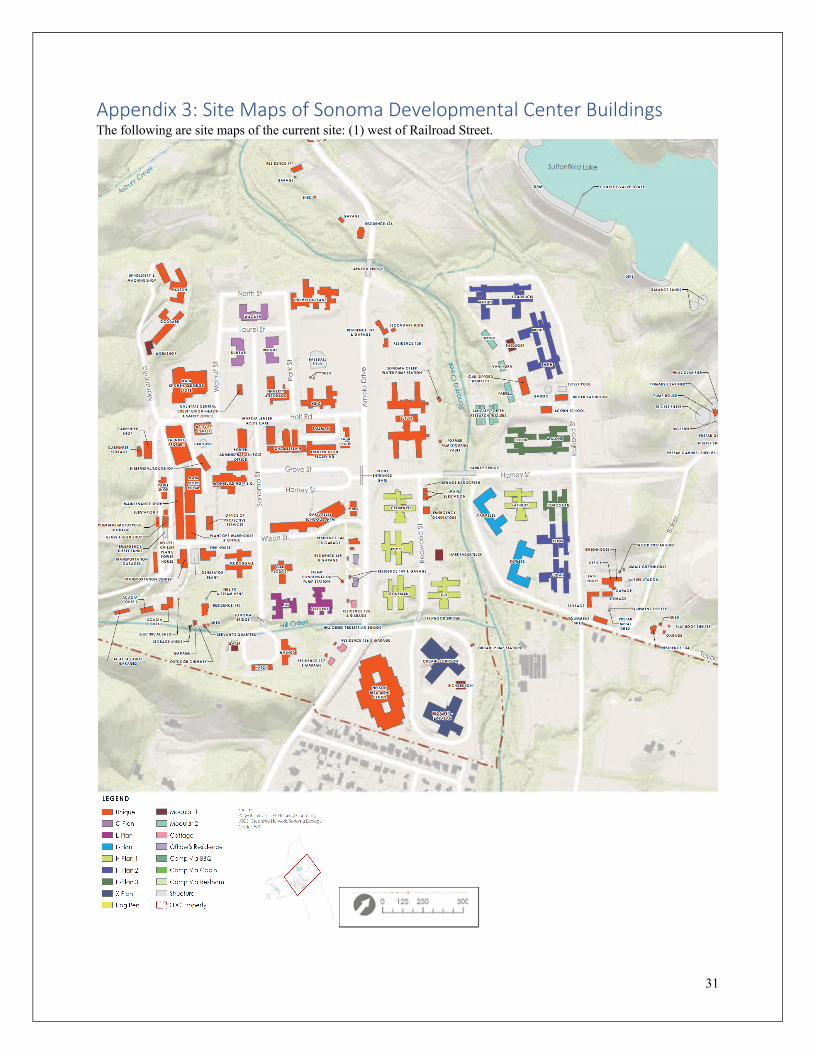
Appendix 3: Site Maps of Sonoma Developmental Center Buildings The following are site maps of the current site: (1) west of Railroad Street.
,.,,. ...... ~ .. MACIIIN(IIIOP 9111
::;·
LEGEND
• Unique
- C-Plan
- E-Plan
- F-Plan
□ H-Planl
- H-Plan2
- H-Plan3
- X-Plan
W Hog Pen
0
\
- Modular]
• Modular2
• Collage
- Officer's Residence
- Camp Via BBQ
• Camp Via Cabin
D Camp Via Restoom
Structure
L: SOC Property
Suttonfield Lake
/C0NII0l/'O ,lVI I0WII
Id North St
Laurel St H1JDIIIC I IJt.. UCOII0,01 UOG &GU.t.G I ,.,,,
UlAMCI IAN«I\"
I· I •1110111c1u,
01(011111~
""''~ ~-~=~ :fist<rico!Cons,Jlirg. Coote..-, WRl twcrk. Sonoma Ecology
0 I [ ') o ............... ,~ ,lf ...J.....J.....' ,, I
32
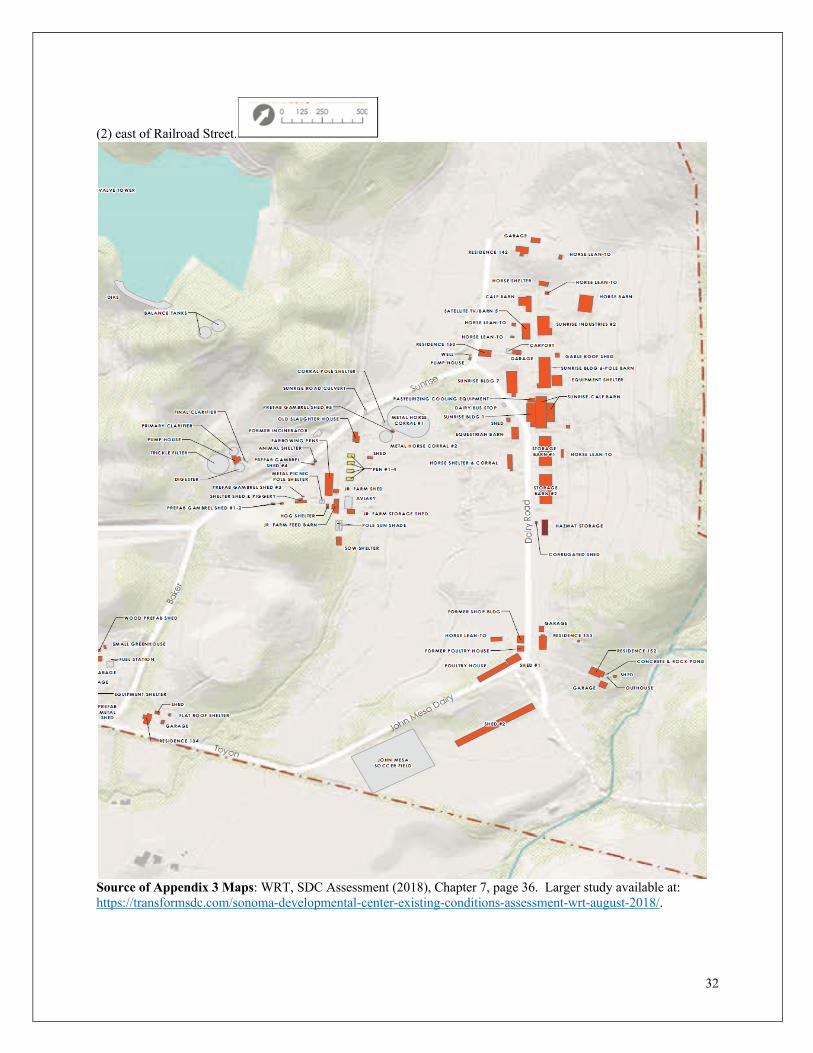
(2) east of Railroad Street.
Source of Appendix 3 Maps: WRT, SDC Assessment (2018), Chapter 7, page 36. Larger study available at: https://transformsdc.com/sonoma-developmental-center-existing-conditions-assessment-wrt-august-2018/.
IAlANCl •••U\"
r W OOD PIU.-.1 SMID
/.. SMAll GIUH HOUH
■ """"""I UllUA I ION
P■ lfAI
MflAl SHID
.r.SHID t .. HAT IOOf SHlllll
GAIAGl
H SIDIHC E u •
I SOW SH llllll
G-'U, Gl -
HS ID(HCI 142 9 • HOU( U-'H -lO
C-' lflA ■H ..
S-'lHUTl JY / IAIN I ~
HO ISi UAN - J O •
~ NOUIL(AH-10
• HO■H&AIN
HO ISi LIA N- TO •
I SUHI IU IHDUU■IU •2
■UI DINCI uo -............._
wm----.,~• -PUM PMOUU
~CAIPO■ I
GA ■AGI • GAil( ■oo, SH(D
1-SUH■IH llDG • -f'Ol l IA.IN
SUNI IU llDG 7 ' ■ lOUIPMlNt SHl U H
■SUHI IH •CA lf &AIM PASTlUIJl lNG COOU HG IQUIPMlNl -
DAl■ 'I' &US UOf'
":~~~:~::· '""'"' .... ,-•• -.-.=.:-7 lQUU l ■I AH IA ■N I
SI . G I
"'0 •...-2 8 i \ I .. ™ .. U OUG I
8 lcomo•no mo
fOIMII S MOf' l l DG \
GAIAGf
■ MOUi UAH -10 - I lt U I D(HC; us
I
I
fO■MHPOUlllYHOUU--- .t;HSIDfNCI 152
_.,,........--coN C H H .. ■oc,: POHD POU l ll'I' MOUH SMID • 1 / . .. . .,.
JOMHMUA soccn nuo
·--. --.
llt SN lD
G.-.1.-.G I . OUI HOUU
- ---.


