Embed Size (px)
Citation preview

1
Economic consequences of intifada
Marco Missaglia and Paul de Boer
June 2004 1. Introduction The most recent years of the Palestinian history, those of the second intifada, have witnessed a dramatic decline in all Palestinian economic and social indicators. Since September 2000, when the violent confrontations started, conditions for a normal life have nearly disappeared and the economic situation has steadily disintegrated. Using a poverty line of US$ 2.1 per day the World Bank estimated the poverty in Palestine in 1998 at 23.2% of the population, whereas by the end of 2002 the Bank estimated the poverty to have risen to 59 percent. The unemployment rate that amounted to 16.2% in 1998 rose to 37% at the end of 2002. The overall GNI losses have reached US$ 5.2 billion during the first twenty-seven months of intifada, which is more than the GNI in 1998 or in 1999 (US$ 5.1 billion). Two main causes of the Palestinian economic crisis are closure, namely the imposition of restrictions on the movement of goods and people across borders and within Palestine, and the destruction of capital. In September 2000 the Bank estimated the number of Palestinians working in Israel and the settlements at 128,000, while the estimate for end 2002 was about 32,000. The physical damage resulting from the conflict was estimated to be US$ 305 million by the end of 2001 and US$ 930 million by the end of 2002. As a result of damage and of the fall in investment, the real productive capital stock declined by US$ 1.7 billion between 1999 and 2002. It is clear, in some way even obvious, that an already fragile economy has been hit very hard by the conflict. However, there is no consensus on the extent and the order of magnitude by which the Palestinian economy has suffered during the last years of conflict. Specifically, we will see in the next section that the evaluations coming from the World Bank (World Bank 2003a, 2003b and 2003c) are substantially different from those of the International Monetary Fund (IMF, 2003). Just to anticipate one figure, according to the WB the GNI in 2002 is 25% less than the corresponding figure calculated by the IMF. It goes without saying that such a huge difference is relevant not only to a full understanding of the economic consequences of the conflict, but arguably to the size of the international community intervention as well. This is the reason why in this paper we try to propose our own evaluation of the economic consequences of the conflict, with the help of a computable general equilibrium (CGE) model calibrated on the social accounting matrix (SAM) of 1998, of which we present a part in appendix 1. The rest of the paper is organized as follows. Section 2 illustrates the different assessments proposed by international agencies. In section 3 we provide a description of the model used for our own evaluation. Section 4 describes what we called the “intifada shock”, i.e. the set of shocks the Palestinian economy has suffered as a consequence of the violent confrontations started in September 2000. Section 5 illustrates the results and compares them with those obtained by international agencies.
2
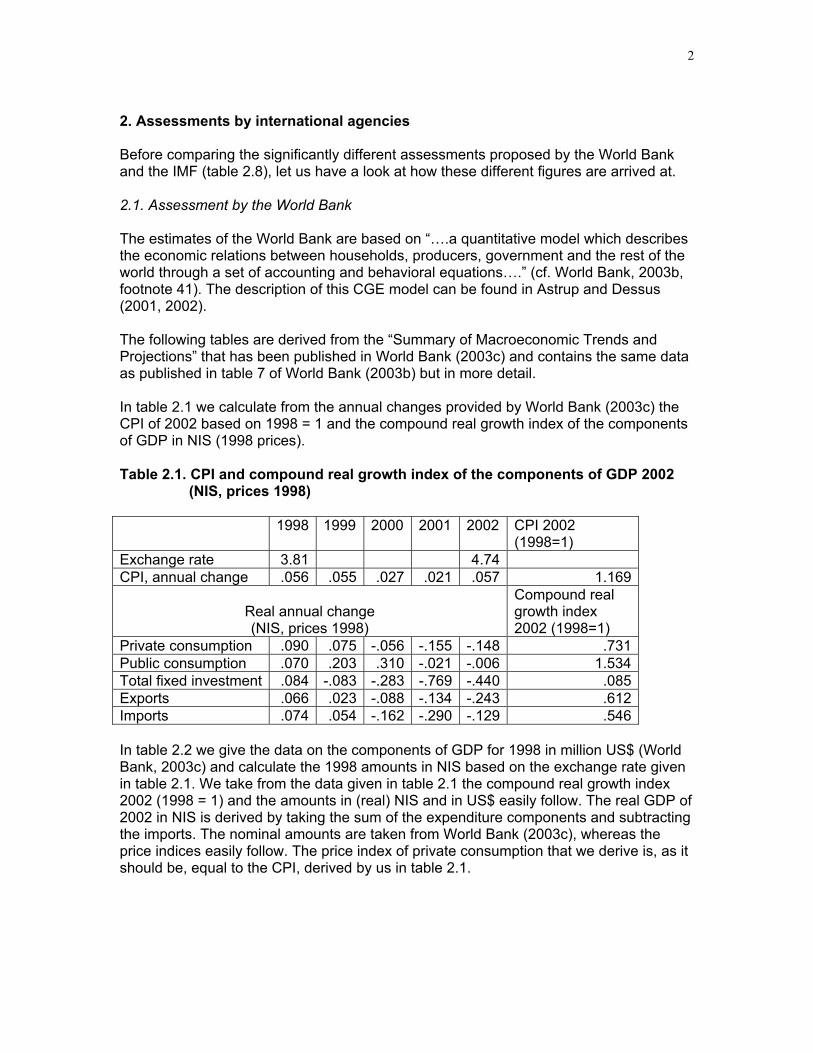
2. Assessments by international agencies Before comparing the significantly different assessments proposed by the World Bank and the IMF (table 2.8), let us have a look at how these different figures are arrived at. 2.1. Assessment by the World Bank The estimates of the World Bank are based on “….a quantitative model which describes the economic relations between households, producers, government and the rest of the world through a set of accounting and behavioral equations….” (cf. World Bank, 2003b, footnote 41). The description of this CGE model can be found in Astrup and Dessus (2001, 2002). The following tables are derived from the “Summary of Macroeconomic Trends and Projections” that has been published in World Bank (2003c) and contains the same data as published in table 7 of World Bank (2003b) but in more detail. In table 2.1 we calculate from the annual changes provided by World Bank (2003c) the CPI of 2002 based on 1998 = 1 and the compound real growth index of the components of GDP in NIS (1998 prices). Table 2.1. CPI and compound real growth index of the components of GDP 2002 (NIS, prices 1998) 1998 1999 2000 2001 2002 CPI 2002
(1998=1) Exchange rate 3.81 4.74 CPI, annual change .056 .055 .027 .021 .057 1.169
Real annual change (NIS, prices 1998)
Compound real growth index 2002 (1998=1)
Private consumption .090 .075 -.056 -.155 -.148 .731 Public consumption .070 .203 .310 -.021 -.006 1.534 Total fixed investment .084 -.083 -.283 -.769 -.440 .085 Exports .066 .023 -.088 -.134 -.243 .612 Imports .074 .054 -.162 -.290 -.129 .546 In table 2.2 we give the data on the components of GDP for 1998 in million US$ (World Bank, 2003c) and calculate the 1998 amounts in NIS based on the exchange rate given in table 2.1. We take from the data given in table 2.1 the compound real growth index 2002 (1998 = 1) and the amounts in (real) NIS and in US$ easily follow. The real GDP of 2002 in NIS is derived by taking the sum of the expenditure components and subtracting the imports. The nominal amounts are taken from World Bank (2003c), whereas the price indices easily follow. The price index of private consumption that we derive is, as it should be, equal to the CPI, derived by us in table 2.1.

3
Table 2.2 Estimate of the real components of GDP (in million US$ or million NIS) and of the price indices 1998 2002 Nominal
US$ Nominal NIS
Compoundreal growth index
Real NIS
Real US$
Nominal US$
Price index (1998=1)
Private consumption
4,014 15,293 .731 11,173 2,357 2,756 1.169
Public consumption
976 3,719 1.534 5,703 1,203 1,757 1.460
Total fixed investment
1,668 6,355 .085 541 114 119 1.044
Exports 624 2,377 .612 1,454 307 345 1.125Imports 3,052 11,628 .546 6,351 1,340 1,581 1.180GDP 4,230 16,116 12,519 2,641 3,396 1.286 In table 2.3 we give data taken from World Bank (2003c) and calculate the compound real growth indices per capita for 2002 (1998=1). Table 2.3 Population and compound real growth index per capita 1998 1999 2000 2001 2002 Poulation, mid-year (1,000)
2,731 3,231
Real annual change (NIS, prices 1998)
Compound real growth index per capita
GNI per capita .077 .039 -.075 -.232 -.234 .565 GDP per capita .039 .031 -.053 -.195 -.225 .609 In table 2.4 we estimate GNI and GDP using the compound real per capita growth index and the data on the population presented in table 2.3. The estimate of real net factor income (NFI) follows from subtracting real GDP from real GNI. The nominal amounts of GNI, GDP and net factor income are taken from World Bank (2003c). Table 2.4 Estimate of the real components of GNI (in million US$ or million NIS) 1998 2002 Nominal
US$ Nominal per capita NIS
Compound real growth index per capita
Real per capita NIS
Real US$
Nominal US$
GNI 5,058 7,056 .565 3,990 2,719 3,768 GDP 4,230 5,901 .609 3,595 2,450 3,396 NFI 828 1,155 269 372 It should be noted that the estimate of GDP reported in table 2.2 (2,641 million US$) is 10.8% higher than the one reported in table 2.4 (2,450 million US$).

4
2.2. Assessment by the International Monetary Fund In June 2003, the PCBS published, with the technical assistance of the IMF, a set of annual national accounts statistics for the years 1994 to 2000 (IMF, 2003, p. 22). With the aid of an income-expenditure model the IMF estimated GNI and its components for the years 2001 and 2002. We quote from IMF (2003): Box 2.5. A simple Income-Expenditure Model to Estimate GDP Developments The income-expenditure model starts with the identity GDP equals Exports minus Imports plus Consumption plus Investment. Information on exports in 2001 can be obtained from the preliminary balance of payments (BOP) prepared by the PCBS and the PMA. For 2002, Israeli BOP figures are available, that identify Israeli imports from the “Palestinian Authority”, which is broadly equivalent to WBG excluding East Jerusalem in this context. According to trade statistics from the PCBS, about 90 percent of Palestinian exports go to Israel. Imports and private consumption are both assumed to be a linear function of private disposable income (PDI). PDI is equal to GNI less domestic taxes (available from ministry of finance data) plus transfers from abroad (for which some limited data is available from banks). GNI is equal to GDP plus net factor income from abroad, which is mostly labor income from Israel (estimates based on quarterly labor market survey). Public consumption is derived from the fiscal accounts (which are up to date). Investment is based on partial information on public investment from donors project financing and even more partial information on private investment in construction (based on indicators of cement imports and building permits). The model provides estimates for GDP and certain components in nominal terms. In order to derive GDP in real terms, each demand component is deflated. The most important component of the deflators is the CPI which is complemented by several other price series, such as oil prices and prices in Israel. Historically, the GDP deflator and the CPI index have in fact been very similar. In table 2.5 we make use of the fractions of GDP and of the nominal GDP figures reported by IMF (2003, table 2.2) to derive the components for 1998 and 2002. Table 2.5 GDP and GNI (current prices, million US$) 1998 and 2002 1998 2002 Fraction Million US$ Fraction Million US$ Private consumption .997 4,245 1.247 3,709 Public consumption .224 954 .343 1,020 Private investment .264 1,124 .166 494 Public investment .064 273 .035 104 Change inventories .023 98 0 0 Exports .208 886 .139 413 Imports .780 3,321 .930 2,766 GDP 4,258 4,258 2,974 2,974 Net factor income .212 903 .145 431 GNI 1.212 5,161 1.145 3,405 Net current transfers .096 409 .589 1,752 Gross disposable income 1.308 5,569 1.734 5,157

5
IMF (2003, table 2.1) gives the annual growth of GDP, GNI and CPI. In table 2.6 we use these figures in order to derive the GDP, GNI and, residually, the net factor income (NFI), all in millions US$, prices 1998 (recall from our table 2.5 that in 1998 the GNI was 5,161 and the GDP 4,258 million US$). We present our findings in table 2.6. Table 2.6 Estimate for 2002 of Real GNI, GDP, NFI (million US$, prices 1998) and CPI (base year 1998) 1999 2000 2001 2002 Million US$
2002 (prices 1998) Real annual change (US$, prices 1998 Compound
growth index 2002 (1998 = 1)
Real GNI .084 -.068 -.162 -.164 .708 3,653 Real GDP .089 -.054 -.150 -.145 .749 3,188 Real NFI 565 CPI .055 .028 .012* .057 1.160 * The World Bank reports a figure of .021 leading to a CPI of 1.169 in 2002. IMF (2003, table 2.3) reports that the index of real GDP of 2002 with respect to real GDP 1997 = 100 is equal to .837. Since the index of real GDP in 1998 was equal to 118.8 and the nominal GDP in 1998 4,258, we calculate the real GDP in 2002:
188,3188.1
258,4837.=
×
which is equal to the real GDP in 2002 reported in our table 2.6, as indeed it should be. Using the fractions that IMF (2003, table 2.3) reports for 2002, and using the figure of 3,188 million US$, we arrive at table 2.7. Table 2.7. Estimate of the real components of GDP 2002
2002 Fraction Million US$*
(prices 1998)Private consumption 1.041 3,956Public consumption .274 1,041Private investment .144 547Public investment .030 114Change inventories 0 0Exports .112 426Imports .762 2,986GDP .837 3,188* We balanced the figures to arrive at GDP=3,188 It is puzzling that division of the nominal consumption of 3,709 (cf. our table 2.5) by the real consumption of 3,956 (cf. our table 2.7) does not lead to the CPI of 1.160 (cf. our table 2.6).

6
2.3. Comparison between the World Bank and the IMF In table 2.8 we summarize the assessment by the World Bank and the IMF presented in the two previous subsections, as well as their ratio: the assessment of the World Bank as fraction of the one by the IMF. Table 2.8* Comparison between the assessment by the World Bank and the IMF 1998 (million US$) 2002 (current prices,
million US$) 2002 (prices 1998,
million US$) WB IMF Ratio WB IMF Ratio WB IMF Ratio Private consumption
4,014 4,245 .946 2,756 3,709 .743 2,357 3,956 .596
Public consumption
976 954 1.023 1,757 1,020 1.723 1,203 1,041 1.156
Total fixed investment
1,668 1,494 1.116 119 598 .199 114 661 .172
Exports 624 886 .704 345 413 .835 307 426 .721Imports 3,052 3,321 .919 1,581 2,766 .572 1,340 2,896 .463GDP 4,230 4,258 .993 3,396 2,974 1.142 2,450 3,188 .769NFI 828 903 .917 372 431 .863 269 465 .578GNI 5,058 5,161 .980 3,768 3,405 1.107 2,719 3,653 .744* The ratio is the figure of the World Bank divided by the one of the IMF. The reader may easily notice that the differences between the two evaluations (2002, prices 1998) are relevant and worth stressing. In a sense, one should not be too much surprised: the WB predictions are based on a micro-founded, CGE model, whereas the IMF’s are based on a macro, income-expenditure model; the WB based its study on a SAM of 1998, whereas the IMF study relies on some more recent data (see Box 2.5). It would not make any sense to assert that one model is better than the other, since they are usually employed for different purposes. What we want to stress here is the fact that the IMF macro figures are based on more recently available data and thus are likely to describe more appropriately the cost of the conflict. Is it possible to get closer to those (IMF) figures using some analytical tool which is closer to the richer, micro-founded kind of model used by the World Bank? This is the question we try to answer in the rest of this paper. 3. Description of the model 3.1. Introduction In the model we have five economic agents: eight producers, one household, a bank that allocates savings over investments, the Palestinian Authority (PA) and the rest of the world (RoW). In appendix 2 we present the glossary of symbols and in appendix 3 the equations of the model.
3.2. The producers
Intermediate inputs are combined into the intermediates by means of a Leontief technology, whereas capital and labor are combined into value added by means of a CES technology. Both aggregates are, using the Leontief assumption, combined into

7
the supply of the domestically produced commodity. This commodity is transformed via a CET function into an export commodity and into a domestic commodity supplied to the domestic market. This commodity is combined with imports to produce the composite commodity. To that end we adopt the Armington assumption by using a CES functional form. This commodity is either used in the production process (intermediate demand) or for final purposes: consumption, consumption of the PA and investment.
3.3. The household
The household owns the capital, receives transfers from the PA and from the rest of the world, and it disposes of a time endowment. The household is assumed to maximize its utility in two stages: in the first one it allocates its time endowment over labor supply and leisure. We allow for unemployment so that the labor demand is smaller than the labor supply. We assume that the unemployed do not receive unemployment benefits.
In the model we use the unemployment theory delineated in the migration literature by Harris and Todaro (1970) to describe the wage gap between rural and urban jobs. Compared to the modified version proposed by Ruppert Bulmer (2001), we stay closer to the original Harris-Todaro model. The core of the theory is described by the following arbitrage condition (acting as a wage curve):
PLF.b).UNEMPLFLF(PL
+=
The wage rate paid by Palestinian firms to Palestinian workers, PL, must be equal, in equilibrium, to the expected wage rate of the Palestinian workers employed in Israel or in the settlements. The latter is equal to the wage rate prevailing in Israel and the settlements, PLF, multiplied by the probability of getting a job in Israel or in the settlements and a factor b. The probability of getting a job in Israel or in the settlements is simply given by the ratio of the Palestinian workers actually employed in Israel or in the settlements (LF) to the workers who look for a job there: those who manage (LF) and those who do not (UNEMP). The factor b is interpreted to be the inverse of the probability of getting a job in Palestine. Then, the arbitrage condition states nothing but the equality between two expected wages: P (Job in Palestine).PL = P (Job in Israel or in the settlements).PLF All sources of income (capital, transfers and wages earned in Israel, the settlements and Palestine) together yield the household income. The household pays income taxes and saves a fixed fraction out of its income after taxes. Subtracting taxes and savings from income yields the budget that it devotes to the purchase of commodities. In the second stage the household maximizes a utility function, with the consumption of these commodities as arguments, subject to its budget constraint. For both stages we use a Linear Expenditure System (LES). 3.4. The Palestinian Authority (PA) The PA derives its revenues from two sources: taxes (on imports, capital, labor, consumption commodities and on household’s income) and foreign aid. These revenues are spent on transfers, savings and on other expenditures. With respect to the latter we assume that the PA maximizes a Cobb-Douglas utility function with its purchases of the

8
two commodities “Private Services” and “Public Services” as arguments subject to the expenditure constraint. 3.5. The bank The household savings, the PA savings and the foreign savings are allocated over the investment demand for the commodities. To that end the bank is assumed to maximize a Cobb-Douglas utility function subject to the constraint that savings are equal to total investments. 3.6. The rest of the world For the Palestinian economy, the RoW basically coincides with Israel and its settlements, at least as far as foreign trade is considered. In 1998, 76 percent of imports and 96 percent of exports came from and were directed toward Israel and its settlements (Astrup and Dessus, 2001). Obviously, the picture is different if one looks at foreign aid disbursements. For instance, out of a total of US$ 1.1 billion by the end of 2002, US$ 840 million came from Arab League countries and US$ 230 million from the EU (World Bank, 2003a). Palestine earns revenues from the RoW via exports and other sources: foreign aid accruing to the PA, remittances from the workers employed in Israel or in the settlements, foreign transfers directly accruing to the households and foreign savings, i.e. the deficit in the current account balance. These revenues are spent on imports of goods. Imports and exports are treated in a rather standard way, through, respectively, an Armington-CES and a CET assumption. 4. The 1998 Social Accounting Matrix and the counterfactual SAM 4.1. The 1998 SAM The CGE model used in this paper is calibrated around the SAM constructed by the World Bank for 1998 (a reduced SAM is reported in Appendix 1). Compared to this original version, we aggregate the several sectors and sub-sectors included in it to eight main sectors: Food, Other Agriculture, Manufacturing, Construction, Transport, Trade, Private Services and Public Services, each of them producing one good. The food sector is an aggregation of the food producing agricultural activities and of those activities that, although belonging to the Manufacturing sector in the SAM, produce food items as well (for instance the "food and beverages" activity). The data in the SAM is organized in a way that implicitly separates the role of the PA as a consumer from its role as a producer. More precisely, in the SAM the PA does not buy intermediate goods, labor and capital services. It only buys consumption goods. The role of the PA as a producer is captured by the sector "Public Services", which is considered in the SAM as any other producing sector of the economy. In the model, we follow this convention and therefore the reader must be aware that this is not a way of disregarding the overwhelmingly important role of the PA as a producer and, above all, labor demander. If one looks at the "Public Services" column of the SAM, the extremely important role the PA plays as a producer will be immediately apparent. Our model is a standard one, where each producing sector maximizes its profits under a technological constraint. This assumption might seem inadequate to describe the
9
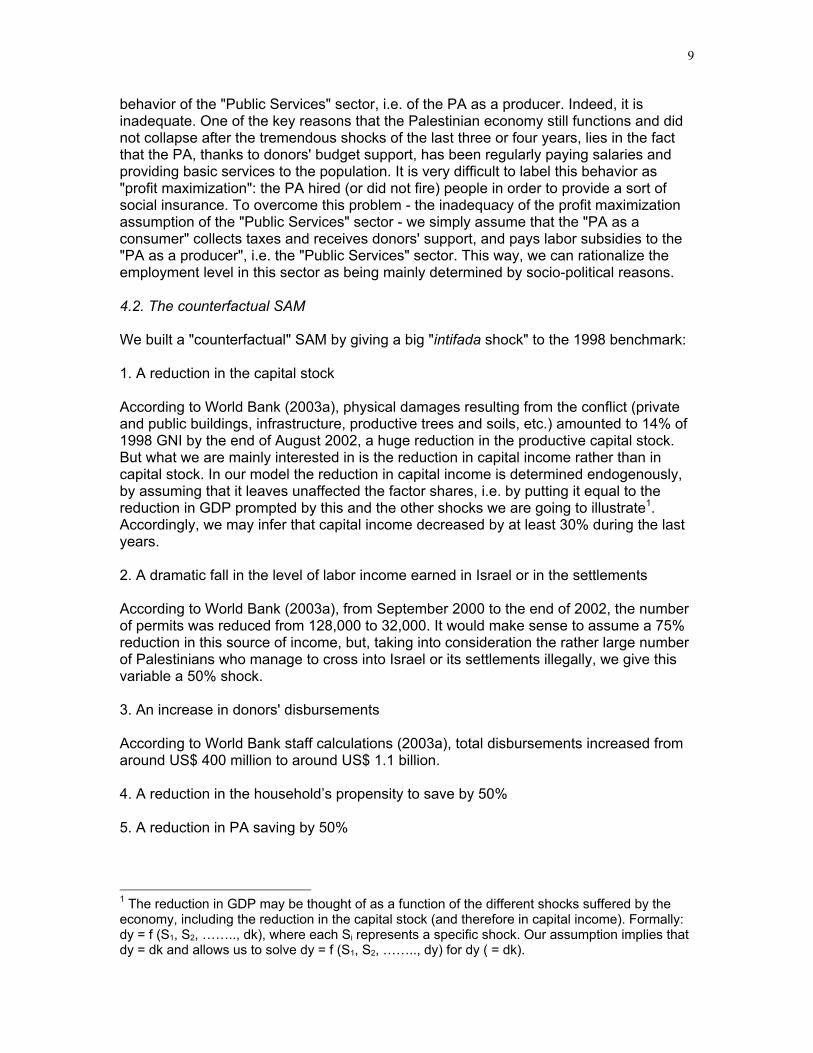
behavior of the "Public Services" sector, i.e. of the PA as a producer. Indeed, it is inadequate. One of the key reasons that the Palestinian economy still functions and did not collapse after the tremendous shocks of the last three or four years, lies in the fact that the PA, thanks to donors' budget support, has been regularly paying salaries and providing basic services to the population. It is very difficult to label this behavior as "profit maximization": the PA hired (or did not fire) people in order to provide a sort of social insurance. To overcome this problem - the inadequacy of the profit maximization assumption of the "Public Services" sector - we simply assume that the "PA as a consumer" collects taxes and receives donors' support, and pays labor subsidies to the "PA as a producer", i.e. the "Public Services" sector. This way, we can rationalize the employment level in this sector as being mainly determined by socio-political reasons. 4.2. The counterfactual SAM We built a "counterfactual" SAM by giving a big "intifada shock" to the 1998 benchmark: 1. A reduction in the capital stock According to World Bank (2003a), physical damages resulting from the conflict (private and public buildings, infrastructure, productive trees and soils, etc.) amounted to 14% of 1998 GNI by the end of August 2002, a huge reduction in the productive capital stock. But what we are mainly interested in is the reduction in capital income rather than in capital stock. In our model the reduction in capital income is determined endogenously, by assuming that it leaves unaffected the factor shares, i.e. by putting it equal to the reduction in GDP prompted by this and the other shocks we are going to illustrate1. Accordingly, we may infer that capital income decreased by at least 30% during the last years. 2. A dramatic fall in the level of labor income earned in Israel or in the settlements According to World Bank (2003a), from September 2000 to the end of 2002, the number of permits was reduced from 128,000 to 32,000. It would make sense to assume a 75% reduction in this source of income, but, taking into consideration the rather large number of Palestinians who manage to cross into Israel or its settlements illegally, we give this variable a 50% shock. 3. An increase in donors' disbursements According to World Bank staff calculations (2003a), total disbursements increased from around US$ 400 million to around US$ 1.1 billion. 4. A reduction in the household’s propensity to save by 50% 5. A reduction in PA saving by 50%
1 The reduction in GDP may be thought of as a function of the different shocks suffered by the economy, including the reduction in the capital stock (and therefore in capital income). Formally: dy = f (S1, S2, …….., dk), where each Si represents a specific shock. Our assumption implies that dy = dk and allows us to solve dy = f (S1, S2, …….., dy) for dy ( = dk).
10
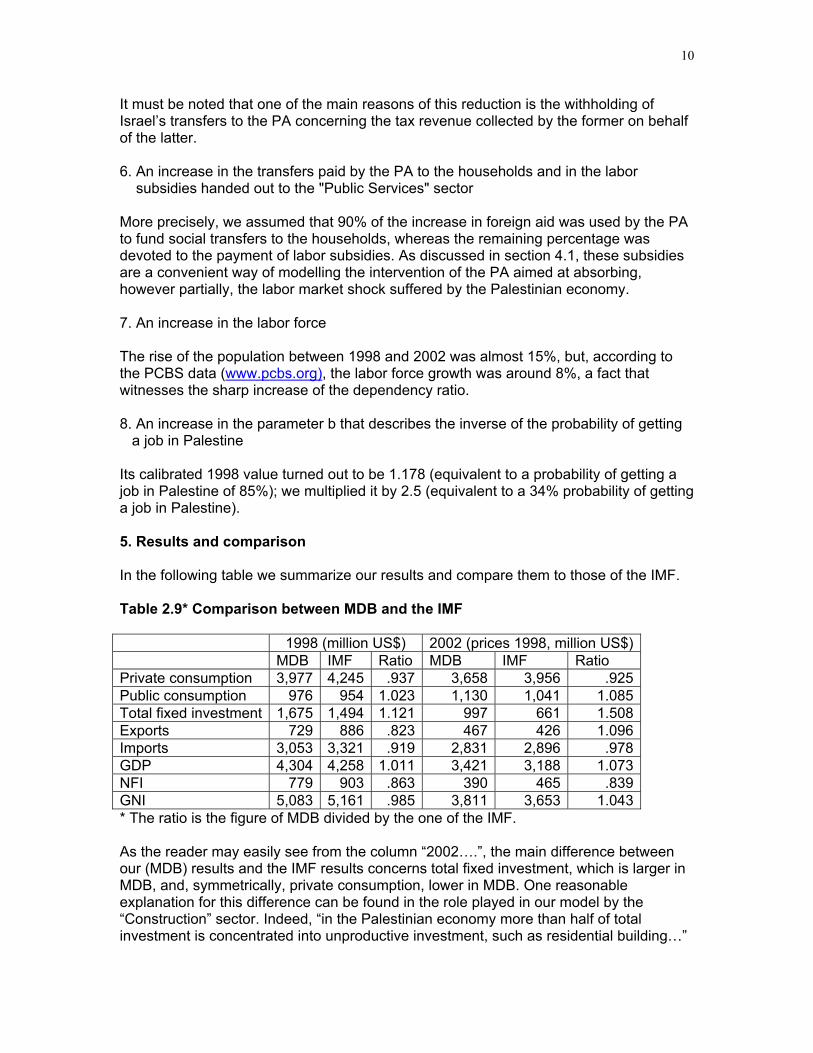
It must be noted that one of the main reasons of this reduction is the withholding of Israel’s transfers to the PA concerning the tax revenue collected by the former on behalf of the latter. 6. An increase in the transfers paid by the PA to the households and in the labor subsidies handed out to the "Public Services" sector More precisely, we assumed that 90% of the increase in foreign aid was used by the PA to fund social transfers to the households, whereas the remaining percentage was devoted to the payment of labor subsidies. As discussed in section 4.1, these subsidies are a convenient way of modelling the intervention of the PA aimed at absorbing, however partially, the labor market shock suffered by the Palestinian economy. 7. An increase in the labor force The rise of the population between 1998 and 2002 was almost 15%, but, according to the PCBS data (www.pcbs.org), the labor force growth was around 8%, a fact that witnesses the sharp increase of the dependency ratio. 8. An increase in the parameter b that describes the inverse of the probability of getting a job in Palestine Its calibrated 1998 value turned out to be 1.178 (equivalent to a probability of getting a job in Palestine of 85%); we multiplied it by 2.5 (equivalent to a 34% probability of getting a job in Palestine). 5. Results and comparison In the following table we summarize our results and compare them to those of the IMF. Table 2.9* Comparison between MDB and the IMF 1998 (million US$) 2002 (prices 1998, million US$) MDB IMF Ratio MDB IMF Ratio Private consumption 3,977 4,245 .937 3,658 3,956 .925 Public consumption 976 954 1.023 1,130 1,041 1.085 Total fixed investment 1,675 1,494 1.121 997 661 1.508 Exports 729 886 .823 467 426 1.096 Imports 3,053 3,321 .919 2,831 2,896 .978 GDP 4,304 4,258 1.011 3,421 3,188 1.073 NFI 779 903 .863 390 465 .839 GNI 5,083 5,161 .985 3,811 3,653 1.043 * The ratio is the figure of MDB divided by the one of the IMF. As the reader may easily see from the column “2002….”, the main difference between our (MDB) results and the IMF results concerns total fixed investment, which is larger in MDB, and, symmetrically, private consumption, lower in MDB. One reasonable explanation for this difference can be found in the role played in our model by the “Construction” sector. Indeed, “in the Palestinian economy more than half of total investment is concentrated into unproductive investment, such as residential building…”

11
(Astrup and Dessus, 2002, p.18). This kind of investment (or at least a part of it: its annual equivalent) should be assimilated, from the point of view of its economic impact, to consumption, something that does not add anything to the productive capacity of the economy. However, in the SAM we used to calibrate the model almost the whole output of the “Construction” sector is classified as “investment”. This may explain the origin of the observed difference. The other items of MDB and IMF are extremely close to each other, which means that the “intifada shock” we imposed on the model is reasonable and, arguably, the modelling itself makes sense. Consequently, it turns out that it is possible to get closer to the IMF figures using our model which is closer to the richer, micro-founded model used by the World Bank. The conviction that our model can be profitably used to simulate, for instance, the impact of different foreign assistance policies and eventually other policy shocks (see Missaglia and de Boer, 2004) has been reinforced by the outcomes of this study. References: Astrup, C. and S. Dessus (2001), Trade options for the Palestinian economy: some orders of magnitude, MENA Working Papers Series # 21, The World Bank. Astrup, C. and S. Dessus (2002), Exporting labor or goods: long term implications for the Palestinian economy, MENA Working Papers Series # 29, The World Bank. Harris, J. and M. Todaro, (1970) Migration, unemployment and development: a two-sector analysis,The American Economic Review, 60, pp.126-142. IMF (2003), West Bank and Gaza: economic performance and reform under conflict conditions, September 2003. Missaglia, M. and P.M.C. de Boer (2004), Food-for-work versus cash-for-work: emergency assistance in Palestine, to appear in: Economic Systems Research, 16, issue 4 (December 2004). Ruppert Bulmer, E. (2001), The impact of future labor policy options on the Palestinian labor Market, MENA Working Paper Series # 24, The World Bank. World Bank (2003a), Two years of intifada, closure and Palestinian economic crisis: an Assessment, March 2003. World Bank (2003b), Twenty-seven months-intifada, closure and Palestinian economic crisis: an Assessment, May 2003. World Bank (2003c), West Bank and Gaza Update, A quarterly Publication of the West Bank and Gaza Office, April- June 2003.

12
Appendix 1: The Palestinian SAM for 1998 Input-output structure and primary income (US$, million)
Food Oth Agr
Manuf Const Trade Transp Priv Svc
Pub Svc
Total
Food 195 6 23 0 229 0 0 4 457Oth Agr 46 1 28 0 0 0 0 0 75Manuf 489 23 445 829 78 73 84 135 2,156Const 4 0 6 113 7 0 22 36 188Trade 507 0 512 3 263 9 13 58 1,365Transp 21 4 25 4 45 7 14 40 160Priv Svc 61 8 39 20 119 19 225 67 558Pub Svc 0 0 0 0 0 0 15 0 15Labor 89 38 205 179 473 103 426 349 1,862Capital 177 4 321 245 214 80 546 18 1,605Total 1,589 84 1,604 1,393 1,428 291 1,345 707 8,441
Final demand and imports (US$, million) Private
Cons PA
Cons Invest-ment
Exports Total final demand
Imports
Food 1,736 0 117 219 2,072 733 Other Agr 40 0 0 8 48 34 Manuf 821 0 382 450 1,653 1,793 Const 61 0 1,108 38 1,207 1 Trade 126 0 1 10 137 64 Transp 249 0 33 1 283 135 Private Svc 84 215 33 2 334 264 Public Svc 7 761 1 1 770 29 Total 3,124 976 1,675 729 6,504 3,053 Other data (US$, million): Foreign aid 390 Factor payments from abroad 779 Transfers from abroad 140 Foreign saving 1,015

13
Appendix 2 The glossary of symbols Variables:
iC : demand for commodity i by the household
1nC + : demand for leisure
iCZ : demand for commodity i in the benchmark CBUD : consumption budget of the household CEBUD : extended budget of the household
iCG : demand for commodity i by the Palestinian Authority
iE : export of the domestically produced commodity i ER : exchange rate FAID : foreign aid FTRF : transfers to household from abroad GOVR : PA revenues
iI : demand for commodity i for investment
iK : capital demand by firms KS : capital endowment
iL : labor demand by firms LF : labor demand by Israel LS : labor endowment
iM : imports of commodity i
iP : price of composite commodity i
iPZ : price of composite commodity i in the benchmark PCINDEX : Laspeyres consumer price index
iPD : price of domestically produced commodity i
iPDD : price of the domestically produced commodity i supplied to the domestic market
iPE : export price (in local currency) PK : return to capital PL : domestic wage rate PLF : wage rate in Israel
iPM : import price (in local currency)
iPWEZ : world price of exports
iPWMZ : world price of imports

14
RE : remittances S : total savings SF : foreign savings SG : PA savings SH : household savings TAXR : total tax revenues TRO : real other transfers to the household TS : time endowment UNEMP : unemployment
iX : supply of composite commodity i
iXD : supply of domestically produced commodity i
iXDD : domestic commodity i supplied to the domestic market Y : household's total income Parameters:
iaA : efficiency parameter of the Armington function
iaF : efficiency parameter of firm's i CES production function
iaT : efficiency parameter of the CET function
iCGα : Cobb-Douglas power of the demand of commodity i by government
iHLESα : marginal budget shares of commodity i in the household’s LES utility function
1nHLES +α : marginal budget share of leisure in the household’s LES utility function
iIα : Cobb-Douglas power of the bank's utility function b : shift parameter of the arbitrage condition
iAγ : share parameter of the imports in the Armington function
iFγ : share parameter of capital of firm's i CES production function
iTγ : share parameter of exports of the CET function
j,iio : technical coefficients of the inter-industry flows mps : marginal propensity to save

15
iHµ : subsistence level of commodity i in the household’s LES utility function
1nH +µ : subsistence level of leisure in the household’s LES utility function
iAσ : elasticity of substitution of the Armington function
iFσ : elasticity of substitution of firm’s i CES production function
iTσ : elasticity of transformation of the CET function
itc : tax rate on consumer commodities
itcz : tax rate on consumer commodities in the benchmark
itk : tax rate on capital use
itl : tax rate on labor use
itm : tariff rate
ty : tax rate on income Appendix 3. The model Note: the index i = 1, 2,…,n refers to commodities, while the index n+1 refers to leisure. Variables:
,PZ,P,M,LS,LF,L,KS,K,I,GOVR,FTRF,FAID,ER,E,CG,CBUD,CZ,C iiiii,iiiii
,SH,SG,SF,S,RE,PWMZ,PWEZ,PM,PLF,PL,PK,PE,PDD,PD,PCINDEX iiiiii Y,XDD,XD,X,UNEMP,TS,TRO,TRF,TAXR iii
Parameters:
,H,H,mps,io,T,F,A,b,I,HLES,HLES,CG,aT,aF,aA 1nij,iiiii1niiiii ++ µµγγγαααα ty,tm,tl,tk,tcz,tc,T,F,A iiii,iiii σσσ
Household:
)H.P).tc1(CBUD.(]P).tc1.[(HLESHC j
n
1jjj
1iiiii µ+−+α+µ= ∑
=
−
Y).ty1.(mpsSH −=
+−−
−−−= ∑
=
−
+
++ jj
n
1jj
1
1n
1n1n Hµ.P).tc1(CBUD.]PL).ty1.[(
)HLESα1(HLESα
)HµTS(LS

16
PLF.b).LFUNEMP
LF(PL+
=
∑
∑
=
=
+
+= n
1iiii
n
1iiii
CZ.PZ).tcz1(
CZ.P).tc1(PCINDEX
Investment demand:
SF.ERSG.PCINDEXSHS ++=
S.II.P iii α= Firms:
( ) .]PL).sftl1.[()Fγ1(]PK).tk1.[(Fγ.]PK).tk1.[(FγK)Fσ1/(FσFσ1
iiFσ
iFσ1
iFσ
iFσ
iFσ
iiiiiiiiii
−−−− −+−+++= .( )aF/XD ii
( ) .]PL).sftl1.[()Fγ1(]PK).tk1.[(Fγ.]PL).sftl1.[()Fγ1(L
)Fσ1/(FσFσ1ii
Fσi
Fσ1i
Fσi
Fσii
Fσii
iiiiiiii−−−− −+−++−+−=
)aF/XD.( ii Foreign sector:
[ ] )aA/X.(PDD.)A1(PM.A.PDD.)A1(XDD ii)A1/(AA1
iA
iA1
iA
iA
iA
iiii
iiiiiiσ−σσ−σσ−σσ−σ γ−+γγ−=
[ ] )aA/X.(PDD.)A1(PM.A.PM.AM ii
)A1/(AA1i
Ai
A1i
Ai
Ai
Aii
iiiiiiiiσ−σσ−σσ−σσ−σ γ−+γγ=
[ ] )aT/XD.(PDD.)T1(PE.T.PDD.)T1(XDD ii
)T1/(TT1i
Ti
T1i
Ti
Ti
Tii
iiiiiiiiσ−σσ−σσ−σσ−σ γ−+γγ−=
[ ] )aT/XD.(PDD.)T1(PE.T.PE.TE ii
)T1/(TT1i
Ti
T1i
Ti
Ti
Tii
iiiiiiiiσ−σσ−σσ−σσ−σ γ−+γγ=
( ) iii PWMZ.ER.tm1PM +=
ii PWEZ.ERPE =
∑ ∑= =
++++=n
1i
n
1iiiii FTRFREFAIDSFE.PWEZM.PWMZ
LF.PLFRE =

17
Palestinian authority:
)SG.PCINDEXTRFGOVR.(P.CGαCG 1iii −−= −
( ) Y.tyM.PWMZ.ER.tmL.PL.tlK.PK.tkC.P.tcTAXRn
1iiiiiiiiiii ++++= ∑
=
FAID.ERTAXRGOVR +=
TRO.PCINDEXTRF = Market clearing:
KSKn
1ii =∑
=
*∑ UNEMPLSLFLn
1ii −=+
=
iii
n
1jjj,ii ICCGXD.ioX +++= ∑
=
Income equations:
)REFTRF.(ERTRF)LFUNEMPLS.(PLKS.PKY +++−−+=
SHY).ty1(CBUD −−=
++++= ∑
=
n
1ji,jjiiiiiii io.P.XDL.PL).tl1(K.PK).tk1(XD.PD
iiiiii XDD.PDDM.PMX.P +=
iiiiii XDD.PDDE.PEXD.PD += *Commented out (Law of Walras): market clearing of labor market Closure: TS,TRO,SG,SF,PWMZ,PWEZ,PZ,PLF,LF,KS,FTRF,FAID,CZ iiii
Numeraire: ER


