Embed Size (px)
Citation preview
arX
iv:a
stro
-ph/
0308
348v
2 1
1 M
ay 2
004
Dwarf Dark Matter Halos
P. ColinInstituto de Astronomia, Universidad Nacional Autonoma de Mexico, C.P. 04510, Mexico, D.F., Mexico
A. Klypin, O. ValenzuelaAstronomy Department, New Mexico State University, Box 30001, Department 4500, Las Cruces, NM
88003-0001, U.S.A.
Stefan GottloberAstrophysikalisches Institut Potsdam, An der Sternwarte 16, 14482 Potsdam, Germany
ABSTRACT
We study properties of dark matter halos at high redshifts z = 2−10 for a vast range of masseswith the emphasis on dwarf halos with masses 107−109h−1M⊙. We find that the density profilesof relaxed dwarf halos are well fitted by the NFW profile and do not have cores. We computethe halo mass function and the halo spin parameter distribution and find that the former is verywell reproduced by the Sheth & Tormen model while the latter is well fitted by a lognormaldistribution with λ0 = 0.042 and σλ = 0.63. We estimate the distribution of concentrations forhalos in mass range that covers six orders of magnitude from 107 h−1M⊙ to 1013 h−1M⊙, andfind that the data are well reproduced by the model of Bullock et al. The extrapolation of ourresults to z = 0 predicts that present-day isolated dwarf halos should have a very large medianconcentration of ∼ 35. We measure the subhalo circular velocity functions for halos with massesthat range from 4.6× 10⁹h−1M⊙ to 1013 h−1M⊙ and find that they are similar when normalizedto the circular velocity of the parent halo. Dwarf halos studied in this paper are many ordersof magnitude smaller than well-studied cluster- and Milky Way-sized halos. Yet, in all respectsthe dwarfs are just down-scaled versions of the large halos. They are cuspy and, as expected,more concentrated. They have the same spin parameter distribution and follow the same massfunction that was measured for large halos.
Subject headings: cosmology: theory — cosmology: dark matter — galaxies: formation — galaxies: halos
— methods: numerical
1. Introduction
Dwarf galaxies with virial masses 107 − 109M⊙
are the smallest virialized objects in the universethat show evidence of dark matter (Mateo 1998,and references therein). Some of these galaxies areso small that they can be detected only in the Lo-cal Group. Large amounts of dark matter alongwith the proximity to the Milky Way make dwarfgalaxies an ideal laboratory for testing the hierar-chical cosmologies such as the standard ΛCDM.The rotation curves of dwarf irregular galaxies
and the velocity dispersions of dwarf spheroidalgalaxies have been used in the last decade to con-strain the density of the dark matter in the centralparts of these galaxies and, thus, to constrain thestructure of dark matter (DM) halos that host thegalaxies. So far the results indicate that DM ha-los should have flat cores (Carignan & Freeman1988; Carignan & Beauliu 1989; Flores & Pri-mack 1994; Moore 1994; Burkert 1995). Thisis inconsistent with the cold dark matter theory,which predicts cuspy cores with ρ ∝ r−1 (Dubin-
1
ski & Carlberg 1991; Navarro, Frenk, & White1995, 1996, 1997, hereafter NFW) or ρ ∝ r−1.5
(Moore et al. 1999). The controversy of the flatversus cuspy DM cores is still not resolved. Recentobservations and analysis of dwarf and low surfacebrightness (LSB) galaxies rotation curves continueto suggest a dark matter halo density profile with arelatively flat core (de Blok, Bosma, & McGaugh2003; Weldrake, de Blok, & Walter 2003), butsee also Swaters et al. (2003); Rhee, Klypin, &Valenzuela (2003).
A second somewhat related problem faced bythe CDM cosmogony is the excessive substructurepredicted by this model in Milky Way-sized ha-los as compared with what is observed (Klypinet al. 1999b; Moore et al. 1999). Withinthe CDM framework this problem finds a nat-ural explanation in the reionization of the uni-verse: satellites form only inside subhalos that col-lapse early, before the universe was fully ionized(Bullock, Kravtsov, & Weinberg 2000; Somerville2002; Benson et al. 2002). There may be a differ-ent reading of the substructure problem which de-pends on how peak circular velocities, vmax, are as-signed to dwarf spheroidal (dSph) galaxies (thesegalaxies comprise most of the Milky Way satel-lites). If these galaxies have a larger vmax thanwhat was previously expected, there is no dis-agreement: the small number of satellites would beexplained by the relatively scarcity by which largesubhalos are formed in the CDM model. In thiscase every large DM satellite hosts a dwarf galaxy.The absence of a stellar component in the nu-merous small DM satellites could be explained byfeedback and/or reionization. The problem seemsto be degenerate: observed dwarf galaxies can behosted by either a relatively low-concentration buthigh-vmax halo (Hayashi et al. 2003; Stoehr etal. 2002) or by a high-concentration and low-vmax halo ( Lokas 2002). Thus, the concentra-tion of dwarf DM halos is quite important. Accu-rate measurements of the concentration for a largesample of dwarf DM halos is one of the goals of thispaper.
Attempts have been made to simulate dwarf ha-los with high resolution within a cosmological con-text. Moore et al. (2001) simulated one “Draco”-sized halo (Mvir ∼ 108h−1M⊙) with several mil-lion particles and with high force resolution. Theirfit of the density profile favor the inner slope −1.3.
Ricotti (2002) presented several simulations in-cluding one with a small (1 h−1Mpc) box. Thedwarf halos in this small box are resolved withonly few tens of thousands of particles at highredshifts. Ricotti (2002) finds that at z ∼ 10the density profiles have inner slopes in the range[−0.4,−0.5]. Recently, Cen et al. (2004) repro-duced results of Ricotti (2002) using halos withvery small number (few thousands) of particles.Cusps in these simulations are much flatter thanthat quoted by Moore et al. Navarro et al. (2003)made high resolution simulations of dwarf halos,but those were presented only at z = 0. Dwarfhalos were found to have steep profiles. Thus,the issue of the evolution of the cusps of dwarfsis still not settled. Numerical effects are of specialconcern for low resolution simulations. Yet, thereare other issues, which require attension includ-ing treatment of non-equilibrium features in thedensity distribution.
In this paper, we also study cusps of dwarf ha-los. But cusps is only one of the aspects, which weare interested in. The statistical properties of thispopulation of halos such as the mass function orthe spin parameter distribution are also studied.
Dwarf halos with masses Mvir ∼ 107−109h−1M⊙
studied in this paper form at very high redshifts.If a halo of this low mass remains isolated, it isexpected to grow only 2-3 times since redshiftz ≈ 3 until z = 0 (van den Bosch 2002) with mostof the mass ending up in the outer part of thehalo. Thus, the halo profile should not changemuch since z = 3. The dwarfs may be accretedby larger halos and become satellites. If that hap-pens, they are significantly stripped and lose mostof their mass in outer regions. In any case, it isimportant to know what was the structure of thedwarfs at high redshifts. This is why we focus onthe structure of the dwarfs at z ≈ 3.
The paper is organized as follows. In §2 wepresent the cosmological model and describe nu-merical simulations used in our analysis. The massfunction of simulated halos span a mass range ofseven orders of magnitude. Density profiles of themost resolved dwarf halos from the 1 h−1Mpc boxare presented in §3.1. The concentration versusmass diagram along with the analytical predictionby Bullock et al. (2001a) is also shown there. In§3.2 we compute the subhalo velocity function forour most massive halos and show the almost self-
2

Table 1
Parameters of simulations
Box Mass resolution Force resolution σ8 Name(h−1Mpc) (h−1M⊙) (comoving h−1pc)
1 4.9 × 10³ 61 0.75 A25 1.2 × 10⁶ 191 0.90 B80 4.0 × 10⁷ 610 0.90 C60 1.1 × 10⁹ 2000 1.00 D
similar nature of the dark matter inside virializedsystems, in agreement with the results of Moore etal. (2001) and De Lucia et al. (2003). The differ-ential mass function of halos from the 1 h−1Mpcbox is calculated in §4.1. A comparison is madewith the prediction by Sheth & Tormen (1999). In§4.2 we calculate the spin parameter distributionof dwarf halos for the 1 h−1Mpc box and compareit with one at z = 0 with the same cosmology. Wediscuss some of the results presented in previoussections and present our concluding remarks in §5.
2. Numerical Simulations
We use a series of simulations of a low-densityflat ΛCDM cosmological model with the followingparameters: Ω0 = 0.3, ΩΛ = 0.7, and h = 0.7.All simulations are done with the Adaptive Re-finement Tree (ART) code (Kravtsov et al. 1997).The ART code achieves high spatial resolution byrefining the base uniform grid in all high-densityregions with an automated refinement algorithm.
For our code a convergence study shows thatdensity deviations less than 10% are expected atradii larger than 4 times the formal force reso-lution or the radius that contains 200 particles,whichever is larger (Klypin et al. 2001). This isrecently confirmed in a detailed analysis of haloprofiles by Tasitsiomi et al. (2003). With the aimof studying the structure of dwarf halos, we per-form a simulation of an 1 h−1Mpc box on a sidewith 2563 particles. One of the motivations forchoosing this small box is to reproduce the sameconfiguration as in Ricotti (2002). The simula-tion has been stopped at z = 2.3 when the longestfluctuations in the box are still well in the lin-ear regime. At redshift z = 3.3 in the simula-tion there are 4 large halos resolved with more
than 200, 000 particles and with proper force res-olution 14h−1pc. For analysis we also use manymore smaller halos.
To complement our study we use three moresimulations. We use the simulation presented inKlypin et al. (2001), who focused on a con-vergence study of the density structure of threeMilky Way-sized halos at low redshifts. At z = 3the three largest halos in that simulation havea mass of about 1011 h−1M⊙ and are resolvedwith ∼ 105 particles. For our analysis we alsouse 12 large halos with more than 5000 particles(M > 6 × 10⁹ h−1M⊙).
We also use a 80 h−1Mpc box simulation, inwhich at redshift z = 3 we identified 5 large halosresolved with more than 105 particles. At z = 0the halos have become a cluster-sized halo of virialmass Mvir ≈ 2 × 10¹⁴h−1M⊙. The high redshifthalos are used for our analysis.
Finally, we use the 60 h−1Mpc simulation with2563 particles described in Colın et al. (1999);Klypin et al. (1999a). The parameters of all thesimulations are presented in Table 1. In column 1we show the comoving size of the computationalbox. The mass resolution is given in column 2,while the formal spatial resolution (size of a cellin the finest refinement grid in comoving units) isshown in column 3. Column 4 gives the value ofσ8 (the rms of mass fluctuations estimated withthe top-hat window of radius 8h−1Mpc). Finally,column 5 gives the name of the simulation (whichis also used for objects studied in this simulation).
In our simulations the halos are identified bythe Bounded-Density-Maxima (BDM) algorithm(Klypin & Holtzman 1997; Klypin et al. 1999a).The BDM algorithm first finds positions of lo-cal maxima in the density field. These density
3
maxima are found using a top-hat filter with a“search radius” which is several times larger thanthe force resolution. Once centers of potential ha-los are found, the algorithm identifies halos aroundthem and removes particles which are not boundto those halos. This procedure also detects sub-halos of larger objects – halos inside halos (for ex-ample, satellites of galaxies or galaxies in clusters).Particles of a subhalo are bound to both the sub-halo and to the larger halo.
3. Halo structure
3.1. Density profiles and concentrations
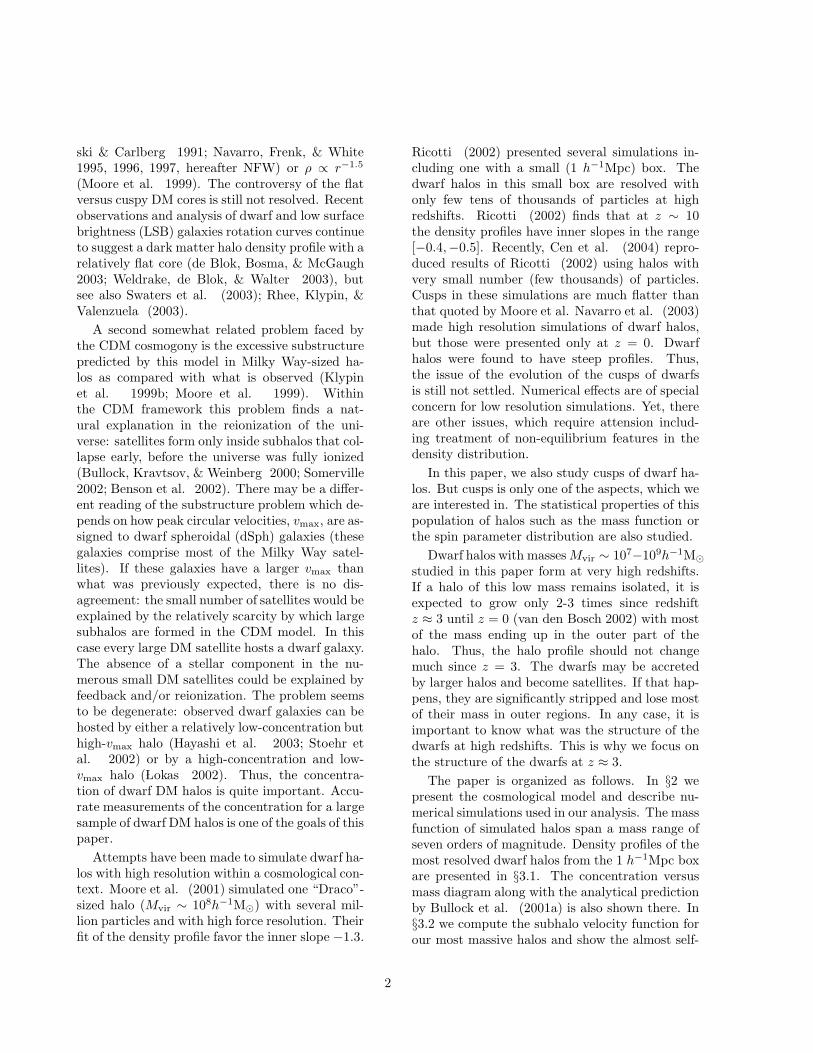
We start our analysis of halo profiles by study-ing all most massive halos (subhalos are not in-cluded). The profiles are not averaged over timeand halos are not selected to be quite or notto have large merging events. Thus, some non-equilibrium features are expected. Figure 1 showsthe density profiles of the ten most massive halosin the 1h−1Mpc box at z = 3.3 plotted from theradii which contain at least 200 particles to theirvirial radii. The profiles are given in normalizedunits: the radius is measured in units of the scaleradius rs, the radius where the logarithmic deriva-tive of the NFW profile (see equation 1) is equalto −2, whereas the density is measured in unitsof a characteristic density ρs = ρ0/4, the NFWdensity evaluated at r = rs. These parameters aretaken from their corresponding NFW fits. The ha-los show a variety of profiles. Some profiles havesignificant deviations from the NFW fit (e.g., thesecond and the forth from the top) while othersare fitted by NFW reasonably well (e.g., the fifthhalo).
The wiggles in the profiles seen in the outskirtsof most halos can be explained as substructurethat have not yet reached equilibrium with the restof the halo or as the result of a significant merger.For example, halos number 2 and 9 from top are inthe process of a major merger. Both halos show adensity enhancement in the peripheral part (morepronounced in case of halo 2). The almost power-law profile of halo 9 may be a consequence of theway the merger has developed 1.
1Out of the fifteen biggest halos in the 1 h−1Mpc box, themerger companion of halo 9 has the most peculiar densityprofile. It has the highest rs value even though it is the
Fig. 1.— Density profiles of the ten most massivehalos of the 1 h−1Mpc box in normalized units.The dotted curves iare the NFW profile. For clar-ity we shift down the profiles by −0.5 in logarithm.Halos are ordered by mass with the most massivehalo being at the top of the plot. The densityprofiles are cut at the virial radii. The innermostbin contains more than 200 particles. No sign of ashallow core is seen in any of the halos. However,most halos have wiggles in the peripheral regions,which are due to residual substructure and ongo-ing merging. The labels An, with n = 1, ..., 4, rep-resent the “equilibrium” halos used for subsequentanalysis.
No matter how large or small are the deviations,the profiles do not show a sign of flat cores in thecentral part of dwarf halos. In other words, steepcentral cusps of halos in our simulations contra-dict the results of Ricotti (2002), who finds thatcentral slopes of halos in his 1 h−1Mpc simulationare very shallow: ρ ∝ rα, α ≈ −0.2.
There are some differences in the way how weand Ricotti (2002) approximate profiles. Ri-cotti does the approximations at much earlier timez ∼ 10 when halos are much smaller and are less
second least massive halo on the list.
4
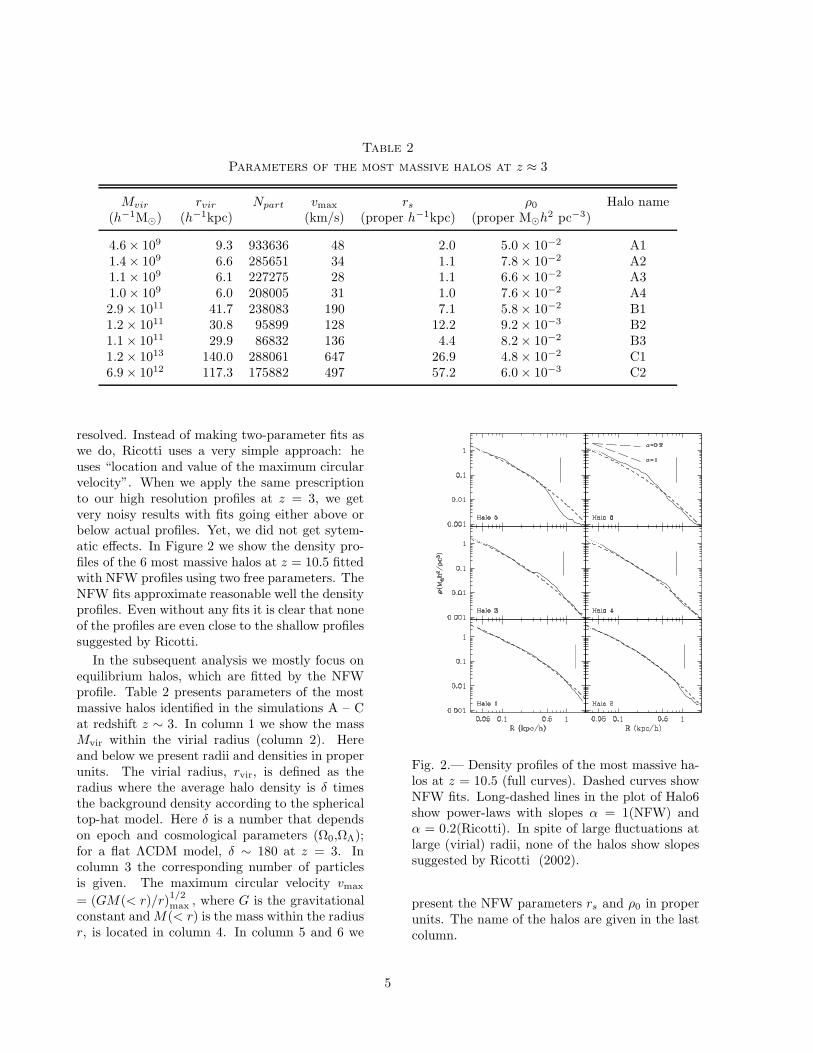
Table 2
Parameters of the most massive halos at z ≈ 3
Mvir rvir Npart vmax rs ρ0 Halo name(h−1M⊙) (h−1kpc) (km/s) (proper h−1kpc) (proper M⊙h2 pc−3)
4.6 × 10⁹ 9.3 933636 48 2.0 5.0 × 10⁻² A11.4 × 109 6.6 285651 34 1.1 7.8 × 10⁻² A21.1 × 109 6.1 227275 28 1.1 6.6 × 10⁻² A31.0 × 109 6.0 208005 31 1.0 7.6 × 10⁻² A42.9 × 1011 41.7 238083 190 7.1 5.8 × 10⁻² B11.2 × 1011 30.8 95899 128 12.2 9.2 × 10⁻³ B21.1 × 1011 29.9 86832 136 4.4 8.2 × 10⁻² B31.2 × 1013 140.0 288061 647 26.9 4.8 × 10⁻² C16.9 × 1012 117.3 175882 497 57.2 6.0 × 10⁻³ C2
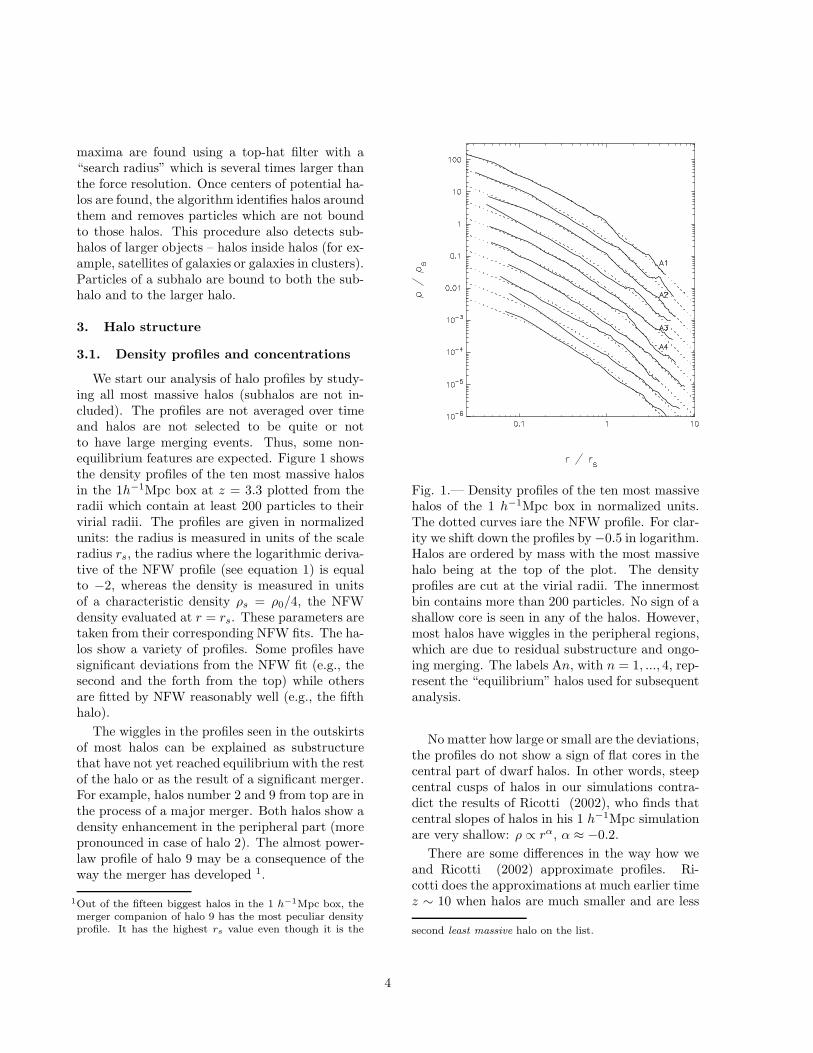
resolved. Instead of making two-parameter fits aswe do, Ricotti uses a very simple approach: heuses “location and value of the maximum circularvelocity”. When we apply the same prescriptionto our high resolution profiles at z = 3, we getvery noisy results with fits going either above orbelow actual profiles. Yet, we did not get sytem-atic effects. In Figure 2 we show the density pro-files of the 6 most massive halos at z = 10.5 fittedwith NFW profiles using two free parameters. TheNFW fits approximate reasonable well the densityprofiles. Even without any fits it is clear that noneof the profiles are even close to the shallow profilessuggested by Ricotti.
In the subsequent analysis we mostly focus onequilibrium halos, which are fitted by the NFWprofile. Table 2 presents parameters of the mostmassive halos identified in the simulations A – Cat redshift z ∼ 3. In column 1 we show the massMvir within the virial radius (column 2). Hereand below we present radii and densities in properunits. The virial radius, rvir, is defined as theradius where the average halo density is δ timesthe background density according to the sphericaltop-hat model. Here δ is a number that dependson epoch and cosmological parameters (Ω0,ΩΛ);for a flat ΛCDM model, δ ∼ 180 at z = 3. Incolumn 3 the corresponding number of particlesis given. The maximum circular velocity vmax
= (GM(< r)/r)1/2
max, where G is the gravitational
constant and M(< r) is the mass within the radiusr, is located in column 4. In column 5 and 6 we
Fig. 2.— Density profiles of the most massive ha-los at z = 10.5 (full curves). Dashed curves showNFW fits. Long-dashed lines in the plot of Halo6show power-laws with slopes α = 1(NFW) andα = 0.2(Ricotti). In spite of large fluctuations atlarge (virial) radii, none of the halos show slopessuggested by Ricotti (2002).
present the NFW parameters rs and ρ0 in properunits. The name of the halos are given in the lastcolumn.
5
We impose the following “equilibrium” criteriato select a halo for further analysis: (1) The haloshould not be within the virial radius of a moremassive halo; i.e, the halo is not a subhalo. (2)The halo should not have a subhalo with a masslarger than one tenth the mass of the halo. Finally,(3) we also use a goodness of fit criterion to rejecthalos with Df ≥ 0.004, where the accuracy of thefit Df is defined as follows.
We compute the density, ρ(r), in sphericalshells whose radii increase as the square of the binnumber, n. Under this scheme, the logarithmic ra-dial width, ∆ log r, is not constant but decreaseswith n, and for high values of n ∆ log r goes as 2/n.This binning improves the often used constant log-arithmic binning. We use the NFW profile, ρNFW,to fit our halo density profiles
ρNFW(r) =ρ0
r/rs(1 + r/rs)2. (1)
The best fit and thus parameters ρ0 and rs areobtained by minimizing χ2,
χ2(ρ0, rs) =N
∑
n=1
[
log ρ(rn) − log ρNFW(rn)
σn
]2
.
(2)We define ωn ≡ 1/σ2
n to be
ωn =∆r
rn=
2n + 7
(n + 3)2(3)
to compensate for the increasing density of binswith radius. In equation (3), ∆r is the radialwidth for our binning scheme and n is the numberof the bin corresponding to radius rn. Notice thatby definition ω is constant for a binning constantin log(r). We estimate the accuracy of the fit withthe parameter D ≡ χ2/F , where F =
∑
ωn andthe sum runs over the number of bins N . Thisparameter reduces to χ2/N (with σn = 1) whenω is constant and it is a better estimation of thegoodness of the fit than, for example, a maximumdeviation because average out possible large fluc-tuations in some bins. We set D = Df = 0.004as our criterion for the quality of the fit. Haloswith Df < 0.004 that satisfy at the same timeour minimum requirements for equilibrium (crite-ria 1 and 2) comprise 65% of the sample. In fact,in the distribution of D there is a strong drop inthe number of halos above Df . It seems that Df
separates relaxed from unrelaxed halos.
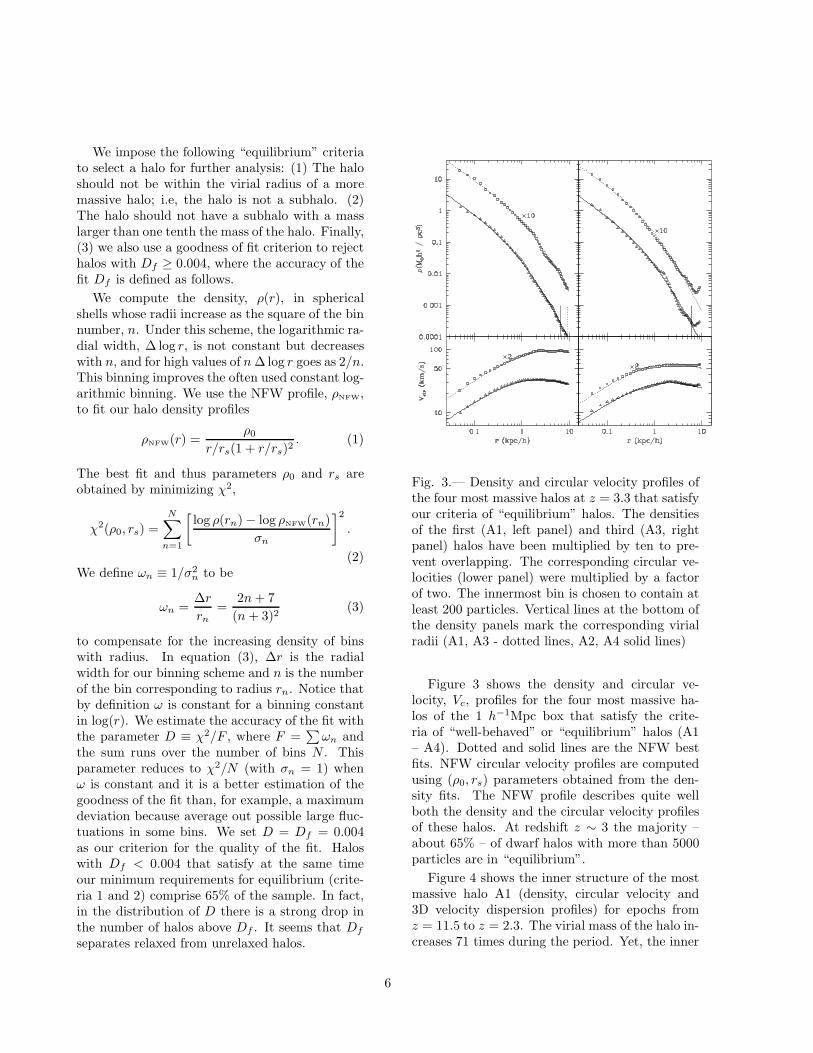
Fig. 3.— Density and circular velocity profiles ofthe four most massive halos at z = 3.3 that satisfyour criteria of “equilibrium” halos. The densitiesof the first (A1, left panel) and third (A3, rightpanel) halos have been multiplied by ten to pre-vent overlapping. The corresponding circular ve-locities (lower panel) were multiplied by a factorof two. The innermost bin is chosen to contain atleast 200 particles. Vertical lines at the bottom ofthe density panels mark the corresponding virialradii (A1, A3 - dotted lines, A2, A4 solid lines)
Figure 3 shows the density and circular ve-locity, Vc, profiles for the four most massive ha-los of the 1 h−1Mpc box that satisfy the crite-ria of “well-behaved” or “equilibrium” halos (A1– A4). Dotted and solid lines are the NFW bestfits. NFW circular velocity profiles are computedusing (ρ0, rs) parameters obtained from the den-sity fits. The NFW profile describes quite wellboth the density and the circular velocity profilesof these halos. At redshift z ∼ 3 the majority –about 65% – of dwarf halos with more than 5000particles are in “equilibrium”.
Figure 4 shows the inner structure of the mostmassive halo A1 (density, circular velocity and3D velocity dispersion profiles) for epochs fromz = 11.5 to z = 2.3. The virial mass of the halo in-creases 71 times during the period. Yet, the inner
6
density profile (radii less than ≈ 100 pc) changesvery little. Thus, the cusp of the halo was alreadyin place at very high redshift and since then showslittle evolution. The central 0.5 kpc region showslittle evolution since redshift z = 5. This does notmean that particles, which at redshift z ≈ 10 arein the core stay there at later times. Comparisonof the rms velocities (middle panel) with the cir-cular velocities (top panel) clearly indicates thatparticles in the core move with random velocitiesthat significantly exceed the circular velocity. Thisimplies that the core itself is not self-bound anda large fraction of particles simply passes throughthe cusp. This is very important for understand-ing the evolution of halo concentration.
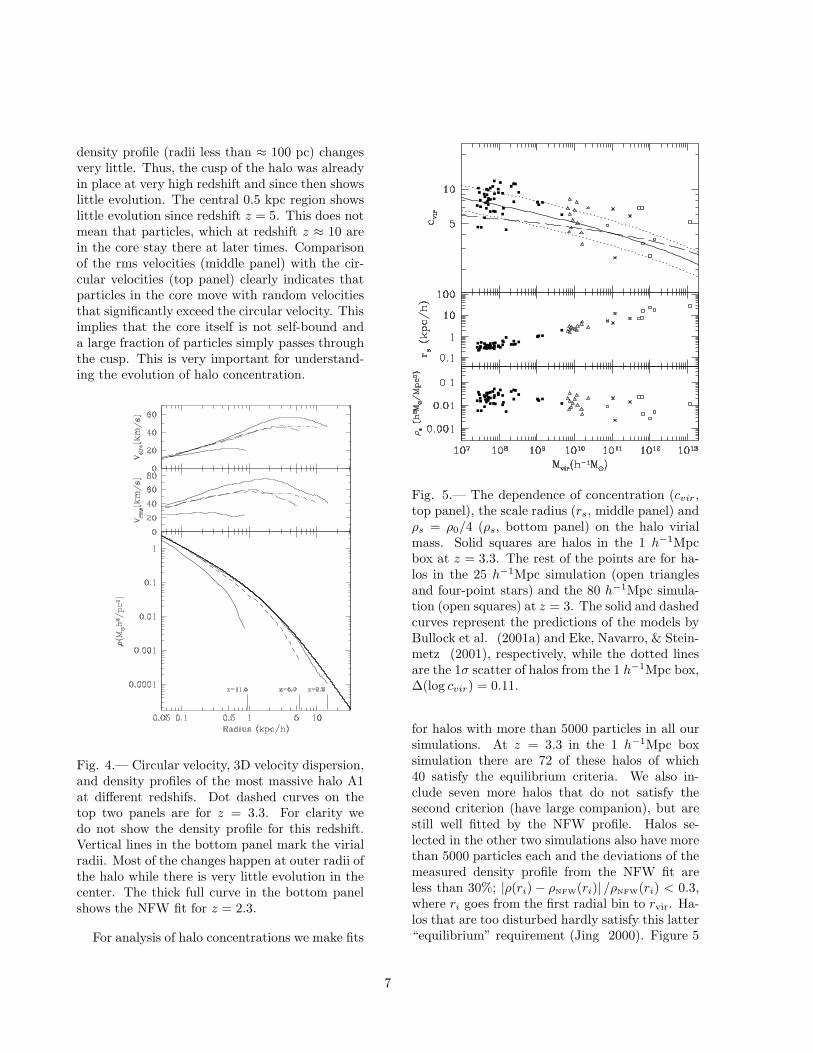
Fig. 4.— Circular velocity, 3D velocity dispersion,and density profiles of the most massive halo A1at different redshifs. Dot dashed curves on thetop two panels are for z = 3.3. For clarity wedo not show the density profile for this redshift.Vertical lines in the bottom panel mark the virialradii. Most of the changes happen at outer radii ofthe halo while there is very little evolution in thecenter. The thick full curve in the bottom panelshows the NFW fit for z = 2.3.
For analysis of halo concentrations we make fits
Fig. 5.— The dependence of concentration (cvir ,top panel), the scale radius (rs, middle panel) andρs = ρ0/4 (ρs, bottom panel) on the halo virialmass. Solid squares are halos in the 1 h−1Mpcbox at z = 3.3. The rest of the points are for ha-los in the 25 h−1Mpc simulation (open trianglesand four-point stars) and the 80 h−1Mpc simula-tion (open squares) at z = 3. The solid and dashedcurves represent the predictions of the models byBullock et al. (2001a) and Eke, Navarro, & Stein-metz (2001), respectively, while the dotted linesare the 1σ scatter of halos from the 1 h−1Mpc box,∆(log cvir) = 0.11.
for halos with more than 5000 particles in all oursimulations. At z = 3.3 in the 1 h−1Mpc boxsimulation there are 72 of these halos of which40 satisfy the equilibrium criteria. We also in-clude seven more halos that do not satisfy thesecond criterion (have large companion), but arestill well fitted by the NFW profile. Halos se-lected in the other two simulations also have morethan 5000 particles each and the deviations of themeasured density profile from the NFW fit areless than 30%; |ρ(ri) − ρNFW(ri)| /ρNFW(ri) < 0.3,where ri goes from the first radial bin to rvir. Ha-los that are too disturbed hardly satisfy this latter“equilibrium” requirement (Jing 2000). Figure 5
7
shows concentrations cvir ≡ rvir/rs, proper scaleradii, rs, and proper densities at the scale radiiρs = ρ0/4 for halos of different virial masses Mvir.The solid and dashed curves are the predictions ofthe concentration at z = 3.0 based on the mod-els of Bullock et al. (2001a) and Eke, Navarro,& Steinmetz (2001), respectively, for the appro-priate cosmological model with σ8 = 0.9. Thepoints from the 1 h−1Mpc box are slightly scaledup to take into account the different normalization(σ8 = 0.75) and the slightly different identifica-tion redshift (z = 3.3). For this latter, we use the1 + z dependence of cvir while for the former wemultiply cvir by 0.9/0.75, which is a good approx-imation because dwarf halos form very early whenthe growth factor is proportional to a.2 We usethe halos from the 1 h−1Mpc box to compute thestandard deviation of the log(c) distribution andfind ∆(log cvir) = 0.11, which is a factor 1.6 lowerthan that quoted by Bullock et al. (2001a). Ifwe use the whole sample of halos only under therestriction that they must have more than 5000particles, the scatter increases to 0.14. So, at leastpart if not all (see §5), of our smaller scatter is dueto the fact that we are using relaxed halos.
In summary, dwarf halos seem to be in manyrespects a down-scaled copy of more massive ha-los. For example, they all have cusps regardless oftheir equilibrium status. Interestingly, they havea median concentration that agree with the modelof Bullock et al. (2001a). We extended the cvir
versus Mvir diagram to high masses and showedhow the Bullock et al. model continue to predictthe correct concentration.
3.2. Substructure mass function
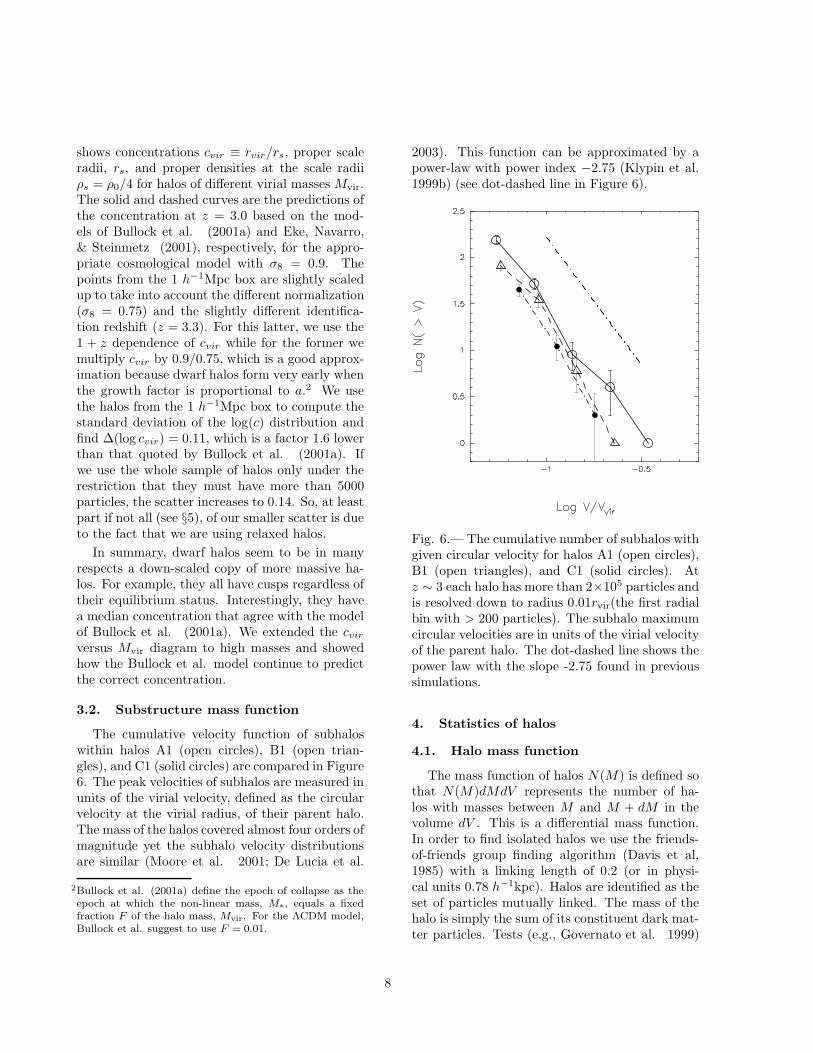
The cumulative velocity function of subhaloswithin halos A1 (open circles), B1 (open trian-gles), and C1 (solid circles) are compared in Figure6. The peak velocities of subhalos are measured inunits of the virial velocity, defined as the circularvelocity at the virial radius, of their parent halo.The mass of the halos covered almost four orders ofmagnitude yet the subhalo velocity distributionsare similar (Moore et al. 2001; De Lucia et al.
2Bullock et al. (2001a) define the epoch of collapse as theepoch at which the non-linear mass, M∗, equals a fixedfraction F of the halo mass, Mvir. For the ΛCDM model,Bullock et al. suggest to use F = 0.01.
2003). This function can be approximated by apower-law with power index −2.75 (Klypin et al.1999b) (see dot-dashed line in Figure 6).
Fig. 6.— The cumulative number of subhalos withgiven circular velocity for halos A1 (open circles),B1 (open triangles), and C1 (solid circles). Atz ∼ 3 each halo has more than 2×10⁵ particles andis resolved down to radius 0.01rvir(the first radialbin with > 200 particles). The subhalo maximumcircular velocities are in units of the virial velocityof the parent halo. The dot-dashed line shows thepower law with the slope -2.75 found in previoussimulations.
4. Statistics of halos
4.1. Halo mass function
The mass function of halos N(M) is defined sothat N(M)dMdV represents the number of ha-los with masses between M and M + dM in thevolume dV . This is a differential mass function.In order to find isolated halos we use the friends-of-friends group finding algorithm (Davis et al.1985) with a linking length of 0.2 (or in physi-cal units 0.78 h−1kpc). Halos are identified as theset of particles mutually linked. The mass of thehalo is simply the sum of its constituent dark mat-ter particles. Tests (e.g., Governato et al. 1999)
8
indicate that at least 30 particles are needed totake into account properly the effect of mass res-olution. In this paper we analyze only halos withmore than 40 particles.
We construct the dwarf halo mass function bygrouping the halos according to their mass in binsof ∆ log(M) = 0.1. In order to avoid too largestatistical fluctuations, we do not use the few mostmassive halos. Error bars for data in individualbins are estimated using Poisson statistics.
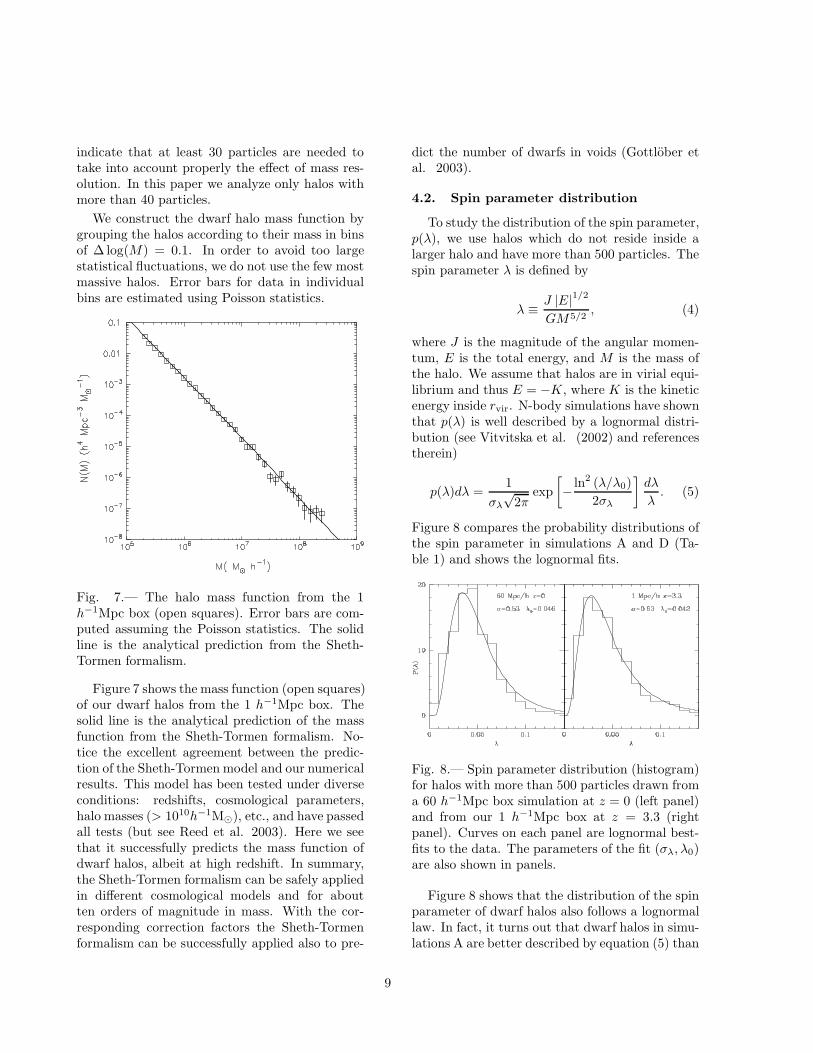
Fig. 7.— The halo mass function from the 1h−1Mpc box (open squares). Error bars are com-puted assuming the Poisson statistics. The solidline is the analytical prediction from the Sheth-Tormen formalism.
Figure 7 shows the mass function (open squares)of our dwarf halos from the 1 h−1Mpc box. Thesolid line is the analytical prediction of the massfunction from the Sheth-Tormen formalism. No-tice the excellent agreement between the predic-tion of the Sheth-Tormen model and our numericalresults. This model has been tested under diverseconditions: redshifts, cosmological parameters,halo masses (> 1010h−1M⊙), etc., and have passedall tests (but see Reed et al. 2003). Here we seethat it successfully predicts the mass function ofdwarf halos, albeit at high redshift. In summary,the Sheth-Tormen formalism can be safely appliedin different cosmological models and for aboutten orders of magnitude in mass. With the cor-responding correction factors the Sheth-Tormenformalism can be successfully applied also to pre-
dict the number of dwarfs in voids (Gottlober etal. 2003).
4.2. Spin parameter distribution
To study the distribution of the spin parameter,p(λ), we use halos which do not reside inside alarger halo and have more than 500 particles. Thespin parameter λ is defined by
λ ≡ J |E|1/2
GM5/2, (4)
where J is the magnitude of the angular momen-tum, E is the total energy, and M is the mass ofthe halo. We assume that halos are in virial equi-librium and thus E = −K, where K is the kineticenergy inside rvir. N-body simulations have shownthat p(λ) is well described by a lognormal distri-bution (see Vitvitska et al. (2002) and referencestherein)
p(λ)dλ =1
σλ
√2π
exp
[
− ln2 (λ/λ0)
2σλ
]
dλ
λ. (5)
Figure 8 compares the probability distributions ofthe spin parameter in simulations A and D (Ta-ble 1) and shows the lognormal fits.
Fig. 8.— Spin parameter distribution (histogram)for halos with more than 500 particles drawn froma 60 h−1Mpc box simulation at z = 0 (left panel)and from our 1 h−1Mpc box at z = 3.3 (rightpanel). Curves on each panel are lognormal best-fits to the data. The parameters of the fit (σλ, λ0)are also shown in panels.
Figure 8 shows that the distribution of the spinparameter of dwarf halos also follows a lognormallaw. In fact, it turns out that dwarf halos in simu-lations A are better described by equation (5) than
9
the more massive halos in the simulation D: theirdistribution has a lower χ2 for the same numberof bins. According to the values of the parametersof the fit, it would appear that the distributionsare different, but within the errors they are simi-lar. What happens is that p(λ) is very sensitive to(σλ, λ0). In general, our results confirm the knownindependence of the spin parameter on mass (Lem-son & Kauffmann 1999) and epoch (e.g., Vitvitskaet al. 2002).
5. Discussion and conclusions
We find that the density profiles of relaxeddwarf halos can be well fitted by the NFW pro-file, which has an inner density slope α = −1.This result is in conflict with results of Ricotti(2002), who finds α ≈ −0.5 for dwarf halos in his1 h−1Mpc box simulation. In a attempt to find thecause of our discrepancy, we studied density pro-files at the same redshift as Ricotti did (z = 10.5)and reproduced Ricotti’s fitting procedure. Theconclusion is that even without any fits none ofthe profiles are close to the shallow profiles sug-gested by Ricotti. On the other hand, Navarro etal. (2003), in a recent study of mass profiles ofΛCDM halos at z = 0 that span five decades inhalo mass, show that inner density slopes of dwarfhalos are steeper than −1 all the way down to theresolution limit. From their Tables 2 and 3 wefind dwarf halo concentrations from cvir = 16.4for halo D1 to cvir = 22.0 for halo D4. These con-centrations are below to our extrapolated value ofthe median concentration we find for our dwarf ha-los, but once the mass dependence of the concen-tration is considered they turn out to be similar.Our results thus agree with the study of Navarroet al. on dwarf halos not only in the inner shapeof density profiles but also on concentrations.
It is impressive to see how well the model ofBullock et al. (2001a) reproduces over five or-ders of magnitude the measured concentration asa function of halo mass. At the same time, Bul-lock et al. overpredict the deviations from themean value. We compute the median and stan-dard deviation of the cvir distribution of our sam-ple of relaxed dwarf halos and find a spread whichdisagrees with that reported in Bullock et al. byabout a factor 1.6 in ∆ log cvir . It appears that theprinted version of Bullock et al. has a typo and the
actual value for the spread of concentration in Bul-lock et al. should have been ∆ log cvir = 0.14 (Bul-lock, private communication). This is still largerthan what we found: ∆ log cvir = 0.11. Our 1σscatter is close to ∆ log cvir = 0.10 measured byKlypin et al. (2003). We found that, except at thehigh-mass end, Eke’s et al. model lie below Bul-lock’s et al. For instance, at Mvir = 107h−1M⊙
Bullock’s et al. model predicts cvir = 8.8 as com-pared with 5.5 of Eke’s et al. model.
If we extrapolate the concentration of our dwarfhalos to the present using the 1+z growth law ofthe Bullock et al. model, the median would beabout 30. This is higher; for example, than thevalue c200 ∼ 14 (or cvir ∼ 18, no mass loss case)used by Hayashi et al. (2003). A shift up in c200
in Hayashi et al. fitting procedure would reducethe lower limit in vmax; that is, a lower vmax wouldbe required to match the observed stellar velocitydispersion of Carina and Draco. In any case, itis not clear to what extent Hayashi et al. resultscan be applied to the observed satellites when sub-structure is constrained to evolve in a static poten-tial. Stoehr et al. (2002), on the other hand, areable to explain the observed central velocity dis-persions of the dSph satellites of the Milky Wayfor the 20 most massive subhalos of a Milky Way-sized galaxy halo. Subhalos are resolved with hun-dreds or at most with a few thousands of particles.These still small numbers of particles are proba-bly not enough to draw yet firm conclusions. Inthe light of our results, it seems that subhalos re-solved with many more particles than subhalos inpresent-day cosmological simulations will be moreconcentrated. However, it is not clear how this ef-fect will affect the conclusion that observed dSphgalaxies inhabit the largest subhalos.
In our analysis of the structure of dwarf ha-los, we also compute the abundance of subhalos.We measure the amount of substructure in halosA1 (dwarf halo), B1 (Magellanic Cloud-sized halo)and C1 (group-size halo) through the normalizedsubhalo vmax function (vmax is measured in unitsof the virial velocity of the parent halo) and finda mass-scale independent result: the curves aresimilar and well approximated by the power-lawn(> V ) ∝ V −2.75 (Klypin et al. 1999b). Thisis in agreement with the paper by Moore et al.(2001) (see also De Lucia et al. (2003)).
We compute the dwarf halo mass function and
10
find an excellent agreement with the model ofSheth & Tormen (1999). The model has beentested at different redshifts, for a variety of cos-mologies, and for halo masses above ∼ 1010h−1M⊙
(Sheth & Tormen 1999; Jenkins et al. 2001;Reed et al. 2003). It provides an excellent matchto the data. In this paper, we tested it at muchlower masses, 105 − 108h−1M⊙, and found also anexcellent agreement with the data. It is pleasantto know that this approximation is able to matchdata for ten orders of magnitude in mass.
The spin parameter distribution p(λ) is mea-sured for our sample of dwarf halos (halos witha virial mass between 107 and 109 h−1M⊙). Itis well fitted by a lognormal distribution withλ0 = 0.042 and σλ = 0.63. These parametersroughly agree with those estimated by Vitvitskaet al. (2002). Our results corroborate the knownindependence of the spin parameter on mass (Lem-son & Kauffmann 1999) and epoch (e.g., Vitvitskaet al. 2002).
Acknowledgement: P.C. acknowledge supportby CONACyT grant 36584-E, S.G. and A.K. byNSF/DAAD, S.G. and P.C. by DFG/CONACyT.Computer simulations presented in this paperwere done at the Leibnizrechenzentrum (LRZ)in Munich and at the National Energy ResearchScientific Computing Center (NERSC). We thankJ. Bullock and V. Avila-Reese for helpful com-ments and discussions. We acknowledge theanonymous referee whose helpful comments andsuggestions improved some aspects of this paper.
REFERENCES
Benson, A.J., Frenk, C.S., Lacey, C.G., Baugh,C.M., & Cole, S. 2002, MNRAS, 333, 177
Bond, J.R., Cole, Efstathiou, G., & Kaiser, N.1991, apJ, 379, 440
Bullock, J.S., Kravtsov, A.V., & Weinberg, D.H.2000, ApJ, 539, 517
Bullock, J.S., Kolatt, T.S., Sigad, Y., Somerville,R.S., Kravtsov A.V., Klypin, A.A., Primack,J.R., & Dekel, A. 2001a, MNRAS, 321, 559
Bullock, J.S., Dekel, A., Kolatt, T.S., Kravtsov,A.V., Klypin, A.A., Porciani, C., & Primack,J.R. 2001, ApJ, 555, 240
Burkert, A. 1995, ApJ, 447, L25
Carignan, C., & Beauliu, S. 1989, ApJ, 347, 760
Carignan, C., & Freeman, K.C. 1988, ApJ, 332,L33
de Blok, W.J.G., Bosma, A., & McGaugh, S. 2003,MNRAS, 340, 657
Cen, R., Dong, F., Bode, P., & Ostriker, J.P. ApJsubmitted (astro-ph/0403352)
Colın, P., Klypin, A.A., Kravtsov, A.V., & A.M.Khokhlov. 1999, ApJ, 523, 32
De Lucia, G., Kauffmann, G., Springel, V.,& White, S.D.M. MNRAS submitted (astro-ph/0306205)
Davis, M., Efstathiou, G., Frenk, C.S., & White,S.D.M. 1985, ApJ, 292, 371
Dubinski, J., & Carlberg, R. 1991, ApJ, 378, 496
Eke, V.R., Cole, S., Frenk, C.S. 1996, MNRAS,282, 263
Eke, V.R., Navarro, J.F., & Steinmetz, M. 2001,ApJ, 554, 114
Flores, R.A., & Primack, J.R. 1994, ApJ, 427, L1
Gottlober, S., Lokas, E., Klypin, A.A., HoffmanY. 2003, MNRAS, in press
Governato, F., Babul, A., Quinn, T., Tozzi, P.,Baugh, C.M., Katz, N., & Lake, G. 1999, MN-RAS, 307, 949
Hayashi, E., Navarro, J.F., Taylor, J.E., Stadel,J., & Quinn, T. 2003, ApJ, 584, 541
Jenkins, A., Frenk, C.S., White, S.D.M., Col-berg, J.M., Cole, S., Evrard, A.E., Couchman,H.M.P., & Yoshida, N. 2001, MNRAS, 321, 372
Jing, Y.P. 2000, ApJ, 535, 30
Klypin, A.A., Holtzman, J., 1997,http://xxx.lanl.gov/pdf/astro-ph/9712217
Klypin, A.A., Gottlober, S., Kravtsov, A.V., &Khokhlov, A.M 1999, ApJ, 516, 530
Klypin, A.A., Kravtsov, A.V., Valenzuela, O., &Prada, F. 1999, ApJ, 522, 82
Klypin, A.A., Kravtsov, A.V., Bullock, J.S., &Primack, J.R. 2001, ApJ, 554, 903
11
Klypin, A.A., Maccio, A.V., Mainini, R., &Bonometto, S.A. 2003, ApJ submitted (astro-ph/0303304)
Kravtsov, A.V., Klypin, A.A., & Khokhlov, A.M.,1997, ApJS, 111, 73
Lemson, G., & Kauffmann, G. 1999, MNRAS, 302,111
Lokas, E.L. 2002, MNRAS, 333, 697
Mateo, M. 1998, ARA&A, 36, 435
Moore, B. 1994, Nature, 370, 629
Moore, B., Quinn, T., Governato, F., Stadel, J.,& Lake, G. 1999a, MNRAS, 310, 1147
Moore, B., Ghigna, S., Governato, F., Lake, G.,Quinn, T., Stadel, J., Tozzi, P. 1999b, ApJ,524, 19
Moore, B., Calcaneo-Roldan, C., Stadel, J.,Quinn, T., Lake, G., Ghigna, S., & Governato,F. 2001, PhRvD, 64, 063508
Navarro, J.F., Frenk, C.S., & White, S.D.M. 1995,MNRAS, 275, 720
Navarro, J.F., Frenk, C.S., & White, S.D.M. 1996,ApJ, 462, 563
Navarro, J.F., Frenk, C.S., & White, S.D.M. 1997,ApJ, 490, 493
Navarro, J.F., Hayashi, E., Power, C., Jenkins,A.R., Frenk, C.S., White, S.D.M., Springel, V.,Stadel, J., & Quinn, T.R. 2003, MNRAS sub-mitted (astro-ph/0311231)
Ricotti, M. 2003, MNRAS, 344, 1237
Peebles, P.J.E. 1980, The Large Scale Structureof the Universe (Princeton: Princeton Univ.Press)
Reed, D., Gardner, J., Quinn, T., Stadel, J.,Fardal, M., Lake, G., & Governato, F. 2003,MNRAS submitted (astro-ph/0301270)
Rhee,G., Klypin, A., & Valenzuela, O. 2003, inpreparation
Sheth, R., & Tormen, G. 1999, MNRAS, 308, 119
Somerville, R. 2002, ApJ, 572, L23
Stoehr, F., White, S.D.M., Tormen, G., &Springel, V. 2002, MNRAS, 335, L84
Swaters, R.A., Madore, B.F., van den Bosch, F.C.,& Balcells, M. 2003, ApJ, 583, 732
Tasitsiomi, A., Kravtsov, A.V., Gottlober, S.,& Klypin, A.A. 2003, ApJ submitted (astro-ph/0311062)
van den Bosch, F. C. 2002, MNRAS, 331, 98
Vitvitska, M., Klypin, A.A., Kravtsov, A.V.,Wechsler, R.H., Primack, J.R., & J.S. Bullock.2002, ApJ, 581, 799
Weldrake, D.T.F., de Blok, W.J.G., & Walter, F.2003, MNRAS, 340, 12
This 2-column preprint was prepared with the AAS LATEXmacros v5.2.
12


