Embed Size (px)
Citation preview
OGDEN CITY
ANALYSIS of
IMPEDIMENTS to
FAIR HOUSING
CHOICE
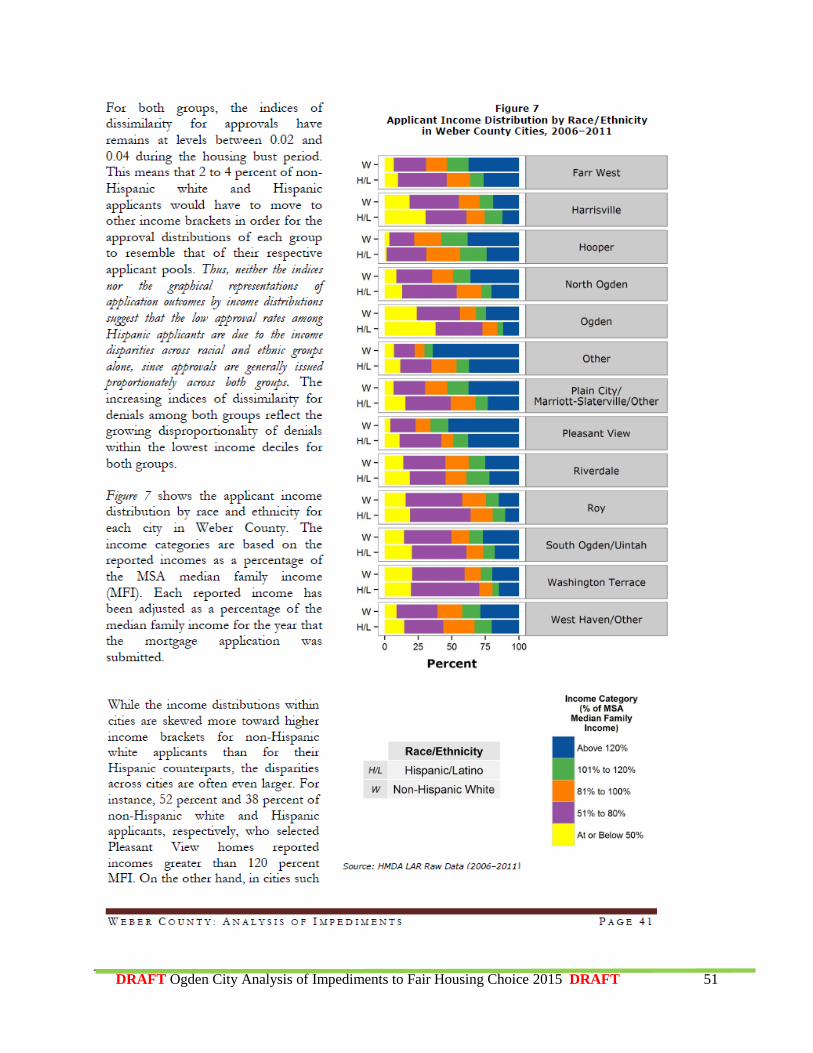
MARCH 2015
PREPARED BY OGDEN CITY COMMUNITY AND ECONOMIC DEVELOPMENT DEPARTMENT
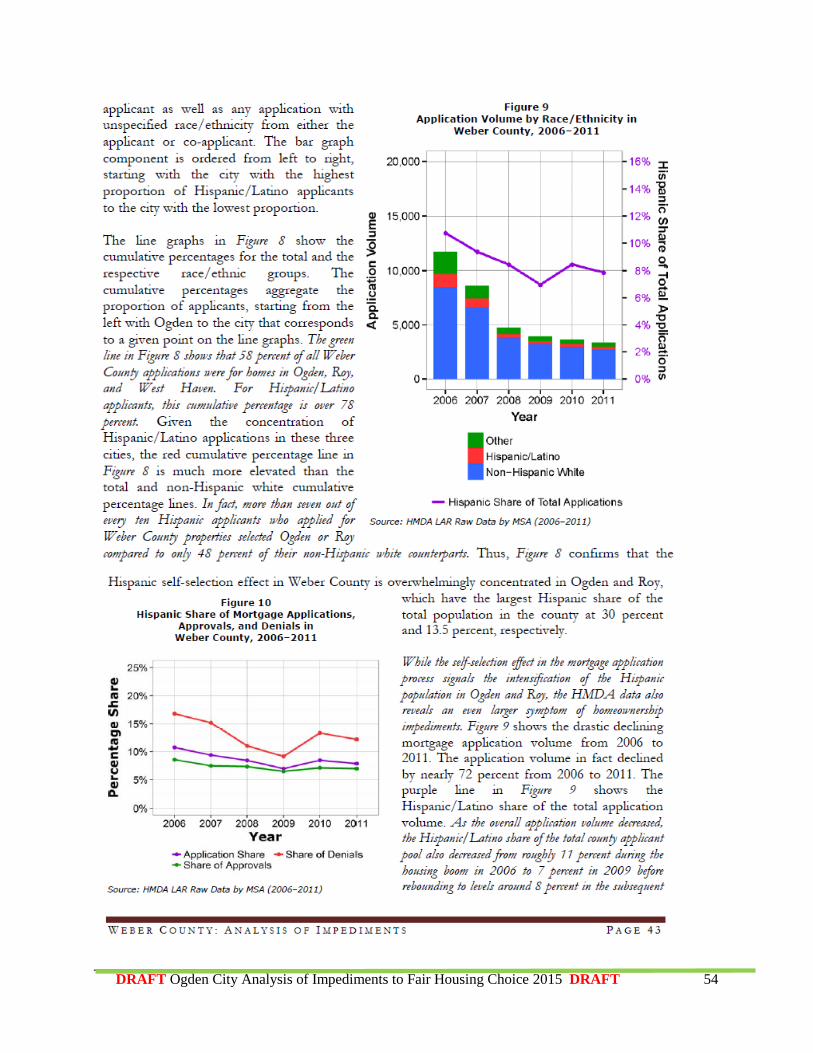
Data, research and analysis by University of Utah’s Bureau of Economic and Business Research, David
Eccles School of Business, James Wood, John Downen, DJ Benway and Darius Li (BEBR) and Lotus
Community Development Institute and James Wood.
DRAFT

DRAFT Ogden City Analysis of Impediments to Fair Housing Choice 2015 DRAFT 2
DRAFT Ogden City Analysis of Impediments to Fair Housing Choice 2015 DRAFT 3
TABLE OF CONTENTS
Introduction
Analysis of Impediments Process .......................................................................................................4
Impediments to Fair Housing...............................................................................................................4
Protected Classes..................................................................................................................................5
I. Demographic Trends and Characteristics
Minority Population.............................................................................................................................5
Other demographics.............................................................................................................................6
Racially Concentrated Areas of Poverty (RCAP) ..............................................................................7
Renters in RCAPs................................................................................................................................8
II. Employment Trends and Characteristics .......................................................................................8
III. Housing Market Characteristics, Trends and Affordability
Homeownership.................................................................................................................................10
Housing Affordability........................................................................................................................11
Rental Housing...................................................................................................................................13
Rental Assisted Housing....................................................................................................................13
IV. Housing Needs Summary
Surplus of Affordable Rental Housing...............................................................................................14
Aging Housing Stock.........................................................................................................................15
Affordable Housing Needs of the Protected Classess…………........................................................15
Supportive Housing for the Disabled.................................................................................................16
V. Policies and Practices
Public Policies, Zoning and Land Use…….......................................................................................16
Nimbyism, Zoning and Land Prices...................................................................................................16
Transit Oriented Developments (TODs)............................................................................................17
Utah State Legislature HB295............................................................................................................17
Language Assistance Plan (LAP) and Fair Housing Infrastructure……...........................................18
VI. Legal Status / Fair Housing Complaints
Utah Anti-Discrimination and Labor Division (UALD)…................................................................18
Disability Law Center........................................................................................................................19
Reasonable Accomodations...............................................................................................................19
VII. Private Policies and Practices: Lending.........................................................................................19
VIII. Impediments to Fair Housing Choice and Action Items..............................................................22
IX. Signature for the City of Ogden…..................................................................................................25
X. General Data, Tables, Maps and Figures…..................................................................................26
DRAFT Ogden City Analysis of Impediments to Fair Housing Choice 2015 DRAFT 4
Introduction
An Analysis of Impediments to Fair Housing Choice (AI) is a comprehensive review of municipal housing,
economic, and transportation conditions, as well as public and private sector policies in order to ensure that
housing choices and opportunities for all persons in a community are available. Under the HOME and
Community Development Block Grant (CDBG) statutes, the AI is a document required by HUD as part of
the Five Year Consolidated Plan 2016-2020 (ConPlan). The city must certify to HUD that an AI was
conducted and fair housing action steps are being implemented. Goals and objectives are designed to
identify and mitigate obstacles to fair housing choice. Many of these are also included in the five year
ConPlan.
Since the last Analysis of Impediments to Fair Housing Choice was completed in 2010, Ogden City has
actively worked to meet the objectives outlined in the Action Plan and to find ways to mitigate or remove
barriers to fair housing. Ogden City has worked with the Utah Fair Housing Forum, Ogden Housing
Authority and the Disability Law Center to develop a cooperative approach to develop fair housing choices
through the region.
AI Process Developed to accompany the City of Ogden’s ConPlan 2016-2020, this AI has been completed to meet
requirements of the Housing and Community Development Act and HUD regulations governing the
preparation of the ConPlan. To assist in the development of Ogden’s AI, University of Utah’s Bureau of
Economic and Business Research David Eccles School of Business, James Wood, John Downen, DJ
Benway and Darius Li (BEBR) were contracted to prepare a Regional Analysis of Impediments to Fair
Housing Choice for Weber County – referred to as “Regional AI”, dated May 2014. The Regional AI
provides the framework for Ogden’s Analysis of Impediments to Fair Housing Choice 2015. In addition to
the Regional AI, the City utilized the Weber County Housing Assessment & Plan 2012-2014 (Weber
County Housing Plan) which provided supportive data, tables, maps, research and analysis to determining
housing needs in Ogden.
The Regional AI and Weber County Housing Plan process included: 1) gathering essential economic and
housing data, employing mapping and analysis tools; 2) soliciting and ensuring meaningful community
input from key stakeholders; 3) creating and prioritizing inter-jurisdictional objectives, goals and outcomes
with planning professionals upon which a collective vision for regional growth could be shaped and adopted
by the public, while supporting individual cities in maintaining their unique identities; 4) seeking out
community-based organizational partners, and financial resources critical to its eventual implementation;
and finally 5) outlining a structure to assist in carrying the process forward.
Impediments to fair housing choice are:
Any actions, omissions, or decisions taken because of one’s membership in a protected class
which restrict housing choices or the availability of housing choices; and
Any actions, omissions, or decisions which have the effect of restricting housing choices or the
availability of housing choices on the basis of one’s membership in a protected class.
This report considers impediments to fair housing choice experienced by both the federal protected
classes.
Protected Classes
The federally protected classes are:
Disability
DRAFT Ogden City Analysis of Impediments to Fair Housing Choice 2015 DRAFT 5
Familial status
National origin
Race
Color
Religion
Sex
I. Demographic Trends and Characteristics
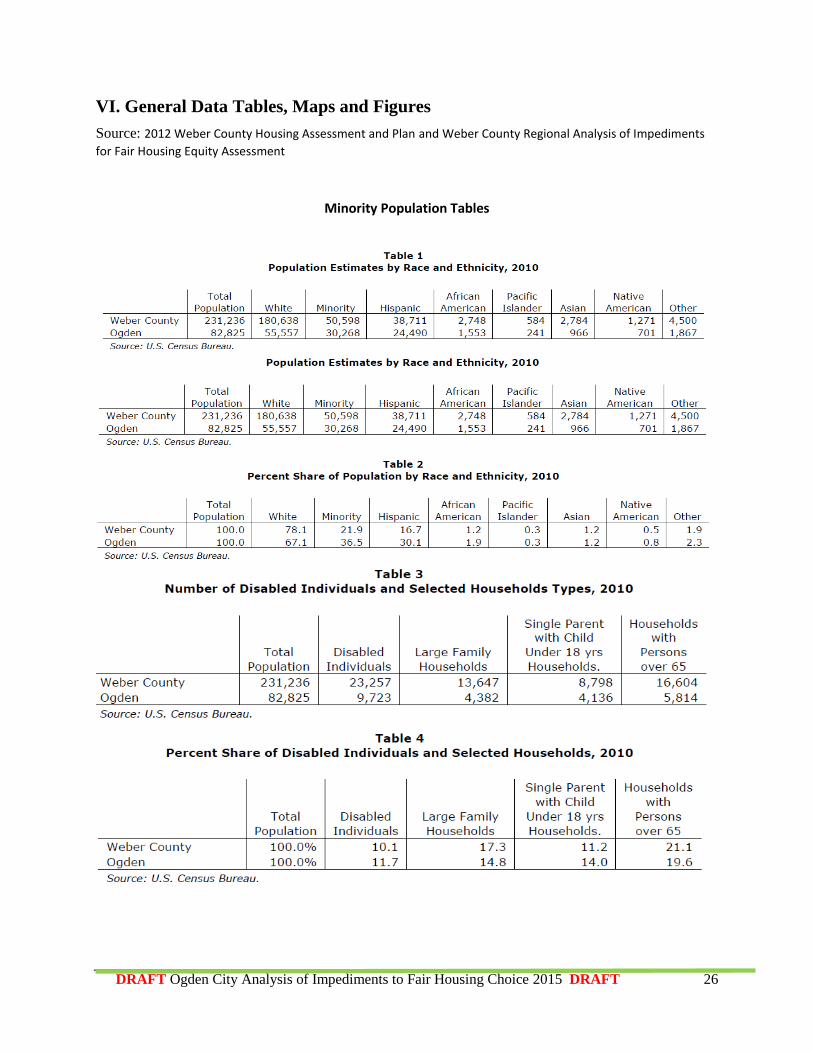
Ogden’s population shows a modest increase over the past ten years. In 2010 the population of the city was
estimated at 82,825 by the U.S. Census Bureau, an increase of 7.3 percent since 2000 Table 1. Over the
past twenty years the population of Ogden City increased by 22 percent, driven by higher rates of population
increase in the 1990s. Ogden is the largest city in Weber County and accounts for about 36 percent of the
population of the county. The population growth of Ogden is lower than the 17.7 percent growth rate for
the county. Ogden is a mature, older city with little opportunity for new large scale residential development
on sizeable parcels of undeveloped land.
Minority Population
The minority population of Ogden has increased at a much faster pace than the overall population. In 2000
the minority population in the city totaled 16,395 individuals. By 2010 the number of minority individuals
in the city had increased by 84.6 percent to 30,268. In 2010 one in three individuals in Ogden City is a
minority up from one in five in 2000. The city has by far the largest concentration of minority individuals
of any study city. 36.5% of Ogden’s Population is a minority, compared to 21.9% in Weber County and
19.6% in Utah.
The AI has a broader analytical scope that encompasses issues associated the protected classes covered by
the Fair Housing Act. Discrimination is most likely to occur against protected classes with the largest
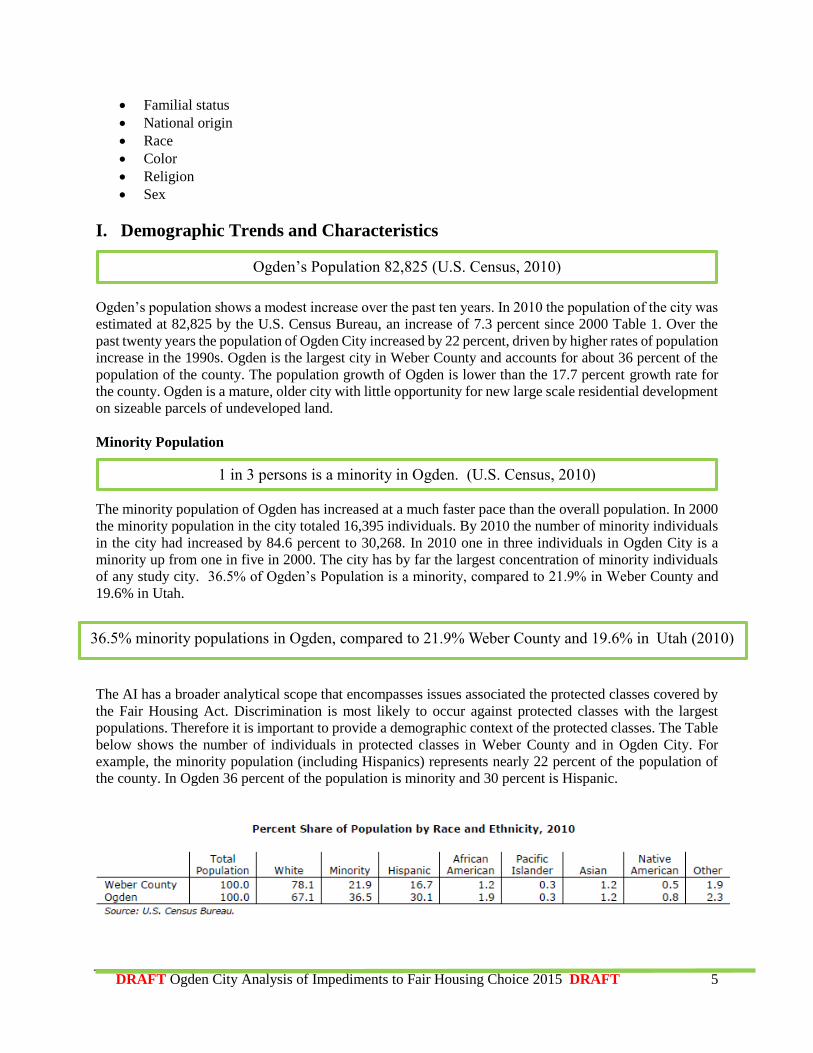
populations. Therefore it is important to provide a demographic context of the protected classes. The Table
below shows the number of individuals in protected classes in Weber County and in Ogden City. For
example, the minority population (including Hispanics) represents nearly 22 percent of the population of
the county. In Ogden 36 percent of the population is minority and 30 percent is Hispanic.
36.5% minority populations in Ogden, compared to 21.9% Weber County and 19.6% in Utah (2010)
Ogden’s Population 82,825 (U.S. Census, 2010)
1 in 3 persons is a minority in Ogden. (U.S. Census, 2010)
DRAFT Ogden City Analysis of Impediments to Fair Housing Choice 2015 DRAFT 6
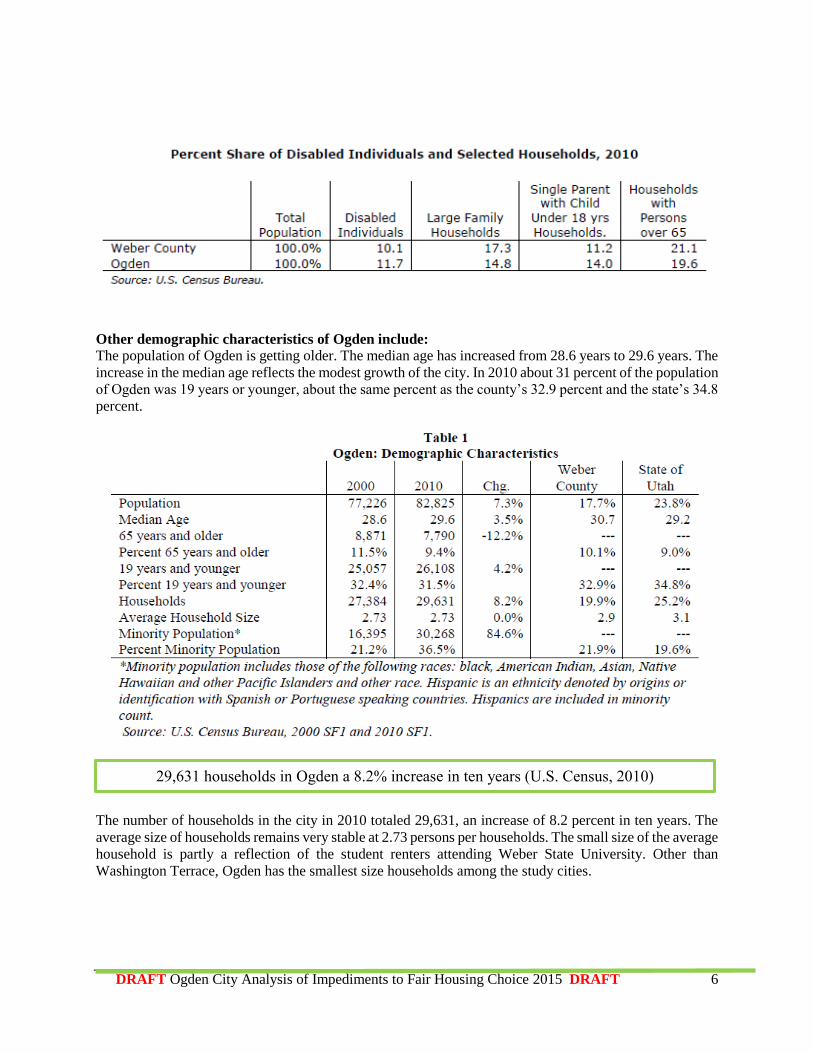
Other demographic characteristics of Ogden include:
The population of Ogden is getting older. The median age has increased from 28.6 years to 29.6 years. The
increase in the median age reflects the modest growth of the city. In 2010 about 31 percent of the population
of Ogden was 19 years or younger, about the same percent as the county’s 32.9 percent and the state’s 34.8
percent.
The number of households in the city in 2010 totaled 29,631, an increase of 8.2 percent in ten years. The
average size of households remains very stable at 2.73 persons per households. The small size of the average
household is partly a reflection of the student renters attending Weber State University. Other than
Washington Terrace, Ogden has the smallest size households among the study cities.
29,631 households in Ogden a 8.2% increase in ten years (U.S. Census, 2010)
DRAFT Ogden City Analysis of Impediments to Fair Housing Choice 2015 DRAFT 7
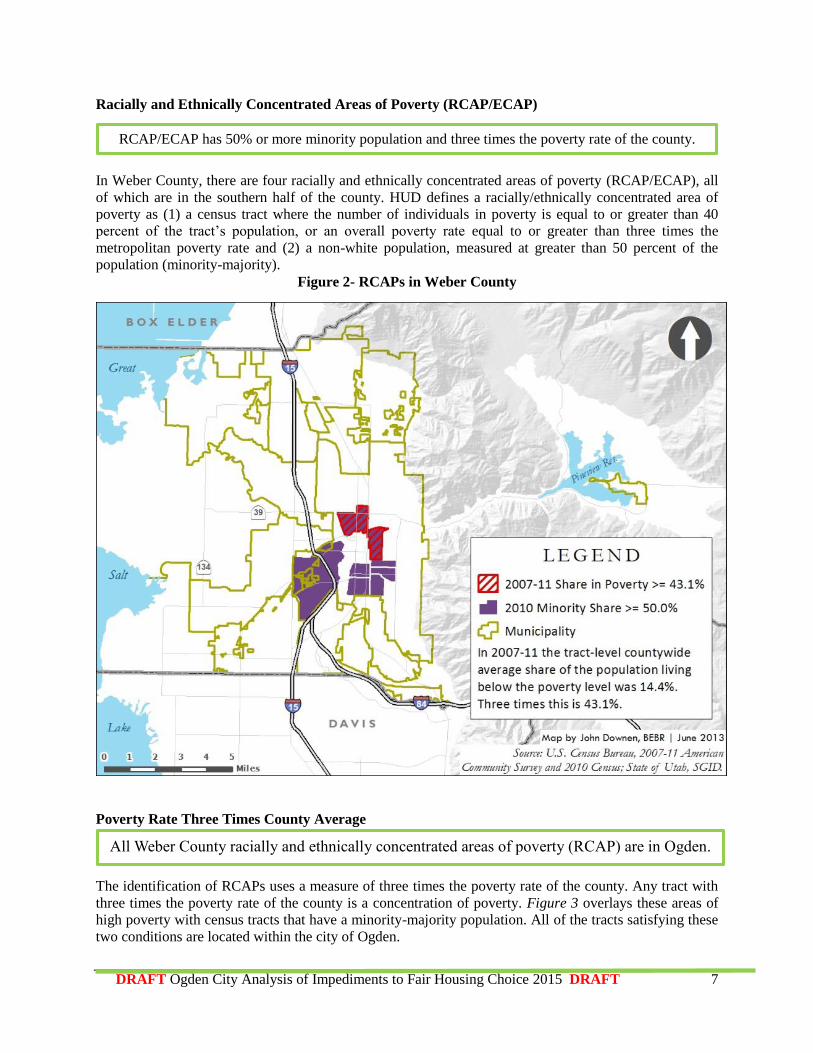
Racially and Ethnically Concentrated Areas of Poverty (RCAP/ECAP)
.
In Weber County, there are four racially and ethnically concentrated areas of poverty (RCAP/ECAP), all
of which are in the southern half of the county. HUD defines a racially/ethnically concentrated area of
poverty as (1) a census tract where the number of individuals in poverty is equal to or greater than 40
percent of the tract’s population, or an overall poverty rate equal to or greater than three times the
metropolitan poverty rate and (2) a non-white population, measured at greater than 50 percent of the
population (minority-majority).
Figure 2- RCAPs in Weber County
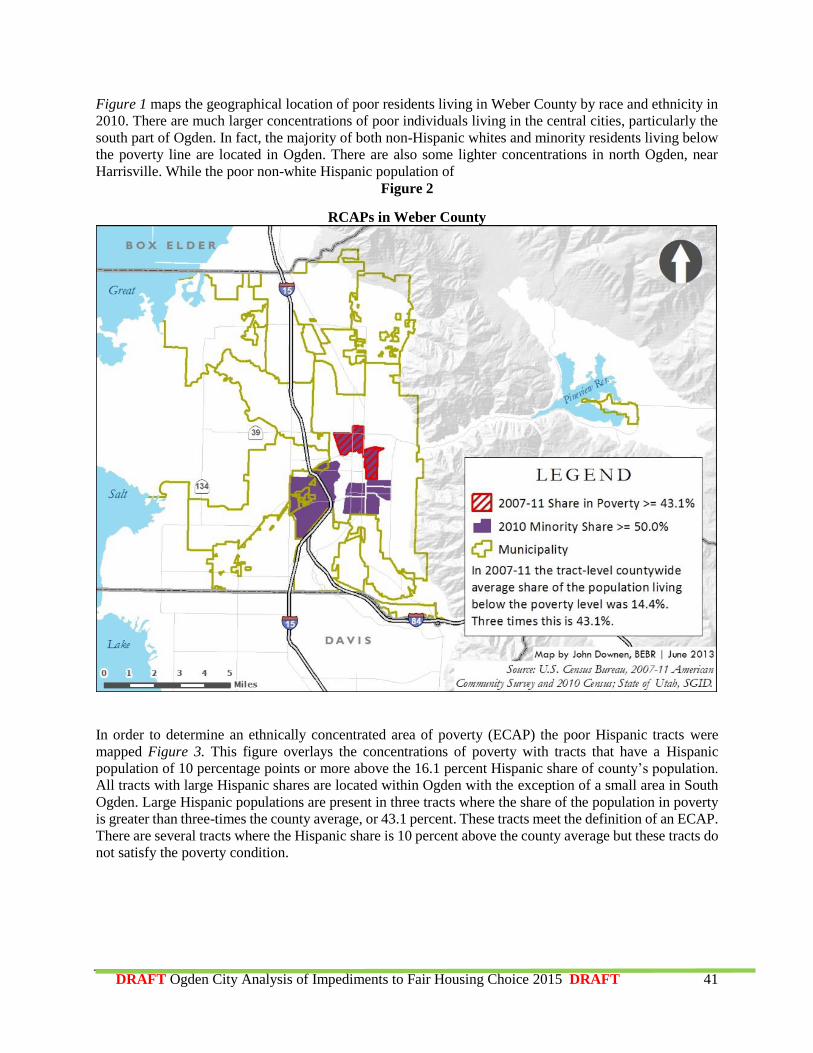
Poverty Rate Three Times County Average
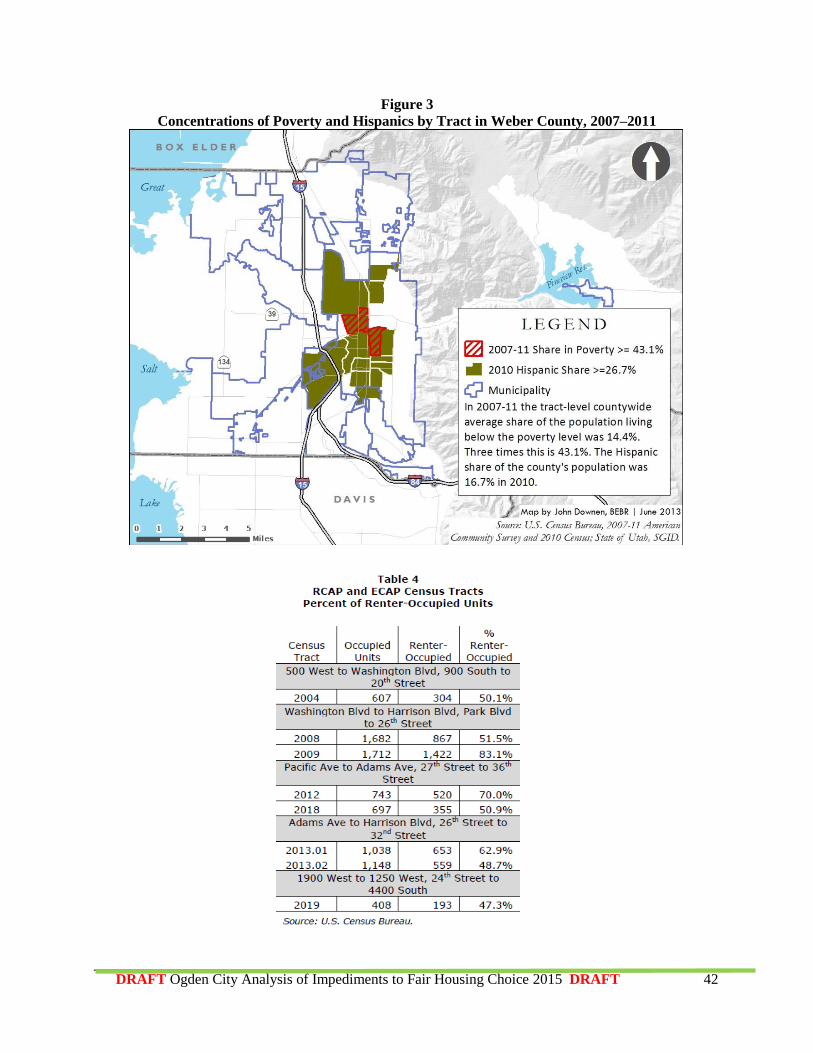
The identification of RCAPs uses a measure of three times the poverty rate of the county. Any tract with
three times the poverty rate of the county is a concentration of poverty. Figure 3 overlays these areas of
high poverty with census tracts that have a minority-majority population. All of the tracts satisfying these
two conditions are located within the city of Ogden.
All Weber County racially and ethnically concentrated areas of poverty (RCAP) are in Ogden.
RCAP/ECAP has 50% or more minority population and three times the poverty rate of the county.
DRAFT Ogden City Analysis of Impediments to Fair Housing Choice 2015 DRAFT 8
The countywide poverty rate is 14.4 percent, so an area is considered highly concentrated when it has 43.1
percent or more of the population living in poverty. In, all cases, the RCAP and ECAP tracts are
communities of low-valued homes and with a high proportion of minority renters and homeowners. These
areas of high concentrations of minority residents also tend to be in areas of only low- to mid-level access
to opportunity. With more affordable housing options in the county, these concentrations of poverty and
minority residents would be less severe and more evenly distributed in Weber County.
Renters in RCAP and ECAP Census Tracts
Weber County’s RCAPs and ECAPs are characterized by high rates of renter-occupied housing. Renter-
occupied housing has a much higher likelihood of concentrations of low-income, minority renters. The
dominance of rental housing in some of the census tracts is striking. For instance in census tract 2009 there
were 1,712 occupied housing units and over 83 percent were renter-occupied units (Table 4, Page 41).
Furthermore, in RCAP and ECAP census tracts, the rate at which occupied housing units are rented and
not-owned never falls below 47.3 percent.
II. Employment Trends and Characteristics
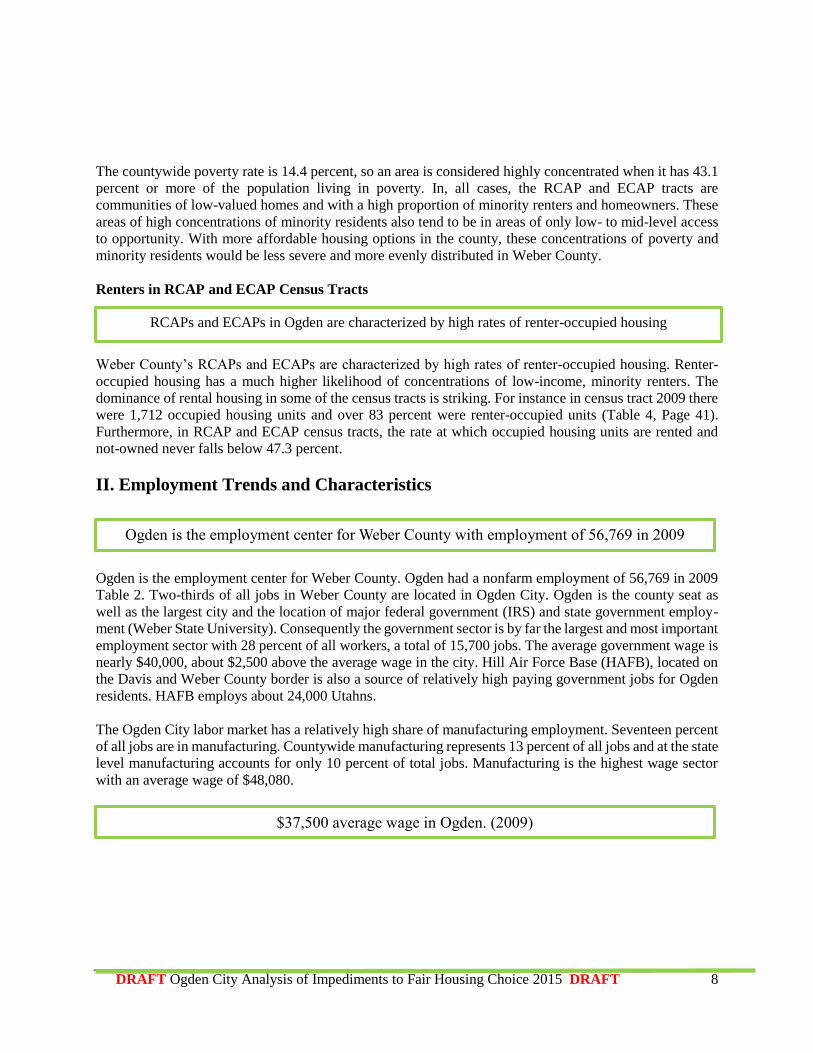
Ogden is the employment center for Weber County. Ogden had a nonfarm employment of 56,769 in 2009
Table 2. Two-thirds of all jobs in Weber County are located in Ogden City. Ogden is the county seat as
well as the largest city and the location of major federal government (IRS) and state government employ-
ment (Weber State University). Consequently the government sector is by far the largest and most important
employment sector with 28 percent of all workers, a total of 15,700 jobs. The average government wage is
nearly $40,000, about $2,500 above the average wage in the city. Hill Air Force Base (HAFB), located on
the Davis and Weber County border is also a source of relatively high paying government jobs for Ogden
residents. HAFB employs about 24,000 Utahns.
The Ogden City labor market has a relatively high share of manufacturing employment. Seventeen percent
of all jobs are in manufacturing. Countywide manufacturing represents 13 percent of all jobs and at the state
level manufacturing accounts for only 10 percent of total jobs. Manufacturing is the highest wage sector
with an average wage of $48,080.
RCAPs and ECAPs in Ogden are characterized by high rates of renter-occupied housing
Ogden is the employment center for Weber County with employment of 56,769 in 2009
$37,500 average wage in Ogden. (2009)
DRAFT Ogden City Analysis of Impediments to Fair Housing Choice 2015 DRAFT 9
The third ranking sector is trade, transportation and utilities. Well over 80 percent of the jobs in this sector
are in retail trade. Retail trade employs about 6,500 workers in Ogden City. Health care ranks fourth in
share of employment in Ogden City. IHC’s Mckay Dee Hospital is the largest health care employer.
III. Housing Market Characteristics, Trends and Affordability
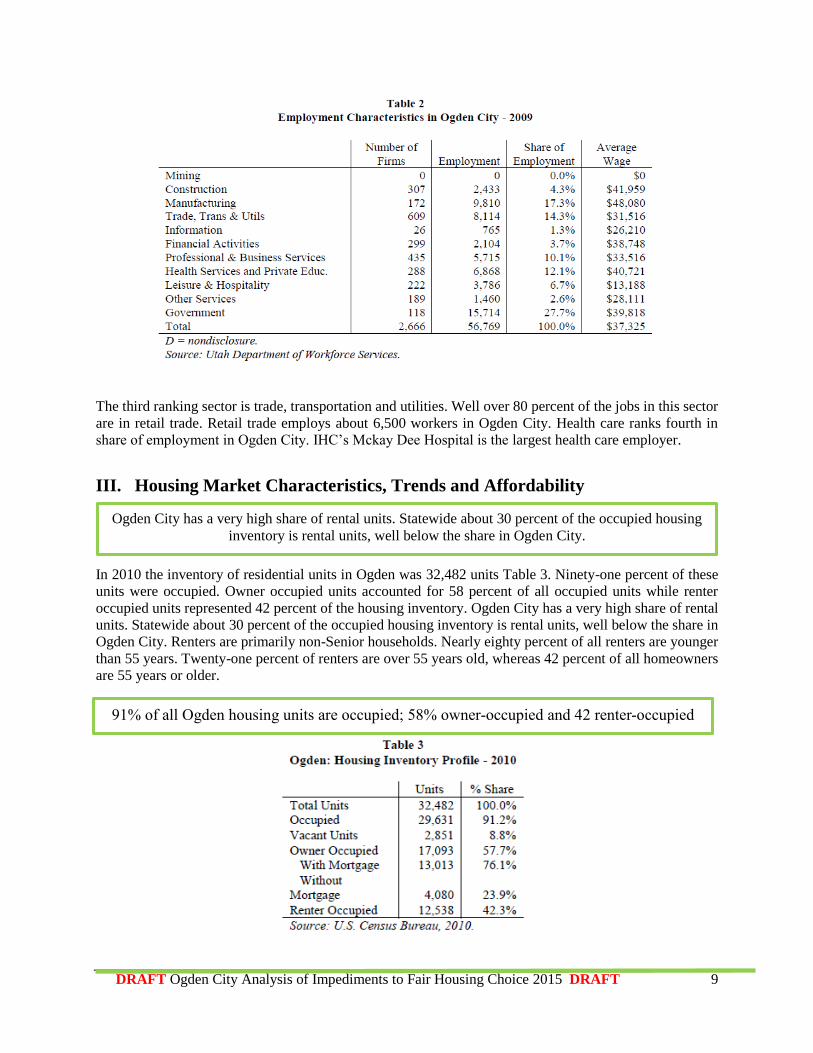
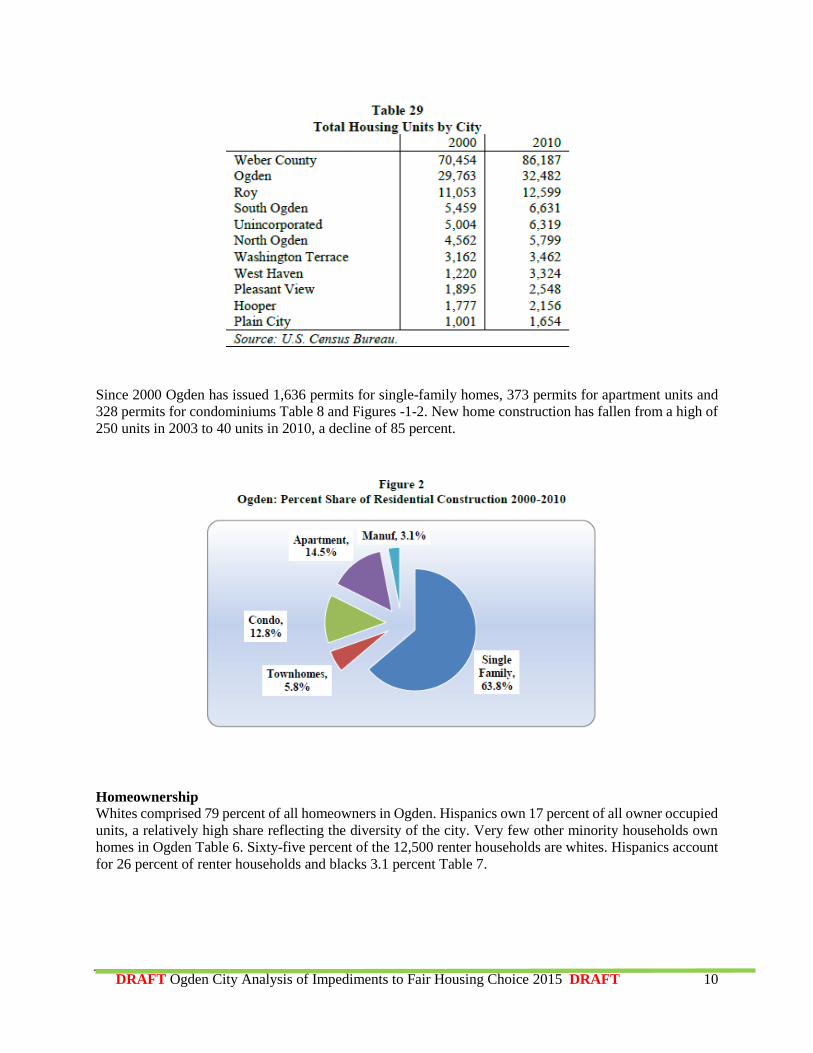
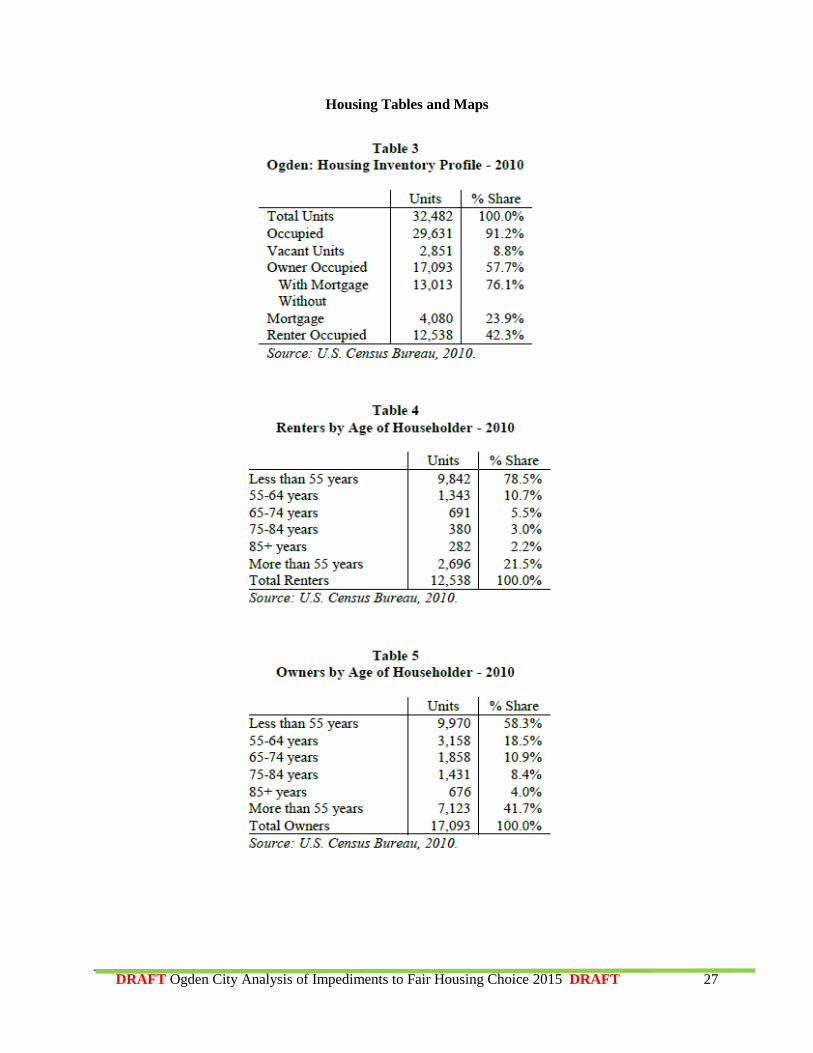
In 2010 the inventory of residential units in Ogden was 32,482 units Table 3. Ninety-one percent of these
units were occupied. Owner occupied units accounted for 58 percent of all occupied units while renter
occupied units represented 42 percent of the housing inventory. Ogden City has a very high share of rental
units. Statewide about 30 percent of the occupied housing inventory is rental units, well below the share in
Ogden City. Renters are primarily non-Senior households. Nearly eighty percent of all renters are younger
than 55 years. Twenty-one percent of renters are over 55 years old, whereas 42 percent of all homeowners
are 55 years or older.
91% of all Ogden housing units are occupied; 58% owner-occupied and 42 renter-occupied
Ogden City has a very high share of rental units. Statewide about 30 percent of the occupied housing
inventory is rental units, well below the share in Ogden City.
DRAFT Ogden City Analysis of Impediments to Fair Housing Choice 2015 DRAFT 10
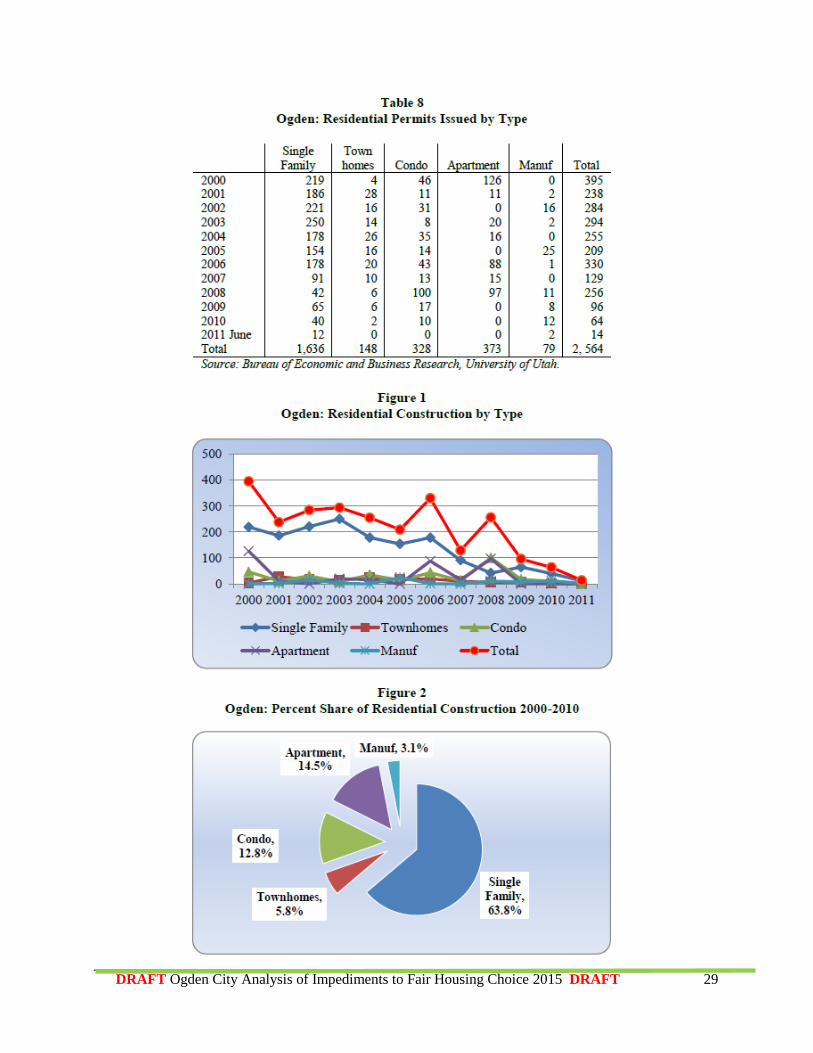
Since 2000 Ogden has issued 1,636 permits for single-family homes, 373 permits for apartment units and
328 permits for condominiums Table 8 and Figures -1-2. New home construction has fallen from a high of
250 units in 2003 to 40 units in 2010, a decline of 85 percent.
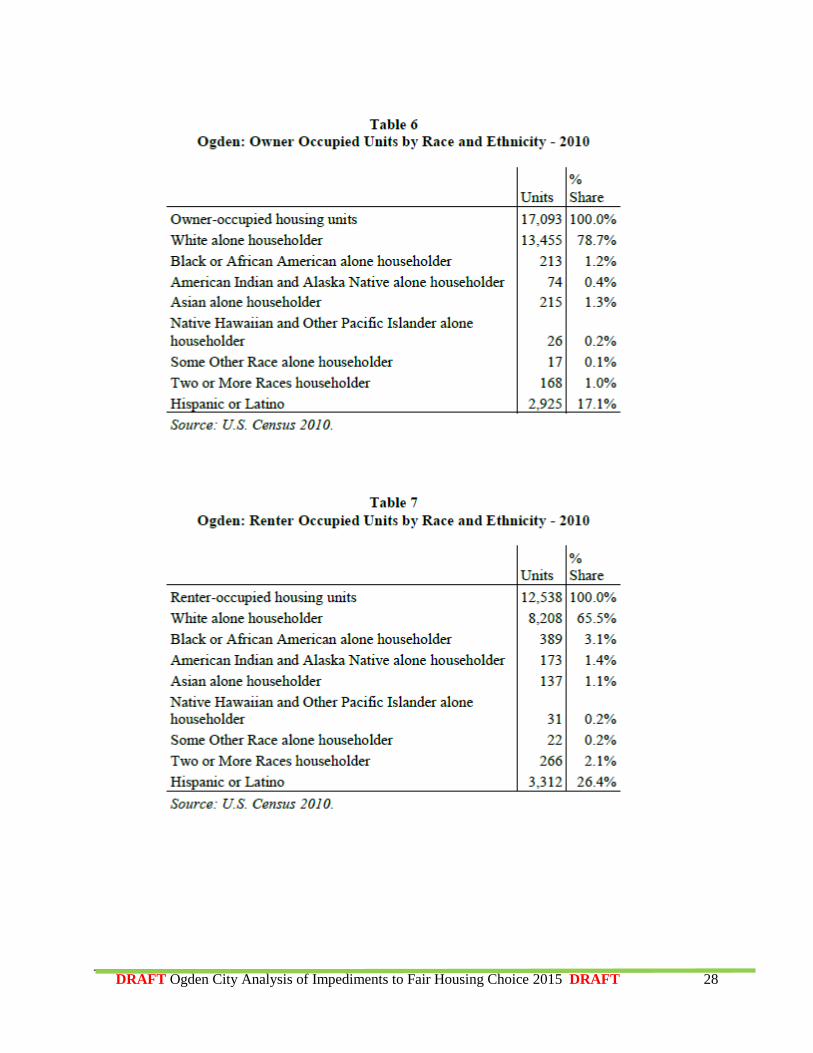
Homeownership
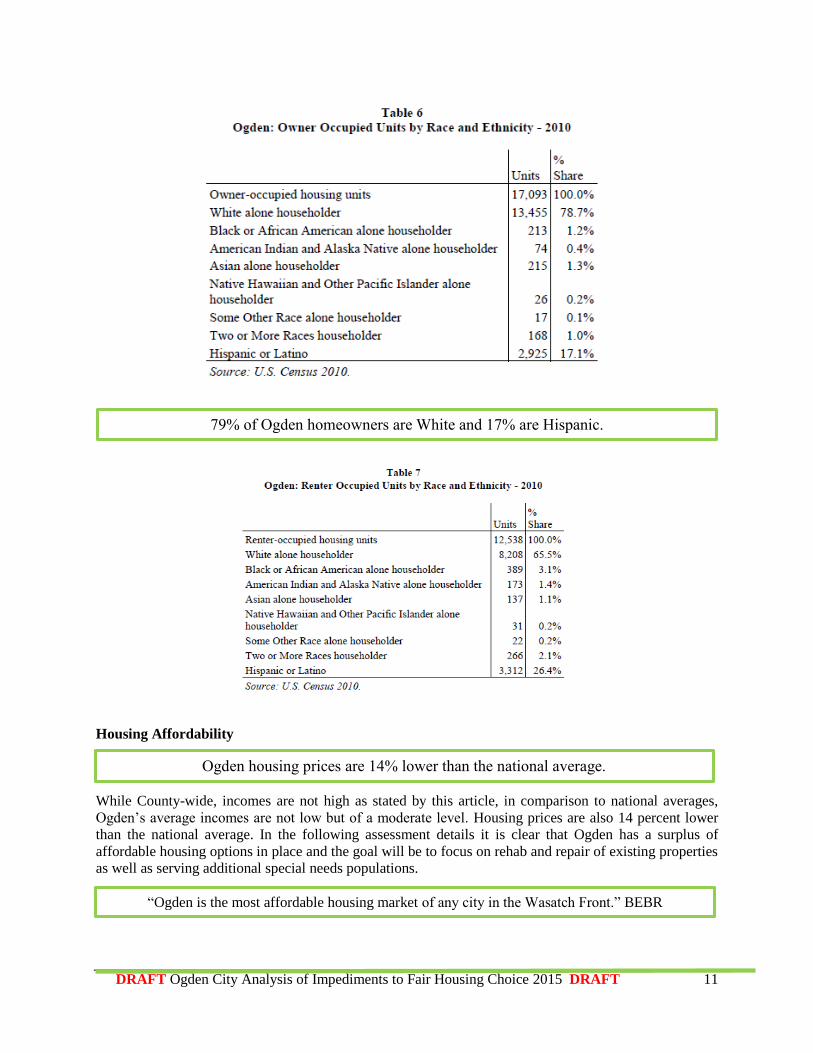
Whites comprised 79 percent of all homeowners in Ogden. Hispanics own 17 percent of all owner occupied
units, a relatively high share reflecting the diversity of the city. Very few other minority households own
homes in Ogden Table 6. Sixty-five percent of the 12,500 renter households are whites. Hispanics account
for 26 percent of renter households and blacks 3.1 percent Table 7.
DRAFT Ogden City Analysis of Impediments to Fair Housing Choice 2015 DRAFT 11
Housing Affordability
While County-wide, incomes are not high as stated by this article, in comparison to national averages,
Ogden’s average incomes are not low but of a moderate level. Housing prices are also 14 percent lower
than the national average. In the following assessment details it is clear that Ogden has a surplus of
affordable housing options in place and the goal will be to focus on rehab and repair of existing properties
as well as serving additional special needs populations.
79% of Ogden homeowners are White and 17% are Hispanic.
“Ogden is the most affordable housing market of any city in the Wasatch Front.” BEBR
Ogden housing prices are 14% lower than the national average.
DRAFT Ogden City Analysis of Impediments to Fair Housing Choice 2015 DRAFT 12
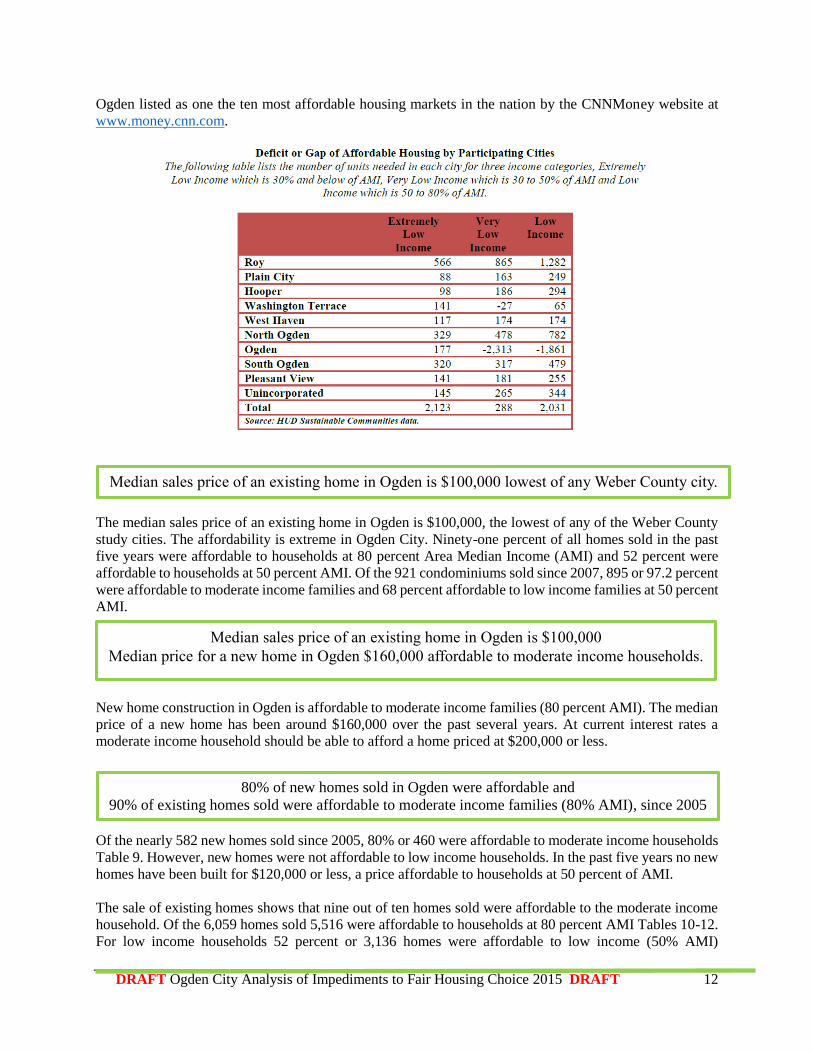
Ogden listed as one the ten most affordable housing markets in the nation by the CNNMoney website at
www.money.cnn.com.
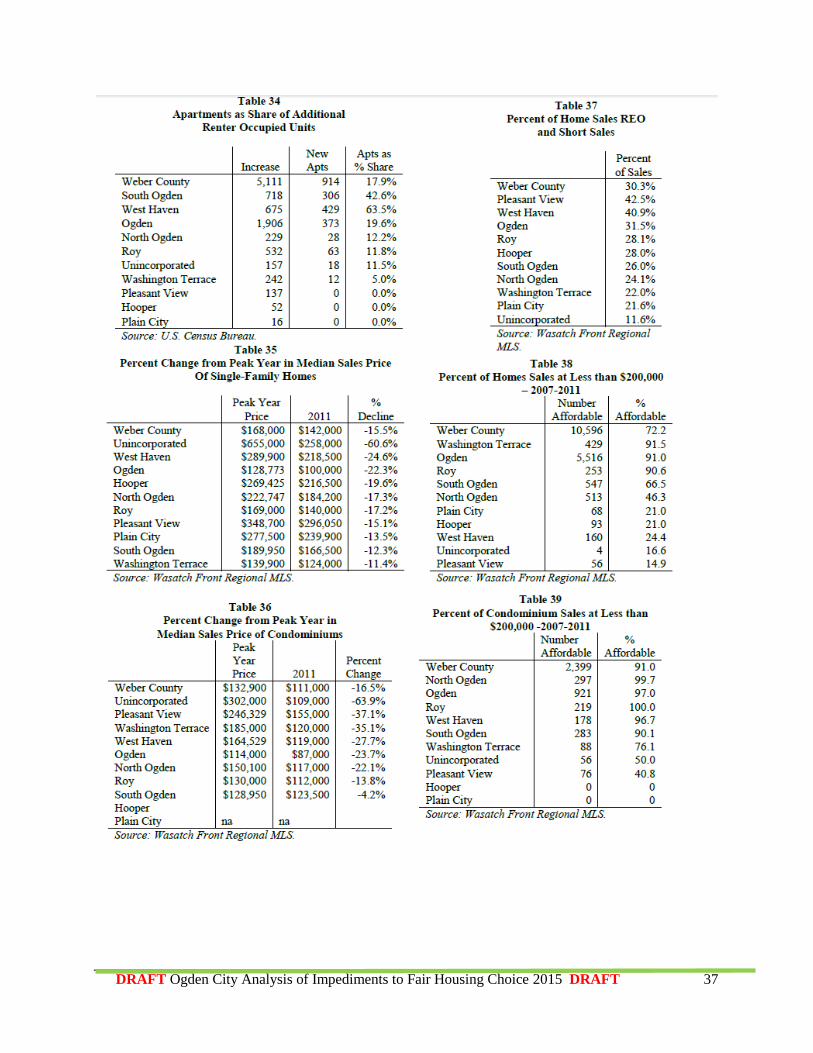
The median sales price of an existing home in Ogden is $100,000, the lowest of any of the Weber County
study cities. The affordability is extreme in Ogden City. Ninety-one percent of all homes sold in the past
five years were affordable to households at 80 percent Area Median Income (AMI) and 52 percent were
affordable to households at 50 percent AMI. Of the 921 condominiums sold since 2007, 895 or 97.2 percent
were affordable to moderate income families and 68 percent affordable to low income families at 50 percent
AMI.
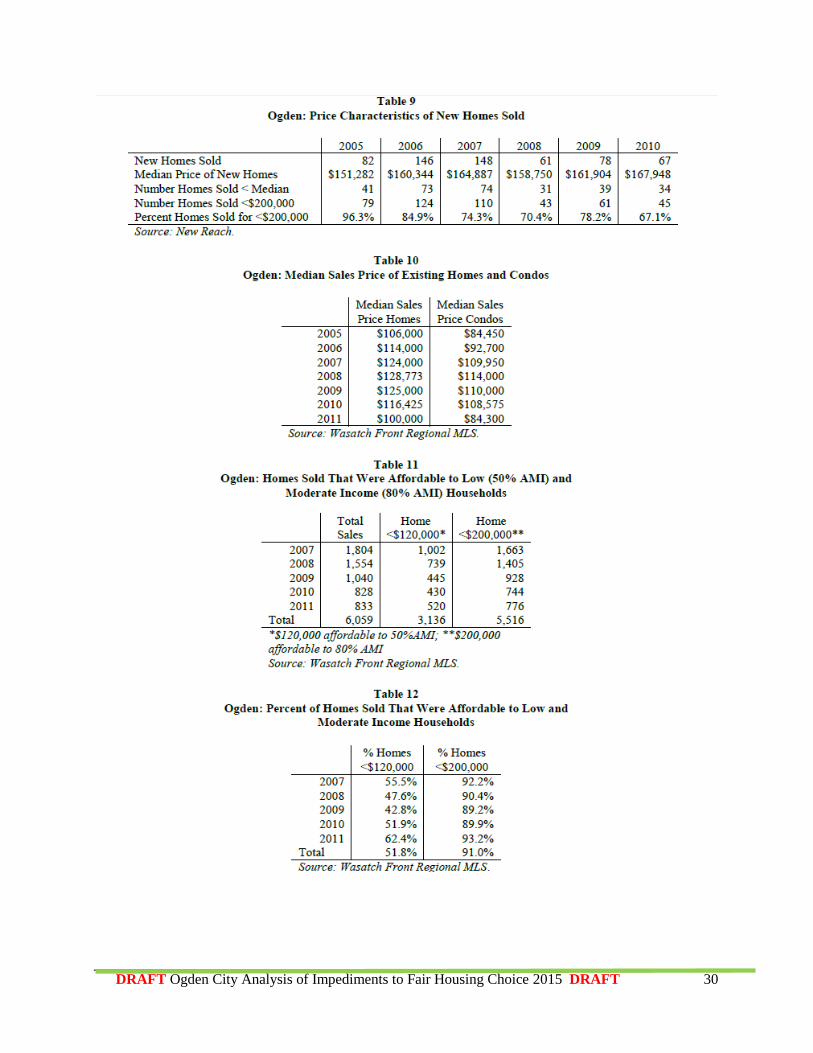
New home construction in Ogden is affordable to moderate income families (80 percent AMI). The median
price of a new home has been around $160,000 over the past several years. At current interest rates a
moderate income household should be able to afford a home priced at $200,000 or less.
Of the nearly 582 new homes sold since 2005, 80% or 460 were affordable to moderate income households
Table 9. However, new homes were not affordable to low income households. In the past five years no new
homes have been built for $120,000 or less, a price affordable to households at 50 percent of AMI.
The sale of existing homes shows that nine out of ten homes sold were affordable to the moderate income
household. Of the 6,059 homes sold 5,516 were affordable to households at 80 percent AMI Tables 10-12.
For low income households 52 percent or 3,136 homes were affordable to low income (50% AMI)
80% of new homes sold in Ogden were affordable and
90% of existing homes sold were affordable to moderate income families (80% AMI), since 2005
Median sales price of an existing home in Ogden is $100,000
Median price for a new home in Ogden $160,000 affordable to moderate income households.
Median sales price of an existing home in Ogden is $100,000 lowest of any Weber County city.
DRAFT Ogden City Analysis of Impediments to Fair Housing Choice 2015 DRAFT 13
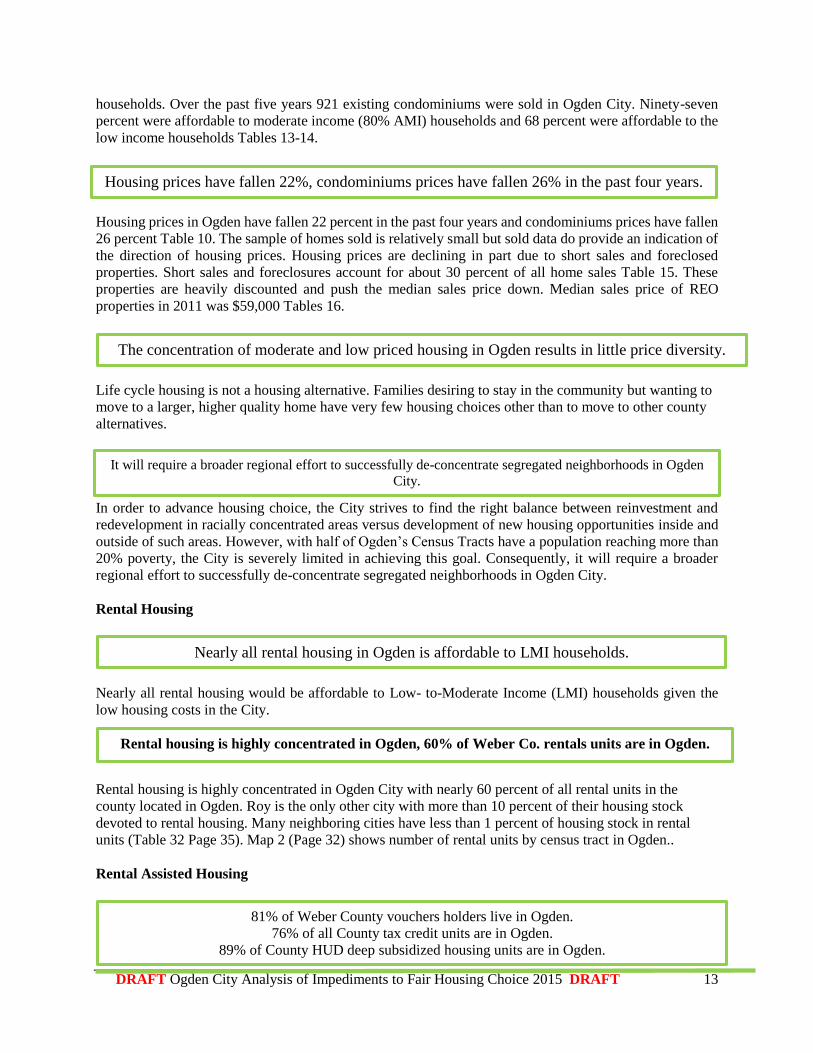
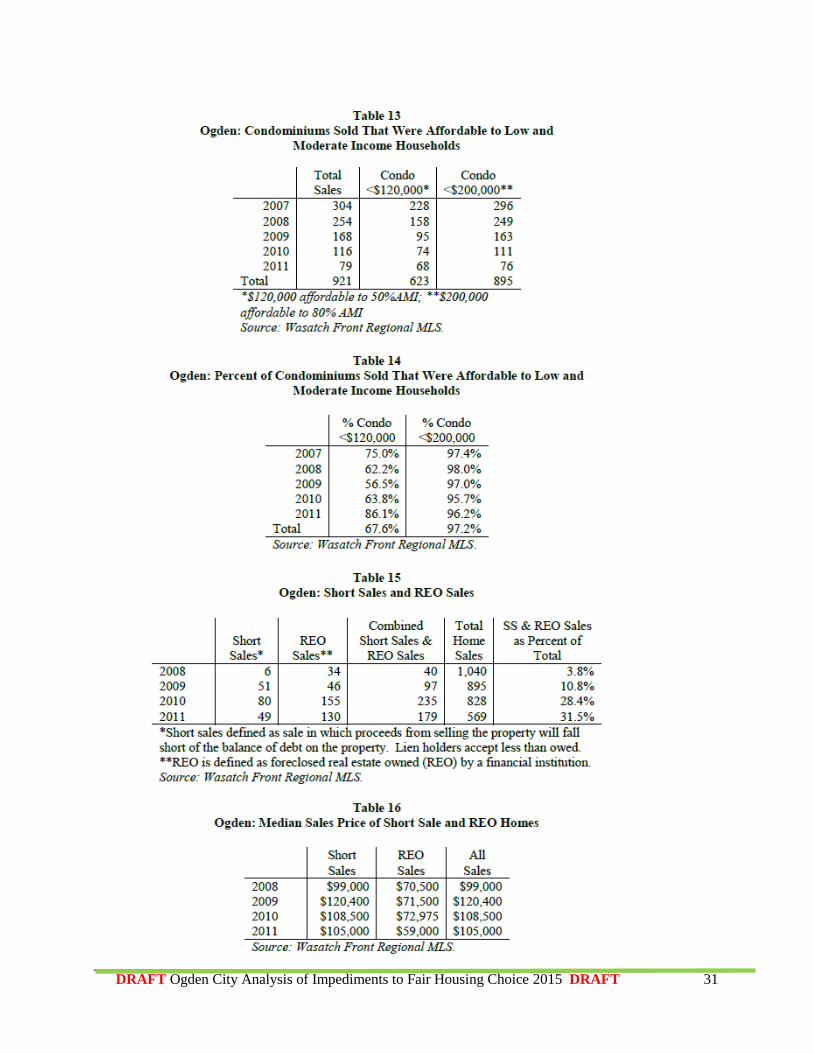
households. Over the past five years 921 existing condominiums were sold in Ogden City. Ninety-seven
percent were affordable to moderate income (80% AMI) households and 68 percent were affordable to the
low income households Tables 13-14.
Housing prices in Ogden have fallen 22 percent in the past four years and condominiums prices have fallen
26 percent Table 10. The sample of homes sold is relatively small but sold data do provide an indication of
the direction of housing prices. Housing prices are declining in part due to short sales and foreclosed
properties. Short sales and foreclosures account for about 30 percent of all home sales Table 15. These
properties are heavily discounted and push the median sales price down. Median sales price of REO
properties in 2011 was $59,000 Tables 16.
Life cycle housing is not a housing alternative. Families desiring to stay in the community but wanting to
move to a larger, higher quality home have very few housing choices other than to move to other county
alternatives.
In order to advance housing choice, the City strives to find the right balance between reinvestment and
redevelopment in racially concentrated areas versus development of new housing opportunities inside and
outside of such areas. However, with half of Ogden’s Census Tracts have a population reaching more than
20% poverty, the City is severely limited in achieving this goal. Consequently, it will require a broader
regional effort to successfully de-concentrate segregated neighborhoods in Ogden City.
Rental Housing
Nearly all rental housing would be affordable to Low- to-Moderate Income (LMI) households given the
low housing costs in the City.
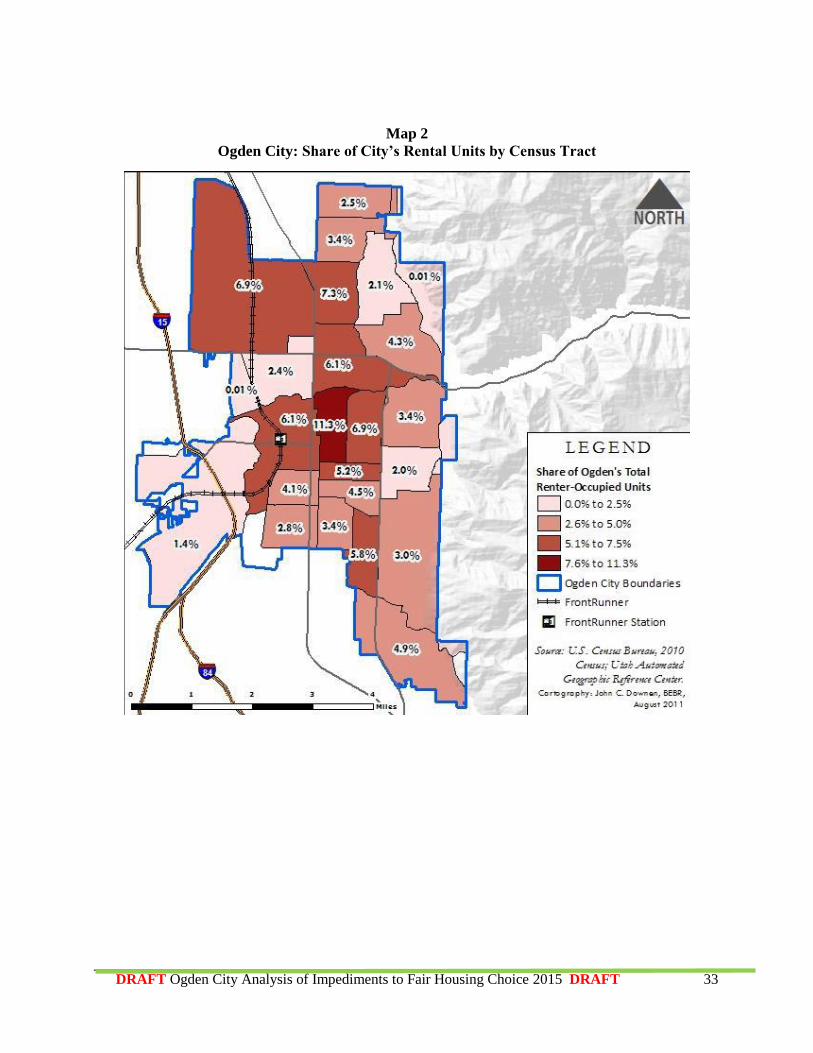
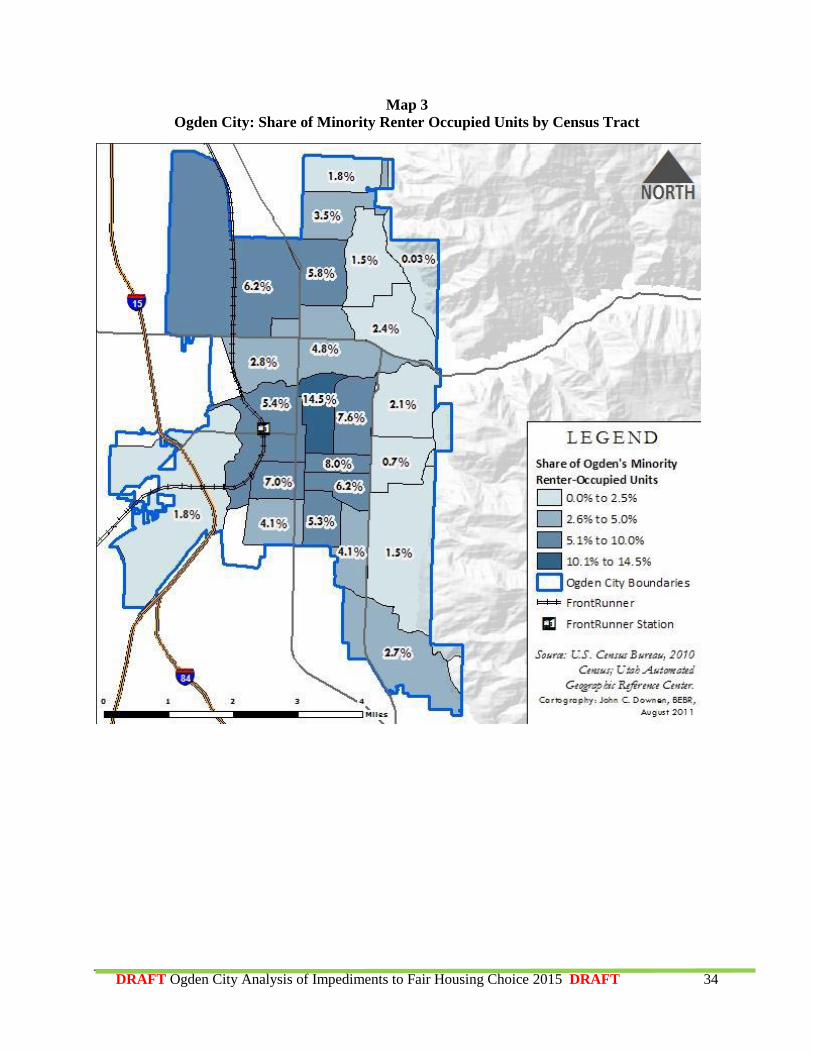
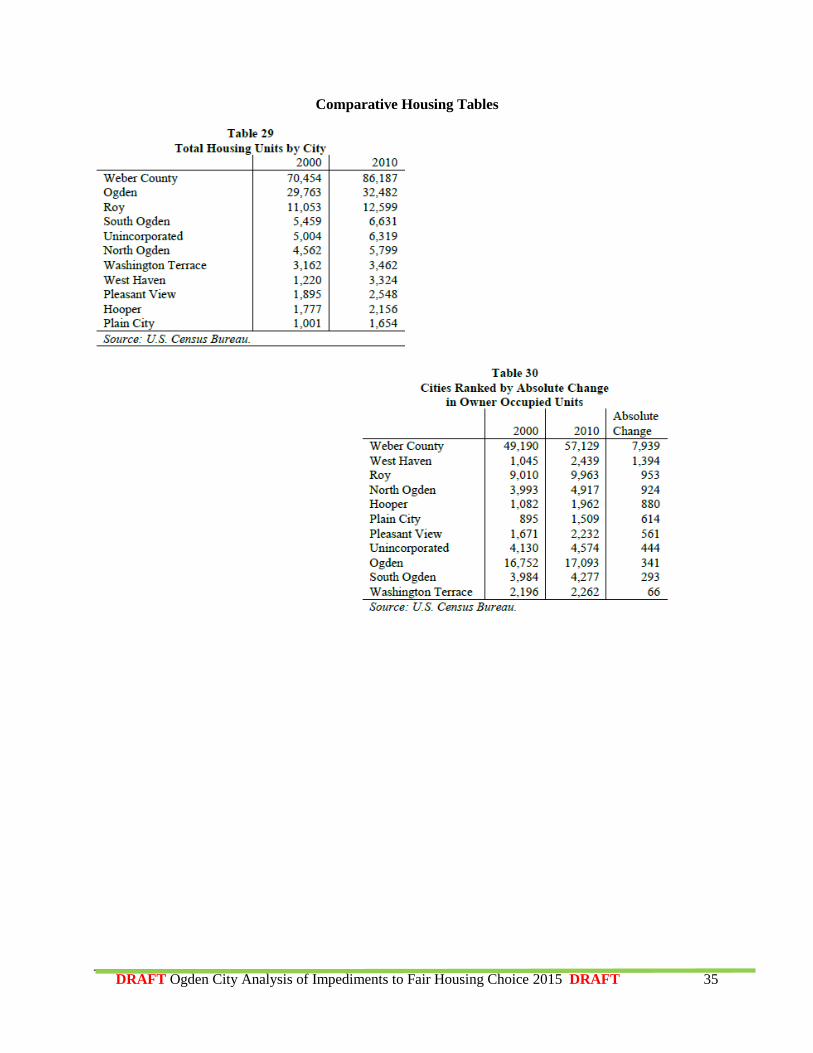
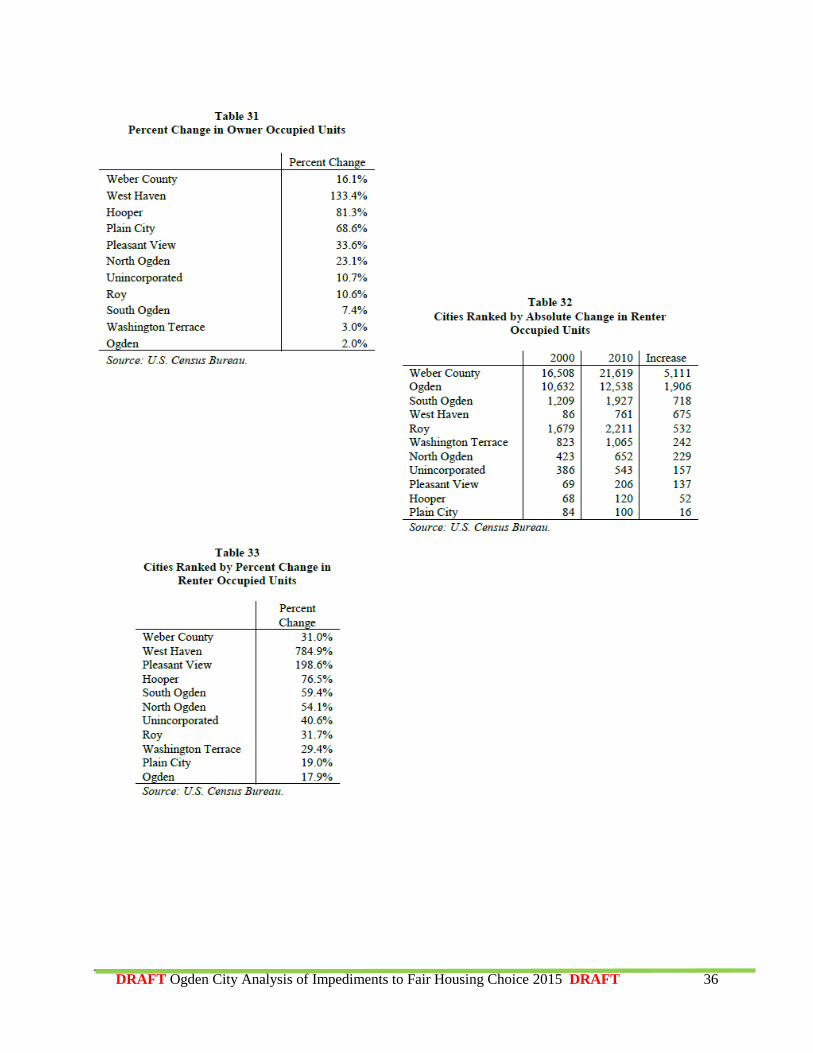
Rental housing is highly concentrated in Ogden City with nearly 60 percent of all rental units in the
county located in Ogden. Roy is the only other city with more than 10 percent of their housing stock
devoted to rental housing. Many neighboring cities have less than 1 percent of housing stock in rental
units (Table 32 Page 35). Map 2 (Page 32) shows number of rental units by census tract in Ogden..
Rental Assisted Housing
Housing prices have fallen 22%, condominiums prices have fallen 26% in the past four years.
Nearly all rental housing in Ogden is affordable to LMI households.
Rental housing is highly concentrated in Ogden, 60% of Weber Co. rentals units are in Ogden.
81% of Weber County vouchers holders live in Ogden.
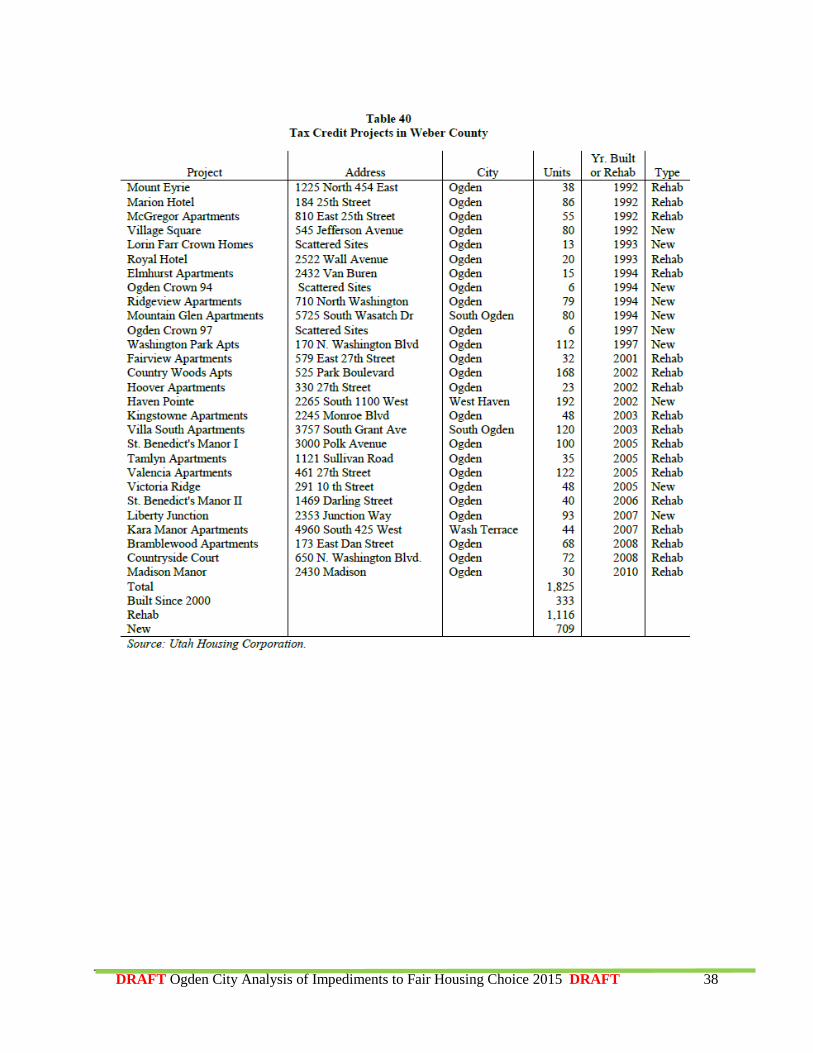
76% of all County tax credit units are in Ogden.
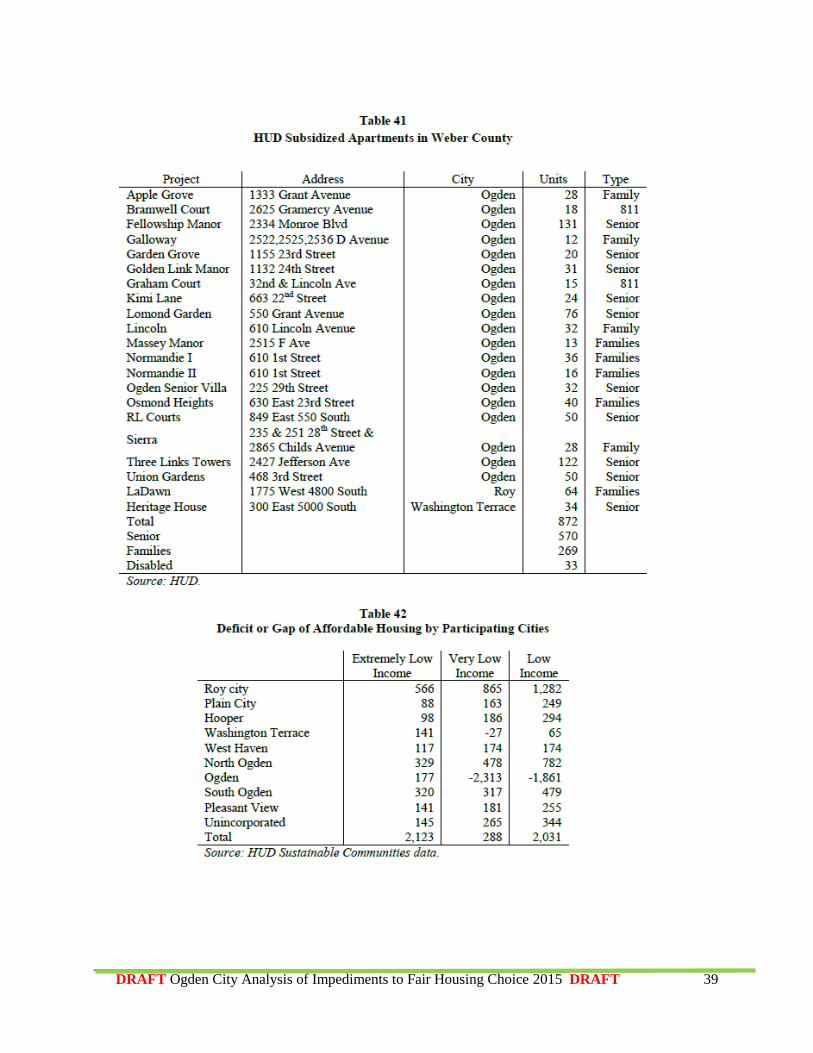
89% of County HUD deep subsidized housing units are in Ogden.
The concentration of moderate and low priced housing in Ogden results in little price diversity.
It will require a broader regional effort to successfully de-concentrate segregated neighborhoods in Ogden
City.
DRAFT Ogden City Analysis of Impediments to Fair Housing Choice 2015 DRAFT 14
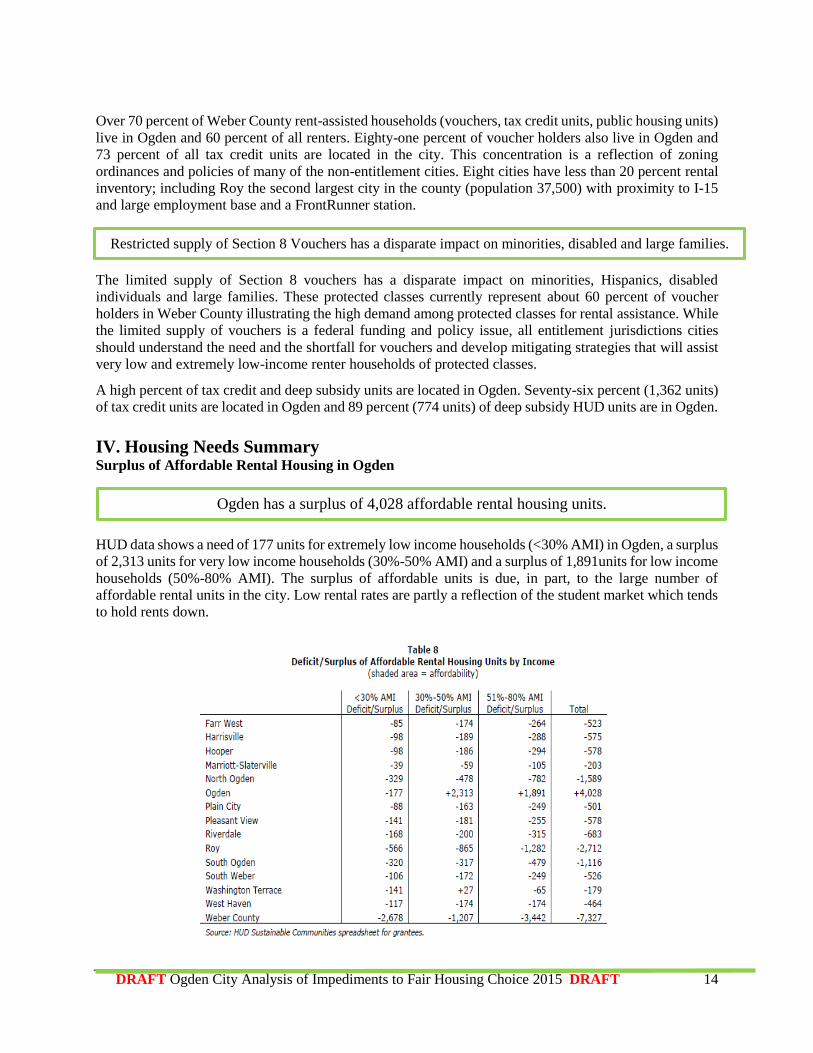
Over 70 percent of Weber County rent-assisted households (vouchers, tax credit units, public housing units)
live in Ogden and 60 percent of all renters. Eighty-one percent of voucher holders also live in Ogden and
73 percent of all tax credit units are located in the city. This concentration is a reflection of zoning
ordinances and policies of many of the non-entitlement cities. Eight cities have less than 20 percent rental
inventory; including Roy the second largest city in the county (population 37,500) with proximity to I-15
and large employment base and a FrontRunner station.
The limited supply of Section 8 vouchers has a disparate impact on minorities, Hispanics, disabled
individuals and large families. These protected classes currently represent about 60 percent of voucher
holders in Weber County illustrating the high demand among protected classes for rental assistance. While
the limited supply of vouchers is a federal funding and policy issue, all entitlement jurisdictions cities
should understand the need and the shortfall for vouchers and develop mitigating strategies that will assist
very low and extremely low-income renter households of protected classes.
A high percent of tax credit and deep subsidy units are located in Ogden. Seventy-six percent (1,362 units)
of tax credit units are located in Ogden and 89 percent (774 units) of deep subsidy HUD units are in Ogden.
IV. Housing Needs Summary Surplus of Affordable Rental Housing in Ogden
HUD data shows a need of 177 units for extremely low income households (<30% AMI) in Ogden, a surplus
of 2,313 units for very low income households (30%-50% AMI) and a surplus of 1,891units for low income
households (50%-80% AMI). The surplus of affordable units is due, in part, to the large number of
affordable rental units in the city. Low rental rates are partly a reflection of the student market which tends
to hold rents down.
Restricted supply of Section 8 Vouchers has a disparate impact on minorities, disabled and large families.
Ogden has a surplus of 4,028 affordable rental housing units.
DRAFT Ogden City Analysis of Impediments to Fair Housing Choice 2015 DRAFT 15
Table 8 shows the need for affordable units by city. These estimates were generated by HUD in 2011 for
the Equity Assessment analysis required of Sustainable Communities grantees. A HUD Sustainable
Communities grant was awarded to Salt Lake County as the fiscal agent, and Envision Utah and Wasatch
Front Regional Council as the managing partners. This grant includes a regional housing plan for the four
Wasatch Front Counties; hence HUD developed the affordable housing need estimates that appear in Table
42. The negative numbers for low (80% AMI in HUD terminology) and very low (50% AMI for HUD)
income households in Ogden City reflect the extreme affordability of the city, both in terms of rental and
owner occupied units. However, the need for extremely low income (30% AMI) housing units in Ogden is
177 units. The cumulative number of units needed for the cities studied indicates an important fact: a
shortage of affordable housing for extremely low income households.
Aging Housing Stock
In Ogden the number of housing units increased by 2,700 units over the past ten years, a 9 percent increase
in the inventory. Ninety percent of the housing inventory of Ogden City was built prior to 2000. The housing
stock in Ogden is relatively old with a median age of 45 years. The “old” housing stock increases the need
for programs that are targeted at addressing deferred maintenance, rehabilitation and improving energy
efficiency.
Affordable Housing Needs and Protected Classes
Affordable rental housing is the greatest housing need for protected classes. Over half of all minority
households rent and these households are more likely to be very low or extremely low income households.
Although Ogden has a surplus of affordable rental housing, the most critical unmet housing needs exist in
the very low and extremely low-income households. These households comprise a significant share of the
county’s population. One-in-four households in the county have incomes below 50 percent of the Area
Median Income (AMI). Of the 21,260 renter households in Weber County 45 percent or 9,500 households
were very low and extremely low-income households Table 1. There were about 5,520 renter households
with extremely low-income. Again these renter households are much more likely to be households of
protected classes; minority, Hispanic, disabled, or large family.
While an excess of supply of affordable housing in Ogden City has depressed housing sales. There is a
disparity in housing markets among cities within Weber County, with the lowest sales prices occurring in
Ogden. The City’s NRSA minority households have a median income equivalent to only 61% of the White
household income, minority residents are more likely to experience neighborhood limitations in locating
an affordable home to purchase.
Ogden’s old housing stock increases the need for housing rehab programs.
Rental housing is the primary source of housing for protected classes.
The need is to expand affordable housing in non-concentrated areas.
This situation underscores the need to expand affordable housing opportunities in non-
concentrated areas, though it would not be possible for government to subsidize enough
housing to satisfy the unmet need of persons who are not paid a living wage.
DRAFT Ogden City Analysis of Impediments to Fair Housing Choice 2015 DRAFT 16
Minimum-wage earners and single-wage-earning households cannot afford a housing unit renting for the
HUD fair market rent in Ogden. This situation forces these individuals and households to double up with
others or lease inexpensive substandard units. Minorities and female-headed households are
disproportionately impacted due to their lower incomes.
Supportive Housing for Disabled
There are currently 1,100 disabled individuals living in rental units in Weber County that are very low-
income households with severe housing cost burdens and non-elderly. These individual confront many
housing impediments. A targeted effort to develop HUD 811 housing would provide supportive rental
housing for these extremely low and very low-income disabled adults. A coordinated approach should be
considered by the two entitlement cities to develop on a regular basis 811 projects to further fair housing
for the disabled. These efforts should include a public private partnership with non-profit developer(s) and
approached from a regional perspective; that is coordinated among the entitlement cities and non-
entitlement cities.
V. Policies and Practices
Public Policy, Zoning and Land Use Element
Many impediments to fair housing choice are common impediments shared by most cities within a region.
The most effective mitigation to these common impediments is a coordinated, shared approach by the cities
in the region. Collaboration between service providers and jurisdictions to develop a regional approach
should be pursued to reduce the concentration of protected class households in Ogden. Lack of a regional
approach is likely one cause of the concentration affordable rental housing and low and very low-income
households in Ogden and some of the cities in the south-end of the county.
Ogden has a diversity of residential densities accommodating various type of development from low density
single family to high density mixed use and TODs. Group homes, an important housing type for HUD,
probably are restricted in some non-entitlement cities. Ogden has inclusionary zoning and allows accessory
units. The city does not have density bonuses for affordable housing or fee waivers. Ogden does not need
to provide incentives for affordable housing.
Nimbyism, Zoning, and Land Prices
Lack of a regional approach is likely one cause of the concentration of affordable rental
housing and low and very-low income households in Ogden.
“If some of the northern cities provided incentives, over the long-term there would be less concentration
of protected classes in Ogden and housing opportunities would be expanded for protected classes.” BEBR
Ogden does not need to provide incentives for affordable housing.
If the higher income cities in Weber County do not allow increased levels of affordable housing,
particularly rental housing, protected classes will become more highly concentrated and segregated by
2020 thereby further limiting housing choice.
DRAFT Ogden City Analysis of Impediments to Fair Housing Choice 2015 DRAFT 17
Regionally, Nimbyism, Zoning, and Land Prices Lead to Concentrations of Affordable Housing and greatly
impacts and potentially further concentrates low-income and minority housing in Ogden. “Zoning practices
and development approvals have a greater impact than any other factor on fair housing choice. If the higher
income cities in Weber County do not allow increased levels of affordable housing, particularly rental
housing, protected classes will become more highly concentrated and segregated by 2020 thereby further
limiting housing choice.
Transit Oriented Developments (TOD)
To avoid impeding fair housing choice for protected classes, housing projects at Transit Oriented
Developments (TOD) should include housing types and prices that are consistent with the housing needs
of protected classes as outlined in the Fair Housing and Equity Assessment. TODs offer a rare opportunity
to bring together affordable housing, proximity to employment, and access to public transportation for
transit dependent households, which are disproportionately minorities and the disabled. There is a TOD in
downtown Ogden at 24th Street and Wall Avenue.
In an effort to redevelop under-utilized property and support the development of a Transit Oriented
Development (TOD) near Ogden’s intermodal transit hub, Ogden has committed to the acquisition of
properties adjacent to the UTA parcels located adjacent to the intermodal hub. The properties Ogden plans
to acquire are bordered by Wall Ave, Reeves Ave, 21st and 22nd Streets, and equate to approximately 7.5
acres of land. These properties, as well as a portion of the UTA parcels, are within the existing 21st – 22d
Street Redevelopment Area, and are part of Ogden’s existing Wall Avenue Retail Corridor Master Plan.
They are also conveniently located within walking distance of the IRS campus, which is one of Ogden’s
largest employers. This location offers very high visibility with frontage on Wall Avenue, which has a
traffic count of 23,125 cars per day. Ogden’s objective is to create a complimentary use to UTA’s existing
infrastructure and developable land, while adhering to the existing Wall Avenue Master Plan. In addition,
increasing Ogden’s sales and property tax bases are primary goals and Ogden feels a TOD that offers a
diverse mix of uses, along with quality and affordable housing units, would best fit this location and assist
Ogden in reaching these goals.
Utah State Legislature passed HB295
In 1996 the Utah State Legislature passed HB295 Providing Affordable Housing. HB 295 states, “the
availability of moderate income housing is an issue of statewide concern.” To this end “municipalities
should afford a reasonable opportunity for a variety of housing, including moderate income housing to meet
the needs of people desiring to live there.” This legislation provided very few incentives for compliance
however, most cities have completed an assessment of affordable housing need, albeit in many cases cities
have failed to update the housing assessment as required by the legislation. The requirements of HB295
have led cities to consider affordable housing issues on a narrow jurisdictional basis, which in some cases
has resulted in impediments to fair housing. Focusing solely on “their” jurisdiction, a city is left without
Lack of housing price diversity in some non-entitlement cities in the county, due in part to local zoning,
has led to concentrations of low-income and poor minorities and ethnic groups in many neighborhoods
in Ogden.
.
The requirements of HB295 have led cities to consider affordable housing issues on a narrow
jurisdictional basis, which in some cases has resulted in impediments to fair housing.
DRAFT Ogden City Analysis of Impediments to Fair Housing Choice 2015 DRAFT 18
any regional context regarding the location and need for affordable housing and the disparities of
opportunities across cities in the region (county). Housing markets do not stop at a jurisdiction’s boundaries.
Housing markets are highly interrelated and interdependent with surrounding jurisdictions. Weber County
is a regional housing market and Ogden is a subset of this regional market.
Since passage of the original affordable housing statute the state’s population has increased from two
million to three million. It is time to revisit Utah’s affordable housing legislation and amend the legislation
to encourage a regional (county) context of affordable housing needs. Utah State Department of Community
and Housing, Utah Housing Corporation, local government officials, non-profit advocacy groups, and other
stakeholders should be included in a working group to update HB295.
Language Assistance Plan and Fair Housing Infrastructure
The absence of language access plans and the availability of language interpreters in the fair housing offices
of entitlement jurisdictions disproportionately impacts minorities, ethnic populations, and immigrants.
Ogden’s fair housing infrastructure is one of the most complete of any city in the Wasatch Front. However,
the fair housing website is only in English. The city does provide language interpreters.
VI. Legal Status / Fair Housing Complaints
Utah Antidiscrimination and Labor Division
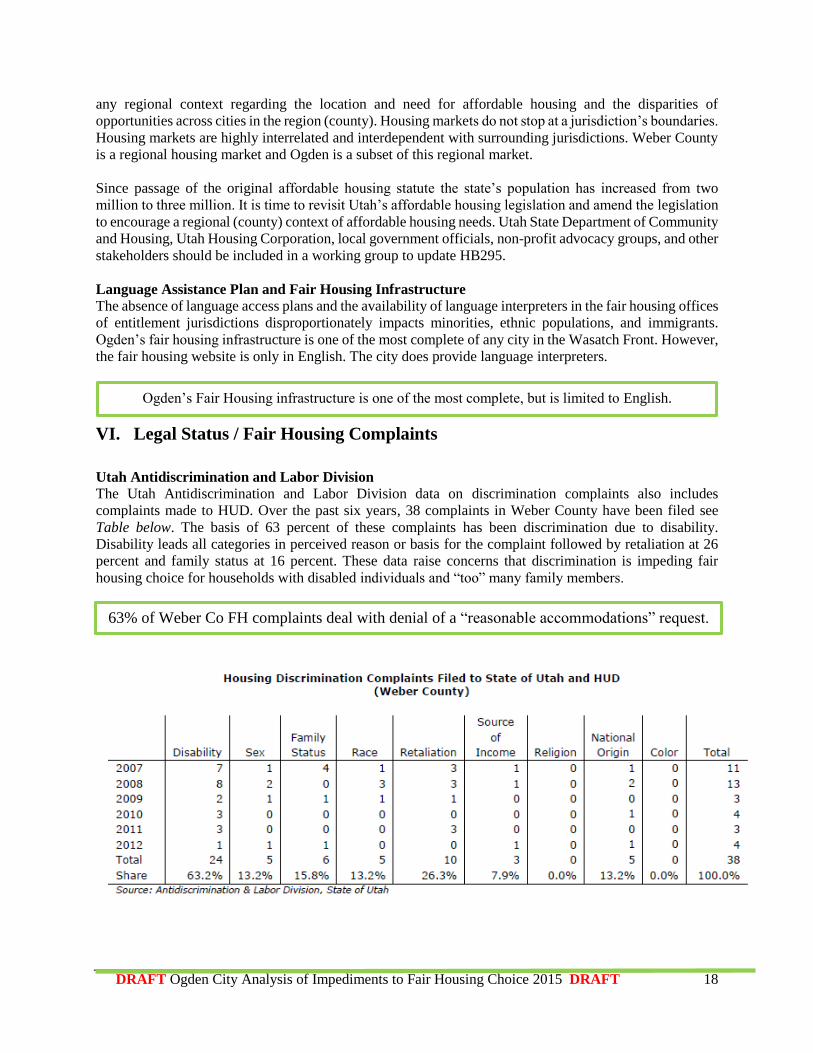
The Utah Antidiscrimination and Labor Division data on discrimination complaints also includes
complaints made to HUD. Over the past six years, 38 complaints in Weber County have been filed see
Table below. The basis of 63 percent of these complaints has been discrimination due to disability.
Disability leads all categories in perceived reason or basis for the complaint followed by retaliation at 26
percent and family status at 16 percent. These data raise concerns that discrimination is impeding fair
housing choice for households with disabled individuals and “too” many family members.
Ogden’s Fair Housing infrastructure is one of the most complete, but is limited to English.
63% of Weber Co FH complaints deal with denial of a “reasonable accommodations” request.
DRAFT Ogden City Analysis of Impediments to Fair Housing Choice 2015 DRAFT 19
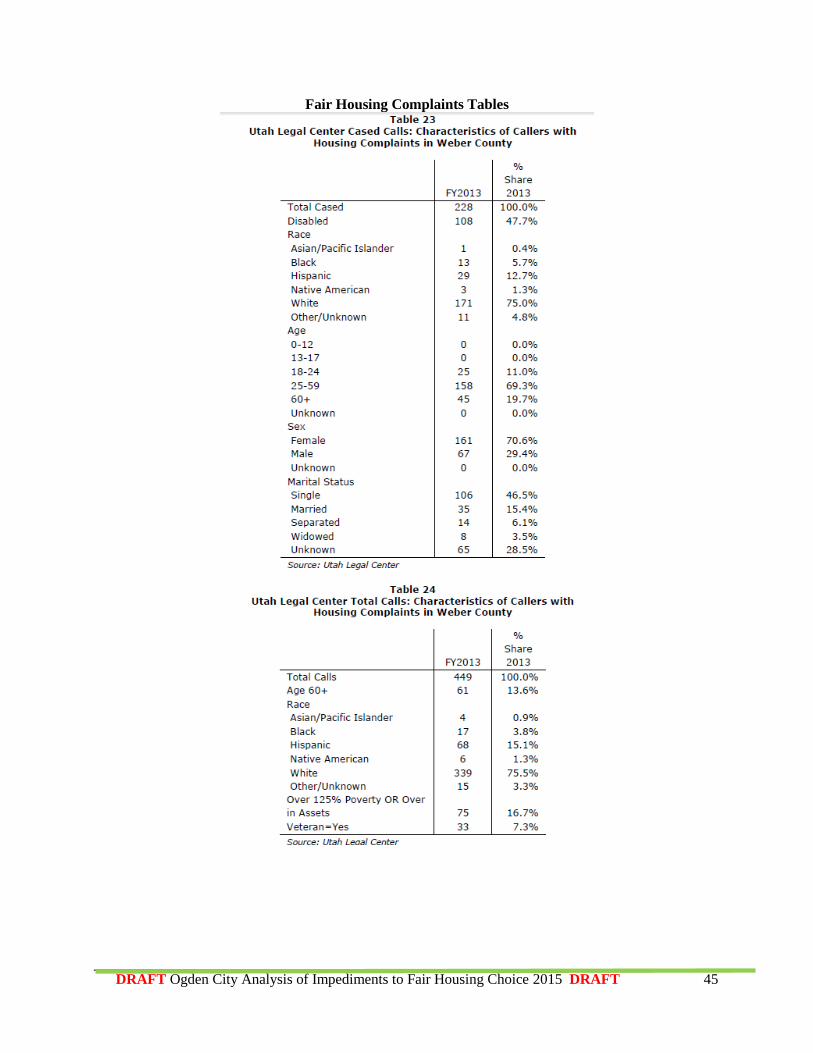
Utah Legal Services
Utah Legal Services data show that 48 percent of “Cased Call” reports the basis of the complaint as
disability. The race and ethnicity of individuals filing complaint is consistent with state demographic
patterns. Seventy-five percent of those filing complaints were white and 13 percent were Hispanic. Data in
(Tables 23-24 Page 45) do not suggest, at least for those filing complaints, a significant level of
discrimination based on race or ethnicity.
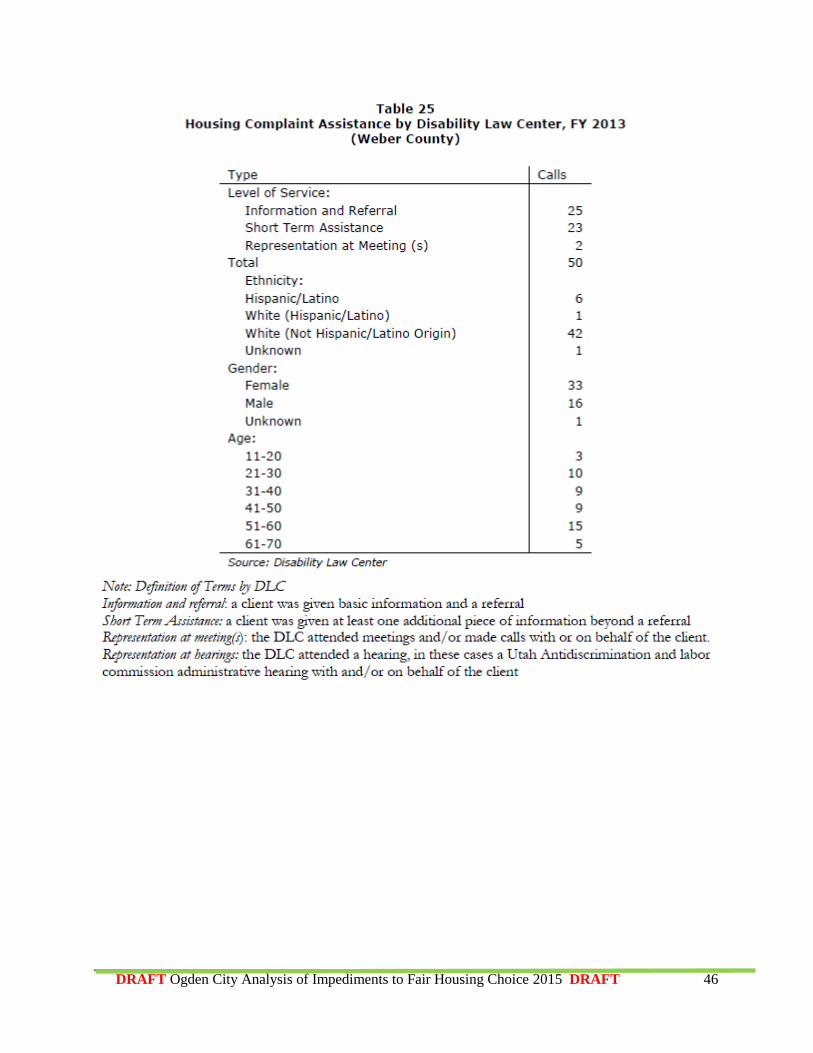
Disability Law Center
The Disability Law Center also fields calls regarding housing discrimination. Their data does not show the
basis of the discrimination but show that in fiscal year 2013 50 individuals in Weber County filed
complaints regarding housing discrimination Table 25. Of the complaints filed 84 percent were by non-
Hispanic whites and 66 percent were filed by women. The Disability Law Center is in the process of
developing a comprehensive survey regarding housing, transportation, and employment. The housing
section of the survey will ask three or four detailed questions regarding housing discrimination. The results
should provide further insight into the level of housing discrimination based on disabilities.
Reasonable Accommodations for the Disabled
The number of disabled individuals in Weber County is estimated by the American Community Survey,
U.S. Census Bureau to be 23,000 individuals, about 11 percent of the population. Under the Fair Housing
Act housing providers must make “reasonable accommodations in rules, policies practices, or services when
such accommodations may be necessary to afford a person with a disability the equal opportunity to use
and enjoy a dwelling.” Currently over one-third of all rental housing in Weber County is a detached single
family unit. Many of the landlords who are renting homes or small “mom and pop” housing providers are
not aware of the full implications of the Fair Housing Act and the “reasonable accommodations” provision.
The Fair Housing infrastructure in all cities has not systematically addressed the education of landlords
regarding “reasonable accommodations.
VII. Private Policies and Practices: Lending
The disparities in homeownership across racial and ethnic lines reflect only the symptoms of underlying
impediments in the home mortgage application process. The Home Mortgage Disclosure Act (HMDA) data
was compiled for Weber County to better understand the barriers that members of the protected class face
in obtaining mortgages. For illustrative proposes, non-Hispanic white applicants were compared with
Hispanic/Latino applicants for most metrics derived from the HMDA data. Homeownership and housing
stability are two dimensions of housing opportunity that can be assessed using HMDA data by examining
mortgage application outcomes and the high interest lending practices. The focus of analysis is on Ogden
which accounts for 78 percent of the county’s Hispanic mortgage applications and have Hispanic denial
rates roughly twice as large as those of non-Hispanics.
DLC provides free advocacy to all protected classes in filing a FH complaint.
Utah Legal Services data suggest there is no race or ethnicity discrimination in filing FH complaints.
Many landlords are not aware of Fair Housing Act requirement to provide
“reasonable accommodations” to persons with a disability
DRAFT Ogden City Analysis of Impediments to Fair Housing Choice 2015 DRAFT 20
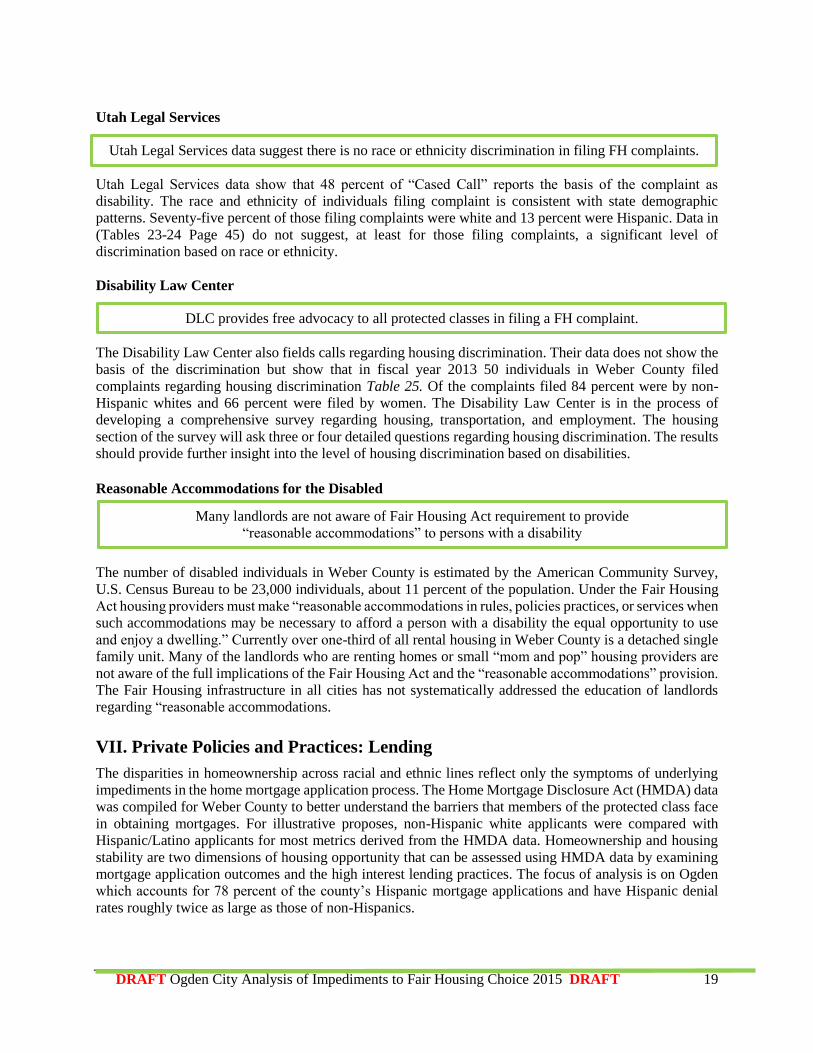
Figure 1 - Percent of Mortgage Loan Applications Denied by Race/Ethnicity in
Weber County Incorporated Cities, 2006–2011
Source: HMDA LAR Raw Data by MSA (2006–2011) Note: The categories Plain City/Marriott-Slaterville and West Haven
include unincorporated areas in the western region of Weber County, which are contained within the census tracts that
encompass the three cities.
Figure 2 - Percent of Mortgage Loan Applications (At or Below 80% HAMFI) Denied by
Race/Ethnicity in Utah County Incorporated Cities, 2006–2011
Source: HMDA LAR Raw Data by MSA (2006–2011)
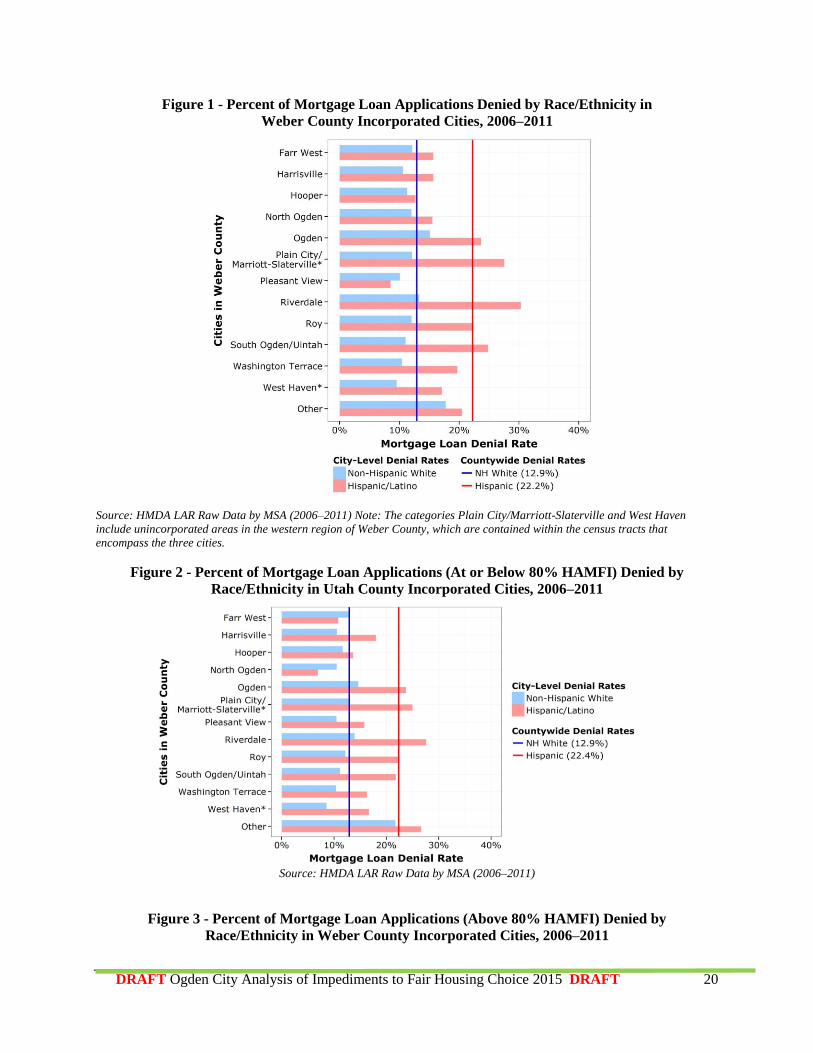
Figure 3 - Percent of Mortgage Loan Applications (Above 80% HAMFI) Denied by
Race/Ethnicity in Weber County Incorporated Cities, 2006–2011
DRAFT Ogden City Analysis of Impediments to Fair Housing Choice 2015 DRAFT 21
Source: HMDA LAR Raw Data by MSA (2006–2011)
Note: The categories Plain City/Marriott-Slaterville and West Haven include unincorporated areas in the western region of
Weber County, which are contained within the census tracts that encompass the three cities.
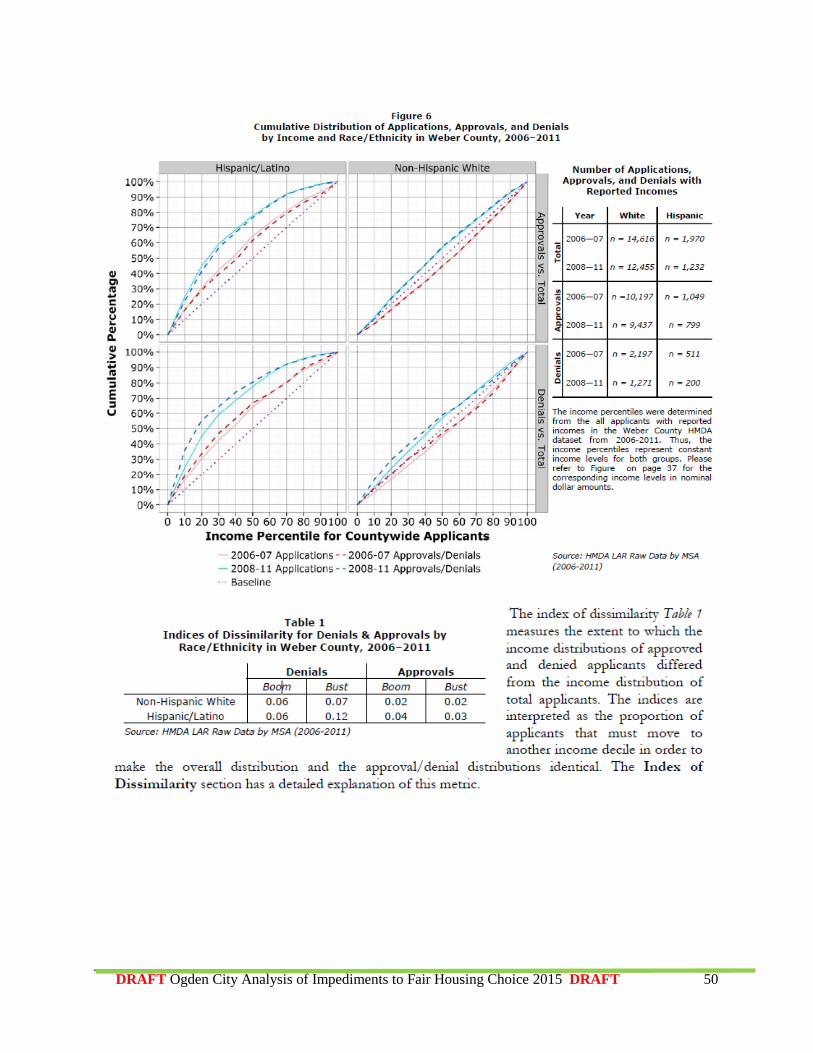
Figure 2 shows the denial rates among white and Hispanic applicants with reported incomes at or below
80 percent HAMFI (median family income), while Figure 3 shows the denial rates for applicants with
reported incomes above 80 percent HAMFI. Note that the reported incomes for applicants from 2006 to
2011 are adjusted relative to the median family income for the year that they filed their mortgage
applications.
The overall county-level denial rates do not change across groups. The Hispanic denial rate remains at
levels around 22 percent, while the white denial rate is roughly 13 percent—regardless of income bracket.
More pertinent are the cities with the largest Hispanic application volume such as Ogden and Roy, which
have denial rate gaps greater than 9 percentage points regardless of income brackets. Similarly, in West
Haven, which has the third highest application volume in Weber County, the Hispanic denial rate is
sustained at levels above 15 percent for both income brackets, whereas non-Hispanic denial rates are below
10 percent. Thus, while many smaller cities have fluctuations in denial rates attributed to low application
volume, the cities with the largest Hispanic application volume have not experienced clear denial gap
closures with the disaggregation by income bracket.
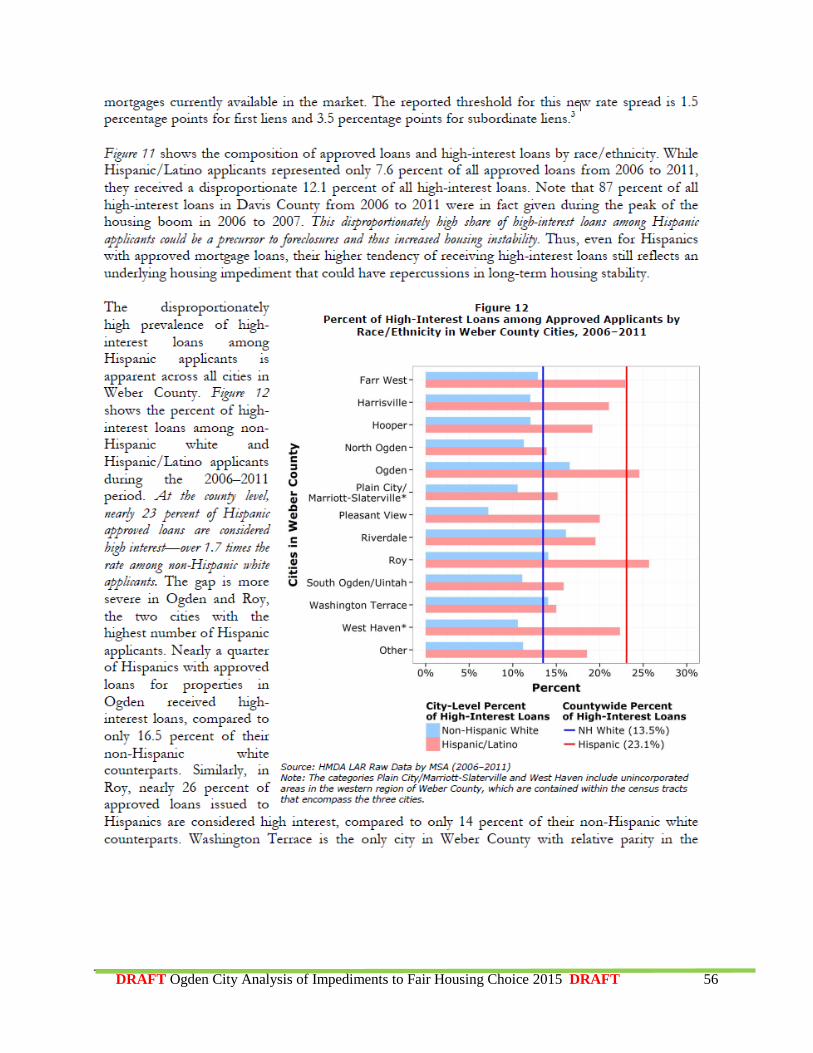
The significantly higher denial rates for home mortgages for Hispanics suggests a financial impediment to
fair housing choice for Hispanics and all minorities. Denial rates for Hispanics in Ogden are twice as high
as denial rates for whites even after adjusting for income. Furthermore, if a Hispanic household receives
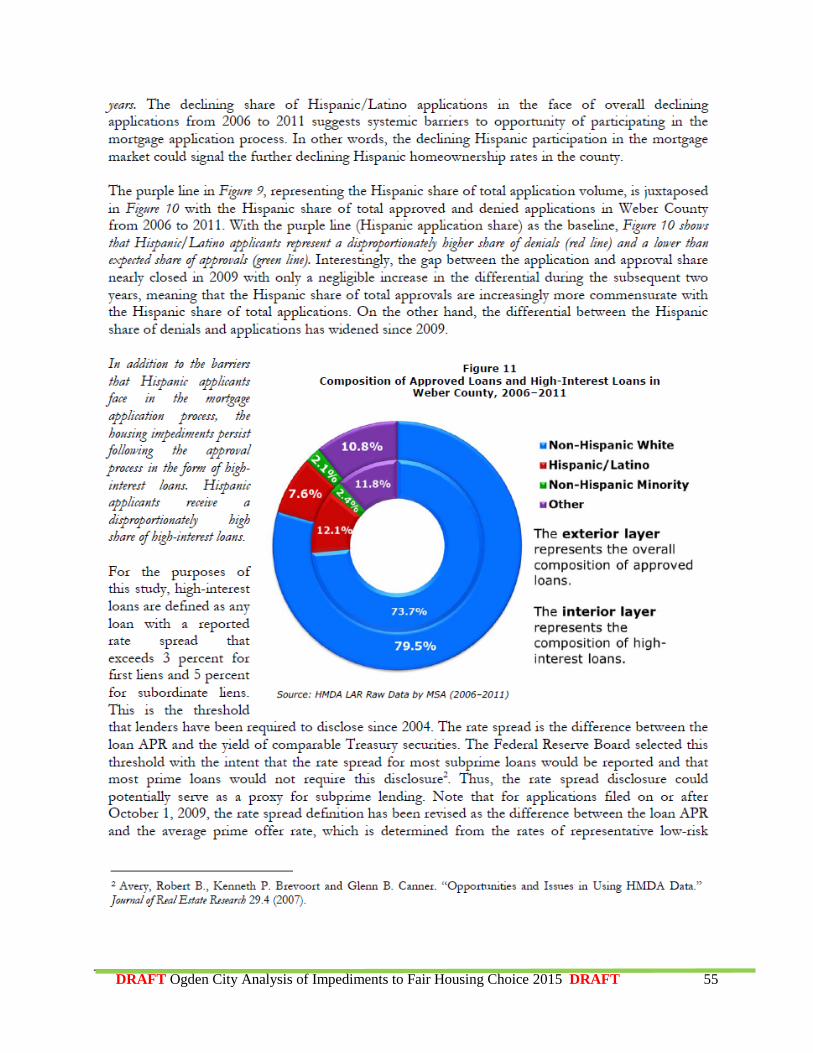
loan approval that household is nearly two times as likely to have a high interest loan as a white household.
Despite the persistent disparity in mortgage outcomes between the two groups, other factors such as credit
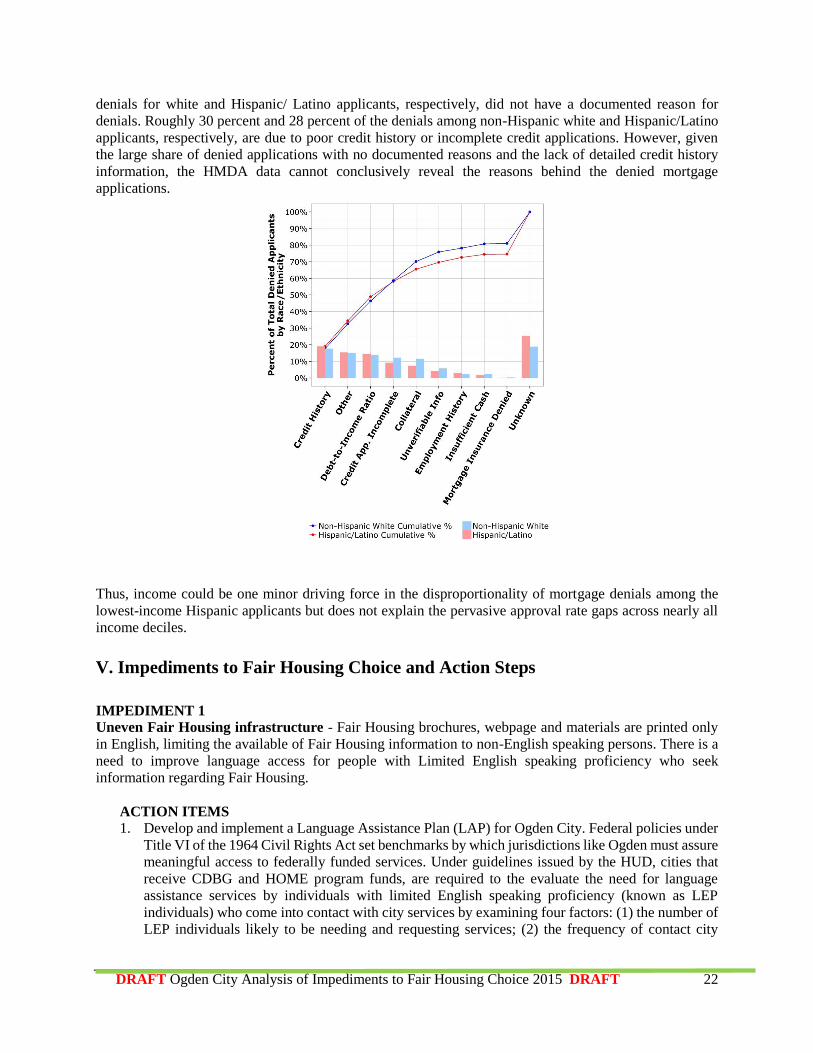
history could be the driving force behind the mortgage denials. Note that 19 percent and 25 percent of the
Ogden Hispanics are twice as likely to be denied a mortgage and once approved two times
more likely to have a higher interest loan than white households (even adjusted for income).
DRAFT Ogden City Analysis of Impediments to Fair Housing Choice 2015 DRAFT 22
denials for white and Hispanic/ Latino applicants, respectively, did not have a documented reason for
denials. Roughly 30 percent and 28 percent of the denials among non-Hispanic white and Hispanic/Latino
applicants, respectively, are due to poor credit history or incomplete credit applications. However, given
the large share of denied applications with no documented reasons and the lack of detailed credit history
information, the HMDA data cannot conclusively reveal the reasons behind the denied mortgage
applications.
Thus, income could be one minor driving force in the disproportionality of mortgage denials among the
lowest-income Hispanic applicants but does not explain the pervasive approval rate gaps across nearly all
income deciles.
V. Impediments to Fair Housing Choice and Action Steps
IMPEDIMENT 1
Uneven Fair Housing infrastructure - Fair Housing brochures, webpage and materials are printed only
in English, limiting the available of Fair Housing information to non-English speaking persons. There is a
need to improve language access for people with Limited English speaking proficiency who seek
information regarding Fair Housing.
ACTION ITEMS
1. Develop and implement a Language Assistance Plan (LAP) for Ogden City. Federal policies under
Title VI of the 1964 Civil Rights Act set benchmarks by which jurisdictions like Ogden must assure
meaningful access to federally funded services. Under guidelines issued by the HUD, cities that
receive CDBG and HOME program funds, are required to the evaluate the need for language
assistance services by individuals with limited English speaking proficiency (known as LEP
individuals) who come into contact with city services by examining four factors: (1) the number of
LEP individuals likely to be needing and requesting services; (2) the frequency of contact city
DRAFT Ogden City Analysis of Impediments to Fair Housing Choice 2015 DRAFT 23
agencies have with LEP Individuals; (3) the nature and importance of the contacts LEP Individuals
have with city agencies; and (4) the resources available for language assistance activities. A LAP
will identify ways in which language assistance will be provided – thereby outreaching effectively
to the LEP community regarding Fair Housing Choice, as well as, other City services.
2. Translate the City’s Fair Housing webpage and vital program documents in Spanish; and print from
HUD’s website and make available informational pamphlets and Fair Housing brochures for LEP
individuals.
3. Continue to provide citizens with consistent Spanish translation services. Utilizing a private
contractor to test and certify employees, so that quality translation services are available to LEP
individuals.
4. Establish a centralized list of resources for assisting LEP individuals, by utilizing the City’s
Intranet. Posting the LAP and a list of City employees who are certified interpreters on the City’s
Intranet will assist in consistent and even Fair Housing infrastructure, as well as, consistent access
to City programs.
5. Encourage the Disability Law Center (DLC) (a recipient of HUD’s Fair Housing Initiatives
Program (FHIP) Grant) to take the lead in establishing a database to track Fair Housing complaints
or legal actions for the region, thereby establishing a centralized administration of Fair Housing
infrastructure.
6. Participate in a Regional Analysis of Impediments to Fair Housing Choice.
IMPEDIMENT 2
Deteriorating Quality of Housing Inventory - Ogden's housing stock is aging in Ogden's NRSA. This
along with the prevalence of low-income households and minority concentrations in the NRSA, presents
the challenge of deferred maintenance and deteriorating quality of housing stock. Homes in the East Central
and NRSA particularly, are disproportionately occupied by minority and disabled individuals (seniors with
a highly likelihood of disability). An analysis of age and value of homes in Ogden indicates several
neighborhoods where there are a large number of homes built prior to 1950 and valued at less than $100,000.
There is a relatively high probability these homes are subject to deferred maintenance and deteriorating
quality. These homes are disproportionately occupied by minorities and disabled individuals (seniors with
a high likelihood of disability). Programs to rehabilitate, renovate, and repair structures and/or improve
energy efficiency would affirmatively further fair housing.
ACTION ITEMS
1. Continue targeting resources to improving the condition of housing in the NRSA.
2. Partner with local lenders and non-profit groups to expand CED’s access to funding to improve the
quality of housing in the RCAP and NRSA.
3. Continue to partner with HUD’s ACA program to improve the quality of housing in Ogden’s high
minority and high poverty East Central neighborhood.
4. Work towards providing additional housing options, and when possible, develop new quality
housing in the NRSA to provide more price diversity and desegregate the concentration of poverty.
IMPEDIMENT 3
Disproportionate impact from Good Landlord program - (“refuse to rent to applicants with certain
criminal backgrounds” – minorities disproportionately have higher criminal backgrounds.) The purpose of
the program is to eliminate code violations and public nuisances among rental units. In exchange for running
background checks and refusing to rent to applicants with certain criminal pasts, landlords receive a
financial incentive. Many respondents of the Utah State Fair Housing Survey felt that these programs create
barriers to housing for those individuals with past transgressions. Ogden’s good landlord program may be
overly restrictive and have disparate impacts on protected classes. The requirements of the program should
be refined. The program currently requires landlords to “refuse to rent to applicants with certain criminal
DRAFT Ogden City Analysis of Impediments to Fair Housing Choice 2015 DRAFT 24
backgrounds.” Although not intended to discriminate against protected classes, if minorities
disproportionately have criminal backgrounds the Good Landlord program could be deemed a violation of
the Fair Housing Act.
ACTION ITEMS
1. Re-evaluate the program to determine if it is consistent with the Utah State legislature.
IMPEDIMENT 4
Landlords lack familiarity with Fair Housing Act - (many landlords are not aware of their
responsibilities to provide “reasonable accommodations” as required by the Fair Housing Act.) The number
of disabled individuals in Weber County is estimated at 23,000 individuals, about 11% of the population.
Under the Fair Housing Act housing providers must make “reasonable accommodations in rules, policies
practices, or services when such accommodations may be necessary to afford a person with a disability the
equal opportunity to use and enjoy a dwelling.” Currently over one-third of all rental housing in Weber
County is a detached single family unit. Many of the landlords who are renting homes or small “mom and
pop” housing providers are not aware of the full implications of the Fair Housing Act and the “reasonable
accommodations” provision. The Fair Housing infrastructure in all cities has not systematically addressed
the education of landlords regarding “reasonable accommodations.
ACTION ITEMS
1. Review the Good Landlord curriculum to ensure it adequately addresses the Fair Housing Act and
particularly the Reasonable Accommodations requirements for landlords.
2. Work with state agencies and DLC to promote fair housing educational opportunities.
3. Work with the Utah Apartment Association’s to increase attendance at Fair Housing Tradeshow
4. Promote April as Fair Housing Month to increase the public’s awareness of the Fair Housing Act.
5. Utilize the FHEO logo in City documents to raise awareness of Fair Housing.
IMPEDIMENT 5
Local building inspectors lack familiarity with federal multi-family housing requirements.
Lack of familiarity of local building inspection offices with the International Building Code (IBC) and the
federally assisted multi-family housing requirements can impact fair housing choice for disabled
individuals. IBC and federal requirements mandate a percentage of multi-family units as accessible.
Developers have completed apartment projects not in compliance due to an oversight by the building
inspector.
ACTION ITEMS
1. Providing training opportunities for City employees whose duties impact fair housing such as
building inspection, developing assisted housing or community/economic development activities.
IMPEDIMENT 6
High Denial Rates for Mortgage Loans to Hispanics - The significantly higher denial rates for home
mortgages for Hispanics suggests a financial impediment to fair housing choice for Hispanics and all
minorities. Denial rates for Hispanics in Ogden are twice as high as denial rates for whites even after
adjusting for income. Furthermore, if a Hispanic household receives loan approval that household is nearly
two times as likely to have a high interest loan as a white household. Higher denial rates of mortgage loan
applications and a disproportionate share of high-cost loans among minority households have the effect of
limiting access to mortgage products for these households.
Note: Although Ogden City agrees that there is a significantly higher number of Hispanics denied
mortgages and Hispanics disproportionately have higher interest rates in Ogden, the data is inconclusive to
DRAFT Ogden City Analysis of Impediments to Fair Housing Choice 2015 DRAFT 25
determine the reason for the denials and higher interest rates. Ogden City CED contacted a leading local
mortgage lender to inquire about the Weber County AI findings and the possible reasons for higher interest
rates and higher rate of Hispanics denied mortgages. Poor credit history, no credit history and failure to
follow-through with the mortgage application paperwork and process all are important factors which the
research provided by UofU for the AI did not take into account.
Although the AI is inconclusive to determine that Hispanics are subject to discrimination based on
ethnicity in mortgage lending in Ogden, the City will take the following steps to encourage fair
housing choice.
ACTION ITEMS
1. Encourage USU Extension to offer Homebuyer Education class in Spanish in Ogden.
2. Encourage the DLC, Fair Housing to increase Fair Housing testing in Ogden and to include
mortgage lending testing based on ethnicity.
3. Review all Own In Ogden homebuyer applications to ensure applicants are not victims of predatory
lending.
4. Strengthen partnerships with local lenders and encourage lenders to offer homebuyer education and
incentives to purchase homes in the City.
X. Signature for the City of Ogden
By my signature I certify that the Analysis of Impediments to Fair Housing Choice for the City of Ogden
is in compliance with the intent and directives of the regulations of the Community Development Block
Grant Program regulations.
______________________________________
Mayor, Michael P. Caldwell
_______________________________________
Date
DRAFT Ogden City Analysis of Impediments to Fair Housing Choice 2015 DRAFT 26
VI. General Data Tables, Maps and Figures
Source: 2012 Weber County Housing Assessment and Plan and Weber County Regional Analysis of Impediments
for Fair Housing Equity Assessment
Minority Population Tables
DRAFT Ogden City Analysis of Impediments to Fair Housing Choice 2015 DRAFT 27
Housing Tables and Maps
DRAFT Ogden City Analysis of Impediments to Fair Housing Choice 2015 DRAFT 28
DRAFT Ogden City Analysis of Impediments to Fair Housing Choice 2015 DRAFT 29
DRAFT Ogden City Analysis of Impediments to Fair Housing Choice 2015 DRAFT 30
DRAFT Ogden City Analysis of Impediments to Fair Housing Choice 2015 DRAFT 31
DRAFT Ogden City Analysis of Impediments to Fair Housing Choice 2015 DRAFT 32
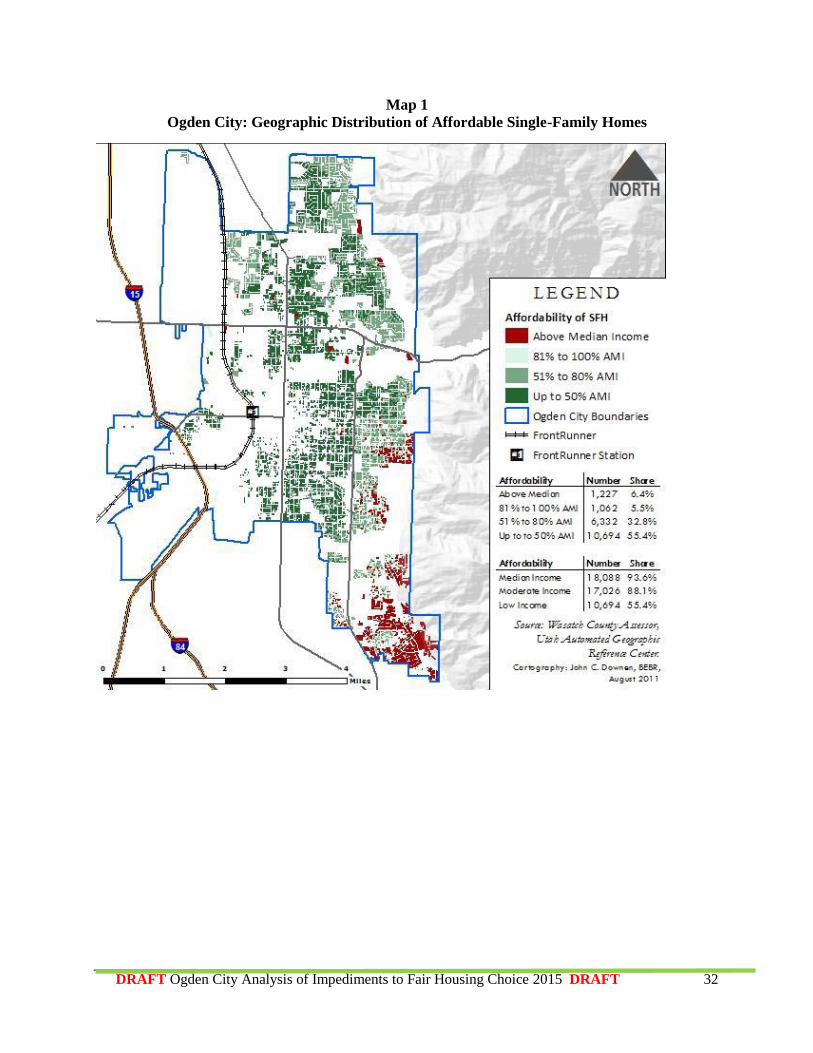
Map 1
Ogden City: Geographic Distribution of Affordable Single-Family Homes
DRAFT Ogden City Analysis of Impediments to Fair Housing Choice 2015 DRAFT 33
Map 2
Ogden City: Share of City’s Rental Units by Census Tract
DRAFT Ogden City Analysis of Impediments to Fair Housing Choice 2015 DRAFT 34
Map 3
Ogden City: Share of Minority Renter Occupied Units by Census Tract
DRAFT Ogden City Analysis of Impediments to Fair Housing Choice 2015 DRAFT 35
Comparative Housing Tables
DRAFT Ogden City Analysis of Impediments to Fair Housing Choice 2015 DRAFT 36
DRAFT Ogden City Analysis of Impediments to Fair Housing Choice 2015 DRAFT 37
DRAFT Ogden City Analysis of Impediments to Fair Housing Choice 2015 DRAFT 38
DRAFT Ogden City Analysis of Impediments to Fair Housing Choice 2015 DRAFT 39
DRAFT Ogden City Analysis of Impediments to Fair Housing Choice 2015 DRAFT 40
Poverty data, Tables and Maps
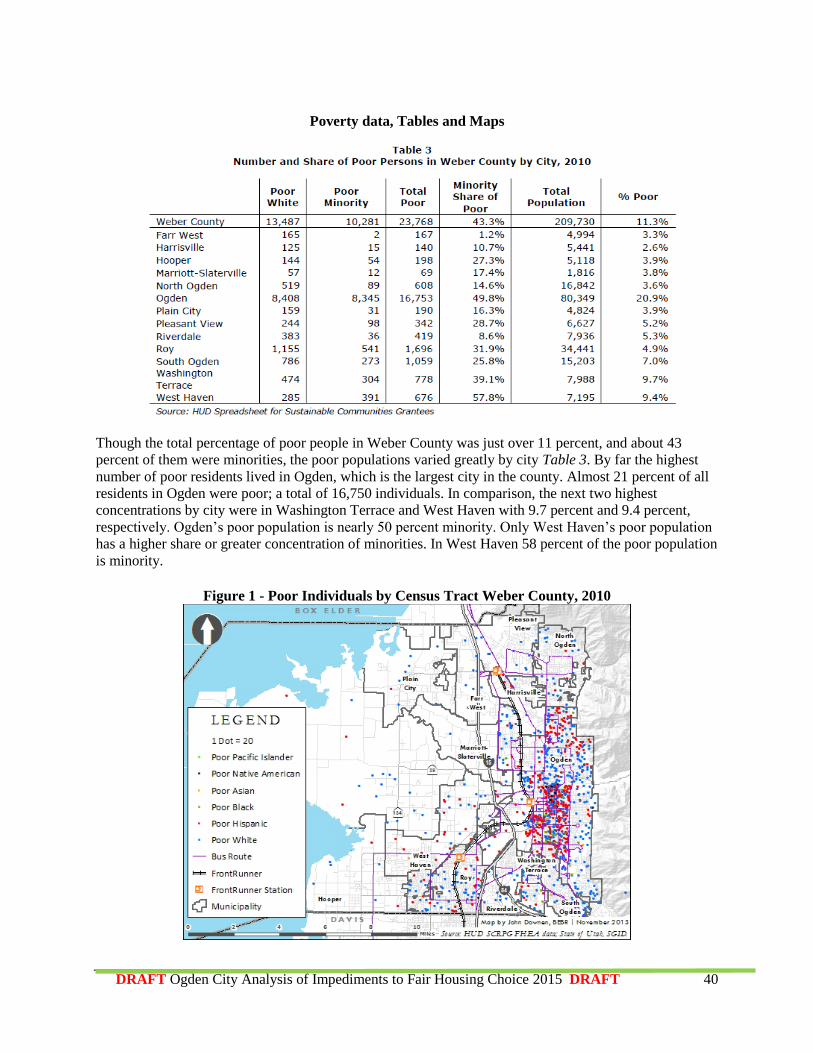
Though the total percentage of poor people in Weber County was just over 11 percent, and about 43
percent of them were minorities, the poor populations varied greatly by city Table 3. By far the highest
number of poor residents lived in Ogden, which is the largest city in the county. Almost 21 percent of all
residents in Ogden were poor; a total of 16,750 individuals. In comparison, the next two highest
concentrations by city were in Washington Terrace and West Haven with 9.7 percent and 9.4 percent,
respectively. Ogden’s poor population is nearly 50 percent minority. Only West Haven’s poor population
has a higher share or greater concentration of minorities. In West Haven 58 percent of the poor population
is minority.
Figure 1 - Poor Individuals by Census Tract Weber County, 2010
DRAFT Ogden City Analysis of Impediments to Fair Housing Choice 2015 DRAFT 41
Figure 1 maps the geographical location of poor residents living in Weber County by race and ethnicity in
2010. There are much larger concentrations of poor individuals living in the central cities, particularly the
south part of Ogden. In fact, the majority of both non-Hispanic whites and minority residents living below
the poverty line are located in Ogden. There are also some lighter concentrations in north Ogden, near
Harrisville. While the poor non-white Hispanic population of
Figure 2
RCAPs in Weber County
In order to determine an ethnically concentrated area of poverty (ECAP) the poor Hispanic tracts were
mapped Figure 3. This figure overlays the concentrations of poverty with tracts that have a Hispanic
population of 10 percentage points or more above the 16.1 percent Hispanic share of county’s population.
All tracts with large Hispanic shares are located within Ogden with the exception of a small area in South
Ogden. Large Hispanic populations are present in three tracts where the share of the population in poverty
is greater than three-times the county average, or 43.1 percent. These tracts meet the definition of an ECAP.
There are several tracts where the Hispanic share is 10 percent above the county average but these tracts do
not satisfy the poverty condition.
DRAFT Ogden City Analysis of Impediments to Fair Housing Choice 2015 DRAFT 42
Figure 3
Concentrations of Poverty and Hispanics by Tract in Weber County, 2007–2011
DRAFT Ogden City Analysis of Impediments to Fair Housing Choice 2015 DRAFT 43
Rent Assisted Maps and Tables
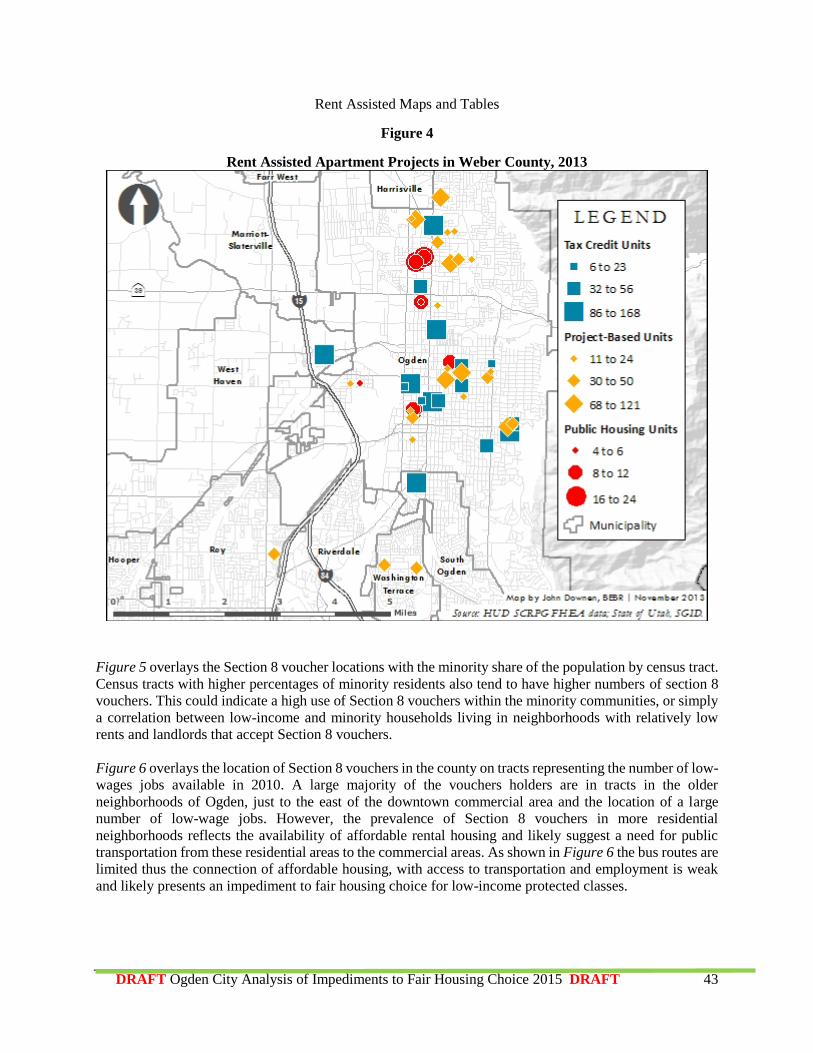
Figure 4
Rent Assisted Apartment Projects in Weber County, 2013
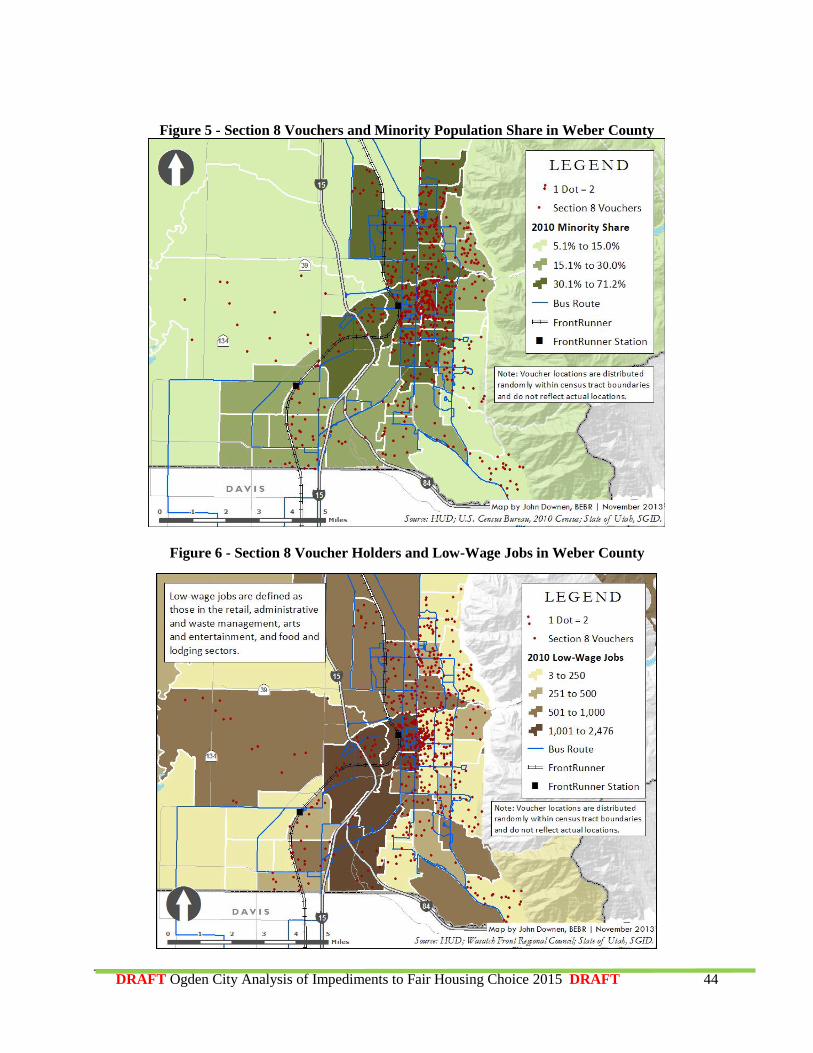
Figure 5 overlays the Section 8 voucher locations with the minority share of the population by census tract.
Census tracts with higher percentages of minority residents also tend to have higher numbers of section 8
vouchers. This could indicate a high use of Section 8 vouchers within the minority communities, or simply
a correlation between low-income and minority households living in neighborhoods with relatively low
rents and landlords that accept Section 8 vouchers.
Figure 6 overlays the location of Section 8 vouchers in the county on tracts representing the number of low-
wages jobs available in 2010. A large majority of the vouchers holders are in tracts in the older
neighborhoods of Ogden, just to the east of the downtown commercial area and the location of a large
number of low-wage jobs. However, the prevalence of Section 8 vouchers in more residential
neighborhoods reflects the availability of affordable rental housing and likely suggest a need for public
transportation from these residential areas to the commercial areas. As shown in Figure 6 the bus routes are
limited thus the connection of affordable housing, with access to transportation and employment is weak
and likely presents an impediment to fair housing choice for low-income protected classes.
DRAFT Ogden City Analysis of Impediments to Fair Housing Choice 2015 DRAFT 44
Figure 5 - Section 8 Vouchers and Minority Population Share in Weber County
Figure 6 - Section 8 Voucher Holders and Low-Wage Jobs in Weber County
DRAFT Ogden City Analysis of Impediments to Fair Housing Choice 2015 DRAFT 45
Fair Housing Complaints Tables
DRAFT Ogden City Analysis of Impediments to Fair Housing Choice 2015 DRAFT 46
DRAFT Ogden City Analysis of Impediments to Fair Housing Choice 2015 DRAFT 47
Mortgage Lending Analysis
Taken from Weber county Analsys Pages 38 – 47
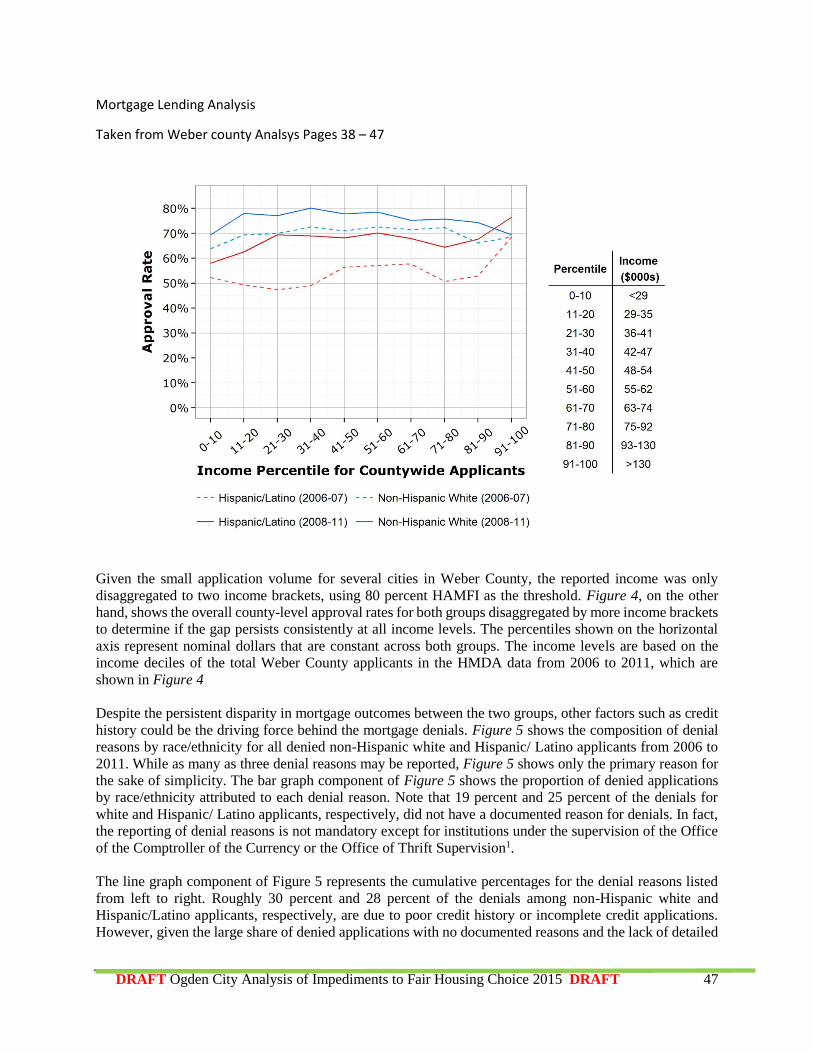
Given the small application volume for several cities in Weber County, the reported income was only
disaggregated to two income brackets, using 80 percent HAMFI as the threshold. Figure 4, on the other
hand, shows the overall county-level approval rates for both groups disaggregated by more income brackets
to determine if the gap persists consistently at all income levels. The percentiles shown on the horizontal
axis represent nominal dollars that are constant across both groups. The income levels are based on the
income deciles of the total Weber County applicants in the HMDA data from 2006 to 2011, which are
shown in Figure 4
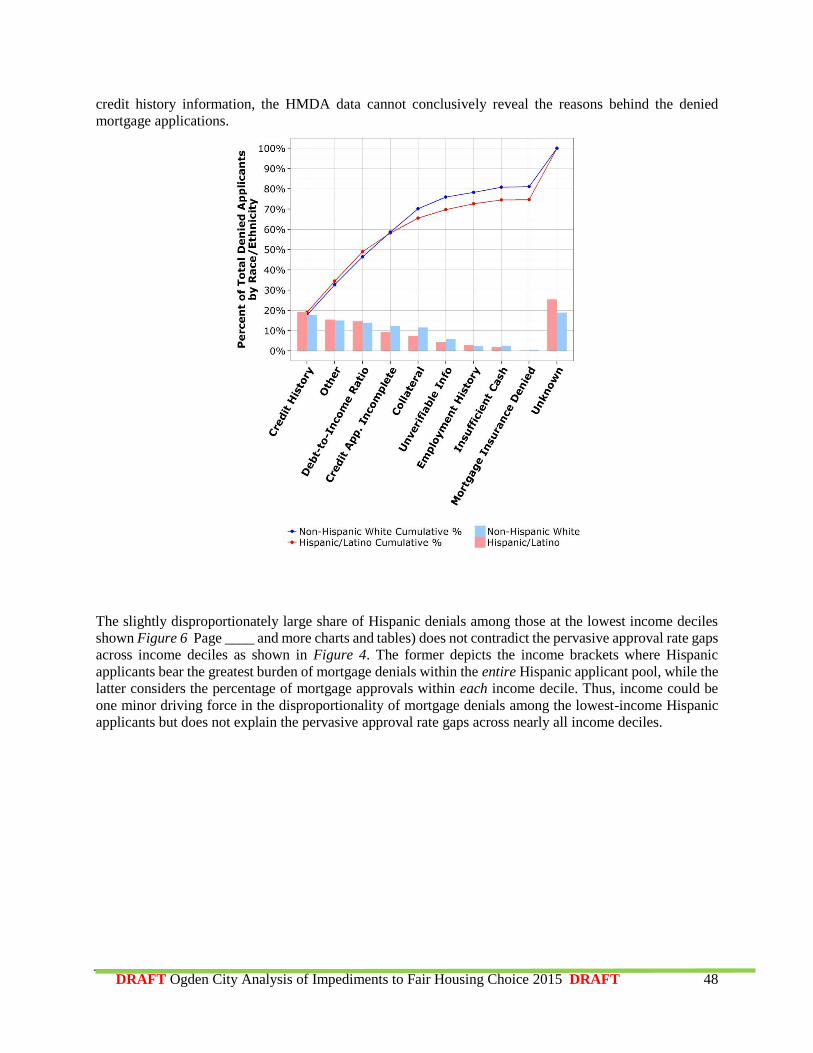
Despite the persistent disparity in mortgage outcomes between the two groups, other factors such as credit
history could be the driving force behind the mortgage denials. Figure 5 shows the composition of denial
reasons by race/ethnicity for all denied non-Hispanic white and Hispanic/ Latino applicants from 2006 to
2011. While as many as three denial reasons may be reported, Figure 5 shows only the primary reason for
the sake of simplicity. The bar graph component of Figure 5 shows the proportion of denied applications
by race/ethnicity attributed to each denial reason. Note that 19 percent and 25 percent of the denials for
white and Hispanic/ Latino applicants, respectively, did not have a documented reason for denials. In fact,
the reporting of denial reasons is not mandatory except for institutions under the supervision of the Office
of the Comptroller of the Currency or the Office of Thrift Supervision1.
The line graph component of Figure 5 represents the cumulative percentages for the denial reasons listed
from left to right. Roughly 30 percent and 28 percent of the denials among non-Hispanic white and
Hispanic/Latino applicants, respectively, are due to poor credit history or incomplete credit applications.
However, given the large share of denied applications with no documented reasons and the lack of detailed
DRAFT Ogden City Analysis of Impediments to Fair Housing Choice 2015 DRAFT 48
credit history information, the HMDA data cannot conclusively reveal the reasons behind the denied
mortgage applications.
The slightly disproportionately large share of Hispanic denials among those at the lowest income deciles
shown Figure 6 Page ____ and more charts and tables) does not contradict the pervasive approval rate gaps
across income deciles as shown in Figure 4. The former depicts the income brackets where Hispanic
applicants bear the greatest burden of mortgage denials within the entire Hispanic applicant pool, while the
latter considers the percentage of mortgage approvals within each income decile. Thus, income could be
one minor driving force in the disproportionality of mortgage denials among the lowest-income Hispanic
applicants but does not explain the pervasive approval rate gaps across nearly all income deciles.
DRAFT Ogden City Analysis of Impediments to Fair Housing Choice 2015 DRAFT 49
DRAFT Ogden City Analysis of Impediments to Fair Housing Choice 2015 DRAFT 50
DRAFT Ogden City Analysis of Impediments to Fair Housing Choice 2015 DRAFT 51
DRAFT Ogden City Analysis of Impediments to Fair Housing Choice 2015 DRAFT 52

DRAFT Ogden City Analysis of Impediments to Fair Housing Choice 2015 DRAFT 53
DRAFT Ogden City Analysis of Impediments to Fair Housing Choice 2015 DRAFT 54
DRAFT Ogden City Analysis of Impediments to Fair Housing Choice 2015 DRAFT 55
DRAFT Ogden City Analysis of Impediments to Fair Housing Choice 2015 DRAFT 56
DRAFT Ogden City Analysis of Impediments to Fair Housing Choice 2015 DRAFT 57
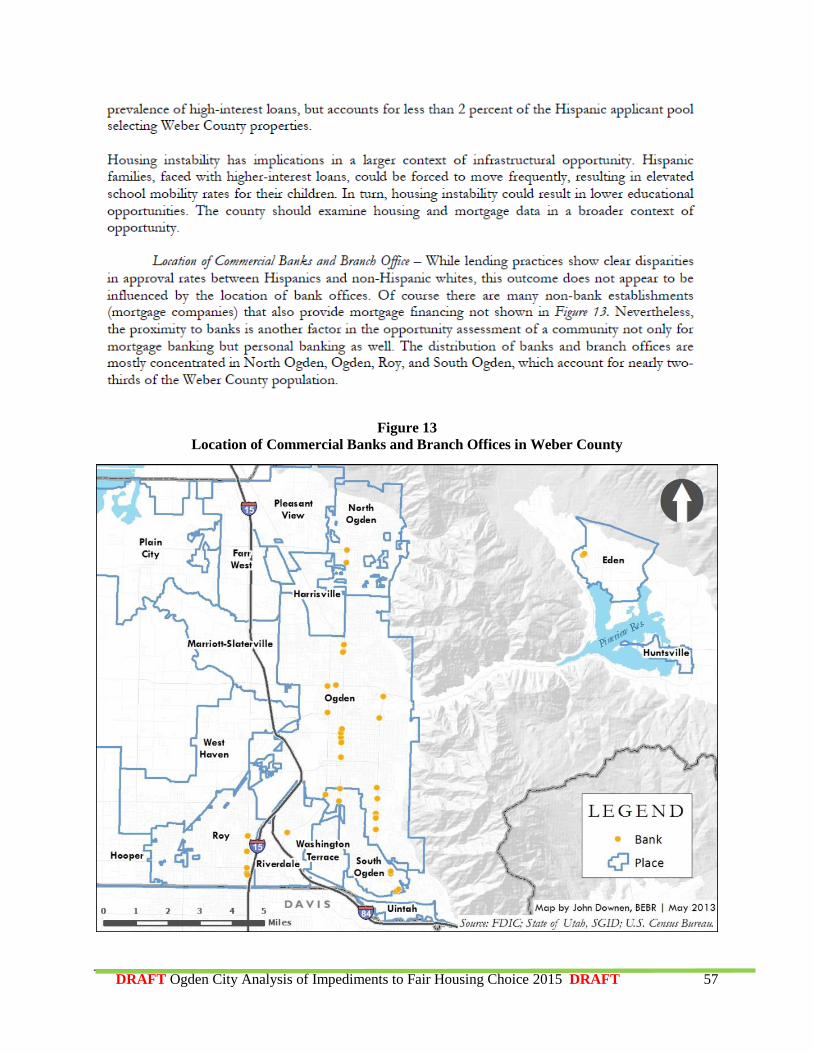
Figure 13
Location of Commercial Banks and Branch Offices in Weber County
DRAFT Ogden City Analysis of Impediments to Fair Housing Choice 2015 DRAFT 58


