Embed Size (px)
Citation preview
International Journal of Cardiology, 28 (1990) 51-66
Elsevier
57
CARD10 01081
Doppler echocardiography in aortic stenosis: feasibility and clinical impact
Clarence Shub, A. Jamil Tajik, David R. Holmes, Jr., Guy S. Reeder, William K. Freeman, Duane M. Ilstrup and Hugh C. Smith
Division of Cardiovascular Diseases and Internal Medicine and the Section of Biostatistics, Mayo Clinic and Mayo Foundation, Rochester,
Minnesota, U.S.A.
(Received 12 June 1989; revision accepted 2 February 1990)
Shub C, Tajik AJ, Holmes DR Jr, Reeder GS, Freeman WK, Ilstrup DM, Smith HC. Doppler echocardiography in aortic stenosis: feasibility and clinical impact. Int J Cardiol 1990;28:57-66.
The clinical utility of Doppler echocardiography for the assessment of aortic stenosis was prospectively studied in 425 consecutive patients referred to the echocardiography laboratory over 1 year with the clinical diagnosis of aortic stenosis. Optimal peak Doppler velocities were obtained in 405 (95%) patients of all ages. In 108 patients, the severity of aortic stenosis as determined by subsequent cardiac catheterization was compared with that found by Doppler assessment. Categorization of severity was concordant in 8 (89%) of 9 cases of mild aortic stenosis and in 28 (78%) of 36 cases of severe aortic stenosis, but there was considerable diagnostic overlap in cases of moderate stenosis. Forty-nine patients with mild aortic stenosis as determined clinically had moderate or severe stenosis as assessed by Doppler; 7 (14%) of these patients underwent subsequent replacement of the aortic valve. Increased aortic velocity, as determined by Doppler, was associated with a significant incidence of subsequent (mean follow-up period, 22 months) cardiac events (cardiac death, aortic valvar replacement, New York Heart Association functional class III or Iv). Patients with mild aortic stenosis as assessed by Doppler (peak aortic velocity < 2.5 m/set) had > 95% event-free survival at 1 year and rarely required cardiac catheterization. Conversely, only 45% of patients with severe aortic stenosis as determined by Doppler were free of a cardiovascular event at 1 year. Although the noninvasive assessment of aortic stenosis should ideally include determination of the area of the aortic valve and the mean aortic gradient by Doppler echocardiography, this is not always possible. Prognostic information derived from peak aortic velocity alone is clinically useful. It has the additional advantage that it is much less laborious and time-consuming to obtain and is obtainable in almost all (99%) patients.
Key words: Doppler echocardiography; Aortic stenosis
Introduction
Correspondence to: C. Shub, M.D., Mayo Clinic, 200 First Doppler echocardiography has been shown to Street SW. Rochester. MN 55905, U.S.A. provide reliable estimates of the severity of aortic
0167-5273/90/$03.50 0 1990 Elsevier Science Publishers B.V. (Biomedical Division)
58
stenosis [1,2]. The clinical utility and feasibility of the technique, however, have been evaluated in only relatively small numbers of patients [3], and the prognostic implications of Doppler-derived data in aortic stenosis have not been well defined. In 1985, we prospectively recorded Doppler echocardiographic data in all patients referred to our echocardiography laboratory with the clinical diagnosis of aortic stenosis. We then assessed the clinical implications of these data over a mean follow-up period of 22 months.
Materials and Methods
Patients and echocardiographic study
For this prospective study, all patients seen at the Mayo Clinic or an affiliated hospital who were referred to the echocardiography laboratory from January through December 1985 with a clinical diagnosis of aortic stenosis underwent a compre- hensive cross-sectional Doppler echocardiographic assessment. For each patient, there was a sys- tematic attempt to record peak aortic velocities from multiple sampling sites.
During the period of this study, the accuracy and significance of Doppler-derived determina- tions of the area of the aortic valve and the mean aortic gradient were still being validated in a sep- arate study at our institution [4] and were there- fore not included in this analysis.
M-mode echocardiographic measurements, as guided by cross-sectional images, of end-systolic and end-diastolic left ventricular internal dimen- sions and end-diastolic thicknesses of the ventricu- lar septum and left ventricular posterior wall were obtained according to the recommendations of the American Society of Echocardiography [5]. The left ventricular ejection fraction was calculated with a modification of the method of Quinones et al. [6]. When the left ventricular ejection fraction could not be measured, a visual assessment of global systolic function was made by the echo- cardiologist, and a left ventricular global systolic function score was derived, as follows: 1, normal (corresponding to left ventricular ejection fraction 2 50%); 2, mild reduction (ejection fraction, 40%
to 49%); 3, moderate reduction (ejection fraction, 26% to 39%); and 4, severe reduction (ejection fraction I 25%).
Left ventricular hypertrophy was diagnosed when left ventricular wall thicknesses exceeded normal ranges adjusted for age and body surface area [7]. Left ventricular mass was determined (for patients more than 21 years of age) with the method of Woythaler et al. [B].
The following peak aortic velocity ranges were used as general guidelines to establish categories of severity of aortic stenosis by Doppler assess- ment: mild, 2 1.8 but < 2.5 m/set; moderate, 2.5 to 4.4 m/set; and severe, 2 4.5 m/set. For purposes of analysis, peak aortic velocities were also divided into three nearly equal groups (terciles) on the basis of the maximal velocity obtained.
For patients undergoing cardiac catheteriza- tion, the area of the aortic valve was determined by the method of either Gorlin and Gorlin [9] (n = 57) or Hakki et al. [lo] (n = 51) or both. Because both methods showed a strong correlation (P < 0.001; mean difference = 0.014 when both methods were performed), the Gorlin method was used preferentially for data analysis. All Doppler studies were obtained before cardiac catheteriza- tion. The hemodynamic severity of aortic stenosis was classified according to the calculated area of the aortic valve as follows: mild (valvar area, 2 1.0 cm2), moderate (0.76 to 0.99 cm2), and severe (I 0.75 cm2). For patients undergoing coronary arteriography, coronary arterial disease was considered present when one or more major coronary vessels had one or more stenoses with narrowing of the luminal diameter of 2 70%.
At cardiac catheterization, ascending aortic and left ventricular pressures were measured simulta- neously using 7- or &French fluid-filled catheters and electromagnetic strain gauges. Care was taken to adjust gauges to zero at the beginning and end of each case. Most commonly, a double-lumen pigtail catheter with pressure ports above and below the aortic valve was used, although some patients had a transseptal approach for simulta- neous measurements of pressure. Cardiac output was determined with Cardio-Green dye. The re- sults of multiple injections were averaged.
Follow-up
59
Results
The majority of the patients returned to the Mayo Clinic and were followed by a review of their clinical records. For the remainder, follow-up was accomplished with a form letter or a tele- phone call to the patients or their referring physi- cians. For patients who had died, the cause of death was determined by a review of the autopsy data or death certificate or, when neither was available, by telephone contact with the local physician. Deaths were then categorized as being of cardiac, noncardiac, or unknown cause. For the purposes of analysis, (1) follow-up began with the date of the initial echocardiographic examination and (2) replacement of the aortic valve, New York Heart Association functional class III or IV status, and death were considered end points. Follow-up functional capacity was assessed according to New York Heart Association criteria. A subsequent “cardiac event” was defined as any of the follow- ing: cardiac death, aortic valve replacement, or a patient designated as functional class III or IV.
Statistical methods
Survival and survival free of cardiovascular events were estimated with the Kaplan-Meier method. Survival curves were compared with log- rank tests. The effect of continuous variables on survival was estimated with the Cox proportional hazards model. Survivorship was analyzed multi- variately with the Cox model.
Continuous variables were compared with two-sample r-test or with rank-sum tests when necessary. Ordinal variables were compared with rank-sum procedures.
Proportions were compared with x2 tests or with Fisher’s exact test. Discrete events were analyzed multivariately with a logistic multiple regression model. The associations of continuous and ordinal variables were estimated with Spear- man’s rank correlation coefficient. Paired continu- ous variables or changes in continuous variables with time were tested with paired t-tests or with signed-rank tests when needed. P values < 0.05 were considered statistically significant.
Of the 446 consecutive patients studied, 21 were excluded: 16 because they had both a normal aortic valve by echocardiography and normal Doppler peak aortic velocities (I 1.7 m/set) and 5 because adequate Doppler signals of the aortic valve could not be obtained. The final study group was composed of 425 patients; 284 were male and 141 were female. Their mean age was 68 + 13 years (range, 1 to 93 years); 13% were older than 80 years, and 0.4% were younger than 10 years. The mean body surface area for patients older than 10 years (determined in 413 patients) was 1.87 f 0.02 m2 (range, 1.30 to 2.52).
Doppler echocardiographic data
The average peak aortic velocity was 3.3 f 0.9 m/set (range, 1.8 to 6.0). The average velocity across the left ventricular outflow tract (pulsed- wave Doppler) in 170 patients was 1.03 f 0.4 m/set. Six patients with resting velocities > 2 m/set had dynamic obstruction of the outflow tract in addition to valvar aortic stenosis. The mean ratio of the velocity across the left ventricu- lar outflow tract (obtained with pulsed-wave Dop- pler) to peak aortic velocity (obtained with con- tinuous-wave Doppler) was 0.32 + 0.15.
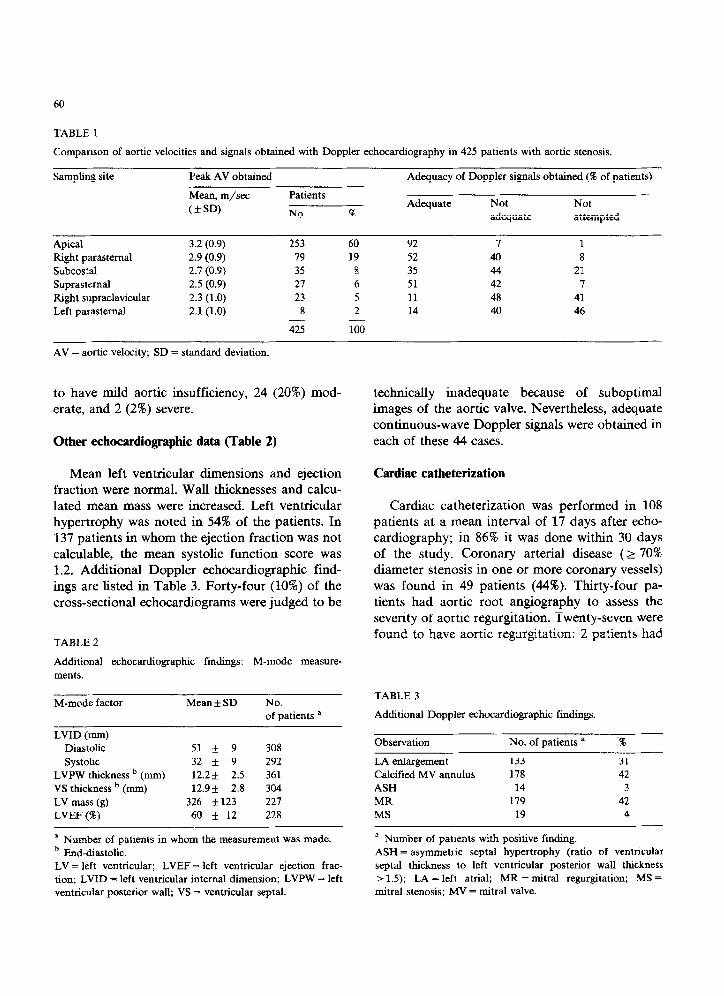
Twenty patients (5%) had suboptimal Doppler signals that were, nonetheless, thought to be usa- ble by the examiner for the overall assessment of the severity of aortic stenosis. In the 405 remain- ing patients (95%), optimal Doppler signals were obtained from one or more sites. The apical and right parasternal sites most often yielded the max- imal velocities (Table 1).
The composite Doppler assessment showed a wide spectrum of severity of aortic stenosis: mild in 137 patients (32%) moderate in 153 (36%), and severe in 135 (32%). Doppler echocardiography detected aortic insufficiency (with either continu- ous-wave or pulsed-wave study) in 283 patients (67%). Color flow imaging was not routinely per- formed as part of this study, but in the 120 patients in whom pulsed-wave mapping tech- niques [ll] were performed, 94 (78%) were thought
60
TABLE 1
Comparison of aortic velocities and signals obtained with Doppler echocardiography in 425 patients with aortic stenosis.
Sampling site Peak AV obtained Adequacy of Doppler signals obtained (W of patients)
Mean, m/xc
(*SD)
Apical
Right parasternal
Subcostal
Suprastemal
Right supraclavicular
Left parastemal
3.2 (0.9)
2.9 (0.9)
2.7 (0.9)
2.5 (0.9)
2.3 (1.0)
2.1 (1.0)
Patients
No. 5%
253 60
79 19
35 8
27 6
23 5
8 2 - - 425 100
Adequate
92
52
35
51
11
14
Not Not
adequate attempted
I 1
40 8
44 21
42 7
48 41
40 46
AV = aortic velocity; SD = standard deviation.
to have mild aortic insufficiency, 24 (20%) mod- erate, and 2 (2%) severe.
Other echocardiographic data (Table 2)
Mean left ventricular dimensions and ejection fraction were normal. Wall thicknesses and calcu- lated mean mass were increased. Left ventricular hypertrophy was noted in 54% of the patients. In 137 patients in whom the ejection fraction was not calculable, the mean systolic function score was 1.2. Additional Doppler echocardiographic find- ings are listed in Table 3. Forty-four (10%) of the cross-sectional echocardiograms were judged to be
TABLE 2
Additional echocardiographic findings: M-mode measure-
ments.
M-mode factor Mean f SD No. of patients a
LVID (mm)
Diastolic 51 * 9 308
systolic 32 + 9 292
LVPW thickness b (mm) 12.2+ 2.5 361
VS thickness b (mm) 12.9* 2.8 304
LV mass (g) 326 *123 227
LVEF (a) 60 f 12 228
’ Number of patients in whom the measurement was made.
b End-diastolic.
LV = left ventricular; LVEF = left ventricular ejection frac-
tion; LVID = left ventricular internal dimension; LVPW = left
ventricular posterior wall; VS = ventricular septal.
technically inadequate because of suboptimal images of the aortic valve. Nevertheless, adequate continuous-wave Doppler signals were obtained in each of these 44 cases.
Cardiac catheterization
Cardiac catheterization was performed in 108 patients at a mean interval of 17 days after echo- cardiography; in 86% it was done within 30 days of the study. Coronary arterial disease (2 70% diameter stenosis in one or more coronary vessels) was found in 49 patients (44%). Thirty-four pa- tients had aortic root angiography to assess the severity of aortic regurgitation. Twenty-seven were found to have aortic regurgitation: 2 patients had
TABLE 3
Additional Doppler echocardiographic findings.
Observation No. of patients a ‘%
LA enlargement 133 31
Calcified MV annulus 178 42
ASH 14 3
MR 179 42
MS 19 4
a Number of patients with positive finding.
ASH = asymmetric septal hypertrophy (ratio of ventncular
septal thickness to left ventricular posterior wall thickness
> 1.5); LA = left atrial; MR = mitral regurgitation; MS = mitral stenosis; MV = mitral valve.
61
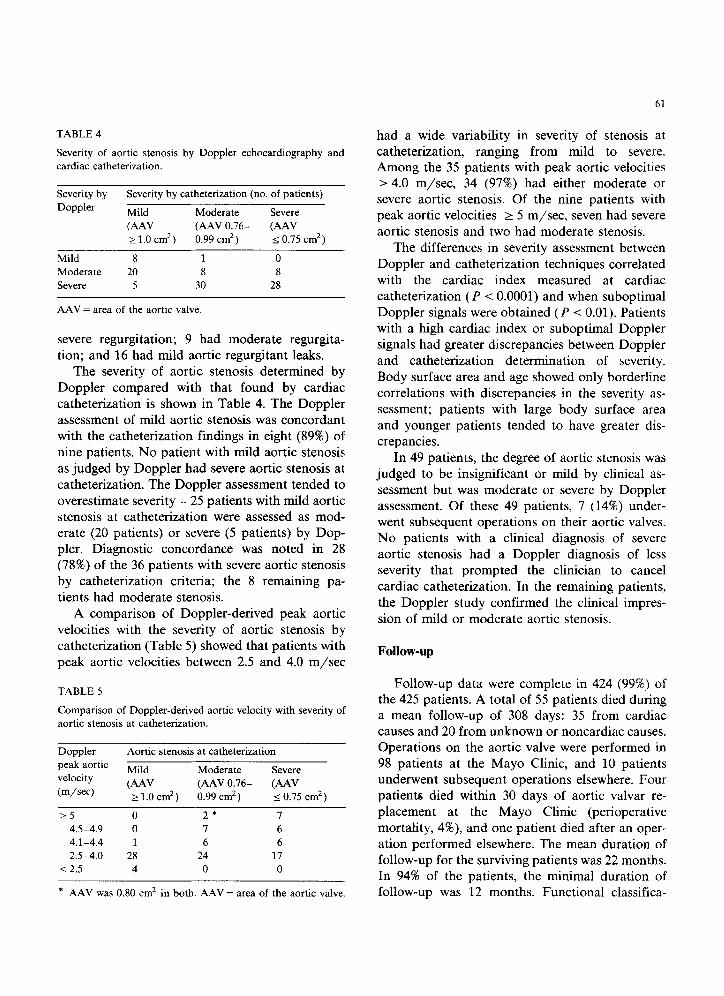
TABLE 4
Severity of aortic stenosis by Doppler echocardiography and
cardiac catheterization.
Severity by Severity by catheterization (no. of patients)
Doppler Mild Moderate Severe
NAV (AAV 0.76- (AAV 2 1.0 cm2) 0.99 cm2) IO.75 cm2)
Mild 8 1 0
Moderate 20 8 8
Severe 5 30 28
AAV = area of the aortic valve.
severe regurgitation; 9 had moderate regurgita- tion; and 16 had mild aortic regurgitant leaks.
The severity of aortic stenosis determined by
Doppler compared with that found by cardiac
catheterization is shown in Table 4. The Doppler assessment of mild aortic stenosis was concordant
with the catheterization findings in eight (89%) of
nine patients. No patient with mild aortic stenosis as judged by Doppler had severe aortic stenosis at
catheterization. The Doppler assessment tended to
overestimate severity - 25 patients with mild aortic stenosis at catheterization were assessed as mod- erate (20 patients) or severe (5 patients) by Dop- pler. Diagnostic concordance was noted in 28
(78%) of the 36 patients with severe aortic stenosis by catheterization criteria; the 8 remaining pa-
tients had moderate stenosis.
A comparison of Doppler-derived peak aortic
velocities with the severity of aortic stenosis by catheterization (Table 5) showed that patients with
peak aortic velocities between 2.5 and 4.0 m/set
TABLE 5
Comparison of Doppler-derived aortic velocity with severity of
aortic stenosis at catheterization.
Doppler
peak aortic
velocity
(m/se@
Aortic stenosis at catheterization
Mild Moderate Severe
(AAV (AAV 0.76- (AAV 2 1.0 cm’) 0.99 cm2) 5 0.75 cm*)
>_5 0 2* 7
4.5-4.9 0 7 6
4.1-4.4 1 6 6
2.5-4.0 28 24 17
< 2.5 4 0 0
* AAV was 0.80 cm* in both. AAV = area of the aortic valve.
had a wide variability in severity of stenosis at catheterization, ranging from mild to severe. Among the 35 patients with peak aortic velocities > 4.0 m/set, 34 (97%) had either moderate or severe aortic stenosis. Of the nine patients with peak aortic velocities 2 5 m/set, seven had severe
aortic stenosis and two had moderate stenosis.
The differences in severity assessment between
Doppler and catheterization techniques correlated with the cardiac index measured at cardiac
catheterization (P < 0.0001) and when suboptimal
Doppler signals were obtained (P -c 0.01). Patients with a high cardiac index or suboptimal Doppler signals had greater discrepancies between Doppler
and catheterization determination of severity.
Body surface area and age showed only borderline correlations with discrepancies in the severity as-
sessment; patients with large body surface area
and younger patients tended to have greater dis- crepancies.
In 49 patients, the degree of aortic stenosis was judged to be insignificant or mild by clinical as-
sessment but was moderate or severe by Doppler assessment. Of these 49 patients, 7 (14%) under- went subsequent operations on their aortic valves. No patients with a clinical diagnosis of severe
aortic stenosis had a Doppler diagnosis of less severity that prompted the clinician to cancel
cardiac catheterization. In the remaining patients,
the Doppler study confirmed the clinical impres-
sion of mild or moderate aortic stenosis.
Follow-up
Follow-up data were complete in 424 (99%) of the 425 patients. A total of 55 patients died during a mean follow-up of 308 days: 35 from cardiac causes and 20 from unknown or noncardiac causes. Operations on the aortic valve were performed in
98 patients at the Mayo Clinic, and 10 patients underwent subsequent operations elsewhere. Four patients died within 30 days of aortic valvar re-
placement at the Mayo Clinic (perioperative
mortality, 4%), and one patient died after an oper- ation performed elsewhere. The mean duration of follow-up for the surviving patients was 22 months.
In 94% of the patients, the minimal duration of follow-up was 12 months. Functional classifica-
62
20
Doppler severity ---Mild (n= 137) --Mod (n= 153) -Severe (n = 135)
01 I I
0 GUS
2
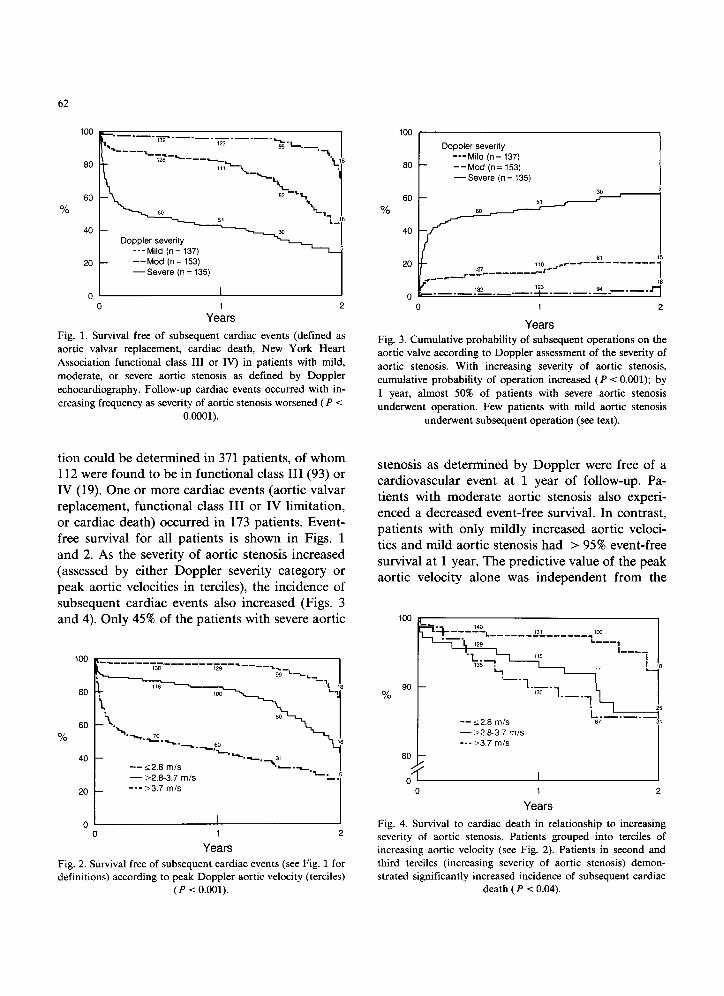
Fig. 1. Survival free of subsequent cardiac events (defined as
aortic valvar replacement, cardiac death, New York Heart
Association functional class III or IV) in patients with mild,
moderate, or severe aortic stenosis as defined by Doppler
echocardiography. Follow-up cardiac events occurred with in-
creasing frequency as severity of aortic stenosis worsened (P < O.OQOl).
tion could be determined in 371 patients, of whom 112 were found to be in functional class III (93) or IV (19). One or more cardiac events (aortic valvar replacement, functional class III or IV limitation, or cardiac death) occurred in 173 patients. Event- free survival for all patients is shown in Figs. 1 and 2. As the severity of aortic stenosis increased (assessed by either Doppler severity category or peak aortic velocities in terciles), the incidence of subsequent cardiac events also increased (Figs. 3 and 4). Only 45% of the patients with severe aortic
80
60
%
40
20
0
-- 12.8 m/s l .-__+
- >2.6-3.7 mls ‘L.
--- >3.7 m/s
0 1
Years 2
Fig. 2. Survival free of subsequent cardiac events (see Fig. 1 for definitions) according to peak Doppler aortic velocity (terciles)
(P < 0.001).
100 ( I
t
Doppler severity ---Mild (n = 137)
80 --Mod (n= 153) -Severe (n = 135)
%
rr_*-------___
0 1
Years
2
Fig. 3. Cumulative probability of subsequent operations on the
aortic valve according to Doppler assessment of the severity of
aortic stenosis. With increasing severity of aortic stenosis,
cumulative probability of operation increased (P < 0.001); by
1 year, almost 50% of patients with severe aortic stenosis
underwent operation. Few patients with mild aortic stenosis
underwent subsequent operation (see text).
stenosis as determined by Doppler were free of a cardiovascular event at 1 year of follow-up. Pa- tients with moderate aortic stenosis also experi- enced a decreased event-free survival. In contrast, patients with only mildly increased aortic veloci- ties and mild aortic stenosis had > 95% event-free survival at 1 year. The predictive value of the peak aortic velocity alone was independent from the
% go
60 I
t 0' 0 1
Years 2
Fig. 4. Survival to cardiac death in relationship to increasing severity of aortic stenosis. Patients grouped into terciles of
increasing aortic velocity (see Fig. 2). Patients in second and
third terciles (increasing severity of aortic stenosis) demon-
strated significantly increased incidence of subsequent cardiac death (P < 0.04).
63
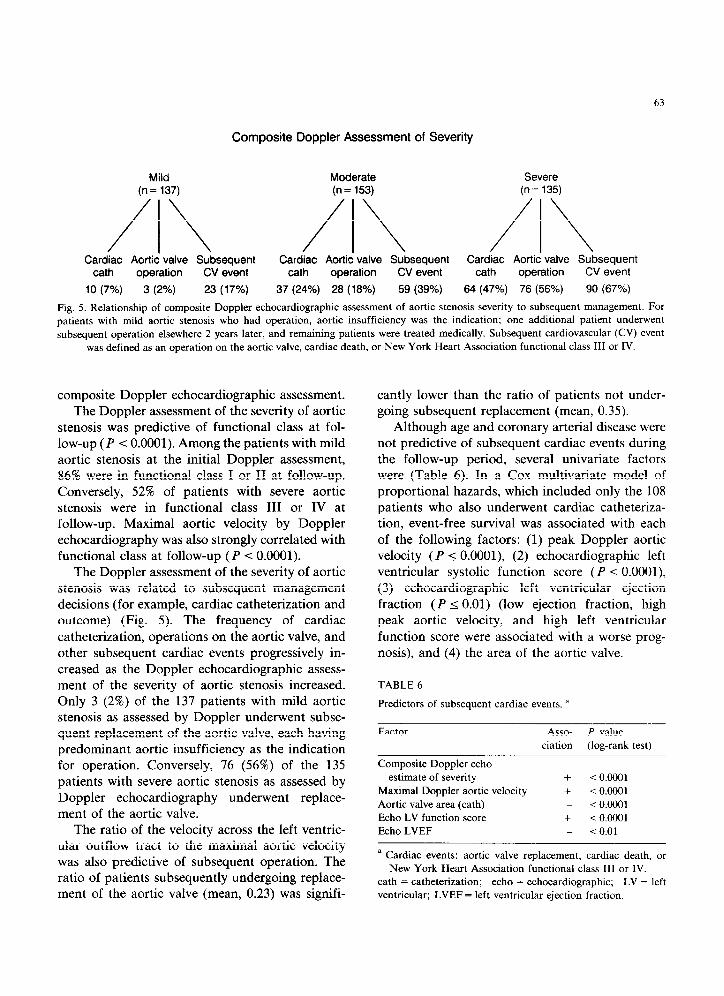
Composite Doppler Assessment of Severity
Mild Moderate Severe (n= 137) (n = 153) (n= 135)
/\ /\ /\ Cardiac Aortic valve Subsequent Cardiac Aortic valve Subsequent Cardiac Aortic valve Subsequent
cath operation CV event cath operation CV event cath operation CV event
10 (7%) 3 (2%) 23 (17%) 37 (24%) 28 (18%) 59 (39%) 84 (47%) 76 (56%) 90 (67%)
Fig. 5. Relationship of composite Doppler echocardiographic assessment of aortic stenosis severity to subsequent management. For patients with mild aortic stenosis who had operation, aortic insufficiency was the indication; one additional patient underwent
subsequent operation elsewhere 2 years later, and remaining patients were treated medically. Subsequent cardiovascular (CV) event
was defined as an operation on the aortic valve, cardiac death, or New York Heart Association functional class III or IV.
composite Doppler echocardiographic assessment. The Doppler assessment of the severity of aortic
stenosis was predictive of functional class at fol-
low-up (P < 0.0001). Among the patients with mild aortic stenosis at the initial Doppler assessment,
86% were in functional class I or II at follow-up. Conversely, 52% of patients with severe aortic stenosis were in functional class III or IV at follow-up. Maximal aortic velocity by Doppler
echocardiography was also strongly correlated with
functional class at follow-up (P < 0.0001). The Doppler assessment of the severity of aortic
stenosis was related to subsequent management decisions (for example, cardiac catheterization and
outcome) (Fig. 5). The frequency of cardiac
catheterization, operations on the aortic valve, and other subsequent cardiac events progressively in-
creased as the Doppler echocardiographic assess-
ment of the severity of aortic stenosis increased. Only 3 (2%) of the 137 patients with mild aortic stenosis as assessed by Doppler underwent subse- quent replacement of the aortic valve, each having predominant aortic insufficiency as the indication
for operation. Conversely, 76 (56%) of the 135 patients with severe aortic stenosis as assessed by
Doppler echocardiography underwent replace- ment of the aortic valve.
The ratio of the velocity across the left ventric- ular outflow tract to the maximal aortic velocity was also predictive of subsequent operation. The ratio of patients subsequently undergoing replace- ment of the aortic valve (mean, 0.23) was signifi-
cantly lower than the ratio of patients not under- going subsequent replacement (mean, 0.35).
Although age and coronary arterial disease were not predictive of subsequent cardiac events during the follow-up period, several univariate factors were (Table 6). In a Cox multivariate model of
proportional hazards, which included only the 108
patients who also underwent cardiac catheteriza- tion, event-free survival was associated with each
of the following factors: (1) peak Doppler aortic velocity (P I O.OOOl), (2) echocardiographic left ventricular systolic function score (P -c O.OOOl),
(3) echocardiographic left ventricular ejection
fraction (P I 0.01) (low ejection fraction, high
peak aortic velocity, and high left ventricular
function score were associated with a worse prog- nosis), and (4) the area of the aortic valve.
TABLE 6
Predictors of subsequent cardiac events. a
Factor Asso- P value
ciation (log-rank test)
Composite Doppler echo
estimate of severity + i 0.0001
Maximal Doppler aortic velocity + < 0.0001
Aortic valve area (cath) _ < 0.0001
Echo LV function score + < 0.0001
Echo LVEF _ < 0.01
a Cardiac events: aortic valve replacement. cardiac death, or
New York Heart Association functional class III or IV.
cath = catheterization; echo = echocardiographic; LV = left
ventricular; LVEF = left ventricular ejection fraction.
64
Discussion
This study demonstrates that optimal Doppler data concerning the velocity of the flow of blood
across the aortic valve can be obtained in 95% of a
consecutive, nonselected, prospectively studied
group of patients with a broad range of severity of aortic stenosis. The group consisted of both inpa- tients and outpatients with a wide range of age
and body size and included patients with poor cross-sectional echocardiographic images. Several previous studies [1,3,4] have demonstrated the
feasibility of the Doppler technique, but these
studies generally involved small numbers of selected patients and involved only one or two
examiners. In our study, 10 examiners were able
to obtain adequate Doppler data using several
different commercially available Doppler ma- chines - indicating that this technique has wide
applicability. In a previous study from our institution [2],
peak aortic velocities derived by Doppler in pa-
tients with aortic stenosis were obtained in the cardiac laboratory during cardiac catheterization
and demonstrated excellent correlation between
Doppler- and catheterization-determined maximal instantaneous and mean aortic gradients. Correla-
tion was not as good, however, when the Doppler
and cardiac catheterization studies were per- formed on different days. In the present study, Doppler examination and cardiac catheterization
were performed on different days in all patients. This may partly explain some of the apparent
discrepancies between the assessments of Doppler and severity by catheterization.
Some of the discrepancy in assessment of sever- ity can be attributed to the use of only Doppler
data concerning peak velocity [2,12,13]. Incorpo- rating a “flow term” into the assessment allows
the area of the aortic valve to be calculated relia- bly by Doppler echocardiographic techniques [4,14]. We now routinely calculate both the valvar area and the mean aortic gradient whenever possi- ble. Even if a dimension of the left ventricular outflow tract cannot be reliably measured by cross-sectional echocardiography, the ratio of the velocity across the left ventricular outflow tract to the peak aortic velocity has been shown to be
better than aortic velocity determined by continu- ous wave techniques alone for assessing severity [4]. In the present study, this ratio was shown to
be predictive of subsequent replacement of the aortic valve. This finding also confirms its useful-
ness from the prognostic standpoint. Six patients with increased velocities across the left ventricular
outflow tract (> 2 m/set) were thought to have dynamic left ventricular outflow tract obstruction in addition to valvar aortic stenosis. Identification of such patients is important because the gradient
may worsen postoperatively and management may be affected.
There are inherent difficulties with calculating the area of the aortic valve by cardiac catheteriza-
tion (used as the comparison standard in this
study), and the grouping of severity is arbitrary.
This hemodynamic categorization, nonetheless, is widely used in the assessment of aortic stenosis.
Recognizing these problems, we found that a Doppler echocardiographic diagnosis of mild aortic stenosis was concordant with catheteriza- tion assessment in 90% of cases. Furthermore, no
patient with mild aortic stenosis as assessed by
Doppler was subsequently shown to have severe aortic stenosis at cardiac catheterization. Con-
versely, most patients with peak aortic velocities > 4.0 m/set will have significant (moderate or
severe) aortic stenosis. As expected, factors that reflect left ventricular
hypertrophy (increased wall thickness and in-
creased left ventricular mass) were shown to corre- late with the severity of aortic stenosis as found at cardiac catheterization. The assessment of left
ventricular hypertrophy and the degree of aortic valvar calcification provide additional useful in- formation that should be incorporated into the
overall Doppler echocardiographic assessment of the severity of aortic stenosis.
Clinical Impact
In this study, the referring physicians used the Doppler echocardiographic data to confirm the clinical diagnosis of noncritical aortic stenosis in most cases, thereby deferring cardiac catheteriza- tion. Patients who were asymptomatic were fol-
lowed. A significant minority of patients, nonethe-
less, had severe disease of the aortic valve that was clinically unsuspected, and management was al- tered even to the point of replacing the aortic valve. No patients with a clinical diagnosis of
severe aortic stenosis had cardiac catheterization cancelled because the cross-sectional echocardio-
graphic and Doppler study indicated a lesser de- gree of severity.
In the present study, the presence of increased
peak aortic velocities was associated with lowered event-free survival over a relatively short duration of follow-up, and event-free survival progressively
decreased as severity assessed by Doppler in-
creased (as determined either by composite Dop-
pler assessment or by increased aortic velocity
alone). Doppler echocardiography is another method to demonstrate that, the worse the severity
of aortic stenosis, the poorer the prognosis. Even though determination of the area of the aortic valve is the preferred method of assessing the severity of aortic stenosis, the calculation of the valvar area can be difficult in some patients, espe-
cially when the dimensions of the left ventricular outflow tract cannot reliably be measured. Peak
aortic velocity, however, can be easily measured in
almost all patients and provides useful indepen-
dent prognostic information. In view of the excellent prdgnosis of patients
with mild aortic stenosis (approximately a third of
our patients), we believe that most of these pa- tients can safely be followed with periodic clinical reassessment and serial Doppler echocardiogra-
phy, especially if they are asymptomatic. Patients with Doppler-derived peak aortic velocities in the
“intermediate” range (2.5 to 4.4 m/set) have a poorer prognosis and should undergo further as-
sessment, including determination of the Doppler-derived mean aortic gradient and the area
of the aortic valve or cardiac catheterization [4,12,14]. This approach is in general agreement
with previous reports that used the mean aortic gradient as the discriminant factor [12,15].
In summary, Doppler assessment of peak aortic velocity is feasible in almost all patients with aortic stenosis. The technique non-invasively pro- vides prognostic information that allows stratifica-
65
tion of patients into a low-risk group that can be followed safely and a higher-risk group that needs further assessment.
1
2
3
4
5
6
I
8
9
10
11
12
13
References
Hegrenzs L. Hatle L. Aortic stenosis in adults: non-inva-
sive estimation of pressure differences by continuous wave
Doppler echocardiography. Br Heart J 1985;54:396-404.
Currie PJ. Seward JB. Reeder GS, et al. Continuous-wave
Doppler echocardiographic assessment of severity of calcific
aortic stenosis: a simultaneous Doppler-catheter correlative
study in 100 adult patients. Circulation 1985:71:1162-1169.
Williams GA, Labovitz AJ, Nelson JG, Kennedy HL. Value
of multiple echocardiographic views in the evaluation of
aortic stenosis in adults by continuous-wave Doppler. Am J
Cardiol 1985;55:445-449.
Oh JK, Taliercio CP, Holmes DR Jr, et al. Prediction of the
severity of aortic stenosis by Doppler aortic valve area
determination: prospective Doppler-catheterization correla-
tion in 100 patients. J Am Co11 Cardiol 1988:11:1227-1234.
Sahn DJ, DeMaria A, Kiss10 J. Weyman A. Recommenda-
tions regarding quantitation in M-mode echocardiography:
results of a survey of echocardiographic measurements.
Circulation 1978;58:1072-1083.
Quinones MA, Waggoner AD, Reduto LA. et al. A new,
simplified and accurate method for determining ejection
fraction with two-dimensional echocardiography. Circula-
tion 1981;64:744-753.
Gardin JM, Henry WL, Savage DD. Ware JH. Burn C,
Borer JS. Echocardiographic measurements in normal sub-
jects: evaluation of an adult population without clinically
apparent heart disease. J Clin Ultrasound 1979:7:439-447.
Woythaler JN, Singer SL, Kwan OL, et al. Accuracy of
echocardiography versus electrocardiography in detecting
left ventricular hypertrophy: comparison with postmortem
mass measurements. J Am Co11 Cardiol 1983:2:305-313.
Gorlin R, Gorlin SG. Hydraulic formula for calculation of
the area of the stenotic mitral valve. other cardiac valves,
and central circulatory shunts. I. Am Heart J 1951:41:1-29.
Hakki A-H, Iskandrian AS. Bemis CE, et al. A simplified
valve formula for the calculation of stenotic cardiac valve
areas. Circulation 1981;63:1050-1055.
Ciobanu M, Abbasi AS, Allen M, Hermer A. Spellberg R.
Pulsed Doppler echocardiography in the diagnosis and
estimation of severity- of aortic insufficiency. Am J Cardiol
1982;49:339-343.
Krafchek J. Robertson JH, Radford M. Adams D. Kisslo J.
A reconsideration of Doppler assessed gradients in sus-
pected aortic stenosis. Am Heart J 1985;110:765-773.
Smith MD, Dawson PL. Elion JL, et al. Systematic correla-
tion of continuous-wave Doppler and hemodynamic mea-
surements in patients with aortic stenosis. Am Heart J
1986;111:245-252.

66
14 Otto CM, Pearlman AS, Comess KA, Reamer RP, Janko 15 Yeager M, Yock PG, Popp RL. Comparison of Doppler-
CL, Huntsman LL. Determination of the stenotic aortic derived pressure gradient to that determined at cardiac
valve area in adults using Doppler echocardiography. J Am catheterization in adults with aortic valve stenosis: implica-
Co11 Cardiol 1986;7:509-517. tions for management. Am J Cardiol 1986;57:644-648.


