Embed Size (px)
Citation preview
Electronic copy available at: http://ssrn.com/abstract=2361691
! 1!
Doing Well by Doing Good:
The Impact of Foreign Aid on Foreign Public Opinion*
Benjamin E. Goldsmith† Yusaku Horiuchi‡ Terence Wood§
First Draft: February 20, 2012
Last Update: January 31, 2014
Word Count (Text): 10,303
!!!!!!!!!!!!!!!!!!!!!!!!!!!!!!!!!!!!!!!!!!!!!!!!!!!!!!!!* Earlier drafts were presented at the Annual Conference on the 2011 Workshop on the
Frontiers of Statistical Analysis and Formal Theory of Political Science (Tokyo, Japan,
January 6-7, 2011), a workshop on empirical political analysis at the Australia National
University (Canberra, Australia, May 10, 2012), the Second Annual General Conference
of the European Political Science Association (Berlin, Germany, June 21-23, 2012), the
Fifth Oceanic Conference on International Studies (Sydney, Australia, July 18-20, 2012),
and in a seminar at Dartmouth College (Hanover, USA, October 12, 2012). We thank
Geoff Brennan, Steve Brooks, Alison Cumming Thom, Linda Fowler, Michael Herron,
Kosuke Imai, Mike Miller, Jo Spratt, Carrie Steel, Matt Winters, Ippei Yamamoto, and
other participants of the above workshops, conferences, and seminars for useful
comments. We also thank Gallup Inc. for providing us their data. † Associate Professor, Department of Government and International Relations, the
University of Sydney. Email: [email protected]. ‡ Associate Professor and the Mitsui Chair in the Study of Japan, Department of
Government, Dartmouth College. Email: [email protected]. § Ph.D. Candidate, School of International, Political and Strategic Studies, the Australian
National University. Email: [email protected].
Electronic copy available at: http://ssrn.com/abstract=2361691
! 2!
Abstract
Does foreign aid extended by one country improve that country’s image
among populations of recipient countries? Using a multinational survey,
we show that a United States aid program targeted to address HIV and
AIDS substantially improves perceptions of the U.S. Our identification
strategy for causal inference is to use instrumental variables measuring the
magnitude of the HIV/AIDS problem in aid recipient countries. Our
finding implies that in addition to its potential humanitarian benefits,
foreign aid that is targeted, sustained, effective, and visible can serve an
important strategic goal for those countries that give it: fostering positive
perceptions among foreign publics. By doing good, a country can do well.
Keywords: foreign aid, U.S. foreign policy, HIV, AIDS, PEPFAR, public
opinion, instrumental variables
! 3!
Competition between major powers such as the United States (U.S.) and China for
favorable perceptions in global public opinion is increasingly evident today and likely to
be a pivotal feature of the emerging international order (Friedberg 2010; Gill and Huang
2006; Kurlantzick 2007; Nye 2004; Shambaugh 2008). These countries are eager to
develop positive images of themselves among foreign publics, because such images are
considered important for achieving a range of objectives in foreign relations (Bustamante
and Sweig 2008; Goldsmith and Horiuchi 2012; Nye 2004). Among potential tools states
may use to win hearts and minds abroad, foreign aid is often claimed to be effective
(American Political Science Association 2009).1
In the context of this intensifying competition for positive images among global
publics, in 2003, under the Bush Administration, the U.S. established a foreign aid
program called the President’s Emergency Plan for AIDS Relief (PEPFAR), which has
been provided to more than 80 developing countries. Its declared objectives include
stopping the spread of HIV and AIDS, supporting the treatment of people suffering from
HIV and AIDS, and mitigating the indirect consequences of the epidemic.2
!!!!!!!!!!!!!!!!!!!!!!!!!!!!!!!!!!!!!!!!!!!!!!!!!!!!!!!!1 States may use other tools, such as public diplomacy, for the same reason (Goldsmith
and Horiuchi 2009). In this paper, we use the term “foreign aid” (or simply “aid”) as a
synonym for Official Development Assistance as defined and measured by the
Organisation for Economic Co-operation and Development’s Development Co-operation
Directorate. Importantly, this definition does not include military aid.
2 Funding for PEPFAR was re-authorized in 2008 and it has continued to receive support
under the Obama administration, although in a modified form integrated into a broader
plan for improving global health outcomes, and with funding levels no longer increasing.
! 4!
As then Secretary of State Condoleezza Rice emphasized in her speech at the
release of the Fifth Annual Report to Congress on PEPFAR on January 12, 2008, the U.S.
government believes that PEPFAR has contributed not only to addressing global health
problems but also to improving the U.S. image among publics in recipient countries. Yet,
while claims such as this are common, they appear to be based on speculation or
anecdotal evidence. Empirically, work on the impact of aid – and more specifically,
PEPFAR – on public opinion is scarce. There is little available systematic evidence
suggesting that foreign aid improves donor image amongst populations of countries
receiving the aid.
In this article, we provide compelling evidence that PEPFAR has, indeed,
positively affected how publics in recipient countries regard the U.S. We emphasize two
key implications of this finding.
First, it suggests what types of aid, under what conditions, might be effective in
influencing foreign public opinion about the donor. Specifically, our theory is that foreign
aid that is targeted, sustained, effective, and visible is more likely to affect mass opinion.
Recent studies suggest that aid can be effective at encouraging economic growth in
recipient countries, although such positive findings remain contested (for example,
Doucouliagos and Paldam 2013). Specifically, they suggest that aid promotes economic
growth, under certain conditions, at the national (Arndt et al. 2010; Dalgaard and Tarp
2004; Wright 2010) or global (Headey 2008) levels; and that the effects of aid are
observable over multi-year time periods (Headey 2008; Minoiu and Reddy 2010). While
much of the existing empirical debate focuses on the economic impacts of foreign aid,
our refined theory of aid effectiveness sheds light on the comparatively under-
! 5!
investigated area of aid’s impact on public opinion in recipient countries. This has
practical ramifications for international relations, because, as Goldsmith and Horiuchi
(2012) show, changes in public opinion within Country B about Country A can influence
Country B’s foreign policy behavior toward Country A.
Second, if foreign aid programs have such political ramifications, we suggest a
possible virtuous circle or race-to-the-top dynamic for the emerging global order. As
great powers, especially the U.S. and China, are increasingly constrained by the costs that
militarized conflicts would impose on their trade and investment interests, they may
increasingly seek to pursue their international interests through currying favor among
foreign elites and publics. Foreign aid is an obvious potential tool for this. If targeted,
sustained, effective, and visible aid gives the best chance of influence, this may compel
great powers to actually do good, and to be seen to be doing so, in order to do well in
their global competition for influence.
Despite the importance of understanding this sort of impact of foreign aid on
public opinion in recipient countries, there have not been many empirical investigations
on this topic. This is likely in part due to a methodological challenge researchers
inevitably encounter when answering the question of whether an aid program like
PEPFAR actually affects opinion about a donor in recipient countries. This difficulty
arises because donors never allocate foreign aid across countries at random. Therefore,
causal estimates based on naïve regression analysis are likely to be biased due to the
possibility that a donor may determine the amounts to be allocated to individual countries
based partly on existing public opinion about the donor in these recipient countries or, as
! 6!
much of the existing literature suggests, based on other political or strategic
considerations, which are typically unobservable or difficult to measure.
In this paper, we tackle this methodological problem and present systematic new
evidence. Specifically, our identification strategy for causal inference is to use
instrumental variables measuring the magnitude of the HIV/AIDS problem in aid
recipient countries. These instruments are strongly correlated with the amount of
PEPFAR funding allocated across countries, but are likely to be uncorrelated with
unobserved heterogeneity (conditional on a set of observable pre-treatment covariates).
By using a large multinational survey with a battery of questions, we also undertake
multiple placebo tests and examine whether the treatment variable has a significant effect
only on public opinion about the U.S. but not on public opinion about other countries.
The results of our analysis show that PEPFAR substantially improves perceptions
of the U.S. in recipient countries, and they are robust to model specifications. Our finding
implies that in addition to its potential humanitarian benefits, under certain conditions,
foreign aid can serve an important strategic goal for those countries that give it: fostering
positive perceptions among foreign publics. By doing good, a country can do well.
Does Foreign Aid Affect Foreign Public Opinion?
There exist a range of reasons why countries give foreign aid. It may be given
altruistically to improve economic and social well-being in developing countries, as
advocated by Sachs (2005) and practiced to a significant extent by some Northern
European countries (Berthélemy 2006; Gates and Hoeffler 2004; Hoeffler and Outram
2011). Alternatively, foreign aid may be used as a tool of direct leverage over political
elites to advance commercial or foreign policy goals important to the donor (Alesina and
! 7!
Dollar 2000; Browne 2006, Chap. 6; Dreher et al. 2008; Dreher et al. 2011; Kuziemko
and Werker 2006; Radelet 2006; Vreeland 2011; Wang 1999). Finally, foreign aid may
be provided at least in part in the hope of creating favorable public perceptions of the
donor in recipient countries.
The purpose of this paper is to examine the effectiveness of the latter objective of
foreign aid, for the case of PEPFAR. In doing this, we complement the existing
literatures on aid effectiveness, which examine whether aid delivers development benefits
to recipient countries (for example, Arndt and Tarp 2010; Burnside and Dollar 2000;
Dalgaard and Tarp 2004; Doucouliagos and Paldam 2013; Dreher et al. 2008b; Feeny and
de Silva 2012; Headey 2008; Miniou and Reddy 2010; Mekasha and Tarp 2013; Mishra
and Newhouse 2009; Rajan and Subramanian 2008) and whether aid delivers direct geo-
strategic benefits to donors (for example, Dreher and Strum 2012; Milner and Tingley
2013; Nowak-Lehmann et al. 2009; Vreeland 2011).
Theoretically, it is plausible that by instilling gratitude in those it helps or through
promoting an image of positive action, compassion and generosity, foreign aid may
create or strengthen positive perceptions of donor nations in recipient countries. But there
are also reasons to suspect that foreign aid could be an ineffective tool of influence
(Adelman 2011; Lindsay 2011). Recipients may be unaware of the origins of the aid they
receive; the donor’s motivations might be seen as primarily self-serving; the positive
feelings associated with aid may be too small to shift perceptions shaped by more salient
and dramatic foreign policy behavior; or aid programs may simply fail to work and,
therefore, fail to sway people’s opinions in the absence of obvious improvements to their
quality of life.
! 8!
To date there are only a limited number of empirical studies examining these
theoretical possibilities. Furthermore, they are often based on single cases and
consequently tend to suffer from a lack of generalizability, or do not fully control for
confounding factors that might render their conclusions invalid. In the following, we
summarize the literature before providing further details on PEPFAR and discussing its
potential as a means of fostering improved opinion.
The Existing Literature
Most of the existing studies that examine aid’s impact on opinion have been within-
country case studies. They include studies focusing on U.S. hearts and minds campaigns
in conflict zones, such as Iraq and Afghanistan, as well as studies focusing on disaster
relief aid after the 2004 Indian Ocean tsunami, the 2005 Pakistan earthquake, or the 2011
earthquake and tsunami in Japan (these are discussed in more detail in the following
paragraphs). One statistical paper by Goldsmith, Horiuchi, and Inoguchi (2005) takes a
comparative, cross-national perspective, using data from a variety of countries. It is,
however, not focused on estimating the effects of a specific foreign aid program. Rather,
foreign aid variables are included among a range of independent variables expected to
affect post-9/11 international opinion about U.S. foreign policy. Overall, these previous
studies on the impacts of foreign aid on public opinion about donors in recipient countries
provide mixed results.
A series of qualitative studies has been undertaken through the Feinstein Center at
Tufts University, looking at perceptions of aid donors in Kenya and Afghanistan
(Bradbury and Kleinman 2010; Fishstein 2010; Gompelman 2011; Gordon 2011). While
there is some variation across field sites, these studies generally find that aid is
! 9!
ineffective in positively influencing recipients’ perceptions of donors. Importantly,
although the Feinstein Center work is thorough and detailed, the external validity of their
findings is questionable because their qualitatively oriented studies are based on samples
that tend to be small. Furthermore, there is little basis for expecting that similar results to
be found in cases beyond the immediate context of Afghanistan and conflict
environments.
The generally pessimistic findings of the Feinstein Center studies are consistent
with the finding of a large-N quantitative study, also undertaken in Afghanistan,
associated with an evaluation of German aid (Böhnke, Koehler and Zürcher, 2010). This
study found a weak but statistically significant association between foreign aid and public
opinion about the foreign peace-building work. However, this positive relationship
disappeared when the survey, originally conducted in 2007, was repeated in 2009.
In a study of aid’s impact on attitudes in the wake of the 2005 Pakistan
earthquake, Andrabi and Das (2010) suggest that exposure to foreign assistance had a
long-lasting and statistically significant impact on affected villagers’ trust of foreigners.
At the same time, however, the authors found that positive perceptions tapered off as
distance from the fault line increased, suggesting that the impact was localized among
those who benefitted directly from the aid or who came from communities that benefitted.
Outside of academia, changes in surveyed public opinion over time have also
been claimed as evidence of aid’s ability to improve public opinion. Commonly cited
cases are high-profile U.S. disaster relief aid after the 2004 Indian Ocean tsunami, the
2005 earthquake in Pakistan, and the 2011 earthquake and tsunami in Japan. In all
instances, various polls (McCawley 2006; Terror Free Tomorrow 2005; Terror Free
! 10!
Tomorrow 2006; Wike 2012) show that opinions of the U.S. improved in assisted
countries. While such eye-ball studies of before and after comparisons lack the rigor of
careful statistical analysis and thus their findings might potentially be spurious, the
magnitude and timing of the change in opinion are suggestive. In the case of the Pakistan
earthquake, though, changes may have only been transient, with opinions of the U.S.
returning to pre-quake levels relatively rapidly (Kinder 2010).
Is PEPFAR Effective?
The mixed findings of these studies may in part stem from differing impacts associated
with different types of aid. Because foreign aid is given in different forms and in different
contexts, it is unlikely that all forms of aid will improve public opinion. PEPFAR differs
from those aid programs previously studied in that it is an ongoing aid program, as
opposed to a response to a natural disaster or aid extended during a military conflict, and
it is given across numerous countries and contexts. Accordingly, its impacts might quite
reasonably be different from those found in other studies.
PEPFAR comprises a substantial share of the U.S. development aid budget
(approximately 15% in 2009). Although the total amount of U.S. development aid itself is
small when contrasted with the total spending the U.S. devotes to the military and other
foreign policy activities,3 we argue that PEPFAR could nevertheless have positive
perceptual “externalities” (indirect effects in a separate policy realm) for the following
four reasons.
!!!!!!!!!!!!!!!!!!!!!!!!!!!!!!!!!!!!!!!!!!!!!!!!!!!!!!!!3 In 2008, total U.S. aid spending was 0.18% of the country’s Gross National Income
(GNI), compared to military spending of 4.32% of GNI. However, due to the size of its
economy, the U.S. also donates the largest amount of aid globally (Radelet 2006).
! 11!
First, it is targeted at a critical need. The proportion of direct and indirect
PEPFAR beneficiaries in the population of a recipient country is expected to be fairly
large, particularly in the countries worst affected by HIV and AIDS. This is due to the
scale of the HIV and AIDS epidemic. In those countries, the illness has had a major
adverse impact on the lives of a significant portion of the population. In Botswana, for
example, about a quarter of the population aged between 15 and 49 was HIV positive in
2009. This figure is high enough to ensure that the disease also impacts many of those not
living with HIV and AIDS themselves, as even non-sufferers are likely to have relatives
or friends suffering from HIV and AIDS. Moreover, many of the poorest countries
receiving PEPFAR funding had, prior to the arrival of large-scale aid, been almost
completely unable to provide anti-retroviral therapy (ART) to HIV and AIDS sufferers.
But the provision of PEPFAR (and other similar funding) has significantly changed this
situation.
Second, PEPFAR aid is sustained over a considerable period of time, which may
increase perceptions of genuine commitment by the donor among recipient populations. It
also allows for information about the effects of the aid and its source to become more
firmly embedded in public perceptions due to repeated exposure to information about
PEPFAR. This should operate through basic cognitive “priming” mechanisms (Kolb and
Whishaw 2008), and also through gradual social spread of awareness via word of mouth.
Third, PEPFAR appears to have been effective in reducing the adverse impacts of
HIV and AIDS. The U.S. has made considerable efforts to ensure that PEPFAR has been
a well-run aid program (El-Sadr et al. 2012; Sepulveda et al. 2007; Simonds, Carrino, and
Moloney-Kitts 2012). Its objectives are well specified and misuse of the funds by
! 12!
recipients is minimized, if not completely eliminated, through careful monitoring. Indeed,
the 2011 WHO/UNAIDS Global HIV/AIDS Response Progress Report argues that the
major reason for the decline in AIDS deaths in 2010 since the peak year in 2005 was
PEPFAR (Cumming 2012), and at least two academic studies provide evidence
suggesting that PEPFAR has had positive health impacts. Bendavid and Bhattacharya
(2009) found that PEPFAR funding has significantly reduced HIV and AIDS related
mortality. Nunnenkamp and Öhler (2011) found that U.S. bilateral HIV funding
(essentially PEPFAR) has a significant impact on HIV related deaths.
Finally, PEPFAR is well publicized and thus visible among publics. The U.S. has
made sure that the fund has a high profile in recipient countries as “the leading platform
for US health diplomacy and a symbol of American capacity to achieve constructive and
beneficial change” (Collins et al. 2012, 1578). The U.S. has carefully and deliberately
branded PEPFAR funded work to “ensure appropriate recognition for U.S. programs and
contributions” (PEPFAR 2012, 2). The stars and stripes of the U.S. flag are a prominent
feature of the PEPFAR logo, and the signing of PEPFAR country agreements is often
undertaken by high profile figures in the U.S. administration, increasing in-country media
exposure and public awareness (Ingram 2010).4 In countries with high HIV prevalence
rates, PEPFAR has a significant media profile with improvements in HIV outcomes
frequently being attributed to PEPFAR (for example, Botswana Gazette 2011; IOL 2012;
Sambira 2013; Times of Zambia 2012a; Times of Zambia 2012b; Vo 2008). PEPFAR is
also unlikely to be overshadowed, or even rivaled, by other donors’ HIV/AIDS-related
!!!!!!!!!!!!!!!!!!!!!!!!!!!!!!!!!!!!!!!!!!!!!!!!!!!!!!!!4 For examples of high profile figures’ visits and their news coverage, see Kanyesigye
(2011), Sunday Standard (2011), and Times of Zambia (2012a).
! 13!
aid. The U.S. was the source of 52% of such bilateral aid commitments globally, 2004-
2006, while the second largest donor, the U.K., contributed 18% (Henry J. Kaiser Family
Foundation 2013).5
These four characteristics of PEPFAR – targeted to address a critical and widely
understood need, sustained delivery of aid over time, effectiveness (or perceived
effectiveness), and being highly visible – condition the theoretical contribution of our
study. We expect that aid that meets these conditions will be more likely to actually affect
opinion among recipient populations about the donor state.
Data and Variables
To test whether PEPFAR has an impact on public opinion in recipient countries, we
conduct regression analysis. The treatment variable is the per capita amount of PEPFAR
funds provided to each recipient country (in natural log). We averaged official statistics
over the first three years (2004-2006) since the disbursement of funds began in 2004.6
The number of countries receiving PEPFAR funds during this period was 79. By taking
!!!!!!!!!!!!!!!!!!!!!!!!!!!!!!!!!!!!!!!!!!!!!!!!!!!!!!!!5 We only use PEPFAR data for 2004-2006, but in 2007-2010, the years for which we
measure public opinion, the U.S. share of global bilateral HIV/AIDS aid was 59%.
6 U.S. President George W. Bush announced PEPFAR in January 2003, but disbursement
did not start until 2004. The data sources are various PEPFAR Operational Plans for
PEPFAR funds (in millions of current U.S. dollars) obtained at
<http://www.pepfar.gov/about/c19388.htm>, and the World Bank’s World Development
Indicators (WDI) for the total population, obtained at <http://data.worldbank.org/data-
catalog/world-development-indicators?cid=GPD_WDI>.
! 14!
the natural log of the highly skewed per capita amount, we exclude countries not
receiving any funding during the first three years.7
The outcome variable is the difference between the percentages (in natural log) of
respondents answering “approve” and “disapprove” to the following question asked in
Gallup World Polls (GWP): “Do you approve or disapprove of the job performance of the
leadership of the United States?” The GWP is the only available multinational survey
with nearly universal coverage of the developing world, repeating the same questions
annually about perceptions of the U.S. This question is especially appropriate for our
study because it focuses on the evaluation of current or recent U.S. leaders and their
behavior. By taking the natural log for both treatment and outcome variables, the
estimated treatment effect measures elasticity.8
The sampling procedures of the GWP targeted the national population aged 15 or
older in each country. Random-Digit-Dial (RDD) phone surveys were conducted where
at least 80% of the population has a telephone (primarily in developed countries), while
face-to-face interviews were conducted in all other countries. When RDD telephone
surveys were conducted, Gallup applied a list-assisted sampling design (Casady and
Lepkowski 1993) with all telephone numbers as the sampling frame. For face-to-face
surveys, an area sampling frame was used based on the latest available census data, with
!!!!!!!!!!!!!!!!!!!!!!!!!!!!!!!!!!!!!!!!!!!!!!!!!!!!!!!!7 As a robustness test, we also run a set of regressions after imputing missing values so
that we are able to use a larger number of countries for estimation. See a subsection
(Robustness Tests) in the Results Section.
8 We also used a slightly different outcome variable for another robustness test, the
results of which are presented in a subsection (Robustness Tests) in the Results Section.
! 15!
a stratified multi-stage random sample based on population units ranging usually from
cities with 1 million or more people to villages with under 10,000. The sample size is
roughly 1,000 surveys per country per year.9
Gallup Inc. launched this annual global public opinion study in 2006, asking the
question about U.S. leadership in each year.10 For our analysis, we use three outcome
variables – the average during the last two years of the Bush administration (2007-2008),
the average during the first two years of the Obama administration (2009-2010), and the
average during all four years. The use of these variables allows us to examine whether the
PEPFAR funding affected public opinion in recipient countries only when George W.
Bush, the founder of the PEPFAR program, was in office, and to be sure that our results
are not driven by changing global public opinion about the U.S. resulting from the
election of Barack Obama.
Because it is likely to have taken time for PEPFAR’s positive health impacts to
become clearly apparent, any effects of providing PEPFAR funds over multiple years on
public opinion in recipient countries are expected to be gradual and cumulative. In other
words, we assume that any short-term change (for example, a change from the previous
year) in PEPFAR funds does not abruptly cause a short-term change in public opinion
about the donor among recipient countries. For this reason, we take the averaged values
!!!!!!!!!!!!!!!!!!!!!!!!!!!!!!!!!!!!!!!!!!!!!!!!!!!!!!!!9 For details, see Tortora, Srinivasan, and Esipova (2010).
10 The number of countries in which this specific question was asked was 119 in 2006, 93
in 2007, 114 in 2008, 112 in 2009, and 115 in 2010. The country-level aggregated data
were obtained at <https://worldview.gallup.com/>.
! 16!
for both treatment and outcome variables and run cross-sectional (i.e., cross-country)
regressions.11
To increase confidence in our causal inference, we use instrumental variables
(IVs) that are expected to influence public opinion about the U.S. only through the
treatment variable (the amount of per capita PEPFAR funding). The use of instrumental
variables is often an effective way to address the issue of endogeneity using observational
data. Specifically, we use the HIV prevalence rate (the average of 2000-2003, in natural
log) and the number of annual HIV related deaths divided by the total population (the
average of 2000-2003, in natural log).12 HIV prevalence and death-rate data were used
extensively in designing PEPFAR’s approach, including the selection of recipient
countries, and setting annual funding levels (Lyerla et al. 2012). As would be expected,
!!!!!!!!!!!!!!!!!!!!!!!!!!!!!!!!!!!!!!!!!!!!!!!!!!!!!!!!11 Previous studies have shown that general ODA’s effects on economic growth are better
modelled over periods of several (specifically, four) years (Burnside and Dollar 2000;
Headey 2008).
12 The data source for the HIV prevalence rate and the number of annual HIV related
deaths is UNAIDS Data obtained at
<http://unaids.org/globalreport/documents/HIV_Estimates_GR2010_1990_2009_en.xls>.
If the reported HIV prevalence rate is “<0.1” percentage, we assigned a random number
between 0 (exclusive) and 0.1 (exclusive). Similarly, if the reported number of deaths is
“<1000”, “<500”, “<200”, or “<100”, we assigned a random number within the possible
range for each observation. The total population (2000-2003 average), the denominator
for the second instrumental variable, is from the World Bank’s WDI (see Footnote 6).
! 17!
our instruments are therefore strongly correlated with the treatment variable – the per
capita amount of PEPFAR funding (the average in 2004-2006).
Assuming they are valid, our instruments estimate the “local average treatment
effect” (Imbens and Angrist 1994). Formally, we estimate the average cross-country
effects of the variation in PEPFAR funding, which is determined by the variation in these
health indicators, rather than by other motivations such as geo-strategic selection, on
foreign public opinion. In other words, we have considerable confidence that we estimate
the effect of foreign aid targeted to need on public opinion. The allocation of PEPFAR
funds may be politically determined to some degree, but our IV estimates are unrelated to
such political considerations.
An important assumption in this analysis is the exclusion restriction, an
assumption that instruments can be excluded from the second-stage regression because
they are uncorrelated with the error term, conditional on other covariates included in the
model. To make this assumption plausible, we need to add variables that are expected to
correlate with our instrumental and outcome variables.13
First, U.S. total Official Development Assistance (ODA) per capita (in natural log,
averaged over 2004-2006) is the total aid funding received in each recipient country from
the U.S. (gross disbursements, current million U.S. dollars) divided by the total
!!!!!!!!!!!!!!!!!!!!!!!!!!!!!!!!!!!!!!!!!!!!!!!!!!!!!!!!13 We considered using a wide range of variables. See a subsection (Robustness Tests) in
the Results Section for more details.
! 18!
population (in millions).14 Including this variable ensures that any impact on opinion is a
result of PEPFAR and not of other aid programs designed in part to address public health
problems in developing countries.
Second, the U.S. may provide more PEPFAR funds to poorer economies and/or
poorly governed countries, and these countries are also likely to have more severe public
health problems. To control for these possibilities, we add GDP per capita (2004-2006
average, in natural log).15 For similar reasons, we control for the level of civil liberties
and the quality of governance, using the Freedom House civil liberties score (2004-2006
average),16 as well as a compositional score based on six World Bank Governance
Indicators (2004-2006 average).17 We also include a dummy variable for sub-Saharan
!!!!!!!!!!!!!!!!!!!!!!!!!!!!!!!!!!!!!!!!!!!!!!!!!!!!!!!!14 The data source of ODA disbursements is OECD DAC CRS Aid Database, obtained at
<http://www.oecd.org/document/33/0,2340,en_2649_34447_36661793_1_1_1_1,00.html
#dac>. See Footnote 12 for the source of total population.
15 The data source is the World Bank’s WDI (see Footnote 6). Specifically, the variable
we use is GDP per capita, PPP (constant 2005 international dollars).
16 The data source is Freedom House, Freedom in the World Country Rankings, obtained
at <http://www.freedomhouse.org/template.cfm?page=439>. An alternative measure of
the level of political development is polity score from Polity IV data. We, however,
prefer to use the Freedom House’s score, as there are no missing values for countries
included in our analysis. The two variables are highly correlated (r=0.81).
17 The data source is Teorell, Samanni, Holmberg and Rothstein (2011). The original
source is Kaufmann et al. (2009) available at <http://www.govindicators.org>. Because
! 19!
African countries to control for unobserved region-specific covariates.18 Because the
global HIV and AIDS epidemic is most acute in Sub-Saharan Africa and because much
of PEPFAR funding has been directed to countries in this region, this variable is essential
to ensure that our results are not driven by other, unobserved, region specific
characteristics.
Third, the problems associated with HIV and AIDS in a given country may affect
that country’s economic and political relationships with the U.S. (and then, in turn, the
country’s public opinion about the U.S.) Specifically, the U.S. tends to have weaker trade
ties with countries with more severe public health problems. This may be because these
countries are economically closed and/or because they lack goods to export to the U.S.
These countries also tend to have weaker political ties with the U.S., perhaps because of
their small presence in political and economic negotiations at international arenas. To
account for these connections, we use three variables. The first two are imports to the U.S.
from a given country as a percentage of total U.S. imports (in natural log), and exports
from the U.S. to a given country as a percentage of total U.S. exports (in natural log).19
!!!!!!!!!!!!!!!!!!!!!!!!!!!!!!!!!!!!!!!!!!!!!!!!!!!!!!!!!!!!!!!!!!!!!!!!!!!!!!!!!!!!!!!!!!!!!!!!!!!!!!!!!!!!!!!!!!!!!!!!!!!!!!!!!!!!!!!!!!!!!!!!!!!!!!!!!!!!!!!!!!!!!the six indicators are highly correlated, we measured a Cronbach’s alpha. The reliability
coefficient is 0.97.
18 We generate a dummy variable base on a variable indicating the region of the country
in Teorell, Samanni, Holmberg, and Rothstein (2011). The original source is Teorell and
Hadenius (2005).
19 Fleck and Kilby (2006) use these variables to capture the impact of trade with the U.S.
on U.S. aid allocation decisions. The data source is U.S. Department of Commerce,
Bureau of the Census, Foreign Trade, obtained at <http://www.census.gov/foreign-
! 20!
As a proxy for each recipient country’s political connection to the U.S., we add a variable
measuring accordance of each country’s United Nations General Assembly (UNGA)
voting pattern with that of the U.S.20
Conditional on these covariates, we argue, it is unlikely that our instrumental
variables (HIV/AIDS rates) would have any impact on the outcome variable (public
opinion about the U.S. leadership) through any mechanism other than their impact through
the treatment variable (PEPFAR). In other words, having accounted for these covariates,
we have confidence that our instrumental variables are not systematically correlated with
the error term in the second-stage regression. Ultimately, the validity of this exclusion
restriction assumption is an empirical matter, and thus we conduct a set of standard
specification tests.
Results
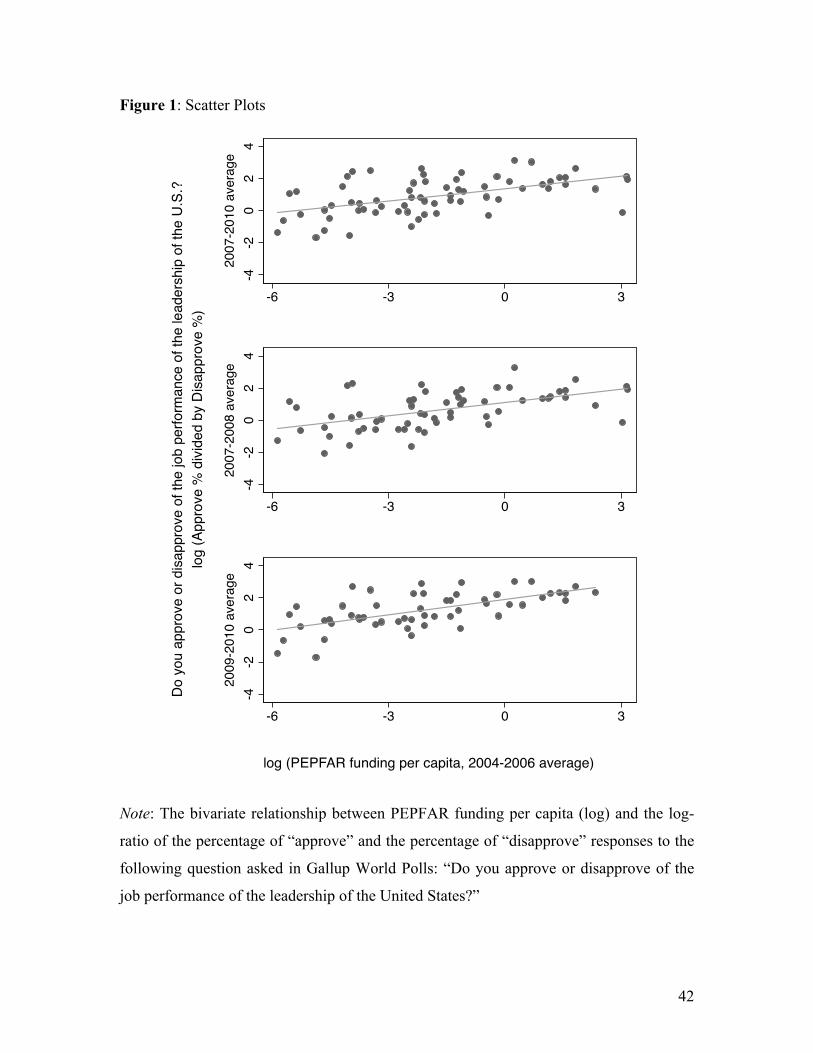
Figure 1 shows the results of our first-cut analysis – simple scatter plots using the
outcome variable and the treatment variable. Each panel in this figure corresponds to one
of three periods used for analysis (i.e., 2007-2010, 2007-2008, or 2009-2010). The !!!!!!!!!!!!!!!!!!!!!!!!!!!!!!!!!!!!!!!!!!!!!!!!!!!!!!!!!!!!!!!!!!!!!!!!!!!!!!!!!!!!!!!!!!!!!!!!!!!!!!!!!!!!!!!!!!!!!!!!!!!!!!!!!!!!!!!!!!!!!!!!!!!!!!!!!!!!!!!!!!!!!trade/balance/>. Another commonly used indicator for the trade ties with the U.S. is the
sum of exports to the U.S. and imports from the U.S. as the percentage of GDP. This
variable, however, is found to be very weakly correlated with our instrumental variables.
20 The data source is Dreher and Sturm (2012), obtained at <http://www.uni-
heidelberg.de/fakultaeten/wiso/awi/professuren/intwipol/datasets_en.html>. The measure
used is the proportion of UN votes in the year of interest in which the aid recipient
country voted in-line with the United States. For a detailed description of the calculation
involved see Dreher and Strum (2012, 371)
! 21!
straight lines are OLS regression lines. All these lines have a positive slope, and the
estimated slope coefficients from simple bivariate regressions (0.26 for 2007-2010, 0.27
for 2007-2008, and 0.32 for 2009-2010) are highly significant at the 99% level.
[Figure 1 about here]
The magnitude of the effect is substantial and similar across the last two years of
the Bush administration and the first two years of the Obama administration. Specifically,
regardless of who the U.S. president was at the time of the surveys, doubling the per
capita amount of PEPFAR funds increased the ratio of the percentages of Approve and
Disapprove by about 30%. For example, if the percentage of Approve was initially 40%,
the estimated coefficients suggest that it would increase to 52%.21
Estimated Treatment Effects
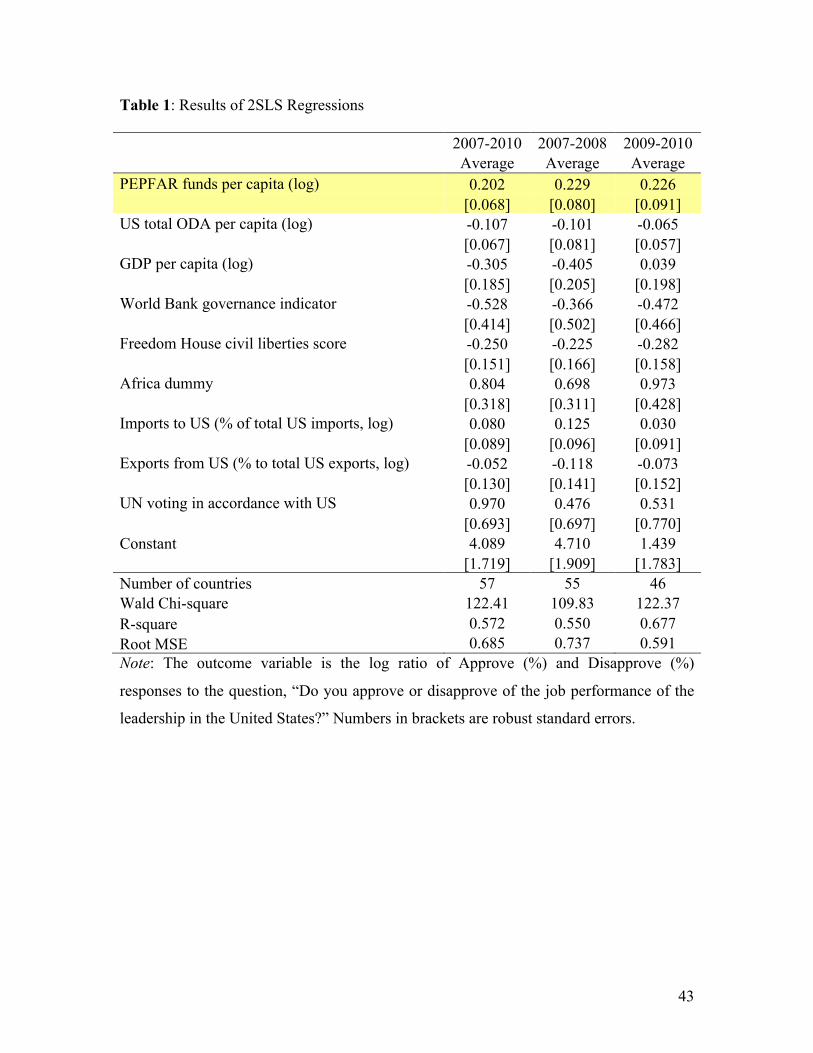
Table 1 shows the results of two-stage least square (2SLS) regressions. The effect of
PEPFAR funds per capita on the perception of U.S. leadership is positive and statistically
significant at the 99% level of confidence for the 2007-2010 period overall, as well as for
the final Bush years, 2007-2008. It is significant at the 95% level during the initial
!!!!!!!!!!!!!!!!!!!!!!!!!!!!!!!!!!!!!!!!!!!!!!!!!!!!!!!!21 This simple interpretation assumes that PEPFAR increases the percentage of Approve
while keeping the percentage of Disapprove constant. PEPFAR may also decrease the
percentage of Disapproval, but understanding the impacts of PEPFAR on the
composition of percentages is beyond the scope of this paper. The average percentages of
Approve and Disapprove for the period of 2007-2010 were 45.8% and 31.2%,
respectively. The remaining percentage includes respondents who either chose “Don’t
know” or refused to answer.
! 22!
Obama years, 2009-2010.22 The estimated marginal effects are slightly smaller than those
based on simple bivariate OLS (shown in Figure 1) but still substantial. Specifically, if
the per capita amount of PEPFAR funding doubles, the ratio of Approval to Disapproval
increases by 20-23%. Importantly, we re-emphasize, the effects of PEPFAR on public
opinion in recipient countries are independent of the U.S. president’s popularity,
partisanship and of any perceived policy differences between Bush and Obama.23
[Tables 1 and 2 about here]
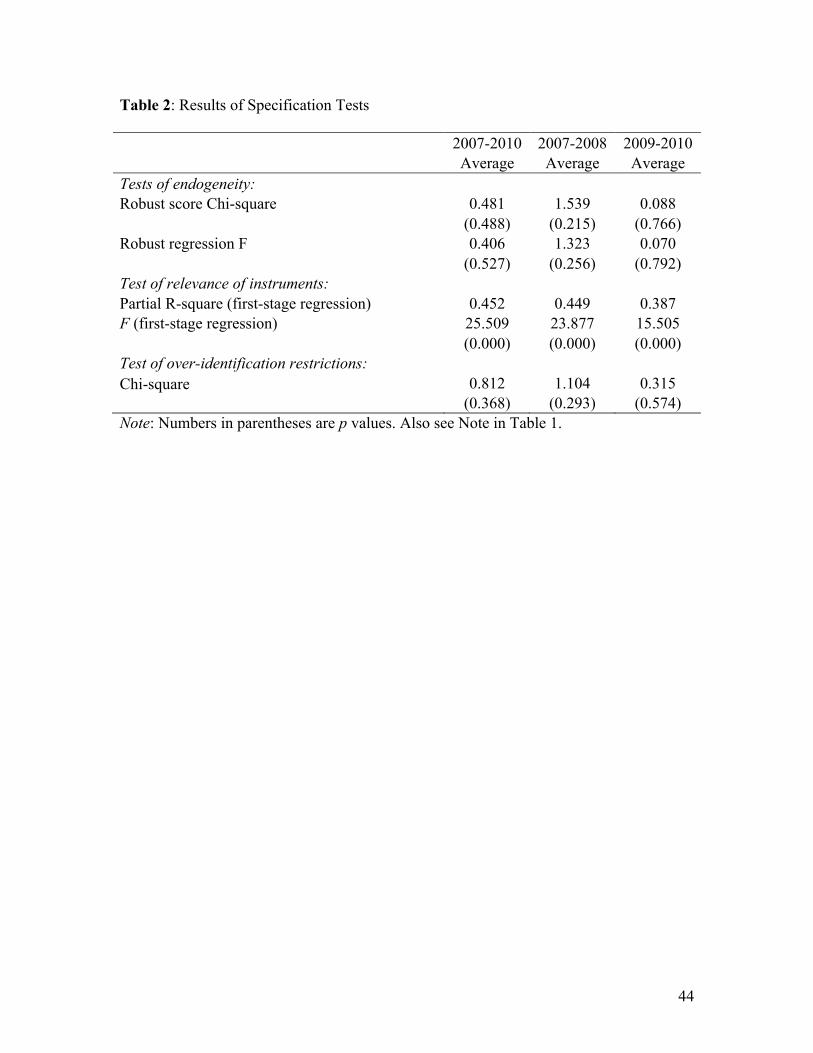
As expected, a set of specification tests (shown in Table 2) suggests that our
instruments are highly valid empirically. The small values of test statistics for !!!!!!!!!!!!!!!!!!!!!!!!!!!!!!!!!!!!!!!!!!!!!!!!!!!!!!!!22 We experimented with many different sets of control variables, but the results,
discussed shortly, are similar.
23 The negative – but statistically insignificant – association of total U.S. ODA per capita
with opinion about U.S. leadership might be related to the various strategic purposes for
which some U.S. aid is given (Dreher, Nunnenkamp, and Thiele 2008; Gates and
Hoeffler 2004). The mixed goals of promoting U.S. foreign policy may cause U.S. aid to
be less effective at promoting development (Headey 2008). Specifically, U.S. aid may be
extended to more corrupt (Alesina and Weder 2002) and/or less democratic regimes, and
to those that violate human rights, to a greater extent than is the case for most other major
bilateral donors (Hoeffler and Outram 2011). Thus, U.S. ODA might be perceived in
some recipient countries as ineffective, and complicit in propping up dysfunctional or
repressive regimes. It is worth further investigating such potentially negative effects of
more general U.S. aid on opinion about the U.S. in recipient countries, but we leave it for
future research.
! 23!
endogeneity – Wooldridge’s (1995) robust Chi-square score test and a robust regression-
based F test – imply that our treatment variable (PEPFAR funds per capita) does not need
to be considered as endogenous.24 The partial R-square statistics in the first-stage
regression range from 0.39 to 0.45. Thus, the instruments explain 39-45% of the first-
stage regression’s overall goodness of fit. The F statistics for the joint significance of the
instruments in the first stage range from 15.5 to 25.5 and are highly significant. They are
larger than 10, which Stock, Wright, and Yogo (2002) suggest as the benchmark to assess
the reliability of 2SLS estimates for causal inference (when there is one endogenous
variable).
We also conducted over-identification tests to examine whether the instruments
are uncorrelated with the error term. Sargan’s (1958) and Basmann’s (1960) Chi-square
test statistics are very small. The associated high p values indicate that the exclusion
restriction assumption is empirically supported.
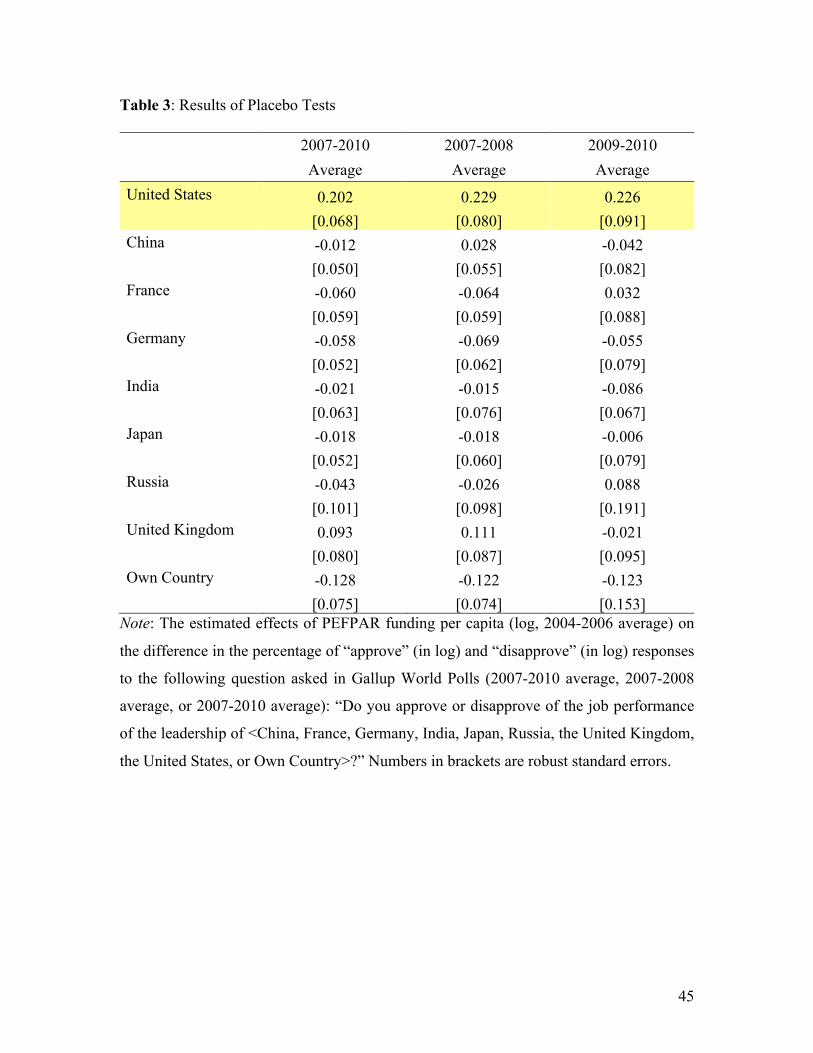
Placebo Tests
To further ensure that no additional unobserved factors are driving our results, we also
conducted placebo tests – also called “control-outcome” tests (Rosenbaum 2010) – using
similar-but-different outcome variables. Given that we do not expect PEPFAR aid to
have an effect on opinions about other countries, besides the U.S., these tests “exploit the
anticipated absence of an effect to provide information about unmeasured biases”
(Rosenbaum 2010, 121). They are based on identical questions about the approval of
leadership of (“Do you approve or disapprove of the job performance of the leadership
!!!!!!!!!!!!!!!!!!!!!!!!!!!!!!!!!!!!!!!!!!!!!!!!!!!!!!!!24 For this reason, we also estimated our model based on OLS. See a subsection
(Robustness Tests) in the Results Section.
! 24!
of…?”) China, France, Germany, India, Japan, Russia, the United Kingdom, and the
respondent’s home country. As in the case of the U.S., each “non-equivalent dependent
variable” (Cook and Campbell 1979, Chap. 2) measures the 2007-2008, 2009-2010, or
2007-2010 average difference between the percentage of Approval (in natural log) and
the percentage of Disapproval (in natural log).
[Table 3 about here]
Table 3 shows the estimated marginal effects of the treatment variable on these
nine outcome variables. The only statistically significant effects (at the 99% or 95%
level) were obtained for the outcome variable measuring the Approval vis-à-vis
Disapproval of leadership of the U.S. These tests further support our expectation that
PEPFAR affects public opinion specifically about the U.S. in recipient countries, and the
relationship is not the result of confounding factors.
There is a theoretical rationale for these empirical results. While donor countries
tend to give aid to combat HIV/AIDS to those states that are most affected by the
epidemic, there is also a substitution or free-riding dynamic in which other donors give
less to a specific recipient state when one donor gives a larger amount (Gaibulloev and
Sandler 2012). This could also be due to explicit multilateral coordination among donors.
Given that the U.S. is the largest such donor, this implies that other donors give relatively
less HIV/AIDS-related aid to the states receiving more from the U.S., which would
support our expectation that public opinion about other countries would not be
significantly related to PEPFAR funding provided by the U.S.
Interestingly, however, the effects on the leadership Approval vis-à-vis
Disapproval ratio in a respondent’s own country are negative and significant at the 90%
! 25!
level (for 2007-2010 and 2007-2008). The publics in countries receiving large PEPFAR
funds may assess the relative performance of their country’s leaders in comparison to that
of the U.S. leaders who provide – or are perceived to provide – effective foreign aid.
These barely significant effects are, however, not robust. Among many model
specifications we tried, they are more often insignificant (even at the 90% level) than
significant.
Robustness Tests
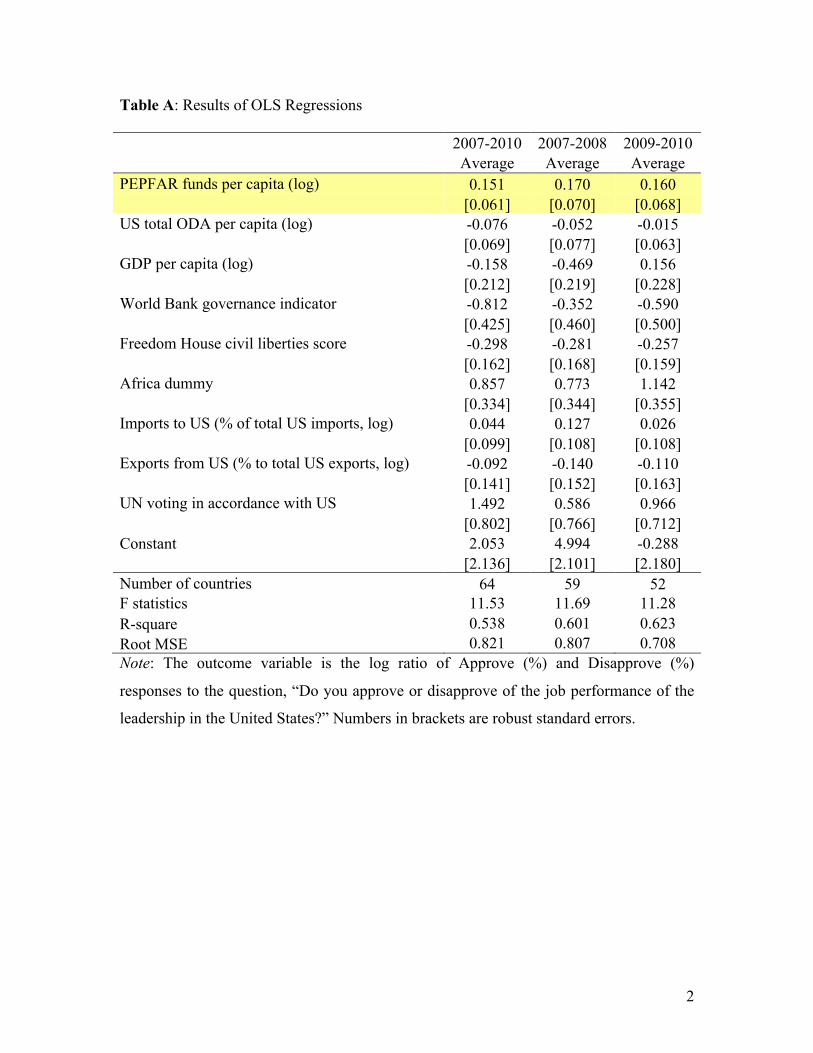
We also ran a range of other regression models for further robustness tests. First, building
on the initial bivariate correlations reported with the scatter plots in Figure 1 at the
beginning of this section we estimated our model using multiple regression (i.e., without
instruments). The results are presented in Appendix A (Table A). The effects of PEPFAR
funds per capita are slightly smaller, ranging from 0.15 to 0.17, but are still highly
significant at the 95% level in all three periods of investigation. The similarity between
the 2SLS and OLS regression results is what we expect, given that the test results for
endogeneity suggest that we do not necessarily need to treat the per capita amount of
PEFAR funds as endogenous, conditional on the covariates included in our estimation.
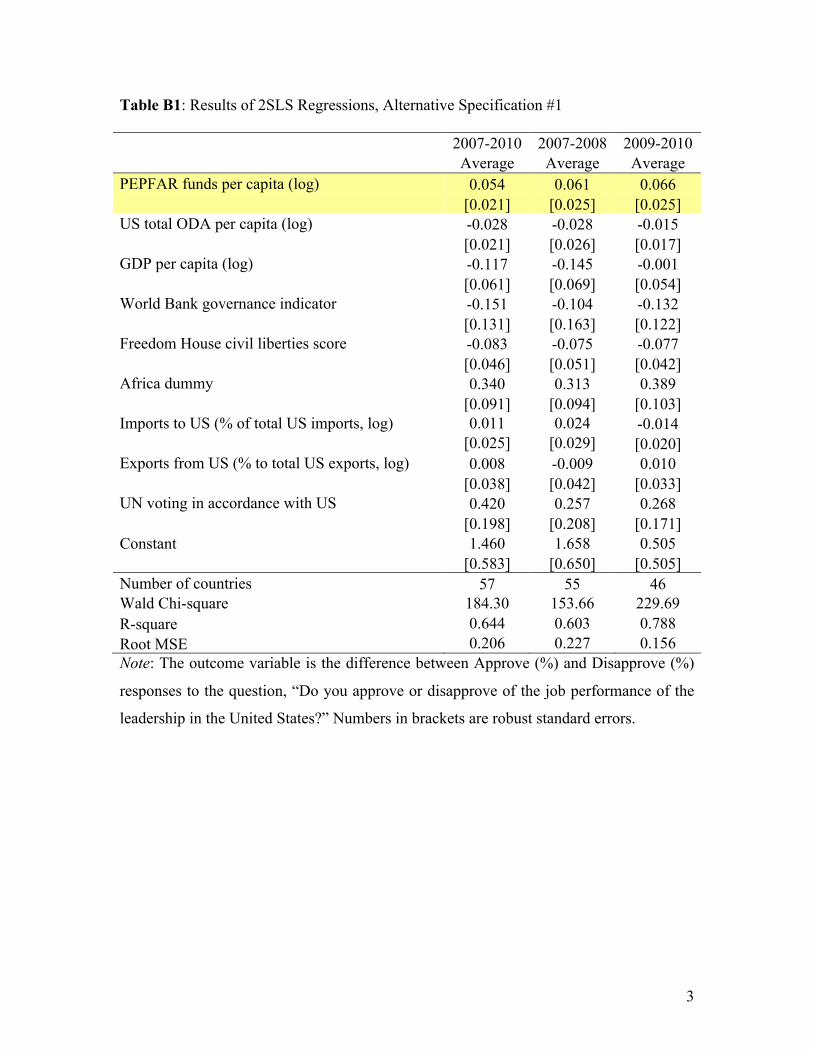
Second, we tried an alternative outcome variable; specifically, the difference
between the Approval percentage and the Disapproval percentage without taking the
natural log. The results shown in Appendix B (Tables B1 and B2) are quite similar. The
effects of our treatment variable are positive and significant at the 99% or 95% level. The
results of specification tests are also similar.25
!!!!!!!!!!!!!!!!!!!!!!!!!!!!!!!!!!!!!!!!!!!!!!!!!!!!!!!!25 The Chi-square statistic for the test of over-identification restrictions is large (3.005)
enough to reject the null hypothesis at the 90% level but not at the 95% level.
! 26!
Third, we randomly imputed small numbers for countries not receiving PEPFAR
funds and/or other foreign aid programs.26 This is aimed at testing whether our results are
driven by non-random exclusion of countries not receiving aid by taking the natural log
of the highly skewed per capita amount of PEPFAR or total ODA. The results are
presented in Appendix C (Tables C1 and C2). By imputing the missing values, we
substantially increase the number of observations. All three coefficients of PEPFAR
funds per capita are positive and statistically significant at the 95% level for 2007-2010,
90% for 2007-2008, and 99% for 2009-2010. The magnitude of the effects is slightly
smaller for 2007-2010 and 2007-2008, but almost exactly the same for 2009-2010.
Finally, we considered using other pre-treatment covariates aimed to satisfy the
exclusion restriction assumption. They include the geographical distance from the U.S.,
variables measuring the amount of U.S. military aid, a dummy variable for United
Nations Security Council members, a dummy variable for former U.S. colonies, a dummy
variable for Latin American countries, a dummy variable for Egypt, and the percentage of
Muslims in each country’s population. Adding these variables individually or jointly does
not substantially change our main results, although doing so tends to increase the
standard errors of the coefficients for our treatment variable. To avoid this problem of
inefficiency, for our main results reported in Tables 1 and 2, we decided to keep a
!!!!!!!!!!!!!!!!!!!!!!!!!!!!!!!!!!!!!!!!!!!!!!!!!!!!!!!!26 Specifically, for each period of investigation (2007-2010, 2007-2008, or 2009-2010),
we calculated the minimum amount of PEPFAR funds per capita or U.S. total ODA per
capita. For each of countries not receiving PEPFAR or other aid programs, we imputed a
random number ranging from 0 (exclusive) to the observed minimum value. After
imputing these missing values, we took the natural log of each variable.
! 27!
variable not only when there was a theoretical reason to include it, but also when its
pairwise correlation with one of our instrumental variables was statistically significant at
the 95% level. None of these additional pre-treatment covariates satisfied our criteria, and
thus we did not include them in our main analysis.
Conclusion
These findings provide robust evidence that PEPFAR has had a strong positive effect on
how U.S. leadership has been perceived in recipient countries. The results of
specification tests, placebo tests, and robustness tests suggest that the observed effects are
not statistical artifacts, and thus we are strongly inclined to believe that they are causal.
Our theory is that these empirically robust results stem from the fact that PEPFAR is
targeted to address a widely understood need; has been sustained over some time; is –
and is perceived to be – effective; and is highly visible.
Whether, and the extent to which, these conditions apply individually and/or
jointly are important questions for future investigation. At present, such investigations
aimed to identify the mechanisms through which PEPFAR has had its impact are limited
by the absence of individual-level (or household-level) survey datasets. Once such data
become available, further work could examine, for example, whether positive perceptions
are higher among those impacted directly (i.e., suffering from HIV and AIDS or the
families of sufferers) and/or among those with better access to media and the publicity of
PEPFAR.
In addition to further work looking inwards, there is considerable scope for
further work looking outwards. Specifically, one important way our approach could be
extended is by testing whether other aid programs targeted to important needs, sustained
! 28!
over time, perceived as effective, and well-publicized or otherwise visible to the
population are also positively associated with opinion about the U.S. Another would be to
examine this relationship for other donor countries. Give the large absolute amounts of
aid the U.S. provides, it remains an open question whether other donors’ extant smaller
programs might affect perceptions within recipient countries about these donors.
Another promising area of further investigation stemming directly from this
article would be to study other humanitarian aid programs addressing global health issues
that have been successful in tackling other major illnesses, such as small pox, polio, river
blindness and malaria. While there are many examples of aid failing to provide benefits,
PEPFAR is not unique in its achievements. Indeed, there are other well-documented
examples of aid having significant positive impacts (for example, Demombynes and
Trommlerova 2012; Levine 2007). Thus, future work should seek to extend our analysis
across a range of programs.
Having acknowledged some limitations and future research directions, we
underscore that our analysis is the first of its kind to use cross-country data to make
systematic causal inference about the impacts of aid on public opinion in aid recipient
countries. Our findings suggest that policy debates about PEPFAR and similar programs
should consider not only their efficacy in achieving direct goals such as fighting HIV and
AIDS, but also their value in improving the donor country’s global or regional standing.
Beyond the literature on aid effectiveness, our research has broader implications
for understanding today’s international relations. If analysts are correct that national
image is increasingly a key resource for great powers’ international influence, our
findings may be good news. With militarized confrontation tempered by high economic
! 29!
interdependence (for example, between China and the U.S. today, but unlike the U.S. and
USSR during the Cold War), great powers might now start learning to place more
emphasis on improving their image through aid, because it enhances their power. Our
research shows that one possible means of doing well in the newly forming arena of
international competition for favorable perceptions is by actually doing good.
! 30!
References
Arndt, C., S. Jones and F. Tarp 2010. “Aid, Growth, and Development: Have We Come
Full Circle?” Journal of Globalization and Development 1(2): Article 5.
Adelman, K. 2011. “Not-So-Smart Power: Go Ahead, Congress, Cut Away at U.S.
Foreign Aid.” Foreign Policy. April 18.
http://www.foreignpolicy.com/articles/2011/04/18/not_so_smart_power (March
23, 2013).
Alesina, A. and D. Dollar. 2000. “Who Gives Foreign Aid to Whom and Why?” Journal
of Economic Growth 5(1): 33-64.
Alesina, A. and B. Weder. 2002. “Do Corrupt Governments Receive Less Foreign Aid?”
American Economic Review 92(4): 1126-1137.
American Political Science Association. 2009. U.S. Standing in the World: Causes,
Consequences, and the Future, Long Report of the Task Force. Washington DC:
American Political Science Association.
Andrabi, T. and J. Das. 2010. “In Aid We Trust: Hearts and Minds and the Pakistan
Earthquake of 2005.” World Bank, Policy Research Working Paper, No.
WPS5440.
Basmann, R. L. 1960. “On Finite Sample Distributions of Generalized Classical Linear
Identifiability Test Statistics.” Journal of the American Statistical Association
55(292): 650-659.
Beath, A., F. Christia, and R. Enikolopov. 2011. “Winning Hearts and Minds? Evidence
from a Field Experiment in Afghanistan.” MIT Political Science Department,
Working Paper, No. 2011-14.
! 31!
Bendavid, E. and J. Bhattacharya. 2009. “The President’s Emergency Plan for AIDS
Relief in Africa: An Evaluation of Outcomes.” Annals of Internal Medicine
150(10): 688-695.
Berthélemy, J.-C. 2006, “Bilateral Donors’ Interest vs. Recipients’ Development Motives
in Aid Allocation: Do All Donors Behave the Same?”, Review of Development
Economics 10(2): 179-194
Böhnke, J., J. Koehler, C. Zürcher. 2010. “Assessing the Impact of Development
Cooperation in North East Afghanistan 2005–2009.” Bundesministerium für
wirtschaftliche Zusammenarbeit und Entwicklung. Unpublished Report.
http://www.oecd.org/countries/afghanistan/46785983.pdf (accessed on March 23,
2013).
Botswana Gazette. 2011. “U.S. Global AIDS Coordinator Ambassador Eric Goosby to
Visit Botswana”. The Botswana Gazette. March 7. http://www.gazettebw.com/ind
ex.php?option=com_content&view=article&id=8903:us-global-aids-coordinator-
ambassador-eric-goosby-to-visit-botswana&catid=18:headlines&Itemid=2
(accessed on January 28, 2013).
Bradbury, M. and M. Kleinman. 2010. Winning Hearts and Minds? Examining the
Relationship between Aid and Security in Kenya. Medford, MA: Feinstein
International Center, Tufts University.
Browne, S. 2006. Aid and influence: do donors help or hinder? London: Earthscan.
Burnside C. and D. Dollar. 2000. “Aid, policies and growth.” American Economic
Review 90(4): 847-868.
! 32!
Bustamante, M. J. and J. E. Sweig. 2008. “Buena Vista Solidarity and the Axis of Aid:
Cuban and Venezuelan Public Diplomacy.” Annals of the American Academy of
Political and Social Science 616(1): 223-256.
Casady, R. J. and J. M. Lepkowski. 1993. “Stratified Telephone Survey Designs.” Survey
Methodology 19(1): 103-113.
Collins, C., M. Isbell, A. Sohn, and K. Klindera. 2012. “Four Principles for Expanding
PEPFAR's Role as a Vital Force in US Health Diplomacy Abroad.” Health Affairs
31(7): 1578-1584.
Cook, T. and D. Campbell. 1979. Quasi-Experimentation: Design and Analysis Issues for
Field Settings. Boston, MA: Houghton Mifflin.
Cumming, R. G. 2012. “HIV and AIDS in Africa: Good News and Bad News.” Medical
Journal of Australia 196(5): 309.
Dalgaard, C-J. and F. Tarp. 2004, “On the Empirics of Foreign Aid and Growth.”
Economic Journal 114(496): 191-216.
Demombynes, G. and S. K. Trommlerova. 2012. “What has driven the decline of infant
mortality in Kenya?” World Bank Policy Research Working Paper,WPS No. 6057.
Doucouliagos, H. and M. Paldam. 2013. “The Robust Result in Meta-analysis of Aid
Effectiveness: A Response to Mekasha and Tarp.” The Journal of Development
Studies 49(4): 584-587.
Dreher, A., P. Nunnenkamp, and R. Thiele. 2008. “Does US aid buy UN general
assembly votes? A disaggregated analysis.” Public Choice 136(1): 139-164.
! 33!
Dreher, A., P. Nunnenkamp, and R. Thiele. 2008b. “Does Aid for Education Educate
Children? Evidence from Panel Data.” The World Bank Economic Review 22(2):
291-314.
Dreher, A., P. Nunnenkamp and R. Thiele. 2011. “Are ‘New’ Donors Different?
Comparing the Allocation of Bilateral Aid Between non DAC and DAC Donor
Countries.” World Development 39(11): 1950-1968.
Dreher, A. and J-E. Sturm. 2012. “Do the IMF and the World Bank influence voting
in the UN General Assembly?” Public Choice 151(1-2): 363-397.
El-Sadr, W. M., C. B. Holmes, P. Mugyenyi, H. Thirumurthy, T. Ellerbrock, R.t Ferris, I.
Sanne, A. Asiimwe, G. Hirnschall, R. N. Nkambule, L. Stabinski, M. Affrunti, C.
Teasdale, I. Zulu, and A. Whiteside. 2012. “Scale-up of HIV Treatment Through
PEPFAR: A Historic Public Health Achievement.” Journal of Acquired Immune
Deficiency Syndromes 60, supplement 3: S96-S104.
Embassy of the United States, Islamabad, Pakistan. 2012. “U.S. Releases New Funds for
Pakistani Energy Projects.” http://islamabad.usembassy.gov/pr-080312.html
(accessed on March 23, 2013).
Feeny, S. and A. de Silva. 2012. “Measuring absorptive capacity constraints to foreign
aid.” Economic Modelling 29(3): 725-733.
Fleck, R. K. and Kilby, C. 2006. “How Do Political Changes Influence US Bilateral Aid
Allocations? Evidence from Panel Data.” Review of Development Economics
10(2): 210-223.
! 34!
Fishstein, P. 2010. Winning Hearts and Minds? Examining the Relationship between Aid
and Security in Afghanistan’s Balkh Province. Medford, MA: Feinstein
International Center, Tufts University.
Friedberg, A. L. 2010. “Implications of the Financial Crisis for the US-China Rivalry.”
Survival 52(4): 31-53.
Gaibulloev, K. and T. Sandler. 2012. “Aid for AIDS in Africa.” Empirical Economics
43(3): 1171-1197
Gates, S. and A. Hoeffler. 2004. “Global Aid Allocation: Are Nordic Donors Different?”
The Center for the Study of African Economies, WPS No. 2004-34.
http://www.csae.ox.ac.uk/workingpapers/pdfs/2004-34text.pdf (accessed on
September 23, 2013).
Gill, B. and Y. Huang. 2006. “Sources and Limits of Chinese ‘Soft power’.” Survival
48(2): 17-36.
Goldsmith, B. E. and Y. Horiuchi. 2009. “Spinning the Globe? U.S. Public Diplomacy
and Foreign Public Opinion.” The Journal of Politics 71(3): 863-875.
Goldsmith, B. E. and Y. Horiuchi. 2012. “In Search of Soft Power: Does Foreign Public
Opinion Matter for U.S. Foreign Policy?” World Politics 64(3): 555-585.
Goldsmith, B. E., Y. Horiuchi, and T. Inoguchi. 2005. "American Foreign Policy and
Global Opinion: Who Supported the War in Afghanistan?" Journal of Conflict
Resolution 49(3): 408-429.
Gompelman, G. 2011. Winning Hearts and Minds? Examining the Relationship between
Aid and Security in Afghanistan’s Faryab Province. Medford, MA: Feinstein
International Center, Tufts University.
! 35!
Gordon, S. 2011. Winning Hearts and Minds? Examining the Relationship between Aid
and Security in Afghanistan’s Helmand Province. Medford, MA: Feinstein
International Center, Tufts University.
Govender, P. 2012. “U.S. Hands More Control to South Africa in its AIDS fight.”
Reuters. August 7. http://www.reuters.com/article/2012/08/07/us-clinton-safrica-
aids-idUSBRE8760ZU20120807 (accessed on March 23, 2013).
Hanusch, M. 2012. “African Perspectives on China–Africa: Modelling Popular
Perceptions and their Economic and Political Determinants.” Oxford Development
Studies 40(4): 492-516
Headey, D. 2008. “Geopolitics and the Effect of Foreign Aid on Economic Growth:
1970-2001.” Journal of International Development 20(2): 161-180.
Henry J. Kaiser Family Foundation, The. 2013. “Financing the Response to AIDS in
Low- and Middle-Income Countries: International Assistance from Donor
Governments.” http://kff.org/global-health-policy/report/financing-the-response-
to-aids-in-low/ (accessed on 24 September 24, 2013).
Hoeffler, A. and V. Outram. 2011. “Need, Merit, or Self-Interest: What Determines the
Allocation of Aid?” Review of Development Economics 15(2): 237-250.
Huntington, S. P. 1991. The Third Wave: Democratization in the Late Twentieth Century.
Norman, OK: University of Oklahoma Press.
Imbens, G. W. and J. D. Angrist. 1994. “Identification and Estimation of Local Average
Treatment Effects.” Econometrica 62(2): 467-475.
Ingram, A. and W. Kazanecki. 2010. “Governmentality and security in the US President's
Emergency Plan for AIDS Relief (PEPFAR).” Geoforum 41(4): 607-616.
! 36!
Kanyesigye, F. 2012. “Kagame Receives U.S. Global Aids Coordinator”, The New Times,
16 October 2012. http://allafrica.com/stories/201210160094.html (accessed on
March 23, 2013).
Kaufmann, D., A. Kraay, and M. Mastruzzi. 2009. “Governance Matters VIII: Aggregate
and Individual Governance Indicators, 1996-2008.” World Bank Policy Research
Working Paper, WPS No. 4978.
Kinder, M. 2010. “Winning Hearts and Minds in Pakistan, One Humanitarian Relief
Worker at a Time.” Center for Global Development, http://blogs.cgdev.org/mca-
monitor/2010/10/winning-hearts-and-minds-in-pakistan-one-humanitarian-relief-
worker-at-a-time.php (accessed on March 23, 2013).
Keohane, R. O. and J. S. Nye. 1977. Power and Interdependence. First ed. Boston, MA:
Little, Brown.
Kaiser Family Foundation. 2011. “The U.S. President’s Emergency Plan for AIDS Relief
(PEPFAR).” http://www.kff.org/globalhealth/upload/8002-03.pdf (accessed on
March 23, 2013).
Kolb, B. and I. Q. Whishaw. 2008. Fundamentals of Human Neuropsychology. Sixth ed.
New York, NY: Worth Publishers.
Kurlantzick, J. 2007. Charm Offensive: How China’s Soft Power is Transforming the
World? New Haven, CT: Yale University Press
Kuziemko, I. and E. Werker. 2006. “How much is a Seat on the Security Council Worth?
Foreign Aid and Bribery at the United Nations.” Journal of Political Economy
114(5): 905-930.
! 37!
Lake, D. A. 2007. “Escape from the State of Nature: Authority and Hierarchy in World
Politics.” International Security 32(1): 47-79.
Levine, R. 2007. Case Studies in Global Health: Millions Saved. Sudbury, MA: Jones
and Bartlett.
Lindsay, J. M. 2011. “We Don’t Give Out Foreign Aid to Make People Like Us.” The
Atlantic, September 29
http://www.theatlantic.com/international/archive/2011/09/we-dont-give-out-
foreign-aid-to-make-people-like-us/245856/ (accessed on March 23, 2013).
Lyerla, R., C. S. Murrill, P. D. Ghys, J. M. Calleja-Garcia, K. M. DeCock. 2012. “The
Use of Epidemiological Data to Inform the PEPFAR Response.” Journal of
Acquired Immune Deficiency Syndromes 60, supplement 3, S57-S62.
Mekasha, T. and F. Tarp. 2013. “Aid and Growth: What Meta-Analysis Reveals.” The
Journal of Development Studies 49(4): 564-583.
Milner, H. V. and D. H. Tingley. 2011. “Who Supports Global Economic Engagement?
The Sources of Preferences in American Foreign Economic Policy.” International
Organization 65(1): 37-68.
Milner, H. V. and D. H. Tingley. 2013. Geopolitics of Foreign Aid. Northhampton, MA:
Edward Elgar Publishing.
Minoiu, C. and S. Reddy. 2010. “Development Aid and Economic Growth: A Positive
Long-run Relation.” The Quarterly Review of Economics and Finance 50(1): 27-
39.
Mishra, P. and D. Newhouse. 2009. “Does Health Aid Matter?” Journal of Health
Economics 28(4): 855-872.
! 38!
Nowak-Lehmann, F., I. Martínez-Zarzoso, S. Klasen and D. Herzer. 2009. “Aid and
Trade: A Donor’s Perspective.” The Journal of Development Studies 45(7): 1184-
1202.
Nunnenkamp, P. and H. Öhler. 2011. “Throwing Foreign Aid at HIV/AIDS in
Developing Countries: Missing the Target?” World Development 39(10): 1704-
1723.
Nye, J. S. 2004. Soft Power: The Means to Success in World Politics. New York, NY:
Public Affairs.
PEPFAR. 2012. “The U.S. President’s Emergency Plan for AIDS Relief (PEPFAR)
Branding Guidance.” The U.S. President’s Emergency Plan for AIDS Relief,
http://www.pepfar.gov/documents/organization/198963.pdf (accessed on March
23, 2013).
Perlez, J. 2012. “China Pledges $20 Billion in Loans to African Nations.” The New York
Times. June 19, http://www.nytimes.com/2012/07/20/world/asia/china-pledges-
20-billion-in-loans-to-african-nations.html?hp (accessed on March 23, 2013)
Program on International Policy Attitudes (PIPA). 2009. “Obama Rockets to Top of Poll
on Global Leaders: Putin and Ahmadinejad Receive Lowest Marks.” June 29,
http://hdl.handle.net/1903/10689 (accessed on March 23, 2013).
Radelet, S. 2006. “A Primer on Foreign Aid.” Center for Global Development, Working
Paper Number 92, http://www.cgdev.org/publication/primer-foreign-aid-working-
paper-92 (accessed on September 24, 2013).
Rajan, R. and A. Subramanian. 2008. “Aid and Growth: What Does the Cross-Country
Evidence Really Show?” Review of Economics and Statistics 90(4): 643-665.
! 39!
Ros-Lehtinenin, Ileana. 2008. Congressional Record, 110th Congress, 2nd sess., vo1. 154,
Issue 51
Rosenbaum, P. R. 2010. Design of Observational Studies. New York, NY: Springer.
Sachs, J. 2005. The End of Poverty: Economic Possibilities for Our Time. New York,
NY: Penguin Press.
Sambira, J. 2013. “New HIV infections are falling dramatically in Africa”. The Botswana
Gazette. January 16,
http://www.gazettebw.com/index.php?option=com_content&view=article&id=16
027:new-hiv-infections-are-falling-dramatically-in-
africa&catid=18:headlines&Itemid=2 (accessed on January 17, 2013).
Sargan, J. D. 1958. “The Estimation of Economic Relationships Using Instrumental
Variables.” Econometrica 26(3): 393-415.
Sepulveda, J., C. Carpenter, J. Curran, W. Holzemer, H. Smits, K. Scott, and M. Orza.
2007. PEPFAR Implementation: Progress and Promise. Washington D.C.: The
National Academies Press.
Shambaugh, D.. 2008. “China’s Role in Asia: Implications for the United States.” Korean
Journal of Defense Analysis 20(4): 295-304.
Simonds, R. J., Constance A. Carrino, and Michele Moloney-Kitts. 2012. “Lessons From
The President's Emergency Plan For AIDS Relief: From Quick Ramp-Up to The
Role of Strategic Partnership.” Health Affairs 31(7): 1397-1405.
Stock, J. H., J. H. Wright, and M. Yogo. 2002. “A Survey of Weak Instruments and
Weak Identification in Generalized Method of Moments.” Journal of Business
and Economic Statistics 20(4): 518-529.
! 40!
Sunday Standard. 2011. “Global AIDS Ambassador visits Botswana.” The Sunday
Standard. March 10.
http://www.sundaystandard.info/article.php?NewsID=10173&GroupID=1
(accessed on March 23, 2013)
Teorell, J., Marcus Samanni, Sören Holmberg and Bo Rothstein. 2011. “The Quality of
Government Dataset, Version 6 Apr 2011.” University of Gothenburg: The
Quality of Government Institute. http://www.qog.pol.gu.se.
Teorell, J. and Hadenius, A. 2005. “Determinants of Democratization: Taking Stock of
the Large-N Evidence.” Mimeo, Department of Government, Uppsala University .
Terror Free for Tomorrow. 2005. A Dramatic Change of Public Opinion in the Muslim
World. Washington D.C.: Terror Free for Tomorrow.
Terror Free for Tomorrow. 2006. Humanitarian Assistance Key to Favorable Public
Opinion in World’s Three Most Populous Muslim Countries. Washington D.C.:
Terror Free for Tomorrow.
Times of Zambia. 2012a. “Bush Pledges More Help.” Times of Zambia. July 4.
http://www.times.co.zm/?p=3344 (accessed on January 09, 2013).
Times of Zambia. 2012b. “Let’s Hope for More Bush Visits.”, Times of Zambia. July 3.
http://www.times.co.zm/?p=3214 (accessed on January 09, 2013).
Tortora, R. D., R. Srinivasan and N. Esipova. 2010. “The Gallup World Poll.” In Survey
Methods in Multinational, Multiregional and Multicultural Contexts, eds. J. A.
Harkness, M. Braun, B. Edwards, T. P. Johnson, L. Lyberg, P. Ph. Mohler, B-E.
Pennell, and T. W. Smith. New York, NY: Wiley, 535-543.
! 41!
Vo, L. T. 2008. “Vietnam Battles HIV Epidemic With U.S. Aid”. The Wall Street
Journal, Asia Edition. December 26.
http://online.wsj.com/article/SB123014126494733205.html (accessed on March
23, 2013).
Vreeland, J. 2011. “Foreign aid and global governance: Buying Bretton Woods – the
Swiss-bloc case.” The Review of International Organizations 6(3-4): 369-391.
Walsh, D. 2012. “Craving Energy and Glory, Pakistan Revels in Boast of Water-Run Car.”
The New York Times. August 4. http://www.nytimes.com/
2012/08/05/world/asia/boast-of-water-run-car-thrills-pakistan.html?ref=world.
(accessed on March 23, 2013).
Wang, T. Y. 1999. “US Foreign Aid and UN Voting: An Analysis of Important Issues.”
International Studies Quarterly 43(1): 199–210.
Wike, R. 2012. “Does Humanitarian Aid Improve America’s Image?” Pew Research
Global Attitude Project. A report released on March 6, 2012.
Wooldridge, J. M. 1995. “Score Diagnostics for Linear Models Estimated by Two Stage
Least Squares.” In Advances in Econometrics and Quantitative Economics:
Essays in Honor of Professor C. R. Rao, ed. G. S. Maddala, P. C. B. Phillips, and
T. N. Srinivasan. Oxford, UK: Blackwell, 66-87.
Wright, J. 2010. “Aid Effectiveness and the Politics of Personalism.” Comparative
Political Studies 43(6): 735-762.
! 42!
Figure 1: Scatter Plots
!
Note: The bivariate relationship between PEPFAR funding per capita (log) and the log-
ratio of the percentage of “approve” and the percentage of “disapprove” responses to the
following question asked in Gallup World Polls: “Do you approve or disapprove of the
job performance of the leadership of the United States?”
-4-2
02
4
-6 -3 0 3
2007
-201
0 av
erag
e-4
-20
24
-6 -3 0 3
2007
-200
8 av
erag
e-4
-20
24
-6 -3 0 3
2009
-201
0 av
erag
e
log
(App
rove
% d
ivid
ed b
y D
isap
prov
e %
)D
o yo
u ap
prov
e or
dis
appr
ove
of th
e jo
b pe
rform
ance
of t
he le
ader
ship
of t
he U
.S.?
log (PEPFAR funding per capita, 2004-2006 average)
! 43!
Table 1: Results of 2SLS Regressions
2007-2010 2007-2008 2009-2010
Average Average Average
PEPFAR funds per capita (log) 0.202 0.229 0.226
[0.068] [0.080] [0.091]
US total ODA per capita (log) -0.107 -0.101 -0.065
[0.067] [0.081] [0.057]
GDP per capita (log) -0.305 -0.405 0.039
[0.185] [0.205] [0.198]
World Bank governance indicator -0.528 -0.366 -0.472
[0.414] [0.502] [0.466]
Freedom House civil liberties score -0.250 -0.225 -0.282
[0.151] [0.166] [0.158]
Africa dummy 0.804 0.698 0.973
[0.318] [0.311] [0.428]
Imports to US (% of total US imports, log) 0.080 0.125 0.030
[0.089] [0.096] [0.091]
Exports from US (% to total US exports, log) -0.052 -0.118 -0.073
[0.130] [0.141] [0.152]
UN voting in accordance with US 0.970 0.476 0.531
[0.693] [0.697] [0.770]
Constant 4.089 4.710 1.439
[1.719] [1.909] [1.783]
Number of countries 57 55 46 Wald Chi-square 122.41 109.83 122.37 R-square 0.572 0.550 0.677 Root MSE 0.685 0.737 0.591 Note: The outcome variable is the log ratio of Approve (%) and Disapprove (%)
responses to the question, “Do you approve or disapprove of the job performance of the
leadership in the United States?” Numbers in brackets are robust standard errors.
! !
! 44!
Table 2: Results of Specification Tests
2007-2010 2007-2008 2009-2010
Average Average Average
Tests of endogeneity: Robust score Chi-square 0.481 1.539 0.088
(0.488) (0.215) (0.766) Robust regression F 0.406 1.323 0.070
(0.527) (0.256) (0.792) Test of relevance of instruments: Partial R-square (first-stage regression) 0.452 0.449 0.387 F (first-stage regression) 25.509 23.877 15.505
(0.000) (0.000) (0.000) Test of over-identification restrictions: Chi-square 0.812 1.104 0.315
(0.368) (0.293) (0.574) Note: Numbers in parentheses are p values. Also see Note in Table 1.
! !
! 45!
Table 3: Results of Placebo Tests
2007-2010 2007-2008 2009-2010 Average Average Average
United States 0.202 0.229 0.226
[0.068] [0.080] [0.091] China -0.012 0.028 -0.042
[0.050] [0.055] [0.082] France -0.060 -0.064 0.032
[0.059] [0.059] [0.088] Germany -0.058 -0.069 -0.055
[0.052] [0.062] [0.079] India -0.021 -0.015 -0.086
[0.063] [0.076] [0.067] Japan -0.018 -0.018 -0.006
[0.052] [0.060] [0.079] Russia -0.043 -0.026 0.088
[0.101] [0.098] [0.191] United Kingdom 0.093 0.111 -0.021
[0.080] [0.087] [0.095] Own Country -0.128 -0.122 -0.123
[0.075] [0.074] [0.153] Note: The estimated effects of PEFPAR funding per capita (log, 2004-2006 average) on
the difference in the percentage of “approve” (in log) and “disapprove” (in log) responses
to the following question asked in Gallup World Polls (2007-2010 average, 2007-2008
average, or 2007-2010 average): “Do you approve or disapprove of the job performance
of the leadership of <China, France, Germany, India, Japan, Russia, the United Kingdom,
the United States, or Own Country>?” Numbers in brackets are robust standard errors.
! 1!
Doing Well by Doing Good:
The Impact of Foreign Aid on Foreign Public Opinion
Benjamin E. Goldsmith Yusaku Horiuchi Terence Wood
First Draft: February 20, 2012
Last Update: November 29, 2013
Appendices
A. The Results of OLS Regression
B. The Results of 2SLS Regression and Specification Tests, Alternative
Specification #1
C. The Results of 2SLS Regression and Specification Tests, Alternative
Specification #2
! 2!
Table A: Results of OLS Regressions
2007-2010 2007-2008 2009-2010
Average Average Average
PEPFAR funds per capita (log) 0.151 0.170 0.160
[0.061] [0.070] [0.068]
US total ODA per capita (log) -0.076 -0.052 -0.015
[0.069] [0.077] [0.063]
GDP per capita (log) -0.158 -0.469 0.156
[0.212] [0.219] [0.228]
World Bank governance indicator -0.812 -0.352 -0.590
[0.425] [0.460] [0.500]
Freedom House civil liberties score -0.298 -0.281 -0.257
[0.162] [0.168] [0.159]
Africa dummy 0.857 0.773 1.142
[0.334] [0.344] [0.355]
Imports to US (% of total US imports, log) 0.044 0.127 0.026
[0.099] [0.108] [0.108]
Exports from US (% to total US exports, log) -0.092 -0.140 -0.110
[0.141] [0.152] [0.163]
UN voting in accordance with US 1.492 0.586 0.966
[0.802] [0.766] [0.712]
Constant 2.053 4.994 -0.288
[2.136] [2.101] [2.180]
Number of countries 64 59 52 F statistics 11.53 11.69 11.28 R-square 0.538 0.601 0.623 Root MSE 0.821 0.807 0.708 Note: The outcome variable is the log ratio of Approve (%) and Disapprove (%)
responses to the question, “Do you approve or disapprove of the job performance of the
leadership in the United States?” Numbers in brackets are robust standard errors.
!! !
! 3!
Table B1: Results of 2SLS Regressions, Alternative Specification #1
2007-2010 2007-2008 2009-2010
Average Average Average
PEPFAR funds per capita (log) 0.054 0.061 0.066
[0.021] [0.025] [0.025]
US total ODA per capita (log) -0.028 -0.028 -0.015
[0.021] [0.026] [0.017]
GDP per capita (log) -0.117 -0.145 -0.001
[0.061] [0.069] [0.054]
World Bank governance indicator -0.151 -0.104 -0.132
[0.131] [0.163] [0.122]
Freedom House civil liberties score -0.083 -0.075 -0.077
[0.046] [0.051] [0.042]
Africa dummy 0.340 0.313 0.389
[0.091] [0.094] [0.103]
Imports to US (% of total US imports, log) 0.011 0.024 -0.014
[0.025] [0.029] [0.020]
Exports from US (% to total US exports, log) 0.008 -0.009 0.010
[0.038] [0.042] [0.033]
UN voting in accordance with US 0.420 0.257 0.268
[0.198] [0.208] [0.171]
Constant 1.460 1.658 0.505
[0.583] [0.650] [0.505]
Number of countries 57 55 46 Wald Chi-square 184.30 153.66 229.69 R-square 0.644 0.603 0.788 Root MSE 0.206 0.227 0.156 Note: The outcome variable is the difference between Approve (%) and Disapprove (%)
responses to the question, “Do you approve or disapprove of the job performance of the
leadership in the United States?” Numbers in brackets are robust standard errors.
!! !
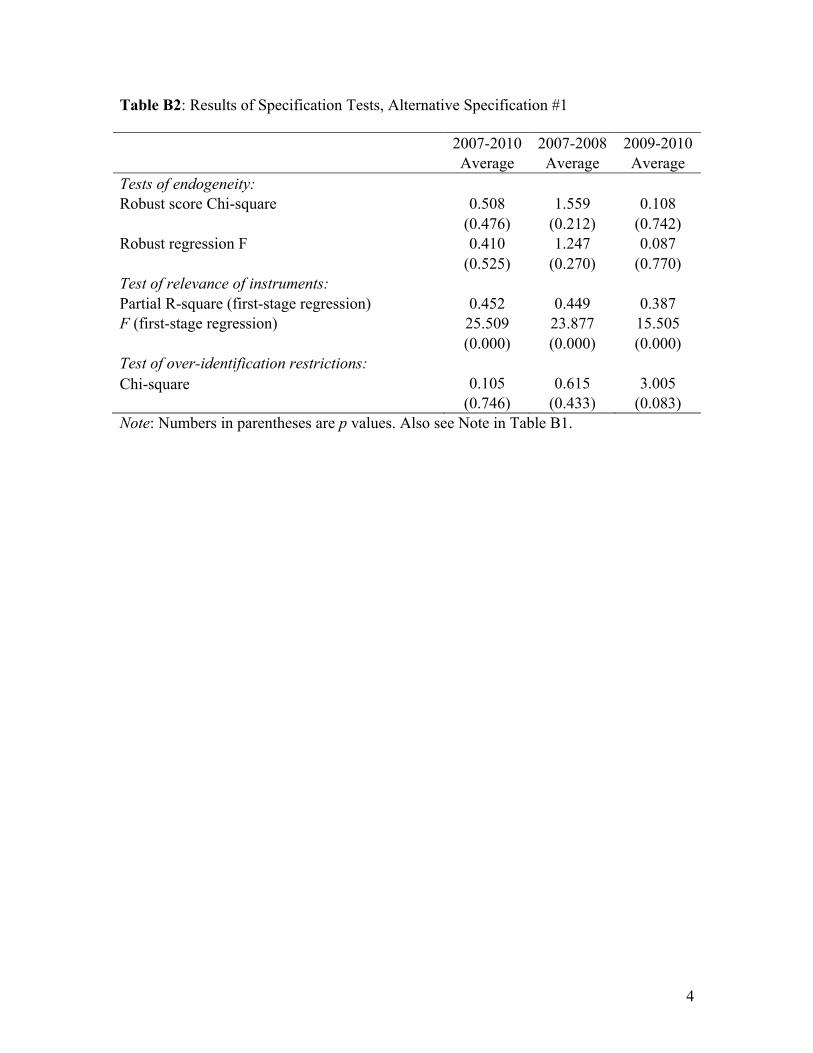
! 4!
Table B2: Results of Specification Tests, Alternative Specification #1
2007-2010 2007-2008 2009-2010
Average Average Average
Tests of endogeneity: Robust score Chi-square 0.508 1.559 0.108
(0.476) (0.212) (0.742) Robust regression F 0.410 1.247 0.087
(0.525) (0.270) (0.770) Test of relevance of instruments: Partial R-square (first-stage regression) 0.452 0.449 0.387 F (first-stage regression) 25.509 23.877 15.505
(0.000) (0.000) (0.000) Test of over-identification restrictions: Chi-square 0.105 0.615 3.005
(0.746) (0.433) (0.083) Note: Numbers in parentheses are p values. Also see Note in Table B1.
!! !
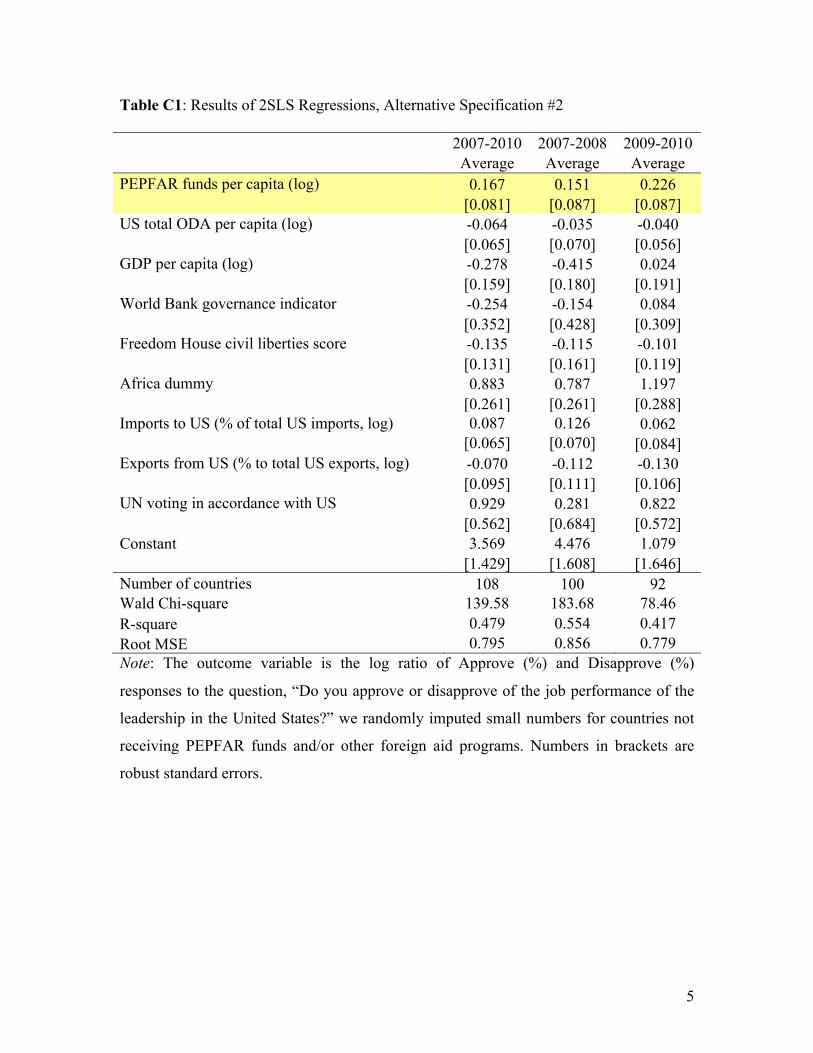
! 5!
Table C1: Results of 2SLS Regressions, Alternative Specification #2
2007-2010 2007-2008 2009-2010
Average Average Average
PEPFAR funds per capita (log) 0.167 0.151 0.226
[0.081] [0.087] [0.087]
US total ODA per capita (log) -0.064 -0.035 -0.040
[0.065] [0.070] [0.056]
GDP per capita (log) -0.278 -0.415 0.024
[0.159] [0.180] [0.191]
World Bank governance indicator -0.254 -0.154 0.084
[0.352] [0.428] [0.309]
Freedom House civil liberties score -0.135 -0.115 -0.101
[0.131] [0.161] [0.119]
Africa dummy 0.883 0.787 1.197
[0.261] [0.261] [0.288]
Imports to US (% of total US imports, log) 0.087 0.126 0.062
[0.065] [0.070] [0.084]
Exports from US (% to total US exports, log) -0.070 -0.112 -0.130
[0.095] [0.111] [0.106]
UN voting in accordance with US 0.929 0.281 0.822
[0.562] [0.684] [0.572]
Constant 3.569 4.476 1.079
[1.429] [1.608] [1.646]
Number of countries 108 100 92 Wald Chi-square 139.58 183.68 78.46 R-square 0.479 0.554 0.417 Root MSE 0.795 0.856 0.779 Note: The outcome variable is the log ratio of Approve (%) and Disapprove (%)
responses to the question, “Do you approve or disapprove of the job performance of the
leadership in the United States?” we randomly imputed small numbers for countries not
receiving PEPFAR funds and/or other foreign aid programs. Numbers in brackets are
robust standard errors.
! !

! 6!
Table C2: Results of Specification Tests, Alternative Specification #2
2007-2010 2007-2008 2009-2010
Average Average Average
Tests of endogeneity: Robust score Chi-square 3.162 1.129 4.958
(0.075) (0.288) (0.026) Robust regression F 3.504 1.092 5.476
(0.064) (0.299) (0.022) Test of relevance of instruments: Partial R-square (first-stage regression) 0.193 0.193 0.179 F (first-stage regression) 13.207 12.948 11.390
(0.000) (0.000) (0.000) Test of over-identification restrictions: Chi-square 2.828 4.774 0.432
(0.093) (0.029) (0.511) Note: Numbers in parentheses are p values. Also see Note in Table C1.