Embed Size (px)
Citation preview
http://eepa.aera.net
Policy AnalysisEducational Evaluation and
http://epa.sagepub.com/content/32/2/143The online version of this article can be found at:
DOI: 10.3102/0162373709359683
February 2010 2010 32: 143 originally published online 5EDUCATIONAL EVALUATION AND POLICY ANALYSIS
Liang Zhang and Erik C. NessDoes State Merit-Based Aid Stem Brain Drain?
Published on behalf of
American Educational Research Association
and
http://www.sagepublications.com
can be found at:Educational Evaluation and Policy AnalysisAdditional services and information for
http://eepa.aera.net/alertsEmail Alerts:
http://eepa.aera.net/subscriptionsSubscriptions:
http://www.aera.net/reprintsReprints:
http://www.aera.net/permissionsPermissions:
at UNIV OF GEORGIA LIBRARIES on June 30, 2010http://eepa.aera.netDownloaded from
Does State Merit-Based Aid Stem Brain Drain?
Liang ZhangThe Pennsylvania State University
Erik C. NessUniversity of Georgia
In this study, the authors use college enrollment and migration data to test the brain drain hypothesis. Their results suggest that state merit scholarship programs do indeed stanch the migration of “best and brightest” students to other states. In the aggregate and on average, the implementation of state merit aid programs both increases the total 1st-year student enrollment in merit aid states and boosts resident college enrollment in these states significantly. The gross enrollment increase is a function of increased total student enrollment from these states and, perhaps more important, decreased emigra-tion from these states. In addition to these overall effects, variations across states and across types of institutions exist due to scholarship eligibility criteria and award amount across states.
Keywords: higher education finance, student financial aid, student migration
In the past decade and a half, 14 states have adopted statewide scholarship programs that are awarded on the basis of academic merit as opposed to the more conventional criterion of students’ financial need. Policymakers have cited the need to “stanch the brain drain” (i.e., the migration of students to out-of-state col-leges) as one of the primary rationales for this large influx of funding and for the shift from need- to merit-based scholarships (Heller, 2002b). In fact, given the concentration of merit aid programs in the southeast, states in this region explicitly link these merit scholarship programs to the broader goal of preparing the workforce in hopes of retaining and attracting businesses. Indeed, a common slogan of state merit aid programs has been to “retain the best and brightest”1 students to attend colleges in-state
with the hope that they will enter the state’s workforce after college graduation.2
As merit scholarship programs have prolifer-ated among the states recently, so has merit aid captured the attention of both higher education researchers and the broader public. The populist appeal of generous scholarships for “B” stu-dents has led more than a dozen states to adopt these programs. Yet, researchers have highlighted the social consequences of allocating scarce state resources to students who were already likely to attend college and, more important, had the means to do so without a scholarship (Heller & Marin, 2002, 2004). In fact, much of the research on this issue considers the dispro-portionate effects of merit scholarship programs on students underrepresented in postsecondary education. It is surprising that few studies have
Please address correspondence to Erik C. Ness, Institute of Higher Education, 010 Meigs Hall, University of Georgia, Athens, GA 30606; phone: 706-542-0573; email: [email protected].
Educational Evaluation and Policy AnalysisJune 2010, Vol. 32, No. 2, pp. 143–165
DOI: 10.3102/0162373709359683© 2010 AERA. http://eepa.aera.net
at UNIV OF GEORGIA LIBRARIES on June 30, 2010http://eepa.aera.netDownloaded from
144
Zhang and Ness
considered the extent to which state merit aid programs alleviate the brain drain. Of course, the implicit assumption is that state merit aid pro-grams would have a positive effect on retaining the best and brightest students. As the first merit aid program, adopted in 1993, Georgia’s HOPE Scholarship program has been most often exam-ined by higher education researchers in single-state studies on student’s college choice deci-sions either within Georgia or out-of-state (Cornwell & Mustard, 2002, 2004; Cornwell, Mustard, & Sridhar, 2006; Dynarski, 2000, 2002). Our study extends this line of inquiry to a national scope by employing a research design similar to Cornwell et al. (2006), who find evi-dence that Georgia did indeed stanch the brain drain (i.e., reduce the migration of students to colleges out-of-state) due to the HOPE Scholarship program. As such, two research questions guide our examination. First, what is the effect of state merit-based scholarship pro-grams on stemming the brain drain? Second, does the effect vary across states and by different types of institutions? If so, how are these varia-tions related to the merit scholarship programs’ eligibility criteria and award amounts?
Literature Review
To examine how state merit aid programs affect students’ decisions of where to attend col-lege, our study is grounded in two related litera-ture bases: the determinants of student migra-tion and the effect of state merit aid programs. The first literature stream represents decades of studies of the practical policy trends and of economists’ analysis of the determinants of stu-dent migration patterns. The second more recent literature base represents an emerging line of inquiry on the effects of state merit scholarship programs.
Student migration. Given the wide variation between states, college student migration has consistently received attention from policymak-ers and researchers alike. For example, a 1989 Change article highlights state migration trends from high rates of out-migration in New Jersey to North Carolina and Massachusetts maximiz-ing trends of low-level emigration rates and high-level immigration rates to the balancing
trends in New Hampshire and Vermont of high out-migration and high in-migration of college students (Carnegie Foundation for the Advance-ment of Teaching, 1989). This article also sparked a response by Michael Olivas (1990) for its inat-tention to the role of state residency policies in which some states make in-migration of college students more attractive by easily allowing stu-dents to become state residents. Similar to the recent criticism of merit aid programs, Olivas criticizes state residency policies because the students benefiting from these liberal residency policies are overwhelmingly from higher income families. More recently, in a Chronicle of Higher Education article, Morphew (2006) identifies three trends that mitigate the barriers to student migration, including the increasing number of reciprocity agreements between states, rising autonomy and entrepreneurial behavior of pub-lic institutions, and variations of state popula-tions. Nevertheless, policymakers in states con-sidering the adoption of merit aid programs continue to identify student migration as a cause for concern. Officials in Wisconsin, for exam-ple, have recently proposed “tethering” college students in-state by offering merit scholarships with residency requirements post-graduation (Redden, 2007).
Researchers have extended the interstate col-lege attendance trends to specifically examine the “determinants of college student migration,” as the first such study is elegantly titled (Tuckman, 1970). Tuckman applies human capital invest-ment theory to test whether student migration is a result of investment or consumption theory of demand. That is, do students attend college out-of-state because they expect the benefits of their college degree to outweigh the higher tuition costs? Or, do students leave their home states because of qualities of out-of-state colleges not available at in-state colleges? Tuckman’s study, which employs a linear regression model based on a cross-sectional sample of states, finds that the proportion of out-migrating students is influenced by college prices at both in-state and out-of-state institutions. Student aid, however, does not prove to be a significant determinant (although Tuckman allows that this may be due to the inability of his model to distinguish between aid that follows the students and insti-tutional aid). Although these findings suggest
144
at UNIV OF GEORGIA LIBRARIES on June 30, 2010http://eepa.aera.netDownloaded from
145
Does State Merit Aid Stem Brain Drain?
support for human capital theory, Tuckman’s model did not sufficiently account for insti-tutional characteristics that might have better tested the consumption theory. Mixon and Hsing (1994a, 1994b) extend the determinants of out-of-state migration by including institutional characteristics in their two-stage least-squares model. Their studies find that small class sizes, college selectivity, high-performing faculty, successful athletic programs, and availability of diverse cultural opportunities attract out-of-state students.
More recent studies integrate college char-acteristics with the influences of college cost. Baryla and Dotterweich (2001), who also employ a two-stage least-squares model, suggest that students emigrating to other states are not con-cerned with higher prices but rather seek the characteristics of academic program quality, specifically as demonstrated by high selectivity and regional economic factors that lead to favor-able conditions for employment post-graduation. Perna and Titus (2004) confirm this finding that higher tuition rates do not significantly influ-ence students attending out-of-state institutions. Rather than attribute college choice decisions to characteristics of the institution and region, how-ever, Perna and Titus through hierarchical linear modeling find that student-level variables, such as demographic and academic characteristics, and state-level variables, such as state appropria-tions to the higher education sector, have the greatest effect on the decision of students to attend college out-of-state. An earlier single-state study using a log-linear model (Kyung, 1996) finds similar significant student- and state-level influences on the migration of undergradu-ate students to the state of New York, such as the admission rate of public 4-year institutions in the student’s home state and number of high school graduates and, more important, the SAT scores and per capita disposable income.
Just as Perna and Titus (2004) find that increases in state appropriations to higher edu-cation attract students from outside the state, Strathman (1994) finds the inverse—that high out-migration rates lead policymakers to lower state appropriations to the higher education sector. Strathman employs a three-stage least-squares model to test the benefit spillovers hypoth-esis and finds that as out-migration of students
increases by each percentage point, state appro-priations fall by $100 per student. Recent merit aid program adoptions suggest that, rather than address student migration through state appro-priation levels, states sought additional revenue streams, most often state-run lotteries, to bolster support for higher education through a new form of student financial aid.
The studies mentioned thus far deal solely with student migration for postsecondary edu-cation enrollment and do not address where students will reside upon graduating from col-lege. However, many state merit aid programs explicitly aim to enhance the state’s workforce as a means to generate economic development, which is predicated on in-state college gradu-ates remaining in their home state. Although our study does not directly measure the migration of college graduates, recent studies suggest that students attending college in-state are more likely to remain in-state post-graduation than students who attend college out-of-state are to return to their home state. For example, Perry (2001) uses follow-up surveys in 1994 and 1997 with partici-pants from the 1993 Baccalaureate and Beyond Longitudinal Study and finds that 84% of stu-dents attending college in-state remain in the state after graduation compared with 64% of students attending out-of-state institutions who return to their home state. In another study that tracks students 10 and 20 years post-graduation, Groen (2003) finds more modest results with a roughly 10 percentage point increase of home state residence post-graduation among students attending in-state colleges as compared with stu-dents attending college out-of-state. Furthermore, unlike most student migration studies, Groen accounts for academic achievement through SAT scores and finds that the effects of where students attend college on whether they return/remain in their home state are consistent across SAT scores. In fact, Groen suggests that this evidence supports the efforts of state merit schol-arship programs aimed at retaining high-achieving students.
State merit aid programs. Since the adoption of the initial merit aid program in Georgia and the subsequent adoption of similar programs in more than a dozen states, researchers have largely considered the effects of merit aid programs on
at UNIV OF GEORGIA LIBRARIES on June 30, 2010http://eepa.aera.netDownloaded from
146
Zhang and Ness
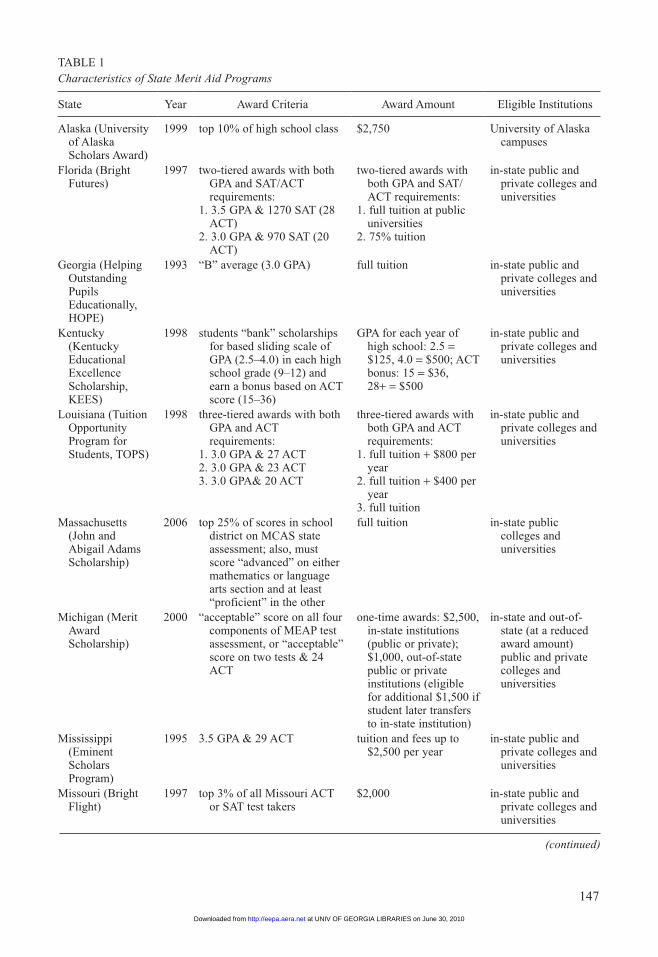
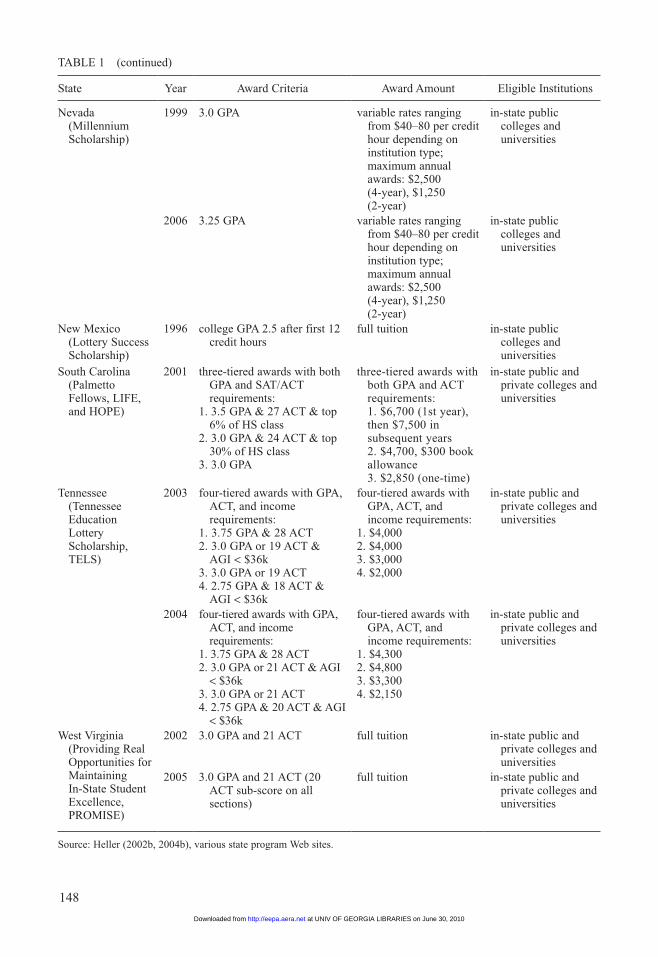
students and institutions. Two policy reports (Heller & Marin, 2002, 2004) provide an over-view of merit aid’s proliferation and highlight their negative social consequences, which are generally summarized as awarding scholarships to students who already planned to attend col-lege and could already afford to do so, rather than allocating scarce state resources to students in financial need of assistance. Heller (2002a, 2002b, 2004a) presents compelling descriptive evidence that, indeed, states with merit aid pro-grams have overwhelmingly shifted the share of state financial aid to merit scholarships as opposed to need-based grants. These introduc-tory chapters to the state merit aid trend also serve as a practical orientation to the variabil-ity of eligibility criteria and scholarship award amounts. Table 1 summarizes these merit aid pro-gram characteristics, including the substantive revisions that occurred in Nevada, Tennessee, and West Virginia.
Furthermore, recent research illustrates the disproportionate rates at which minority and low-income students are eligible for state merit-based aid in Georgia (Cornwell & Mustard, 2002, 2004; Dynarski, 2002), in Massachusetts (Heller, 2004b), in New Mexico (Binder & Ganderton, 2002, 2004), in Tennessee (Ness & Tucker, 2008), and across multiple states (Dynarski, 2004; Farrell, 2004; Heller & Rasmussen, 2002; Ness & Noland, 2007). Although each of these studies finds evidence of disproportionate effects by race and income, taken as a whole, these studies demonstrate that these disproportionate effects vary based on state programs’ award amounts and rigor of eligibility criteria. In addition to studies considering the effect by race and income, researchers have also empirically examined the effects of state merit aid programs on institutions, specifically on stu-dents’ academic achievement and attrition (Dee & Jackson, 1999; Henry, Rubenstein, & Bugler, 2004), on increasing tuition (Long, 2004), and on increasing enrollment (Cornwell et al., 2006; Dynarski, 2000, 2004). The final group of stud-ies on enrollment effects is most relevant to our study of merit aid programs’ influence on col-lege student migration.
Because state merit aid programs are still relatively recent policy innovations, much of the research on enrollment effects has been limited
either to single-state studies most often of Georgia’s HOPE program or to studies of the southeast region. Dynarski’s (2000) first study on this topic, which employs a difference-in-differences model, finds roughly a 7% to 8% enrollment increase in Georgia as a result of the HOPE Scholarship program. Her more recent study (Dynarski, 2004) confirms the enroll-ment increases in Georgia and finds that HOPE Scholarships indeed reduce student out-migration. Based on a similar difference-in-differences design for the southeast region, Dynarski (2004) finds that the seven southern state merit aid programs not only have consistent enrollment increases between 5% and 7% but also reduce (if only slightly) the college attendance gap between White and Black students. Across all states in Dynarski’s (2004) study, the most significant enrollment increases occurred at public 4-year institutions. In addition to corroborating this trend of the public flagship institutions realizing the largest enrollment increases, Cornwell et al. (2006), who also employed a difference-in-differences model, found that over a 10-year period (1988–1997), the Georgia HOPE pro-gram increased first year student college enroll-ment by nearly 6%. Moreover, with regard to the retention of the best and brightest students, Cornwell and colleagues note that these increases coincide with an increase in average academic credentials of incoming first year stu-dents. SAT scores rose 40 points upon adoption of the HOPE program compared with modest gains by other states in the region. As with Dynarski’s earlier work, Cornwell et al. (2006) also found strong evidence of HOPE reducing the migration of Georgia high school graduates to out-of-state institutions.
Our study extends research on college stu-dent migration and state merit aid programs in two important ways. First, we consider the effect of merit-based aid on the enrollment of different student migration groups. Studies of the enrollment effects of merit aid programs typically limit their examinations to total enroll-ment in a state. Our study incorporates aspects of the college student migration literature by examining the effect of state merit aid programs on resident enrollment and out-migration enroll-ment across all 50 states. Second, we provide a systematic analysis for the 13 merit aid states
at UNIV OF GEORGIA LIBRARIES on June 30, 2010http://eepa.aera.netDownloaded from
147
TABLE 1Characteristics of State Merit Aid Programs
State Year Award Criteria Award Amount Eligible Institutions
Alaska (University of Alaska Scholars Award)
1999 top 10% of high school class $2,750 University of Alaska campuses
Florida (Bright Futures)
1997 two-tiered awards with both GPA and SAT/ACT requirements:
1. 3.5 GPA & 1270 SAT (28 ACT)
2. 3.0 GPA & 970 SAT (20 ACT)
two-tiered awards with both GPA and SAT/ACT requirements:
1. full tuition at public universities
2. 75% tuition
in-state public and private colleges and universities
Georgia (Helping Outstanding Pupils Educationally, HOPE)
1993 “B” average (3.0 GPA) full tuition in-state public and private colleges and universities
Kentucky (Kentucky Educational Excellence Scholarship, KEES)
1998 students “bank” scholarships for based sliding scale of GPA (2.5–4.0) in each high school grade (9–12) and earn a bonus based on ACT score (15–36)
GPA for each year of high school: 2.5 = $125, 4.0 = $500; ACT bonus: 15 = $36,28+ = $500
in-state public and private colleges and universities
Louisiana (Tuition Opportunity Program for Students, TOPS)
1998 three-tiered awards with both GPA and ACT requirements:
1. 3.0 GPA & 27 ACT2. 3.0 GPA & 23 ACT3. 3.0 GPA& 20 ACT
three-tiered awards with both GPA and ACT requirements:
1. full tuition + $800 per year
2. full tuition + $400 per year
3. full tuition
in-state public and private colleges and universities
Massachusetts (John and Abigail Adams Scholarship)
2006 top 25% of scores in school district on MCAS state assessment; also, must score “advanced” on either mathematics or language arts section and at least “proficient” in the other
full tuition in-state public colleges and universities
Michigan (Merit Award Scholarship)
2000 “acceptable” score on all four components of MEAP test assessment, or “acceptable” score on two tests & 24 ACT
one-time awards: $2,500, in-state institutions (public or private); $1,000, out-of-state public or private institutions (eligible for additional $1,500 if student later transfers to in-state institution)
in-state and out-of-state (at a reduced award amount) public and private colleges and universities
Mississippi (Eminent Scholars Program)
1995 3.5 GPA & 29 ACT tuition and fees up to $2,500 per year
in-state public and private colleges and universities
Missouri (Bright Flight)
1997 top 3% of all Missouri ACT or SAT test takers
$2,000 in-state public and private colleges and universities
(continued)
at UNIV OF GEORGIA LIBRARIES on June 30, 2010http://eepa.aera.netDownloaded from
148
TABLE 1 (continued)
State Year Award Criteria Award Amount Eligible Institutions
Nevada (Millennium Scholarship)
1999 3.0 GPA variable rates ranging from $40–80 per credit hour depending on institution type; maximum annual awards: $2,500 (4-year), $1,250 (2-year)
in-state public colleges and universities
2006 3.25 GPA variable rates ranging from $40–80 per credit hour depending on institution type; maximum annual awards: $2,500 (4-year), $1,250 (2-year)
in-state public colleges and universities
New Mexico (Lottery Success Scholarship)
1996 college GPA 2.5 after first 12 credit hours
full tuition in-state public colleges and universities
South Carolina (Palmetto Fellows, LIFE, and HOPE)
2001 three-tiered awards with both GPA and SAT/ACT requirements:
1. 3.5 GPA & 27 ACT & top 6% of HS class
2. 3.0 GPA & 24 ACT & top 30% of HS class
3. 3.0 GPA
three-tiered awards with both GPA and ACT requirements: 1. $6,700 (1st year), then $7,500 in subsequent years 2. $4,700, $300 book allowance 3. $2,850 (one-time)
in-state public and private colleges and universities
Tennessee (Tennessee Education Lottery Scholarship, TELS)
2003 four-tiered awards with GPA, ACT, and income requirements:
1. 3.75 GPA & 28 ACT2. 3.0 GPA or 19 ACT &
AGI < $36k3. 3.0 GPA or 19 ACT 4. 2.75 GPA & 18 ACT &
AGI < $36k
four-tiered awards with GPA, ACT, and income requirements:
1. $4,0002. $4,0003. $3,0004. $2,000
in-state public and private colleges and universities
2004 four-tiered awards with GPA, ACT, and income requirements:
1. 3.75 GPA & 28 ACT2. 3.0 GPA or 21 ACT & AGI
< $36k3. 3.0 GPA or 21 ACT 4. 2.75 GPA & 20 ACT & AGI
< $36k
four-tiered awards with GPA, ACT, and income requirements:
1. $4,3002. $4,8003. $3,3004. $2,150
in-state public and private colleges and universities
West Virginia (Providing Real Opportunities for Maintaining In-State Student Excellence, PROMISE)
2002 3.0 GPA and 21 ACT full tuition in-state public and private colleges and universities
2005 3.0 GPA and 21 ACT (20 ACT sub-score on all sections)
full tuition in-state public and private colleges and universities
Source: Heller (2002b, 2004b), various state program Web sites.
at UNIV OF GEORGIA LIBRARIES on June 30, 2010http://eepa.aera.netDownloaded from
149
Does State Merit Aid Stem Brain Drain?
(Massachusetts, which adopted a merit aid program in 2005, is excluded from this analysis) that have adopted statewide merit aid programs, and more important, we examine the variations across these programs.
Data and Variables
The main data source of this study is the Integrated Postsecondary Education Data System (IPEDS) administered by the National Center for Education Statistics (NCES). We use IPEDS’s Enrollment Survey to construct the main variables in this analysis. In addition, we derive several control variables including the number of recent high school graduates, state per capita personal income, and state unemployment rate from various data sources. This section provides a detailed description of data collection and variable construction.
The IPEDS Enrollment Survey collects data on the state of residence of first-time, 1st-year students (hereafter conveniently referred to as college enrollment) in even-numbered years before 2000 and every year since then. These data are available through the IPEDS website at the NCES for the following 13 years: 1986, 1988, 1992, 1994, 1996, 1998, 2000, 2001, 2002, 2003, 2004, 2005, and 2006. For an unexplained reason, data are not available for 1990. In each year for which data are available, each institu-tion reported its enrollment of first-time, 1st-year students by state of residence (all 50 states, the District of Columbia, U.S. territories, and foreign countries). We include only 50 states in our analy-sis. In addition, we include only 4-year institu-tions in this study for two reasons. First, for substantive reasons, this study focuses on stu-dent migration, the vast majority of which hap-pens at 4-year institutions, because students attending 2-year institutions do so overwhelm-ingly in-state. Second, for practical reasons, the enrollment and migration data are more com-plete at 4-year colleges and universities than at 2-year colleges. Missing data would cause prob-lems when institutional data are aggregated within states.3
To facilitate our discussion, the following notation is used: a is the number of first-time, 1st-year students; i represents home state (i.e., the state where students are residents); j repre-
sents host state (i.e., the state where students attend college); and k denotes institutions. So aijkt is the number of students from state i who attend institution k in state j in year t. After aggregating aijkt over k (i.e., institutions within each state), we compute the number of students from state i who attend colleges in state j in year t, that is, aijt = ∑
k aijkt. Using aijt, we further define
the following three enrollment variables:
(1) aiit : resident enrollment in state i in year t when i = j in aijt (i.e., stayers)
(2) ai.t - aiit : emigrants from state i who attend colleges elsewhere in year t (i.e., leavers)
(3) ai.t = 50
∑j=1
aijt : total college enrollment from state i in year t (i.e., stayers and leavers)
Each of the above variables has important policy implications depending on specific policy goals of the merit aid program. For example, if the policy goal is to increase college enrollment of its residents in a state, regardless of where students attend colleges, then policymakers should focus on the total college enrollment. (It is noteworthy here that the total college enrollment from a state is defined as the number of students who attend colleges in its home state and elsewhere, whereas the total college enroll-ment in a state is defined as the number of stu-dents who attend colleges in a state, regardless of their resident states.) Conversely, if a merit aid program is intended to promote resident student enrollment in the home state and to reduce the number of resident students who out-migrate to other states (i.e., to reduce brain drain), then both Variables 1 and 2 should be examined.4
This study’s primary goal is to determine whether college enrollment (as defined by the above three variables) was affected by the imple-mentation of a merit-based aid program. It is obvious that college enrollment in a state is affected by a host of economic and demographic variables in addition to state financial aid poli-cies. We follow the literature on college enroll-ment and student migration and on the effect of state merit-based aid (e.g., Cornwell et al., 2006; Tuckman, 1970) and control for salient factors that affect college enrollment. These variables include the number of high school graduates, per capita income, and unemployment rate. The
at UNIV OF GEORGIA LIBRARIES on June 30, 2010http://eepa.aera.netDownloaded from
150
Zhang and Ness
estimated effects of these variables (not reported in this article due to space constraint) are sig-nificant and in expected directions in our empir-ical models.
Data on the number of public high school gradu-ates in each state are available from the Common Core Data administered by the NCES.5 For each state, we extract data on the number of high school diplomas awarded in each academic year that pre-cedes the academic year for which we have enroll-ment data. For example, the number of high school graduates in spring 2004 is matched up with the college first year student cohort in fall 2004. The high school completion cohort is not equivalent to the college-going cohort because not all high school graduates attend colleges immediately after gradua-tion. Alternatively, we could use weighted averages of the number of high school graduates over a num-ber of preceding years (e.g., the average of high school graduates during the past 2 years) to approx-imate the college-going cohort. These different measures of the college-going cohort do not pro-duce significantly different results.
Using the number of high school graduates to control for the variation in college enroll-ment does not account for changes in students’ academic preparation for colleges, which might be an important factor to consider especially for enrollment at 4-year institutions. Measures of academic preparation are not included in this analysis for several reasons, not the least of all is the unavailability of data in a consistent fashion over years. The average SAT scores of the gradu-ating high school cohort, for example, are avail-able periodically from College Board, but not for all years for which we have college enrollment data.6 A related challenge of using high school-level or state-level SAT data is that average SAT scores depend largely on the number of students who take the exam over years. That is, the more students who take the SAT in a high school or state, the lower the average score is likely to be (Graham & Husted, 1993; Marchant & Paulson, 2001). Finally, and perhaps most important, based on the financial incentive provided by a merit scholarship program, students might be working harder to obtain higher grades. In fact, improv-ing high school students’ academic achievement is one of the primary objectives of a state merit aid program (Heller, 2002b). It is not clear, however, how changes in students’ academic
preparation in those merit aid states—had there not been for the merit aid programs—would be significantly different from that in other states, which also suggests that this variable is not appropriate for our model. Besides, the time-fixed effect in our empirical model controls for any time trend in students’ academic preparation across different states. This modeling strategy also helps alleviate any potential omitted variable bias.
Economic theory suggests that the consump-tion of normal goods (i.e., college education in this particular case) increases when income is higher. Recent studies have shown that state per capita personal income affects students’ college enrollment decisions (Betts & McFarland, 1995; Buss, Parker, & Rivenburg, 2004). Data on state per capita income are available through the Bureau of Economic Analysis.7 We extract data on per capita personal income for each state for all 13 years for which we have enrollment data. Income data are adjusted by the Consumer Price Index to reflect real-dollar value. In addition, economic theory also suggests that individuals are more likely to attend college when its oppor-tunity cost is low. Recent studies have also shown that unemployment rate reflects the opportunity cost of attending college (Berger & Kostal, 2002; Betts & McFarland, 1995; Buss et al., 2004; Dellas & Sakellaris, 2003). Historical data on unemployment rate by state are avail-able through the Bureau of Labor Statistics.8 We extract the unemployment rate in each state in April of each year for which we have enrollment data. Other measures of opportunity costs such as minimum or average wage rates are not used because they are not as sensitive to labor market conditions as unemployment rate.
Method
This study’s primary goal is to determine whether merit-based financial aid programs alleviate brain drain. Because the 14 states in Table 1 adopted a merit-based aid program in different years, our strategy is to first evaluate the effect of a merit aid program in each of these states and then calculate the average effect. We do not include Massachusetts in our analysis because it has only 2 years of enrollment data since the adoption of a merit-based aid policy in
at UNIV OF GEORGIA LIBRARIES on June 30, 2010http://eepa.aera.netDownloaded from
151
Does State Merit Aid Stem Brain Drain?
2005. To test for the effect of merit aid, we need to compare the enrollment before and after the policy change. As in any policy evaluation study of this sort, the most difficult task is to construct a counterfactual (i.e., what would have happened if there had been no merit aid program). In this analysis, we adopt two strat-egies. The first is to use multiple regression analysis to control for salient variables that might have contributed to the change in college enrollment in a state over time, in particular before and after the implementation of a merit aid program. These control variables include the number of high school graduates, state per cap-ita income, and state unemployment rate. Second, we use comparable states to account for general factors that might have contributed to enrollment changes. These general factors might include, for example, business cycle and changes in the cost and return of college educa-tion. Assuming that these general factors will have a similar effect on college enrollment in a merit aid state and other comparable states, we are able to substitute the changes in college enrollment in other states for that in a merit aid state if there had been no policy change. This difference-in-differences method has been widely employed to study the effect of Georgia’s HOPE Scholarship (e.g., Cornwell et al., 2006; Dynarski, 2000; Long, 2004).
Our research design may be most clearly explained by discussing the difference-in-differences model for a single state. Using Florida as an example, we employ the following ordinary least squares regression:
yit = α + β (FL * post ) + γi statei (1) + θt yeart + Z'
it ξ + εit
where yit is our dependent variables (i.e., Vari-ables 1–3) in state i in year t; FL is a dummy variable for Florida (i.e., FL = 1 if Florida, FL = 0 if other states); post is a dummy variable that indicates the implementation of the merit-based aid program in Florida (i.e., post = 1 if year is 1997 or after, post = 0 if otherwise); statei is a set of dummy variables representing each of the comparison states (i.e., γi is state fixed effect); yeart is a set of dummy variables representing years (i.e., θt is year fixed effect);
Zit includes a
set of covariates in state i in year t (i.e., high
school graduates, state per capita income, and state unemployment rate), and finally, εit is the error term. Because these error terms could be serially correlated, it might lead to incorrect statistical inference with the difference-in-differences estimation (Bertrand, Duflo, & Mullainathan, 2004). Thus, we use feasible gen-eralized least squares to estimate Equation 1 that allows for AR(1) errors. The estimate of β reflects the difference in the differences between Florida and other comparable states before and after the adoption of merit aid after controlling for covariates in the model. Using this strategy with state and time fixed effects, we are able to con-trol for potential state-specific effects that are relatively stable over time within a state and any time effects that are common across states in each year. The state fixed effects, for example, have effectively controlled for any state charac-teristics that are constant or relatively stable over time. States differ greatly in their higher education systems (e.g., the level of state fund-ing, public and private sectors, number and types of institutions, etc.); however, these characteris-tics tend to be quite stable over time and thus can be captured by state fixed effects. The year fixed effects control for any national (or regional) eco-nomic, social, and political factors that might affect year-to-year college enrollment. These fixed effects help eliminate some potential omitted variable biases. In addition, because these state- and time-specific effects are estimated as fixed effects, they can be correlated with our main policy variables.
The next two considerations for our research design relate to time and comparison groups. First, how many years should be included in the before and after periods? The common strategy is to compare several years (e.g., 3–5 years) before and after the policy intervention (e.g., Cornwell et al., 2006; Dynarski, 2000; Long, 2004); however, our multiple-state model com-plicates this strategy. The 13 merit aid states have different policy implementation years, from the earliest in 1993 (Georgia) to the most recent case in 2003 (Tennessee). Because data are only available in even years before 2000, we include 6 years both before and after the policy change in each state. To illustrate, Florida intro-duced the merit-based aid in 1997, so the pre-period is from 1991 to 1996 with enrollment data
at UNIV OF GEORGIA LIBRARIES on June 30, 2010http://eepa.aera.netDownloaded from
152
Zhang and Ness
in 1992, 1994, and 1996, and the post-period is from 1997 to 2002 with enrollment data in 1998, 2000, 2001, and 2002. This general rule restricts comparison in a relatively short time frame to minimize the effect of other policy initiatives both in the merit aid states and in comparable states; on the other hand, it provides us with at least 3 years of enrollment data both before and after the policy change to estimate its effect.
Our second consideration relates to what con-stitutes a comparable group for states with merit aid programs, such as Florida. The selection of a comparable group is crucial in using the difference-in-differences method because the difference between the before and after periods in the comparable states is substituted for the difference between the before and after periods in Florida. That is, what happens in comparable states is used as the counterfactual for Florida if there has been no policy change. Because we are not aware of any single best definition of compa-rable states, we use four different comparison groups. Multiple comparison groups greatly reduce the possibility of bias in a single com-parison group design, so the more comparison groups the better (Meyer, 1995). Our analysis starts with the most general comparison group—states without merit-based aid programs—and then narrows down to states with similar out-migration profiles. Both regional compacts and bordering states are also commonly used com-parison groups in empirical study (e.g., Berry & Berry, 2007; Doyle, 2006; Hearn & Griswold, 1994; Zhang, 2007).
National group. Again, considering Florida as an example, the national group includes all other states except Florida. Considering that there are 13 other states that have adopted merit-based aid programs over time, including these states in the national comparable group will introduce additional complexities in the analysis. For example, South Carolina intro-duced merit-based aid in 2001, so South Carolina is a valid comparable state for Florida before 2001 but not after that. Excluding these merit aid states from the analysis, however, would probably exclude the states that are most similar to the focal state for the simple reason that they have all adopted merit-based aid at some point. As a result, the national
comparable group for Florida in our analysis includes only all 36 states that have never adopted merit-based aid as of 2006 and the other 13 merit aid states before the year when they adopted merit aid policies. (As a robust-ness check, we also ran all analyses based on the 36 states that have never adopted merit-based aid. Results are very similar to what is reported here.)
States with similar proportions of out-migra-tion students. States vary greatly in the severity of brain drain. The proportion of a state’s resi-dents attending colleges in other states ranges from around 10% (e.g., Utah, North Carolina, and Arkansas) to more than 50% (e.g., Connecticut, New Jersey, and Wyoming) based on enrollment data in 1992. Because of the focus on brain drain in this analysis, it seems appropriate to compare those merit aid states with other states that have a similar out-migra-tion profile. We divide all 50 states into 4 brackets (0–15%, 15–25%, 25–40%, 40% and above) based on the proportion of their resi-dents attending colleges in other states in 1992. For example, 4 merit aid states (Kentucky, Louisiana, Michigan, and West Virginia), together with 7 other non-merit aid states, fall into the first bracket. As a consequence, we compare each of the above 4 merit aid states with the remaining 10 states in the same bracket. Again, for those states in the compa-rable group that have adopted merit aid poli-cies at some point, we include only those years before their implementation.
Regional compact. States within a regional com-pact often share policy innovations based on their proximity and the compact’s efforts to dissemi-nate information (Cohen-Vogel, Ingle, Albee, & Spence, 2008; Hearn & Griswold, 1994). As a result, regional compacts are commonly used as comparison groups in recent empirical studies on merit-based aid programs (Cornwell et al., 2006; Dynarski, 2004). There are four main regional compacts in the United States: Southern Regional Education Board (SREB), Western Interstate Commission for Higher Education (WICHE), Midwest Higher Education Compact (MHEC), and New England Board of Higher Education (NEBHE).9 Similarly, we include all states in the
at UNIV OF GEORGIA LIBRARIES on June 30, 2010http://eepa.aera.netDownloaded from
153
Does State Merit Aid Stem Brain Drain?
same compact that have never adopted merit aid policies and those merit aid states before the implementation of these policies.
Bordering states. Bordering states (including water bordering such as Michigan and Minnesota, Rhode Island and New York) are also good can-didates for comparable states because the major-ity of student migration happens among states that share state lines (Zhang, 2007). To illus-trate, Florida has two bordering states: Alabama and Georgia. Here again, Georgia is excluded because it also had a merit-based aid program when Florida adopted its merit aid policy. So Alabama is the only comparable state for Florida if bordering states are used. Alaska does not have a bordering state.
Limitations
Our analysis has its limitations. Perhaps the most common limitation of studies that use the difference-in-differences technique is the fun-damental assumption that the time effects for both the treatment group and control group are similar. That is, without the policy intervention, the treatment group would experience similar changes in outcome variables to the control group. The validity of the before and after design with treatment and control groups largely hinges on the comparability of these two groups. It is unfortunate that this assumption cannot be eas-ily tested.
Three efforts have been made to strengthen our analysis: (a) We include three control vari-ables to account for salient factors related to college enrollment, (b) we use fixed effect models to control for both state and time fixed effects, and (c) we use multiple comparison groups to reduce the possibility of bias in a sin-gle comparison group design. Our results, how-ever, indicate that the bordering states compari-son group produced different results from the other three comparison groups. We undertake an additional step to understand these differences.
To better understand these differences between comparison groups and to account for within-state factors affecting student enrollment, we conduct a policy audit of all 50 states. This step involves a thorough search and review of The Chronicle of Higher Education “Almanac of
Higher Education” (2002) since the early 1990s to identify major state-level policy initiatives or changes that might have affected college enroll-ment and student migration. Among non-merit aid states, we identified 14 major policy initia-tives or changes, none of which leads to sig-nificant changes in the estimated coefficients. Among the 13 merit aid states, we identified three policy initiatives that might affect our results. First, Kentucky substantially increased tuition for 4 years between 2003 and 2007, which makes it difficult to isolate the effect of the merit-based aid program. Second, the merit scholarship program in Nevada increased its eligibility crite-ria from 3.0 to 3.25 GPA in 2004–2005, so our results might be more appropriately viewed as the average effect over time. Third, when the number of comparison states is smaller, the esti-mated effect for the treatment state is quite sus-ceptible to policy changes in an individual comparison state. For example, when the bor-dering state Alabama is used as the comparison state, the effect of merit-based aid on resident enrollment in Florida is estimated at 3%, much smaller than more than 20% when other com-parison groups are used.10
Results
For each of the 13 states that have a merit-based financial aid program, Equation 1 is esti-mated using the three enrollment measures as dependent variables in turn. In addition, to test whether a merit aid program has a similar effect on college enrollment at different types of institu-tions, these regressions are estimated by Carnegie categories. In particular, we estimate these equa-tions for research and doctoral institutions and other 4-year institutions. Furthermore, all above regressions are repeated by using four different comparison groups. Finally, to get an overall effect of these merit aid policies across states, we impose the restriction that the effect is the same when estimating these 13 equations by using the same comparable states for each merit aid state. This overall effect is reported in the last row of each table. It is noteworthy that given the great variation in the estimated effects across different states, this restriction is probably unre-alistic. However, it provides us with a general sense of the average effect of the merit aid
at UNIV OF GEORGIA LIBRARIES on June 30, 2010http://eepa.aera.netDownloaded from
154
Zhang and Ness
policy. So although we conveniently interpret these restricted coefficients as “average” effect in this section, it does not apply to each indi-vidual state. Due to space limits, only the effect of the merit-based aid program (i.e., the coeffi-cient of state * post) is reported; all other coef-ficients including state fixed effects, year fixed effects, and other covariates are suppressed.
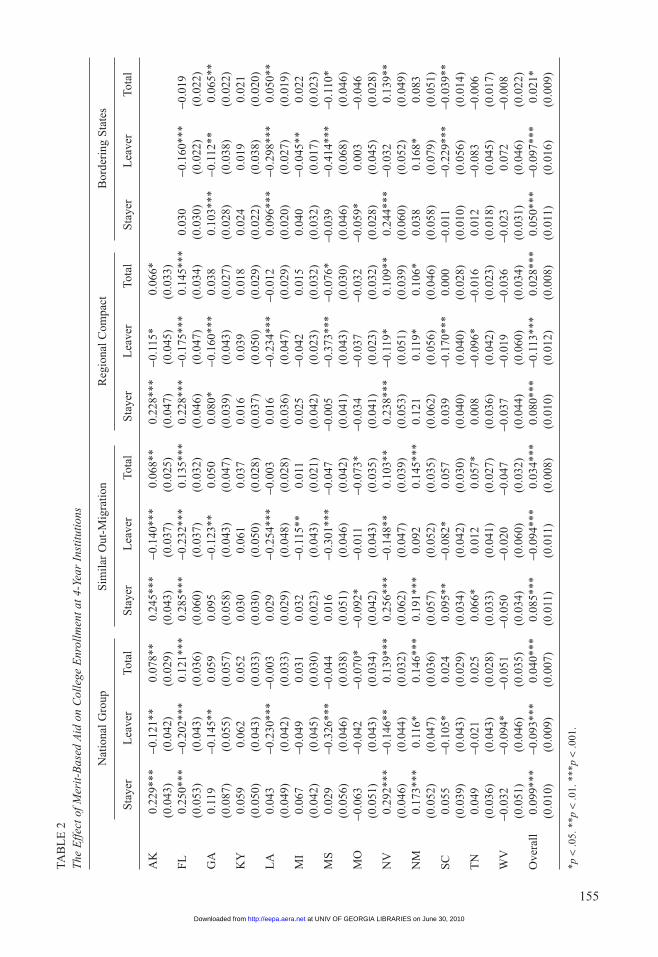
Resident first year student enrollment (stayers). Table 2 reports the effect of merit-based aid pro-grams on 4-year college first year student enroll-ment for each of the 13 merit aid states using four different comparison groups. The first col-umn in each of the four comparison group panels reports the effect of the merit aid program on the resident 1st-year student enrollment from each of the 13 states. Two observations from these Stayer columns are particularly important. First, the estimated effects are positive in most states. Second, there is great variation in the estimated effects across different states. The general posi-tive effect of merit-based aid programs on col-lege enrollment is well reflected in the positive and significant average effects based on each of the four comparison groups. For example, the overall effect based on national group is 0.099 log points with a standard error of 0.010. Note that college enrollment has been transformed by natural logarithm; hereafter, we use [exp(b)–1] to convert the estimated coefficients into per-centage changes. On average, the introduction of a merit-based aid program in a state increases resident 1st-year student enrollment in 4-year colleges by about 10.4% compared with states without such programs. Evaluated at the state mean 4-year college 1st-year student enrollment of about 14,000, this translates into an enroll-ment increase of nearly 1,500. The overall effects based on states with similar proportions of their residents attending colleges in other states, regional compacts, and bordering states are also positive and statistically significant, although the estimated coefficients (e.g., 8.9% based on states with similar out-migration pro-files, 8.3% based on regional compacts, and 5.1% based on bordering states) are somewhat smaller than those based on the national group. These results confirm the common wisdom that state merit aid programs increase resident enroll-ment in a state.
The estimate based on bordering states is somewhat smaller than that based on other com-parable groups. This is an interesting, but not surprising, finding because neighboring states are likely to react to each other. For example, Florida’s pre-policy period was influenced by the implementation of HOPE Scholarship in Georgia, whereas South Carolina created an aid program especially for Georgia residents in response to the HOPE program. These reactions among states could reduce the effectiveness of merit aid programs, especially when neighbor-ing states are used as the comparable group. Although our results might indicate these across-state interactions, the nature of our data prevents us from estimating the effect of the original merit aid programs and other states’ responses separately.
This estimated overall effect, however, masks a great deal of variation across states. Regression results based on the national comparison group indicate that among the 13 merit aid states, only 4 states have positive and significant effects. Positive but insignificant coefficients are esti-mated in 7 states, and the remaining 2 states (Missouri and West Virginia) have negative although statistically insignificant results. Alaska, Florida, Nevada, and Mew Mexico have the largest increases (25.7%, 28.4%, 33.9%, and 18.9%, respectively) in resident first year student enrollment after the introduction of merit-based aid programs in these states. As we will discuss in greater detail below, this may be in part because of the high level of award amounts, which fund the full tuition costs or near equiva-lent awards. Georgia, Kentucky, Michigan, and South Carolina also have large estimated effects that are greater than 5% (12.6%, 6.1%, 6.9%, and 5.6%, respectively), but probably due to a rela-tively small number of data points, these results are not statistically significant. For example, in Georgia, only two data points before and three points after the introduction of a merit-based aid program are available because enrollment data are available every other year before 2000 and not available in 1990. This substantially limits the statistical power of our analysis. The magni-tude of the estimated coefficients, however, is consistent with other published studies. For example, Cornwell et al. (2006) used five data points both before and after the introduction of
at UNIV OF GEORGIA LIBRARIES on June 30, 2010http://eepa.aera.netDownloaded from
155
TAB
LE
2T
he E
ffec
t of M
erit
-Bas
ed A
id o
n C
olle
ge E
nrol
lmen
t at 4
-Yea
r In
stit
utio
ns
N
atio
nal G
roup
S
imil
ar O
ut-M
igra
tion
R
egio
nal C
ompa
ct
Bor
deri
ng S
tate
s
S
taye
r L
eave
r To
tal
Sta
yer
Lea
ver
Tota
l S
taye
r L
eave
r To
tal
Sta
yer
Lea
ver
Tota
l
AK
0.
229*
**
-0.1
21**
0.
078*
* 0.
245*
**
-0.1
40**
* 0.
068*
* 0.
228*
**
-0.1
15*
0.06
6*
(0
.043
) (0
.042
) (0
.029
) (0
.043
) (0
.037
) (0
.025
) (0
.047
) (0
.045
) (0
.033
)
F
L
0.25
0***
-0
.202
***
0.12
1***
0.
285*
**
-0.2
32**
* 0.
135*
**
0.22
8***
-0
.175
***
0.14
5***
0.
030
-0.1
60**
* -0
.019
(0
.053
) (0
.043
) (0
.036
) (0
.060
) (0
.037
) (0
.032
) (0
.046
) (0
.047
) (0
.034
) (0
.030
) (0
.022
) (0
.022
)G
A
0.11
9 -0
.145
**
0.05
9 0.
095
-0.1
23**
0.
050
0.08
0*
-0.1
60**
* 0.
038
0.10
3***
-0
.112
**
0.06
5**
(0
.087
) (0
.055
) (0
.057
) (0
.058
) (0
.043
) (0
.047
) (0
.039
) (0
.043
) (0
.027
) (0
.028
) (0
.038
) (0
.022
)K
Y
0.05
9 0.
062
0.05
2 0.
030
0.06
1 0.
037
0.01
6 0.
039
0.01
8 0.
024
0.01
9 0.
021
(0
.050
) (0
.043
) (0
.033
) (0
.030
) (0
.050
) (0
.028
) (0
.037
) (0
.050
) (0
.029
) (0
.022
) (0
.038
) (0
.020
)L
A
0.04
3 -0
.230
***
-0.0
03
0.02
9 -0
.254
***
-0.0
03
0.01
6 -0
.234
***
-0.0
12
0.09
6***
-0
.298
***
0.05
0**
(0
.049
) (0
.042
) (0
.033
) (0
.029
) (0
.048
) (0
.028
) (0
.036
) (0
.047
) (0
.029
) (0
.020
) (0
.027
) (0
.019
)M
I 0.
067
-0.0
49
0.03
1 0.
032
-0.1
15**
0.
011
0.02
5 -0
.042
0.
015
0.04
0 -0
.045
**
0.02
2
(0.0
42)
(0.0
45)
(0.0
30)
(0.0
23)
(0.0
43)
(0.0
21)
(0.0
42)
(0.0
23)
(0.0
32)
(0.0
32)
(0.0
17)
(0.0
23)
MS
0.
029
-0.3
26**
* -0
.044
0.
016
-0.3
01**
* -0
.047
-0
.005
-0
.373
***
-0.0
76*
-0.0
39
-0.4
14**
* -0
.110
*
(0.0
56)
(0.0
46)
(0.0
38)
(0.0
51)
(0.0
46)
(0.0
42)
(0.0
41)
(0.0
43)
(0.0
30)
(0.0
46)
(0.0
68)
(0.0
46)
MO
-0
.063
-0
.042
-0
.070
* -0
.092
* -0
.011
-0
.073
* -0
.034
-0
.037
-0
.032
-0
.059
* 0.
003
-0.0
46
(0.0
51)
(0.0
43)
(0.0
34)
(0.0
42)
(0.0
43)
(0.0
35)
(0.0
41)
(0.0
23)
(0.0
32)
(0.0
28)
(0.0
45)
(0.0
28)
NV
0.
292*
**
-0.1
46**
0.
139*
**
0.25
6***
-0
.148
**
0.10
3**
0.23
8***
-0
.119
* 0.
109*
* 0.
244*
**
-0.0
32
0.13
9**
(0
.046
) (0
.044
) (0
.032
) (0
.062
) (0
.047
) (0
.039
) (0
.053
) (0
.051
) (0
.039
) (0
.060
) (0
.052
) (0
.049
)N
M
0.17
3***
0.
116*
0.
146*
**
0.19
1***
0.
092
0.14
5***
0.
121
0.11
9*
0.10
6*
0.03
8 0.
168*
0.
083
(0
.052
) (0
.047
) (0
.036
) (0
.057
) (0
.052
) (0
.035
) (0
.062
) (0
.056
) (0
.046
) (0
.058
) (0
.079
) (0
.051
)S
C
0.05
5 -0
.105
* 0.
024
0.09
5**
-0.0
82*
0.05
7 0.
039
-0.1
70**
* 0.
000
-0.0
11
-0.2
29**
* -0
.039
**
(0.0
39)
(0.0
43)
(0.0
29)
(0.0
34)
(0.0
42)
(0.0
30)
(0.0
40)
(0.0
40)
(0.0
28)
(0.0
10)
(0.0
56)
(0.0
14)
TN
0.
049
-0.0
21
0.02
5 0.
066*
0.
012
0.05
7*
0.00
8 -0
.096
* -0
.016
0.
012
-0.0
83
-0.0
06
(0.0
36)
(0.0
43)
(0.0
28)
(0.0
33)
(0.0
41)
(0.0
27)
(0.0
36)
(0.0
42)
(0.0
23)
(0.0
18)
(0.0
45)
(0.0
17)
WV
-0
.032
-0
.094
* -0
.051
-0
.050
-0
.020
-0
.047
-0
.037
-0
.019
-0
.036
-0
.023
0.
072
-0.0
08
(0.0
51)
(0.0
46)
(0.0
35)
(0.0
34)
(0.0
60)
(0.0
32)
(0.0
44)
(0.0
60)
(0.0
34)
(0.0
31)
(0.0
46)
(0.0
22)
Ove
rall
0.
099*
**
-0.0
93**
* 0.
040*
**
0.08
5***
-0
.094
***
0.03
4***
0.
080*
**
-0.1
13**
* 0.
028*
**
0.05
0***
-0
.097
***
0.02
1*
(0.0
10)
(0.0
09)
(0.0
07)
(0.0
11)
(0.0
11)
(0.0
08)
(0.0
10)
(0.0
12)
(0.0
08)
(0.0
11)
(0.0
16)
(0.0
09)
*p <
.05.
**p
< .0
1. *
**p
< .0
01.
at UNIV OF GEORGIA LIBRARIES on June 30, 2010http://eepa.aera.netDownloaded from
156
Zhang and Ness
the HOPE Scholarship in Georgia and found that the program increased total 1st-year student enrollment (including resident and nonresident enrollment in Georgia) by 9.0% at public 4-year institutions and by 14.1% at private 4-year institutions.
It is not surprising that the estimated effects of merit-based aid programs on resident enroll-ment are somewhat different when different comparison groups are used; however, these esti-mates are qualitatively similar, especially among the first three comparison groups. For example, the estimated coefficients for Alaska are 0.229, 0.245, and 0.228 log points when the national group, states with similar out-migration profiles, and regional compact are used as comparison groups, respectively. The estimates produced by the last comparison group, the bordering states, seem to be quite different in several states. For example, as discussed in the previous Limitations section, the estimated effect for Florida in the last panel is 0.030 log points and statistically insignificant, whereas those effects in the first three panels are much larger and statistically significant.
Out-migration first year student enrollment from a state (leavers). The second main depen-dent variable is the number of students in a merit aid state who attend colleges in other states (i.e., leavers). Results reported in Table 2 generally support the hypothesis that state-sponsored merit-based aid programs were suc-cessful in reducing brain drain. Compared with states without merit aid programs, the introduc-tion of a merit aid program has decreased the number of students from merit aid states who attend out-of-state colleges and universities by nearly 9% (i.e., –0.093 log points in the second column of the first panel), on average. Results based on states with similar out-migration pro-files, regional compacts, and bordering states are very similar at –0.094, –0.113, and –0.097 log points.
Again, there is a great deal of variation across these merit aid states. For example, regression results based on the national com-parison group show that 11 of the 13 merit aid states have reduced the number of their resi-dent students attending colleges in other states. The estimated effects are significant in 8 states,
including Alaska with a reduction of 11.4%, Florida 18.3%, Georgia 13.5%, Louisiana 20.5%, Mississippi 27.8%, Nevada 13.6%, South Carolina 10.0%, and West Virginia 9.0%. Kentucky and New Mexico are the only 2 states that have actually increased the number of stu-dents attending colleges in other states after the adoption of merit-based aid programs, with a 6.4% and a 12.3% increase for Kentucky and New Mexico, respectively. The increase in out-migration in these two states should be consid-ered in conjunction with the increase in the resident enrollment in these states.
Total 1st-year student enrollment. Changes in total college enrollment from a state could be from two sources: resident and out-migration enrollment. The first and second columns in each panel report the effect of merit-based aid programs on resident (stayers) and out-migration (leavers) enrollment separately. Given the oppo-site directions of the effects on these two types of enrollment, it is important to examine the effect of merit-based aid on the total college enrollment from a state. For example, it could be the case that a merit-based aid program does not increase the total enrollment from a state; instead, it only attracts more students to stay in their home state. Or, it could be the case that merit-based aid programs both increase the total college enrollment from a state and reduce stu-dent out-migration.
Results in the last column of each panel reveal that merit-based aid programs have a positive effect on the total college enrollment from a state, although the relative increase in total college enrollment is much smaller than the increase in resident college enrollment because of reduced student out-migration. For example, the overall effect on total college enrollment based on the national comparison group is about a 4.1% (0.040 log points), which is much smaller than a 10.4% (0.099 log points), increase in resident enrollment. The average effects on total college enrollment based on states with similar out-migration profiles, regional compacts, and bordering states are estimated at 3.5%, 2.8%, and 2.1%, respectively, smaller than the corre-sponding effects on resident enrollment. Again, as in the case of resident and out-migration enroll-ment, the estimated effects of merit-based aid
at UNIV OF GEORGIA LIBRARIES on June 30, 2010http://eepa.aera.netDownloaded from
157
Does State Merit Aid Stem Brain Drain?
programs on total college enrollment vary across states and differ by comparison groups.
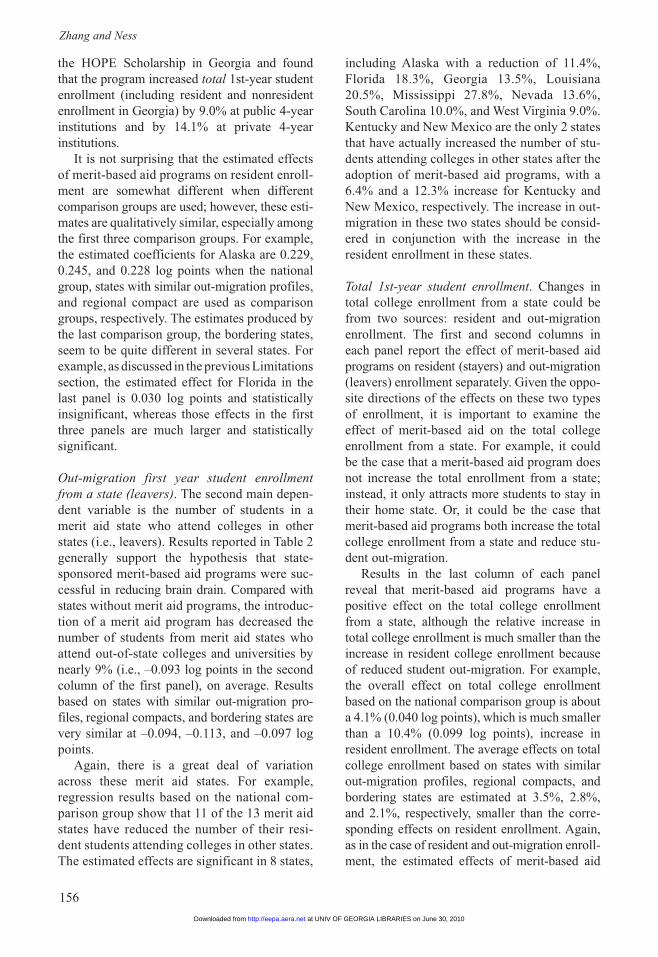
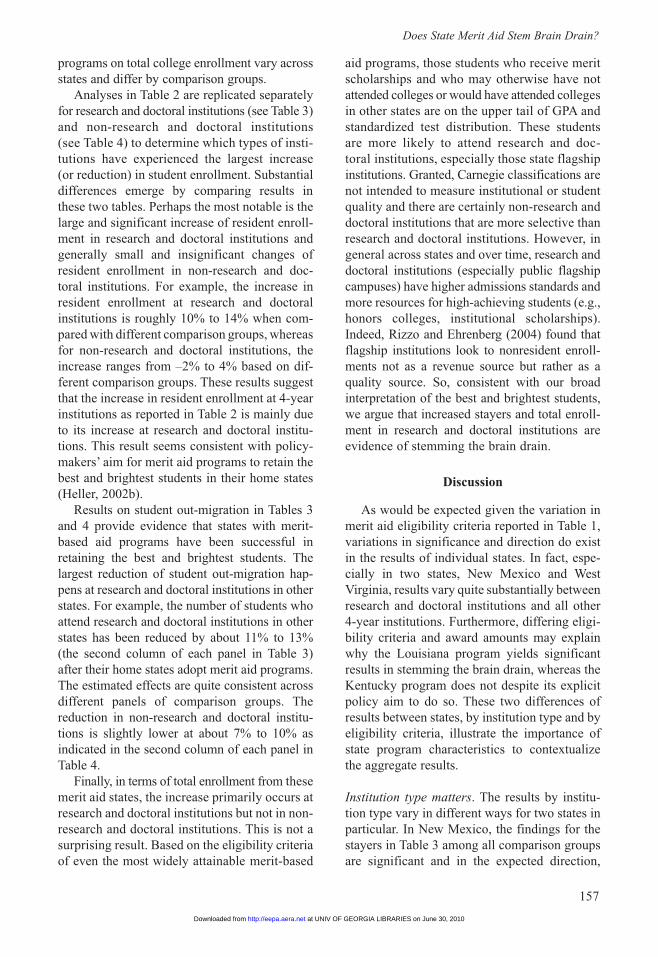
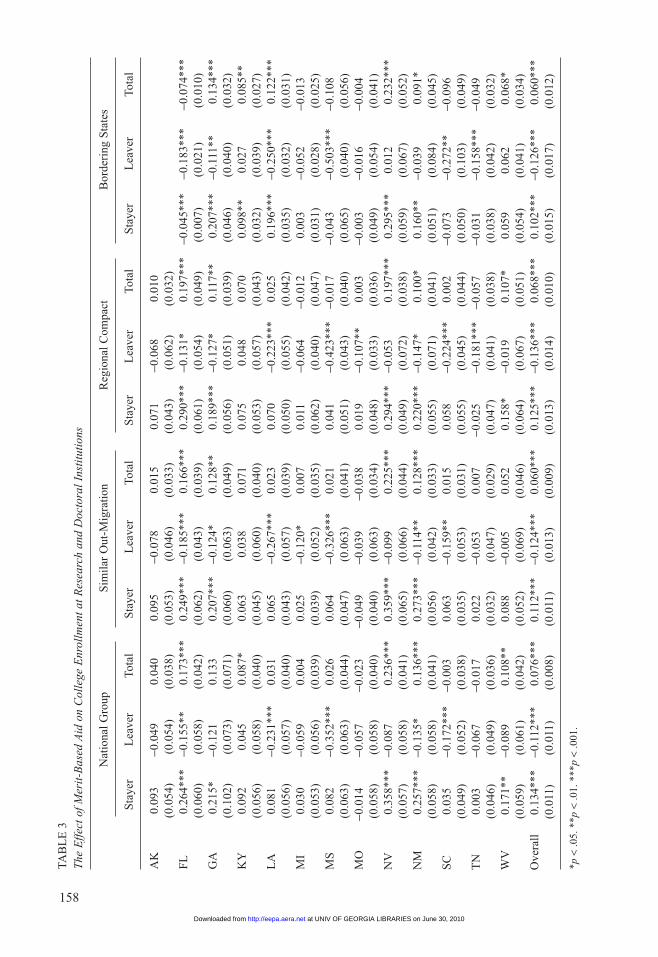
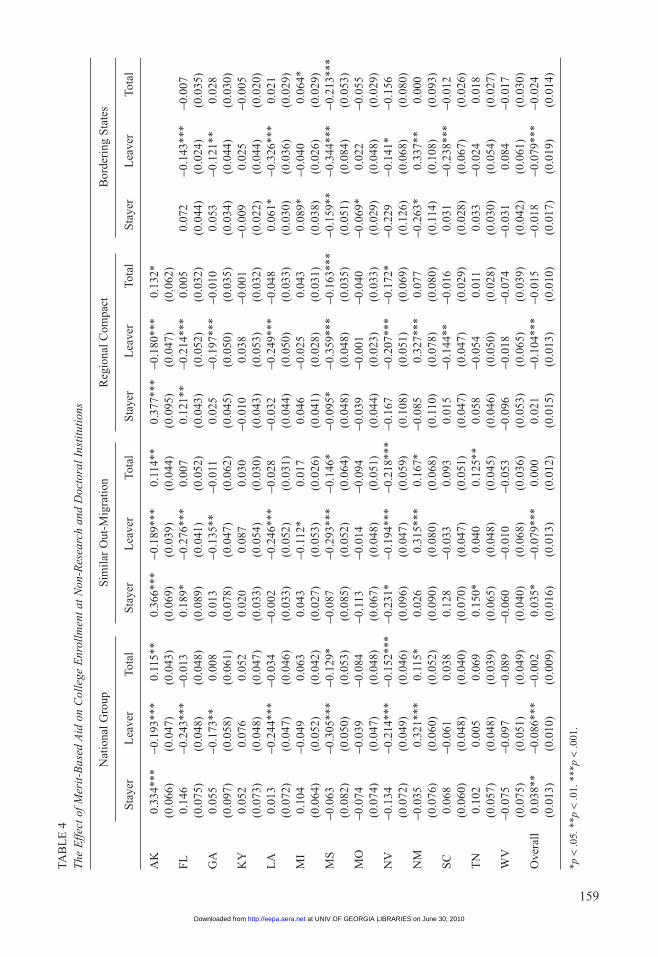
Analyses in Table 2 are replicated separately for research and doctoral institutions (see Table 3) and non-research and doctoral institutions (see Table 4) to determine which types of insti-tutions have experienced the largest increase (or reduction) in student enrollment. Substantial differences emerge by comparing results in these two tables. Perhaps the most notable is the large and significant increase of resident enroll-ment in research and doctoral institutions and generally small and insignificant changes of resident enrollment in non-research and doc-toral institutions. For example, the increase in resident enrollment at research and doctoral institutions is roughly 10% to 14% when com-pared with different comparison groups, whereas for non-research and doctoral institutions, the increase ranges from –2% to 4% based on dif-ferent comparison groups. These results suggest that the increase in resident enrollment at 4-year institutions as reported in Table 2 is mainly due to its increase at research and doctoral institu-tions. This result seems consistent with policy-makers’ aim for merit aid programs to retain the best and brightest students in their home states (Heller, 2002b).
Results on student out-migration in Tables 3 and 4 provide evidence that states with merit-based aid programs have been successful in retaining the best and brightest students. The largest reduction of student out-migration hap-pens at research and doctoral institutions in other states. For example, the number of students who attend research and doctoral institutions in other states has been reduced by about 11% to 13% (the second column of each panel in Table 3) after their home states adopt merit aid programs. The estimated effects are quite consistent across different panels of comparison groups. The reduction in non-research and doctoral institu-tions is slightly lower at about 7% to 10% as indicated in the second column of each panel in Table 4.
Finally, in terms of total enrollment from these merit aid states, the increase primarily occurs at research and doctoral institutions but not in non-research and doctoral institutions. This is not a surprising result. Based on the eligibility criteria of even the most widely attainable merit-based
aid programs, those students who receive merit scholarships and who may otherwise have not attended colleges or would have attended colleges in other states are on the upper tail of GPA and standardized test distribution. These students are more likely to attend research and doc-toral institutions, especially those state flagship institutions. Granted, Carnegie classifications are not intended to measure institutional or student quality and there are certainly non-research and doctoral institutions that are more selective than research and doctoral institutions. However, in general across states and over time, research and doctoral institutions (especially public flagship campuses) have higher admissions standards and more resources for high-achieving students (e.g., honors colleges, institutional scholarships). Indeed, Rizzo and Ehrenberg (2004) found that flagship institutions look to nonresident enroll-ments not as a revenue source but rather as a quality source. So, consistent with our broad interpretation of the best and brightest students, we argue that increased stayers and total enroll-ment in research and doctoral institutions are evidence of stemming the brain drain.
Discussion
As would be expected given the variation in merit aid eligibility criteria reported in Table 1, variations in significance and direction do exist in the results of individual states. In fact, espe-cially in two states, New Mexico and West Virginia, results vary quite substantially between research and doctoral institutions and all other 4-year institutions. Furthermore, differing eligi-bility criteria and award amounts may explain why the Louisiana program yields significant results in stemming the brain drain, whereas the Kentucky program does not despite its explicit policy aim to do so. These two differences of results between states, by institution type and by eligibility criteria, illustrate the importance of state program characteristics to contextualize the aggregate results.
Institution type matters. The results by institu-tion type vary in different ways for two states in particular. In New Mexico, the findings for the stayers in Table 3 among all comparison groups are significant and in the expected direction,
at UNIV OF GEORGIA LIBRARIES on June 30, 2010http://eepa.aera.netDownloaded from
158
TAB
LE
3T
he E
ffec
t of M
erit
-Bas
ed A
id o
n C
olle
ge E
nrol
lmen
t at R
esea
rch
and
Doc
tora
l Ins
titu
tion
s
N
atio
nal G
roup
S
imil
ar O
ut-M
igra
tion
R
egio
nal C
ompa
ct
Bor
deri
ng S
tate
s
S
taye
r L
eave
r To
tal
Sta
yer
Lea
ver
Tota
l S
taye
r L
eave
r To
tal
Sta
yer
Lea
ver
Tota
l
AK
0.
093
-0.0
49
0.04
0 0.
095
-0.0
78
0.01
5 0.
071
-0.0
68
0.01
0
(0.0
54)
(0.0
54)
(0.0
38)
(0.0
53)
(0.0
46)
(0.0
33)
(0.0
43)
(0.0
62)
(0.0
32)
FL
0.
264*
**
-0.1
55**
0.
173*
**
0.24
9***
-0
.185
***
0.16
6***
0.
290*
**
-0.1
31*
0.19
7***
-0
.045
***
-0.1
83**
* -0
.074
***
(0
.060
) (0
.058
) (0
.042
) (0
.062
) (0
.043
) (0
.039
) (0
.061
) (0
.054
) (0
.049
) (0
.007
) (0
.021
) (0
.010
)G
A
0.21
5*
-0.1
21
0.13
3 0.
207*
**
-0.1
24*
0.12
8**
0.18
9***
-0
.127
* 0.
117*
* 0.
207*
**
-0.1
11**
0.
134*
**
(0.1
02)
(0.0
73)
(0.0
71)
(0.0
60)
(0.0
63)
(0.0
49)
(0.0
56)
(0.0
51)
(0.0
39)
(0.0
46)
(0.0
40)
(0.0
32)
KY
0.
092
0.04
5 0.
087*
0.
063
0.03
8 0.
071
0.07
5 0.
048
0.07
0 0.
098*
* 0.
027
0.08
5**
(0
.056
) (0
.058
) (0
.040
) (0
.045
) (0
.060
) (0
.040
) (0
.053
) (0
.057
) (0
.043
) (0
.032
) (0
.039
) (0
.027
)L
A
0.08
1 -0
.231
***
0.03
1 0.
065
-0.2
67**
* 0.
023
0.07
0 -0
.223
***
0.02
5 0.
196*
**
-0.2
50**
* 0.
122*
**
(0.0
56)
(0.0
57)
(0.0
40)
(0.0
43)
(0.0
57)
(0.0
39)
(0.0
50)
(0.0
55)
(0.0
42)
(0.0
35)
(0.0
32)
(0.0
31)
MI
0.03
0 -0
.059
0.
004
0.02
5 -0
.120
* 0.
007
0.01
1 -0
.064
-0
.012
0.
003
-0.0
52
-0.0
13
(0.0
53)
(0.0
56)
(0.0
39)
(0.0
39)
(0.0
52)
(0.0
35)
(0.0
62)
(0.0
40)
(0.0
47)
(0.0
31)
(0.0
28)
(0.0
25)
MS
0.
082
-0.3
52**
* 0.
026
0.06
4 -0
.326
***
0.02
1 0.
041
-0.4
23**
* -0
.017
-0
.043
-0
.503
***
-0.1
08
(0.0
63)
(0.0
63)
(0.0
44)
(0.0
47)
(0.0
63)
(0.0
41)
(0.0
51)
(0.0
43)
(0.0
40)
(0.0
65)
(0.0
40)
(0.0
56)
MO
-0
.014
-0
.057
-0
.023
-0
.049
-0
.039
-0
.038
0.
019
-0.1
07**
0.
003
-0.0
03
-0.0
16
-0.0
04
(0.0
58)
(0.0
58)
(0.0
40)
(0.0
40)
(0.0
63)
(0.0
34)
(0.0
48)
(0.0
33)
(0.0
36)
(0.0
49)
(0.0
54)
(0.0
41)
NV
0.
358*
**
-0.0
87
0.23
6***
0.
359*
**
-0.0
99
0.22
5***
0.
294*
**
-0.0
53
0.19
7***
0.
295*
**
0.01
2 0.
232*
**
(0.0
57)
(0.0
58)
(0.0
41)
(0.0
65)
(0.0
66)
(0.0
44)
(0.0
49)
(0.0
72)
(0.0
38)
(0.0
59)
(0.0
67)
(0.0
52)
NM
0.
257*
**
-0.1
35*
0.13
6***
0.
273*
**
-0.1
14**
0.
128*
**
0.22
0***
-0
.147
* 0.
100*
0.
160*
* -0
.039
0.
091*
(0
.058
) (0
.058
) (0
.041
) (0
.056
) (0
.042
) (0
.033
) (0
.055
) (0
.071
) (0
.041
) (0
.051
) (0
.084
) (0
.045
)S
C
0.03
5 -0
.172
***
-0.0
03
0.06
3 -0
.159
**
0.01
5 0.
058
-0.2
24**
* 0.
002
-0.0
73
-0.2
72**
-0
.096
(0
.049
) (0
.052
) (0
.038
) (0
.035
) (0
.053
) (0
.031
) (0
.055
) (0
.045
) (0
.044
) (0
.050
) (0
.103
) (0
.049
)T
N
0.00
3 -0
.067
-0
.017
0.
022
-0.0
53
0.00
7 -0
.025
-0
.181
***
-0.0
57
-0.0
31
-0.1
58**
* -0
.049
(0
.046
) (0
.049
) (0
.036
) (0
.032
) (0
.047
) (0
.029
) (0
.047
) (0
.041
) (0
.038
) (0
.038
) (0
.042
) (0
.032
)W
V
0.17
1**
-0.0
89
0.10
8**
0.08
8 -0
.005
0.
052
0.15
8*
-0.0
19
0.10
7*
0.05
9 0.
062
0.06
8*
(0.0
59)
(0.0
61)
(0.0
42)
(0.0
52)
(0.0
69)
(0.0
46)
(0.0
64)
(0.0
67)
(0.0
51)
(0.0
54)
(0.0
41)
(0.0
34)
Ove
rall
0.
134*
**
-0.1
12**
* 0.
076*
**
0.11
2***
-0
.124
***
0.06
0***
0.
125*
**
-0.1
36**
* 0.
068*
**
0.10
2***
-0
.126
***
0.06
0***
(0
.011
) (0
.011
) (0
.008
) (0
.011
) (0
.013
) (0
.009
) (0
.013
) (0
.014
) (0
.010
) (0
.015
) (0
.017
) (0
.012
)
*p <
.05.
**p
< .0
1. *
**p
< .0
01.
at UNIV OF GEORGIA LIBRARIES on June 30, 2010http://eepa.aera.netDownloaded from
159
TAB
LE
4T
he E
ffec
t of M
erit
-Bas
ed A
id o
n C
olle
ge E
nrol
lmen
t at N
on-R
esea
rch
and
Doc
tora
l Ins
titu
tion
s
N
atio
nal G
roup
S
imil
ar O
ut-M
igra
tion
R
egio
nal C
ompa
ct
Bor
deri
ng S
tate
s
S
taye
r L
eave
r To
tal
Sta
yer
Lea
ver
Tota
l S
taye
r L
eave
r To
tal
Sta
yer
Lea
ver
Tota
l
AK
0.
334*
**
-0.1
93**
* 0.
115*
* 0.
366*
**
-0.1
89**
* 0.
114*
* 0.
377*
**
-0.1
80**
* 0.
132*
(0.0
66)
(0.0
47)
(0.0
43)
(0.0
69)
(0.0
39)
(0.0
44)
(0.0
95)
(0.0
47)
(0.0
62)
FL
0.
146
-0.2
43**
* -0
.013
0.
189*
-0
.276
***
0.00
7 0.
121*
* -0
.214
***
0.00
5 0.
072
-0.1
43**
* -0
.007
(0
.075
) (0
.048
) (0
.048
) (0
.089
) (0
.041
) (0
.052
) (0
.043
) (0
.052
) (0
.032
) (0
.044
) (0
.024
) (0
.035
)G
A
0.05
5 -0
.173
**
0.00
8 0.
013
-0.1
35**
-0
.011
0.
025
-0.1
97**
* -0
.010
0.
053
-0.1
21**
0.
028
(0
.097
) (0
.058
) (0
.061
) (0
.078
) (0
.047
) (0
.062
) (0
.045
) (0
.050
) (0
.035
) (0
.034
) (0
.044
) (0
.030
)K
Y
0.05
2 0.
076
0.05
2 0.
020
0.08
7 0.
030
-0.0
10
0.03
8 -0
.001
-0
.009
0.
025
-0.0
05
(0.0
73)
(0.0
48)
(0.0
47)
(0.0
33)
(0.0
54)
(0.0
30)
(0.0
43)
(0.0
53)
(0.0
32)
(0.0
22)
(0.0
44)
(0.0
20)
LA
0.
013
-0.2
44**
* -0
.034
-0
.002
-0
.246
***
-0.0
28
-0.0
32
-0.2
49**
* -0
.048
0.
061*
-0
.326
***
0.02
1
(0.0
72)
(0.0
47)
(0.0
46)
(0.0
33)
(0.0
52)
(0.0
31)
(0.0
44)
(0.0
50)
(0.0
33)
(0.0
30)
(0.0
36)
(0.0
29)
MI
0.10
4 -0
.049
0.
063
0.04
3 -0
.112
* 0.
017
0.04
6 -0
.025
0.
043
0.08
9*
-0.0
40
0.06
4*
(0.0
64)
(0.0
52)
(0.0
42)
(0.0
27)
(0.0
53)
(0.0
26)
(0.0
41)
(0.0
28)
(0.0
31)
(0.0
38)
(0.0
26)
(0.0
29)
MS
-0
.063
-0
.305
***
-0.1
29*
-0.0
87
-0.2
93**
* -0
.146
* -0
.095
* -0
.359
***
-0.1
63**
* -0
.159
**
-0.3
44**
* -0
.213
***
(0
.082
) (0
.050
) (0
.053
) (0
.085
) (0
.052
) (0
.064
) (0
.048
) (0
.048
) (0
.035
) (0
.051
) (0
.084
) (0
.053
)M
O
-0.0
74
-0.0
39
-0.0
84
-0.1
13
-0.0
14
-0.0
94
-0.0
39
-0.0
01
-0.0
40
-0.0
69*
0.02
2 -0
.055
(0
.074
) (0
.047
) (0
.048
) (0
.067
) (0
.048
) (0
.051
) (0
.044
) (0
.023
) (0
.033
) (0
.029
) (0
.048
) (0
.029
)N
V
-0.1
34
-0.2
14**
* -0
.152
***
-0.2
31*
-0.1
94**
* -0
.218
***
-0.1
67
-0.2
07**
* -0
.172
* -0
.229
-0
.141
* -0
.156
(0
.072
) (0
.049
) (0
.046
) (0
.096
) (0
.047
) (0
.059
) (0
.108
) (0
.051
) (0
.069
) (0
.126
) (0
.068
) (0
.080
)N
M
-0.0
35
0.32
1***
0.
115*
0.
026
0.31
5***
0.
167*
-0
.085
0.
327*
**
0.07
7 -0
.263
* 0.
337*
* 0.
000
(0
.076
) (0
.060
) (0
.052
) (0
.090
) (0
.080
) (0
.068
) (0
.110
) (0
.078
) (0
.080
) (0
.114
) (0
.108
) (0
.093
)S
C
0.06
8 -0
.061
0.
038
0.12
8 -0
.033
0.
093
0.01
5 -0
.144
**
-0.0
16
0.03
1 -0
.238
***
-0.0
12
(0.0
60)
(0.0
48)
(0.0
40)
(0.0
70)
(0.0
47)
(0.0
51)
(0.0
47)
(0.0
47)
(0.0
29)
(0.0
28)
(0.0
67)
(0.0
26)
TN
0.
102
0.00
5 0.
069
0.15
0*
0.04
0 0.
125*
* 0.
058
-0.0
54
0.01
1 0.
033
-0.0
24
0.01
8
(0.0
57)
(0.0
48)
(0.0
39)
(0.0
65)
(0.0
48)
(0.0
45)
(0.0
46)
(0.0
50)
(0.0
28)
(0.0
30)
(0.0
54)
(0.0
27)
WV
-0
.075
-0
.097
-0
.089
-0
.060
-0
.010
-0
.053
-0
.096
-0
.018
-0
.074
-0
.031
0.
084
-0.0
17
(0.0
75)
(0.0
51)
(0.0
49)
(0.0
40)
(0.0
68)
(0.0
36)
(0.0
53)
(0.0
65)
(0.0
39)
(0.0
42)
(0.0
61)
(0.0
30)
Ove
rall
0.
038*
* -0
.086
***
-0.0
02
0.03
5*
-0.0
79**
* 0.
000
0.02
1 -0
.104
***
-0.0
15
-0.0
18
-0.0
79**
* -0
.024
(0
.013
) (0
.010
) (0
.009
) (0
.016
) (0
.013
) (0
.012
) (0
.015
) (0
.013
) (0
.010
) (0
.017
) (0
.019
) (0
.014
)
*p <
.05.
**p
< .0
1. *
**p
< .0
01.
at UNIV OF GEORGIA LIBRARIES on June 30, 2010http://eepa.aera.netDownloaded from
160
Zhang and Ness
indicating that of New Mexico residents attend-ing research and doctoral institutions, more students stayed in-state to attend the University of New Mexico (UNM) and New Mexico State University (NMSU) rather than an out-of-state research and doctoral institution. However, as reported in the Leaver columns of Table 4, the results for the migration models are significant in the opposite direction for students attending non-research and doctoral institutions, which indicates that students attending these institu-tion types were more likely to do so out-of-state since the inception of the New Mexico Lottery Success Scholarship program.11 Although this may seem surprising at first glance, much of this difference can be attributed to the New Mexico merit aid program’s unique eligibility require-ment, which is based solely on a student’s GPA during the first semester at a New Mexico pub-lic institution, and full-tuition award amount. When you combine these program characteris-tics with the near open-enrollment policies of the New Mexico flagship campuses and their practice of offering “bridge scholarships” to fund students’ first semester prior to merit aid funding, students have multiple financial incen-tives to attend a flagship campus. Indeed, our findings corroborate trends reported by Binder and Ganderton (2002, 2004) on enrollment effects of the New Mexico program on students attending UNM. Binder and Ganderton’s studies identify the enrollment shift in New Mexican college students to UNM as an unintended con-sequence of the merit aid eligibility criteria that led to an increase in less well-prepared students attending the New Mexico flagships and, subse-quently, increased attrition rates. Albeit in a dif-ferent way, the flagship campus in West Virginia also contributed to differing results by institu-tion type.
The only significant results for West Virginia are recorded in the Stayer and Total columns in Table 3, which indicates that West Virginians attending research and doctoral institutions are more likely to do so in-state. As with New Mexico, this is due to characteristics of the West Virginia PROMISE Scholarship program and of West Virginia University (WVU), the only research and doctoral institution in the state. Unlike New Mexico’s unique merit aid eligibil-ity criteria, the PROMISE criteria are among the
most rigorous of all broad-based state merit aid programs. Furthermore, in contrast to the near open-enrollment policies of the New Mexico flag-ships, admission to WVU has become increas-ingly more selective. As a result, nearly 40% of all PROMISE Scholarship recipients enroll in WVU.12 Despite these stark differences by insti-tution type, our results suggest that the policy-makers who crafted the PROMISE Scholarship program have met their intended goals. The ratio-nale for adopting a higher GPA and standardized-test score requirement in West Virginia was tied directly to the explicit policy aim of retaining the best and brightest students as a means to enhance the state’s workforce (Ness, 2008). Despite simi-lar aims of merit aid programs in Kentucky and Tennessee, our findings do not indicate that these programs alleviate the brain drain regardless of institution type. This consistent finding across institution types appears to be largely due to the liberal eligibility criteria in Kentucky and Tennessee, which spread scholarship recipients across many institutions rather than concentrated in a flagship campus as in West Virginia. Also, the Kentucky and Tennessee scholarships are available beginning in students’ first semester unlike in New Mexico where UNM and NMSU have offered “bridge scholarships” to cover stu-dents’ first semester.
Unlike New Mexico and West Virginia, other state merit aid programs yield signifi-cant results in the predicted direction. With regard to Florida’s Bright Futures program, for example, the Stayer columns of Table 3 indicate that Florida students attending research and doctoral institutions are much more likely to do so in-state. Likewise, the Leaver columns of Table 4 indicate that fewer students are attending non-research and doc-toral institutions out-of-state. These results might be explained by Bright Futures’ two-tiered award program that seems to target stu-dents in both institution types. The full-tuition scholarship for students earning at least a 3.5 GPA and 1270 SAT may be enticing more Florida residents to attend institutions such as the University of Florida and Florida State University. The second tier award of 75% tuition may also be enough to keep Florida students from leaving the state to attend non-research and doctoral institutions. As the
at UNIV OF GEORGIA LIBRARIES on June 30, 2010http://eepa.aera.netDownloaded from

161
Does State Merit Aid Stem Brain Drain?
Florida results indicate, differences by institu-tion type may also be explained by differ-ences in merit aid program characteristics.
Award criteria and amounts matter. Although eligibility criteria and award amounts do not uniformly explain the effect of state merit aid programs, the absence of consistently significant effects in reducing the brain drain in Michigan and in Kentucky may be explained by their low award amounts. The Michigan Merit Award, for example, provides a modest one-time scholar-ship to students based on their scores on a state-wide assessment. Moreover, Michigan’s is the only state merit scholarship that students can use at colleges and universities out-of-state (although at a reduced amount). Given these characteristics of the Michigan Merit Award, it is not surprising that this program does not significantly alleviate the brain drain.
The merit aid program in Kentucky has a manifest goal for the state’s best high school students to attend in-state colleges and univer-sities. Yet, as opposed to significant results for similar broad-based state programs such as Florida’s Bright Futures, Georgia’s HOPE, Louisiana’s TOPS, Nevada’s Millennium, and South Carolina’s HOPE, our empirical analysis indicates that Kentucky’s KEES has not met this goal. In addition to the possible effect of sub-stantial tuition increases that we mentioned in the previous Limitations section, the lack of sig-nificant findings can be attributed to the pro-gram’s eligibility criteria, which are among the most liberally awarded of all state programs. The Kentucky program awards scholarships on a sliding scale for GPA in Grades 9 through 12 and standardized-test performance. Given the vari-able award amounts, it appears that not all stu-dents are enticed by the sometimes small schol-arships, especially because the maximum awards for the highest achieving students ($2,500) are less than one half of tuition costs at a 4-year public institution (College Board, 2007). By contrast, Louisiana’s award amounts are equal to full tuition with the possibility of additional funding for books.
As reported in the Leaver columns of Table 2, Louisiana’s merit aid program has one of the most significant and substantive effects of all 13 states with the TOPS program decreasing
out-migration by nearly 20%. Unlike in Kentucky, the minimum eligibility criteria for Louisiana’s merit scholarships are a 3.0 GPA and a 20 ACT score (950 SAT equivalent). These simply understood scholarship criteria and, perhaps more important, the full-tuition award amounts seem to have a greater effect on alleviating the brain drain than Kentucky’s more inclusive cri-teria and more modest award amounts.
Conclusion and Implications
In this study, we use college enrollment and migration data to test the brain drain hypothesis—that state merit-based scholarship programs alle-viate the migration of students to out-of-state colleges. Our results suggest that state merit aid programs do indeed stanch the migration of the best and brightest students to other states. To be sure, we use the term “best and brightest” quite broadly by making the claim based on evidence of increased stayer enrollment in research and doctoral universities in-state and reduced leaver enrollment in these institutions. In the aggregate and on average, the implementation of state merit aid programs both increases the total 1st-year student enrollment in merit aid states and boosts resident college enrollment in these states sig-nificantly. The gross enrollment increase is a function of increased total student enrollment from these states and, more directly relevant to our study’s question, decreased emigration from these states. That is, the adoption of a merit aid program has both income and substitution effects.13 However, there is a great deal of varia-tion across states and across types of institu-tions. These variations appear to be related to differences in eligibility criteria and award amount across states. As we discussed in the previous section, future research might further examine the mitigating effects on the brain drain of this variation between state merit aid program characteristics.
Results in this study provide an important tool to simulate the effect of merit-based aid programs on different enrollment types. For example, imagine an average state with a total college enrollment of 100 before the introduction of a merit aid program. Based on our data, about 30% of total enrollment in a typical state is nonresident enrollment. That is, about 70 of the total 100 is
at UNIV OF GEORGIA LIBRARIES on June 30, 2010http://eepa.aera.netDownloaded from
162
Zhang and Ness
resident enrollment and the other 30 students attend institutions in other states. After the intro-duction of a merit-based aid program, the resi-dent enrollment increases by about 10%, from 70 to 77. (We use the regression results based on national group in this calculation.) At the same time, student out-migration decreases by 10%, from 30 to 27. As a result, the total enrollment from this typical state increases from 100 to 104 (i.e., 77 + 27), representing a 4% increase, which is consistent with our estimates in Table 2. In relative terms, the proportion of students who attend 4-year institutions in other states decreases from 30% to about 26% (i.e., 27 / 104).
This simulation based on estimated results can facilitate the understanding of the effect of merit-based aid on college enrollment of differ-ent categories of students. For example, it is widely believed that merit-based aid programs increase resident enrollment in a state. Results from this analysis suggest that this increase comes from two sources: increases in the total college enrollment from a state and a decrease in the proportion of out-migration students. Our results also indicate that the increase in resident enrollment in a merit aid state is mainly driven by increases in enrollment at research and doc-toral institutions.
Given the findings of this study that, on aver-age, state merit aid programs do indeed alleviate the brain drain and that variation exists among state programs, further research might consider the effectiveness of merit scholarship programs in meeting other goals such as improving the state workforce and expanding college access. For instance, does the reduced out-migration of students lead to an enhanced workforce? If so, does this attract corporations to the state or lead increases in state gross domestic product (GDP)? Similarly, do state merit aid programs increase college access? That is, are more low-income and racial and ethnic minority stu-dents attending college as a result of these merit scholarship programs? Studies examining these questions would seemingly find variation between states, too. As a result, such empirical work would have implications for states considering adopting merit aid programs or revising existing programs.
In addition to testing explicitly desired out-comes of state merit scholarship programs,
future studies might also consider the effects of these programs on students and institutions. Although our study finds evidence of reduced out-migration rates, it does not consider aca-demic and demographic characteristics of the students remaining in-state or migrating to other states. Even single-state studies that control for these characteristics would add to our under-standing of which students are most responsive to the incentives of merit scholarships. Of course, institution-level analysis would further inform the effect of state merit aid programs on college attendance patterns. For instance, our study finds that enrollment increases are more pronounced at research and doctoral institutions. Future stud-ies might consider whether these institutions are able to maintain (or even increase) the academic credentials of these retained students and the diversity of their incoming class. In capturing such effects of state merit aid programs, varia-tion is likely to exist. These empirical variations between state programs still merit further exami-nation as state merit aid programs continue to proliferate and evolve.
Notes
1With regard to state merit scholarship programs, “best and brightest” seems to be a relative term. That is, there is no wide consensus on what academic cre-dentials constitute the best and brightest students. Missouri’s Bright Flight program awards a one-time $2,000 scholarship to only the top 3% of SAT test tak-ers, whereas Tennessee’s merit aid program awards students with SAT scores below the 50th percentile nearly full tuition scholarships. Yet, both states explic-itly aim to retain the best and brightest students through these scholarships. So, this term seems to be used more for rhetorical reasons by policymakers than for its descriptive accuracy in retaining high-achiev-ing students. Indeed, state merit aid programs, depend-ing on the rigor of their eligibility criteria and whether they recognize it or not, seem to be using the term with the irony that David Halberstam (1972) intended in his best-selling book, The Best and the Brightest. Although our study does not include measures, such as SAT scores, to track the academic qualifications of students, we are able to examine the migration of the best and brightest students by broadly interpreting the term.
2Admittedly, retaining 1st-year college students does not have as direct of an effect on a state’s work-force as does retaining college graduates.
at UNIV OF GEORGIA LIBRARIES on June 30, 2010http://eepa.aera.netDownloaded from
163
Does State Merit Aid Stem Brain Drain?
Nevertheless, as we discuss more fully in the litera-ture review, recent studies (Groen, 2003; Perry, 2001) have shown in-state college graduates as 10% to 20% more likely to enter the state’s workforce than state residents graduating from out-of-state colleges.
3Because we have limited our sample to 4-year institutions, the missing data problem is not severe. For all years we have data, the missing observations are 10.3%. The majority of these missing observations occur in early years (e.g., 1986, 1988). Because most states adopted merit-based aid programs after 1995 and we use 6 years before and after policy implemen-tation, the effect of missing data on our results is minimal. In fact, in most recent years, the missing data are less than 0.5%. Because we use state aggregate enrollment data, missing data should be carefully handled. We took advantage of panel data and interpo-lated those missing observations. For example, if data for 2001 are missing, we use the average of 2000 and 2002 to replace that missing value.
4Besides these important enrollment variables, we have also created variables such as the total enroll-ment in a state and nonresident student enrollment in a state. These are important policy variables to con-sider if the policy goal is to increase nonresident enrollment in a state (e.g., due to diversity, quality, and tuition revenue consideration). Results are avail-able upon request.
5Data are available at: http://www.nces.ed.gov/ccd/.6Also, state-level data are not available prior to
1998. The College Board provides archived SAT data and reports at http://professionals.collegeboard.com/data-reports-research/sat/archived.
7Data are available at http://www.bea.gov/regional/spi/default.cfm?satable=summary.
8Data are available at http://data.bls.gov/cgi-bin/surveymost?la.
9SREB has membership of 16 states: Alabama, Arkansas, Delaware, Florida, Georgia, Kentucky, Louisiana, Maryland, Mississippi, North Carolina, Oklahoma, South Carolina, Tennessee, Texas, Virginia, and West Virginia. WICHE includes another 15 states: Alaska, Arizona, California, Colorado, Hawaii, Idaho, Montana, Nevada, New Mexico, North Dakota, Oregon, South Dakota, Utah, Washington, and Wyoming. The MHEC includes Kansas, Michigan, Missouri, Minnesota, Nebraska, North Dakota, and recently Wisconsin and Illinois. Finally, NEBHE cov-ers six states: Connecticut, Maine, Massachusetts, New Hampshire, Rhode Island, and Vermont. These regional compacts usually offer tuition reciprocity programs to its members. For more information on tuition reciprocity programs, see the survey conducted by the Cornell Higher Education Research Institute at http://www.ilr.cornell.edu/cheri/surveys/2001survey Results.html.
10These differences suggest that resident enrollment in Alabama increased greatly in the mid-1990s. Indeed, in 1997, the governor proposed a significant budgetary change to the higher education system in Alabama. Specific plans included raising nonresident tuition rates, reducing state appropriations to public institu-tions with out-of-state enrollment exceeding 25%, and funding a Georgia HOPE-like merit-based aid program. Although the proposal to adopt a lottery to fund a merit-based aid program was eventually and unexpectedly defeated, the proposal itself might have enticed stu-dents to stay in-state and discouraged institutions from enrolling a high proportion of nonresident students.
11In 2006, the program was renamed the Legislative Lottery Scholarship program.
12As reported on the West Virginia University Undergraduate Scholarship Office website: http://www.arc.wvu.edu/Scholars_Office/PROMISE/index.html.
13In consumer theory, the income effect refers to the observation that changes in prices can affect buyers’ purchasing power. In this particular case, changes in college costs would lead to higher demand for college education overall. The substitution effect is the effect observed with changes in relative prices of goods. In our particular case, the relative decrease of in-state colleges would increase its demand relative to out-of-state colleges.
References
Almanac of higher education, Arkansas. (2002). The Chronicle of Higher Education. Retrieved April 11, 2009, from http://chronicle.com/weekly/ almanac/2002/states/ar.htm
Baryla, E. A., & Dotterweich, D. (2001). Student migration: Do significant factors vary by region? Education Economics, 9(3), 269–280.
Berger, M. C., & Kostal, T. (2002). Financial resources, regulation, and enrollment in U.S. public higher education. Economics of Education Review, 21(2), 101–110.
Berry, F. S., & Berry, W. D. (2007). Innovation and diffusion models in policy research. In P. Sabatier (Ed.), Theories of the policy process (2nd ed., pp. 223–260). Boulder, CO: Westview Press.
Bertrand, M., Duflo, E., & Mullainathan, S. (2004). How much should we trust differences-in-differences estimates? The Quarterly Journal of Economics, 119(1), 249–275.
Betts, J., & McFarland, L. (1995). Safe port in a storm: The impact of labor market conditions on community college enrollments. Journal of Human Resources, 30(4), 741–765.
Binder, M., & Ganderton, P. T. (2002). Incentive effects of New Mexico’s merit-based state scholarship
at UNIV OF GEORGIA LIBRARIES on June 30, 2010http://eepa.aera.netDownloaded from
164
Zhang and Ness
program. In D. E. Heller & P. Marin (Eds.), Who should we help? The negative social consequences of merit scholarships (pp. 41–56). Cambridge, MA: The Civil Rights Project at Harvard University.
Binder, M., & Ganderton, P. T. (2004). The New Mexico lottery scholarship: Does it help minority and low-income students? In D. E. Heller & P. Marin (Eds.), State merit scholarship program and racial inequality (pp. 101–122). Cambridge, MA: The Civil Rights Project at Harvard University.
Buss, C., Parker, J., & Rivenburg, J. (2004). Cost, qual-ity and enrollment demand at liberal arts colleges. Economics of Education Review, 23(1), 57–65.
Carnegie Foundation for the Advancement of Teaching. (1989). Student migration patterns: What they mean for states. Change, 21(3), 29–34.
Cohen-Vogel, L., Ingle, K., Albee, A., & Spence, M. (2008). The “spread” of merit-based college aid: Politics, policy consortia and interstate competi-tion. Educational Policy, 22(3), 339–362.
College Board. (2007). Trends in college pricing. Washington, DC: Author.
Cornwell, C., & Mustard, D. B. (2002). Race and the effects of Georgia’s HOPE Scholarship. In D. E. Heller & P. Marin (Eds.), Who should we help? The negative social consequences of merit scholarships (pp. 57–72). Cambridge, MA: The Civil Rights Project at Harvard University.
Cornwell, C., & Mustard, D. B. (2004). Georgia’s HOPE Scholarship and minority and low-income students: Program effects and proposed reforms. In D. E. Heller & P. Marin (Eds.), State merit scholar-ship program and racial inequality (pp. 77–100). Cambridge, MA: The Civil Rights Project at Harvard University.
Cornwell, C., Mustard, D. B., & Sridhar, D. J. (2006). The enrollment effects of merit-based financial aid: Evidence from Georgia’s program. Journal of Labor Economics, 24(4), 761–786.
Dee, T. S., & Jackson, L. A. (1999). Who loses HOPE? Attrition from Georgia’s college scholarship program. Southern Economic Journal, 66(2), 379–390.
Dellas, H., & Sakellaris, P. (2003). On the cyclicality of schooling: Theory and evidence. Oxford Economic Papers, 55, 148–172.
Doyle, W. R. (2006). Adoption of merit-based student grant programs: An event history analysis. Educational Evaluation and Policy Analysis, 28(3), 259–285.
Dynarski, S. (2000). Hope for whom? Financial aid for the middle class and its impact on college atten-dance. National Tax Journal, 53(3), 629–661.
Dynarski, S. (2002). Race, income, and the impact of merit aid. In D. E. Heller & P. Marin (Eds.), Who
should we help? The negative social consequences of merit scholarships (pp. 73–92). Cambridge, MA: The Civil Rights Project at Harvard University.
Dynarski, S. (2004). The new merit aid. In C. M. Hoxby (Ed.), College choices: The econom-ics of where to go, when to go, and how to pay for it (pp. 63–100). Chicago: University of Chicago Press.
Farrell, P. L. (2004). Who are the students receiving merit scholarships? In D. E. Heller & P. Marin (Eds.), State merit scholarship program and racial inequality (pp. 47–76). Cambridge, MA: The Civil Rights Project at Harvard University.
Graham, A. E., & Husted, T. A. (1993). Understanding state variations in SAT scores. Economics of Education Review, 12(3), 197–202.
Groen, J. A. (2003). The effect of college location on migration of college-educated labor. Journal of Econometrics, 121(1–2), 125–142.
Halberstam, D. (1972). The best and the brightest. New York: Random House.
Hearn, J. C., & Griswold, C. P. (1994). State-level centralization and policy innovation in U.S. post-secondary education. Educational Evaluation and Policy Analysis, 16(2), 161–190.
Heller, D. E. (2002a). State merit scholarship pro-grams: An introduction. In D. E. Heller & P. Marin (Eds.), Who should we help? The negative social consequences of merit scholarships (pp. 15–24). Cambridge, MA: The Civil Rights Project at Harvard University.
Heller, D. E. (2002b). The policy shift in state finan-cial aid programs. In J. C. Smart (Ed.), Higher education: Handbook of theory and research (Vol. XVII, pp. 221–261). New York: Agathon Press.
Heller, D. E. (2004a). State merit scholarship pro-grams: An overview. In D. E. Heller & P. Marin (Eds.), State merit scholarship program and racial inequality (pp. 13–22). Cambridge, MA: The Civil Rights Project at Harvard University.
Heller, D. E. (2004b). The devil is in the details: An analysis of eligibility criteria for merit scholarships in Massachusetts. In D. E. Heller & P. Marin (Eds.), State merit scholarship program and racial inequality (pp. 23–46). Cambridge, MA: The Civil Rights Project at Harvard University.
Heller, D. E., & Marin, P. (Eds.). (2002). Who should we help? The negative social consequences of merit scholarships. Cambridge, MA: The Civil Rights Project at Harvard University.
Heller, D. E., & Marin, P. (Eds.). (2004). State merit scholarship program and racial inequality. Cambridge, MA: The Civil Rights Project at Harvard University.
at UNIV OF GEORGIA LIBRARIES on June 30, 2010http://eepa.aera.netDownloaded from
165
Does State Merit Aid Stem Brain Drain?
Heller, D. E., & Rasmussen, C. J. (2002). Merit scholarships and college access: Evidence from Florida and Michigan. In D. E. Heller & P. Marin (Eds.), Who should we help? The negative social consequences of merit scholarships (pp. 25–40). Cambridge, MA: The Civil Rights Project at Harvard University.
Henry, G. T., Rubenstein, R., & Bugler, D. T. (2004). Is Hope enough? Impacts of receiving and losing merit-based financial aid. Educational Policy, 18(5), 686–709.
Kyung, W. (1996). In-migration of college students to the state of New York. Journal of Higher Education, 67(3), 349–358.
Long, B. T. (2004). How do financial aid policies affect colleges? The institutional impact of the Georgia HOPE Scholarship. Journal of Human Resources, 39(3), 1045–1066.
Marchant, G. J., & Paulson, S. E. (2001). State com-parisons of SAT scores: Who’s your test taker? NASSP Bulletin, 85(627), 62–73.
Meyer, B. D. (1995). Natural and quasi-experiments in economics. Journal of Business & Economic Statistics, 13(2), 151–161.
Mixon, F. G., & Hsing, Y. (1994a). College student migration and human capital theory: A research note. Education Economics, 2(1), 65–73.
Mixon, F. G., & Hsing, Y. (1994b). The determinants of out-of-state enrollments in higher education: A Tobit analysis. Economics of Education Review, 13(4), 183–195.
Morphew, C. C. (2006). State borders are not barriers to the migration of college students. The Chronicle of Higher Education, 52(44), B24.
Ness, E. C. (2008). Merit aid and the politics of edu-cation. New York: Routledge.
Ness, E. C., & Noland, B. E. (2007). Targeted merit aid: Implications of the Tennessee Education Lottery Scholarship Program. Journal of Student Financial Aid, 37(1), 7–17.
Ness, E. C., & Tucker, R. (2008). Eligibility effects on college access: Under-represented student
perceptions of Tennessee’s merit aid program. Research in Higher Education, 49(7), 569–588.
Olivas, M. A. (1990). Puzzle piece missing. Change, 22(1), 7.
Perna, L. W., & Titus, M. A. (2004). Understanding differences in the choice of college attended: The role of state public policies. Review of Higher Education, 27(4), 507–525.
Perry, K. K. (2001). Where college students live after they graduate. Washington, DC: National Center for Government Statistics. (ERIC Document Reproduction Service No. ED453739)
Redden, E. (2007, January 4). Tethering students to their states. Inside Higher Ed. Retrieved August 28, 2009, from http://www.insidehighered.com/news/ 2007/01/04/scholarships
Rizzo, M. J., & Ehrenberg, R. G. (2004). Resident and nonresident tuition and enrollment at flagship state universities. In C. Hoxby (Ed.), College decisions: How students actually make them and how they could (pp. 303–354). Chicago: University of Chicago Press.
Strathman, J. G. (1994). Migration, benefit spillovers and state support of higher education. Urban Studies, 31(6), 913–920.
Tuckman, H. P. (1970). Determinants of college stu-dent migration. Southern Economic Journal, 37(2), 184–189.
Zhang, L. (2007). Nonresident enrollment demand in public higher education: An analysis at national, state, and institutional levels. Review of Higher Education, 31(1), 1–26.
Authors
LIANG ZHANG is an assistant professor of educa-tion and labor studies in the Department of Education Policy Studies at The Pennsylvania State University.
ERIK C. NESS is an assistant professor of higher education in the Institute of Higher Education at the University of Georgia.
at UNIV OF GEORGIA LIBRARIES on June 30, 2010http://eepa.aera.netDownloaded from


