Embed Size (px)
Citation preview
Crime & Delinquency 1 –28
© The Author(s) 2016Reprints and permissions:
sagepub.com/journalsPermissions.navDOI: 10.1177/0011128716638503
cad.sagepub.com
Article
Does Crime Cause Punitiveness?
Gary Kleck1 and Dylan Baker Jackson2
AbstractWhy are Americans so punitive toward criminals? Some theories of punitiveness suggest that exposure to crime makes people more supportive of punitive policies toward criminals. We analyzed national survey data and found that neither support for longer prison sentences for four different crimes nor support for the death penalty had a significant positive association with crime rates, prior victimization, vicarious victimization, higher perceived risk of victimization, or fear of crime. Instead, punitiveness was related to how often people watched local TV news, the percent Republican of the person’s county, and race. Support for harsh treatment of criminals therefore appears to be more a product of race, ideology, and news media presentations of crime than of the reality of crime.
Keywordspunishment, punitiveness, punitivity
Introduction
Why are Americans so punitive toward criminals? Most Americans favor the death penalty for murderers, mandatory minimum prison sentences for a variety of crimes, three-strikes laws, longer prison sentences in general,
1Florida State University, Tallahassee, USA2University of Texas at San Antonio, Texas, USA
Corresponding Author:Gary Kleck, College of Criminology and Criminal Justice, Florida State University, 112 S. Copeland Street, Tallahassee, FL 32306-1273, USA. Email: [email protected]
638503 CADXXX10.1177/0011128716638503Crime & DelinquencyKleck and Jacksonresearch-article2016
at UTSA Libraries on May 12, 2016cad.sagepub.comDownloaded from

2 Crime & Delinquency
treating some juvenile offenders as adults, and thereby making them subject to more severe penalties, and a long list of other highly punitive policies (Costelloe, Chiricos, & Gertz, 2009; Cullen, Fisher, & Applegate, 2000). U.S. policy toward criminals is correspondingly harsh, and supporters of punitive policies commonly justify their positions by asserting that these are the policies favored by most Americans (e.g., DiIulio, 1997). The implied argument is that democracy is functioning as it should, with mass public opinion affecting the positions of the people’s elected representatives and thereby determining, at least in a general way, criminal justice policy.
If the majority’s attitudes are driving harsher policies, why then are Americans’ attitudes so favorable to harsh treatment of criminals, and so much more supportive of punitive policies than the citizens of other devel-oped nations? One common explanation is that, in one sense or another, crime causes punitiveness, so that the higher rates of crime in the United States cause more people to favor harsher punishment. If public support for punitive policies really is driven by crime, policymakers who might other-wise be persuaded to reduce the harshness of the criminal justice system could plausibly reply, “What can I do? Crime is high, and my constituents demand that I deal with it by getting tough on criminals.” This line of defense implies that the public is realistically reacting to the reality of crime, and pragmatically supporting punitive policies that they believe will be effective in reducing crime. Is this in fact an accurate description of the link between crime and supportive for harsh criminal sanctions?
Theory
There are many explanations of punitiveness, pointing to conservative political ideology, attribution of blame for criminal behavior, media influences, racial animus and racial threat, economic threat, religious fundamentalism, educa-tion, income, gender, and misperceptions of criminal justice as more lenient than it really is. Our focus is a narrower one. We seek to explore how exposure to crime, broadly construed, affects support for harsher punishment of crime.
One prominent theory of punitivity is what Unnever and Cullen (2010) called the “escalating crime-distrust model” (see also the similar emphasis on “crime salience” in Costelloe et al., 2009; Taylor, Scheppele, & Stinchcombe, 1979). This theory argues that punitivity in the United States and other Western nations grew as perceptions of rising crime and disorder spread, against a background of growing distrust in government and its ability and willingness to protect its citizens from crime (Simon, 2007). This theory’s stress on perceptions of a growing crime threat suggests that there may be a consider-able gap between perceptions and reality. Although these perceptions might be
at UTSA Libraries on May 12, 2016cad.sagepub.comDownloaded from
Kleck and Jackson 3
partially attributable to a reality of rising crime rates, they can also be encour-aged by news about crime and the criminal justice system, or by political pro-paganda. The volume of news about crime can increase even when crime rates are declining, and exposure to an endless stream of accurate, yet unrepresenta-tive, news accounts of violent crime can create a vision of the world as a dangerous place, even for people who are largely sheltered from the risks of victimization.
This conception of exposure to crime may, however, be unduly narrow. There are many other ways in which crime could influence punitiveness besides a perception of rising crime rates. First, emotional reactions to crime may influence punitiveness independently of beliefs about crime. Thus, the fear of victimization may matter, not just the belief that its risks are rising. Second, even within the category of perceptions or beliefs about crime, per-ceptions of the current level of crime risks may matter, independent of per-ceptions that those risks are increasing. Certainly intense, high risks of victimization could motivate people to support short-term crime control strat-egies that promise quick results, such as “getting tough on criminals,” even if that risk level was not rising past an already intolerably high level. Third, it is possible that support for punitive measures is driven by a belief (accurate or not) that crime in one’s immediate environment is intolerably high, relative to other places, and thus, one is in greater need than other Americans of poli-cies that promised to quickly reduce crime. Similarly, some people may believe, accurately or not, that they are at higher risk of future victimization than others, regardless of whether crime rates in general are rising.
Conversely, a focus solely on subjective reactions to crime might also be unduly restrictive. Some people are more likely than others to have actual personal experience with crime as victims, or to have become “vicarious victims” through the experiences of family members, friends, neighbors, and other significant others (Borg, 1998). Thus, there may be a reality of direct and indirect personal experience with crime underlying their perceptions and feelings of risk. Likewise, some people live in areas where the general area-wide risk of criminal victimization is, to the extent that official crime rates can measure that risk, genuinely higher than average. Thus, for some, there is an objective reality about crime that could motivate support for harsher pun-ishment of criminals, apart from the effects of exaggerated perceptions of future risk and excessive fear stimulated by misleading news coverage and political rhetoric about crime. If so, prior victimization of one’s self or of significant others, and local crime rates could affect get-tough attitudes. The personal experience of victimization might stimulate in some people an intensified support for policies perceived to be effective tools for reducing the risk of future victimization. Alternatively, it could trigger in others a thirst
at UTSA Libraries on May 12, 2016cad.sagepub.comDownloaded from
4 Crime & Delinquency
for vengeance or retribution, not only against the specific persons responsible for the individual’s victimization but also against others perceived to be like them and the larger class of criminals in general.
Support for harsher crime control measures could also be influenced by relatively unemotional, intellectual assessments of the risk of future victim-ization, rather than just emotional reactions to prior victimization. Even in the absence of fear, if one believed that punitive measures are effective in quickly reducing crime, those who anticipated a higher probability of future victim-ization for themselves could be more supportive of such tactics simply because they perceive themselves to be more in need of measures that would reduce crime. To be sure, these estimations of risk are subject to considerable error, but even inaccurate estimates could influence attitudes toward the treat-ment of criminals. Thus, perceptions of future crime risk, as well as fear of crime, merit a place in a theory of punitivity.
There are some fairly clear causal chains implied by these separate hypoth-eses. High or rising crime rates can affect the probability of personal victim-ization for any given individual, and for people they know. These can in turn affect (along with media influences and political rhetoric) perceptions of the risk of future victimization, of trends in crime rates, and of the risk of crime in one area relative to others. These risk perceptions can in turn directly affect punitiveness, or can affect fear of crime, which then affects punitiveness. It is, however, also possible that levels or trends in crime rates can influence punitiveness in heretofore undiscovered ways beyond their effects on indi-vidual and vicarious victimization, risk perceptions, and fear. If so, a more complete test of the impact of crime on punitiveness would have to include crime rates even if the model already included these other factors that are presumed to mediate the effect of crime rates.
To summarize, support for harsher treatment of criminals could be influ-enced by (a) personal prior victimization, (b) vicariously victimization of others known to the person, (c) a higher perceived individual risk of future victimization, (d) higher crime rates prevailing in one’s area, (e) perceptions of rising crime rates, in a context of distrust about governments’ willingness and ability to reduce crime, (f) the belief that crime rates are relatively higher in one’s area compared with other areas, or (g) greater fear of crime.
Methods of Prior Research
Previous work on the effects of exposure to crime on punitiveness has suf-fered from a number of limitations, including constricted conceptions of exposure to crime, unduly narrow measures of punitiveness, use of local or nonprobability samples of limited generalizability, and measures of
at UTSA Libraries on May 12, 2016cad.sagepub.comDownloaded from

Kleck and Jackson 5
punitiveness of doubtful validity. Exposure to crime has been conceptualized in most previous studies exclusively as personal experience of victimization or fear of crime (e.g., Taylor et al., 1979; Unnever, Cullen, & Fisher, 2007), and in most studies, only one or two of these factors are addressed. This focus neglects the possibility the crime rates can influence an individual’s attitudes toward punishment independent of his or her personal experiences as victims or fear of crime. Certainly, people can be aware of high rates of crime without experiencing it themselves. People may likewise also be affected by the vic-timization of those they know, that is, by “vicarious victimization” (Borg, 1998). And to the extent that they are influenced by factors pertaining to themselves, it could be cognitive assessments of future risk of victimization that matter, not just prior experiences as victims or the emotion of fear.
Much of the prior work in this area has also been unduly narrow in the kinds of punitive attitudes that are measured. Most studies have focused on just two attitudes: (a) support for the death penalty for murder (e.g., Baumer, Messner, & Rosenfeld, 2003), and (b) the belief that local courts are too lenient in their sentencing (e.g., Taylor et al., 1979). Attitudes toward the death penalty may be influenced by attributes that are unique to that particu-lar penalty, such as its irreversibility, so that findings pertaining to capital punishment may not be generalizable to other punishments. In any case, only a tiny fraction of sentences for crime are death sentences; serious offenses are far more likely to be punished by prison sentences.
Regarding sentencing in general, some studies have used a General Social Surveys (GSS) question inquiring whether the respondent considers local courts to be too lenient or too harsh, and interpreted endorsement of the “too lenient” response as indicative of punitiveness. The chief problem with this measure is that it implicitly assumes that respondents know something about local sentencing practices, because the respondent’s preferences for harsher sentencing are expressed solely in terms of a comparison with those per-ceived sentencing practices. Given the average person’s ignorance of either sentencing practices or criminal justice realities in general, this assumption is implausible. Consequently, a “too lenient” response could reflect an underes-timation of local court harshness rather than a preference for harsher penal-ties (Roberts, 1992).
Measures of fear of crime and perceived risk of future victimization have been typically limited to single items. For example, fear is commonly mea-sured using the GSS item asking whether there is an area near the respondent where they would be afraid to walk alone at night. This measure is problem-atic because of its hypothetical character—although there might well be places where the respondent would be fearful if he or she walked there at night, if they do not do so, they may actually have very little fear of crime.
at UTSA Libraries on May 12, 2016cad.sagepub.comDownloaded from
6 Crime & Delinquency
Using measures that directly ask people to rate their fear levels may be more appropriate.
Measures of fear and perceived risk are often limited to questions pertain-ing to a single crime, although these perceptions may be very crime-specific, varying considerably from one crime type to another. Using multiple items to measure fear and perceived risk with regard to multiple offense types would seem to be preferable.
Findings of Prior Research
The findings of past studies have been very inconsistent regarding the impact of most crime-related variables on punitiveness. First, there is little research on the impact of perceived risk of future victimization, and it has yielded inconsistent results. Pickett and Chiricos (2012) found a significant positive association, but it applied only to attitudes toward the punishment of juve-niles. However, King and Maruna (2009) and Pickett and Baker (2014) found no significant association between perceived risk and general punitive atti-tudes. The results of the latter two studies, however, have limited generaliz-ability: King and Maruna studied only residents of six nonrandomly selected local areas in England, whereas Pickett and Baker based their research on a nonprobability volunteer sample.
In contrast, there is a wealth of research bearing on the effect of fear of crime on punitive attitudes, but the findings are highly inconsistent. Of 18 studies we located, nine obtained results supporting a positive effect of fear on punitiveness (Costelloe et al., 2009; Hogan, Chiricos, & Gertz, 2005; Johnson, 2006; Rankin, 1979; Sprott & Doob, 1997; Thomas & Foster, 1975; Tufts & Roberts, 2002; Unnever et al., 2007; Wu, Sun, & Wu, 2011) and nine found no support (Chiricos, Welch, & Gertz, 2004; King & Wheelock, 2007; Leverentz, 2011; Messner, Baumer, & Rosenfeld, 2006; Ouimet & Coyle, 1991; Stack, 2003; Taylor et al., 1979; Tyler & Weber, 1982; Welch, Payne, Chiricos, & Gertz, 2011). There is no clear methodological superiority of either of these two conflicting bodies of research, so it remains very much an unsettled matter whether fear of crime motivates people to favor harsher treatment of criminals.
There has been far more agreement regarding the influence of individuals’ personal victimization experiences—researchers generally find no impact. Of 19 studies we located, 16 found no significant positive association of prior victimization with punitive attitudes (Borg, 1998; Costelloe et al., 2009; Cullen, Clark, Cullen, & Mathers, 1985; Hartnagel & Templeton, 2012; Johnson, 2006; King & Maruna, 2009; Leverentz, 2011; Ouimet & Coyle, 1991; Pickett & Baker, 2014; Pickett & Chiricos, 2012; Seltzer & McCormick,
at UTSA Libraries on May 12, 2016cad.sagepub.comDownloaded from

Kleck and Jackson 7
1987; Sprott & Dobb, 1997; Stack, 2003; Taylor et al., 1979; Tufts & Roberts, 2002; Tyler & Weber, 1982; Unnever et al., 2007). Only three studies found significant positive associations (Hanslmaier, 2013; Rich & Sampson, 1990 [for two of three offense types]; Wu et al., 2011). The Rich and Sampson findings were based on a local sample of Chicago-area residents, the Wu et al. study addressed only students at four nonrandomly selected universities (three of them in China), and the Hanslmaier study was based on a national sample of German residents. Thus, the supportive results of these three stud-ies may be reflective of effects unique to these samples, but not applicable to the general U.S. population.
Research on the effect of crime rates on individual support for harsh pun-ishment of criminals is considerably more modest, and generally quite narrow in its focus. Three of the studies address only the effect of one crime type, homicide, on support for one punitive policy, capital punishment. Messner et al. (2006) found no significant association, whereas Baumer, Messner, and Rosenfeld (2003) found a significant positive association and Soss, Langbein, and Metelko (2003) observed the same association among Whites. Four stud-ies analyzed more general measures of punitiveness, and all found no signifi-cant association with crime rates, although each of them was significantly limited in some way. Ousey and Unnever (2012) found no effect of national violent crime rates on individuals’ support for more severe punishment of criminals in 26 European Union nations. People may, however, only be aware of local crime rates, which might affect their attitudes toward punishment. The same problem affects the null findings of Welch et al. (2011), who measured only state-level property and violent crime rates. King and Wheelock (2007) measured county crime rates, but they assessed only the effects of the homi-cide rate, finding no significant association with punitiveness. Finally, Pickett and Chiricos (2012) also used county crime data, but only for the single com-bined Index crime rate. They found no association between punitiveness and this combined measured, but use of this measure could have concealed posi-tive effects of rarer crimes such as homicide or rape that were counterbalanced by null or negative effects of more common crimes such as larceny.
Finally, there is some evidence that attitudes favoring harsher punishment of criminals are affected by the perception—accurate or not—that crime is increas-ing. Sometimes, what researchers vaguely describe as “crime salience” or “con-cern” about crime is actually measured by survey items that tap into the perception of rising crime (e.g., two of four items in Leverentz’ measure of crime salience measured perceptions of increasing crime, and two of five items addressing “salience of crime” in Cullen et al., 1985, likewise measured percep-tions of increased crime). Other scholars have specifically measured perceived crime trends (Hogan et al., 2005; Pickett & Baker, 2014; Thomas & Foster,
at UTSA Libraries on May 12, 2016cad.sagepub.comDownloaded from

8 Crime & Delinquency
1975; Unnever & Cullen, 2010). All but one of these six studies (Cullen et al., 1985) found punitiveness to be positively and significantly related to the percep-tion that crime is increasing. The supportive studies, however, are characterized by the use of nonprobability (Pickett & Baker, 2014) or local samples (Hogan et al., 2005; Leverentz, 2011; Thomas & Foster, 1975), or by a dubious measure of punitiveness. Unnever and Cullen (2010) studied a national probability sam-ple, but measured “punitiveness” by asking forced-choice questions in which survey respondents were asked to choose between (a) punitive policies for reducing crime or (b) policies that “address the social problems that cause crime like bad schools, poverty, and joblessness.” A high score of this punitiveness index in this study therefore may have reflected only a lack of support for the nonpunitive policies rather than support for punitive policies. As a result, there is no evidence on the impact of perceptions of increasing crime on punitiveness that can be reliably generalized to any national population.
In sum, prior work has produced highly conflicting results concerning the impact of fear of crime on punitive attitudes, little generalizable research on the impact of crime rates on punitive attitudes in general (as opposed to just those pertaining to the death penalty or punishment of juveniles) or of the effects of perceptions that crime is increasing, and only a handful of conflicting studies of the effect of perceived risk of future victimization. A large body of research over-whelmingly indicates that prior victimization is unrelated to punitive attitudes.
There nevertheless is at least some research supporting the hypotheses that crime is affected by any of five distinct crime-related factors: crime rates, perceived risk of victimization, fear of crime, prior victimization, and a perception of increasing crime. All of these variables are conceptually dis-tinct, they all could directly affect punitive attitudes independent of effects mediated through the other variables, and they are positively correlated with each other (Hogan et al., 2005; Johnson, 2006). Thus, the effect on punitive-ness of any one of them could be confounded with the effects of the others if the others are not statistically controlled. Yet, none of these studies has controlled for all five types of variables, nor have any studies controlled for even four of them. Even the best studies in this regard simultaneously esti-mated the effects of just three of these five types of crime-related variables (Leverentz, 2011; Pickett & Baker, 2014; Pickett & Chiricos, 2012; Welch et al., 2011). As a consequence, all extant estimates of the effects of each of these factors are probably distorted by omitted variables bias.
Our study contributes to the literature on the effects of crime on support for harsher punishment of criminals in the following ways:
1. We measure and simultaneously estimate the effects of all five of the aforementioned types of crime-related variables, as well as two
at UTSA Libraries on May 12, 2016cad.sagepub.comDownloaded from

Kleck and Jackson 9
others: vicarious victimization (Borg, 1998) and the perceived level of crime in one’s own area compared with that of other areas.
2. We investigate the possible effects of understudied aspects of expo-sure to crime such as perceived risk of future victimization.
3. We use improved multi-item measures of the more commonly studied variables such as prior victimization and fear of crime.
4. We use a nationally representative probability sample of the U.S. urban population, providing a formal basis for generalizing its find-ings to the population most exposed to crime.
5. We directly measure a wide array of sentencing preferences regarding prison sentence lengths for multiple offenses, as well as support or opposition to the death penalty.
6. Finally, we carry out crime-specific analyses of the potential effects of crime rates, prior victimization, fear, and perceived risk on pre-ferred punishment severity for the corresponding crime types, testing the proposition that it is exposure to specific types of crime that influ-ences attitudes toward how harshly those same crimes should be punished.
Hypotheses
Based on the aforementioned theoretical considerations and the lacunae in prior empirical research, we seek to test the following specific hypotheses concerning the impact of exposure to crime on punitive attitudes:
Hypothesis 1: Higher crime rates in the area where one resides increase support for more punitive treatment of criminals.Hypothesis 2: A perception that crime rates are increasing causes greater support for more punitive treatment of criminals.Hypothesis 3: A perception that crime rates are relatively higher in the area where one resides increases support for more punitive treatment of criminals.Hypothesis 4: Personal experience of crime victimization increases sup-port for more punitive treatment of criminals.Hypothesis 5: Vicarious victimization (knowing a person who has been a victim of serious crime) increases support for more punitive treatment of criminals.Hypothesis 6: Perceiving a higher personal risk of future victimization increases support for more punitive treatment of criminals.Hypothesis 7: Greater fear of crime increases support for more punitive treatment of criminals.
at UTSA Libraries on May 12, 2016cad.sagepub.comDownloaded from

10 Crime & Delinquency
Method
The Sample
Our individual-level data were obtained in a national telephone survey of a probability sample of 1,500 adults (age 18 and above) living in a proba-bility sample of 54 large urban counties. The sample was selected using random digit dialing procedures. This sampling method allowed access to the 95% of the U.S. households with a telephone, including those with unlisted numbers. The sample was drawn exclusively from the 54 largest counties participating in the National Judicial Reporting Program (NJRP). These 54 counties were selected by NJRP staff to be representative of the 75 largest (by population) counties in the United States. In 1998, these 75 counties accounted for 50.2% of the nation’s murders, 61.9% of robberies, and 51.4% of all violent crimes known to the police (analysis of U.S. Department of Justice, Federal Bureau of Investigation, 2000). Consequently, our results can be generalized to the noninstitutionalized adult residents of the 75 largest urban counties that account for most of the nation’s violent crime.
Telephone numbers were randomly generated for each county, using the area code and residential prefixes operative in each county, with sample sizes for each county proportional to the population size of the county. Within each household contacted, an adult R was randomly selected by the interviewer, by asking to speak to the resident age 18 or older who had most recently cele-brated a birthday. Rs were weighted by the inverse of the number of different telephone numbers in their household. Telephone interviews were conducted byResearch Network, a professional polling firm that has conducted hun-dreds of telephone surveys, including many concerning crime.
The interviews were conducted in April and May of 1998. Although levels of punitivity and its potential determinants have changed since 1998, we are not aware of any evidence or sound rationale for believing that the relation-ships between these variables or the underlying causal structure of punitivity has changed since then. In any case, no more recent data set has nearly as rich a set of measures of exposure to crime as this one.
Measurement of the Variables
Dependent variables—Measures of punitiveness. We measured the dependent variable, support for punitive policies toward criminals, in six ways: (1a) a binary measure of support for the death penalty as a punishment for murder, (b) the length of preferred prison sentences for convicted murderers, (c) the length of preferred prison sentences for convicted robbers, (d) the length of
at UTSA Libraries on May 12, 2016cad.sagepub.comDownloaded from

Kleck and Jackson 11
preferred prison sentences for persons convicted of aggravated assault, (e) the length of preferred prison sentences for convicted burglars, and (f) an index combining the four preferred-sentence measures. We asked Rs how long a sentence they preferred for persons convicted of each of these four crimes. Sentences have been converted from years into number of months when necessary. When a death sentence or life sentence was the preferred sentence for murder, it was treated as 540 months (45 years)—the average remaining life expectancy for a male of the median age of murder arrestees. The exact wording of the relevant survey questions can be found in the appendix.
Principal independent variables—Measures of exposure to crime. The principal independent variables of interest were measures of exposure to crime. We measured prior victimization by asking questions about (a) having been a victim of robbery in the past year, (b) having been a victim of burglary in the past year, (c) having been a victim of an assault since becoming an adult, and (d) knowing a person who has been a victim of a serious crime in the past year (vicarious victimization). We measured perceived risk of future victim-ization by asking questions about (e) the perceived likelihood that one will be murdered in the next 12 months, (f) the perceived likelihood that one will be robbed or mugged in the next 12 months, and (g) the perceived likelihood that one will be burglarized in the next 12 months. We measured crime rates in areas in which Rs resided using official police-based data on (h) the local (county) murder rate, (i) the local robbery rate, (j) the local aggravated assault rate, and (k) the local burglary rate. We measured fear of crime by asking the R to rate (l) how much (on a 0-10 scale) they feared being murdered, (m) how much they feared being robbed or mugged, and (n) how much they feared having their home broken into. Finally, we asked questions regarding the Rs (o) perception that crime in their county was increasing, and their (p) percep-tion that crime in their county was higher/lower than the national average.
Control variables. We controlled for many attributes of both individuals and their environments that theory and prior research suggest could affect support for punitive crime control policies, and that might also be correlated with measures of exposure to crime. Specifically, we controlled for the individual attributes of age, sex, race, income, education, marital status, the number of times per week the person watches local television news, the number of times per week the person watches national television news, whether the person had ever been arrested, and whether the person or a member of his or her fam-ily had ever worked in the criminal justice system. Race is a particularly important control given prior evidence that Whites are more punitive, and
at UTSA Libraries on May 12, 2016cad.sagepub.comDownloaded from

12 Crime & Delinquency
that racial animus toward Blacks lies behind much of this punitiveness (Chiri-cos et al., 2004; Unnever & Cullen, 2010).
We also recognized that punitiveness might be affected by perceptions of attributes of one’s environment that are popularly associated, correctly or not, with crime. In particular, the racial threat explanation of punitiveness asserts that people (certainly White people, and possibly members of racial minori-ties as well) will feel more threatened if they believe that a large share of the population in their area are Black (Pickett, Chiricos, Golden, & Gertz, 2012). More broadly, crime threat theory suggests that people will feel more threat-ened if they live where a large share of the population belongs to other groups thought to commit crimes at a higher rate than average, such as the poor, unemployed people, the uneducated, urban dwellers, and so on (Chiricos, McEntire, & Gertz, 2001). Greater numbers of unemployed persons and other “threatening populations” could increase public anxiety over disorder, leading to increased support for more punishment of criminals as a way of alleviating this anxiety, and of protecting themselves from this perceived danger. We therefore controlled for the following county-level measures of threatening populations, as of 1990: percent Black, the percent of families under the poverty line, and percent of the civilian labor force unemployed. We also controlled attributes of areas that might induce some to perceive social disorder that needed to be addressed: divorces per 1,000 marriages, percent with a college degree, and population size (U.S. Bureau of the Census, 1994).
Finally, prior multi-level analysis has indicated that punitive attitudes are increased by the prevalence of conservative political views in their area (Baumer, Messner, & Rosenfeld, 2003), so we controlled for the percent who voted Republican in the 1996 presidential election as a measure of the county population’s political conservatism (the individual’s political ideology was not measured in the survey), and for whether the county was located in the South (1 if in a state of the Confederacy, 0 otherwise).
Estimation procedures. We estimated models of support for the death penalty using logistic regression, as this was a binary dependent variable, and esti-mated models of the other measures of punitiveness using ordinary least squares (OLS) regression, as they were continuous variables. Because there were considerable missing data on the income variable, we used multiple imputation methods to impute missing data, to avoid the sample bias and loss of statistical power that could result from list wise deletion of cases with missing data. Results concerning effects of exposure to crime, however, were generally substantively identical when list wise deletion was used. The STATA Version 13 statistical package, using its mi command for multiple
at UTSA Libraries on May 12, 2016cad.sagepub.comDownloaded from

Kleck and Jackson 13
imputation of missing values, was used to compute estimates. In addition to the estimates shown here, we also estimated standard errors using the STATA cluster command to take account of the clustering of respondents by county. Some estimates were higher, some were lower, but all signs and significance of all measures of exposure to crime were unchanged (estimates available from senior author).
Results
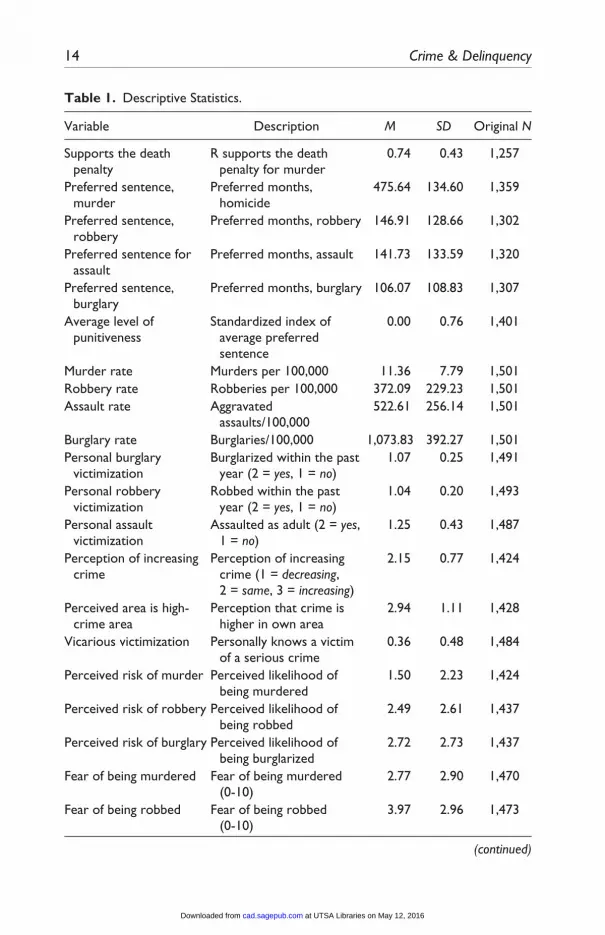
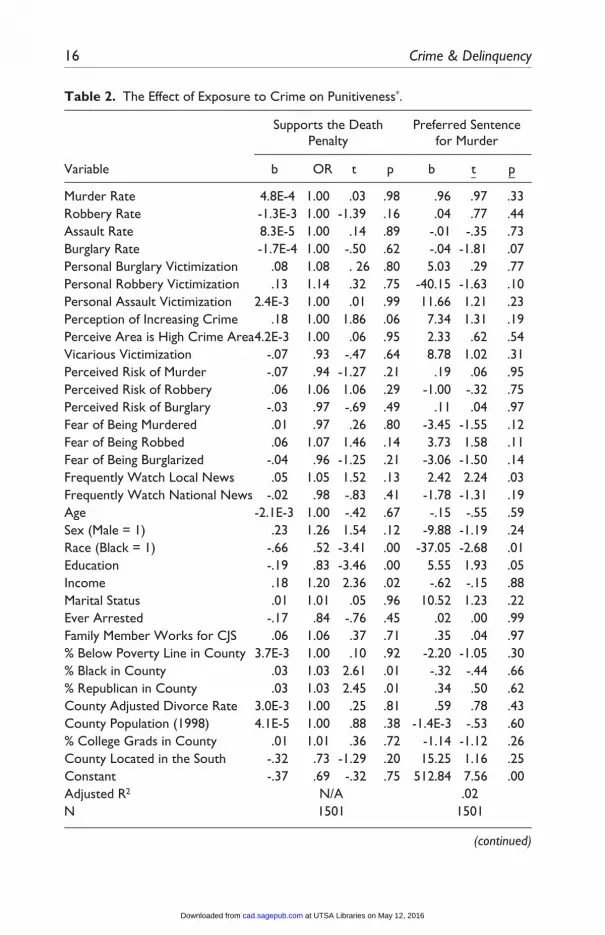
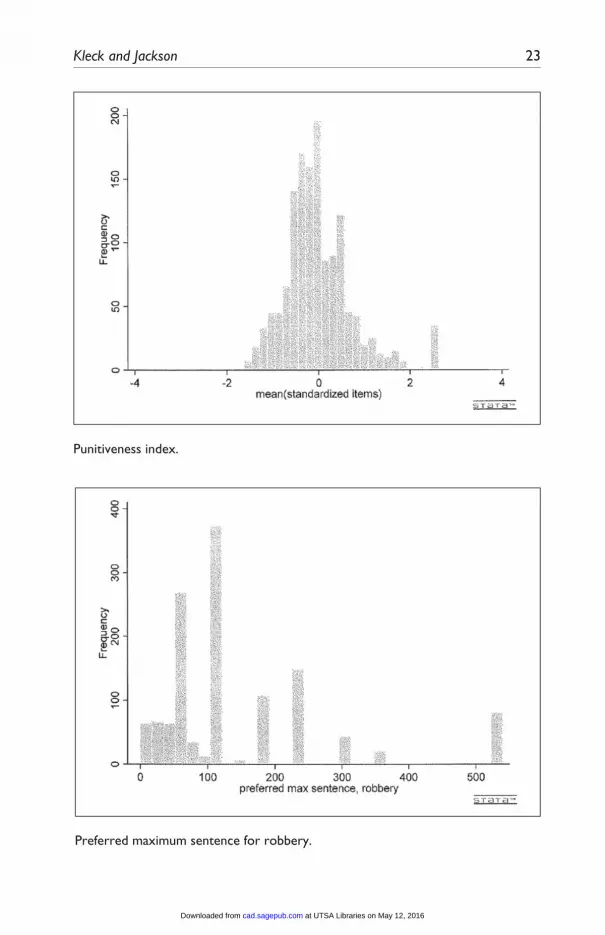
Table 1 lists the full set of variables used in our analyses, along with their sample means and standard deviations. Table 2 displays the estimates that test our hypotheses.1 Histograms in the appendix display the distributions of the dependent variables, that is, the measures of punitiveness.
Put simply, exposure to crime, regardless of how it was measured, showed no significant association with support for punitive measures, no matter how they were measured. With 16 measures of exposure to crime and six different measures of punitiveness, there were a total of 96 tests of the general hypoth-esis that exposure to crime increases support for punitiveness toward crimi-nals. Table 3 summarizes the results of all of the tests of the hypothesis. Of the tests, only three yielded statistically significant (at the .05 significance level, two-tailed) positive associations consistent with the hypothesis, one yielded a significant negative association, contrary to the hypothesis, and 92 (96%) were not significantly different from zero. Because one would expect about five of 96 results to be significant purely on the basis of random chance, even if there was no actual effect of exposure to crime on punitiveness, the three seemingly supportive findings are likely to be chance findings. This interpre-tation is supported by the fact that two of these three findings were nonsensi-cal, seemingly indicating that (a) a higher murder rate causes support for more severe punishment of aggravated assault, but not of murder, and that (b) a higher perceived risk of being murdered causes support for more severe pun-ishment of robbery but not of murder. We hypothesized that crime rates could affect punitiveness indirectly, via individual victimization, perceived risk of future victimization, or fear of crime, but because these variables have no direct effects of their own, they cannot mediate any indirect effects of crime rates.
What, then, does affect punitiveness? Our findings indicate that people are more punitive if they are White, live in politically conservative areas, and view more hours of local television news programs. Rather than being a response to real crime levels or actual exposure to crime, punitiveness is more likely to be a response to exposure to news media coverage of crime and a politically conservative context.
at UTSA Libraries on May 12, 2016cad.sagepub.comDownloaded from
14 Crime & Delinquency
Table 1. Descriptive Statistics.
Variable Description M SD Original N
Supports the death penalty
R supports the death penalty for murder
0.74 0.43 1,257
Preferred sentence, murder
Preferred months, homicide
475.64 134.60 1,359
Preferred sentence, robbery
Preferred months, robbery 146.91 128.66 1,302
Preferred sentence for assault
Preferred months, assault 141.73 133.59 1,320
Preferred sentence, burglary
Preferred months, burglary 106.07 108.83 1,307
Average level of punitiveness
Standardized index of average preferred sentence
0.00 0.76 1,401
Murder rate Murders per 100,000 11.36 7.79 1,501Robbery rate Robberies per 100,000 372.09 229.23 1,501Assault rate Aggravated
assaults/100,000522.61 256.14 1,501
Burglary rate Burglaries/100,000 1,073.83 392.27 1,501Personal burglary
victimizationBurglarized within the past
year (2 = yes, 1 = no)1.07 0.25 1,491
Personal robbery victimization
Robbed within the past year (2 = yes, 1 = no)
1.04 0.20 1,493
Personal assault victimization
Assaulted as adult (2 = yes, 1 = no)
1.25 0.43 1,487
Perception of increasing crime
Perception of increasing crime (1 = decreasing, 2 = same, 3 = increasing)
2.15 0.77 1,424
Perceived area is high-crime area
Perception that crime is higher in own area
2.94 1.11 1,428
Vicarious victimization Personally knows a victim of a serious crime
0.36 0.48 1,484
Perceived risk of murder Perceived likelihood of being murdered
1.50 2.23 1,424
Perceived risk of robbery Perceived likelihood of being robbed
2.49 2.61 1,437
Perceived risk of burglary Perceived likelihood of being burglarized
2.72 2.73 1,437
Fear of being murdered Fear of being murdered (0-10)
2.77 2.90 1,470
Fear of being robbed Fear of being robbed (0-10)
3.97 2.96 1,473
(continued)
at UTSA Libraries on May 12, 2016cad.sagepub.comDownloaded from

Kleck and Jackson 15
Variable Description M SD Original N
Fear of being burglarized Fear of being burglarize (0-10)
4.16 3.11 1,475
Frequency watch local news
Times per week R watches local TV news
5.93 4.06 1,482
Frequency watch national news
Times per week R watches national TV news
4.54 3.46 1,469
Age Age in years 44.12 17.10 1,451Sex Sex (Male = 1) 0.46 0.50 1,469Race Race (Black = 1) 0.13 0.34 1,501Level of education Education (7-point scale) 4.76 1.60 1,475Income Income (5-point scale) 3.19 1.28 1,132Marital status Married = 1, other status
= 00.52 0.50 1,473
Ever arrested R has been arrested for non-traffic offense
0.13 0.33 1,453
Family member works for CJS
Family member works in CJS
0.22 0.42 1,475
% below poverty line in county
% county population below poverty line, 1990
13.27 4.63 1,501
% Black in county % county population Black, 1990
16.66 12.60 1,501
% Republican in county % 1996 presidential votes for Republican
35.8 10.24 1,501
County divorce rate Divorces/1,000 married population, 1990
18.94 7.33 1,501
County population (1998)
1998 County Population (1,000s)
2,754.44 2,685.74 1,501
% college grads in county % college graduates, 1990 28.11 6.76 1,501County located in the
southCounty is in state of
confederacy0.25 0.43 1,501
Table 1. (continued)
In particular, watching more hours of local television news appears to increase viewers’ support for harsh treatment of criminals. The fact that local news but not national news has this apparent effect is consistent with prior research indicating that local television news is especially focused on crime and likely to project an image of the world as a dangerous place (Chiricos, Padgett, & Gertz, 2000). We did not, however, find that fear mediates the effect of local TV viewing, so it remains for future research to explore how this effect works.
at UTSA Libraries on May 12, 2016cad.sagepub.comDownloaded from
16 Crime & Delinquency
Table 2. The Effect of Exposure to Crime on Punitiveness*.
Variable
Supports the Death Penalty
Preferred Sentence for Murder
b OR t p b t p
Murder Rate 4.8E-4 1.00 .03 .98 .96 .97 .33Robbery Rate -1.3E-3 1.00 -1.39 .16 .04 .77 .44Assault Rate 8.3E-5 1.00 .14 .89 -.01 -.35 .73Burglary Rate -1.7E-4 1.00 -.50 .62 -.04 -1.81 .07Personal Burglary Victimization .08 1.08 . 26 .80 5.03 .29 .77Personal Robbery Victimization .13 1.14 .32 .75 -40.15 -1.63 .10Personal Assault Victimization 2.4E-3 1.00 .01 .99 11.66 1.21 .23Perception of Increasing Crime .18 1.00 1.86 .06 7.34 1.31 .19Perceive Area is High Crime Area4.2E-3 1.00 .06 .95 2.33 .62 .54Vicarious Victimization -.07 .93 -.47 .64 8.78 1.02 .31Perceived Risk of Murder -.07 .94 -1.27 .21 .19 .06 .95Perceived Risk of Robbery .06 1.06 1.06 .29 -1.00 -.32 .75Perceived Risk of Burglary -.03 .97 -.69 .49 .11 .04 .97Fear of Being Murdered .01 .97 .26 .80 -3.45 -1.55 .12Fear of Being Robbed .06 1.07 1.46 .14 3.73 1.58 .11Fear of Being Burglarized -.04 .96 -1.25 .21 -3.06 -1.50 .14Frequently Watch Local News .05 1.05 1.52 .13 2.42 2.24 .03Frequently Watch National News -.02 .98 -.83 .41 -1.78 -1.31 .19Age -2.1E-3 1.00 -.42 .67 -.15 -.55 .59Sex (Male = 1) .23 1.26 1.54 .12 -9.88 -1.19 .24Race (Black = 1) -.66 .52 -3.41 .00 -37.05 -2.68 .01Education -.19 .83 -3.46 .00 5.55 1.93 .05Income .18 1.20 2.36 .02 -.62 -.15 .88Marital Status .01 1.01 .05 .96 10.52 1.23 .22Ever Arrested -.17 .84 -.76 .45 .02 .00 .99Family Member Works for CJS .06 1.06 .37 .71 .35 .04 .97% Below Poverty Line in County 3.7E-3 1.00 .10 .92 -2.20 -1.05 .30% Black in County .03 1.03 2.61 .01 -.32 -.44 .66% Republican in County .03 1.03 2.45 .01 .34 .50 .62County Adjusted Divorce Rate 3.0E-3 1.00 .25 .81 .59 .78 .43County Population (1998) 4.1E-5 1.00 .88 .38 -1.4E-3 -.53 .60% College Grads in County .01 1.01 .36 .72 -1.14 -1.12 .26County Located in the South -.32 .73 -1.29 .20 15.25 1.16 .25Constant -.37 .69 -.32 .75 512.84 7.56 .00Adjusted R2 N/A .02N 1501 1501
(continued)
at UTSA Libraries on May 12, 2016cad.sagepub.comDownloaded from
Kleck and Jackson 17
Variable
Preferred Sentence for Robbery
Preferred Sentence for Assault
b t P b t p
Murder Rate .48 .53 .60 2.05 2.32 .02Robbery Rate .06 1.14 .26 .08 1.35 .18Assault Rate -.06 -1.68 .09 -.05 -1.40 .16Burglary Rate .02 .89 .37 -.03 -1.82 .07Personal Burglary Victimization 25.23 1.63 .10 11.24 .72 .47Personal Robbery Victimization -51.95 -3.72 .00 -35.20 -2.10 .04Personal Assault Victimization 7.92 .93 .35 4.37 .46 .65Perception of Increasing Crime -3.39 -.62 .53 -5.87 -1.09 .28Perceive Area is High Crime Area 1.20 .32 .75 2.75 .73 .47Vicarious Victimization 1.30 .16 .87 17.89 2.15 .03Perceived Risk of Murder 5.33 2.15 .03 3.26 1.28 .20Perceived Risk of Robbery -1.65 -.63 .53 -1.49 -.56 .58Perceived Risk of Burglary -1.73 -.68 .50 -2.20 -.86 .39Fear of Being Murdered -3.04 -1.62 .11 -.67 -.36 .72Fear of Being Robbed 1.26 .53 .59 .13 .06 .95Fear of Being Burglarized .07 .03 .97 .53 .28 .78Frequently Watch Local News 2.94 2.01 .04 3.20 2.13 .03Frequently Watch National News -1.25 -.88 .38 -1.85 -1.24 .22Age .04 .16 .88 -.06 -.22 .83Sex (Male = 1) 12.49 1.61 .11 -11.73 -1.47 .14Race (Black = 1) -16.12 -1.57 .12 -26.29 -2.44 .02Education -.26 -.10 .92 3.02 1.06 .29Income 7.29 1.97 .05 6.58 1.55 .12Marital Status 12.72 1.54 .12 6.25 .71 .48Ever Arrested 3.57 .29 .77 -20.98 -1.78 .08Family Member Works for CJS 9.12 1.00 .32 -5.66 -.60 .55% Below Poverty Line in County -1.56 -.78 .44 -2.35 -1.18 .24% Black in County .81 1.08 .28 -.09 -.12 .90% Republican in County 1.70 2.86 .00 1.60 2.56 .01County Adjusted Divorce Rate .23 .34 .74 .86 1.23 .22County Population (1998) 3.3E-3 1.26 .21 8.2E-4 .32 .75% College Grads in County 1.12 1.14 .25 .47 .51 .61County Located in the South 6.63 .55 .58 11.43 .51 .61Constant 3.64 .06 .95 58.70 .96 .34Adjusted R2 .03 .03N 1501 1501
Table 2. (continued)
(continued)
at UTSA Libraries on May 12, 2016cad.sagepub.comDownloaded from

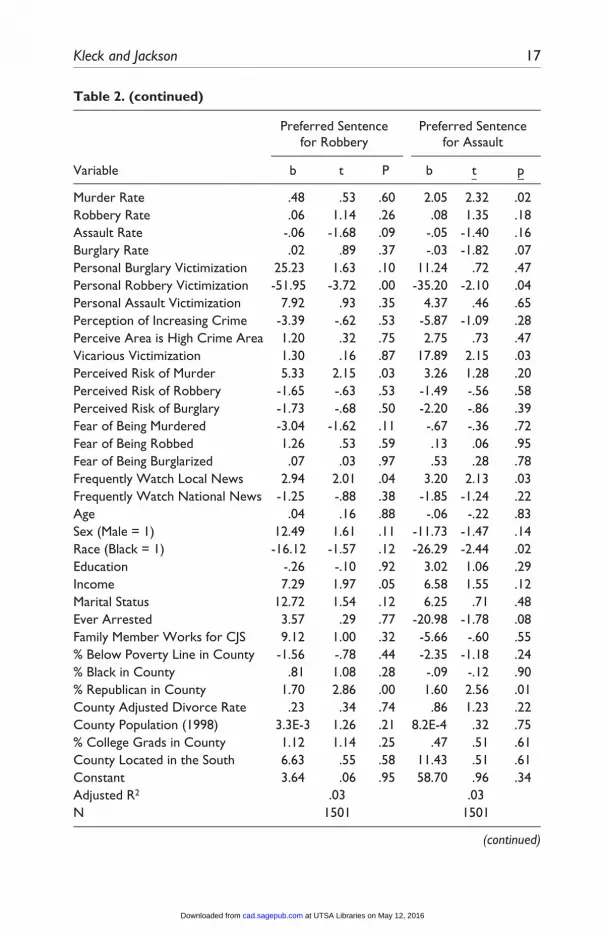
18 Crime & Delinquency
Variable
Preferred Sentence for Burglary
Average Level of Punitiveness
b t p b t p
Murder Rate 1.00 1.34 .18 .01 1.75 .08Robbery Rate .05 .97 .33 4.7E-4 1.41 .16Assault Rate -.03 -1.09 .28 -2.9E-4 -1.55 .12Burglary Rate -9.50E-4 -.06 .95 -1.2E-4 -1.11 .27Personal Burglary Victimization 8.94 .67 .50 .08 .85 .39Personal Robbery Victimization -21.69 -1.64 .10 -.30 -3.44 .00Personal Assault Victimization 5.95 .74 .49 .06 1.24 .22Perception of Increasing Crime .80 .18 .86 4.3E-3 .14 .89Perceive Area is High Crime Area .70 .21 .83 .02 .77 .44Vicarious Victimization 4.79 .68 .49 .07 1.51 .13Perceived Risk of Murder 1.72 .82 .41 .02 1.47 .14Perceived Risk of Robbery -2.06 -.91 .36 -.01 -.76 .45Perceived Risk of Burglary -2.05 -.95 .34 -.01 -.79 .43Fear of Being Murdered 1.40 .86 .39 -.01 -.98 .33Fear of Being Robbed -.26 -.14 .89 3.6E-3 .29 .77Fear of Being Burglarized -.67 -.40 .69 5.3E-3 .46 .64Frequently Watch Local News 2.65 2.15 .03 .02 2.65 .01Frequently Watch National News -.74 -.55 .58 -.01 -1.12 .26Age .13 .62 .54 7.2E-5 .05 .96Sex (Male = 1) 5.05 .74 .46 -.01 -.27 .79Race (Black = 1) -12.41 -1.25 .21 -.19 -3.05 .00Education -.45 .20 .85 .01 .95 .34Income 1.63 .47 .64 .03 1.20 .23Marital Status 6.95 .94 .35 .06 1.28 .20Ever Arrested -7.38 -.66 .51 -.05 -.75 .45Family Member Works for CJS 6.17 .78 .44 .03 .61 .54% Below Poverty Line in County -2.13 -1.20 .23 -.02 -1.28 .20% Black in County .58 .85 .39 1.2E-3 .28 .78% Republican in County 1.08 2.22 .03 .01 2.68 .01County Adjusted Divorce Rate .74 1.16 .25 4.6E-3 1.05 .29County Population (1998) 1.6E-3 .71 .48 6.0E-6 .40 .69% College Grads in County .47 .54 .59 1.0E-3 .17 .87County Located in the South 1.00 .09 .93 .08 1.18 .24Constant 19.69 .35 .73 -.48 -1.33 .18Adjusted R2 .01 .03N 1501 1501
*b = unstandardized OLS/Logistic regression coefficient; OR = odds ratio; t = ratio of coefficient over its standard error; p = 2-tailed significance.
Table 2. (continued)
at UTSA Libraries on May 12, 2016cad.sagepub.comDownloaded from

Kleck and Jackson 19
People are significantly more likely to support the death penalty for mur-der, though not longer prison sentences, if they live in places where a larger share of the residents are Black. Because we controlled for crime rates, this finding provides partial support for the racial threat hypothesis that larger Black populations per se, independent of actual crime levels, represent a per-ceived threat that increases support for harsher measures to control crime (Chiricos, Hogan, & Gertz, 1997). Furthermore, as did previous researchers, we consistently found that Whites were more supportive of harsh punishment of criminals than African Americans.
Conclusion
It is impossible to prove a negative, but it is fair to say that our findings over-whelmingly fail to support the broad hypothesis that exposure to crime causes
Table 3. The Effects of Exposure to Crime on Punitiveness: Summary of Findings.
Preferred sentence length for Favors
Homicide Robbery Assault Burglary Death penalty
Crime rates Murder ns ns +, p = .07 ns +, p = .07 Robbery ns −, p < .01 ns ns ns Assault ns ns ns ns ns Burglary −, p = .07 ns −, p = .10 ns nsVictimization Robbery ns −, p < .01 −, p = .04 −, p = .09 ns Assault ns ns ns ns ns Burglary ns ns ns ns ns Know victim ns ns +, p = .04 ns nsPerceived risk Murder ns +, p = .08 ns ns ns Robbery ns ns ns ns ns Burglary ns ns ns ns ns Rising crime ns ns ns ns +, p = .05 Above average ns ns ns ns nsFear of crime Murder ns −, p = 07 ns ns ns Robbery ns ns ns ns ns Burglary ns ns ns ns ns
Note. Findings in bold are findings in the predicted positive direction and significant at the .05 level, two-tailed. p = two-tailed significance of coefficient; ns = two-tailed significance > .10.
at UTSA Libraries on May 12, 2016cad.sagepub.comDownloaded from

20 Crime & Delinquency
punitiveness. Higher crime rates do not cause increased support for harsher punishment of criminals, nor does personal experience as a crime victim, vicar-ious victimization through the experiences of others, higher perceived risk of becoming a victim in the future, a perception of rising crime rates, a perception of a local crime problem that is worse than average, or greater fear of crime.
In sum, support for punitive measures does not appear to be grounded in the reality of higher crime rates, prior victimization, or vicarious victimiza-tion, or even subjective reactions to these realities such as increased fear of crime or perceived risks of future victimization. Instead, it appears to be affected by factors with much weaker connections to the reality of crime. One variable that was consistently related to a variety of measures of punitiveness was the number of hours of local television news watched per week. Prior research indicates that viewing local TV news encourages fear of crime, quite apart from actual crime rates or personal contact with crime, and this effect is stronger than is the viewing of national news (Chiricos et al., 2000). Our findings, however, indicate that fear does not affect punitiveness; rather, viewing of local TV news somehow increases punitiveness independent of fear, local crime rates, victimization risk, and prior victimization. Perhaps repeated exposure to crime on television inspires generalized feelings of anger toward offenders rather than (or in addition to) fear of victimization.
Past research indicates that punitiveness can be generated by racial ani-mus, especially among Whites willing to typify criminals as Black (Chiricos et al., 2004; Unnever & Cullen, 2010). Although we did not have a measure of racial typification, our findings did show that greater punitiveness pre-vailed among Whites, and among persons living in places with a larger Black share of the population, independent of local crime rates. Considerable prior research supports the view that, among Whites who engage in racial typifica-tion, harsh treatment of racial minorities is justified by the need to control crime (Chiricos & Eschholz, 2002; Chiricos et al., 2004; Costelloe et al., 2009; Unnever & Cullen, 2010). Because punitiveness is not a response to the reality of crime, however, this appears to be more of a rationalization than an accurate explanation of support for harsh treatment of criminals.
Because our individual-level results indicate that punitiveness is not a response to crime, this suggests that at the societal level, the rise of punitive criminal jus-tice policies in the 1980s and 1990s likewise was not likely to have been due to a popular response to higher or rising crime rates, increased fear of crime, or greater perceived risk of victimization, even if those factors did increase. Therefore, an alternative explanation for this development is needed. It has been argued instead that conservative policy elites of that period who favored harsher treatment of criminals for their own ideological reasons deployed rhetoric to shift public opin-ion in a more punitive direction. Thus, elite opinion may have driven mass public
at UTSA Libraries on May 12, 2016cad.sagepub.comDownloaded from

Kleck and Jackson 21
Appendix
Wording of Key Questions
Measures of Exposure to Crime
•• Would you say that crime in your county is much lower than the national average, somewhat lower, about average, somewhat above average, or much higher than average?
•• Would you say that crime in your county is increasing, decreasing, or staying the same?
•• On a scale from 0 to 10, with 0 being not at all fearful and 10 being very fearful, how much would you say you fear being murdered? [being robbed or mugged? having your home broken into?]
•• Now I would like to ask you how likely you think it is that you actually will be a crime victim in the next 12 months.
On a scale from 0 to 10, where 0 means not at all likely and 10 means very likely, how likely do you think it is that in the next 12 months, you will be murdered? [robbed or mugged? have your home broken into?]
•• During the last year—that is between last March and now—did any-one break into or somehow illegally get into your home?
•• During the last year, did anyone take something directly from you using force—such as a stickup, mugging, or threat?
•• Since you became an adult, has anyone ever hit you, knocked you down, or actually attacked you in any way?
•• During the last year, has anyone you know personally been the victim of a serious crime or felony?
Measures of Punitiveness Toward Criminals
•• Do you favor or oppose the death penalty for persons convicted of murder?
•• Now I would like to change topics and ask you not about what you think is actually done by the courts in your area, but rather what kinds of punishment that you feel should be imposed on persons convicted of serious crimes. I am going to ask you only about people who were
opinion, rather than the reverse. If so, it was the “tough-on-crime” rhetoric wielded by conservative elites, more than the reality of crime, that drove increased public concern about crime (Beckett, 1997, pp. 28-43).
at UTSA Libraries on May 12, 2016cad.sagepub.comDownloaded from

22 Crime & Delinquency
convicted of crimes and given a jail or prison sentence. More specifi-cally, I would like to hear your opinion about the maximum sentence that you feel should be imposed for the average criminal.
For example, for the typical person convicted of a criminal homicide, what do you feel is the average maximum prison or jail sentence that should be imposed by the judge?
_ _ __ (years)or_____ (months)Life sentenceDeath sentenceNo opinionHow about for robbery? For the typical person convicted of a robbery,
what do you feel is the average maximum prison or jail sentence that should be imposed by the judge?
How about for aggravated assault? . . . (Rest of question is same as in previous question.)
Finally, how about burglary? . . . (Rest of question is same as in previous question.)
Histograms of the Punitiveness Variables
Support for the death penalty.
at UTSA Libraries on May 12, 2016cad.sagepub.comDownloaded from
Kleck and Jackson 23
Punitiveness index.
Preferred maximum sentence for robbery.
at UTSA Libraries on May 12, 2016cad.sagepub.comDownloaded from

24 Crime & Delinquency
Preferred maximum sentence for burglary.
Preferred maximum sentence for homicide.
at UTSA Libraries on May 12, 2016cad.sagepub.comDownloaded from
Kleck and Jackson 25
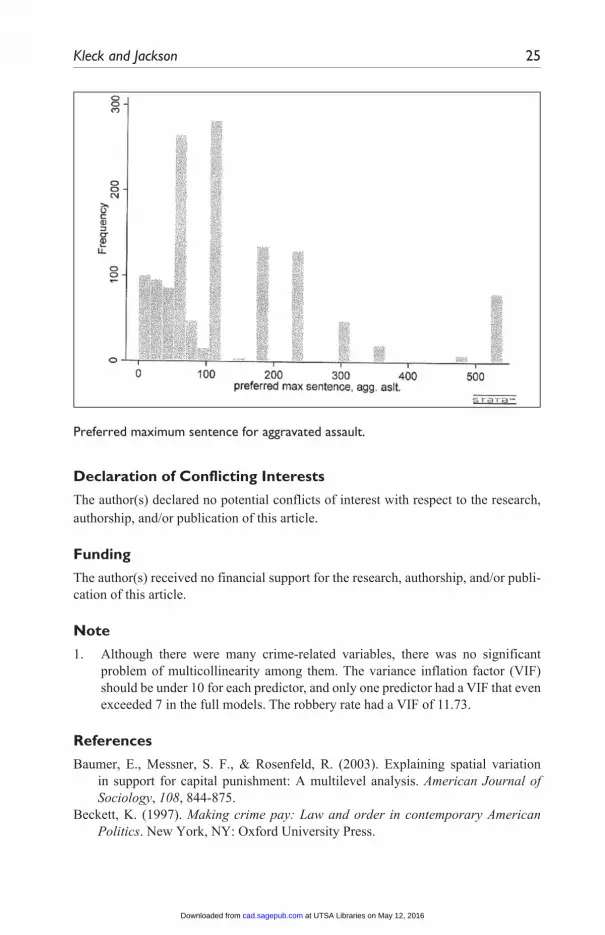
Preferred maximum sentence for aggravated assault.
Declaration of Conflicting Interests
The author(s) declared no potential conflicts of interest with respect to the research, authorship, and/or publication of this article.
Funding
The author(s) received no financial support for the research, authorship, and/or publi-cation of this article.
Note
1. Although there were many crime-related variables, there was no significant problem of multicollinearity among them. The variance inflation factor (VIF) should be under 10 for each predictor, and only one predictor had a VIF that even exceeded 7 in the full models. The robbery rate had a VIF of 11.73.
References
Baumer, E., Messner, S. F., & Rosenfeld, R. (2003). Explaining spatial variation in support for capital punishment: A multilevel analysis. American Journal of Sociology, 108, 844-875.
Beckett, K. (1997). Making crime pay: Law and order in contemporary American Politics. New York, NY: Oxford University Press.
at UTSA Libraries on May 12, 2016cad.sagepub.comDownloaded from

26 Crime & Delinquency
Borg, M. J. (1998). Vicarious homicide victimization and support for capital punish-ment: A test of Black’s theory of law. Criminology, 36, 537-567.
Chiricos, T., & Eschholz, S. (2002). The racial and ethnic typification of crime and the criminal typification of race and ethnicity in local television news. Journal of Research in Crime & Delinquency, 39, 400-420.
Chiricos, T., Hogan, M., & Gertz, M. (1997). Racial composition of neighborhood and fear of crime. Criminology, 35, 107-131.
Chiricos, T., McEntire, R., & Gertz, M. (2001). Perceived racial and ethnic composi-tion of neighborhood and perceived risk of crime. Social Problems, 48, 322-340.
Chiricos, T., Padgett, K., & Gertz, M. (2000). Fear, TV news and the reality of crime. Criminology, 38, 755-786.
Chiricos, T., Welch, K., & Gertz, M. (2004). The racial typification of crime and sup-port for punitive measures. Criminology, 42, 359-390.
Costelloe, M., Chiricos, T., & Gertz, M. (2009). Punitive attitudes toward criminals: Exploring the relevance of crime salience and economic insecurity. Punishment & Society, 11, 25-49.
Cullen, F. T., Clark, G. A., Cullen, J. B., & Mathers, R. (1985). Attribution, salience, and attitudes toward criminal sanctioning. Criminal Justice and Behavior, 12, 305-331.
Cullen, F. T., Fisher, B. S., & Applegate, B. K. (2000). Public opinion about pun-ishment and corrections. In M. Tonry (Ed.), Crime and justice: A review of the research (Vol. 27, pp. 1-79).Chicago, IL: University of Chicago Press.
DiIulio, J. J., Jr. (1997). Are voters fools? Crime, public opinion, and representative democracy. Corrections Management Quarterly, 1, 1-5.
Hanslmaier, M. (2013). Crime, fear and subjective well-being. European Journal of Criminology, 10, 515-533.
Hartnagel, T. F., & Templeton, L. T. (2012). Emotions about crime and attitudes to punishment. Punishment & Society, 14, 452-474.
Hogan, M. J., Chiricos, T., & Gertz, M. (2005). Economic insecurity, blame, and punitive attitudes. Justice Quarterly, 22, 392-412.
Johnson, D. (2006). Crime salience, perceived racial bias, and blacks’ punitive atti-tudes. Journal of Ethnicity in Criminal Justice, 4, 1-18.
King, A., & Maruna, S. (2009). Is a conservative just a liberal who has been mugged? Punishment & Society, 11, 137-169.
King, R. D., & Wheelock, D. (2007). Group threat and social control: Race, percep-tions of minorities and the desire to punish. Social Forces, 85, 1255-1280.
Leverentz, A. (2011). Neighborhood context of attitudes toward crime and reentry. Punishment & Society, 13, 64-92.
Messner, S. F., Baumer, E. P., & Rosenfeld, R. (2006). Distrust of government, the vigilante tradition, and support for capital punishment. Law & Society Review, 40, 559-590.
Ouimet, M., & Coyle, E. J. (1991). Fear of crime and sentencing punitiveness. Canadian Journal of Criminology, 33, 149-162.
Ousey, G. C., & Unnever, J. D. (2012). Racial-ethnic threat, out-group tolerance, and support for punishing criminals. Criminology, 50, 565-603.
at UTSA Libraries on May 12, 2016cad.sagepub.comDownloaded from
Kleck and Jackson 27
Pickett, J. T., & Baker, T. (2014). The pragmatic American: Empirical reality or methodological artifact? Criminology, 52, 195-222.
Pickett, J. T., & Chiricos, T. (2012). Controlling other people’s children. Criminology, 50, 673-710.
Pickett, J. T., Chiricos, T., Golden, K. M., & Gertz, M. (2012). Reconsidering the rela-tionship between perceived neighborhood racial composition and whites’ percep-tions of victimization risk: Do racial stereotypes matter? Criminology, 50, 145-186.
Rankin, J. H. (1979). Changing attitudes towards capital punishment. Social Forces, 58, 194-211.
Rich, R. F., & Sampson, R. J. (1990). Public perceptions of criminal justice policy. Violence and Victims, 5, 109-118.
Roberts, J. V. (1992). Public opinion, crime, and criminal justice. Crime and Justice, 16, 99-180.
Seltzer, R., & McCormick, J. P. (1987). The impact of crime victimization and fear of crime on attitudes toward death penalty defendants. Violence and Victims, 2, 99-114.
Simon, J. (2007). Governing through crime: How the war on crime transformed American Democracy and created a culture of fear. New York, NY: Oxford University Press.
Soss, J., Langbein, L., & Metelko, A. R. (2003). Why do white Americans support the death penalty. Journal of Politics, 65, 397-421.
Sprott, J. B., & Doob, A. N. (1997). Fear, victimization, and attitudes to sentencing, the courts, and the police. Canadian Journal of Criminology, 39, 275-291.
Stack, S. (2003). Authoritarianism and support for the death penalty: A multivariate analysis. Sociological Focus, 36, 333-352.
Taylor, D. G., Scheppele, K. L., & Stinchcombe, A. L. (1979). Salience of crime and support for harsher criminal sanctions. Social Problems, 26, 413-424.
Thomas, C. W., & Foster, S. C. (1975). A sociological perspective on public support for capital punishment. American Journal of Orthopsychiatry, 45, 641-657.
Tufts, J., & Roberts, J. V. (2002). Sentencing juvenile offenders: Comparing public preferences and judicial practice. Criminal Justice Policy Review, 13, 46-64.
Tyler, T. R., & Weber, R. (1982). Support for the death penalty. Law & Society Review, 17, 21-45.
Unnever, J. D., & Cullen, F. T. (2010). The social sources of Americans’ punitive-ness. Criminology, 48, 99-129.
Unnever, J. D., Cullen, F. T., & Fisher, B. S. (2007). A liberal is someone who has not been mugged’’: Criminal victimization and political beliefs. Justice Quarterly, 24, 309-334.
U.S. Bureau of the Census. (1994). County and city data book 1994. Washington, DC: U.S. Government Printing Office.
U.S. Department of Justice, Federal Bureau of Investigation. (2000). Uniform crime reporting data [United States]: County-level detailed arrest and offense data, 1998 [Computer file]. 2nd ICPSR ed. Ann Arbor, MI: Inter-university Consortium for Political and Social Research [producer and distributor].
Welch, K., Payne, A. A., Chiricos, T., & Gertz, M. (2011). The typification of Hispanics as criminals and support for punitive crime control policies. Social Science Research, 40, 822-840.
at UTSA Libraries on May 12, 2016cad.sagepub.comDownloaded from

28 Crime & Delinquency
Wu, Y., Sun, I. Y., & Wu, Z. (2011). Support for the death penalty: Chinese and American college students compared. Punishment & Society, 13, 354-376.
Author Biographies
Gary Kleck is the David J. Bordua professor of criminology and criminal justice at Florida State University. He received his doctorate in sociology from the University of Illinois in 1979, where he received the University of Illinois Foundation Fellowship in Sociology. He has been at Florida State since 1978. His research has focused on the topics of the impact of firearms and gun control on violence, deterrence, crime con-trol, and violence. He is the author of Point Blank: Guns and Violence in America, which won the 1993 Michael J. Hindelang Award of the American Society of Criminology, awarded to the book of the previous several years that “made the most outstanding contribution to criminology.” He also wrote Targeting Guns (1997) and, with Don B. Kates, Jr., The Great American Gun Debate (1997) and Armed (2001). His articles have been published in the American Sociological Review, American Journal of Sociology, Social Forces, Social Problems, Criminology, Journal of Criminal Law and Criminology, Law & Society Review, Journal of Research in Crime and Delinquency, Journal of Quantitative Criminology, Crime and Delinquency, UCLA Law Review, the Journal of the American Medical Association, and many other journals.
Dylan Baker Jackson is an assistant professor at the University of Texas, San Antonio. His research explores the biosocial underpinnings of antisocial behaviors. His recent work has examined the influence of neuropsychological deficits on low self-control and misconduct as well as the impact of children’s antisocial traits and behaviors on measures of family risk.
at UTSA Libraries on May 12, 2016cad.sagepub.comDownloaded from