Embed Size (px)
Citation preview

Eco-friendly Synthesis of Fly Ash and Volcanic Ash
Supported Solid Base Catalysts for Conventional
and Microwave Assisted Organic Transformations
A Thesis
Submitted for the Award of
Doctor of Philosophy
Degree
In Chemistry
(Faculty of Science)
to the
UNIVERSITY OF KOTA, KOTA
Supervised by Submitted by
Prof. Ashu Rani Stuti Katara
Department of Pure & Applied Chemistry
University of Kota, Kota
2015
UNIVERSITY OF KOTA, KOTA M.B.S. Marg, Near Kabir Circle, Kota (Raj.)
Prof. Ashu Rani Residence Head 2-m-1, Rangbari Scheme Dept. of Pure & Applied Chemistry Kota-324005 (Raj.) India University of Kota, Kota Ph: 0744-2420815 e-mail: [email protected]
Date.................
CERTIFICATE
It is to certify that the
i. Thesis entitled “Eco-friendly Synthesis of Fly Ash and Volcanic Ash
Supported Solid Base Catalysts for Conventional and Microwave
Assisted Organic Transformations” submitted by Stuti Katara is an
original piece of research work carried out by the candidate under my
supervision.
ii. Literary presentation is satisfactory and the thesis is in a form suitable
for publication.
iii. Work evidences the capacity of the candidate for critical examination
and independent judgment.
iv. Candidate has put in at least 200 days of attendance every year.
Prof. Ashu Rani

Dedicated
To
My Parents

“All of Science is nothing more than
the refinement of everyday thinking.”
-Albert Einstein

ACKNOWLEDGEMENT
Words are often less to reveals one’s deep regards. With an understanding
that work like this can never be the outcome of a single person, I take this
opportunity to express my profound sense of gratitude and respect to all those who
helped me through the duration of this work.
First and foremost, praises and thanks to “Shri Bade Mathuradhish Ji”
for his showers of blessings, for leading me in the right path and for giving me
strength to cross the toughest situations.
I avail this opportunity to extend my hearty indebtedness to my research
supervisor Prof. Ashu Rani for her invaluable guidance, untiring efforts,
patience, constant motivation and regular monitoring and meticulous attention at
all stages during my research work. I would also like to convey my deep regards
for her apart from the subject of my research, I learnt a lot from her, which I am
sure, will be useful in different stages of my life. She has provided many
opportunities for me to increase my abilities as a researcher and responsibilities as
a team member.
I am grateful to Sh. Onkar Singh, Vice Chancellor and Prof.
Madhusudan Sharma, former Vice Chancellor, University of Kota, Kota, for
allowing me to carryon my research work in his respective institute.
I would like to thank Dr. Arun Kumar, Lecturer, Department of
Mathematics, Govt. College, Kota, faculty members of Department of Pure &
Applied Chemistry, Uniersity of Kota, Dr. Niloo Chauhan, Dr. Bhawani Singh,
Dr. Shweta Vyas, Mr. Ankit Sharma, Dr. Sushil Sharma, Dr. Shweta
Saxena, Dr. Bhartiya Sharma, Dr. Suman Khinchi and official staff of
Department, Research section and Accounts section of University of Kota, for
immediate help and timely cooperation.
I would like to acknowledge Dr. Mukul Gupta, Dr. T. Shripathi, Dr. D.
M. Phase, Dr. Uday Deshpande of UGC-DAE Consortium for Scientific
Research, Indore, and technical staff of University of Pune, Pune, IIT Bombay,

Mumbai, SAIF, Chandigarh, IIT-Roorkee, Roorkee, CDRI, Lucknow for
providing instrumentation facilities for sample analysis. I would like to thank Mr.
Rawat and Mr. Chauhan, Indica Chem. Ind. Pvt. Ltd., Kotdwar (Uttarakhand)
for providing me samples of volcanic ash. I would like to express my sincere
thanks to UGC for giving me Junior and Senior Research Fellowship and Fly
Ash Mission Project, sanctioned to Prof. Ashu Rani for providing me analytical
support in my department.
I am grateful to my ex-colleagues Dr. Deepti, Dr. Anita, Dr. Shefali, my
lab-mates Sakshi, Renu, Khushboo, Niharika, Priyanka, Hari Om, Swarnima,
Niranjan and Rajesh for their unconditional support and friendly atmosphere in
the lab throughout my research career.
The highest gratitude goes to my family. My family has always been a
source of inspiration and encouragement. I wish to thank my father Mr. Chandra
Shekhar Katara and my mother Mrs. Anita Katara, whom love, teachings and
support have brought me this far. I wish to thank my elder brother Mr. Hemant
Katara for his affection, understanding and support and my uncle Dr. Rakesh
Katara for his guidance and sharing all the knowledge regarding research. I am
deeply thankful to my uncle Mr. Subhash Chaturvedi, my Bhuaji Mrs. Rama
Sharma, brother Mr. Davesh Sharma and my loving sister Mrs. Sudhi Sharma,
for unconditional support and help. Last but not the least, I would also like to
thank all members of Katara (paternal) and Sharma (maternal) families for their
support, love and wishes.
Stuti Katara

INDEX
CHAPTERS PAGE NO.
Chapter 1 : Introduction 1-27
1.1 Solid base catalysts 1
1.2 Generation of basic sites 2
1.3 Characterization of basic surfaces 4
1.4 Types of solid base catalysts 10
1.5 Fly ash 21
1.6 Volcanic ash 22
1.7 Scope of the work 23
1.8 References 23
Chapter 2 : Synthesis and Characterization of Solid Base Catalyst
from Perlite and Its Catalytic Application in Cross-
Aldol Condensation 28-54
Abstract 28
2.1 Introduction 29
2.2 Experimental 31
2.3 Catalyst characterization 32
2.4 Catalytic activity of KATP catalyst 34
2.5 Catalyst regeneration 35
2.6 Results and discussion 35
2.7 Catalytic activity 45
2.8 Reaction mechanism 48
2.9 Catalyst regeneration 51
2.10 Conclusion 53
2.11 References 53

Chapter 3 : Magnesium Nitrate Activated Perlite as Solid Base
Catalyst for Microwave Assisted Nitroaldol
Condensation Reaction 55-85
Abstract 55
3.1 Introduction 56
3.2 Experimental 58
3.3 Catalyst characterization 60
3.4 Experimental setup 60
3.5 Catalytic activity of MTP catalyst 63
3.6 Catalyst regeneration 65
3.7 Results and discussion 65
3.8 Catalytic activity 75
3.9 Reaction mechanism 78
3.10 Catalyst regeneration 81
3.11 Conclusion 83
3.12 References 84
Chapter 4 : Strontium Nitrate Activated Fly Ash: An Efficient
Solid Base Catalyst for Microwave Assisted Michael
Addition Reaction 86-115
Abstract 86
4.1 Introduction 87
4.2 Experimental 89
4.3 Catalyst characterization 90
4.4 Catalytic activity of SrTFA catalyst 92
4.5 Catalyst regeneration 93
4.6 Results and discussion 93
4.7 Catalytic activity 102
4.8 Reaction mechanism 106

4.9 Catalyst regeneration 109
4.10 Conclusion 112
4.11 References 113
Chapter 5 : Barium Nitrate Activated Fly Ash: Synthesis,
Characterization and Its Catalytic Application
116-146
Abstract 116
5.1 Introduction 117
5.2 Experimental 118
5.3 Catalyst characterization 119
5.4 Catalytic activity of BaTFA catalyst 119
5.5 Catalyst regeneration 122
5.6 Results and discussion 122
5.7 Catalytic activity 134
5.8 Reaction mechanism 138
5.9 Catalyst regeneration 138
5.10 Conclusion 143
5.11 References 144
Chapter 6 : Silica Enrichment in Fly Ash and Synthesis of Solid
Base Catalyst for Claisen-Schmidt Condensation
Reaction 147-171
Abstract 147
6.1 Introduction 148
6.2 Experimental 149
6.3 Catalyst characterization 150
6.4 Catalytic activity of CaSFA catalyst 150
6.5 Catalyst regeneration 152
6.6 Results and discussion 152
6.7 Catalytic activity 163
6.8 Reaction mechanism 166
6.9 Catalyst regeneration 169
6.10 Conclusion 170
6.11 References 170
ANNEXURE I 172-174
ANNEXURE II 175-178
Publications

Chapter 1
Introduction
Chapter 1
1
ir Humphrey Davy first observed the phenomenon of catalysis during
the development of the mine safety lamp in 1816. In 1835, Jons Jakob Berzelius
defined the term catalyst. A catalyst is a substance that increases the rate at which
a chemical reaction will reach equilibrium, without itself being consumed in the
reaction process [1]. The action of the catalyst is called catalysis and it comes
from two Greek words: Kata- “down” and lyein “loosen”.
The use of a catalyst provides a higher reaction rate at the same given
temperature without affecting the equilibrium of the reaction. The rate of the
forward reaction is increased thus the rate of the back reaction is also increased.
Hence the energy profile for a catalyzed reaction and an uncatalyzed reaction
differ only in the height of the activation curve.
Catalysts are divided in two main forms, namely heterogeneous and
homogeneous. Homogeneous catalysts exist in the same phase as that of the
reactants whereas the former describes a system in which the catalyst exists in a
different phase than that of the reactants. Usually heterogeneous catalysts exist in
solid form while the reactants are liquids/gases.
1.1 Solid base catalysts
Solid base catalysts are originally defined as catalysts for which the color
of an acidic indicator changes when it is chemically adsorbed. There are two types
of solid bases: Bronsted and Lewis base. According to Bronsted and Lewis
definitions, a Bronsted base is a proton acceptor and Lewis base is an electron-
pair donor [2]. Because of the advantages over liquid bases, the use of solid base
catalysts in organic synthesis is expanding. Solid bases are non-corrosive and
easier to dispose than liquid bases, separation and recovery of products, catalysts
recovery and reuse are easier in case of solid base catalyst. Furthermore, base-
catalyzed reactions can be performed without using solvents and even in the gas
phase, opening up more possibilities for discovering novel reaction systems [3].
Examples of the application of recyclable solid base catalysts are far fewer than
for solid acids because a number of industrially important reactions are solid acid
catalyzed therefore fewer efforts have been devoted to solid base catalysts [4].
S

Chapter 1
2
Four reasons for recognizing certain materials as heterogeneous basic catalysts are
as follows.
(1) Characterization of the surfaces indicates the existence of basic sites:
characterizations of the surfaces by various methods such as color change of the
acid-base indicators adsorbed, surface reactions, adsorption of acidic molecules,
and spectroscopies (UV, IR, XPS, ESR etc.) indicate that basic sites exist on the
surfaces.
(2) There is a parallel relation between catalytic activity and the amount and/or
strength of the basic sites: The catalytic activities correlate well with the amount
of basic sites or with the strength of the basic sites measured by various methods.
Also, the active sites are poisoned by acidic molecules such as HCl, H2O and
CO2.
(3) The material has similar activities to those of homogeneous basic catalysts for
“base-catalyzed reactions” well-known in homogeneous systems. There are a
number of reactions known as base-catalyzed reactions in homogeneous systems.
Certain solid materials also catalyse these reactions to give the same products.
The reaction mechanisms occurring on the surfaces are suggested to be essentially
the same as those in homogeneous basic solutions.
(4) There are indications of anionic intermediates participating in the reactions:
mechanistic studies of the reactions, product distributions and spectroscopic
observations of the species adsorbed on certain materials indicate that anionic
intermediates are involved in the reactions [5].
1.2 Generation of basic sites
Generally, the surface of solid base catalyst is covered with carbon
dioxide, water, oxygen etc. and shows no activity for base-catalyzed reactions.
Generation of basic sites requires high-temperature pre-treatment to remove
adsorbed species and in some cases, alkaline earth oxides adsorb CO2, H2O and
O2 form carbonates, hydroxides and peroxides respectively. For removal of these
adsorbed species from the surfaces high-temperature pre-treatment is essential to
obtain the active metal oxide surfaces. Evolution of CO2, H2O and O2 results in
generation of basic sites on the surfaces which act as catalytically active sites for
Chapter 1
3
several reaction types. The nature of the basic sites thus the change in catalytic
activity depends on the severity of the pre-treatment.
As an example, the activity maxima of MgO appear at different pre-
treatment temperatures for different reaction types: 800 K for 1-butene
isomerization, 973 K for CH4-D2 exchange and amination of 1,3-butadiene with
dimethylamine, 1273 K for hydrogenation of 1,3-butadiene and 1373 K for
hydrogenation of ethylene.
As the pre-treatment temperature increases, the molecules covering the
surfaces are successively desorbed according to the strength of the interaction
with the surface sites. The molecules weakly interacting with the surfaces are
desorbed at lower pre-treatment temperatures, and those strongly interacting are
desorbed at higher temperatures. However, rearrangement of surface and bulk
atoms also occurs during pre-treatment in addition to desorption of the molecules,
which is evidenced by a decrease in the surface area with an increase in the pre-
treatment temperature.
According to the proposal by Coluccia and Tench, there exist several
Mg–O ion pairs of different co-ordination numbers on the surface of MgO catalyst
as shown in Figure 1.1. Ion pairs of low coordination numbers exist at corners,
edges and high Miller index surfaces. Different basic sites generated by increasing
the pre-treatment temperature appear to correspond to the ion pairs of different
coordination numbers. The correspondence between the catalytically active sites
for different reaction types and the coordination number of the ion pairs, however,
is not definite yet. Among the ion pairs of different coordination numbers, the ion
pair of three-fold Mg2+
three-fold O2−
is most reactive and adsorbs CO2 most
strongly. To reveal the ion pair, the highest pre-treatment temperature is required.
At the same time, the ion pair is most unstable and tends to rearrange easily at
high temperature. The appearance of such highly unsaturated sites by the removal
of CO2 and the elimination by the surface rearrangement compete, which results
in the activity maxima with change in the pre-treatment temperature. Such
variations of catalytic activities with pre-treatment temperature as observed for
MgO are common to those for other types of solid base catalysts too. It is essential
to remove the adsorbed CO2, H2O and in some cases, O2 from the surfaces to

Chapter 1
4
generate basic sites, though proper pre-treatment temperatures vary with the types
of catalysts and reactions [4].
It is important to know as exception that the surface basic sites generated
on rare earth oxides, however, behave differently from those of the other
heterogeneous base catalysts. The sites of rare earth oxides do not seem to vary in
nature with pre-treatment temperature.
Figure 1.1: Ions in low coordination on the surface of MgO.
1.3 Characterization of basic surfaces
The surface properties of the heterogeneous basic catalysts have been
studied by various methods by which existence of basic sites has been realized.
Different characterization methods give different information about the surface
properties. All the properties of basic sites cannot be measured by any single
method. Integration of the results obtained by different characterizations interprets
the structures, reactivities, strengths and amounts of the basic sites on the catalyst
surfaces. In this section, some representative methods for characterization of the
surface basic sites are described.

Chapter 1
5
1.3.1 Indicator method
Acid-base indicators change their colors according to the strength of the
surface sites and pKBH values of the indicators. The strength of the surface sites
are expressed by an acidity function (H_) proposed by Paul and Long. The H_
function is defined by the following equation [6]:
H_ = pKBH + log [B-]/[BH]
where [BH] and [B-] are, respectively, the concentration of the indicator BH and
its conjugated base and pKBH is the logarithm of the dissociation constant of BH.
The reaction of the indicator BH with the basic site B is
BH B B BH
The amount of basic sites of different strengths can be measured by
titration with benzoic acid. A sample is suspended in a nonpolar solvent and an
indicator is adsorbed on the sample in its conjugated base form. The benzoic acid
titer is a measure of the amount of basic sites having a basic strength
corresponding to the pKBH value of the indicator used.
1.3.2 Temperature-programmed desorption (TPD) of carbon
dioxide
This method is frequently used to measure the number and strength of
basic sites. The strength and amount of basic sites are reflected in desorption
temperature and the peak area, respectively, in a TPD plot. However, it is difficult
to express the strength in a definite scale and to count the number of sites
quantitatively. Relative strengths and relative numbers of basic sites on the
different catalysts can be estimated by carrying out the TPD experiments under
the same conditions. TPD plots of CO2 desorbed from alkaline earth oxides are
compared in Figure 1.2 and the strength of basic sites is found to be in the
increasing order of MgO < CaO < SrO < BaO [7].
1.3.3 UV absorption and luminescence spectroscopies
UV absorption and luminescence spectroscopies give information about
the coordination states of the surface atoms. High surface area MgO absorbs UV
light and emits luminescence, which is not observed with MgO single crystal.

Chapter 1
6
Ion pairs of low coordination numbers responsible for UV absorption and
luminescence exist at corners, edges or high Miller index surfaces. The surface
model for MgO shown in Figure 1.1 was proposed on the basis of UV absorption
and luminescence together with the effects of hydrogen adsorption on the
luminescence spectrum [5]. Although the UV absorption and luminescence
spectroscopies give us useful information about the coordination state, it is
difficult to count the number of the sites of a certain coordination state.
Figure 1.2: TPD plots of carbon dioxide desorbed from alkaline earth
oxides.
1.3.4 Temperature-programmed desorption of hydrogen
This method gives information about the coordination state of the surface
ion pairs when combined with the other methods such as UV absorption and
luminescence spectroscopies. The number of each ion pair could be counted if
TPD is accurately measured with a proper calibration method. This method has
been applied only to the MgO surface. Hydrogen is heterolytically dissociated on
the surface of MgO to form H+ and H
-, which are adsorbed on the surface O
2- ion
and Mg2+
ion, respectively. TPD plots of hydrogen adsorbed on MgO pre-treated
at different temperatures are shown in Figure 1.3.
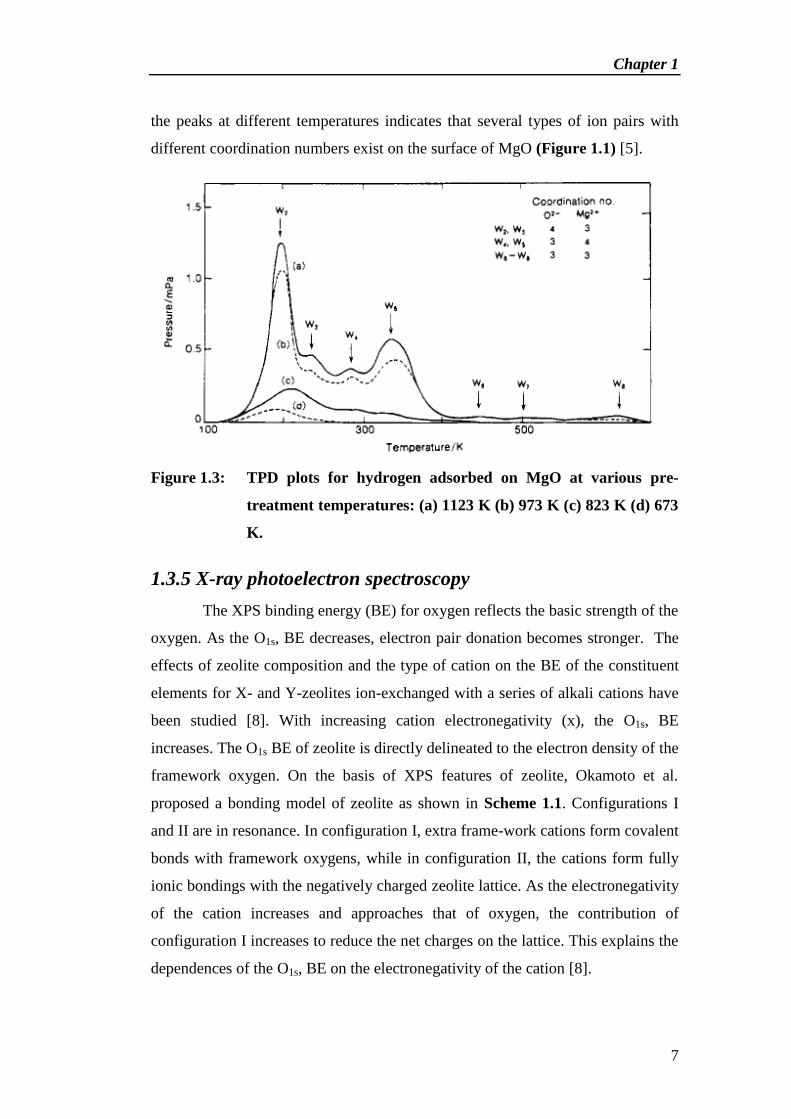
Seven desorption peaks appear in the temperature range 200-650 K.
Appearance of the peaks varies with the pre-treatment temperature. Appearance of
Chapter 1
7
the peaks at different temperatures indicates that several types of ion pairs with
different coordination numbers exist on the surface of MgO (Figure 1.1) [5].
Figure 1.3: TPD plots for hydrogen adsorbed on MgO at various pre-
treatment temperatures: (a) 1123 K (b) 973 K (c) 823 K (d) 673
K.
1.3.5 X-ray photoelectron spectroscopy
The XPS binding energy (BE) for oxygen reflects the basic strength of the
oxygen. As the O1s, BE decreases, electron pair donation becomes stronger. The
effects of zeolite composition and the type of cation on the BE of the constituent
elements for X- and Y-zeolites ion-exchanged with a series of alkali cations have
been studied [8]. With increasing cation electronegativity (x), the O1s, BE
increases. The O1s BE of zeolite is directly delineated to the electron density of the
framework oxygen. On the basis of XPS features of zeolite, Okamoto et al.
proposed a bonding model of zeolite as shown in Scheme 1.1. Configurations I
and II are in resonance. In configuration I, extra frame-work cations form covalent
bonds with framework oxygens, while in configuration II, the cations form fully
ionic bondings with the negatively charged zeolite lattice. As the electronegativity
of the cation increases and approaches that of oxygen, the contribution of
configuration I increases to reduce the net charges on the lattice. This explains the
dependences of the O1s, BE on the electronegativity of the cation [8].

Chapter 1
8
Si
O O
O
Al
O O
Si
O
O
O
O O
M
Si
O O
O
Al
O O
Si
O
O
O
O O
M+
-
I II
Scheme 1.1: Schematic bonding model of zeolite.
1.3.6 IR of carbon dioxide
This method gives information about the adsorbed state of CO2 on the base
catalyst surface. Carbon dioxide interacts strongly with a basic site and therefore,
the surface structures including basic sites are estimated from the adsorbed state
of CO2. Carbon dioxide is adsorbed on MgO and other heterogeneous basic
catalysts in different forms: bidentate carbonate, unidentate carbonate and
bicarbonate (Scheme 1.2). For CaO, carbon dioxide is adsorbed in the form of
bidentate carbonate. In the adsorption state of unidentate carbonate, only surface
oxygen atoms participate, while the metal ion participate in the adsorption state of
bidentate. In other words, the existence of only a basic site is sufficient for
unidentate carbonate, but the existence of both a basic site and a metal cation is
required for bidentate carbonate [5].
C
O
O O
M M
Bidentate
C
O
OO
MM
Unidentate
Scheme 1.2: Adsorbed forms of carbon dioxide.

Chapter 1
9
1.3.7 IR of pyrrole
Pyrrole is proposed to be a probe molecule for measurement of the
strength of basic sites. The IR band ascribed to the N-H stretching vibration shifts
to a lower wavenumber on interaction of the H atom in pyrrole with a basic site
(Scheme 1.3). The shift increases when the negative charge on the oxide ion
increases. The negative charge is associated closely with the strength of the basic
site. The basic strengths of alkali ion-exchanged zeolites are in the order CsX >
NaX > KY > NaY, KL, Na-mordenite, Na-beta. According to the pyrrole IR basic
strengths of the basic sites are found to be in the order CsX > RbX > KK X NaX >
LiX and CsY > RbY > KY > NaY > LiY.
N H
+ Si
O
Al Si
OO O
M+
-
Si
O
Al Si
OO O
M+
-
H
N
Scheme 1.3: Model for pyrrole chemisorbed on a basic site.
1.3.8 Oxygen exchange between carbon dioxide and catalyst
surface
This method gives information about the dynamic nature of interaction of
adsorbed CO2 with the surface ion pair. As described above, carbon dioxide is
used as a probe molecule for the basic properties in IR and TPD. If 18
O-labeled,
carbon dioxide is used, additional information about the nature of basic sites is
obtained. Oxygen exchange between adsorbed CO2 and the MgO surface takes
place to a considerable extent. TPD desorption peak consisting mainly of Cl6
O2
and Cl6
Ol8
O after Cl8
O2 adsorption on MgO and suggested that the adsorbed Cl8
O2
interacts with the peroxy ion (16
Os,)22-
on a defect in the MgO surface. It could be
concluded that basic sites are not fixed on the surface but are able to move over
the surface when carbon dioxide is adsorbed and desorbed. The position of the
basic site (surface O atom) changes as CO2 migrates over the basic site. In

Chapter 1
10
addition, it became clear that not only O2-
basic sites but also adjacent Mg2+
sites
participate in CO2 adsorption. Therefore, it is reasonable to consider that the metal
cations adjacent to the basic site participate in the base-catalyzed reactions.
1.4 Types of solid base catalysts
The types of heterogeneous basic catalysts are listed in Table 1.1. These
materials act as a base toward most of the reagents and, therefore, are called
heterogeneous basic catalysts or solid base catalysts [5]. The detail of different
types of solid base catalysts is given below.
Table 1.1: Types of solid basic catalysts.
Type of solid base Catalyst Example
Single metal oxide Alkali earth oxides MgO, CaO, SrO and BaO
Rare earth oxide La2O3 and YbO2
Transition metal oxide ZrO2
Mixed Oxide Mg-Al mixed oxide MgO-Al2O3
Mg-Ti mixed oxide MgO-TiO2
Supported catalyst Catalyst: Na, K, KF, KNO3 and
K2O KF/Al2O3, Na/NaOH/ Al2O3
Support: C, Al2O3, SiO2, ZrO2
and MgO Na/MgO
Mesoporous material Modified mesoporous material MgO/SBA-15
Functionalised mesoporous
material
MCM-41 functionalised
with amino groups
Mesoporous silicon oxynitride
Zeolite Alkali ion exchanged zeolite Cs-exchanged zeolite X, Y
Alkali metal or metal oxide
occluded zeolite Cs-occluded zeolite X, Y
Clay and modified
clay
Hydrotalcite , Chrysolite,
Sepiolite Magnesium silicate
Hydrotalcite- calcined and
rehydrated Mg-Al hydrotalcites
Oxynitride Silicon oxynitride SiON

Chapter 1
11
Aluminophosphate oxynitride AlPON
Zirconophosphate oxynitride ZrPON
Other Modified natural phosphate (NP) Calcined NaNO3/NP
1.4.1 Alkali and alkaline earth metal oxide
Various supported and unsupported alkali and alkaline earth metal
compound used as catalyst are well reported in the literature. CaO, Al2O3
supported Li2O, Na2O, K2O, CaO, MgO catalysts have been used in
transesterification of palm kernel oil and coconut oil (Scheme 1.4) [9]. The
calcination temperature was found to largely influence the catalytic activity of the
resultant catalysts, except for Mg(NO3)2/Al2O3 that exhibited very low methyl
ester content at all temperatures. Ca(NO3)2/Al2O3 and LiNO3/Al2O3 yielded the
high methyl ester contents (>90%) when the calcination was performed at 450 oC.
With increasing the temperature, the methyl ester contents were dropped due to
the formation of inactive metal aluminates. On the contrary, the activities of
NaNO3/Al2O3 and KNO3/Al2O3 catalysts were remarkably improved when the
calcination was carried out at >550 oC [9].
Scheme 1.4: Transesterification of palm kernel oil and coconut oil over CaO
catalyst.
Dimerisation of ethanol to butanol over MgO, CaO and BaO solid-base
catalysts is reported by Ndou et al. (Scheme 1.5) [10]. The dimerisation reaction
does not proceed primarily through the aldol condensation reaction. The reaction
is proposed to proceed through a mechanism in which a C–H bond in the β-
position on ethanol is activated by the basic metal oxide and condenses with
another molecule of ethanol by dehydration to form 1-butanol which is a crucial
building block for acrylic acid and acrylic esters and is widely used as a solvent. It
is also used as an additive to gasoline [10].

Chapter 1
12
H3C CH2
OH
H2C CH2
OHH
-H2O H3C
H2C CH2
H2C OH
H3C
H2C CH2
CH
O
-H2
+H2
Ethanol 1-butanolButanaldehyde
Ethanol
MgO
Scheme 1.5: Dimerisation of ethanol to 1-butanol.
1.4.2 Rare earth oxide
Lanthanide (III) complexes of p-toluenesulfonic acid (Ln(TOS)3) catalysts
for acylation of 2-phenylethanol have been reported and found a clear correlation
between the ionic radius of the lanthanide (III) ion and the yield of the reaction
product (Scheme 1.6). It is revealed that conversion or catalytic activity decreases
with increase in ionic radius of lanthanide (III) ion [11].
OHO CH3
O
H2OCH3COOH
Ln(TOS)3
+
2-phenylethanolphenethyl acetate
Scheme 1.6: Acylation reaction over lanthanide (III) tosylate catalyst.
La, Cs-La, Sm, Cs-Sm, Ce, Cs-Ce phosphate catalysts for vapor phase
O-alkylation of phenol to anisole [12] and Eu2O3/Al2O3 catalyst for the
transesterification of soybean oil with methanol to biodiesel have been reported
[13].
1.4.3 Mixed metal oxide
Mixed metal oxides (MMOs), contains alkali, alkaline, rare earth and
noble metals. A variety of reactions such as reduction, oxidation, alkylation,
Mannich, condensation, deprotection, cycloaddition, hydroxylation,
dehydration, dehydrogenation, transesterification, reactions involving biomimetic

Chapter 1
13
oxygen-evolving catalysts and other important C–C bond forming reactions are
well reported on the surface of mixed metal oxides. The mixed metal oxides are
important in organic reactions, industrial applications and green chemistry [14].
The KI impregnated Mg–Al mixed-metal oxide catalyst has base strength
in the range of 9.8-15, efficiently catalyses transesterification of soybean oil with
methanol with >90% conversion to biodiesel. Al-O-K sites are the basic site in the
catalyst [15].
Biodiesel production from palm oil by CaO–CeO2 [16], palm kernel oil
by CaMgZn mixed oxide (Scheme 1.7) [17], jatropha curcas oil by K2CO3/ HT
[18], soyabean oil by MgAlNi [19] and rapeseed oil by hydrated tricalcium
aluminate (Ca3Al2O6.6H2O) [20, 21].
C
C
OOR1H
H
OOR2
C
H
OOR3H
H
+ 3ROH
RCOOR1
RCOOR3
RCOOR2
C
C
OHH
H
OH
C
H
OHH
H
+
Triglyceride Alcohol Glycerol Alkyl ester
CaMgZn mixed oxide catalyst
Scheme 1.7: Biodiesel syhthesis reaction.
Ni/SrO-CaO catalyst for the selective conversion of hydrocarbons to
C2H2 and CO has been reported by Michael et al. (Scheme 1.8) [22]. MgO-LaO
mixed oxide prepared by coprecipitation, was used to catalyse the reaction of
cyclic carbonates and methanol at 150 oC for 2 h, to form dimethyl carbonate [23].

Chapter 1
14
Ni/AEM(OH)2.zH2O
Ni/AEMO
(z+1) H2O
Ni/AEMO/C/MC2
(1-y) CO
Ni/AEMO/MC2
3 CHx
1.5 x H2 + y CO
(z+2) H2O
C2H2
Scheme 1.8: A schematic process for the selective production of C2H2 and
CO from gaseous hydrocarbons (CHx) using Ni-modified
alkaline earth metal oxide (AEMO) and metal carbide (MC2)
intermediates.
1.4.4 Zeolite
Zeolites are microporous, aluminosiliicate minerals commonly used as
commercial adsorbents and catalysts. The elementary building units of zeolites are
SiO4 and AlO4 tetrahedra (Figure1.4). Adjacent tetrahedra are linked at their
corners via a common oxygen atom and resulted in an inorganic macromolecule
with a structurally distinct three-dimensional framework. It is evident from this
building principle that the net formula of the tetrahedra are SiO2 and , i.e.
one negative charge resides at each tetrahedron in the framework which has
aluminum in its center [24].
Figure 1.4: Basic zeolite structure.

Chapter 1
15
The basic strength and density of basic sites in alkali ion exchanged
zeolites decrease with an increase in framework Si/Al ratio, while basic strength
increases with an increase in electropositivity of the counter cation in zeolites
[25]. The characteristic features of zeolites are due to their ion exchange ability
and specific pore structure.
Basic zeolites can be categorized in two categories:
(i). Alkali ion-exchanged zeolite
(ii). Alkali ion-added zeolite
(i) Alkali ion-exchanged zeolite
Zeolite possesses a net negative charge that is the result of the
isomorphous replacement of Si4+
by Al3+
in the crystal lattice. This negative
charge is balanced by cations (Na+, K
+ or Ca
2+) that are exchangeable with other
cations in solution (Figure 1.5). Thus, zeolites have great selectivity for cation
exchange, but little or no affinity for anions [26]. In alkali ion exchanged zeolites,
the type of alkali ions used, affects the basic strength of the resulting zeolites. The
effect of alkali ion on the basic strength follows the order Cs>Rb>K>Na> Li [27].
Ion exchange, on NaY and NaX zeolites with alkali metal cations Li+, K
+, Rb
+
and Cs+ has been performed and catalytic efficiency has been studied by
adsorption of CO2 [28]. Cs exchanged NaX and NaY zeolite have been reported
as effective catalysts for conversion of isopropanol to propene and acetone [29].
Na+
ion exchange Y and ZSM-5 zeolites have been reported for catalytic
oxidation of ethyl acetate [26].
(ii) Alkali ion-added zeolite
The zeolites having nanophase alkali metal oxides inside the zeolite
cavities are known as alkali ion added zeolites [30]. In this category cesium oxide
added faujasite zeolite has been synthesized by post-synthetic modification of
basic CsNaX and CsNaY zeolites by impregnation with cesium acetate followed
by thermal decomposition of the cesium acetate into oxide. The addition of metal
oxides in zeolite cage structures generates additional basic sites responsible for
improved catalytic activity [31].

Chapter 1
16
Figure 1.5: Alkali ion exchanged zeolite structure.
1.4.5 Supported solid base catalyst
Pure metal oxides own a poor specific surface area that seriously hinders
their efficiency as catalysts. A convenient way to overcome this problem is to
either coat a support with the metal oxide nanoparticles or to disperse them within
a porous host that has a high surface area.
(i) Alumina supported base catalyst
Among alumina supported catalysts, KOH and KF supported on alumina
are most widely studied. KF/Al2O3, LiF/Al2O3, CsF/Al2O3 etc. catalysts are
found to be suitable for a wide range of industrially important reactions. As shown
in the catalyst model the O- is found to be more basic than F
- (Figure 1.6) [32].
KF/Al2O3 catalyst has been used as a heterogenous base catalyst in a
number of base-catalyzed reactions such as transesterification of canola oil and
methanol to canola oil methyl ester [33], Suzuki-Miyaura reaction [34], Michael
addition, aldol condensation and synthesis of diethyl carbonate by
transesterification of ethylene carbonate at temperature 323 K under atmospheric
pressure in liquid phase reaction condition [35,36].
KOH/Al2O3 is utilized for biodiesel production [37]. Sarda and co-
workers reported synthesis of chalcone via Claisen Schmidt reaction is reported
on NaOH/Al2O3 [38]. The isomerization olefinic amines were carried out in a
quartz reactor using KNH2/Al2O3 as the catalyst. The reactant was introduced to

Chapter 1
17
the rector from the side arm, after the catalyst was prepared. The isomerization of
N,N-diethyl-3,7-dimethyloct-2-enylamine, was carried out at 353 K for 1 h. The
product was corresponding enamine, which was obtained in a 91% yield with a
95% selectivity. The isomerized product has 100% E configuration. This proves
that the catalyst KNH2/Al2O3 is very effective for the isomerization of olefinic
amines as well as simple alkenes [39].
Figure 1.6: Alumina supported alkaline metal fluoride catalyst structure.
Na/NaOH/Al2O3 shows a very high catalytic activity for the isomerization
of 2,3- dimethylbut-1-ene to 2,3-dimethylbut-2-ene, which is usable as an
intermediate material for synthetic parathyroid. A 94% yield was obtained in 3 h
at 293 K (Scheme 1.9) [39].
H2C C
CH3
CH
CH3
CH3 H3C C
CH3
C
CH3
CH3
Na/NaOH/Al2O3
2,3-dimethylbut-1-ene 2,3-dimethylbut-2-ene
Scheme 1.9: Double bond isomerization reaction.

Chapter 1
18
(ii) Silica supported base catalyst
The activity of Li/SiO2, Na/SiO2, K/SiO2, Cs/SiO2 catalysts increases
with the basicity of the metal (Cs > K > Na > Li). O-alkylation of 2-naphthol has
been investigated in the vapor phase over alkali-loaded silica (Figure 1.7) [40].
Figure 1.7: Synthesis of NaOH activated silica catalyst from silica.
Silica supported ammonium acetate is reported as an efficient and
recyclable heterogeneous catalyst for Knoevenagel condensation between
aldehydes or ketones and active methylene group in liquid phase (Scheme 1.10).
The product has numerous applications in the elegant synthesis of fine chemicals,
hetero Diels-Alder reactions and in the synthesis of carbocyclic as well as
heterocyclic compounds of biological significance [41].
R1
R2
O +
CN
XCH2Cl2, 60 oC
SiO2-NH4OAc NC R1
R2X
X = CN, COOEt
Scheme 1.10: Knoevenagel condensation between aldehydes or ketones and
active methylene group.

Chapter 1
19
Silica supported cinchona alkaloids as heterogeneous catalysts for
asymmetric michael reaction is reported by Zhao et. al [42]. Oh et al. reported
isomerization of 5-vinyl-2-norbornene using sodium-coated silica catalysts [43].
Crotonaldehyde production with the help of MgO/SiO2 catalyst has been reported
[44].
(iii) Carbon supported base catalyst
Cs/nanoporous carbon catalyst provides cis-but-2-ene by isomerization
of but-1-ene at 273 K [45]. Cs-Ru/Carbon catalyst prepared by impregnation has
been reported as effective catalyst for ammonia synthesis [46]. Ammonia
synthesis over Ba-Co/graphitised carbon is reported by Rarog-Pilecka et.al [47].
CaO/SrO/BaO supported on carbon nano fibers are reported as efficient
catalysts for self condensation of acetone and transesterification reactions. These
metal oxides on the carbon nanofibers are found to be amorphous in nature [48].
1.4.6 Solid super base catalyst
Normally, catalysts which possess base sites stronger than pKa = 26 are
called super base and all the metal deposited catalysts comes under the super base
category. Solid super basic materials are highly promising for applications in
environmentally friendly and economical catalytic processes, because they can
catalyze diverse reactions under mild conditions and reduce waste production
[49]. The generation of strong basic sites was also reported by the reaction of
alkali metal with holes trapped on oxygen anions near to the cationic vacancy
[50].
In the development of environment-benign processes, solid super bases are
used as catalysts so that reactions can be conducted under mild conditions and
without generation of much waste. In the past two decades, there were many
reports on solid super bases such as NaN3/γ-Al2O3, Na/NaOH/γ-Al2O3, K/MgO,
Eu2O3/γ-Al2O3, KNO3/γ-Al2O3, KNO3/ZrO2, KOH/ZrO2, KF/γ-Al2O3,
K/KOH/γ-Al2O3 and Ca(NO3)2/SBA-15 [50]. Recently, we found that the solid
super bases Na2SnO3 and KOH/La2O3–MgO showed excellent catalytic
efficiency towards some organic reactions at room temperature [51].
Chapter 1
20
1.4.7 Mesoporous material as base catalyst
Mesoporous materials with high surface area, controllable pore size and
narrow pore distribution are interesting in applications as shape selective catalysis
and shape selective adsorption. The most common types of mesoporous materials
are MCM-41 and SBA-15. Promising solid base catalyst N/MgO/MCM-41 is
prepared by nitridation of MgO-loaded mesoporous MCM-41. Basic species,
bridging –NH– and terminal –NH2 groups, are introduced into the framework of
MgO/MCM-41 by nitridation. Prepared catalyst has been used in Knoevenagel
condensation reaction and Claisen–Schmidt reaction [52]. Ca/MCM-41 is
reported as a solid base catalyst for transesterification of palm olein [53].
Magnetic iron oxide nanoparticles are incorporated in MCM-41 and organic
amines (i.e. propylamine and propyl diethylene amine) are grafted to obtain
magnetic mesoporous catalysts for the Knoevenagel condensation reactions. The
catalyst can be easily dispersed into solution and rapidly removed by a magnet for
recovery and reuse [54].
Biodiesel production by transesterification using tetraalkylammonium
hydroxides immobilized onto SBA-15 as a solid catalyst has been reported by Xie
et al. [55]. Transesterification of canola oil as biodiesel over Na/Zr-SBA-15
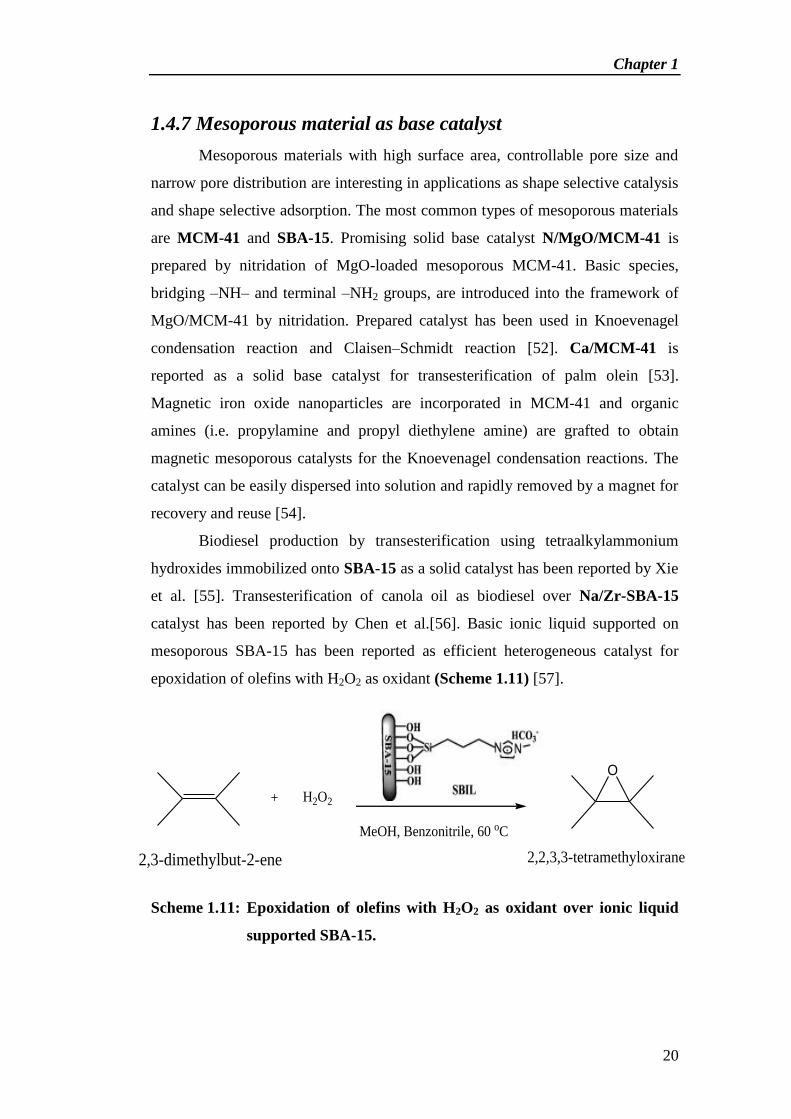
catalyst has been reported by Chen et al.[56]. Basic ionic liquid supported on
mesoporous SBA-15 has been reported as efficient heterogeneous catalyst for
epoxidation of olefins with H2O2 as oxidant (Scheme 1.11) [57].
Scheme 1.11: Epoxidation of olefins with H2O2 as oxidant over ionic liquid
supported SBA-15.
+ H2O2
O
2,2,3,3-tetramethyloxirane2,3-dimethylbut-2-ene
MeOH, Benzonitrile, 60 oC

Chapter 1
21
1.4.8 Clay based catalytic material
Clay is a fine-grained natural rock or soil material that combines one or
more clay minerals with traces of metal oxides and organic matter. Clays are
distinguished from other fine-grained soils by differences in size and mineralogy.
Unmodified hydrotalcites (HTs, a basic anionic clay), as catalyst in the Michael
addition reaction between nitromethane and α,β-unsaturated ketones under MW
has been reported by Kumae et al. ( Scheme 1.12) [58].
R
O
R'
O
R R'
NO2X
XCH2NO2
HT, MW/
Scheme 1.12: Hydrotalcite catalyzed microwave assisted Michael addition.
KF/clay, a material with excellent stability and high catalytic activity is
reported for the conversion of soybean oil into biodiesel in the presence of methyl
alcohol [59]. Sepiolite – a naturally-porous hydrated magnesium silicate with the
highest surface area among all clay minerals, modified by loading 10–50wt.% of
K2CO3, was found to be very active in the catalysis of the transesterification
reaction of canola oil with methanol [60].
1.5 Fly ash
Fly ash, a major residue arising from the combustion of pulverized coal, is
one of the main wastes generated in coal-fired power plants. The chemical
composition of fly ash with high percentage of silica (60– 65%), alumina (25–
30%), magnetite, Fe2O3 (6–15%) make it useful for the synthesis of zeolite,
catalyst and precipitated silica [61]. The other important physicochemical
characteristics of fly ash, such as surface area 2.57 m2/g, bulk density 0.994
g/cm3, average particle size 17.02 μm, porosity, water holding capacity and
surface area make it suitable for use as an adsorbent [62–65]. Fly ash after
appropriate activation has been converted into solid acid and solid base catalyst.
Chapter 1
22
1.5.1 Fly ash supported solid base catalysts
Fly ash supported aminopropylatedtrimethoxysilane (APTMS/FA) has
been used as recyclable catalyst for the synythesis of ethyl(cyclohexylidene)
cyanoacetate by Knoevenagel condensation reaction [66]. Fly ash loaded NaOH
[67], CaO [68], MgO [69] and KF/Al2O3 [70] have been reported as efficient
catalysts for the synthesis of 1,1’-dibenzylidenecyclohexanone, ethyl(E)-α-
cyanocinnamate, 4-methoxy-2’-hydroxychalcone and 2’-hydroxy chalcone,
respectively by various condensation reactions.
1.6 Volcanic ash
Volcanic ash also known as perlite, is a silicious and volcanic glass lava
containing crystal water, falling into the category of igneous rock. After
calcination at high temperature 760-1100 oC, crystal water in the rocks
evaporates, and the perlite may undergo a 15–20 times volume expansion. This
expansion is due to the presence of 2-6% combined water in the crude perlite
rock. Since perlite is a form of amorphous aluminosilicate, it is classified as
chemically inert and has a pH of approximately 7. Perlite has bulk density 0.125
g cm-3,
particle size 0.2-1 mm, porosity 80-90% and BET surface area 2.4 m2 g
-1
[71]. Due to these physicochemical properties perlite has been used mostly in
ceramic material and as adsorbent. Few researches have been done in the field of
perlite supported catalyst synthesis also.
1.6.1 Perlite supported catalysts
Perlite has been converted into catalyst after chemical or physical
modification. ZSM-5 zeolite from expanded perlite as catalyst in FCC gasoline
aromatization [72], perlite granules coated with indium doped TiO2 for gas-phase
photocatalytic decomposition of ethylbenzene [73], immobilization of α-Amylase
on modified mesostructure perlite, prepared by sol gel method [74], Ag coated
bulgarian natural glass perlite via spray pyrolysis for decomposition of ozone
[75], BNi/perlite catalyst for nitro-benzene hydrogenation reaction [76] and
Ag/perlite for ozone decomposition [77] have been reported. TiO2/perlite
composite prepared by flame spray pyrolysis for photocatalytic applications [78]

Chapter 1
23
and nanosized iron oxide coated perlite for arsenate removal [79] have been
reported while the researches regarding perlite supported solid base catalysts
synthesis and its catalytic applications are not reported in the literature.
1.7 Scope of the work
The aim of this work is to study preparation and characterization of
innovative fly ash and perlite supported solid base catalysts and to evaluate their
catalytic applications in liquid phase condensation reactions. Fly ash and perlite
both are siliceous waste materials, non toxic and have external surface which can
be activated during the chemical activation according to the demand of the
reaction. In this study catalysts are prepared by activating with KOH/Al2O3,
Mg(NO3)2, Sr(NO3)2, Ba(NO3)2 and Ca(NO3)2 over mechanically and thermally
activated support materials, characterized by using different analytical techniques
like FTIR spectroscopy, X-ray diffraction, Scanning electron microscopy,
Transmission electron microscopy, Thermo gravimetric analysis and N2
adsorption-desorption etc. The basicity and basic strength of prepared catalysts
were measured by Hammett indicator method. The prepared catalyst serves as
potential solid base catalysts for several condensation reactions, which is
evidented by high yield and conversion. Thus the present research study reports
new solid base catalysts for the replacement of liquid bases in important reactions
and introduces new catalysts for organic synthetic chemistry.This catalytic study
explores the wide application of fly ash and perlite as solid base catalysts in
pharmaceutical, petrochemical and fine chemical industries.
1.8 References
[1] B. Lindström, L.J. Pettersson, Cattech 7 (2003) 130.
[2] M.J. Climent, A. Corma, S. Iborra, A. Velty, J. Mol. Catal. A Chem. 182-
183 (2002) 327.
[3] D. Wu, X. Fu, F. Xiao, J. Li, N. Zhao, W. Wei, Y. Sun, Catal. Commun. 9
(2008) 680.
[4] H. Hattori, Appl. Catal. A Gen. 222 (2001) 247.
[5] H. Hattori, Chem. Rev. 95 (1995) 537.

Chapter 1
24
[6] M.A. Paul, F.A. Long, Chem. Rev. 57 (1957) 1.
[7] G. Zhang, H. Hattori, K. Tanabe, Appl. Catal. 36 (1988) 189.
[8] Y. Okamoto, J. Catal. 112 (1988) 427.
[9] S. Benjapornkulaphong, C. Ngamcharussrivichai, K. Bunyakiat, Chem.
Eng. J. 145 (2009) 468.
[10] A.S. Ndou, N. Plint, N.J. Coville, Appl. Catal. A Gen. 251 (2003) 337.
[11] T.N. Parac-vogt, K. Deleersnyder, K. Binnemans, Eur. J. Org. Chem.
(2005) 1810.
[12] G.S. Devi, D. Giridhar, B.M. Reddy, J. Mol. Catal. A Chem. 181 (2002)
173.
[13] A.A. Refaat, Int. J. Environ. Sci. Technol. 8 (2011) 203.
[14] M.B. Gawande, R.K. Pandey, R. V. Jayaram, Catal. Sci. Technol. 2 (2012)
1113.
[15] J. Tantirungrotechai, P. Chotmongkolsap, M. Pohmakotr, Microporous
Mesoporous Mater. 128 (2010) 41.
[16] W. Thitsartarn, S. Kawi, Green Chem. 13 (2011) 3423.
[17] S. Limmanee, T. Naree, K. Bunyakiat, C. Ngamcharussrivichai, Chem.
Eng. J. 225 (2013) 616.
[18] G. Teng, L. Gao, G. Xiao, H. Liu, J. Lv, Appl. Biochem. Biotechnol. 162
(2010) 1725.
[19] Y. Wang, J. Jehng, Chem. Eng. J. 175 (2011) 548.
[20] B. Wang, S. Li, S. Tian, R. Feng, Y. Meng, Fuel 104 (2013) 698.
[21] D.-W. Lee, Y.-M. Park, K.-Y. Lee, Catal. Surv. from Asia 13 (2009) 63.
[22] M.C.J. Bradford, M. Te, M. V. Konduru, A. Pollack, D.X. Fuentes, Catal.
Today 123 (2007) 23.
[23] C. Murugan, H.C. Bajaj, Indian J. Chem. 52 (2013) 459.
[24] J. Weitkamp, Solid State Ionics 131 (2000) 175.
[25] R. Davis, J. Catal. 216 (2003) 396.
[26] B. Silva, H. Figueiredo, O.S.G.P. Soares, M.F.R. Pereira, J.L. Figueiredo,
a. E. Lewandowska, M. a. Bañares, I.C. Neves, T. Tavares, Appl. Catal. B
Environ. 117-118 (2012) 406.
[27] P.E. Hathway, M.E. Davis, J. Catal. 119 (1989) 497.

Chapter 1
25
[28] K.S. Walton, M.B. Abney, M.D. Levan, Microporous Mesoporous Mater.
91 (2006) 78.
[29] C. Jia, D. Herein, N. Pfander, H.G. Karge, F.C. Jentoft, J. Mol. Catal. A
Chem. 162 (2000) 227.
[30] M. Wallau, U. Schuchardt, J. Brazilian Chem. Soc. 6 (1995) 393.
[31] M. Laspras, H. Cambon, D. Brunel, I. Rodriguez, P. Geneste, Microporous
Mater. 7 (1996) 61.
[32] M. Verziu, M. Florea, S. Simon, V. Simon, P. Filip, V.I. Parvulescu, C.
Hardacre, J. Catal. 263 (2009) 56.
[33] N. Boz, M. Kara, O. Sunal, N. Degirmenbasi, Turkish J. Chem. 33 (2009)
433.
[34] F. Bernhardt, R. Trotzki, T. Szuppa, A. Stolle, B. Ondruschka, Beilstein J.
Org. Chem. 6 (2010) 7.
[35] P. Qiu, B. Yang, C. Yi, S. Qi, Catal. Letters 137 (2010) 232.
[36] H. Kabashima, H. Tsuji, S. Nakata, Y. Tanaka, H. Hattori, Appl. Catal. A
Gen. 194-195 (2000) 227.
[37] L. Čapek, M. Hájek, P. Kutálek, L. Smoláková, Fuel 115 (2014) 443.
[38] S.R. Sarda, W.N. Jadhav, S.R. Bhusare, S.K. Wasmatkar, S.A. Dake, R.P.
Pawar, Int. J. ChemTech Res. 1 (2009) 265.
[39] Y. Ono, T. Baba, Catal. Today 38 (1997) 321.
[40] R. Bal, K. Chaudhari, S. Sivasanker, Catal. Letters 70 (2000) 75.
[41] R. Gupta, M. Gupta, S. Paul, R. Gupta, Bull. Korean Chem. Soc. 30 (2009)
2419.
[42] W. Zhao, Y. Zhang, C. Qu, L. Zhang, J. Wang, Y. Cui, Catal. Letters
(2014).
[43] J.H. Oh, B.S. Ahn, J. Han, S.D. Lee, S.W. Kim, H. Lee, Bull. Korean
Chem. Soc. 29 (2008) 2202.
[44] A. Corma, S. Iborra, Adv. Catal. 49 (2006) 239.
[45] M.G. Stevens, H.C. Foley, Chem. Commun. (1997) 519.
[46] W. Raróg-pilecka, E. Miskiewicz, S. Jodzis, J. Petryk, D. Łomot, Z.
Kaszkur, Z. Karpinski, Z. Kowalczyk, J. Catal. 239 (2006) 313.

Chapter 1
26
[47] W. Raróg-pilecka, E. Miskiewicz, L. Kepinski, Z. Kaszkur, K. Kielar, Z.
Kowalczyk, J. Catal. 249 (2007) 24.
[48] A.M. Frey, J. Yang, C. Feche, N. Essayem, D.R. Stellwagen, F. Figueras,
K.P. de Jong, J.H. Bitter, J. Catal. 305 (2013) 1.
[49] T. Li, L. Sun, L. Gong, X. Liu, X. Liu, J. Mol. Catal. A. Chem. 352 (2012)
38.
[50] H. Ma, S. Li, B. Wang, R. Wang, S. Tian, J. Am. Oil Chem. Soc. 85 (2008)
263.
[51] S.-G. Zhang, S.-F. Yin, Y.-D. Wei, S.-L. Luo, C.-T. Au, Catal. Letters 142
(2012) 608.
[52] T. Wang, G. Wu, N. Guan, L. Li, Microporous Mesoporous Mater. 148
(2012) 184.
[53] J. Tantirungrotechai, P. Thananupappaisal, B. Yoosuk, Catal. Commun. 16
(2011) 25.
[54] X. Chen, M. Arruebo, K.L. Yeung, Catal. Today 204 (2013) 140.
[55] W. Xie, M. Fan, Chem. Eng. J. 239 (2014) 60.
[56] W.-K. Chen, H.-H. Tseng, M.-C. Wei, E.-C. Su, I.-C. Chiu, Int. J.
Hydrogen Energy 39 (2014) 19555.
[57] C. Yuan, Z. Huang, J. Chen, Catal. Commun. 24 (2012) 56.
[58] S. Vijaikumar, K. Pitchumani, Indian Acad. Chem. 49 (2010) 469.
[59] H.J. Alves, A.M. da Rocha, M.R. Monteiro, C. Moretti, M.D. Cabrelon,
C.A. Schwengber, M.C. Milinsk, Appl. Clay Sci. 91-92 (2014) 98.
[60] N. Degirmenbasi, N. Boz, D.M. Kalyon, Appl. Catal. B Environ. 150-151
(2014) 147.
[61] O. Babajide, N. Musyoka, L. Petrik, F. Ameer, Catal. Today 190 (2012) 54.
[62] K.N. Ismail, K. Hussin, M.S. Idris, J. Nucl. Relat. Technol. Vol. 4 (2007)
47.
[63] M. Ahmaruzzaman, Prog. Energy Combust. Sci. 36 (2010) 327.
[64] H.K. Venkatanarayanan, P.R. Rangaraju, Cem. Concr. Compos. 43 (2013)
54.
[65] S. Kumar, R. Kumar, Ceram. Int. 37 (2011) 533.
[66] D. Jain, M. Mishra, A. Rani, Fuel Process. Technol. 95 (2012) 119.

Chapter 1
27
[67] D. Jain, C. Khatri, A. Rani, Fuel 90 (2011) 2083.
[68] D. Jain, C. Khatri, A. Rani, Fuel Process. Technol. 91 (2010) 1015.
[69] D. Jain, A. Rani, Am. Chem. Sci. J. 1 (2011) 37.
[70] D. Jain, R. Hada, A. Rani, J. Catal. 2013 (2013) 1.
[71] D. Bastani, A.A. Safekordi, A. Alihosseini, V. Taghikhani, Sep. Purif.
Technol. 52 (2006) 295.
[72] P. Wang, B. Shen, J. Gao, Catal. Surv. from Asia 125 (2007) 155.
[73] M. Hinojosa-reyes, S. Arriaga, L.A. Diaz-torres, V. Rodríguez-gonzález,
Chem. Eng. J. 224 (2013) 106.
[74] A. Karimi, S.M. Mousavi, B. Ghiasi, J.R. Grace, Am. J. Sci. Res. 32 (2011)
107.
[75] K. Genov, I. Stambolova, M. Shipochka, I. Boevski, S. Vassilev, V.
Blaskov, J. Univ. Chem. Technol. Metall. 46 (2011) 363.
[76] D. Acosta, J. Martinez, C. Carrera, E. Erdmann, E. Gonzo, H. Destéfanis,
Lat. Am. Appl. Res. 36 (2006) 317.
[77] K. Genov, V. Georgiev, T. Batakliev, D.K. Sarker, World Acad. Sci. Eng.
Technol. 80 (2011) 1015.
[78] M. Giannouri, T. Kalampaliki, N. Todorova, T. Giannakopoulou, N.
Boukos, D. Petrakis, T. Vaimakis, C. Trapalis, Int. J. Photoenergy 2013
(2013) 1.
[79] M.G. Mostafa, Y. Chen, J. Jean, C. Liu, Y. Lee, J. Hazard. Mater. 187
(2011) 89.

Chapter 2
Synthesis and Characterization of Solid Base Catalyst from Perlite and Its Catalytic Application in
Cross-Aldol Condensation
Chapter 2
28
Abstract
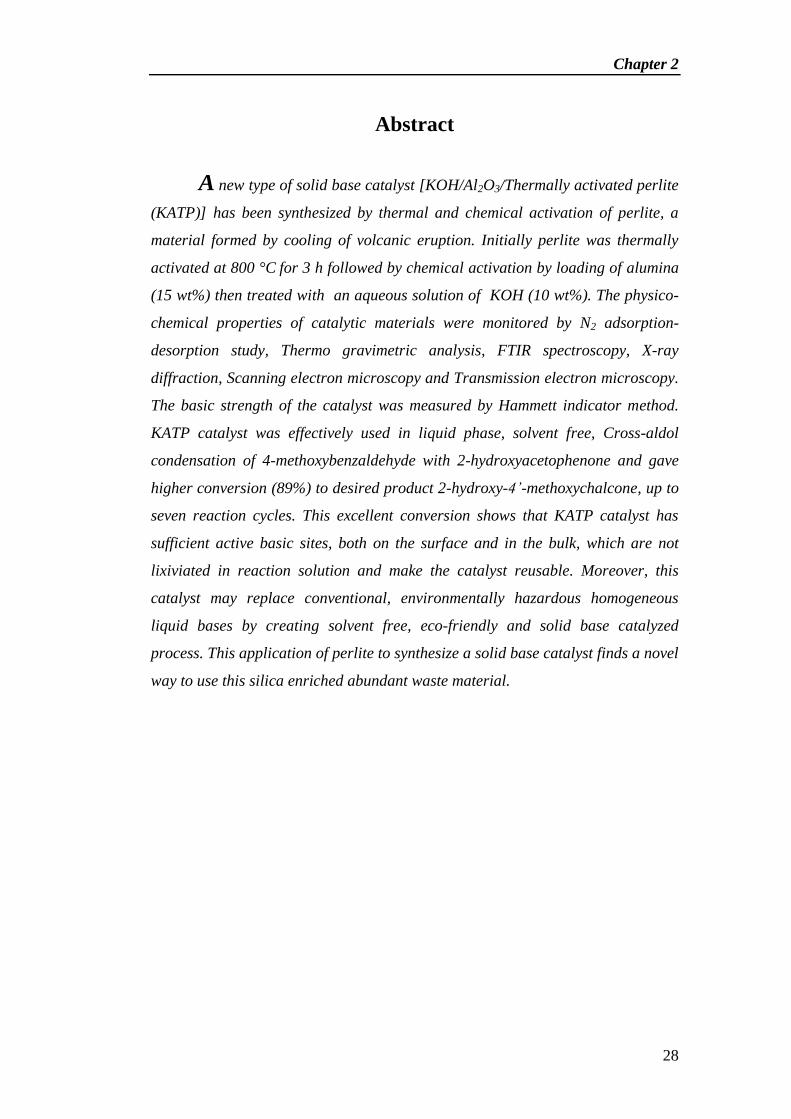
new type of solid base catalyst [KOH/Al2O3/Thermally activated perlite
(KATP)] has been synthesized by thermal and chemical activation of perlite, a
material formed by cooling of volcanic eruption. Initially perlite was thermally
activated at 800 °C for 3 h followed by chemical activation by loading of alumina
(15 wt%) then treated with an aqueous solution of KOH (10 wt%). The physico-
chemical properties of catalytic materials were monitored by N2 adsorption-
desorption study, Thermo gravimetric analysis, FTIR spectroscopy, X-ray
diffraction, Scanning electron microscopy and Transmission electron microscopy.
The basic strength of the catalyst was measured by Hammett indicator method.
KATP catalyst was effectively used in liquid phase, solvent free, Cross-aldol
condensation of 4-methoxybenzaldehyde with 2-hydroxyacetophenone and gave
higher conversion (89%) to desired product 2-hydroxy-4’-methoxychalcone, up to
seven reaction cycles. This excellent conversion shows that KATP catalyst has
sufficient active basic sites, both on the surface and in the bulk, which are not
lixiviated in reaction solution and make the catalyst reusable. Moreover, this
catalyst may replace conventional, environmentally hazardous homogeneous
liquid bases by creating solvent free, eco-friendly and solid base catalyzed
process. This application of perlite to synthesize a solid base catalyst finds a novel
way to use this silica enriched abundant waste material.
A

Chapter 2
29
2.1 Introduction
erlite is a light grey colored glassy volcanic rock with rhyolitic
composition, having numerous concentric cooling cracks which give rise to a
perlitic structure (concentric onion- like partings). Perlite ranges in color from
light gray to almost black and has a waxy to pearly luster. Perlite is formed by
rapid cooling of viscous lava or magma [1]. SiO2, Al2O3, K2O, Na2O are major
constituents of perlite while TiO2, CaO, MgO, Fe2O3 and unburned carbon are
present as minor constituents with 2-5% combined water [2]. Perlite expands in
temperature range of 760–1100 °C up to 15-20 times of volume of the rock, due to
removal of combined water and converts into light weight, white colored and
fluffy material that resembles pumice [1], with approximate bulk density 0.125 g
cm−3, particle size 0.2–1 mm and porosity 80–90% [4]. Huge amount of solid
waste perlite is available in the world, it is reported that approximately 3 million
metric tons of perlite was produced in 15 countries during 2012 [3]. As far as bulk
application of perlite is concerned, due to being inert and non-hazardous material,
it is widely used as fire resistive material, soil conditioner, fillers, extenders in
paints, resins, enamels, rubber, as abrasives and in filtration [1], yet limited
reports are available for utilization of perlite in catalytic applications, perlite is
reported to be used for photocatalysis [4] and ozone decomposition [5] etc.
However, more research is required in testing and model the performance of this
material.
Perlite is an amorphous alumino silicate with high content of silica more
than 70%. Inorganic support materials, including silica gel, alumina, zeolite and
perlite are focused due to their thermal and mechanical stability, no-toxicity and
high resistance against microbial attacks and organic solvents. Lots of inorganic
support materials, however, have too expensive cost because of being synthesized
from organism-silicon compounds, such as recently developed materials MCM-
41, SBA-15, meso-cellular foams. Here the advantage of perlite instead of the
other supports is that, this is naturally occurring siliceous material so inexpensive
than the other supports. So, due to being rich siliceous material, perlite is thought
to be explored as efficient and economical support material for heterogeneous
catalyst synthesis.
P

Chapter 2
30
For organic synthesis, base catalysis is an important area of fundamental
industrial importance in fine chemical, petrochemical and pharmaceutical
industries. Commercially the base catalyzed reactions are largely carried out by
using homogeneous bases like NaOH, Ca(OH)2, KOH etc. [6, 7]. These bases are
harmful, required in more than stoichiometric amount, having high operating cost.
Some serious environmental issues associated with these bases are neutralization,
product separation, purification, corrosion and waste generation which motivate
substantial efforts towards the development of processes mediated by solid base
catalysts.
Solid base catalyst seems to be a promising candidate for replacing a
homogeneous process for solving the above said problems of homogeneous bases
as well as for the suppression of side reactions that include self-condensation and
oligomerization, which results in better selectivity and product yield by
developing desired basic strength as required for the reaction [7]. Solid base
catalysts such as metal oxides viz. CaO, MgO [8], supported catalysts viz
LiOH/Al2O3 [9], Na/SiO2, Cs/MCM-41 [10] and KF/activated carbon [11] are
well reported in the literature for different organic transformations. The main
advantages of heterogeneous catalysts over homogeneous ones include easier
catalyst recovery and recycling resulting in mitigation of the adverse
environmental impacts, such as waste water treatment and elimination of
corrosion problems.
Cross-aldol condensation reaction of aromatic aldehydes with cyclic
ketones is an important synthetic reaction for the preparation of α,β-unsaturated
ketone or chalcone. The compounds with the backbone of chalcones have been
reported to possess various biological activities such as antimicrobial, anti-
inflammatory, analgesic, antiplatelet, antiulcerative, antimalarial, anticancer,
antiviral etc. [12].
We have recently reported fly ash supported base catalysts viz. NaOH/Fly
ash [13], CaO/Fly ash [14], amino propylated/Fly ash [15], MgO/Fly ash [16],
KF/Fly ash [17] applicable for various types of condensation reactions. Perlite
being rich in silica (72-75%) and alumina (12-15%) [18], is thought to be
explored as an efficient siliceous support material to synthesize novel, recyclable,

Chapter 2
31
eco-friendly and cost effective solid base catalyst for Cross-aldol condensation of
2-hydroxyacetophenone and 4-methoxybenzaldehyde. Perlite after suitable
thermal and chemical activation has been converted into an effective solid base
catalyst and reused up to six reaction cycles for synthesis of 2-hydroxy-4’-
methoxychalcone in single step, liquid phase and solvent free reaction conditions
possessing various pharmaceutical applications.
2.2 Experimental
2.2.1 Materials
Perlite was collected from Indica Chemical Industries Pvt. Limited,
Kotdwar (Uttarakhand). KOH (95%), Al(NO3)3.9H2O (98%), NH4CO3 (95%) and
NH4OH (98%) were purchased from Sigma Aldrich and 4-methoxybenzaldehyde
(98%) and 2-hydroxyacetophenone (99%) were purchased from S.D. Fine
Chemical Ltd., India. All the purchased reagents were of analytical grade and used
as such.
2.2.2 Catalyst synthesis
As received perlite (P) was thermally activated at 800 °C for 3 h to form
thermally activated perlite (TP) consequently C, S, moisture and other impurities
also get removed [19]. Several catalytic materials synthesized during the study are
reported below.
a) Al2O3 /Thermally activated perlite (ATP)
An aqueous solution of aluminum nitrate (for 15 wt% alumina loading)
was added into 10 g TP at constant stirring followed by dropwise addition of
aqueous solution of (NH4)2CO3 (0.05 mol) and the pH was maintained close to 8.0
by the addition of appropriate amount of NH4OH. Resultant slurry was aged for 1
h then filtered and washed with double distilled water up to pH 7 to remove
leached compounds, air dried at 110 °C for 24 h and calcined at 700 °C for 3 h in
a muffle furnace under static conditions to form TP supported Alumina material
(ATP). Pure Al2O3 powder was synthesized by adopting the similar process
without involving TP [17].

Chapter 2
32
b) KOH/Al2O3 (KA)
KA was prepared by dropwise addition of an aqueous solution of KOH (10
wt%) into 10 g pure Al2O3 powder at constant stirring. The slurry was aged at 110
°C for 24 h then filtered and washed with double distilled water up to pH 7 to
remove leached compounds, air dried at 110 °C for 24 h and calcined at 400 °C
for 3 h in a muffle furnace under static conditions.
c) KOH/Thermally activated perlite (KTP)
KTP was prepared by dropwise addition of an aqueous solution of KOH
(10 wt%) into 10 g TP at constant stirring. The slurry was aged at 110 °C for 24 h
then filtered and washed with double distilled water up to pH 7 to remove
leached compounds, air dried at 110 °C for 24 h and calcined at 400 °C for 3 h in
a muffle furnace under static conditions.
d) KOH/Al2O3 /Thermally activated perlite (KATP)
KATP was prepared by dropwise addition of an aqueous solution of KOH
(10 wt%) into 10 g ATP, at constant stirring. The slurry was aged at 110 °C for 24
h then filtered and washed with double distilled water up to pH 7 to remove
leached compounds, air dried at 110 °C for 24 h and calcined at 400 °C for 3 h in
a muffle furnace under static conditions (Scheme 2.1).
2.3 Catalyst characterization
P, ATP, KA, KTP and KATP were characterized by N2 adsorption-
desorption study, TGA, FTIR, XRD, SEM and TEM. Instruments detail and
operating conditions during the characterization are given in Annexure I.
2.3.1 Basic strength and basicity measurement
The basic strength of the catalyst was determined by using Hammett
indicators like phenolphthalein (pKa = 8.2), nile blue (pKa = 9.8), 2,4,6-
trinitroaniline (pKa = 12.2), 2,4-dinitroaniline (pKa = 15) and 4-nitroaniline (pKa
= 18.4). 25 mg KATP catalyst was stirred with 1 mL of the solution of Hammett
indicator diluted in methanol and left to equilibrate for 2 h [20].

Chapter 2
33
Scheme 2.1: Synthesis of solid base catalyst KATP.
Thermal activation of perlite (800 °C for 3 h)
Addition of Al (NO)3. 9H2O solution (15 wt%)
Washing with distilled water and drying at 110 °C for 24 h
Dropwise addition of (NH4)2CO3 and NH4OH (up to pH 8)
Calcination at 700 °C for 3 h
Addition of aqueous solution of KOH (10 wt%)
Ageing for 24 h under constant stirring
.
Washing with distilled water and drying at 110 °C for 24 h
Calcination at 400 °C for 3 h
Solid base catalyst KATP

Chapter 2
34
If the indicator exhibits a color change, then the catalyst is labelled as
stronger than the indicator and if not, then the catalyst was said to be weaker than
the indicator.
Basicity of the catalysts was determined by benzoic acid titration method
using phenolphthalein indicator. In benzoic acid titration method, 0.1 g of the
catalyst was suspended in 2 mL of phenolphthalein indictor solution (0.01 mg/mL
toluene). It was then stirred for 0.5 h and titrated against 0.01 M benzoic acid in
toluene solution until the pink colour changed to colourless [20].
2.4 Catalytic activity of KATP catalyst
Catalytic activity of all catalytic materials was tested by Cross-aldol
condensation of 4-methoxybenzaldehyde with 2-hydroxyacetophenone in solvent-
free, single step, liquid phase reaction conditions as shown in Scheme 2.2.
H3CO
H3C
O
HO
O
H3CO
O
HO+
4-methoxybenzaldehyde 2-hydroxyacetophenone 2-hydroxy-4'-methoxychalcone
catalyst
- H2O
Scheme 2.2: Cross-aldol condensation of 4-methoxybenzaldehyde with 2-
hydroxyacetophenone over various catalytic materials.
2.4.1 Cross-aldol condensation
The condensation of 4-methoxybenzaldehyde with 2-
hydroxyacetophenone was performed in a liquid phase batch reactor consisting of
250 mL round bottom flask equipped with digital magnetic stirrer and glass
condenser, immersed in a constant temperature oil bath. A mixture of 4-
methoxybenzaldehyde and 2-hydroxyacetophenone was taken in a round bottom
flask. The desired amount of catalytic material, taken according to
substrate/catalyst weight ratio ranging from 10:1 to 2.5:1, was preheated at
appropriate temperature for 2 h prior to adding in the reaction mixture. The

Chapter 2
35
reaction was carried out at different molar ratio of substrate ranging from 2:1 to
1:3 at different temperatures in the range of 60 to 160 ºC for time ranging from 1
to 8 h. After completion of the reaction, the solid catalyst was filtered and the
product was analyzed by Gas Chromatograph.
The conversion of 4-methoxybenzaldehyde and yield were calculated by using
weight percent method.
Conversion (wt%) = 100 X (Initial wt% - Final wt%) / Initial wt%
Yield % of 2-hydroxy-4'-methoxychalcone obtained
100 X _______________________________________________
g of 2-hydroxy-4'-methoxychalcone obtained experimentlly
g of 2-hydroxy-4'-methoxychalcone obtained theoretically
=
2.5 Catalyst regeneration
After initial use, spent catalyst from the reaction mixture was recovered by
filtration and regenerated for further use. The recovered catalyst was washed
thoroughly with acetone, dried in oven at 110 ºC for 12 h and thermally activated
at 400 ºC for 2 h in static condition before reuse in next reaction cycle under
similar reaction conditions as earlier.
2.6 Results and discussion
2.6.1 Chemical composition of P and KATP catalyst
The Chemical composition of as received perlite (P) and KATP as
determined by SEM-EDX, are given in Table 2.1. The chemical composition of
perlite reveals that major components of perlite are SiO2 and Al2O3. Some minor
components are also present in it. Al and K contents in KATP are increased
considerably up to 6.59% and 3.32% respectively while Si percentage is
decreased slightly. The thermal activation of perlite at 800 °C for 3 h removes C,
S, moisture and other impurities. Loss on ignition (LOI) was determined by
heating a certain weighed quantity of perlite in muffle furnace at 800 °C for 3 h,
LOI was found to be 4.1 wt%.

Chapter 2
36
Table 2.1: Chemical composition of P and KATP.
Elements P (Wt%) KATP (Wt%)
O 73.70 71.56
Si 18.83 16.78
Al 3.72 6.59
K 1.44 3.32
Na 1.61 1.19
Mg 0.21 0.15
Ca 0.19 0.13
Fe 0.10 0.10
Zn 0.13 0.11
Ti 0.07 0.07
2.6.2 Surface area results
Specific surface areas of P and KATP catalyst were calculated to be 2.3
m2/g and 1.5 m
2/g respectively (Table 2.2). A slight decrease in the surface area
of the catalyst is observed after the effective chemical treatment of P with Al2O3
and KOH. Decrement in the surface area is due to the blockage of small pores of
the P [21]. In the present catalytic system the change in the surface area results
into increased surface active catalytic sites (hydroxyl groups), which is accounted
for the high catalytic activity.
Table 2.2: Surface area of P and KATP.
Catalyst Specific surface area
(m2/g)
P 2.3
KATP 1.5

Chapter 2
37
2.6.3 Thermogravimetric analysis
The TGA curve of P, as shown in Figure 2.1, is having weight loss of
4.3% within the temperature range 50-400 ˚C. TGA curve of KATP shows weight
loss of 6.6 % within the temperature range 30-1000 ˚C (Figure 2.1). The weight
loss in P and KATP indicates the removal of moisture content with some volatile
materials. This weight loss would correspond to the removal of moisture content,
burning of carbonaceous materials and volatilization of some trace metal oxides
present in P and KATP [22].
0 200 400 600 800 1000
9.9
10.0
10.1
10.2
10.3
10.4
10.5
10.6
10.7
0 200 400 600 800 1000
9.9
10.0
10.1
10.2
10.3
10.4
KATP
We
igh
t (m
g)
Temperature (oC)
P
Figure 2.1: TGA curves of P and KATP.
2.6.4 FTIR studies
The surface of perlite is covered with hydroxyl groups and physically
adsorbed water. On thermal activation initially the physically adsorbed water is
removed, resulting in the formation of surface siloxane bridges (Si–O–Si), which
on chemical activation with KOH results in increased surface silanols thus
basicity. Each FTIR spectrum (Figure 2.2) shows a broad band between 3600-

Chapter 2
38
3200 cm-1
, which is attributed to surface –OH groups of –Si–OH on the silica
surface [16]. The broadness of band indicates the presence of strong hydrogen
bonding [23]. Intensity and broadness reduce in case of TP (Figure 2.2b)
confirms loss of water from perlite during thermal activation which again
increases in case of ATP (Figure 2.2c), may be due to the presence of surface –
Al–OH. Loaded Al2O3 in ATP facilitates and provides suitable active sites for
further activation by KOH, thus hydroxyl groups increases in case of KATP
catalyst (Figure 2.2d), which is also evidenced by a broad, intense band at 3600-
3200 cm-1
. Each spectrum (Figure 2.2, 2.3, Table 2.3) shows a peak around 1630
cm-1
attributed to bending mode (δO–H) of water molecules [24].
Perlite mainly comprises of amorphous silica, which is normally assumed
to be formed by a continuous network of Q4 units [Si(SiO4)4], gives broadband in
the range of 1100-1040 cm-1
due to Si–O–Si asymmetric stretching vibration
modes (Figure 2.2a) [14]. The increased –OH species in case of ATP and KATP
in the form of –Si–OH and –Si–O–Al–OH groups (Figure 2.2c, 2.2d), shift the
position of Si–O–Si band towards lower wave number indicating the
transformation of amorphous silica Q4 units [Si(SiO4)4] to Q
3 units
[Si(OH)(SiO4)3] [25]. The band appears at 794 cm-1
in TP due to symmetric Si–
O–Si stretching vibration [13] is shifted towards lower wave number in ATP
(Figure 2.2c) and KATP (Figure 2.2d) at 789 and 785 cm-1
(Table 2.3)
respectively, which also could be an evidence for increased –OH groups on
surface due to Al2O3 loading and surface activation by KOH. Al2O3 loading in
ATP is also confirmed by Si–O–Al stretching peak, appearing at 602 cm-1
[26].
Few K+ ions could replace the protons of the surface hydroxyl groups present on
fully hydroxylated alumina which is also proved by the peak around 1400 cm-1
conferring the presence of Al–O–K bond in KATP (Figure 2.2d) [21].
Band due to –OH stretching vibration appearing between 3600-3200
cm-1
is least broad in case of KTP (Figure 2.3a) representing lesser number of
surface silanol groups on KTP surface. This band is broader and sharper in case of
KATP (Figure 2.3b) due to the presence of –Si–O–Al–OH species and hydrogen
bonding among hydroxyl groups while KA (Figure 2.3c) also shows broad band
in this region reflecting the abundance of strong hydrogen bonding in hydroxyl

Chapter 2
39
groups. KA and KATP both show peaks centered at 1400 cm-1
indicating the
presence of Al–O–K species [21].
Table 2.3: The observed transmission frequencies (cm-1
) of Fourier
transform infrared spectra of P, TP, ATP, KA, KTP, KATP
and reused KATP and their assignments.
Peak
Assignments P TP ATP KA KTP KATP
Reused
KATP Ref.
Si-O-Al
stretching
vibration
597 572 602 _ _ 612 590 26
Si-O-Si symm.
stretching
vibration
797 794 789 _ 794 785 789 13
Si-O-Si
asymm.
stretching
vibration
1054 1059 1044 _ 1042 1056 1052 14
Al-O-K
stretching
vibration
_ _ _ 1400 _ 1400 _ 21
H-O-H
bending
vibration
1626 1630 1631 1634 1634 1636 1632 24
-O-H
stretching
vibration
3632 3598 3630 3482 3601 3469 3452 16

Chapter 2
40
Figure 2.2: FTIR spectra of (a) P, (b) TP, (c) ATP and (d) KATP.
Figure 2.3: FTIR spectra of (a) KTP, (b) KATP and (c) KA. D:\FTIR DATA\smj\KOH- Al2O3_KBr.0 KOH- Al2O3_KBr DRS
D:\FTIR DATA\smj\KOH-VA- cal 400-3hKBr.0 KOH-VA- cal 400-3hKBr DRS
D:\FTIR DATA\smj\KOHALNP1 400-3h-KBr.0 KOHALNP1 400-3h-KBr DRS
21/01/2012
11/04/2012
24/01/2012
36
01.1
3
34
82.6
334
69.5
9
29
27.8
7
23
54.5
7
21
02.4
5
18
49.4
418
18.1
5
16
36.2
916
34.7
816
34.5
2
14
01.3
014
00.2
6
12
20.1
8
10
93.1
810
56.2
510
42.9
5
87
0.6
9
79
4.1
478
5.7
0
61
2.9
759
1.6
457
2.9
0
100015002000250030003500
Wavenumber cm-1
20
40
60
80
10
0
Tra
nsm
itta
nce
[%
]
Page 1/1
(a)
(b)
(c)
3482 1042
794
785
1634
1056
1400
1634
1636
1400
3601
3469
D:\FTIR DATA\smj\VA 800-3h calc_KBr.0 VA 800-3h calc_KBr DRS
D:\FTIR DATA\smj\KOHALNP1 400-3h-KBr.0 KOHALNP1 400-3h-KBr DRS
D:\FTIR DATA\smj\Raw VA KBr.0 Raw VA KBr DRS
D:\FTIR DATA\New Folder\BS\SUTHTIC\PPTS-KBR CAL [C].0 PPTS-KBR CAL DRS
21/01/2012
24/01/2012
03/10/2012
01/05/2013
37
73.3
7
36
32.7
536
30.4
535
98.5
1
34
69.5
9
23
22.4
0
18
50.7
718
39.0
818
39.0
818
18.1
5
16
36.2
916
32.5
116
30.3
416
26.3
1
14
00.2
6
10
81.9
010
59.6
510
56.2
510
54.8
479
7.9
279
7.8
979
4.4
878
5.7
063
4.8
661
2.9
759
7.6
859
6.1
458
4.8
057
2.9
057
2.7
257
2.2
5
100015002000250030003500
Wavenumber cm-1
20
40
60
80
10
0
Tra
nsm
itta
nce
[%
]
Page 1/1
3469
3630
363
2
3598 1630
1400
1636
1056
1054
785
789
(a) (b
)
(c)
(d)

Chapter 2
41
2.6.5 X-ray diffraction studies
XRD analysis was carried out to study the effect of different activation
procedures on perlite. The XRD pattern of perlite shows its amorphous nature
(Figure 2.4a) while after thermal activation, a small peak is observed at 2θ =
26.7o (Figure 2.4b) due to formation of quartz crystalline phase [13]. Figure
2.5b shows that alumina loaded on perlite surface is amorphous in nature [27]
resulting in disappearance of small crystalline peak visible in Figure 2.5a. On
treatment with KOH, phase of potassium aluminum silicate (KAlSiO4) is
observed at 2θ = 28.6o (Figure 2.5c) in KATP (PDF-180987) [28].
2.6.6 SEM analysis results
The SEM micrographs of P and TP show particles of different irregular
shapes and sizes, where as the SEM micrograph of KATP (Figure 2.6) shows
agglomerated particles with some loaded potassium aluminum species on perlite
surface. In KATP increased amount of Al and K confirms the successful loading
of alumina and KOH in the above mentioned forms on P surface.
2.6.7 TEM analysis results
The small dark spherical spots in the TEM image (Figure 2.7b) of each
particle of the catalyst are proposed as nano crystalline potassium aluminosilicate
(KAlSiO4) phase referred as a super basicity center of the catalyst which is absent
in P (Figure 2.7a).
2.6.8 Basic strength and basicity measurement
Basic strength and basicity of KATP catalyst were determined by the
Hammett indicator method using phenolphthalein - benzoic acid titration. KATP
shows basic strength 15>H_>9.8 and basicity 1.07 mmol/g which shows quite
resemblance with reported literature [29].
Inte
nsi
ty

Chapter 2
42
Figure 2.4: X ray diffraction patterns of (a) P and (b) TP.
Figure 2.5: X-ray diffraction pattern of (a) TP, (b) ATP and (c) KATP.
26.7
28.6
(a.u
.)
26.7
Inte
nsi
ty c
ounts
(a.
u.)
2 Theta (in degree)

Chapter 2
43
Figure 2.6: SEM micrographs of (a-b) P, (c-d) TP and (e-f) KATP.
a
f e
d c
b
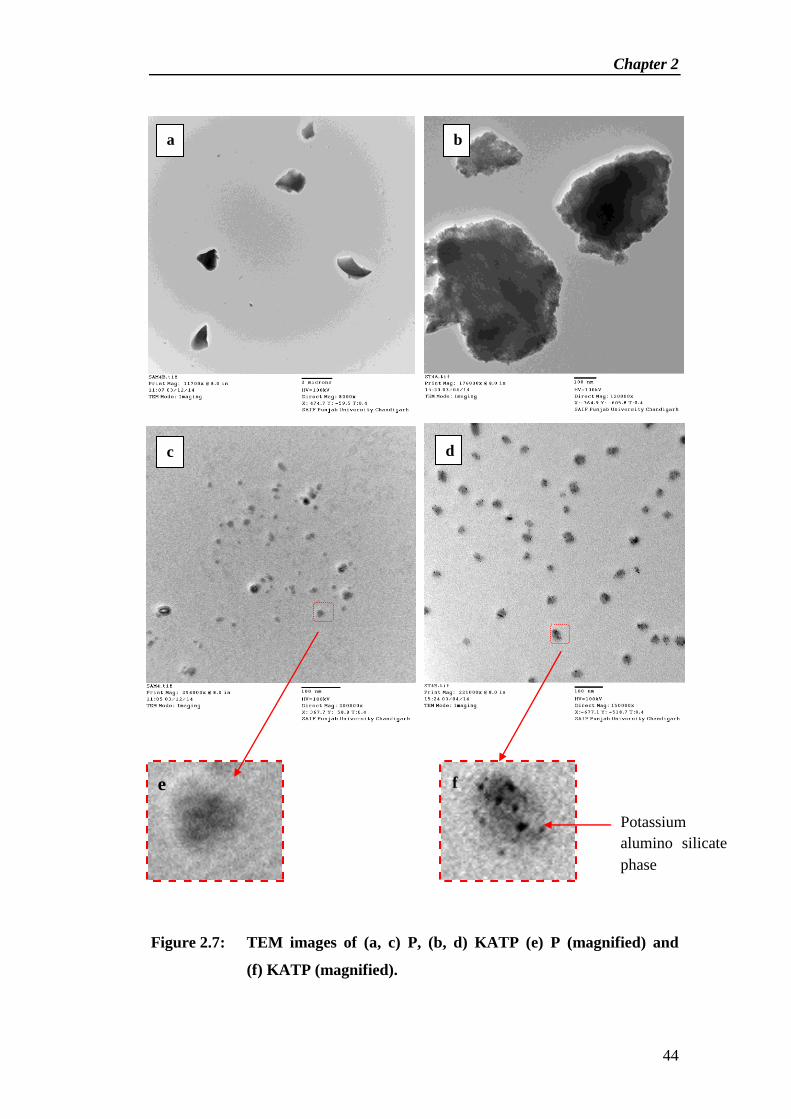
Chapter 2
44
Figure 2.7: TEM images of (a, c) P, (b, d) KATP (e) P (magnified) and
(f) KATP (magnified).
a b
c d
Potassium
alumino silicate
phase
e f

Chapter 2
45
2.7 Catalytic activity
A comparison of catalytic activity of different catalytic materials has been
made, which were synthesized at various stages of KATP synthesis. For this
purpose the condensation of 4-methoxybenzaldehyde and 2-hydroxyacetophenone
with different catalytic materials like TP, ATP, Pure Al2O3, KA, KTP and KATP
was carried out at 110 °C for 2 h, taking 4-methoxybenzaldehyde\2-
hydroxyacetophenone molar ratio 1:1 and 4-methoxybenzaldehyde to catalyst
weight ratio of 5:1. As indicated in Table 2.4, KATP has given highest
conversion in given reaction conditions and selected as catalyst for optimization
of reaction parameters for highest conversion.
Table 2.4: Catalytic activities of different catalysts for Cross-aldol
condensation reaction.
Catalyst
Conversion % of
4-methoxy
benzaldehyde
Yield % of
2-hydroxy-4’-
methoxychalconede
TP Nil Nil
ATP Nil Nil
Pure Al2O3 Nil Nil
KA 50 44
KTP 35 30
KATP 63 57
Reaction conditions: Temperature 110 °C, Time 2 h, 4-methoxybenzaldehyde/2-
hydroxyacetophenone molar ratio 1:1, substrate/catalyst weight ratio 5:1.
2.7.1 Effect of reaction time
In order to check the effect of reaction time, the reaction was carried out at
110 °C for different times ranging from 1 to 8 h taking 4-methoxybenzaldehyde\2-
hydroxyacetophenone in 1:1 molar ratio and 4-methoxybenzaldehyde to catalyst
weight ratio of 5:1. Conversion was observed to increase maximum up to 89%
with increasing reaction time up to 4 h. On further increasing the reaction time,
conversion remained constant as shown in Figure 2.8. From the above results, the

Chapter 2
46
optimum reaction time was found to be 4 h for highly selective synthesis of 2-
hydroxy-4’-methoxychalcone over KATP.
Figure 2.8: Variation of conversion (%) of 4-methoxybenzaldehyde with
time.
Reaction conditions: Temperature 110 °C, Time 1 – 8 h, substrate/catalyst weight
ratio 5:1, 4-methoxybenzaldehyde\2-hydroxyacetophenone molar ratio 1:1.
2.7.2 Effect of substrate/catalyst weight ratio
The effect of substrate to catalyst weight ratio on conversion of 4-
methoxybenzaldehyde was studied by varying the amount of KATP under
optimized reaction conditions. As indicated from Table 2.5, at lower catalyst
amount, i.e. 4-methoxybenzaldehyde/KATP weight ratio 10:1, only 65%
conversion of 4-methoxybenzaldehyde was observed. On increasing 4-
methoxybenzaldehyde/KATP weight ratio to 5:1, conversion of 4-
methoxybenzaldehyde increased up to 89%. The increase in the conversion with
increase in the catalyst weight can be attributed to an increase in the availability of
number of catalytic active sites required for this reaction. On further increasing
the amount of catalyst no change in conversion is observed.
2.7.3 Effect of reaction temperature
Optimization of reaction temperature to give maximum conversion of 4-
methoxybenzaldehyde was studied at temperature ranging from 60 to 160 °C for 4
h taking 4-methoxybenzaldehyde/2-hydroxyacetophenone in molar ratio 1:1 and
4-methoxybenzaldehyde to catalyst weight ratio of 5:1. Conversion was observed
0
20
40
60
80
100
0 2 4 6 8 10
Co
nv
ers
ion
(%
)
Time (h)

Chapter 2
47
to increase on increasing reaction temperature ranging from 60 to 110 °C as
revealed from Figure 2.9. The results show that the maximum conversion (89%)
of 4-methoxybenzaldehyde to 2-hydroxy-4’-methoxychalcone was found at 110
°C, after which conversion remained almost steady till 160 °C.
Table 2.5: Effect of substrate/catalyst weight ratio on conversion (%) of 4-
methoxybenzaldehyde to 2-hydroxy-4’-methoxychalcone over
KATP.
4-methoxybenzaldehyde/KATP
Weight ratio
Conversion % of
4-methoxybenzaldehyde
10:1
5:1
2.5:1
65
89
89
Reaction conditions: Temperature 110 °C, Time 4 h, 4-methoxybenzaldehyde/2-
hydroxyacetophenone molar ratio 1:1.
Figure 2.9: Variation of conversion (%) of 4-methoxybenzaldehyde with
temperature.
Reaction conditions: Temperature 60 – 160 °C, Time 4 h, substrate/catalyst
weight ratio 5:1, 4-methoxybenzaldehyde\2-hydroxyacetophenone molar ratio
1:1.
0
20
40
60
80
100
0 50 100 150 200
Co
nv
ers
ion
(%)
Temperature °C

Chapter 2
48
2.7.4 Effect of reactant molar ratio
The synthesis of 2-hydroxy-4’-methoxychalcone was carried out at 110 °C
with various molar ratios of reactants for 4 h over KATP catalyst. As indicated by
Table 2.6, 78% conversion of 4-methoxybenzaldehyde was observed at 2:1 molar
ratio of 4-methoxybenzaldehyde to 2-hydroxyacetophenone. This may be due to
an insufficient quantity of the reactants to react with each other. There was an
increase in conversion up to 89% at 1:1 molar ratio of 4-methoxybenzaldehyde to
2-hydroxyacetophenone at the same reaction conditions. This may be due to
equilibrating of each reactant quantity on the basic sites on the surface of the
KATP catalyst. The conversion decreased from 80% to 77% on further increasing
the molar ratio from 1:2 to 1:3.
Table 2.6: Effect of molar ratio of 4-methoxybenzaldehyde/2-
hydroxyacetophenone on conversion (%) of 4-
methoxybenzaldehyde to 2-hydroxy-4’-methoxychalcone over
KATP.
Reaction conditions: Temperature 110 °C, Time 4 h, substrate/catalyst weight
ratio 5:1.
2.8 Reaction mechanism
The plausible structure for active basic sites of the KATP catalyst is shown
in Scheme 2.3. The reaction mechanism over KATP catalyst shows (Scheme 2.4)
that the surface basic sites of the KATP catalyst initiate the reaction by abstracting
the proton from 2-hydroxyacetopheneone resulting in the formation of carbanion.
Molar ratio Conversion % of
4-methoxybenzaldehyde
2:1 78
1:1 89
1:2 80
1:3 77

Chapter 2
49
This generated carbanion attacks on the C atom of the carbonyl group of 4-
methoxybenzaldehyde and forms condensation product 2-hydroxy-4’-
methoxychalcone with water removal by the nucleophilic addition reaction.
O
Si
O
Si
O
Si
O
OH
OH
1. Al(NO)3.9H2O Solution
2. KOH
Calcine at 400 oC for 3 h
Thermally activated perlite (TP) surface
KATP catalyst surface
O OH
O
O
O
Si
O
Si
O
Si
O
O
O
O O
O
O
Al
Al
Al
OH
OH
OH
OH
O
O
K
K
-
+
+
-
Scheme 2.3: The schematic presentation of chemical activation of perlite
with Al(NO3)2.9H2O and KOH solutions and proposed
structure of KATP.

Chapter 2
50
O
O Al
Al
O
OH
OH
OH
Bronsted basic sites- H2O
2-hydroxyacetophenone
KATP catalyst surface
________________
+
C
OCH3
OH
4-methoxybenzaldehyde
- H2O
O
HO
2-hydroxy-4'-methoxychalcone
K
CH3O
O
HO
H2C
O
HO
H2CH
O Al
O
OH
K
Super basic site
Scheme 2.4: Proposed mechanism for Cross-aldol condensation of 2-
hydroxyacetophenone and 4-methoxybenzaldehyde over
KATP.

Chapter 2
51
2.9 Catalyst regeneration
The KATP catalyst was recovered from the reaction mixture by simple
filtration, washed thoroughly with acetone, dried in oven at 110 °C for 12 h
followed by thermal activation at 400 °C for 2 h under static conditions. The
regenerated catalyst was used for the next reaction cycle under similar reaction
conditions to first reaction cycle. The FTIR spectrum of reused KATP catalyst
after seven reaction cycles (Figure 2.10b) resembles that of fresh KATP catalyst
(Figure 2.10a) indicating the stability of surface hydroxyl groups responsible for
Bronsted basic catalytic activity. Due to the stability of these basic sites KATP
catalyst was found efficient up to seven reaction cycles, giving conversion in the
range of 89–75% as shown from Table 2.7. The significant decrease in
conversion after seven reaction cycles is due to the deposition of carbonaceous
material on the external surface of the reused catalyst which may block the active
basic sites present on the catalyst surface.
Table 2.7: Cross-aldol condensation of 2-hydroxyacetophenone and 4-
methoxybenzaldehyde over fresh and regenerated KATP.
Reaction cycle Conversion % of
4-methoxybenzaldehyde
Yield % of 2-hydroxy-4’-
methoxychalcone
I 89 80
II 81 75
III 81 75
IV 80 72
V 78 70
VI 76 66
VII 75 64
Reaction conditions: Temperature 110 °C, Time 4 h, 4-methoxybenzaldehyde /2-
hydroxyacetophenone ratio 1:1, substrate/catalyst weight ratio 5:1.

Chapter 2
52
Figure 2.10: FTIR spectra of (a) KATP and (b) reused KATP.
(a)
(b)
D:\FTIR DATA\smj\KOHALNP1 400-3h-KBr.0 KOHALNP1 400-3h-KBr DRS
D:\FTIR DATA\smj\KOHAlNP400-3h reused aft 3 cycle-KBr.0 KOHAlNP reused aft 3 cycle-KBr DRS
24/01/2012
13/04/2012
34
69.5
934
52.1
8
18
64.2
918
18.1
5
16
36.2
916
32.4
2
14
00.2
6
10
56.2
510
52.8
2
78
9.0
078
5.7
0
61
2.9
759
0.7
357
2.9
0
100015002000250030003500
Wavenumber cm-1
20
40
60
80
10
0
Tra
nsm
itta
nce
[%
]
Page 1/1
\\\\
3452 1632
3469
1400
1636
1052
1056 785

Chapter 2
53
2.10 Conclusion
This study provides a new solid support perlite which is least explored in
catalytic applications. An effective solid base catalyst has been prepared through
thermal and chemical activation. The perlite based catalyst KATP serves as a
potential solid base catalyst for Cross-aldol condensation reaction as evidented
from higher conversion of 4-methoxybenzaldehyde (89%). KATP catalyst
possesses higher basicity due to increase in Bronsted basic sites, i.e. Si/Al–OH
content. The reaction was carried out in solvent free conditions and the catalyst
can be easily separated by simple filtration, regenerated and reused up to several
times with almost equal efficiency, thus produces no waste and makes the process
economic. It is thus confirmed that under experimental conditions, the leaching of
active basic sites or deactivation of the catalyst is almost negligible. This
investigation brings into light the structural aspects of a novel perlite supported
solid base catalyst which is cost effective, eco-friendly and recyclable and can be
used in solvent free organic transformations.
2.11 References
[1] M. Alkan, M. Karadas, M. Dogan, O. Demirbaş, Colloids Surfaces A
Physicochem. Eng. Asp. 259 (2005) 155.
[2] D. Bastani, A.A. Safekordi, A. Alihosseini, V. Taghikhani, Sep. Purif.
Technol. 52 (2006) 295.
[3] W.P. Bolen, U.S. Geol. Surv. U.S., Oct. (2013) 55.1.
[4] M. Giannouri, T. Kalampaliki, N. Todorova, T. Giannakopoulou, N.
Boukos, D. Petrakis, T. Vaimakis, C. Trapalis, Int. J. Photoenergy 2013
(2013) 1.
[5] K. Genov, I. Stambolova, M. Shipochka, I. Boevski, S. Vassilev, V.
Blaskov, J. Univ. Chem. Technol. Metall. 46 (2011) 363.
[6] A. Corma, S. Hamid, S. Iborra, A. Velty, J. Catal. 234 (2005) 340.
[7] S. Abello, D. Vijaya-Shankar, J. Perez-Ramirez, Appl. Catal. A Gen. 342
(2008) 119.
[8] H. Kabashima, H. Tsuji, T. Shibuya, H. Hattori, J. Mol. Catal. A Chem.
155 (2000) 23.

Chapter 2
54
[9] Y. Fu, T. Baba, Y. Ono, Appl. Catal. A Gen. 166 (1998) 425.
[10] R. Bal, K. Chaudhari, S. Sivasanker, Catal. Letters 70 (2000) 75.
[11] B.H. Hameed, C.S. Goh, L.H. Chin, Fuel Process. Technol. 90 (2009)
1532.
[12] Y.R. Prasad, A.L. Rao, R. Rambabu, E-Journal Chem. 5 (2008) 461.
[13] D. Jain, C. Khatri, A. Rani, Fuel 90 (2011) 2083.
[14] D. Jain, C. Khatri, A. Rani, Fuel Process. Technol. 91 (2010) 1015.
[15] D. Jain, M. Mishra, A. Rani, Fuel Process. Technol. 95 (2012) 119.
[16] D. Jain, A. Rani, Am. Chem. Sci. J. 1 (2011) 37.
[17] D. Jain, R. Hada, A. Rani, J. Catal. 2013 (2013) 1.
[18] L. Meesuk, S. Seammai, Sci. Asia 36 (2010) 33.
[19] K. Kordatos, S. Gavela, A. Ntziouni, K.N. Pistiolas, A. Kyritsi, V.K.
Rigopoulou, Microporous Mesoporous Mater. 115 (2008) 189.
[20] R. Rahul, J.K. Satyarthi, D. Srinivas, Indian J. Chem. 50 (2011) 1017.
[21] H. Ma, S. Li, B. Wang, R. Wang, S. Tian, J. Am. Oil Chem. Soc. 85 (2008)
263.
[22] M.M.A. Sekkina, R.M. Issa, A.E.-D.M. Bastawisy, W.A. El Helece, Int. J.
Chem. 2 (2010) 81.
[23] C. Khatri, A. Rani, Fuel 87 (2008) 2886.
[24] S. Kabra, S. Katara, A. Rani, Int. J. Innov. Res. Sci. Eng. Technol. 2 (2013)
4319.
[25] M.E. Simonsen, C. Sonderby, Z. Li, E.G. Sogaard, J. Mater. Sci. 44 (2009)
2079.
[26] M.E.G. Frances I. Hurwitz, Denisse V. Aranda, in:, Am. Chem. Soc. 236th
Natl. Meet. Philadelphia, PA, August 20, 2008, 2008.
[27] J. Temuujin, K. Okada, K.J.. MacKenzie, Appl. Clay Sci. 21 (2002) 125.
[28] J. V. Smith, O.F. Tuttle, Am. J. Sci. 255 (1957) 282.
[29] O. Ilgen, A.N. Akin, Turkish J. Chem. 33 (2009) 281.

Chapter 3
Magnesium Nitrate Activated Perlite as Solid Base Catalyst for Microwave Assisted Nitroaldol
Condensation Reaction

Chapter 3
55
Abstract
he synthesis of highly active perlite supported solid base catalyst (MTP)
has been carried, with the aim of being used as heterogeneous catalyst in
nitroaldol condensation reaction. The MTP catalyst was characterized for
determining structural, textural and morphological properties using some
analytical techniques viz. N2 adsorption-desorption study, Thermogravimetric
analysis, FTIR spectroscopy, X-ray diffraction analysis, Scanning electron
microscopy, Energy dispersive X-ray analysis and Transmission electron
microscopy. The basic strength of the catalyst was measured by Hammett
indicator method. The catalytic activity of MTP was tested by microwave
irradiated, liquid phase, single step and solvent free nitroaldol condensation of
nitroethane with propionaldehyde, giving higher conversion (95%) and selectivity
(97%) to desired product 1-nitro-3-pentanol. Nitroaldol condensation products
‘nitroalcohols’ can be converted to pharmacologically important chemicals such
as choloramphenicol and ephedrine antibiotics. The nitroaldol condensation
reaction was further carried out by taking nitroethane or nitromethane with
number of carbonyl compounds. The MTP catalyst can be regenerated and reused
up to 3 reaction cycles with almost equal efficiency. The conversion results show
that the catalyst possesses sufficient stable active basic sites responsible for the
catalytic activity. The work reports an innovative use of solid waste perlite as an
effective solid base catalyst.
T

Chapter 3
56
3.1 Introduction
ase catalyzed condensation and addition reactions are some of the
important reaction steps employed for making large and complex molecules that
characterize many of the fine chemicals and pharmaceutical products. Other
reactions such as trans-esterification and isomerisation have applications, mainly
in food and cosmetic industries [1].
The nitroaldol or Henry reaction is easily recognizable as one of the
classical name reactions in organic synthesis. It is a coupling reaction between a
carbonyl compound and an alkylnitro compound bearing a hydrogen atom. The
overall transformation enables the formation of a carbon-carbon bond with the
concomitant generation of a new difunctional group, namely the nitroalcohol [2].
The reaction involves the C–C bond formation, which is important in organic
synthesis. The products, nitroalcohols, can be converted by hydrogenation to β-
aminoalcohols, which are then converted to pharmacologically important
chemicals such as choloramphenicol and ephedrine antibiotics [3]. Generally the
nitroaldol reaction has been carried out in the presence of the Mg–Al hydrotalcite,
diamino-functionalised MCM-41 [4], KOH, NH4OAc [2], KF/alumina, MgO,
Mg(OH)2, MgCO3, CaO, CaCO3, SrO, SrCO3, BaCO3, BaO, KOH/alumina [3],
DABCO, Et3N etc.[5].
Catalysts are majorly characterized as homogeneous and heterogeneous
catalysts. Homogeneous bases such as alkali metal oxide, alkaline earth metal
oxides, hydroxides and liquid bases are majorly used as homogeneous catalysts in
organic reactions including isomerization [6], C–C bond formation, addition ,
cyclization, oxidation and condensation [7]. These bases are unsafe, required in
more than stoichiometric amount, have high operating cost and some serious
environmental issues attached with base neutralization, product separation and
purification, corrosion and waste generation, thus motivate the considerable
efforts towards the development of processes mediated by heterogeneous base
catalysts. Replacing the homogeneous bases with heterogeneous base catalysts
can lead to harmless and cleaner productions. Side reactions that include self-
condensation and polymerization are suppressed by using heterogeneous catalyst
resulting in better selectivity and product yield [8]. The use of heterogeneous base
B

Chapter 3
57
catalyst keeps away the complex neutralization and separation steps, needed to
recover the homogeneous base catalysts from the reaction mixture [9]. The
recovered solid catalysts can be easily regenerated and reused in further reaction
cycles.
Microwave irradiation has got recognition in the past decade as a powerful
tool for rapid and efficient synthesis of a variety of compounds because of
selective absorption of microwave energy by polar molecules [10]. Microwave
radiation utilizes wavelengths of 0.001 – 1 m and frequencies of 0.3 – 300 GHz
[11].
Microwave-enhanced chemistry is based on the efficient heating of
materials by “microwave dielectric heating” effects. This phenomenon is
dependent on the ability of a specific material (solvent or reagent) to absorb
microwave energy and convert it into heat. The electric component of an
electromagnetic field causes heating by two main mechanisms: dipolar
polarization and ionic conduction [12]. The main advantages of non conventional
‘Microwave heating’ over the conventional heating include highly accelerated rate
of the reaction, reduction in reaction time with an improvement in the yield and
quality of the product, superheating (temperature more than boiling point) and
high heating rate. Microwave irradiations abide by the green chemistry principles,
which states that a reaction should be environmentally friendly, conducted under
solvent free conditions, having minimal or no by-products formations with
maintaining the atom economy [13].
The present work elaborates the synthesis of magnesium nitrate activated
perlite catalyst to have high basicity and catalytic activity for nitroaldol
condensation reaction. As one of the main constituent of perlite is silica (72%),
possesses insufficient catalytic activity, which is enhanced by treatment with
Mg(NO3)2 loading and consequently generation of forsterite and enstatite phases
of MgO-SiO2 with high basicity and catalytic activity [14]. Chemical activation
was performed on thermally activated perlite by precipitation method. Nitroaldol
condensation between carbonyl compound and a nitroalkane compound to get
nitroalcohols were taken as a test reaction for testing the catalytic activity of
Mg(NO3)2 activated perlite catalyst under microwave atmosphere.

Chapter 3
58
3.2 Experimental
3.2.1 Materials
Perlite was collected from Indica Chemical Industries Pvt. Limited,
Kotdwar (Uttarakhand). Mg(NO3)2.6H2O (98%), NaOH (98%), Na2CO3 (99%)
were purchased from Sigma Aldrich and nitroethane (98%), nitromethane (98%)
and various carbonyl compounds were purchased from S.D. Fine Chemical Ltd.,
India. All reagents used, were of analytical grade and were used without any
further purification.
3.2.2 Catalyst synthesis
As received perlite (P) was thermally activated at 800 °C for 3 h to form
thermally activated perlite (TP) consequently C, S, moisture and other impurities
also get removed [15].
Solid base catalyst Mg(NO3)2.6H2O activated TP (MTP) was prepared by
dropwise addition of an aqueous solution of Mg(NO3)2.6H2O (15 wt%) into TP, at
constant stirring. The resulted slurry was aged at 80 °C temperature for 1 h
followed by drop wise addition of a mixed solution of NaOH (3M) and Na2CO3
(2M) (in 1:1 ratio) up to pH 8, resulted slurry was again aged for 24 h then
washed with double distilled water, dried at 110 °C for 24 h and then calcined at
450 °C for 4 h at controlled heating rate under inert conditions to form MTP solid
base catalyst. Pure MgO was synthesized by adopting similar synthetic procedure
without involving TP (Scheme 3.1).

Chapter 3
59
Scheme 3.1: Synthesis of solid base catalyst MTP.
Thermal activation of perlite (800 °C for 3 h)
Addition of Mg(NO3)2.6H2O solution (15 wt%)
Dropwise addition of NaOH (3M) and Na2CO3 (2M) up to pH 8
Constant stirring at 80 °C for 1 h
Ageing for 24h under constant stirring
Washing with distilled water and drying at 110 °C for 24 h
Calcination at 450 °C for 4 h
Solid base catalyst MTP
Chapter 3
60
3.3 Catalyst characterization
P, TP and synthesized catalyst MTP were characterized by N2 adsorption-
desorption study, TGA, FTIR, XRD, SEM and TEM. Instruments detail and
operating conditions during characterization are given in Annexure I. Basic
strength of the MTP catalyst was determined using Hammett indicators like
phenolphthalein (pKa = 8.2), nile blue (pKa = 9.8), 2,4,6-trinitroaniline (pKa =
12.2), 2,4-dinitroaniline (pKa = 15) and 4-nitroaniline (pKa = 18.4). Basicity was
measured by benzoic acid titration method using phenolphthalein indicator [16].
The methods for evaluating basic strength and basicity are given in detail in
Chapter 2.
3.4 Experimental setup
The microwave reaction was carried out in CEM Focused Microwave™
Synthesis System, Model Discover (Figure 3.1). The system is designed to
enhance the ability to perform chemical reactions under controlled conditions on a
laboratory scale. The System facilitates either homogeneous or heterogeneous
solution phase chemistry, solid phase chemistry or chemistry conducted on solid
supports. It accommodates vessels ranging in volume from 5 mL to 125 mL for
reactions performed under atmospheric conditions and a 10 mL vessel with septa
for reactions performed at elevated temperatures and pressures. Primary uses of
the Discover are in the discovery and optimization phases of the new product
development process. The Discover system consists of microwave power delivery
system with operator selectable power output from 0 - 300 watts, operational
temperature range from 25 - 250 °C and operational pressure range from 0 – 300
psi (0 – 21 bar).
Microwave energy is applied to the vessel contents (reactants, catalysts,
salts, solvents and solid supports) to accelerate the chemical reaction. The
microwave absorption properties of some liquid and solid materials, due to their
polar and ionic characteristics, have the capability to significantly enhance
chemical reactions relative to traditional energy application (heating) techniques.
The microwave interaction properties with the reactants, intermediates, catalysts,
solid supports and salts provide unique opportunities for the synthetic chemist.

Chapter 3
61
Figure 3.1: CEM Discover microwave synthesizer.
The CEM Discover model is a single mode cavity instrument, having a
sample cavity possessing multiple entry points for the microwave energy to enter
the cavity (Figure 3.2).
Figure 3.2: Cutaway view of sample cavity with multiple entry points for
microwave energy.
The microwave synthesizer possesses Intellivent pressure control system
to control the pressure during reaction (Figure 3.3). This pressure control system
consists of a load cell to enable pressure measurement and control of the reaction
environment that senses changes in the external deflection of the septa on top of
the sealed pressure vial. The sensor housing incorporates a capture and release
mechanism that secures the reaction vessel in the cavity.

Chapter 3
62
(a) (b)
Figure 3.3: (a) IntelliVent pressure sensor assembly (b) Cutaway view of
Intellivent pressure sensor.
The standard infrared temperature control system for the microwave
synthesizer consists of a non-contact infrared sensor which monitors and controls
the temperature conditions of the reaction vessel located in the instrument cavity
(Figure 3.4). The temperature sensor is centrally located beneath the cavity floor
and “looks” up at the bottom of the vessel. A lens is positioned between the sensor
and the cavity floor to protect the sensor.
Figure 3.4: Cutaway view of infrared temperature sensor.

Chapter 3
63
3.4.1 Working methodology
To run a microwave reaction, a specific method including all the
conditions during the reaction like temperature, hold time, pressure and power
according to reaction requirement, was prepared (Figure 3.5). Reaction mixture,
activated catalyst and magnetic bar were taken in a glass vial (10 mL capacity)
then sealed with a septum and put into the microwave cavity where the vial was
again sealed with pressure lock then the vial was microwave irradiated by pushing
the start key after selecting the required parameters of time, temperature, pressure
and power. After the completion of the reaction (as monitored by TLC) the time
v/s temperature/power/pressure were recorded on the monitor using synergy
software. The catalyst was filtered out and the product was analyzed by Gas
Chromatograph to know the conversion %. The experiments for optimization of
various reaction parameters and conditions were performed by adopting the
similar procedure.
3.5 Catalytic activity of MTP catalyst
The catalytic activity of the MTP was tested by the nitroaldol
condensation reaction of carbonyl compound with nitroalkane in solvent-free,
liquid phase reaction conditions, under microwave irradiation as shown in
Scheme 3.2.
MTP catalyst
R4 NO2
O
R1 H
O
R2 R3
or +
Carbonyl compound Nitro alkane
R1CH (CH2)n NO2
OH
Nitro alcohol
NO2R2(R3)C(CH2)n
or
OH
MW
Scheme 3.2: Nitroaldol condensation of nitroalkane with carbonyl
compound over MTP.

Chapter 3
64
Figure 3.5: Reaction controlling parameters graphs generated by
microwave synthesizer (a) Temperature v/s time (b) Power v/s
time (c) Pressure v/s time.
3.5.1 Reaction procedure: Nitroaldol condensation
For nitroaldol condensation, a mixture of nitroalkane and carbonyl
compound in 2:1 to 1:3 molar ratios was taken in presence of MTP catalyst
(preheated at 450 °C for 2 h) in a glass vial (capacity 10 mL) with magnetic
stirring. The vial was sealed with a septum and placed into the microwave cavity
where it was again sealed with a pressure lock and microwave irradiated in a
CEM Focused Microwave™ Synthesis System, model Discover. The reaction was
carried out at different molar ratio of substrate having various substrates to
a b
c
Chapter 3
65
catalyst weight ratio ranging from 10:1 to 2.5:1 at different temperatures in the
range of 40–100 ºC. The reaction mixture was treated with microwaves for time
ranging from 5 to 30 minutes, at power ~ 70 W and pressure 50 Psi. The reaction
was monitored by thin layer chromatography, stopped after completion of the
reaction and cooled to room temperature. After completion of the reaction the
catalyst was filtered and the product was analyzed by Gas Chromatograph.
The conversion and selectivity were calculated as follows:
Conversion (wt %) = 100 X (Initial wt% - Final wt%) / Initial wt%
Selectivity of product (wt%) 100 X
GC peak area % of nitro alcohol
Total GC peak area % for all the products
=
3.6 Catalyst regeneration
The used catalyst was washed thoroughly with acetone and dried in oven
at 110 ºC for 12 h, thermally activated at 450 ºC for 2 h before reuse in next
reaction cycle under similar reaction conditions as in the first reaction cycle.
3.7 Results and discussion
3.7.1 Chemical composition of P and MTP catalyst
The chemical compositions of as P and MTP as determined by SEM –
EDX, are given in Table 3.1. Loss on ignition (LOI) was found to be 4.1 wt%, by
heating a certain weighed quantity of perlite in muffle furnace at 800 °C for 3 h.
LOI would also correspond to the burning of carbonaceous materials and
volatilization of some trace metal oxides present in P and MTP catalyst [15]. In P,
negligible amount of Mg is present, while the increased amount of Mg
incorporated in the catalyst was found to be 5.15%, while Si and Al percentage is
slightly decreased, as evaluated by SEM– EDX. The increase in Mg is responsible
for various MgO-SiO2 phases in MTP catalyst resulting in increased basicity and
catalytic activity for condensation reaction.

Chapter 3
66
Table 3.1: Chemical composition of P and MTP.
Elements P (Wt%) KATP (Wt%)
O 73.70 71.97
Si 18.83 17.62
Al 3.72 2.12
K 1.44 1.26
Na 1.61 1.47
Mg 0.21 5.15
Ca 0.19 0.13
Fe 0.10 0.10
Zn 0.13 0.11
Ti 0.07 0.07
3.7.2 Surface area results
Specific surface area of P is slightly decreased on thermal and chemical
activation and reaches 2.3 m2/g to 1.7 m
2/g for MTP (Table 3.2). The slight
decrease in surface area could be assigned to the blockage of the small pores of P
surface by loading various Mg species. Mg may load on TP surface in various
forms like MgCO3, Mg(OH)2, MgO and Mg-SiO2. It seems that an increase in the
amount of these Mg forms contribute to the blockage of mesopores of small
diameter and making them unapproachable for N2 molecules [17]. In MTP
catalyst, decrease in the surface area results in increased surface active catalytic
sites (-OH groups), responsible for the high catalytic activity.
Table 3.2: Surface area of P and MTP.
Catalyst Specific surface area (m2/g)
P 2.3
MTP 1.7

Chapter 3
67
3.7.3 Thermogravimetric analysis
TGA profiles of P and MTP catalyst are given in Figure 3.6. The TGA
curve of P shows 4.3% weight loss within the temperature range 50-400 ˚C,
indicates the removal of moisture content and some volatile materials [18]. The
TGA curve of as prepared MTP (uncalcined), shows weight loss of 8% within the
temperature range 0-1000 ˚C. It can be concluded that precursor Mg(NO3).6H2O,
during the catalyst preparation converts into Mg(OH)2 and MgCO3. The weight
loss in temperature range 270 – 370 ˚C and 400 – 550 ˚C are assigned to
decomposition of Mg(OH)2 and MgCO3 respectively [19] as well as burning of
carbonaceous materials and volatilization of some trace metal oxides present in as
prepared MTP catalyst.
0 200 400 600 800 1000
5.0
5.2
5.4
5.6
0 200 400 600 800 1000
9.9
10.0
10.1
10.2
10.3
10.4
MTP
P
we
igh
t (m
g)
Temperature (oC)
Figure 3.6: TGA curves of P and MTP.

Chapter 3
68
3.7.4 FTIR studies
Silica is the major component of perlite, which is totally roofed by
hydroxyl groups and physically adsorbed water. Physically adsorbed water is
removed on thermal activation resulting in the formation of surface siloxane
bridges on silica surface [20] which helps in increasing surface hydroxyl groups
on further chemical activation and hence increases surface basicity and catalytic
activity of the material. Each FTIR spectrum (Figure 3.7) shows a broad band
between 3600-3200 cm-1
, which is attributed to –OH species of surface silanol
groups (–Si-OH) and adsorbed water molecules on the surface [21]. Strong
hydrogen bonding between –OH species is responsible for the broadness of this
band [22]. Intensity and broadness reduce in case of TP (Figure 3.7b) confirming
the loss of water in perlite during thermal activation, which again increases in case
of MTP, probably due to increased –Si–O–Mg–OH groups on TP surface.
All spectra (Figure 3.7) show a peak around 1630 cm-1
attributed to
bending mode (δO–H) of water molecules [23]. A small band centered at 1521 cm-1
present in MTP and reused MTP, is due to (CO3)2-
stretching vibration of MgCO3
and show an agreement with the TGA result [24].
Amorphous silica is the major component of perlite, which is normally
assumed to be formed by a continuous network of Q4 units [Si(SiO4)4] [25], gives
broad band in the range of 1100-1040 cm-1
due to Si–O–Si asymmetric stretching
vibration modes (Figure 3.7a) [26]. The increased –OH species in case of MTP in
the form of –Si–OH and –Si–O–Mg–OH groups (Figure 3.7c), shift the position
of Si–O–Si band towards lower wave number indicating the transformation of
amorphous silica Q4 units [Si(SiO4)4] to Q
3 units [Si(OH)(SiO4)3] [25]. Band
appearing at 797 cm-1
in P due to symmetric Si-O-Si stretching vibration [7] gets
shifted towards lower wave number in MTP (Figure 3.7c and Table 3.3) at 792
cm-1
could be an evidence for increased silanol groups on MTP surface. A small
peak at 572 cm-1
is due to the stretching vibration of Si-O-Al group [23].
Band due to –OH stretching vibration is appeared between 3600-3200
cm-1
, is least broad in case of TP (Figure 3.7b) representing the lesser number of
Si-OH groups on the catalyst surface. This band is broader and sharper in case of
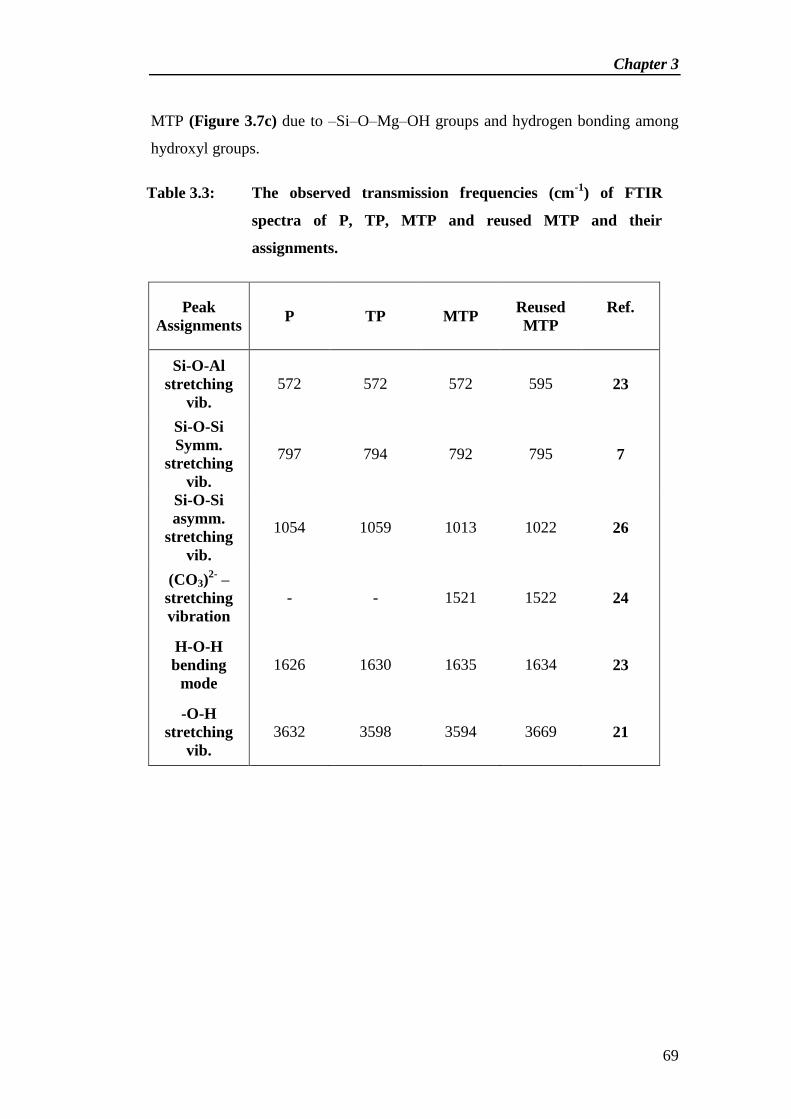
Chapter 3
69
MTP (Figure 3.7c) due to –Si–O–Mg–OH groups and hydrogen bonding among
hydroxyl groups.
Table 3.3: The observed transmission frequencies (cm-1
) of FTIR
spectra of P, TP, MTP and reused MTP and their
assignments.
Peak
Assignments P TP MTP
Reused
MTP
Ref.
Si-O-Al
stretching
vib.
572 572 572 595 23
Si-O-Si
Symm.
stretching
vib.
797 794 792 795 7
Si-O-Si
asymm.
stretching
vib.
1054 1059 1013 1022 26
(CO3)2-
–
stretching
vibration
- - 1521 1522 24
H-O-H
bending
mode
1626 1630 1635 1634 23
-O-H
stretching
vib.
3632 3598 3594 3669 21

Chapter 3
70
Figure 3.7: FTIR spectra of (a) P, (b) TP and (d) MTP.
D:\FTIR DATA\smj\MVA-P 2 450-4h KBr.0 MVA-P 2 450-4h KBr DRS
D:\FTIR DATA\smj\Raw VA KBr.0 Raw VA KBr DRS
D:\FTIR DATA\smj\VA 800-3h calc_KBr.0 VA 800-3h calc_KBr DRS
13/05/2013
03/10/2012
21/01/2012
37
73.3
7
36
32.7
535
98.5
135
94.1
7
23
22.4
0
18
48.8
118
39.0
818
39.0
8
16
30.3
416
26.3
115
21.8
3
14
37.3
1
10
59.6
510
54.8
410
13.7
979
7.9
279
4.4
879
2.3
263
4.8
659
7.6
859
7.5
757
2.7
257
2.3
657
2.2
5100015002000250030003500
Wavenumber cm-1
20
40
60
80
10
0
Tra
nsm
itta
nce
[%
]
Page 1/1
a b
c
3598
3632
3594
1626
797
1059
1521

Chapter 3
71
3.7.5 X-ray diffraction studies
The XRD diffraction patterns for P, TP, Pure MgO and MTP are displayed
in Figure 3.8. The analysis was carried out to study the effect of activation on
perlite surface. The XRD pattern of perlite in Figure 3.8a depicts its purely
amorphous nature of silica while after thermal activation at 800 °C for 3 h, a
small peak is observed at 2θ = 26.7o (Figure 3.8b) corresponding to the crystalline
phase of quartz [27]. The XRD pattern of pure MgO (Figure 3.8c) shows
diffraction peaks at 2θ = 36o, 42
o, 62
o [28]. All of the diffraction peaks can be
indexed as the known periclase (MgO) structure (JCPDS 87-0653) [28]. The XRD
pattern of MTP catalyst shows new small broad humps at around 2θ = 36o, 42
o,
61o which could be assigned to forsterite (Mg2SiO4) (JCPDS data file No. 34-
0189) and enstatite (MgSiO3) (JCPDS data file No. 11-0273) [29] mineral phases
which confirms the effective functionalization of amorphous silica with MgO
loading (Figure 3.8d).
3.7.6 SEM analysis results
The surface morphology of the P, TP and MTP as examined using SEM
technique, is shown in Figure 3.9 which demonstrate particles of different sizes,
having irregular faces in all materials. MTP shows shiny agglomerated areas on
TP particles due to loaded MgO as well as due to newly formed phases like
enstatite and forsterite [29].
3.7.7 TEM analysis studies
TEM images of P and MTP catalyst are given in Figure 3.10. SAED
pattern of MTP shows diffuse rings, which indicates amorphous structure of MTP
catalyst (Figure 3.10c). Bright field micrographs of MTP catalyst (Figure 3.10d-
f) show dark spots on the TP surface which represents the loading of Mg species
in various forms on TP surface.

Chapter 3
72
Figure 3.8: X-ray diffraction patterns of a) P, (b) TP, (c) Pure MgO and
(d) MTP.
(a.u
.)
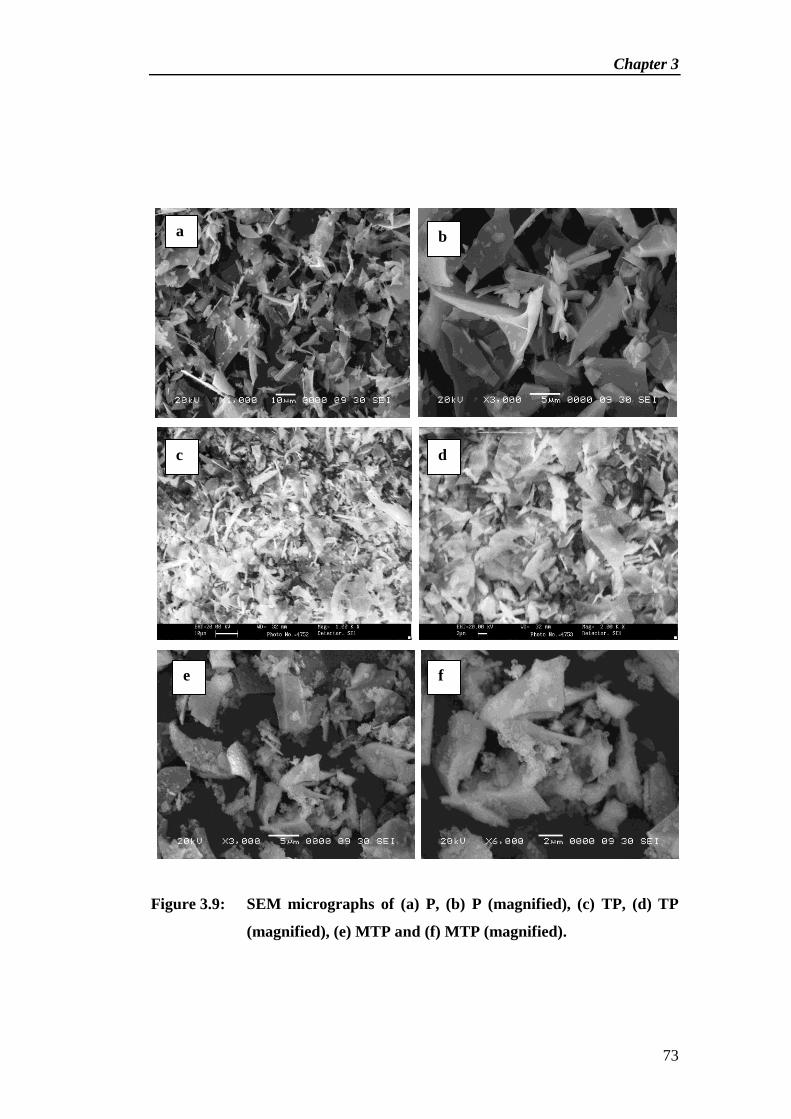
Chapter 3
73
Figure 3.9: SEM micrographs of (a) P, (b) P (magnified), (c) TP, (d) TP
(magnified), (e) MTP and (f) MTP (magnified).
a
f e
d c
b

Chapter 3
74
Figure 3.10: TEM images of (a-b) P, (c) SAED pattern of MTP and (d-f)
bright field micrograph of MTP in the range 2000 nm to 200
nm scales.
2 micron 100 nm
a b
c d
e f

Chapter 3
75
3.7.8 Basic strength and basicity measurement
The basic strength of the MTP catalyst was determined by using Hammett
indicators and found to be 15>H_>9.8. The total basicity was determined by
benzoic acid titration method and found to be 1.02 mmol/g.
3.8 Catalytic activity
The catalytic activity of MTP catalyst was measured by a single step,
liquid phase, solvent free and microwave irradiated nitroaldol condensation
reaction of propionaldehyde with nitroethane under optimized reaction conditions.
Results given in Table 3.4 show that both perlite (P) and thermally activated
perlite (TP) do not possess any catalytic activity for studied reaction. MTP
catalyst under the given conditions, showed maximum activity. Parameters such
as reactant molar ratio, amount of catalyst, reaction time and temperature were
optimized in order to achieve the maximum catalytic activity and good conversion
and selectivity of desired product.
Table 3.4: Catalytic activity of P, TP and MTP for nitroaldol
condensation reaction of nitroethane with propionaldehyde.
Reaction conditions: Temperature 80 °C, Time 15 minute,
nitroethane/propionaldehyde molar ratio 1:1, substrate/catalyst weight ratio 5:1.
3.8.1 Effect of reaction time
In order to find the reaction time to get highest conversion and selectivity
over MTP catalyst, the reaction was carried out at 80 °C for different time
intervals ranging from 5 minutes to 30 minutes taking
nitroethane/propionaldehyde molar ratio 1:1 and nitroethane to catalyst weight
ratio 5:1. It was found that in first 15 minutes of the reaction period the
Catalyst Conversion (%) of
nitroethane
Selectivity (%) for
1-nitro-3-pentanol
P Nil Nil
TP Nil Nil
MTP 78 82

Chapter 3
76
conversion and selectivity increase linearly up to 95% and 97% respectively
which remained constant upto 30 minutes (Figure 3.11). The optimized reaction
time was found to be 15 minutes, in which MTP catalyst gave highest conversion
95% of nitroethane to 1-nitro-3-pentanol with 97% selectivity.
Figure 3.11: Variation in conversion (%) of nitroethane and selectivity (%)
for 1-nitro-3-pentanol with time.
Reaction conditions: Temperature 80 °C, nitroethane/propionaldehyde molar
ratio 1:1, substrate/catalyst weight ratio 5:1.
3.8.2 Effect of reaction temperature
Optimization of reation temperature to give maximum conversion and
selectivity was carried out at temperature ranging from 40 °C to 100 °C for 15
minutes taking nitroethane/propionaldehyde molar ratio of 1:1 while substrate to
catalyst weight ratio was 5:1. Conversion and selectivity were observed to
increase on increasing reaction temperature ranging from 40 °C to 80 °C as
inferred from Figure 3.12. The results show that the maximum conversion (95%)
of nitroethane and selectivity (97%) for 1-nitro-3-pentanol was found at 80 °C,
after which conversion and selectivity remain almost steady till 100 °C.
0
20
40
60
80
100
120
0 5 10 15 20 25 30 35
Time (Minute)
Conversion %
selectivity %

Chapter 3
77
Figure 3.12: Variation in conversion (%) of nitroethane and selectivity (%)
for 1-nitro-3-pentanol with temperature.
Reaction conditions: Time 15 minute, nitroethane/propionaldehyde molar ratio
1:1, substrate/catalyst weight ratio 5:1.
3.8.3 Effect of substrate/catalyst weight ratio
The influence of substrate to catalyst weight ratio on conversion and
selectivity were investigated by varying the amount of MTP catalyst under
optimized reaction conditions. It can be seen from Table 3.5, only 71%
conversion of nitroethane is achieved at nitroethane/MTP weight ratio 10:1. On
increasing nitroethane/MTP weight ratio to 5:1, conversion of nitroethane is
increased up to 95% while selectivity for 1-nitro-3-pentanol is increased up to
97%. The increase in selectivity and conversion, with increase in the catalyst
weight can be attributed to an increase in the availability of number of catalytic
active sites required for condensation reaction. On further increase in the amount
of catalyst no changes in conversion and selectivity are observed.
3.8.4 Effect of reactant molar ratio
The synthesis of 1-nitro-3-pentanol was carried out at 80 °C with various
molar ratios of reactants for 15 minutes over MTP catalyst. As indicated by Table
3.6, 72% conversion of nitroethane was observed at 2:1 molar ratio of nitroethane
to propionaldehyde. This may be due to insufficient quantity of the reactants to
0
20
40
60
80
100
120
0 20 40 60 80 100 120
Temperature (oC)
Conversion %
selectivity %

Chapter 3
78
react with each other. There was an increase in conversion up to 95% with
selectivity 97% at 1:1 molar ratio of nitroethane to propionaldehyde at the same
reaction conditions. This may be due to equilibrating of each reactant quantity on
the basic sites of the MTP catalyst surface. The conversion decreased from 82% to
75% on further increasing the molar ratio from 1:2 to 1:3 which could be
attributed to the self aldol addition reaction of the excessively present
propionaldeyde.
Table 3.5: Effect of substrate/catalyst weight ratio on conversion (%) of
nitroethane and selectivity (%) for 1-nitro-3-pentanol over
MTP.
nitroethane /MTP
weight ratio
Conversion (%) of
nitroethane
Selectivity (%) for
1-nitro-3-pentanol
10:1 71 74
5:1 95 97
2.5:1 95 97
Reaction conditions: Temperature 80 °C, Time 15 minutes,
nitroethane/propionaldehyde molar ratio 1:1.
3.9 Reaction mechanism
The plausible structure for active basic sites of the MTP catalyst is shown
in (Scheme 3.3). The reaction mechanism over MTP catalyst shows (Scheme
3.4) that the surface basic sites (hydroxyl groups) of the MTP catalyst initiate the
reaction by abstracting the proton from nitroethane, resulting in the formation of
carbanion. The formed nitroethanion again attack on the electron deficient carbon
atom of the carbonyl group of propionaldehyde with loss of water and form
condensation product by simple nucleophillic addition reaction.

Chapter 3
79
Table 3.6: Effect of molar ratio of nitroethane/propionaldehyde on
conversion (%) of nitroethane and selectivity (%) for 1-nitro-3-
pentanol over MTP.
Reaction conditions: Temperature 80 °C, Time 15 minutes, substrate/catalyst
weight ratio 5:1.
O
Si
O
Si
O
Si
O
OH
OH
Mg(NO3)2.6H2O Solution
Calcine at 450 oC for 4 h
Thermally activated perlite (TP) surface
MTP catalyst surface
O OH
O
O
O
Si
O
Si
O
Si
O
O
O
O O
O
O
Mg
Mg
Mg
OH
OH
OH
Scheme 3.3: The schematic presentation of chemical activation of perlite
with Mg(NO3)2.6H2O and proposed structure of MTP.
Molar ratio Conversion (%) of
nitroethane
Selectivity (%) for
1-nitro-3-pentanol
2:1 72 93
1:1 95 97
1:2 82 90
1:3 75 89

Chapter 3
80
Bronsted basic site
Nitro ethane
H CH2CH2NO2
CH2CH2NO2C O
H
CH3CH2
Propionaldehyde
CH2CH2NO2
CH
CH3CH2
O
H2O
H2O
CH2CH2 NO2
CH OH
CH3CH2
1-nitro-3-pentanol
Deprotonation
Nucleophilic addition
OSi
OSi
OSi
O
O O
O
O
O O
Mg Mg Mg
OH OH OH
MTP catalyst surface
Scheme 3.4: Proposed mechanism for Nitroaldol condensation of
nitroethane and propionaldehyde over MTP.

Chapter 3
81
3.10 Catalyst regeneration
The spent catalyst was filtered out from the reaction mixture, washed with
acetone, dried in oven at 110 °C for 12 h followed by thermal activation at 450 °C
for 2 h under static condition. The regenerated MTP catalyst was reused in the
next reaction cycles under similar reaction conditions as to first reaction cycle.
The FTIR spectrum of reused MTP catalyst after four reaction cycles (Figure
3.13b) matches with the fresh MTP catalyst (Figure 3.13a). The catalyst was
found to be equally efficient up to four reaction cycles, giving an approximately
similar conversion and selectivity for 1-nitro-3-pentanol (Table 3.7). During the
course of the reaction, the catalyst loses its catalytic activity due to the deposition
of organic molecules on the catalyst surface. The possibility of organic molecules,
entering the interstices of the catalyst cannot be ruled out, which is confirmed by
the successively quite decreased conversion % after regeneration, leading to
deactivation of the catalyst [30].
Table 3.7: Nitroaldol condensation of nitroethane and propionaldehyde
over fresh and regenerated MTP.
Reaction cycle Conversion % of
nitroethane
Selectivity % for
1-nitro-3-pentanol
I 95 97
II 89 92
III 86 92
IV 80 85
Reaction conditions: Temperature 80 °C, Time 15 minute,
nitroethane/propionaldehyde molar ratio 1:1, substrate/catalyst weight ratio 5:1.
The study of nitroaldol condensation reaction was then extended to the
several substituted aromatic and nonaromatic aldehydes with nitroethane and
nitromethane using the MTP catalyst through microwave irradiation. All the
reactions occurred in solvent free conditions within 15 minutes at 80 °C
maintaining the reactant molar ratio 1:1, substarte/catalyst weight ratio 5:1. The
results are summarized in the Table 3.8.

Chapter 3
82
Figure 3.13: FTIR spectra of (a) MTP and (b) reused MTP.
D:\FTIR DATA\smj\MVA-P 2 450-4h KBr.0 MVA-P 2 450-4h KBr DRS
D:\FTIR DATA\smj\MVA-P 1 450-4h KBr.0 MVA-P 1 450-4h KBr DRS
13/05/2013
13/05/2013
36
69.3
8
35
94.1
7
23
41.1
3
18
48.8
118
48.7
4
15
22.5
715
21.8
314
38.0
714
37.3
1
10
22.8
110
13.7
9
79
5.4
579
2.3
2
59
7.5
759
5.1
157
2.3
6
100015002000250030003500
Wavenumber cm-1
20
40
60
80
10
0
Tra
nsm
itta
nce
[%
]
Page 1/1
a
b
2341
3669
1522 1022
795

Chapter 3
83
Table 3.8: Nitroaldol condensation of nitro alkane with various aromatic
and nonaromatic aldehydes in presence of MTP.
S.No. Carbonyl compound Nitro compound Conversion (%)
1 Acetone Nitromethane 46
2
3
4
5
6
7
8
9
10
11
12
Benzaldehyde
Isobutyraldehyde
Methylpropionate
p-chlorobenzaldehyde
p-nitrobenzaldehyde
Acetone
Benzaldehyde
Isobutyraldehyde
Methylpropionate
p-chlorobenzaldehyde
p-nitrobenzaldehyde
Nitromethane
Nitromethane
Nitromethane
Nitromethane
Nitromethane
Nitroethane
Nitroethane
Nitroethane
Nitroethane
Nitroethane
Nitroethane
39
62
34
76
83
54
43
79
32
85
87
Reaction conditions: Temperature 80 °C, Time 15 minutes, substrate molar ratio
1:1, substrate/catalyst weight ratio 5:1.
3.11 Conclusion
The present work provides a brief report on the catalytic application of a
new solid support perlite which is least explored till now. An effective solid base
catalyst has been prepared through thermal and chemical activation. The prepared
MTP catalyst acts as efficient heterogeneous base catalyst for nitroaldol

Chapter 3
84
condensation reaction under optimized reaction conditions with giving conversion
of 95% and selectivity 97%. MTP catalyst possesses higher basicity due to
increase in Bronsted basic sites i.e. Si–OH and Si-O-Mg-OH content. The reaction
was carried out in solvent free conditions under microwave irradiations and the
catalyst can be easily separated by simple filtration, regenerated and reused up to
three times with almost equal efficiency, thus produces no waste and makes the
process profitable. The efficient reuses of the catalyst confirm the stability of the
surface active basic sites. This investigation brings into light an innovative
application of perlite in cost effective, eco-friendly and recyclable catalyst
synthesis for different important organic reactions.
3.12 References
[1] A. Corma, S. Iborra, Adv. Catal. 49 (2006) 239.
[2] F.A. Luzzio, Tetrahedron 57 (2001) 915.
[3] K. Akutu, H. Kabashima, T. Seki, H. Hattori, Appl. Catal. A Gen. 247
(2003) 65.
[4] B.M. Choudary, M.L. Kantam, K.K. Rao, F. Figueras, A.A. Einstein, Green
Chem. (1999) 187.
[5] Z.W. Changsheng Gan, Xing Chen, Guoyin Lai, Synlett 3 (2006) 387.
[6] C.G. Hartung, C. Breindl, M. Beller, 56 (2000) 5157.
[7] D. Jain, C. Khatri, A. Rani, Fuel Process. Technol. 91 (2010) 1015.
[8] J. Weitkamp, M. Hunger, U. Rymsa, Microporous Mesoporous Mater. 48
(2001) 255.
[9] X. Zhang, E.S.M. Lai, R. Martin-aranda, K.L. Yeung, Appl. Catal. A Gen.
261 (2004) 109.
[10] K.R.D. Madhvi A. Surati, Smita Jauhari, Sch. Res. Libr. 4 (2012) 645.
[11] F.K. Macdonald, K.M.M. Carneiro, I.R. Pottie, Tetrahedron Lett. 52 (2011)
891.
[12] C.O. Kappe, Angew Chem Int Edu 43 (2004) 6250.
[13] H.S.P. Rao, S. Jothilingam, J. Chem. Sci 117 (2005) 323.
[14] F. Tavangarian, R. Emadi, Mater. Res. Bull. 45 (2010) 388.

Chapter 3
85
[15] K. Kordatos, S. Gavela, A. Ntziouni, K.N. Pistiolas, A. Kyritsi, V.K.
Rigopoulou, Microporous Mesoporous Mater. 115 (2008) 189.
[16] R. Rahul, J.K. Satyarthi, D. Srinivas, Indian J. Chem. 50 (2011) 1017.
[17] H. Ma, S. Li, B. Wang, R. Wang, S. Tian, J. Am. Oil Chem. Soc. 85 (2008)
263.
[18] M.M.A. Sekkina, R.M. Issa, A.E.-D.M. Bastawisy, W.A. El Helece, Int. J.
Chem. 2 (2010) 81.
[19] R.E.O. Neill, L. Vanoye, C. De Bellefon, F. Aiouache, "Applied Catal. B,
Environ. 144 (2014) 46.
[20] F. Adam, J. Nelson, A. Iqbal, Catal. Today 190 (2012) 2.
[21] D. Jain, A. Rani, Am. Chem. Sci. J. 1 (2011) 37.
[22] D. Jain, C. Khatri, A. Rani, Fuel 90 (2011) 2083.
[23] S. Katara, S. Kabra, A. Sharma, R. Hada, A. Rani, Int. Res. J. Pure Appl.
Chem. 3 (2013) 299.
[24] H. Handa, T. Baba, H. Sugisawa, Y. Ono, J. Mol. Catal. A Chem. 134
(1998) 171.
[25] M.E. Simonsen, C. Sonderby, Z. Li, E.G. Sogaard, J. Mater. Sci. 44 (2009)
2079.
[26] B.J. Saikia, G. Parthasarathy, N.C. Sarmah, G.D. Baruah, Indian Acad. Sci.
31 (2008) 155.
[27] A. Sharma, K. Srivastava, V. Devra, A. Rani, Am. Chem. Sci. J. 2 (2012)
177.
[28] W. Wang, X. Qiao, J. Chen, H. Li, Mater. Lett. 61 (2007) 3218.
[29] F. Tavangarian, R. Emadi, J. Alloys Compd. 485 (2009) 648.
[30] P. Forzatti, L. Lietti, Catal. Today 52 (1999) 165.

Chapter 4
Strontium Nitrate Activated Fly Ash: An Efficient Solid Base Catalyst for Microwave Assisted
Michael Addition Reaction
Chapter 4
86
Abstract
ly ash is converted into an efficient solid base catalyst: strontium nitrate
activated fly ash, by treating with strontium nitrate on mechanically and
thermally activated fly ash. The catalytic application of prepared catalyst was
evaluated by Michael addition reaction under microwave irradiations. The
synthesized catalyst was highly active for solvent free synthesis of Michael
adducts through conjugate addition of 2-cyclohexenone with nitromethane or
active methylene compounds. The microwave assisted synthesis resulted in
increased yield of the products (92%) at a significantly lower reaction
temperature (90 °C) and reaction time (15 minute) than the synthesis by thermal
heating (78% yield, at 120 °C, for time range 120 minute). The physico-chemical
properties of catalyst were investigated by N2 adsorption-desorption study, TGA,
FTIR, XRD, SEM-EDX and TEM analytical techniques. The basic strength was
measured by Hammett indicator method. The catalyst could be easily regenerated
and reused up to four reaction cycles with almost similar efficiency. The work
reports an alternative pathway for utilization of waste fly ash by using it in the
development of novel, cost effective and recyclable solid base catalyst for
industrially important Michael addition reaction.
F

Chapter 4
87
4.1 Introduction
oal-fired power plants are taking a prominent part in the energy
production today. These plants produce a large number of by-products during
coal burning, also known as coal combustion products (CCPs) viz. fly ashes
(FAs), bottom ashes (BAs), boiler slags (BS), fluidised bed combustion ashes
(FBCAs), semi dry adsorption (SDA) products and flue gas desulphurisation
(FGD) gypsum [1]. The physical, chemical and micro structural properties of fly
ash depend on coal category viz. anthracite, bituminous and lignite as well as on
combustion conditions [2]. Worldwide annual production of coal fly ash is
estimated around 800 million tonnes [3], constituting about 75–80% of the total
CCPs production [4]. Therefore, development of innovative methodology for
utilization of this industrial waste in various value added materials has become an
essential objective of the present research and development work related with fly
ash management and utilization. SiO2 and Al2O3 are major constituents of fly ash
while Fe2O3, CaO, MgO, TiO2, Na2O and K2O are present as minor constituents
[5]. Fly ash has a specific surface area ~17 m2/g, mesoporosity ~0.06 cm
3/g and
macroporosity 0.65 cm3/g [6]. According to ASTM Standard C 618, fly ash is
divided into two categories Class F and Class C. The fly ash generally resulted
from the burning of higher-rank bituminous and anthracite coals containing >70%
SiO2, Al2O3 and Fe2O3 with low amount of calcium is classified as Class F fly
ash. On the other hand, Class C fly ash contains >50% SiO2, Al2O3 and Fe2O3
with high amount of calcium, is mostly produced from the burning of low-rank
lignite and sub-bituminous coals [4,7]. As far as bulk application of fly ash is
concerned, besides concrete industry, there are a number of uses and utilization
areas of fly ash such as structural fill, waste solidification and stabilization,
roadway and pavement utilization, metallurgy and valuable metal extraction,
agriculture, environmental engineering and adsorption of heavy metals and dye
from industrial effluents [4]. Studies report that being aluminosilicate rich
material fly ash can be used as an alternative silica source in synthetic organic
chemistry.
Among the well known solid base catalysts, SrO has been reported as an
active heterogeneous base transesterification catalyst due to its high basicity and
C

Chapter 4
88
insolubility in methanol, vegetable oil and FAMEs [8]. The Strontium based
catalysts can be divided into 6 categories such as neat 1. SrO [9], 2. Strontium
salts eg. SrCO3, Sr(OH)2.8H2O [10], Sr(NO3)2, SrSO4, SrCl2 [11], 3. Doped SrO
eg. strontium doped silica supported silver catalyst [(x)SrO Ag(y)/SiO2] [12],
Sr(NO3)2 doped ZnO [13], 4. Mixed oxides nanocomposite eg. Sr3Al2O6, 5. Thin
films eg. barium strontium titanate thin films [14], 6. Supported catalysts eg.
Sr(NO3)2/γ-Al2O3, Sr(NO3)2/ZrO2 [13], SrO/MgO [15], SrO/Carbon nano fiber
[16], SrO/SiO2, SrO/CaO [17], Sr-Co/Al2O3, Sr/FeSi [18].
Commercially the base catalyzed reactions are largely carried out in fine
chemical, petrochemical, agrochemical and pharmaceutical industries by using
homogeneous bases like NaOH, Ca(OH)2, KOH etc. [19]. Harsher reaction
conditions, corrosion, tedious post reaction work up, environmental problems are
the main disadvantages of homogeneous base catalysis. Consequently, solid base
catalysis has been intensively investigated as a replacement for homogeneous
base catalysis. Solid base catalysis presents several advantages over
homogeneous catalysis such as no corrosion, ease of separation from reaction
mixture and lesser environmental issues. Solid base catalysts such as hydrotalcite,
KF/Al2O3, MgO, MCM-41 [20], LiOH/Al2O3 [21], Na/SiO2 [22] and
KF/activated carbon [23] etc. are well reported in the literature for different
organic transformations. Supporting a desired catalyst on a suitable support not
only increases the number of active sites, but also leads to various changes in the
surface morphology. The dispersion ability of a catalyst in reaction will be
promoted after supporting the catalyst on a suitable support [17]. Properly and
homogeneously dispersed catalyst plays a significant role in catalyzing a reaction.
Fly ash being rich in silica (60%) and alumina (32%) [24], is thought to be
explored as an efficient siliceous support material to synthesize novel, recyclable,
eco-friendly and cost effective solid base catalyst. Previously, we have reported
fly ash supported base catalysts viz. NaOH/Fly ash [19], CaO/Fly ash [5], amino
propylated/Fly ash [25], MgO/Fly ash [26], KF/Fly ash [27] applicable for
various types of condensation reactions.
Michael addition is one of the most important reactions for C-C bond
formation through conjugate addition mechanism [28]. Generally Michael
Chapter 4
89
additions are performed in an appropriate solvent in the presence of bases like
Ba(OH)2, MgO, KF/Al2O3, Na/NaOH/Al2O3 [29], MgLa mixed oxides [30],
piperidine [31] etc. under conventional reaction conditions. To overcome the
disadvantages of conventional reaction conditions like prolonged reaction time,
lower product yield and tedious work-ups, new non-conventional procedure
‘microwave irradiation’ is found to facilitate the Michael addition. Microwave
irradiations also satisfied the “green chemistry” protocol, which states that a
reaction should be performed under solvent free conditions, having minimal or no
by-products formations with maintaining the atom economy [32]. To the best of
our knowledge, strontium salts activated fly ash has not been explored as a solid
base catalyst, applicable for Michael additions.
Thus, the aim of this work is to synthesize an efficient, cost-effective,
microwave stable solid base catalyst- Strontium nitrate activated fly ash, for
microwave mediated Michael addition of 2-cyclohexenone with a number of
active methylene compounds. Michael adducts possess various applications in
ploymrization [33], carbohydrate synthesis [34], biologically active heterocycles
[35], pharmaceutical and fine chemical industries [29]. Fly ash after suitable
mechanical, thermal and chemical activation has been converted into an effective
solid base catalyst. Michael addition was carried out under microwave
irradiations in a single step, liquid phase and solvent free reaction conditions and
catalyst was reused up to four reaction cycles with almost similar product yield.
Thus, the synthesized strontium nitrate activated fly ash catalyst gives a solution
to overcome the disadvantages of homogeneous and commercial heterogeneous
catalysts and also suggests an alternative pathway for utilization of solid waste fly
ash as a support material in synthesis of solid base catalyst for industrially
important microwave assisted Michael addition reactions.
4.2 Experimental
4.2.1 Materials
Fly ash was collected from Jamshedpur Thermal Power Station,
Jamshedpur (Jharkhand). All chemicals Sr(NO3)2 (99%), NaOH (98%), Na2CO3
(99%) were purchased from Sigma Aldrich and 2-cyclohexenone (98%) and

Chapter 4
90
active methylene compounds were purchased from S.D. Fine chemical Ltd.,
India. All reagents used were of analytical grade and used as such.
4.2.2 Catalyst synthesis
As received fly ash (FA) was mechanically activated by using high energy
planetary ball mill (Retsch PM-100, Germany) in an agate jar with 5mm diameter
agate balls for 10 h, 20 h and 30 h at 250 rotation/minute speed to increase the
surface area as well as surface active sites. 30 h milled FA showed the higher
specific surface area, also called as mechanically activated fly ash (MFA), was
selected for further activations. The agate jar was loaded with ball to powder
weight ratio of 10:1. MFA was thermally activated at 800 °C for 3 h to form
thermally activated fly ash (TFA), consequently C, S, moisture and other
impurities also get removed [36]. An aqueous solution of Sr(NO3)2 (15 wt%
loading) was added into 10 g TFA and constantly stirred for 1 h at 90 °C.
Precipitation was done by dropwise addition of mixture of NaOH (3M) and
Na2CO3 (2M) solution (in 1:1 ratio) up to pH 8 in the above mixture. Resultant
slurry was aged for 24 h then filtered and washed with double distilled water up
to pH 7 to remove leached compounds, air dried at 110 °C for 24 h and calcined
at 400 °C for 3 h in a muffle furnace under static conditions to form strontium
nitrate activated fly ash catalyst (SrTFA) (Scheme 4.1).
4.3 Catalyst characterization
Physicochemical properties of FA, MFA, TFA and SrTFA were studied by
N2 adsorption- desorption study, TGA, FTIR, XRD, SEM-EDX and TEM
techniques. Instruments detail and operating conditions during the
characterization are given in Annexure I.
Basic strength of SrTFA was determined using Hammett indicators like
phenolphthalein (pKa=8.2), nile blue (pKa=9.8), 2,4,6-trinitroaniline (pKa=12.2),
2,4-dinitroaniline (pKa=15) and 4-nitroaniline (pKa=18.4). Basicity was measured
by a benzoic acid titration method using phenolphthalein indicator [37]. The
methods for evaluating basic strength and basicity are given in detail in Chapter
2.

Chapter 4
91
Scheme 4.1: Synthesis of solid base catalyst SrTFA.
Mechanical activation of fly ash by ball milling
Addition of Sr(NO3)2 solution (15 wt%)
Dropwise addition of NaOH (3M) and Na2CO3 (2M) up to pH 8
Constant stirring at 90 °C for 1 h
Ageing for 24 h under constant stirring
Washing with distilled water and drying at 110 °C for 24 h
Calcination at 400 °C for 3 h
Solid base catalyst SrTFA
Thermal Activation of fly ash at 800 °C for 3 h
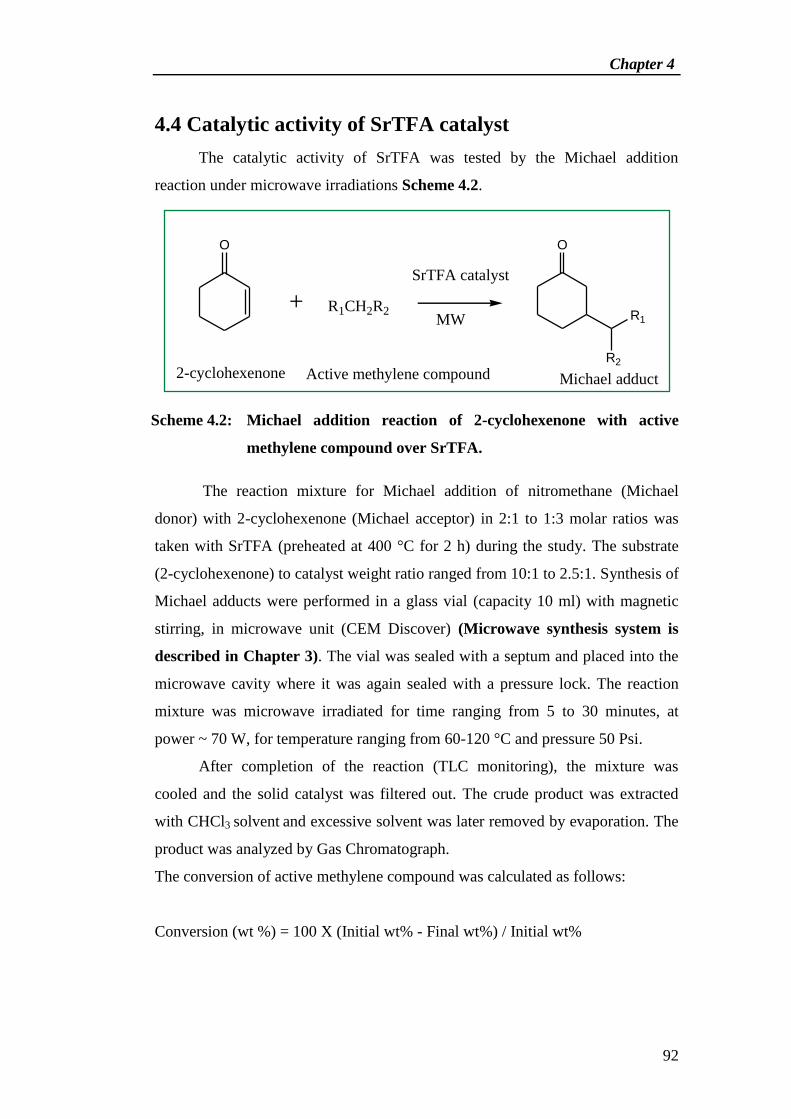
Chapter 4
92
4.4 Catalytic activity of SrTFA catalyst
The catalytic activity of SrTFA was tested by the Michael addition
reaction under microwave irradiations Scheme 4.2.
O
R1CH2R2+
SrTFA catalyst
O
R1
R2
2-cyclohexenone Active methylene compound Michael adduct
MW
Scheme 4.2: Michael addition reaction of 2-cyclohexenone with active
methylene compound over SrTFA.
The reaction mixture for Michael addition of nitromethane (Michael
donor) with 2-cyclohexenone (Michael acceptor) in 2:1 to 1:3 molar ratios was
taken with SrTFA (preheated at 400 °C for 2 h) during the study. The substrate
(2-cyclohexenone) to catalyst weight ratio ranged from 10:1 to 2.5:1. Synthesis of
Michael adducts were performed in a glass vial (capacity 10 ml) with magnetic
stirring, in microwave unit (CEM Discover) (Microwave synthesis system is
described in Chapter 3). The vial was sealed with a septum and placed into the
microwave cavity where it was again sealed with a pressure lock. The reaction
mixture was microwave irradiated for time ranging from 5 to 30 minutes, at
power ~ 70 W, for temperature ranging from 60-120 °C and pressure 50 Psi.
After completion of the reaction (TLC monitoring), the mixture was
cooled and the solid catalyst was filtered out. The crude product was extracted
with CHCl3 solvent and excessive solvent was later removed by evaporation. The
product was analyzed by Gas Chromatograph.
The conversion of active methylene compound was calculated as follows:
Conversion (wt %) = 100 X (Initial wt% - Final wt%) / Initial wt%

Chapter 4
93
The isolated yield (%) of Michael adduct was calculated by using weight percent
method.
% Isolated yield of Michael adduct obtained =
100 X
g of Michael adduct obtained experimentally
g of Michael adduct obtained theoritically
4.5 Catalyst regeneration
The used catalyst was filtered out by simple filtration method then washed
with acetone. After washing catalyst was dried in oven at 110 ºC for 12 h and
thermally activated at 400 ºC for 2 h in muffle furnace before reuse in next
reaction cycles under similar reaction conditions as earlier.
4.6 Results and discussion
4.6.1 Chemical composition of FA and SrTFA catalyst
The chemical compositions of as received FA and synthesized SrTFA
catalyst as determined by SEM-EDX are given in Table 4.1. Loss on ignition
(LOI) was found to be 5 wt%, by heating a certain weighed quantity of FA in
muffle furnace at 800 °C for 3 h. As depicted from Table 4.1 SrO is not present
in FA or it may be present in FA but beyond the instrument detection limit. In
SrTFA SrO is detectable and found 4.91%. Treatment of FA with Sr(NO3)2
proved to be effective in removing some metals to a lower level and hence
increasing the Sr content in the prepared catalyst. The increased Sr is accountable
for the generation of a number of Sr-SiO2/CO3/OH phases, thus increased
catalytic activity and basicity in the SrTFA catalyst for Michael addition reaction.
4.6.2 Surface area results
Specific surface area results of all samples are given in Table 4.2. Specific
surface area of FA 9.18 m2/g, considerably increases after mechanical activation
and reaches up to 30.02 m2/g for MFA while it decreases after thermal activation

Chapter 4
94
and reaches up to 28.47 m2/g. During the mechanical activation breaking of FA
spherical particles takes place which results in increased surface area.
The chemical activation of TFA results into decreased surface area due to
the blockage of its small pores by loading of different Sr species [38]. In SrTFA
catalyst, decrease in the surface area facilitates the generation of surface active
basic sites thus catalytic activity.
Table 4.1: Chemical composition of FA and SrTFA.
Chemical components FA (Wt%) SrTFA (Wt%)
SiO2 59.42 58.90
Al2O3 18.79 17.23
Fe2O3 6.91 6.48
CaO 2.56 2.10
MgO 1.84 1.52
K2O 2.37 1.98
Na2O 3.84 3.42
TiO2 1.27 0.96
SrO - 4.91
Other elements 3 2.5
Table 4.2: Specific surface area of all catalytic materials.
Catalyst Specific surface area (m2/g)
FA 9.18
FA (10 h milled) 15.14
FA (20 h milled) 22.54
MFA 30.02
TFA 28.47
SrTFA 23.54

Chapter 4
95
4.6.3 Thermogravimetric analysis
TGA curves of FA and SrTFA (Figure 4.1) show weight loss of 5.96%
and 11.23% respectively, within the temperature range 50-1000°C, are attributed
to water loss and burning of carbonaceous materials and volatilization of some
trace metal oxides and other impurities [39]. Precursor Sr(NO3)2 would be
converted into Sr(OH)2 and SrCO3 during the catalyst synthesis. So the
considerable weight loss in SrTFA may be assigned to the decomposition of
Sr(NO3)2, Sr(OH)2 and SrCO3.
0 200 400 600 800 1000
9.2
9.4
9.6
9.8
10.0
10.2
10.4
10.6
0 200 400 600 800 1000
4.0
4.5
5.0
5.5
6.0
6.5
a
b
We
igh
t (m
g)
Temperature ( oC)
Figure 4.1: TGA curve of (a) FA and (b) SrTFA.
4.6.4 FTIR studies
The FTIR spectra of FA, MFA, TFA are given in the Figure 4.2. All
spectra show a broad band between 3000-3600 cm-1
, which is attributed to –O-H
stretching vibration of surface silanol groups (Si-OH) [26]. Intensity and
broadness increase in case of MFA is an evidence for the breaking of spherical

Chapter 4
96
silica particles and formation of Si-OH groups and the presence of strong H-
bonding which again decreases after thermal activation due to loss of adsorbed
water in TFA [19]. A peak centered at 1608 cm-1
, present in all samples is
assigned to bending mode (δo-H) of water molecule (Figure 4.2, 4.3) [7]. A small
peak around 2830 cm-1
is assigned to –C-H stretching vibration of organic
contaminants present in fly ash sample (Table 4.3) [40]. Peaks around 1986 and
1872 cm-1
(Figure 4.2, Table 4.3) are assigned to SiO2 as possible quartz [41].
Peaks centered at 1521 and 1681 cm-1
are due to (CO3) 2-
stretching vibration,
visible in all spectra, show the highest intensity in FA and get reduced after
thermal activation confirming the removal of carbonate or carbonate like species
during thermal activation [40,42]. A broad band between 1103-1168 cm-1
is
attributed to Si-O-Si asymmetric stretching vibration [40]. A peak at approx ~
600 cm-1
is attributed to Si-O-Al stretching vibration (Figure 4.2, 4.3) [43].
FTIR spectrum of SrTFA (Figure 4.3b) shows the broader and much
intense band in the region of 3000-3600 cm-1
as compared to TFA. The increased
intensity could be assigned to generation of Si-OH groups as well as to Si-O-Sr-
OH groups during the chemical activation while H- bonding is responsible for the
broadness of the band between these groups. The increased OH groups are
responsible for the Bronsted basic sites which initiate the reaction by abstracting
the proton from active methylene group [44].
There is also possibility of SrO, Sr(OH)2 and SrCO3 formation on TFA
surface [15]. Some of the basic sites generated by SrO, would be due to the
presence of Sr+2
-O-2
ion pairs in different coordination environments [15].
Sr(OH)2 and SrCO3 formation could be assigned due to the absorption of water
vapour [45] and CO2 from environment [16] by SrO compound.

Chapter 4
97
Table 4.3: The observed transmission frequencies (cm-1) of Fourier
transform infrared spectra of FA, MFA, TFA, SrTFA and
reused SrTFA and their assignments.
Assignments FA MFA TFA SrTFA Reused
SrTFA Ref.
Si-O-Al stretching
vibration 602 601 594 602 600 44
Si-O-Si asymm.
Stretching
vibration
1151 1103 1129 1168 1106 41
(CO3)2- –stretching
vibration
1521,
1681 1521
1521,
1679 1521 1521 41, 43
H-O-H bending
Vibration 1609 1616 1608 1617 1614 7
-C–H stretching
vibration 2830 2854 2827 - - 41
-O-H stretching
vibration 3539 3442 3553 3444 3566 26
4.6.5 X-ray diffraction studies
The XRD patterns of FA, MFA, TFA and SrTFA are given in Figure 4.4.
Peaks at 2θ = 20.7 o
, 26.5 o
, 40.66 o
and 49.96o are attributed to quartz (SiO2,
ICDD pdf number 000- 46-1045) while peaks at 2θ = 33.4o
and 16.4 o
confirm the
presence of calcite (CaCO3, ICDD pdf number, 47-1743) and mullite (Al6Si2O13,
ICDD pdf number 000-15-0776) respectively in all XRD patterns. Thermal
activation plays an important role in the crystallization and modification of
previously present crystalline phases as shown from Figure 4.4c that after
thermal activation number of crystalline phases like quartz, mullite and calcite
become more intense and sharper while magnetite (Fe3O4, ICDD pdf number, 19-

Chapter 4
98
0629) peak at 2θ = 34.85o (Figure 4.4a-b) tends to disappear and converts into
hematite phase (Fe2O3, ICDD pdf number, 33-0664) at high temperature
treatment (Figure 4.4c). Mechanical activation of FA results in decrease in peak
intensities of crystalline phase like quartz, mullite and calcite (Figure 4.4b). In
SrTFA, presence of a crystalline peak at 2θ = 32.3o confirms availability of
crystalline strontium silicate (α-Sr2SiO4, JCPDS 076-1493) phase [46], which is
also consistent with the TEM, SEM and FTIR results.
4.6.6 SEM analysis results
SEM micrographs (Figure 4.5) show the surface morphologies of fly ash
in comparison with the mechanically, thermally and chemically activated fly ash
samples. It can be seen that fly ash mainly consists of spherical particles with
smooth outer surfaces and irregularly shaped unburned carbon particles. The
smooth aluminosilicate spherical particles are formed as a result of
thermochemical transformations of mineral particles during coal combustion
process, where the minerals melt to form small droplets, which upon sudden
cooling and action of surface tension forces adopt the spherical shape [47].
During mechanical activation spherical shape particles break into irregular shape
particles as shown by Figure 4.5b which during thermal activation form clumps
and convert into agglomerated particles Figure 4.5c, this agglomeration is the
main reason of additional crystallinity which is clearly visible in the XRD pattern
of TFA. Shiny clumps of strontium based species on TFA surface (Figure 4.5d)
confirm effective chemical activation, which is also in good agreement with FTIR
and XRD results. EDX results are showing the microchemistry of FA and SrTFA,
given in Table 4.1. In SrTFA increased amount of Sr confirms the successful
loading of different Sr species in the above mentioned forms on TFA surface.

Chapter 4
99
D:\FTIR DATA\smj\Machanically- faj 3h -800 KBr.0 Machanically- faj 3h -800 KBr DRS
D:\FTIR DATA\smj\JMech JFA uncal KBr.0 Mech JFA uncal KBr DRS
D:\FTIR DATA\smj\RAW JFA uncal KBr.0 RAW JFA uncal KBr DRS
02/02/2012
16/05/2013
16/05/2013
38
73.7
7
37
91.1
9
35
53.9
335
39.4
2
34
42.0
3
29
42.8
028
94.9
228
83.8
628
30.6
028
27.2
7
23
47.9
623
43.5
323
42.1
722
51.8
722
41.8
622
41.3
2
19
86.8
419
85.5
819
84.5
318
73.2
918
72.5
118
71.7
116
81.8
916
79.7
416
16.7
316
09.5
516
08.8
715
21.8
515
21.8
014
89.6
3
11
51.9
411
29.2
311
03.0
5
78
0.1
261
4.3
960
2.7
860
1.3
059
4.6
657
4.0
657
2.6
957
2.4
6
100015002000250030003500
Wavenumber cm-1
20
40
60
80
10
0
Tra
nsm
itta
nce
[%
]
Page 1/1
3442
3539
3553
2342
1871
1609
1521
1151
602
a
b
c
Figure 4.2: FTIR spectra of (a) FA, (b) MFA and (c) TFA.
Figure 4.3: FTIR spectra of (a) TFA and (b) SrTFA.
D:\FTIR DATA\smj\JMech JFA uncal KBr.0 Mech JFA uncal KBr DRS
D:\FTIR DATA\smj\SrFA(excess) uncal-KBr.0 SrFA(excess) uncal-KBr DRS
16/05/2013
20/02/2013
38
77.2
9
37
91.1
9
35
53.9
3
34
44.1
3
28
27.2
7
23
46.9
423
43.5
322
42.8
622
41.3
2
19
86.8
819
84.5
3
18
72.5
318
71.7
1
16
79.7
416
77.1
216
17.9
316
08.8
715
21.8
515
21.0
1
11
68.4
911
29.2
3
62
0.3
759
4.6
657
2.6
957
2.6
5
100015002000250030003500
Wavenumber cm-1
20
40
60
80
10
0
Tra
nsm
itta
nce
[%
]
Page 1/1
b 3553
3444
1617
1521
1168
a

Chapter 4
100
Mu
u
0 10 20 30 40 50 60 70 80
2 Theta (in degree)
Mu
Inte
nsi
ty (
a.u
.)
C
C
Q
Q
Q
Sr
Q
H Q C
Q
Q C H
Q M
M Mu
Mu Q
Q
Q
Q Q
(d)
(c)
(b
)
(a)
Mu
Figure 4.4: X-ray diffraction patterns of (a) FA, (b) MFA, (c) TFA and (d)
SrTFA.
(Mu = Mullite, Q = Quartz, C = Calcite, M = Magnetite, H =
Hematite, Sr = Strontium silicate)

Chapter 4
101
Figure 4.5: SEM micrographs of (a) FA, (b) MFA, (c) TFA and (d) SrTFA.
a b
c d
2μm 10μm
2μm 5μm
Chapter 4
102
4.6.7 TEM analysis results
TEM image of FA shows a completely spherical, fine and smooth particle
of fly ash which has been reduced in size after mechanical activation (Figure
4.6b). So, mechanical activation is accountable for the complete removal of
smoothness and sphericity of spherical silica particles. TEM image of SrTFA
(Figure 4.6) shows dark spots of crystalline strontium silicate phase while the
needle like structure may be attributed to the SrCO3 phase [15] .
4.6.8 Basic strength and basicity measurement
The base strength and basicity of SrTFA were determined by the Hammett
indicator method. SrTFA shows basic strength 15<H_<18.4 and basicity was
found to be 1.6 mmol/g.
4.7 Catalytic activity
The catalytic activity of SrTFA catalyst was measured by a single step,
liquid phase, solvent free, microwave irradiated Michael addition reaction of 2-
cyclohexenone with nitromethane under optimized reaction conditions.
Results given in Table 4.4 show that FA, MFA and TFA do not possess
any catalytic activity for Michael addition reaction. SrTFA catalyst under the
given reaction conditions, showed maximum activity. Parameters such as reactant
molar ratio, amount of catalyst, reaction time and temperature were optimized in
order to attain the maximum catalytic activity, conversion and yield of desired
product.
4.7.1 Effect of reaction time
In order to find the reaction time to get highest conversion over SrTFA
catalyst, the reaction was carried out at 90 °C for different time intervals ranging
from 5 minutes to 30 minutes taking nitromethane/2-cyclohexenone molar ratio
2:1 and 2-cyclohexenone to catalyst weight ratio 5:1. It was found that in first 15
minutes of the reaction period the conversion increases linearly up to 96% which
remains unchanged up to 30 minutes (Figure 4.7). The optimized reaction time
was found to be 15 minutes, in which SrTFA catalyst gave highest conversion
96% of nitromethane to 3-nitromethyl cyclohexanone.

Chapter 4
103
Figure 4.6: TEM images of (a) FA, (b) MFA and (c-d) SrTFA.
500 nm 500 nm
a b
c d
100 nm 100 nm

Chapter 4
104
Table 4.4: Catalytic activity of FA, MFA, TFA and SrTFA for Michael
addition reaction of 2-cyclohexenone with nitromethane.
Catalyst Conversion (%) of
nitromethane
Isolated yield (%) of
3-nitromethyl cyclohexanone
FA Nil Nil
MFA Nil Nil
TFA Nil Nil
SrTFA 84 76
Reaction conditions: Temperature 90 °C, Time 10 minute, nitromethane/2-
cyclohexenone molar ratio 2:1, substrate/catalyst weight ratio 5:1.
Figure 4.7: Effect of time on conversion (%) of nitromethane and isolated
yield (%) of 3-nitromethyl cyclohexanone over SrTFA.
Reaction conditions: Temperature 90 °C, nitromethane/2-cyclohexenone molar
ratio 2:1, substrate/catalyst weight ratio 5:1.
4.7.2 Effect of reaction temperature
Optimization of reation temperature to give maximum conversion and
isolated yield (%) was carried out at temperature ranging from 60 °C to 120 °C
for 15 minutes taking nitromethane/2-cyclohexenone molar ratio of 2:1 while
substrate to catalyst weight ratio was 5:1. Conversion and yield were observed to
0
20
40
60
80
100
120
0 5 10 15 20 25 30 35
Time (Minute)
Conversion (%)
Isolated yield

Chapter 4
105
increase on increasing reaction temperature ranging from 60 °C to 90 °C as
depicted from Figure 4.8. The results show that the maximum conversion (96%)
of nitromethane and isolated yield (92%) of 3-nitromethyl cyclohexanone was
found at 90 °C, after which conversion and isolated yield (%) remain almost
steady till 90 °C.
Figure 4.8: Effect of temperature on conversion (%) of nitromethane and
isolated yield (%) of 3-nitromethyl cyclohexanone over SrTFA.
Reaction conditions: Time 15 minutes, nitromethane/2-cyclohexenone molar ratio
2:1, substrate/catalyst weight ratio 5:1.
4.7.3 Effect of substrate/catalyst weight ratio
The influence of substrate to catalyst weight ratio on conversion and
isolated yield (%) was investigated by varying the amount of SrTFA catalyst
under optimized reaction conditions. It can be seen from Table 4.5, only 72%
conversion of nitromethane is achieved at 2-cyclohexenone/SrTFA weight ratio
10:1. On increasing 2-cyclohexenone/SrTFA weight ratio to 5:1, conversion of
nitromethane is increased up to 96% while isolated yield (%) of 3-nitromethyl
cyclohexanone is increased up to 92%. The increase in conversion, with increase
in the catalyst weight can be attributed to an increase in the availability of number
of catalytic active sites required for Michael addition reaction reaction. On further
increase in the amount of catalyst no changes in conversion and isolated yield
(%) are observed.
0
20
40
60
80
100
120
0 20 40 60 80 100 120 140 Temperature (oC)
Conversion (%)
Isolated yield

Chapter 4
106
Table 4.5: Effect of substrate/catalyst weight ratio on conversion (%) of
nitromethane and isolated yield (%) of 3-nitromethyl
cyclohexanone over SrTFA.
nitromethane /SrTFA
weight ratio
Conversion (%) of
nitromethane
Isolated yield (%) of 3-
nitromethyl
cyclohexanone
10:1 72 70
5:1 96 92
2.5:1 96 92
Reaction conditions: Temperature 90 °C, Time 15 minutes, nitromethane/2-
cyclohexenone molar ratio 2:1.
4.7.4 Effect of reactant molar ratio
The synthesis of 3-nitromethyl cyclohexanone was carried out at 90 °C
with various molar ratios of reactants for 15 minutes over SrTFA catalyst under
microwave irradiations. As indicated by Table 4.6, 70% conversion of
nitromethane was observed at 3:1 molar ratio of nitromethane to 2-
cyclohexenone. This may be due to insufficient quantity of the reactants to react
with each other. There was an increase in conversion up to 96% at 2:1 molar ratio
of nitromethane to 2-cyclohexenone at the same reaction conditions. This may be
due to satisfactory reactant quantity on the basic sites of the SrTFA catalyst
surface. The conversion decreased from 72% to 35% on further increasing the
molar ratio from 1:1 to 1:3 which could be attributed to the lacking of
nitromethane for the Michael addition reaction.
4.8 Reaction mechanism
The plausible structure for active basic sites of the SrTFA catalyst is
shown in Scheme 4.3. The reaction mechanism over SrTFA catalyst shows that
Michael addition is an addition of active methylene compounds to α, β-
unsaturated carbonyl compounds (2-cyclohexenone) (Scheme 4.4). Surface
active bronsted basic sites (–Sr-OH) abstract proton from nitromethane and form

Chapter 4
107
anion. The conjugate addition of the formed anion to the 2-cyclohexenone,
followed by the acceptance of a proton produces Michael adduct [48].
Table 4.6: Effect of molar ratio of nitromethane/2-cyclohexenone on
conversion (%) of nitromethane and isolated yield (%) of 3-
nitromethyl cyclohexanone over SrTFA.
Reaction conditions: Temperature 90 °C, Time 15 minutes, substrate/catalyst
weight ratio 5:1.
O
Si
O
Si
O
Si
O
OH
OH
Sr(NO3)2 solution
Calcine at 400 oC for 3 h
Thermally activated fly ash (TFA) SrTFA catalyst surface
O OH
O
O
O
Si
O
Si
O
Si
O
O
O
O O
O
O
Sr
Sr
Sr
OH
OH
OH
Scheme 4.3: The schematic presentation of chemical activation of TFA with
Sr(NO3)2 and proposed structure of SrTFA.
Molar ratio Conversion (%) of
nitromethane
Isolated yield (%) of
3-nitromethyl
cyclohexanone
3:1 70 65
2:1 96 92
1:1 72 70
1:2 48 45
1:3 35 31

Chapter 4
108
Bronsted basic site
H CH2 NO2
CH2 NO2
Nitromethane
Nitromethane anion
O O
Cyclohexenone
O
CH2 NO2
-H2O
O
CH2 NO2
H2O
O
CH2 NO2
Intermediate Intermediate3-nitromethyl cyclohexanone
Conjugate addition
O
Si
O
Si
O
Si
O
O
O
O O
O
O
Sr
Sr
Sr
OH
OH
OH
Thermally activated fly ash (TFA)
Scheme 4.4: Proposed mechanism for Michael addition reaction of 2-
cyclohexenone and nitromethane over SrTFA.

Chapter 4
109
4.9 Catalyst regeneration
After completion of the reaction the catalyst was filtered out by simple
filtration method, washed with acetone and dried in oven at 110 °C for 12 h
followed by thermal activation at 400 °C for 2 h. The regenerated SrTFA catalyst
was used in the next cycle for the synthesis of Michael adduct under microwave
irradiation, to evaluate the reusability of the catalyst. The regenerated catalyst
was found to be having similar activity as fresh catalyst for consecutive four
reaction cycles, giving 92–80% yield in microwave irradiation (Table 4.7) for
Michael addition of 2-cyclohexenone with nitromethane. The FTIR spectrum of
reused SrTFA catalyst after five reaction cycles (Figure 4.9b) resembles that of
fresh SrTFA catalyst (Figure 4.9a) indicating the stability of surface hydroxyl
groups responsible for Bronsted basic sites thus catalytic activity. Due to the
stability of these basic sites SrTFA catalyst was found efficient up to five reaction
cycles giving almost similar yield. The significant decrease in yield after five
reaction cycles is due to the deposition of carbonaceous material on the external
surface of the reused catalyst which may block the active basic sites present on
SrTFA surface.
Table 4.7: Catalytic activity of fresh and regenerated SrTFA catalyst for
Michael addition of 2-cyclohexenone with nitromethane.
Reaction Cycle Isolated yield (%)
I 92
II 88
III 85
IV 81
V 80
Reaction conditions: Temperature 90 °C, Time 15 minutes, substrate/catalyst
weight ratio 5:1, nitromethane/2-cyclohexenone molar ratio 2:1.
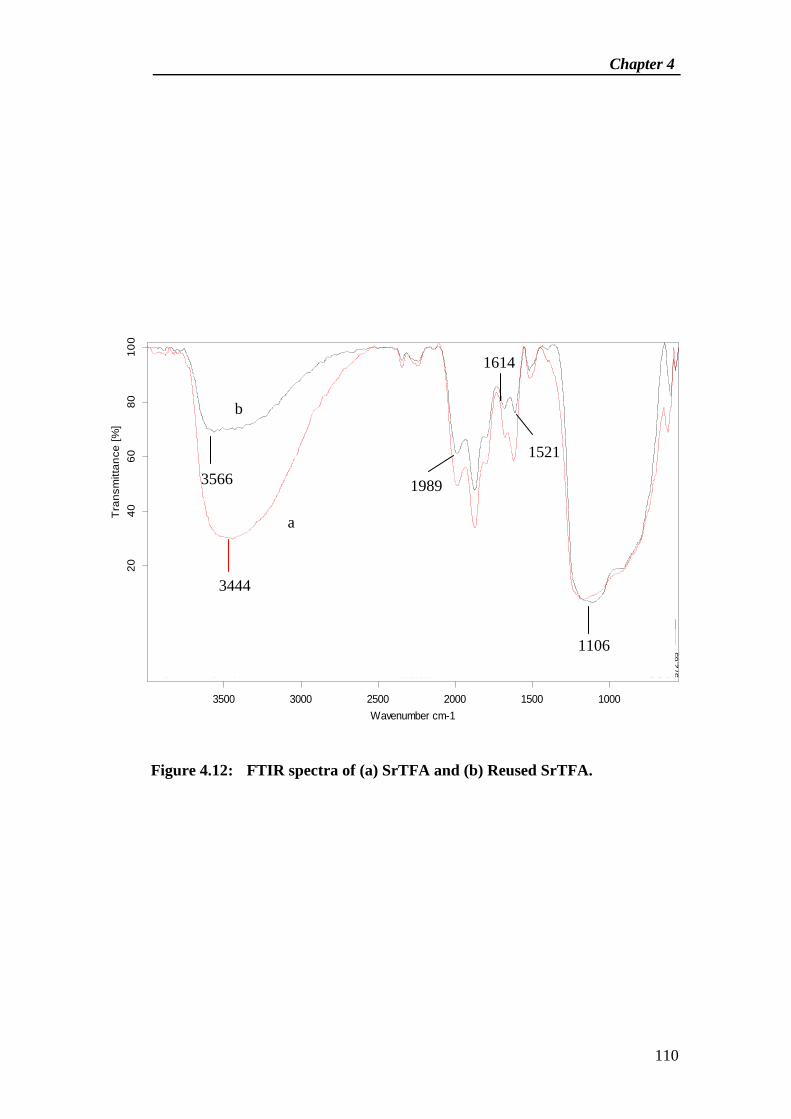
Chapter 4
110
a
b
D:\FTIR DATA\smj\SrFA(excess) uncal-KBr.0 SrFA(excess) uncal-KBr DRS
D:\FTIR DATA\smj\SrFA 400-3h Kbr.0 SrFA 400-3h Kbr DRS
20/02/2013
18/03/2013
38
77.2
9
35
66.0
4
34
44.1
3
23
46.9
423
44.1
622
42.8
622
41.0
7
19
89.7
419
86.8
8
18
72.5
418
72.5
3
16
79.7
216
77.1
216
17.9
316
14.0
015
21.2
315
21.0
114
02.0
1
11
68.4
9
11
06.3
7
62
0.3
760
0.3
157
2.8
157
2.6
5
100015002000250030003500
Wavenumber cm-1
20
40
60
80
10
0
Tra
nsm
itta
nce
[%
]
Page 1/1
3566
3444
1989
1521
1614
1106
Figure 4.12: FTIR spectra of (a) SrTFA and (b) Reused SrTFA.

Chapter 4
111
The study of Michael addition reaction was then further extended to the
several active methylene compounds with 2-cyclohexenone using SrTFA catalyst
under microwave irradiations as well as thermal heating conditions. The results
are summarized in Table 4.8. It is observed by the results (Table 4.8) that in the
synthesis of Michael adduct, yield is considerably increased by microwave
irradiations as compare to thermal heating. Moreover, the microwave synthesis
could be done easily and efficiently at lower temperature in shorter time than in
the thermal heating condition.
Table 4.8: Michael addition of 2-cyclohexenone with active methylene
compounds in presence of SrTFA catalyst under microwave
irradiation and thermal heating.
Entry Michael acceptors ProductIsolated Yield (%)
Thermal
O
NO2
O
1 CH3-NO2 90
2
5
6
OC2H5-NO2
O
NO2
MW
O
O
O O
CN
O
O
O
O
CN
92
91
92
78
79
79
80
Michael donar
(a)
(b)
(c)
(d)
Reaction conditions: Temperature 90 °C (MW), 120°C (thermal heating), Time
15 minutes (MW), 120 minutes (thermal heating), substrate/catalyst weight ratio
5:1, active methylene compound/2-cyclohexenone molar ratio 2:1.

Chapter 4
112
Products were characterized by comparison of their spectroscopic data (1H NMR)
with those reported in the literature.
NMR data of products-
(a). 3-(1-Nitromethyl)cyclohexanone: Colorless oil, 1H-NMR (400 MHz,
CDCl3): δ 1.43-1.56 (m, 1H, CH2), 1.67-1.87 (m, 1H, CH2), 1.94-2.03 (m, 1H,
CH2), 2.07-2.17 (m, 2H, CH2), 2.24-2.33 (m, 1H, CH2), 2.40-2.53 (m, 2H, CH2),
2.58-2.71 (m, 1H, CH), 4.26 (d, J = 7.0 Hz, 1H, CH2NO2), 4.35 (d, J = 6.2 Hz,1H,
CH2NO2).
(b). 3-(1-Nitroethyl)cyclohexanone: Colorless oil, 1 H-NMR (400 MHz,
CDCl3): δ 1.40-1.48 (m, 2H, CH2), 1.57 (d, J = 9.6 Hz, 6H, CH3), 1.85-1.90 (m,
2H, CH2), 1.91-1.97 (m, 2H, CH2), 2.08-2.20 (m, 4H, CH2), 2.25-2.32 (m, 2H,
CH2), 2.39-2.44 (m, 4H, CH2), 2.46-2.48 (m, 2H, CH), 4.44-4.53 (m, 2H,
CHNO2).
(c). 3-(3-Oxocyclohexyl)pentan-2,4-dione: Yellow solid, 1H-NMR (400 MHz,
CDCl3): δ 1.30-1.40 (m, 1H, CH2), 1.62-1.74 (m, 1H, CH2), 1.75-1.82 (m, 1H,
CH2), 1.98-2.06 (m, 2H, CH2), 2.14 (s, 3H, CH3), 2.16 (s, 3H, CH3), 2.20-2.31 (m,
2H, CH2), 2.35-2.41 (m, 1H, CH2), 2.61-2.71 (m, 1H, CHCH2), 3.61 (d,J = 10.4
Hz, 1H, CH(COCH3)2).
(d). 3-Oxocyclohexylphenylacetonitrile: Yellow oil, 1 H-NMR (400 MHz,
CDCl3): δ 1.48-1.63 (m, 4H, CH2), 1.90-1.93 (m, 2H, CH2), 1.96-2.14 (m, 2H,
CH2), 2.15-2.24 (m, 7H, CH2), 2.30-2.35 (m, 3H, CH and CH2), 3.69 (d, J = 4.4
Hz, 1H, CH-CN), 3.83 (d, J = 4.4 Hz, 1H, CH-CN), 7.19-7.25 (m, 4H, ArH),
7.28-7.34 (m, 6H, ArH).
4.10 Conclusion
In summary, we have synthesized the efficient, reusable and novel
strontium nitrate activated fly ash catalyst through mechanical, thermal and
chemical activation of fly ash, for microwave mediated Michael addition of 2-
cyclohexenone with number of active methylene compounds in solvent free
reaction conditions. The prepared catalyst possesses higher basicity due to
increase in stable Bronsted basic sites i.e. -Sr–OH content, was recovered and
reused with small changes in the yield, confirming almost negligible leaching of

Chapter 4
113
active basic sites or deactivation of the catalyst under the mentioned reaction
conditions. The salient features of this protocol are reusability, cost effectiveness,
eco-friendly nature, absence of solvent, shorter reaction time than conventional
reaction condition, operational simplicity and easy product separation in high
yield. The work investigates the structural properties of a novel fly ash supported
solid base catalyst for microwave assisted Michael addition reactions in solvent
free reaction conditions.
4.11 References
[1] M. Gross, M. Soulard, P. Caullet, I. Saude, Microporous Mesoporous
Mater. 104 (2007) 67.
[2] M. Ahmaruzzaman, Prog. Energy Combust. Sci. 36 (2010) 327.
[3] D. Zeng, S. Liu, W. Gong, J. Qiu, H. Chen, G. Wang, Fuel 119 (2014) 202.
[4] I. Acar, M.U. Atalay, Fuel 106 (2013) 195.
[5] D. Jain, C. Khatri, A. Rani, Fuel Process. Technol. 91 (2010) 1015.
[6] M. Gross-lorgouilloux, M. Soulard, P. Caullet, J. Patarin, E. Moleiro, I.
Saude, Microporous Mesoporous Mater. 127 (2010) 41.
[7] S. Katara, S. Kabra, A. Sharma, R. Hada, A. Rani, Int. Res. J. Pure Appl.
Chem. 3 (2013) 299.
[8] J. Tantirungrotechai, S. Thepwatee, B. Yoosuk, Fuel 106 (2013) 279.
[9] M. Koberg, R. Abu-Much, A. Gedanken, Bioresour. Technol. 102 (2011)
1073.
[10] H. Kabashima, T. Katou, H. Hattori, Appl. Catal. A Gen. 214 (2001) 121.
[11] C. Liu, J. Wang, Y. Li, J. Mol. Catal. A Chem. 258 (2006) 367.
[12] H. Atia, M. Richter, U. Armbruster, R. Eckelt, A. Martin, in:, 11 Eur.
Congr. Catal. -EuropaCat-XI, Lyon, France, 2013, pp. 5–6.
[13] Z. Yang, W. Xie, Fuel Process. Technol. 88 (2007) 631.
[14] M. Nargis, H. Jin, M. Bismillah, S. Oh, S. Park, "Applied Catal. A, Gen.
413-414 (2012) 205.
[15] A.P.S. Dias, J. Bernardo, P. Felizardo, M.J.N. Correia, Fuel Process.
Technol. 102 (2012) 146.

Chapter 4
114
[16] A.M. Frey, J. Yang, C. Feche, N. Essayem, D.R. Stellwagen, F. Figueras,
K.P. de Jong, J.H. Bitter, J. Catal. 305 (2013) 1.
[17] C.-L. Chen, C.-C. Huang, D.-T. Tran, J.-S. Chang, Bioresour. Technol. 113
(2012) 8.
[18] J. Li, C. Zhang, X. Cheng, M. Qing, J. Xu, B. Wu, Y. Yang, Y. Li, Appl.
Catal. A Gen. 464-465 (2013) 10.
[19] D. Jain, C. Khatri, A. Rani, Fuel 90 (2011) 2083.
[20] J. Climent, A. Corma, S. Iborra, A. Velty, J. Mol. Catal. A Chem. 183
(2002) 327.
[21] T. Baba, Catal. Surv. from Japan 4 (2000) 17.
[22] R. Bal, K. Chaudhari, S. Sivasanker, Catal. Letters 70 (2000) 75.
[23] S. Sandesh, G. V Shanbhag, Catal. Letters 143 (2013) 1226.
[24] K.T. Paul, S.K.S. Manna, I. Manna, K.K. Chakraborty, N. G B, Nanoscale
Res Lett. 2 (2007) 397.
[25] D. Jain, M. Mishra, A. Rani, Fuel Process. Technol. 95 (2012) 119.
[26] D. Jain, A. Rani, Am. Chem. Sci. J. 1 (2011) 37.
[27] D. Jain, R. Hada, A. Rani, J. Catal. 2013 (2013) 1.
[28] H. Hattori, Chem. Rev. 95 (1995) 537.
[29] H.A. Prescott, Z. Li, E. Kemnitz, A. Trunschke, J. Deutsch, 234 (2005)
119.
[30] H. Keipour, M.A. Khalilzadeh, A. Hosseini, Chinese Chem. Lett. 23 (2012)
537.
[31] J. Li, G. Chen, W. Xu, T. Li, Ultrason. Sonochemistry 10 (2003) 115.
[32] H.S.P. Rao, S. Jothilingam, J. Chem. Sci 117 (2005) 323.
[33] B.D. Mather, K. Viswanathan, K.M. Miller, T.E. Long, Prog. Polym. Sci.
31 (2006) 487.
[34] C. Mukherjee, Anup Kumar Misra, J. Carbohydr. Chem. 26 (2007) 213.
[35] V. Padmavathi, D.R.C.V. Subbaiah, A. Balaiah, B.C.O. Reddy, A.
Padmaja, Indian J. Chem. 44 (2005) 2569.
[36] K. Kordatos, S. Gavela, A. Ntziouni, K.N. Pistiolas, A. Kyritsi, V.K.
Rigopoulou, Microporous Mesoporous Mater. 115 (2008) 189.
[37] R. Rahul, J.K. Satyarthi, D. Srinivas, Indian J. Chem. 50 (2011) 1017.

Chapter 4
115
[38] H. Ma, S. Li, B. Wang, R. Wang, S. Tian, J. Am. Oil Chem. Soc. 85 (2008)
263.
[39] M.M.A. Sekkina, R.M. Issa, A.E.-D.M. Bastawisy, W.A. El Helece, Int. J.
Chem. 2 (2010) 81.
[40] B.J. Saikia, G. Parthasarathy, N.C. Sarmah, G.D. Baruah, Indian Acad. Sci.
31 (2008) 155.
[41] T. Sugama, L. Ecker, T. Butcher, in:, Energy Sci. Technol. Dep.
Brookhaven Natl. Lab. ,Upton, NY 11973-5000, United States, 2010, pp.
1–23.
[42] H. Handa, T. Baba, H. Sugisawa, Y. Ono, J. Mol. Catal. A Chem. 134
(1998) 171.
[43] M.E.G. Frances I. Hurwitz, Denisse V. Aranda, in:, Am. Chem. Soc. 236th
Natl. Meet. Philadelphia, PA, August 20, 2008, 2008.
[44] D. Kishore, S. Kannan, J. Mol. Catal. A Chem. 223 (2004) 225.
[45] B. Yoosuk, P. Krasae, B. Puttasawat, P. Udomsap, N. Viriya-empikul, K.
Faungnawakij, Chem. Eng. J. 162 (2010) 58.
[46] I. Baginskiy, R.S. Liu, C.L. Wang, R.T. Lin, Y.J. Yao, J. Electrochem. Soc.
158 (2011) P118.
[47] S.M. Nyale, O.O. Babajide, G.D. Birch, N. Böke, L.F. Petrik, Procedia
Environ. Sci. 18 (2013) 722.
[48] H. Hattori, Appl. Catal. A Gen. 222 (2001) 247.

Chapter 5
Barium Nitrate Activated Fly Ash: Synthesis, Characterization
and Its Catalytic Application

Chapter 5
116
Abstract
arium nitrate activated fly ash catalyst (BaTFA) has been synthesized by
successive mechanical, thermal and chemical activation of fly ash. The prepared
catalyst was characterized by using various activation techniques viz. N2
adsorption-desorption study, Thermo gravimetric analysis, FTIR spectroscopy, X-
ray diffraction analysis, Scanning electron microscopy, Energy dispersive X-ray
analysis and Transmission electron microscopy. Hammett indicator method was
used to determine the basic strength of the prepared catalyst. The catalytic
behaviour of catalyst was investigated by Claisen-Schmidt condensation reaction
of 4-chlorobenzaldehyde with acetophenone under optimized reaction conditions.
The catalyst gave high conversion (90%) of 4-chlorobenzaldehyde. The BaTFA
catalyst can be regenerated and reused up to four reaction cycles with almost
equal efficiency. The conversion results show that the catalyst possesses sufficient
stable active basic sites responsible for the catalytic activity.
B

Chapter 5
117
5.1 Introduction
he Claisen-Schmidt reaction is a condensation reaction of aldehydes and
carbonyl compounds leading to chalcones or α,β-unsaturated ketone compounds
which possesses diverse pharmacological activities [1]. Chalcones are potentially
important synthetic intermediates for the preparation of flavonoids and various
heterocyclic compounds. They also exhibit biological activities, including
antimitotic, antimalarial, anticancer and anti-inflammatory activity [2].
The Claisen-Schmidt condensation reaction has been reported using a
number of acid and base catalysts. The various types of base catalysts used are
NaOH, KOH, Ba(OH)2, LiHMDS, LiOH.H2O and acids such as RuCl3, TiCl4,
BF3.OEt, dry HCl, SOCl2–EtOH, Zn(bpy)(OAc)2, ZrCl4, bam-boo char sulfonic
acid, BiCl3, clay, ionic liquids and sulfonic acid-functional ionic liquids [3].
As far as alkaline earth metals are considered, basic strength and catalytic
activity of respective metal oxides are found to be following order: BaO> SrO>
CaO> MgO [4]. Various barium species has been reported as valuable catalytic
material for a number of organic reactions viz. oxidative dehydrogenation of
propane by barium hydroxyapatite [5], barium oxide as oxygen-selective
adsorbent [6], rapeseed oil transesterification over barium–aluminium oxide
catalyst [7], ammonia synthesis over Ba-Co/carbon catalyst [8], Wittig –Horner
reaction and crossed Cannizzaro reaction using barium hydroxide etc. [9].
Most of the organic reaction mechanisms, for fine-chemical synthesis,
involve carbanion intermediates. They are formed by abstraction of a proton from
a C–H bond of an organic molecule by a base. Many organic reactions often
require a stoichiometric amount of liquid base to generate carbanions. A number
of drawbacks are associated with the use of liquid bases such as difficult
separation from the reaction mixture after reaction, disposal problems, corrosive
and harmful nature and tedious post reaction work up.
On the other hand heterogeneous base catalysts possess fewer disposal
problems, easier separation from the reaction medium and easier recovery of the
products. A fundamental feature from an industrial point of view is that they are
non corrosive hence offer environmentally benign and more economical pathways
for the synthesis of fine chemicals. Because of these advantages, now researchers
T

Chapter 5
118
are focusing on the solid base catalyzed synthesis of fine chemicals and other
industrially important organic compounds.
The properties and qualities of fly ash have been described in detail in
Chapter 4. Studies report that fly ash; a silico–aluminate material could be a
hopeful siliceous support material for solid base catalyst synthesis. So the present
chapter deals with the synthesis and characterization of barium nitrate activated
fly ash solid base catalyst. The catalytic activity of the prepared catalyst has been
investigated by Claisen-Schmidt condensation reaction of 4-chlorobenzaldehyde
with acetophenone. Mechanically, thermally and chemically activated fly ash has
been converted into atom-efficient, stable, recyclable and easily separable solid
base catalyst. The Claisen-Schmidt reaction was carried out in a conventional
batch reactor in single step, liquid phase and solvent free reaction conditions and
catalyst was reused up to four reaction cycles with approximately similar
efficiency. Thus the prepared catalyst could be a promising candidate to provide a
new path for the use of extensively available fly ash in synthesis of proficient
solid base catalyst.
5.2 Experimental
5.2.1 Materials
Fly ash was collected from Jamshedpur Thermal Power Station,
Jamshedpur (Jharkhand). All chemicals Ba(NO3)2 (99%), NaOH (98%), Na2CO3
(98%) were purchased from Sigma Aldrich and various aldehydes and carbonyl
compounds were purchased from S.D. Fine Chemical Ltd., India. All reagents
used were of analytical grade and used as such.
5.2.2 Catalyst synthesis
As received fly ash (FA) was mechanically activated by using high energy
planetary ball mill. 30 h milled FA showed the higher specific surface area, also
called as mechanically activated fly ash (MFA), was selected for further
activations. Thermally activated fly ash (TFA) was formed by thermally
activating MFA at 800 °C for 3 h, consequently C, S, moisture and other
impurities also get removed [10]. An aqueous solution of Ba(NO3)2 (15 wt%

Chapter 5
119
loading) was added into 10 g TFA. Then the mixture was constantly stirred for 1 h
at 90 oC. Precipitation was done by dropwise addition of mixture of NaOH (3M)
and Na2CO3 (2M) solution (in 1:1 ratio) up to pH = 8 in the above mixture. The
resultant slurry was aged for 24 h then filtered and washed with double distilled
water up to a pH 7 to remove leached compounds, air dried at 110 °C for 24 h and
calcined at 400 °C for 3 h in a muffle furnace under static conditions to form
barium nitrate activated fly ash catalyst (BaTFA) (Scheme 5.1).
5.3 Catalyst characterization
The synthesized FA, MFA, TFA and BaTFA were characterized by N2
adsorption-desorption, TGA, FTIR, XRD, SEM-EDX and TEM techniques.
Instruments details and operating conditions during the characterization are given
in Annexure I.
Hammett indicators like phenolphthalein (pKa=8.2), nile blue (pKa=9.7),
2,4,6-trinitroaniline (pKa=12.2), 2,4-dinitroaniline (pKa=15) and 4-nitroaniline
(pKa=18.4) were used to evaluate the basic strength of BaTFA. Basicity was
measured by a benzoic acid titration method using phenolphthalein indicator [11].
The methods for evaluating basic strength and basicity are given in detail in
Chapter 2.
5.4 Catalytic activity of BaTFA catalyst
The catalytic activity of BaTFA was investigated by Claisen-Schmidt
condensation reaction of 4-chlorobenzaldehyde with acetophenone as shown in
Scheme 5.2. The reaction produces 3-(4-chlorophenyl)-1-phenylprop-2-en-1-one
also known as 4-chlorochalcone. The reaction was carried out in a liquid phase
batch reactor under optimized reaction conditions.
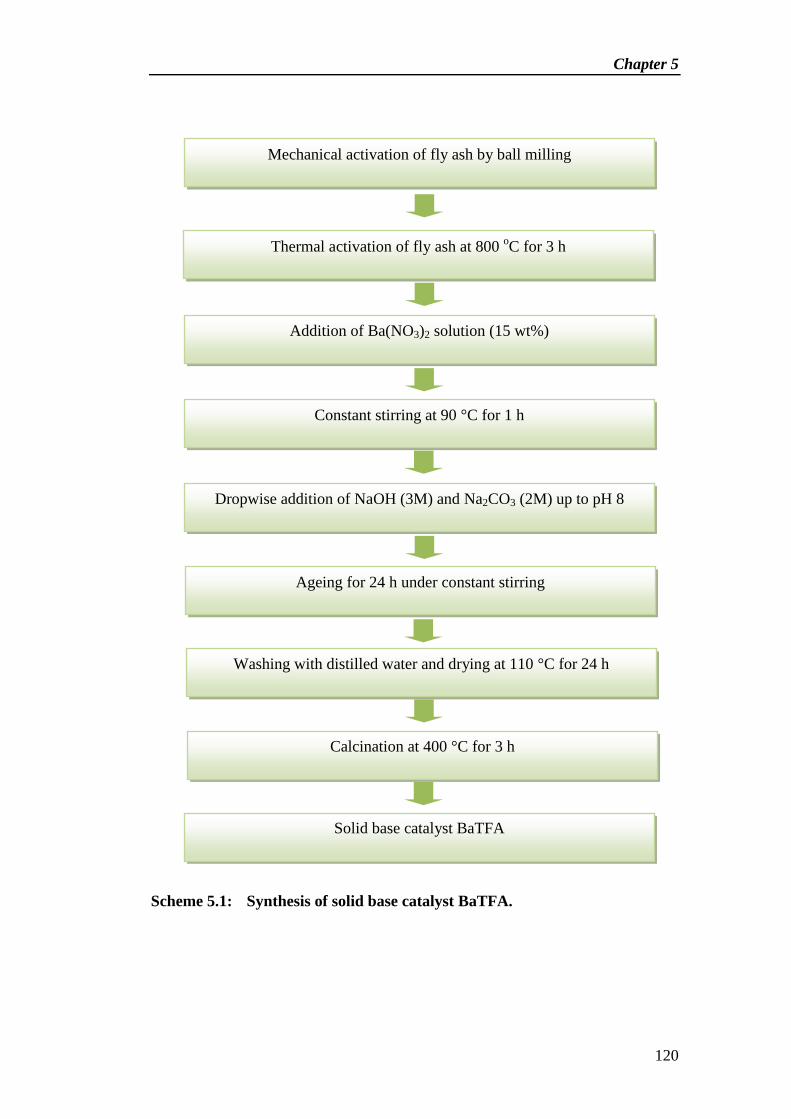
Chapter 5
120
Scheme 5.1: Synthesis of solid base catalyst BaTFA.
Mechanical activation of fly ash by ball milling
Addition of Ba(NO3)2 solution (15 wt%)
Dropwise addition of NaOH (3M) and Na2CO3 (2M) up to pH 8
Constant stirring at 90 °C for 1 h
Ageing for 24 h under constant stirring
Washing with distilled water and drying at 110 °C for 24 h
Calcination at 400 °C for 3 h
Solid base catalyst BaTFA
Thermal activation of fly ash at 800 oC for 3 h
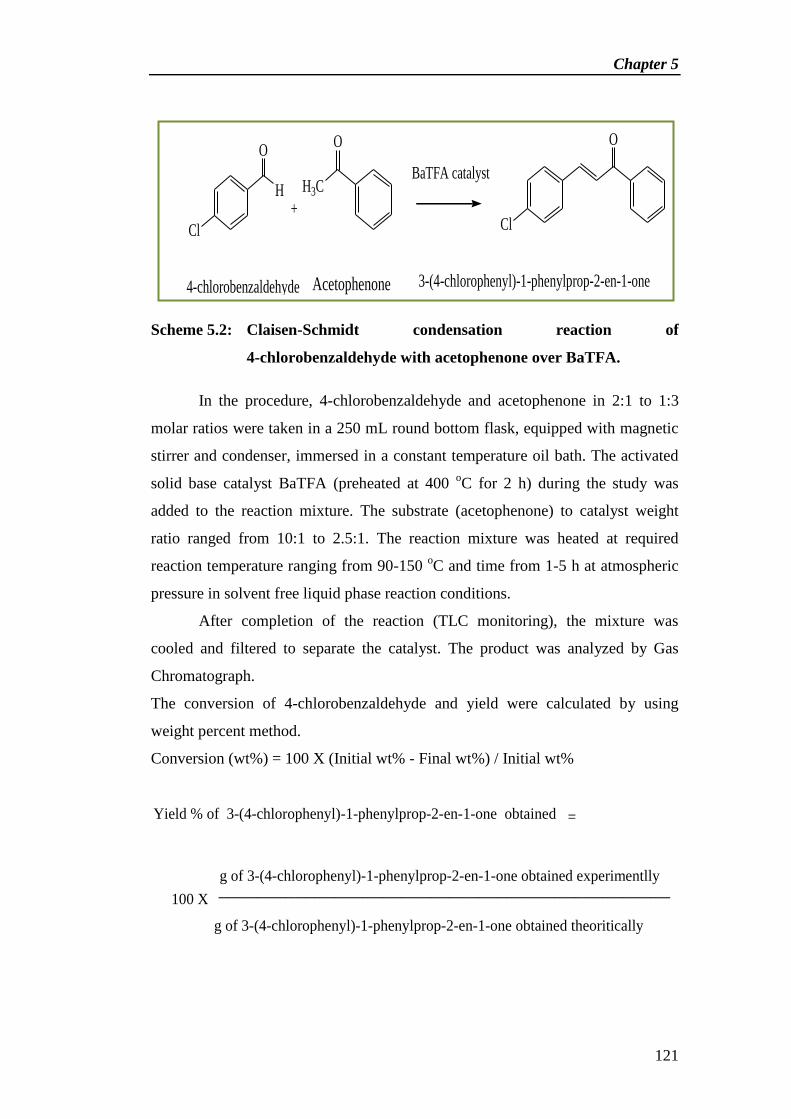
Chapter 5
121
Scheme 5.2: Claisen-Schmidt condensation reaction of
4-chlorobenzaldehyde with acetophenone over BaTFA.
In the procedure, 4-chlorobenzaldehyde and acetophenone in 2:1 to 1:3
molar ratios were taken in a 250 mL round bottom flask, equipped with magnetic
stirrer and condenser, immersed in a constant temperature oil bath. The activated
solid base catalyst BaTFA (preheated at 400 oC for 2 h) during the study was
added to the reaction mixture. The substrate (acetophenone) to catalyst weight
ratio ranged from 10:1 to 2.5:1. The reaction mixture was heated at required
reaction temperature ranging from 90-150 oC and time from 1-5 h at atmospheric
pressure in solvent free liquid phase reaction conditions.
After completion of the reaction (TLC monitoring), the mixture was
cooled and filtered to separate the catalyst. The product was analyzed by Gas
Chromatograph.
The conversion of 4-chlorobenzaldehyde and yield were calculated by using
weight percent method.
Conversion (wt%) = 100 X (Initial wt% - Final wt%) / Initial wt%
Yield % of 3-(4-chlorophenyl)-1-phenylprop-2-en-1-one obtained
100 X_______________________________________________g of 3-(4-chlorophenyl)-1-phenylprop-2-en-1-one obtained experimentlly
=
g of 3-(4-chlorophenyl)-1-phenylprop-2-en-1-one obtained theoritically
+
BaTFA catalystH3C
O
H
O
Cl Cl
O
4-chlorobenzaldehyde Acetophenone 3-(4-chlorophenyl)-1-phenylprop-2-en-1-one
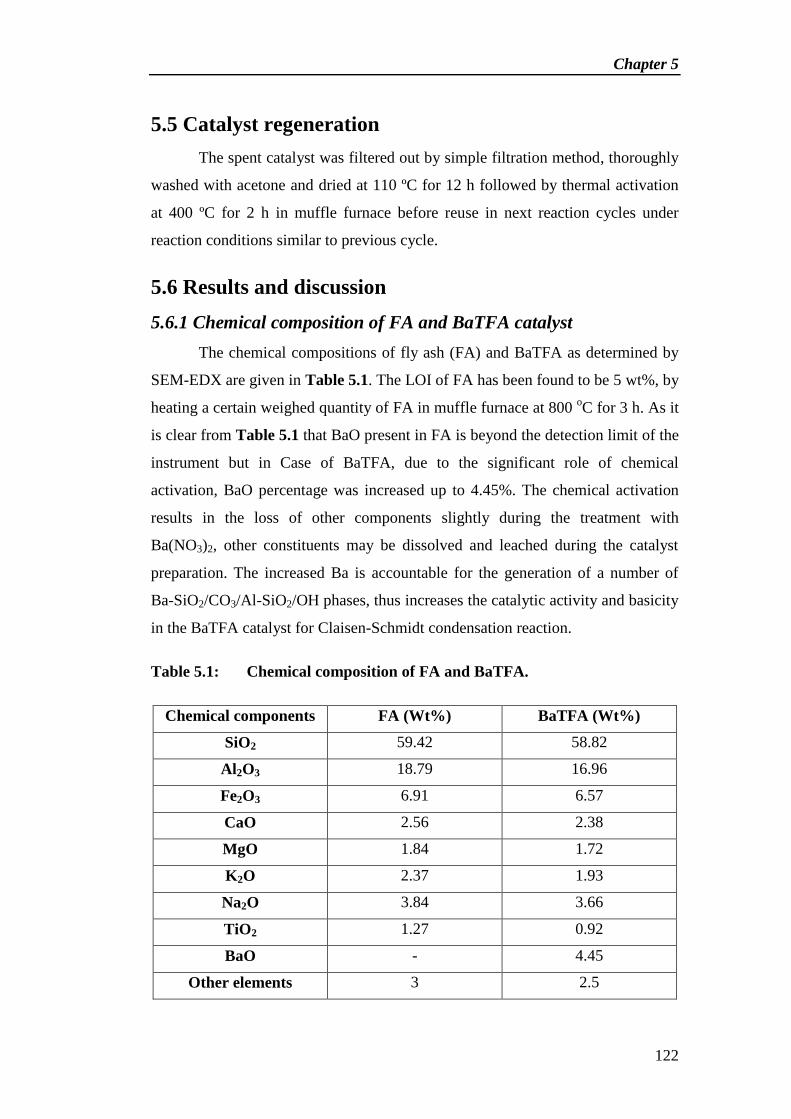
Chapter 5
122
5.5 Catalyst regeneration
The spent catalyst was filtered out by simple filtration method, thoroughly
washed with acetone and dried at 110 ºC for 12 h followed by thermal activation
at 400 ºC for 2 h in muffle furnace before reuse in next reaction cycles under
reaction conditions similar to previous cycle.
5.6 Results and discussion
5.6.1 Chemical composition of FA and BaTFA catalyst
The chemical compositions of fly ash (FA) and BaTFA as determined by
SEM-EDX are given in Table 5.1. The LOI of FA has been found to be 5 wt%, by
heating a certain weighed quantity of FA in muffle furnace at 800 oC for 3 h. As it
is clear from Table 5.1 that BaO present in FA is beyond the detection limit of the
instrument but in Case of BaTFA, due to the significant role of chemical
activation, BaO percentage was increased up to 4.45%. The chemical activation
results in the loss of other components slightly during the treatment with
Ba(NO3)2, other constituents may be dissolved and leached during the catalyst
preparation. The increased Ba is accountable for the generation of a number of
Ba-SiO2/CO3/Al-SiO2/OH phases, thus increases the catalytic activity and basicity
in the BaTFA catalyst for Claisen-Schmidt condensation reaction.
Table 5.1: Chemical composition of FA and BaTFA.
Chemical components FA (Wt%) BaTFA (Wt%)
SiO2 59.42 58.82
Al2O3 18.79 16.96
Fe2O3 6.91 6.57
CaO 2.56 2.38
MgO 1.84 1.72
K2O 2.37 1.93
Na2O 3.84 3.66
TiO2 1.27 0.92
BaO - 4.45
Other elements 3 2.5

Chapter 5
123
5.6.2 Surface area results
Specific surface areas of all sample determined by N2 adsorpion-
desorptions are given in Table 5.2. Specific surface area of FA is considerably
increased on mechanical activation and reaches upto 30.02 m2/g for MFA while it
decreases after thermal activation and reaches up to 28.47 m2/g. Spherical
particles of FA break during the mechanical activation which results in increased
surface area. The crystallite size of FA and MFA were found to be 33 nm and 18
nm respectively.
As it is clear from the pore distribution curve and obtained result that MFA
contains mesopores and macropores (Figure 5.1). But the presence of mesopores
are found to be greater than the macropores. Average pore volume of MFA is 4.76
nm, depicts its mesoporous nature, but the presence of macropores upto a limit
can not be ignored totally. This interesting results are confirming the transition of
macropores to mesopores during mechanical activation step.
As far as isotherm is considered, it is showing a resemblance with Type II
and III, and conferring the transition of macroporous to mesoporous behaviour.
For fly ash, it is not possible to get any of the ideal type of isotherm due to
availability of heterogeneous particles with large variation in size, shape and
porosity arrangements (Figure 5.2) [12].
The BET plots are observed with linear fragment/range for saturation
pressure range (0.08- 0.32) i.e. the pressure observed over (P/Po value) for the
BET equation, which resembles to most of the inorganic silica material (Figure
5.3).
The chemical activation of TFA results into decreased surface area due to
the blockage of its small pores by loading of Ba species [13]. In BaTFA catalyst,
decrease in the surface area facilitates the generation of surface active basic sites
thus catalytic activity (Figure 5.4).

Chapter 5
124
Table 5.2: Surface area of all catalytic materials.
Catalyst Specific surface area
(m2/g)
FA 9.18
FA (10 h milled) 15.14
FA (20 h milled) 22.54
MFA 30.02
TFA 28.47
BaTFA 23.77
Figure 5.1: Pore distribution curve (B.J.H.) of MFA.
Figure 5.2: Isotherm curve of MFA.

Chapter 5
125
Figure 5.3: B.E.T. plot of MFA.
Figure 5.4: Isotherm curve of BaTFA.
5.6.3 Thermogravimetric analysis
TGA curves of FA and BaTFA (Figure 5.5) show weight loss of 5.96%
and 2% respectively, within the temperature range 50-1000°C, are attributed to
water loss and burning of carbonaceous materials and volatilization of some trace
metal oxides and other impurities [14]. Precursor Ba(NO3)2 can attain any of the
phases like Ba(OH)2, BaO, Ba-SiO2/Al-SiO2 and BaCO3 during the catalyst
synthesis. So the slight weight loss in BaTFA may be assigned to the
decomposition of Ba(NO3)2, Ba(OH)2 and BaCO3.
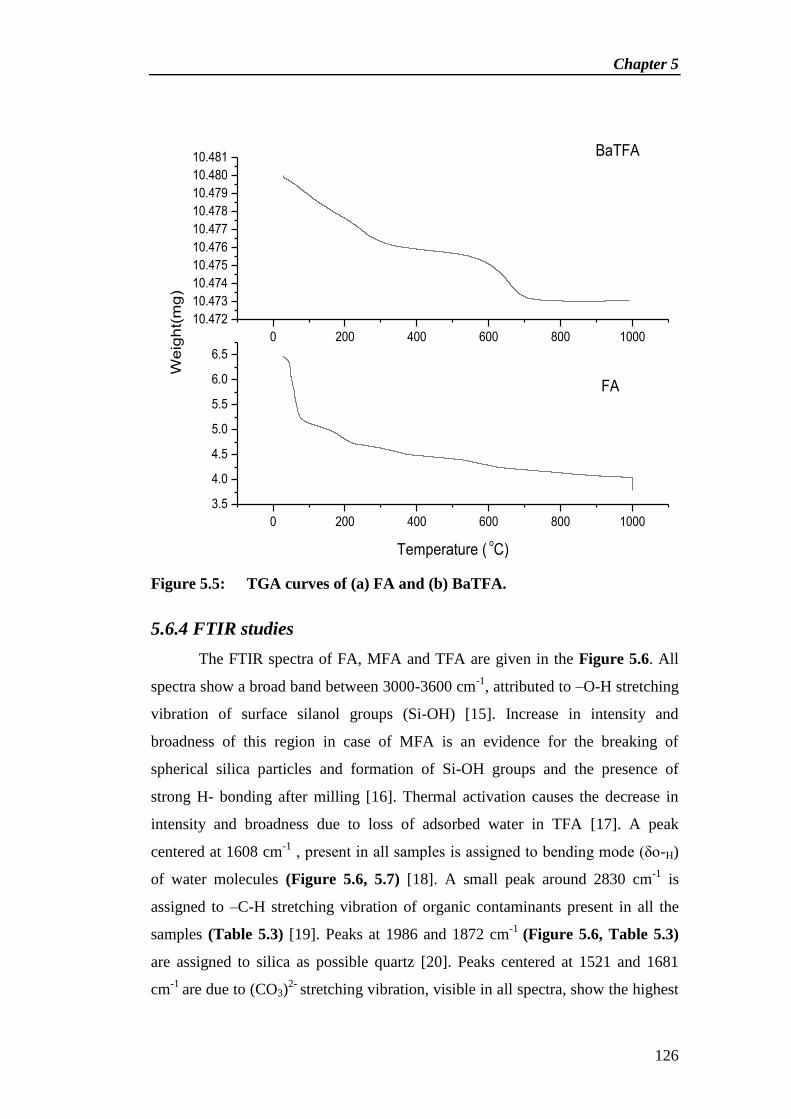
Chapter 5
126
0 200 400 600 800 1000
10.472
10.473
10.474
10.475
10.476
10.477
10.478
10.479
10.480
10.481
0 200 400 600 800 1000
3.5
4.0
4.5
5.0
5.5
6.0
6.5
BaTFA
We
igh
t(m
g)
Temperature ( oC)
FA
Figure 5.5: TGA curves of (a) FA and (b) BaTFA.
5.6.4 FTIR studies
The FTIR spectra of FA, MFA and TFA are given in the Figure 5.6. All
spectra show a broad band between 3000-3600 cm-1
, attributed to –O-H stretching
vibration of surface silanol groups (Si-OH) [15]. Increase in intensity and
broadness of this region in case of MFA is an evidence for the breaking of
spherical silica particles and formation of Si-OH groups and the presence of
strong H- bonding after milling [16]. Thermal activation causes the decrease in
intensity and broadness due to loss of adsorbed water in TFA [17]. A peak
centered at 1608 cm-1
, present in all samples is assigned to bending mode (δo-H)
of water molecules (Figure 5.6, 5.7) [18]. A small peak around 2830 cm-1
is
assigned to –C-H stretching vibration of organic contaminants present in all the
samples (Table 5.3) [19]. Peaks at 1986 and 1872 cm-1
(Figure 5.6, Table 5.3)
are assigned to silica as possible quartz [20]. Peaks centered at 1521 and 1681
cm-1
are due to (CO3)2-
stretching vibration, visible in all spectra, show the highest

Chapter 5
127
intensity in FA and get reduced after thermal activation confirming the removal of
carbonate or carbonate like species during thermal activation [21,22]. A broad
band between 1103-1165 cm-1
is attributed to Si-O-Si asymmetric stretching
vibration [22]. A peak at approx ~ 600 cm-1
is attributed to Si-O-Al stretching
vibration (Figure 5.6, 5.7) [23].
FTIR spectrum of BaTFA (Figure 5.7b) shows the broader and much
intense band in the region of 3000-3600 cm-1
as compared to TFA. The increased
intensity could be assigned to generation of Si-OH groups as well as to Si/Al-O-
Ba-OH groups during the chemical activation while H- bonding is responsible for
the broadness of the band between these groups. The increased OH groups are
responsible for the Bronsted basic sites which initiate the reaction by abstracting
the proton from methyl group [24]. There is also possibility of BaO, Ba(OH)2 and
BaCO3 formation on TFA surface [25]. In BaTFA clearly visible sharp band
centered at 1435 cm-1
is assigned to different Ba species, confirms the proper
loading of Ba in different chemical phases [26]. Ba(OH)2 and BaCO3 formation
could be assigned due to the absorption of water vapour [27] and CO2 from
environment [28] by BaO compound or they may generate during the catalyst
synthesis step.

Chapter 5
128
Figure 5.6: FTIR spectra of (a) FA, (b) MFA and (c) TFA.
Figure 5.7: FTIR spectra of (a) TFA and (b) BaTFA.
D:\FTIR DATA\smj\Machanically- faj 3h -800 KBr.0 Machanically- faj 3h -800 KBr DRS
D:\FTIR DATA\smj\JMech JFA uncal KBr.0 Mech JFA uncal KBr DRS
D:\FTIR DATA\smj\RAW JFA uncal KBr.0 RAW JFA uncal KBr DRS
02/02/2012
16/05/2013
16/05/2013
38
73.7
7
37
91.1
9
35
53.9
335
39.4
2
34
42.0
3
29
42.8
028
94.9
228
83.8
628
30.6
028
27.2
7
23
47.9
623
43.5
323
42.1
722
51.8
722
41.8
622
41.3
2
19
86.8
419
85.5
819
84.5
318
73.2
918
72.5
118
71.7
116
81.8
916
79.7
416
16.7
316
09.5
516
08.8
715
21.8
515
21.8
014
89.6
3
11
51.9
411
29.2
311
03.0
5
78
0.1
261
4.3
960
2.7
860
1.3
059
4.6
657
4.0
657
2.6
957
2.4
6
100015002000250030003500
Wavenumber cm-1
20
40
60
80
10
0
Tra
nsm
itta
nce
[%
]
Page 1/1
1151
1521
3553 c
3539 1609
3442
b a
2830 602
D:\FTIR DATA\smj\JMech JFA uncal KBr.0 Mech JFA uncal KBr DRS
D:\FTIR DATA\smj\BaFA..400-3h KBr.0 BaFA..400-3h KBr DRS
16/05/2013
01/05/2013
39
27.6
2
37
91.1
937
74.5
1
36
09.4
035
53.9
3
31
72.0
9
28
87.6
228
27.2
728
26.4
2
24
55.5
4
23
57.1
223
43.5
323
00.5
422
41.3
2
19
85.9
819
84.5
3
18
72.8
118
71.7
117
96.3
317
58.4
6
16
83.3
516
79.7
416
09.4
316
08.8
7
15
21.8
5
14
35.1
4
11
65.6
111
29.2
3
59
6.4
659
4.6
657
2.6
9
100015002000250030003500
Wavenumber cm-1
20
40
60
80
10
0
Tra
nsm
itta
nce
[%
]
Page 1/1
1435
1165 2826 3609
1683
1609

Chapter 5
129
Table 5.3: The observed transmission frequencies (cm-1
) of Fourier
transform infrared spectra of FA, MFA, TFA, BaTFA and
reused BaTFA and their assignments.
Assignments RFA MFA TFA BaTFA Reused
BaTFA Ref.
Si-O-Al stretching
vibration 602 601 594 596 595 23
Si-O-Si asymm.
stretching
vibration
1151 1103 1129 1165 1118 22
(CO3)2-
stretching
vibration
1521,
1681 1521
1521,
1679 1683 1680 21, 22
H-O-H bending
vibration 1609 1616 1608 1609 1607 18
-C–H stretching
vibration 2830 2854 2827 2826 2827 19
-O-H stretching
vibration 3539 3442 3553 3609 3611 15
5.6.5 X-ray diffraction studies
The XRD patterns of FA, MFA, TFA and BaTFA are given in Figure 5.8.
Quartz exhibits peaks at 2θ = 20.7o, 26.5
o, 40.66
o and 49.96
o (SiO2, ICDD pdf
number 000- 46-1045) while peaks at 2θ = 33.4o
and 16.4 o
confirm the presence
of calcite (CaCO3, ICDD pdf number, 47-1743) and mullite (Al6Si2O13, ICDD pdf
number 000-15-0776) respectively in all XRD patterns (Figure 5.8). After
mechanical activation of FA peak intensities of crystalline phases like quartz,
mullite and calcite get decreased (Figure 5.8b). Contrary on thermal activation
respective peaks of different phases like quartz, mullite and calcite become more
Chapter 5
130
intense and sharper while magnetite (Fe3O4, ICDD pdf number, 19-0629) peak at
2θ = 34.85o (Figure 5.8a-b) tends to disappear and converts into hematite phase
(Fe2O3, ICDD pdf number, 33-0664) at high temperature treatment (Figure 5.8c).
In BaTFA, presence of a broad peak at around 2θ = 24o confirms availability of
witherite (BaCO3, JCPDS file no. 71-2394) [29] and hexacelsian (BaAl2Si2O8,
JCPDS files No 88-1049) [30,31]. Peaks around 24o, 42
o, 45
o and 47
o are assigned
to barium silicate (BaSi2O5.(H2O)3) [32] while combined small peaks at 2θ =
32.7o and 33.04
o are attributed to barium silicates (BaSi2O5, Ba2SiO4) [26] and
BaO [33]. The XRD results are in good agreement with the TEM, SEM and FTIR
results.
5.6.6 SEM analysis results
Figure 5.9 shows the surface morphologies of FA, MFA, TFA and BaTFA
samples. It can be seen that fly ash mainly consists of spherical particles with
smooth outer surfaces and irregularly shaped unburned carbon particles [34].
During mechanical activation spherical shaped particles of FA break into irregular
shaped particles as depicted in Figure 5.9b, which form clumps and convert into
agglomerated particles during thermal activation Figure 5.9c, this agglomeration
is the main reason of additional crystallinity which is clearly visible in the XRD
pattern of TFA. Shiny clumps of hexacelsian, witherite and barium oxide on TFA
surface (Figure 5.9d) confirm successful loading of Ba in the above mentioned
forms on TFA surface.
5.6.7 TEM analysis results
TEM image of FA shows a completely spherical, fine and smooth particle
of fly ash which has been reduced in size after mechanical activation (Figure
5.10b). So, mechanical activation is accountable for the complete removal of
smoothness and sphericity. BaTFA (Figure 5.10) shows dark spots of loaded Ba
species (Figure 5.10c) and rod like grains could be assigned to hexacelsian
(BaAl2Si2O8) (Figure 5.10d) [27, 28], BaCO3 [35] and BaO [36] .

Chapter 5
131
Figure 5.8: XRD patterns of (a) FA, (b) MFA, (c) TFA and (d) BaTFA.
[Mu = Mullite, Q = Quartz, C = Calcite, M = Magnetite, H =
Hematite, Ba-1 = Hexacelsian (BaAl2Si2O8), witherite (BaCO3)
and barium silicate (BaSi2O5.(H2O)3), Ba-2 = Barium silicate
(BaSi2O5, Ba2SiO4) and BaO]
0 10 20 30 40 50 60 70 80
2 Theta (in degree)
C
(d)
Q M
u
u
Q
(c)
(b)
(a)
Q
Q H
M
H
M
Q
Q
Q
Q Mu
Mu
Mu
Q
Q
C
C
C
Q
Q
Q
Ba-1
Ba-2
Inte
nsi
ty (
a.u
.)

Chapter 5
132
Figure 5.9: SEM micrographs of (a) FA, (b) MFA, (c) TFA and (d) BaTFA.
a b
c d
2μm 10μm
2μm 5μm

Chapter 5
133
Figure 5.10: TEM images of (a) FA (b) MFA and (c-d) BaTFA.
500 nm 500 nm
500 nm 500 nm
a b
d
100 nm 100 nm
c

Chapter 5
134
5.6.8 Basic strength and basicity measurement
The base strength and basicity of BaTFA were determined by the
Hammett indicator method. BaTFA shows basic strength 15<H_<18.4 and
basicity 1.5 mmol/g.
5.7 Catalytic activity
The catalytic activity of BaTFA catalyst was investigated by Claisen-
Schmidt condensation reaction of acetophenone with 4-chlorobenzaldehyde in
batch reactor under optimized reaction conditions.
Results summarized in Table 5.4 show that FA, MFA and TFA do not
show any catalytic activity for Claisen-Schmidt condensation reaction while
BaTFA catalyst under the given reaction conditions, showed maximum activity.
On catalyst surface super basic sites Ba2+
O2-
can exist at high temperature while
Bronsted basic sites Ba-OH can exist at low temperature. Claisen-Schmidt
condensation reaction is Bronsted base (-OH-) catalyzed reaction. Therefore
BaTFA catalyst is sufficiently active for the same reaction even at low calcination
temperature at 400 oC, owing high amount of Bronsted basic sites Ba-OH [4].
Various parameters such as reactant molar ratio, amount of catalyst, reaction time
and temperature were optimized, for getting the maximum catalytic activity,
conversion and yield of desired product.
5.7.1 Effect of reaction time
The effect of reaction time variation on the conversion (%) of 4-
chlorobenzaldehyde and product yield was studied in time range of 1-5 h at 130
°C by taking 4-chlorobenzaldehyde/acetophenone molar ratio 1:1 and
acetophenone to catalyst weight ratio 5:1. The conversion continuously increased
up to 90 % in initial 3 h and remained constant for the next 2 h (Figure 5.11). The
optimized reaction time was found to be 3 h for the reaction.

Chapter 5
135
Table 5.4: Catalytic activity of FA, MFA, TFA and BaTFA for Claisen-
Schmidt condensation reaction of 4-chlorobenzaldehyde with
acetophenone.
Catalyst Conversion (%) of
4-chlorobenzaldehyde
Isolated yield (%) of
4-chlorochalcone
FA Nil Nil
MFA Nil Nil
TFA Nil Nil
BaTFA 77 73
Reaction conditions: Temperature 130 °C, Time 3 h, 4-
chlorobenzaldehyde/acetophenone molar ratio 1:1, substrate/catalyst weight ratio
5:1.
Figure 5.11: Variation in isolated yield (%) and conversion (%) of 4-
chlorobenzaldehyde with time.
Reaction conditions: Temperature 130 °C, 4-chlorobenzaldehyde/acetophenone
molar ratio 1:1, substrate/catalyst weight ratio 5:1.
5.7.2 Effect of reaction temperature
Optimization of reaction temperature for maximum conversion (%) and
isolated yield (%) was carried out at temperature ranging from 90 °C to 150 °C for
3 h taking 4-chlorobenzaldehyde/acetophenone molar ratio of 1:1 while substrate
0
20
40
60
80
100
0 1 2 3 4 5 6
Time (h)
Conversion (%)
Isolated yield (%)

Chapter 5
136
to catalyst weight ratio was 5:1. Conversion and yield were observed to increase
on increasing reaction temperature ranging from 90 °C to 130 °C as depicted from
Figure 5.12. The results show that the maximum conversion (90%) of 4-
chlorobenzaldehyde and isolated yield (86%) of 4-chlorochalcone were found at
130 °C, after which conversion and isolated yield (%) remain almost steady till
150 °C.
Figure 5.12: Variation in isolated yield (%) and conversion (%) of 4-
chlorobenzaldehyde with temperature.
Reaction conditions: Time 3 h, 4-chlorobenzaldehyde/acetophenone molar ratio
1:1, substrate/catalyst weight ratio 5:1.
5.7.3 Effect of substrate/catalyst weight ratio
The influence of substrate to catalyst weight ratio on conversion and
isolated yield (%) was studied by varying the amount of BaTFA catalyst under
optimized reaction conditions. Only 77% conversion of 4-chlorobenzaldehyde is
achieved at 2-cyclohexenone/BaTFA weight ratio 10:1 while conversion reached
to 90% in case of 5:1 substrate/catalyst weight ratio. The increase in conversion,
with increase in the catalyst weight can be attributed to an increase in the
availability of number of catalytic active sites required for Claisen-Schmidt
condensation reaction. On further increase in the amount of catalyst no changes in
conversion and isolated yield (%) were observed (Figure 5.13).
0
20
40
60
80
100
80 90 100 110 120 130 140 150
Temperature (oC)
Conversion (%)
Isolated yield (%)

Chapter 5
137
Figure 5.13: Effect of substrate/catalyst weight ratio on conversion (%) of 4-
chlorobenzaldehyde and isolated yield (%) of 4-chlorochalcone
over BaTFA.
Reaction conditions: Temperature 130 °C, Time 3 h, 4-
chlorobenzaldehyde/acetophenone molar ratio 1:1.
5.7.4 Effect of reactant molar ratio
The effect of reactant’s molar ratio was studied in order to attain the most
favorable molar ratio for the reaction. As indicated by Figure 5.14, 62 %
conversion of 4-chlorobenzaldehyde was observed at 2:1 molar ratio of 4-
chlorobenzaldehyde to 2-cyclohexenone. This may be due to insufficient quantity
of the reactants to react with each other. There was an increase in conversion up to
90% at 1:1 molar ratio of 4-chlorobenzaldehyde to acetophenone at the same
reaction conditions. This may be due to satisfactory reactant quantity on the basic
sites of the BaTFA catalyst surface. The conversion decreased from 90-87% on
further increasing the molar ratio from 1:2 to 1:3 which could be attributed to the
lacking of 4-chlorobenzaldehyde or self condensation of acetopheneone.
0
10
20
30
40
50
60
70
80
90
10:01 05:01 2.5:1
Conversion (%)
Isolated yield (%)

Chapter 5
138
Figure 5.14: Effect of molar ratio of 4-chlorobenzaldehyde/acetophenone on
conversion (%) of 4-chlorobenzaldehyde and isolated yield (%)
of 4-chlorochalcone over BaTFA.
Reaction conditions: Temperature 130 °C, Time 3 h, substrate/catalyst weight
ratio 5:1.
5.8 Reaction mechanism
The plausible structure of BaTFA catalyst surface is shown in Scheme 5.3.
The reaction mechanism over BaTFA catalyst shows that Claisen-Schmidt is a
condensation reaction (Scheme 5.4) [9]. Surface active Bronsted basic sites (–Ba-
OH) abstract proton from acetophenone and form anion. The nucleophilic
addition of the formed anion to the 4-chlorobenzaldehyde, followed by the
successive protonation and dehydration produces 3-(4-chlorophenyl)-1-
phenylprop-2-en-1-one or 4-chlorochalcone [37].
5.9 Catalyst regeneration
The regeneration reaction reflects that BaTFA catalyst can be regenerated
by simple thermal regeneration method and retains the catalyst activity. The
regenerated catalyst was found to be having similar activity as fresh catalyst for
consecutive four reaction cycles, giving 86-79% yield (Table 5.5) for Claisen-
Schmidt condensation of acetophenone with 4-chlorobenzaldehyde. The FTIR
spectrum of reused BaTFA catalyst after five reaction cycles (Figure 5.15b)
resembles that of fresh BaTFA catalyst (Figure 5.15a) indicating the stability of
0
10
20
30
40
50
60
70
80
90
02:01 01:01 01:02 01:03
Conversion (%)
Isolated yield (%)

Chapter 5
139
surface hydroxyl groups responsible for Bronsted basic sites thus catalytic
activity. Due to the stability of these basic sites BaTFA catalyst was found
efficient up to five reaction cycles giving almost similar yield. The gradual
decrease in yield after five reaction cycles is due to the deposition of
carbonaceous material on the surface of the reused catalyst which may block the
active basic sites of BaTFA catalyst.
Leaching test was done using hot filtration technique. The catalyst was
removed after 30 min and the reaction was continued to completion but no further
product was formed. This led us to the conclusion that no leaching occurs with the
catalysts used and under the conditions applied in the present investigation.
Table 5.5: Catalytic activity of fresh and regenerated BaTFA catalyst for
Claisen-Schmidt condensation of 4-chlorobenzaldehyde with
acetophenone.
Reaction Cycle Isolated yield (%)
I 86
II 83
III 80
IV 80
V 79
Reaction conditions: Temperature 130 °C, Time 3 h, substrate/catalyst weight
ratio 5:1, 4-chlorobenzaldehyde/acetophenone molar ratio 1:1.
We extend the study of Claisen-Schmidt reaction to various substrates,
including different aromatic aldehydes and ketone compounds. The results are
listed in Table 5.6. All the reactions occurred in solvent free conditions within 3-
3.5 h at 130 oC maintaining the reactant molar ratio 1:1, substrate/catalyst weight
ratio 5:1.

Chapter 5
140
Scheme 5.3: The schematic presentation of chemical activation of TFA with
Ba(NO3)2 and proposed structure of BaTFA.

Chapter 5
141
Bronsted basic site
- H2O
BaTFAcatalyst surface
H O
Cl
H2O
- H2O
Enolate ion
4-chlorobenzaldehyde
Nucleophilic addition
Dehydration
Protonation
H3C
O
H2C
O
OO
Cl
OOH
Cl
O
Cl
3-(4-chlorophenyl)-1-phenylprop-2-en-1-one
3-(4-chlorophenyl)-3-hydroxy-1-phenylpropan-1-one
Acetophenone
OH
Ba
Scheme 5.4: Proposed mechanism for Claisen-Schmidt condensation
reaction of 4-chlorobenzaldehyde with acetophenone over
BaTFA.
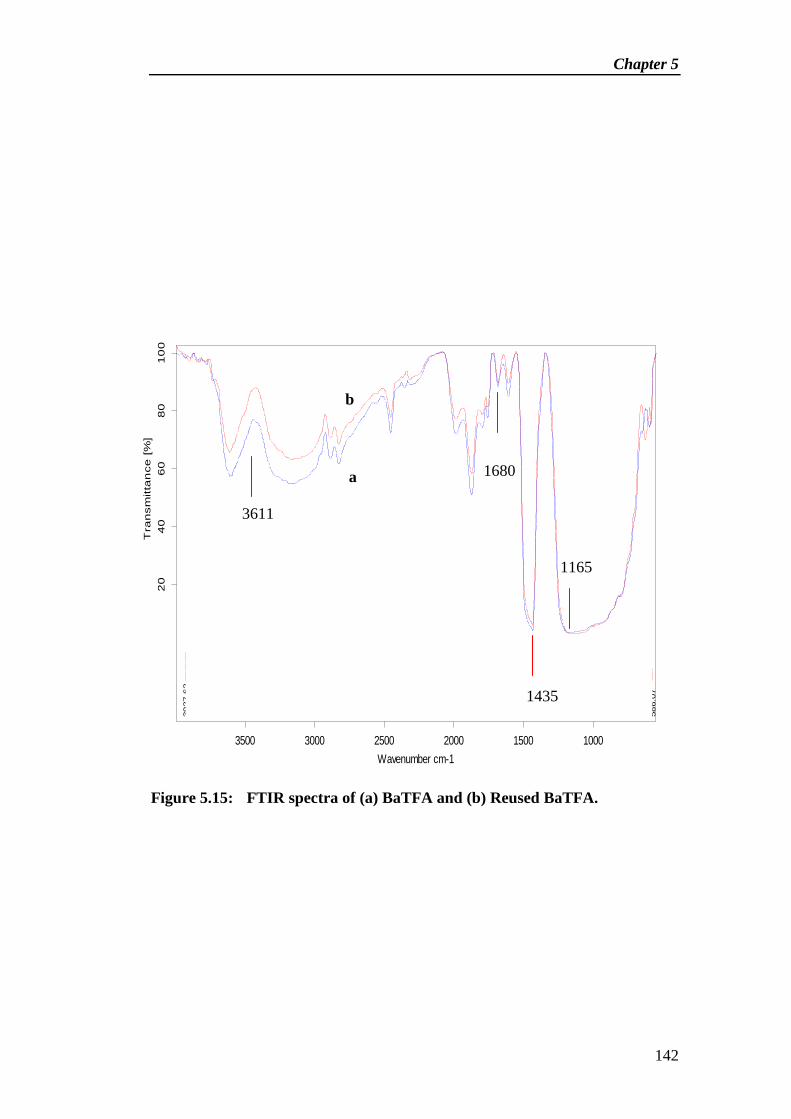
Chapter 5
142
Figure 5.15: FTIR spectra of (a) BaTFA and (b) Reused BaTFA.
D:\FTIR DATA\smj\BaFA..400-3h KBr.0 BaFA..400-3h KBr DRS
D:\FTIR DATA\smj\BaFA...400-3h KBr.0 BaFA...400-3h KBr DRS
01/05/2013
01/05/2013
39
27.6
238
98.8
538
33.6
937
74.5
1
36
11.5
836
09.4
0
31
72.0
931
70.1
9
28
87.6
228
84.3
928
27.9
928
26.4
2
24
55.7
324
55.5
423
57.1
223
13.8
023
00.5
4
19
87.5
519
85.9
8
18
73.1
618
72.8
117
96.5
117
96.3
317
59.2
117
58.4
616
83.3
516
80.8
616
09.4
316
07.8
914
35.9
314
35.1
4
11
65.6
111
18.6
3
62
6.2
059
6.4
658
6.0
7
100015002000250030003500
Wavenumber cm-1
20
40
60
80
10
0
Tra
nsm
itta
nce
[%
]
Page 1/1
1680
3611
1165
1435
b
a

Chapter 5
143
Table 5.6: Claisen-Schmidt condensation of various aromatic aldehyde
with ketones in presence of BaTFA.
Entry Ketone Aromatic Aldehyde Product Time (h) IsolatedYield (%)
1
2CH3
O
CH3
CH3
3CH3
O
CHO
CHO
NO2 ONO2
a
b
c
3
3
3.5
85
94
85
O
CH3
O
OH
HCO
OCH3
OH
O
OCH3
Reaction conditions: Temperature 130 °C, substrate/catalyst weight ratio 5:1, 4-
chlorobenzaldehyde/acetophenone molar ratio 1:1.
5.10 Conclusion
The recyclable solid base catalyst BaTFA has been synthesized in this
chapter. The use of fly ash as solid support material makes the catalyst cost
effective as well as provides a path for the utilization of fly ash, which is
increasing day by day at an alarming rate. The characterization results prove the
catalyst as efficient for base catalyzed reactions. The catalytic activity of BaTFA
has been investigated by Claisen-Schmidt condensation reaction. The prepared
catalyst has stable Bronsted basic sites i.e. -Ba–OH content, was recovered,
regenerated and reused with no noticeable changes in the yield, confirming almost
negligible leaching of active basic sites or slight deactivation of the catalyst under

Chapter 5
144
the mentioned reaction conditions. So, the prepared BaTFA catalyst is stable, eco-
friendly, cost effective, reusable, easily recoverable and suitable for the
production of 4-chlorochalcone.
5.11 References
[1] A. Gómez-rivera, H. Aguilar-mariscal, N. Romero-ceronio, L.F. Roa-de,
C.E. Lobato-garcía, Bioorg. Med. Chem. Lett. 23 (2013) 5519.
[2] A. Davoodnia, G. Yassaghi, Chinese J. Catal. 33 (2012) 1950.
[3] J.K. Rajput, G. Kaur, Tetrahedron Lett. 53 (2012) 646.
[4] G. Zhang, H. Hattori, K. Tanabe, Appl. Catal. 36 (1988) 189.
[5] S. Sugiyama, T. Shono, E. Nitta, H. Hayashi, Appl. Catal. A Gen. 211
(2001) 123.
[6] J. Park, Y. Cho, K. Yi, S. Han, S. Cho, Appl. Surf. Sci. 256 (2010) 5528.
[7] S.G. Zavarukhin, A.S. Ivanova, R.G. Kukushkin, A.N. Simonov, O. V
Sherstyuk, V.A. Yakovlev, L.I. Trusov, Catal. Ind. 5 (2013) 342.
[8] W. Raróg-pilecka, E. Miskiewicz, L. Kepinski, Z. Kaszkur, K. Kielar, Z.
Kowalczyk, J. Catal. 249 (2007) 24.
[9] A. Aguilera, A.R. Alcantara, J.M. Marinas, J. V Sinisterra, Can. J. Chem.
65 (1987) 1165.
[10] K. Kordatos, S. Gavela, A. Ntziouni, K.N. Pistiolas, A. Kyritsi, V.K.
Rigopoulou, Microporous Mesoporous Mater. 115 (2008) 189.
[11] R. Rahul, J.K. Satyarthi, D. Srinivas, Indian J. Chem. 50 (2011) 1017.
[12] J.B. Condon, Surface Area and Porosity Determinations by Physisorption
Measurements and Theory, First edit, Elsevier, Netherlands, 2006.
[13] H. Ma, S. Li, B. Wang, R. Wang, S. Tian, J. Am. Oil Chem. Soc. 85 (2008)
263.
[14] M.M.A. Sekkina, R.M. Issa, A.E.-D.M. Bastawisy, W.A. El Helece, Int. J.
Chem. 2 (2010) 81.
[15] D. Jain, A. Rani, Am. Chem. Sci. J. 1 (2011) 37.
[16] C. Khatri, A. Rani, Fuel 87 (2008) 2886.
[17] D. Jain, C. Khatri, A. Rani, Fuel 90 (2011) 2083.

Chapter 5
145
[18] S. Kabra, S. Katara, A. Rani, Int. J. Innov. Res. Sci. Eng. Technol. 2 (2013)
4319.
[19] S. Katara, S. Kabra, A. Sharma, R. Hada, A. Rani, Int. Res. J. Pure Appl.
Chem. 3 (2013) 299.
[20] T. Sugama, L. Ecker, T. Butcher, in:, Energy Sci. Technol. Dep.
Brookhaven Natl. Lab. ,Upton, NY 11973-5000, United States, 2010, pp.
1–23.
[21] H. Handa, T. Baba, H. Sugisawa, Y. Ono, J. Mol. Catal. A Chem. 134
(1998) 171.
[22] B.J. Saikia, G. Parthasarathy, N.C. Sarmah, G.D. Baruah, Indian Acad. Sci.
31 (2008) 155.
[23] M.E.G. Frances I. Hurwitz, Denisse V. Aranda, in:, Am. Chem. Soc. 236th
Natl. Meet. Philadelphia, PA, August 20, 2008, 2008.
[24] D. Kishore, S. Kannan, J. Mol. Catal. A Chem. 223 (2004) 225.
[25] A.P.S. Dias, J. Bernardo, P. Felizardo, M.J.N. Correia, Fuel Process.
Technol. 102 (2012) 146.
[26] E. Kaya, N. Oktar, G. Karakas, K. Murtezaoglu, Turkish J. Chem. 34
(2010) 935.
[27] B. Yoosuk, P. Krasae, B. Puttasawat, P. Udomsap, N. Viriya-empikul, K.
Faungnawakij, Chem. Eng. J. 162 (2010) 58.
[28] A.M. Frey, J. Yang, C. Feche, N. Essayem, D.R. Stellwagen, F. Figueras,
K.P. de Jong, J.H. Bitter, J. Catal. 305 (2013) 1.
[29] M.R. Rezaie, H.R. Rezaie, R. Naghizadeh, Ceram. Int. 35 (2009) 2235.
[30] C.M. López-badillo, J. López-cuevas, C.A. Gutiérrez-chavarría, J. Eur.
Ceram. Soc. 33 (2013) 3287.
[31] P. Namwong, N. Laorodphan, W. Thiemsorn, Chiang Mai J. Sci. 2010 37
(2010) 231.
[32] E. Sadic, O. Taspinar, O. Ozcan, Fresenius Environ. Bull. 19 (2010) 2823.
[33] J. Park, Y. Cho, K. Yi, S. Han, S. Cho, Appl. Surf. Sci. 256 (2010) 5528.
[34] S.M. Nyale, O.O. Babajide, G.D. Birch, N. Böke, L.F. Petrik, Procedia
Environ. Sci. 18 (2013) 722.

Chapter 5
146
[35] M. Shamsipur, S.M. Pourmortazavi, S.S. Hajimirsadeghic, M. Roushanid,
Colloids Surfaces A Physicochem. Eng. Asp. 423 (2013) 35.
[36] G. Suresh, P.N. Nirmala, Turkish J. Phys. 36 (2012) 392.
[37] H. Hattori, Appl. Catal. A Gen. 222 (2001) 247.

Chapter 6
Silica Enrichment in Fly Ash and Synthesis of Solid Base Catalyst
for Claisen-Schmidt Condensation Reaction

Chapter 6
147
Abstract
ly ash has been converted into silica enriched fly ash (SFA) and CaSFA
catalyst by successively following mechanical, thermal and chemical activation.
The prepared catalytic materials were characterized by using various analytical
techniques viz. N2 adsorption-desorption study, TGA, FTIR, XRD, SEM-EDX and
TEM. The basic strength of the prepared CaSFA catalyst was determined by
Hammett indicator method. The catalytic activity of catalyst was evaluated by
Claisen-Schmidt condensation reaction of 4-methylbenzaldehyde with
acetophenone under optimized reaction conditions. The catalyst gave high
conversion (94%) of 4-methylbenzaldehyde. The CaSFA catalyst can be
regenerated and reused up to four reaction cycles with almost equal efficiency.
The conversion results show that the catalyst possesses sufficient stable active
basic sites responsible for the catalytic activity. The work reports a novel
application of abundantly available siliceous solid waste material fly ash in
synthesis of silica enriched material and catalytic applications.
F
Chapter 6
148
6.1 Introduction
ilica is a functional material that is used to improve surfaces and
mechanical properties of many materials. Precipitated silica, is a white fluffy
powder with amorphous nature, does not show a health hazard with respect to
lung tumour or silicosis [1]. Generally, precipitated amorphous SiO2 can be
produced by chemical reaction between aqueous solution of sodium metasilicate
and a mineral acid [2]. Precipitated silica has surface area in the range of 150-200
m2/g, bulk density 120-200 g/litre and loss on ignition 3-6% [3]. Primary SiO2
particles are ~15 to ~30 nm in size. These particles show a tendency to aggregate
and form ~160 nm size secondary particles [2]. Precipitated SiO2 has found
various applications as absorbent, drying powder, support material for
heterogeneous catalysts synthesis, anticorrosion agent, filler in rubber and
plastics, additives in varnishes, paints and glues, insulation materials. In addition,
amorphous silica is also used in the production of free-flowing powders for food
stuffs, animal feeds, pharmaceuticals and cosmetics [2, 3]. Tetraethylorthosilicate
(TEOS) is widely used in commercial silica synthesis, commercial silica is
amorphous in nature [4]. Besides TEOS, amorphous silica has been extracted
from a number of bio-wastes eg. rice husk ash [5], corn cob ash [6], bagasse ash
[7] etc. Silica supported solid catalysts for catalyzing different organic reactions
are well precedented in the literature viz. alkali metal supported silica for vapour
phase O-methylation of 2-naphthol [8], silica supported ammonium acetate
(NH4OAc/SiO2) catalyst for Knoevenagel condensation between aldehydes or
ketones and active methylene compound [9], Li-Ba/SiO2 catalyst for conversion
of methane [10] and silica supported cinchona alkaloids as heterogeneous
catalysts for asymmetric Michael reaction [11].
The Claisen-Schmidt reaction is a condensation reaction of aldehydes and
carbonyl compounds leading to chalcones. Chalcones are important synthetic
intermediates for the preparation of flavonoids and various heterocyclic
compounds. They also exhibit biological activities including antimitotic,
antimalarial, anticancer and anti-inflammatory activity [12].
Fly ash is a aluminosilicate material, abundantly available by product of
thermal power plants and having ~70% SiO2 content, was thought to be explored
S

Chapter 6
149
as a material for silica enrichment as well as for modification in surfacial
properties by silica enrichment with removal of other accessory metal oxides. The
physicochemical properties of prepared silica enriched fly ash (SFA) were
characterized by using different characterization techniques. The prepared
material has also been used to synthesize solid base catalyst by treating with
Ca(NO3)2 solution. Catalytic activity of prepared silica catalyst was evaluated by
Claisen-Schmidt condensation reaction of 4-methylbenzaldehyde with
acetophenone in single step, liquid phase and solvent free reaction conditions.
Thus the present work brings into light the use of fly ash for synthesis of silica
enriched material which could be a significant alternative of commercial silica
which can be utilized as support material for heterogeneous catalyst synthesis.
6.2 Experimental
6.2.1 Materials
Fly ash was collected from Jamshedpur Thermal Power Station,
Jamshedpur (Jharkhand). All chemicals NaOH (98%), Na2CO3 (98%) Ca(NO3)2
(99%) were purchased from Sigma Aldrich and acetophenone and
4-methoxybenzaldehyde were purchased from S.D. Fine Chemical Ltd., India. All
reagents used were of analytical grade and used as such.
6.2.2 Catalyst synthesis
As received FA was mechanically activated by using high energy
planetary ball mill (Retsch PM-100, Germany) in an agate jar with 5mm diameter
agate balls for 30 h at 250 rotation/minute speed to increase the surface area as
well as surface active sites. Milled FA showed the higher specific surface area,
also called as mechanically activated fly ash (MFA), was selected for further
activations. MFA was thermally activated at 800 °C for 3 h to form thermally
activated fly ash (TFA), consequently C, S, moisture and other impurities also get
removed [13]. An aqueous solution of NaOH (6 M, 60 mL) was added into 10 g
TFA. Then the mixture was constantly stirred for 3 days at 90 oC. Precipitation
was done by dropwise addition of 5 N H2SO4 up to pH 7 in the above mixture at
room temperature. The resultant slurry was aged for 24 h then filtered and washed

Chapter 6
150
with double distilled water up to pH 7 to remove leached compounds and sodium
sulphate. Now the silica enriched fly ash (SFA) was air dried at 110 °C for 24 h.
To prepare solid base catalyst from SFA, Ca(NO3)2 solution (15 wt%) was
added into 10 g, 800 oC for 3 h thermally activated SFA. Then the mixture was
constantly stirred for 1 h at 90 oC. Precipitation was done by dropwise addition of
mixture of NaOH (3M) and Na2CO3 (2M) solution (in 1:1 ratio) up to pH 8 in the
above mixture. The resultant slurry was aged for 24 h then filtered and washed
with double distilled water up to pH 7 to remove leached compounds, air dried at
110 °C for 24 h and calcined at 500 °C for 3 h in a muffle furnace under static
conditions to form CaSFA solid base catalyst.
6.3 Catalyst characterization
The synthesized FA, MFA, TFA, SFA, thermally activated SFA and
CaSFA were characterized by N2 adsorption-desorption study, TGA, FTIR, XRD,
SEM-EDX and TEM techniques. Instrumental details and operating conditions
during the characterization are given in Annexure I.
Hammett indicator method was used to evaluate the basic strength of
CaSFA catalyst. Basicity was measured by a benzoic acid titration method using
phenolphthalein indicator [14]. The methods for evaluating basic strength and
basicity are given in detail in Chapter 2.
6.4 Catalytic activity of CaSFA catalyst
The catalytic activity of CaSFA was investigated by Claisen-Schmidt
condensation reaction of 4-methylbenzaldehyde with acetophenone as shown in
Scheme 6.1. The reaction produces 3-(4-methylphenyl)-1-phenylprop-2-en-1-one
also known as 4-methylchalcone. The reaction was carried out in a liquid phase
batch reactor under optimized reaction conditions.

Chapter 6
151
Scheme 6.1: Claisen-Schmidt condensation reaction of 4-
methylbenzaldehyde with acetophenone over CaSFA.
The condensation of 4-methylbenzaldehyde with acetophenone was
performed in a liquid phase batch reactor consisting of 250 mL round bottom
flask equipped with digital magnetic stirrer and glass condenser, immersed in a
constant temperature oil bath. In the procedure, 4-methylbenzaldehyde and
acetophenone in 2:1 to1:3 molar ratios were taken in a round bottom flask. The
desired amount of CaSFA catalyst (preheated at 500 oC for 2 h), was taken
according to substrate/catalyst weight ratio ranging from 10:1 to 2.5:1. The
reaction mixture was heated at required reaction temperature ranging from 100-
150 oC and time from 1-5 h at atmospheric pressure in solvent free liquid phase
reaction conditions.
After completion of the reaction (TLC monitoring), the mixture was
cooled and filtered to separate the catalyst. The product was analyzed by Gas
Chromatograph.
The conversion of 4-methylbenzaldehyde and yield were calculated by using
weight percent method.
Conversion (wt%) = 100 X (Initial wt% - Final wt%) / Initial wt%
+
H3C
O
H
O
H3C H3C
O
4-methyl benzaldehyde
3-(4-methylphenyl)-1-phenylprop-2-en-1-oneAcetophenone
CaSFA catalyst

Chapter 6
152
Yield % of 3-(4-methylphenyl)-1-phenylprop-2-en-1-one obtained
100 X_______________________________________________g of 3-(4-methylphenyl)-1-phenylprop-2-en-1-one obtained experimentlly
=
g of 3-(4-methylphenyl)-1-phenylprop-2-en-1-one obtained theoritically
6.5 Catalyst regeneration
After initial use, the spent catalyst was filtered out by simple filtration
method, thoroughly washed with acetone and dried at 110 ºC for 12 h followed by
thermal activation at 500 ºC for 2 h in muffle furnace before reuse in next reaction
cycles under similar reaction conditions as earlier.
6.6 Results and discussion
6.6.1 Chemical composition of FA, SFA and CaSFA catalyst
The chemical compositions of FA, SFA and CaSFA as determined by
SEM-EDX are given in Table 6.1. The LOI of FA is found to be 5 wt%, at 800 oC
for 3 h. As it is clear from Table 6.1 that in SFA, silica content increases from
59.42% to 76.63% while percentage of other metal oxides get decreased. It may
be concluded that some other metal oxides are dissolved in NaOH solution and
leach out during washing steps and results in increased silica content. After
chemical treatment of SFA with Ca(NO3)2, CaO content increases in CaSFA
0.71% to 6.42%. The increased Ca generates basic sites in CaSFA as well as
catalytic activity for Claisen-Schmidt condensation reaction.
6.6.2 Surface area results
Specific surface areas of all sample determined by N2 adsorpion-
desorptions are given in Table 6.2. Specific surface area of FA is 9.18 m2/g,
considerably increases after mechanical activation and reaches up to 30.02 m2/g
for MFA. The specific surface area again increases from TFA to SFA, from 28.47
m2/g to 65.78 m
2/g, gets reduced after chemical activation with Ca(NO3)2 and
reaches to 59.23 m2/g in CaSFA. The blockage of SFA small pores by loading of

Chapter 6
153
different Ca species leads the reduction in surface area and confirms significant
chemical activation by Ca(NO3)2.
Table 6.1: Chemical composition of FA, SFA and CaSFA.
Chemical
components
FA
(Wt%)
SFA
(Wt%)
CaSFA
(Wt%)
SiO2 59.42 76.63 75.10
Al2O3 18.79 16.24 13.74
Fe2O3 6.91 3.18 1.89
CaO 2.56 0.71 6.42
MgO 1.84 0.46 0.30
K2O 2.37 0.64 0.59
Na2O 3.84 0.98 0.95
TiO2 1.27 0.14 0.11
Other elements 3 1.2 0.9
Table 6.2: Surface area of all catalytic materials.
Catalyst Specific surface area
(m2/g)
FA 9.18
MFA 30.02
TFA 28.47
SFA 65.78
CaSFA 59.23
6.6.3 Thermogravimetric analysis
TGA curves of FA, SFA and CaSFA (Figure 6.1) show weight loss of
5.96% and 6.10% and 12.96% respectively, within the temperature range 50-
1000°C, are attributed to water loss and burning of carbonaceous materials and
volatilization of some trace metal oxides and other impurities [15]. Precursor

Chapter 6
154
Ca(NO3)2 can attain any of the phases like Ca(OH)2, CaO, Ca-SiO2 and CaCO3
during the catalyst synthesis. So the slight weight loss in CaSFA may be assigned
to the decomposition of these phases.
6.6.4 FTIR studies
The FTIR spectra of TFA, SFA and thermally activated SFA are given in
the Figure 6.2. All spectra show a broad band between 3000-3600 cm-1
, attributed
to –O-H stretching vibration of surface silanol groups (Si-OH) [16]. Increase in
intensity and broadness of this region in case of SFA is an evidence for the
breaking of spherical silica particles and formation of Si-OH groups and the
presence of strong H- bonding after precipitation. In case of thermally activated
SFA, thermal activation causes the decrease in intensity and broadness due to loss
of adsorbed water in SFA [17]. A peak centered around 1630 cm-1
, present in all
samples is assigned to bending mode (δo-H) of water molecules (Figure 6.2, 6.3)
[18]. A small peak in TFA around 2827 cm-1
is assigned to –C-H stretching
vibration of organic contaminants present in TFA (Table 6.3) [19]. Peaks
centered at 1521 and 1679 cm-1
are due to (CO3)2-
stretching vibration, visible in
all spectra [20, 21]. A broad band between 1129-1168 cm-1
is attributed to Si-O-Si
asymmetric stretching vibration [21]. A peak at approx ~ 600 cm-1
is attributed to
Si-O-Al stretching vibration (Figure 6.2, 6.3) [22].
FTIR spectrum of CaSFA (Figure 6.3c) shows the broader and much
intense band in the region of 3000-3600 cm-1
as compared to SFA samples. The
increased intensity could be assigned to generation of Si-OH groups and Si/Al-O-
Ca-OH groups during the chemical activation while H- bonding is responsible for
the broadness of the band between these groups. The increased OH groups are
responsible for the Bronsted basic sites which initiate the reaction by abstracting
the proton from methyl group [23]. Loaded Ca could be present on thermally
activated SFA surface in the forms of carbonate, hydroxide and oxide as well as in
the form of silicate. Ca(OH)2 and CaCO3 formation could be assigned due to the
absorption of water vapour [24] and CO2 from environment [25] by CaO
compound or they may generate during the catalyst synthesis step.

Chapter 6
155
Figure 6.1: TGA curves of (a) FA, (b) SFA and (c) CaSFA.
0 200 400 600 800 1000
5.86.06.26.46.66.87.07.27.47.67.8
0 200 400 600 800 1000
9.910.010.110.210.310.410.510.6
0 200 400 600 800 1000
3.5
4.0
4.5
5.0
5.5
6.0
6.5
We
igh
t (m
g)
CaSFA
SFA
FA
Temperature (oC)

Chapter 6
156
Figure 6.2: FTIR spectra of (a) TFA, (b) SFA and (c) Thermally activated
SFA.
Figure 6.3: FTIR spectra of (a) SFA, (b) Thermally activated SFA and (c)
CaSFA.
D:\FTIR DATA\smj\PPT FA UNCAL.0 PPT FA UNCAL DRS
D:\FTIR DATA\smj\PPT FA CAL 800-3h.0 PPT FA CAL 800-3h DRS
D:\FTIR DATA\smj\JMech JFA uncal KBr.0 Mech JFA uncal KBr DRS
03/04/2013
03/04/2013
16/05/2013
37
91.1
9
35
53.9
3
34
60.1
834
51.0
9
28
27.2
7
23
48.5
623
45.3
423
43.5
322
41.3
222
33.7
419
94.1
019
88.0
919
84.5
3
18
74.9
718
74.6
918
71.7
117
93.4
017
90.5
1
16
79.7
4
16
32.8
716
30.4
716
08.8
715
27.3
415
21.8
515
20.6
6
11
68.5
811
67.2
311
29.2
3
59
9.3
159
4.6
659
3.0
757
9.7
057
2.6
9
100015002000250030003500
Wavenumber cm-1
20
40
60
80
10
0
Tra
nsm
itta
nce
[%
]
Page 1/1
1630
1527
1632
(c) (b)
(a)
3460 1168
3451
D:\FTIR DATA\smj\PPT FA UNCAL.0 PPT FA UNCAL DRS
D:\FTIR DATA\smj\PPT FA CAL 800-3h.0 PPT FA CAL 800-3h DRS
D:\FTIR DATA\smj\KOHALPFA 1 400 3H.0 KOHALPFA 1 400 3H DRS
03/04/2013
03/04/2013
29/09/2011
34
60.1
834
51.0
934
37.4
8
23
48.5
623
45.3
423
37.0
122
33.7
422
33.6
021
36.9
019
94.4
719
94.1
019
88.0
918
74.9
718
74.6
918
74.4
117
93.4
017
90.5
117
89.7
316
40.9
816
32.8
716
30.4
715
27.3
415
20.6
6
13
14.7
2
11
68.5
811
67.2
311
62.5
3
10
46.0
8
82
0.9
4
70
9.4
560
7.9
559
9.3
159
3.0
757
9.7
0
100015002000250030003500
Wavenumber cm-1
20
40
60
80
10
0
Tra
nsm
itta
nce
[%
]
Page 1/1
(a)
(c)
(b)
3437 1162
1527
1640

Chapter 6
157
Table 6.3: The observed transmission frequencies (cm-1
) of Fourier
transform infrared spectra of TFA, SFA, thermally activated
SFA and CaSFA and their assignments.
Assignments TFA SFA
Thermally
activated
SFA
CaSFA Reference
No.
Si-O-Al stretching
vibration 594 593 599 607 22
Si-O-Si asymm.
stretching
vibration
1129 1168 1167 1162 21
(CO3)2-
stretching
vibration
1521,
1679 1527 1520 1527 20, 21
H-O-H bending
vibration 1608 1632 1630 1640 18
-C–H stretching
vibration 2827 - - - 19
-O-H stretching
vibration 3553 3451 3460 3437 16
6.6.5 X-ray diffraction studies
The XRD patterns of TFA, SFA, thermally activated SFA and CaSFA are
given in Figure 6.4. Quartz exhibits peaks at 2θ = 20.7o, 26.5
o, 40.66
o and 49.96
o
(SiO2, ICDD pdf number 000- 46-1045) while peaks at 2θ = 33.4o, 34.85
o and
16.4 o
confirm the presence of calcite (CaCO3, ICDD pdf number, 47-1743),
hematite phase (Fe2O3, ICDD pdf number, 33-0664) and mullite (Al6Si2O13,
ICDD pdf number 000-15-0776) respectively in all XRD patterns (Figure 6.4). A

Chapter 6
158
peak at around 2θ = 41o present only in CaSFA confirms increased amount of
calcite (CaCO3, JCPDS card 05- 0586) [26],[27]. This increased amount of calcite
generates active basic sites on SFA surface thus basicity in CaSFA catalyst.
6.6.6 SEM analysis results
Figure 6.5 shows the surface morphologies of FA, TFA, SFA and CaSFA
samples. It can be seen that fly ash mainly consists of spherical particles with
smooth outer surfaces and irregularly shaped unburned carbon particles [28]
which form clumps and convert into agglomerated particles during thermal
activation Figure 6.5b, this agglomeration is the main reason of additional
crystallinity in TFA. During precipitation step, agglomerated particles of TFA
break into irregular shape small particles as depicted in Figure 6.5c, 6.6 which
results in increased surface area of SFA. After chemical treatment with Ca(NO3)2,
CaSFA particles show loaded Ca species in different forms, clearly visible in
Figure 6.5d.
6.6.7 TEM analysis results
TEM image of FA shows a completely spherical, fine and smooth particle
of fly ash which has been reduced in size after mechanical activation (Figure
6.7b). So, mechanical activation is accountable for the complete removal of
smoothness and sphericity in FA particles. The TEM image of SFA shows < 100
nm particles of oval, rod and irregular shapes (Figure 6.7c). The clear difference
in particle size and shape of SFA is responsible for increased surface area which
facilitates the generation of surface active basic sites in CaSFA.
6.6.8 Basic strength and basicity measurement
The base strength and basicity of CaSFA was determined by the Hammett
indicator method. CaSFA shows basic strength 9.8<H_<15 and basicity was found
to be 1.1 mmol/g.

Chapter 6
159
Figure 6.4: XRD patterns of (a) TFA, (b) SFA, (c) Thermally activated
SFA and (d) CaSFA.
[Mu = Mullite, Q = Quartz, C = Calcite, H = Hematite]
0 10 20 30 40 50 60 70 80
2 Theta (in degree)
Q
H
C
C C
H
Q
C
C
Q
Q
Q
Q
Q
Mu
Q
Q
Q
Mu
Mu
Mu
Q
Q
Q
H
H
(a)
(b)
(c)
(d)
Inte
nsi
ty (
a.u
.)

Chapter 6
160
Figure 6.5: SEM micrographs of (a) FA, (b) TFA, (c) SFA and (d) CaSFA.
a b
c d
2μm 2μm
10μm 10μm

Chapter 6
161
Figure 6.6: SEM micrographs of SFA in higher magnification.
c
b
a

Chapter 6
162
Figure 6.7: TEM images of (a) FA, (b) Mechanically activated FA and (c)
SFA.
500 nm 500 nm
500 nm 500 nm
a b
c
100 nm
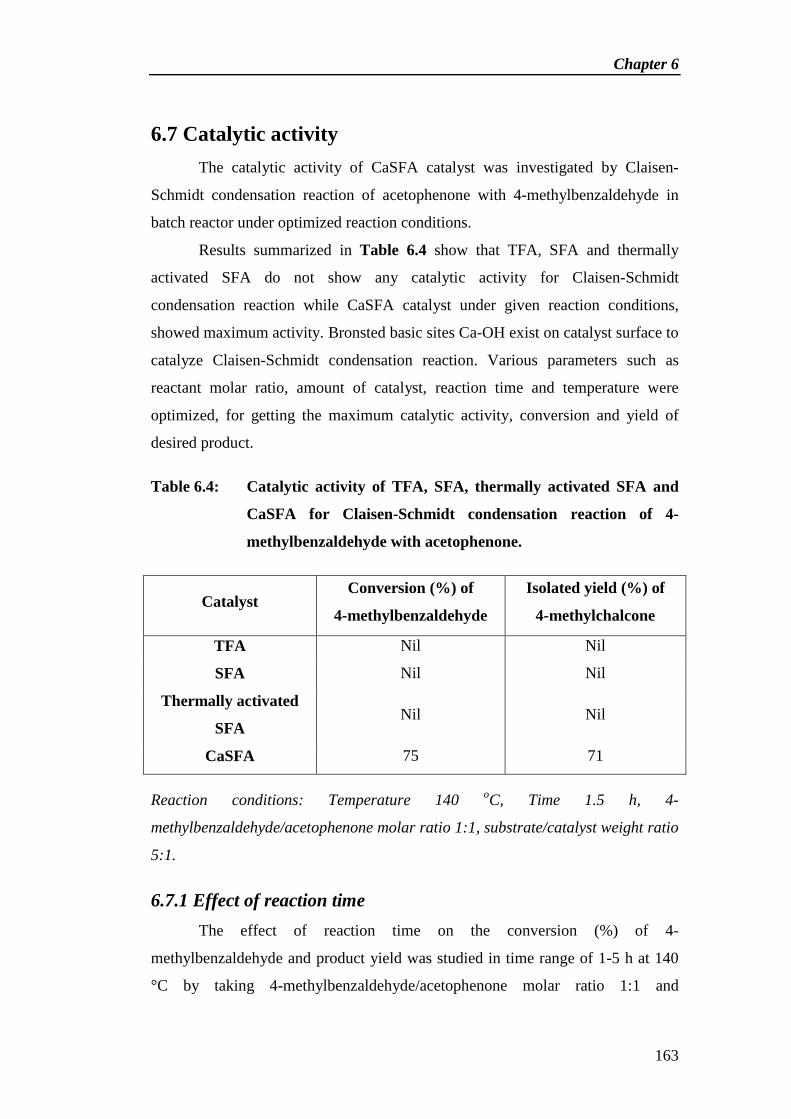
Chapter 6
163
6.7 Catalytic activity
The catalytic activity of CaSFA catalyst was investigated by Claisen-
Schmidt condensation reaction of acetophenone with 4-methylbenzaldehyde in
batch reactor under optimized reaction conditions.
Results summarized in Table 6.4 show that TFA, SFA and thermally
activated SFA do not show any catalytic activity for Claisen-Schmidt
condensation reaction while CaSFA catalyst under given reaction conditions,
showed maximum activity. Bronsted basic sites Ca-OH exist on catalyst surface to
catalyze Claisen-Schmidt condensation reaction. Various parameters such as
reactant molar ratio, amount of catalyst, reaction time and temperature were
optimized, for getting the maximum catalytic activity, conversion and yield of
desired product.
Table 6.4: Catalytic activity of TFA, SFA, thermally activated SFA and
CaSFA for Claisen-Schmidt condensation reaction of 4-
methylbenzaldehyde with acetophenone.
Catalyst Conversion (%) of
4-methylbenzaldehyde
Isolated yield (%) of
4-methylchalcone
TFA Nil Nil
SFA Nil Nil
Thermally activated
SFA Nil Nil
CaSFA 75 71
Reaction conditions: Temperature 140 oC, Time 1.5 h, 4-
methylbenzaldehyde/acetophenone molar ratio 1:1, substrate/catalyst weight ratio
5:1.
6.7.1 Effect of reaction time
The effect of reaction time on the conversion (%) of 4-
methylbenzaldehyde and product yield was studied in time range of 1-5 h at 140
°C by taking 4-methylbenzaldehyde/acetophenone molar ratio 1:1 and

Chapter 6
164
acetophenone to catalyst weight ratio 5:1. The conversion continuously increased
up to 94 % in initial 3 h and remained constant for the next 2 h (Figure 6.8). The
optimized reaction time was found to be 3 h, in which CaSFA catalyst gave
highest conversion 94% of 4-methylbenzaldehyde to 4-methylchalcone with 89%
yield .
Figure 6.8: Variation in isolated yield (%) and conversion (%) of 4-
methylbenzaldehyde with time.
Reaction conditions: Temperature 140 oC, 4-methylbenzaldehyde/acetophenone
molar ratio 1:1, substrate/catalyst weight ratio 5:1.
6.7.2 Effect of reaction temperature
Optimization of reaction temperature for maximum conversion (%) and
isolated yield (%) was carried out at temperature ranging from 100 oC to 150
oC
for 3 h taking 4-methylbenzaldehyde/acetophenone molar ratio of 1:1 while
substrate to catalyst weight ratio was 5:1. Conversion and yield were observed to
increase on increasing reaction temperature ranging from 100 oC to 140
oC as
depicted from Figure 6.9. The results show that the maximum conversion (94%)
of 4-methylbenzaldehyde and isolated yield (89%) of 4-methylchalcone were
found at 140 oC, after which conversion and isolated yield (%) remain almost
steady till 150 oC.
0
20
40
60
80
100
0 1 2 3 4 5 6
Time (h)
Conversion (%)
Isolated yield (%)

Chapter 6
165
Figure 6.9: Variation in isolated yield (%) and conversion (%) of 4-
methylbenzaldehyde with temperature.
Reaction conditions: Time 3 h, 4-methylbenzaldehyde/acetophenone molar ratio
1:1, substrate/catalyst weight ratio 5:1.
6.7.3 Effect of substrate/catalyst weight ratio
The influence of substrate to catalyst weight ratio on conversion and
isolated yield (%) was studied by varying the amount of CaSFA catalyst under
optimized reaction conditions. Only 79% conversion of 4-methylbenzaldehyde
was achieved at acetophenone/CaSFA weight ratio 10:1 while conversion reached
to 94% in case of 5:1 substrate/catalyst weight ratio which remained unchanged in
2.5:1 substrate/catalyst weight ratio. The increase in conversion, with increase in
the catalyst weight can be attributed to an increase in the availability of number of
catalytic active sites required for the reaction (Figure 6.10).
6.7.4 Effect of reactant molar ratio
The effect of reactant molar ratio was studied at different molar. As
indicated by Figure 6.11, 62% conversion of 4-methylbenzaldehyde was
observed at 2:1 molar ratio of 4-methylbenzaldehyde to acetophenone. This may
be due to insufficient quantity of the reactants to react with each other. There was
an increase in conversion up to 94% at 1:1 molar ratio due to satisfactory reactant
quantity on the basic sites of the CaSFA catalyst surface. The conversion
decreased on further increasing the molar ratio from 1:2 to 1:3 which could be
0
20
40
60
80
100
90 100 110 120 130 140 150
Temperature (oC)
Conversion (%)
Isolated yield (%)

Chapter 6
166
attributed to the lacking of 4-methylbenzaldehyde or self condensation of
acetopheneone.
Figure 6.10: Effect of substrate/catalyst weight ratio on conversion (%) of 4-
methylbenzaldehyde and isolated yield (%) of 4-
methylchalcone over CaSFA.
Reaction conditions: Temperature 140 °C, Time 3 h, 4-
methylbenzaldehyde/acetophenone molar ratio 1:1.
6.8 Reaction mechanism
The plausible structure of CaSFA catalyst surface is shown in Scheme 6.2.
The reaction mechanism over CaSFA catalyst shows that Claisen-Schmidt is a
condensation reaction (Scheme 6.3). Surface active Bronsted basic sites (–Ca-
OH) abstract proton from acetophenone and form anion. The nucleophilic
addition of the formed anion to the 4-methylbenzaldehyde, followed by the
successive protonation and dehydration produces 3-(4-methylphenyl)-1-
phenylprop-2-en-1-one or 4-methylchalcone.
0
10
20
30
40
50
60
70
80
90
100
10:01 05:01 2.5:1
Weight ratio
Conversion (%)
Isolated yield (%)

Chapter 6
167
Figure 6.11: Effect of molar ratio of 4-methylbenzaldehyde/acetophenone
on conversion (%) of 4-methylbenzaldehyde and isolated yield
(%) of 4-methylchalcone over CaSFA.
Reaction conditions: Temperature 140 °C, Time 3 h, substrate/catalyst weight
ratio 5:1.
Scheme 6.2: The schematic presentation of chemical activation of thermally
activated SFA with Ca(NO3)2 and proposed structure of
CaSFA.
0
20
40
60
80
100
02:01 01:01
01:02 01:03
Molar ratio
Conversion (%)
Isolated yield (%)
O
Si
O
Si
O
Si
O
OH
OH
Chemical activation
Calcine at 500 oC for 3 h
Thermally activated SFA surface CaSFA catalyst surface
O OH
O
O
O
Si
O
Si
O
Si
O
O
O
O O
O
O
Ca
Ca
Ca
OH
OH
OH

Chapter 6
168
Scheme 6.3: Proposed mechanism for Claisen-Schmidt condensation
reaction of 4-methylbenzaldehyde with acetophenone over
CaSFA .
Bronsted basic site
- H2O
O
Si
O
Si
O
Si
O
O
O
O O
O
O
Ca
Ca
Ca
OH
OH
OH
CaSFAcatalyst surface
H O
CH3
H2O
- H2O
Enolate ion
4-methylbenzaldehyde
Nucleophilic addition
Dehydration
Protonation
H3C
O
H2C
O
OO
H3C
OOH
H3C
O
H3C
3-(4-methylphenyl)-1-phenylprop-2-en-1-one
3-(4-methylphenyl)-3-hydroxy-1-phenylpropan-1-one
Acetophenone

Chapter 6
169
6.9 Catalyst regeneration
The regeneration reaction reflects that CaSFA catalyst can be regenerated
by simple thermal regeneration method and retains the catalyst activity. The
regenerated catalyst was found to be having similar activity as fresh catalyst for
consecutive four reaction cycles, giving 89-75% yield (Table 6.5) for Claisen-
Schmidt condensation of acetophenone with 4-methylbenzaldehyde. Due to the
stability of Ca-OH Bronsted basic sites, CaSFA catalyst was found efficient up to
five reaction cycles giving almost similar yield. The gradual decrease in yield
after five reaction cycles is due to the deposition of carbonaceous material on the
surface of the reused catalyst which may block the active basic sites of CaSFA
catalyst.
Leaching test was done using hot filtration technique. The catalyst was
removed after 30 min and the reaction was continued to completion but no further
product was formed. This led us to the conclusion that no leaching occurs with the
catalysts used and under the conditions applied in the present investigation.
Table 6.5: Catalytic activity of fresh and regenerated CaSFA for Claisen-
Schmidt condensation of 4-methylbenzaldehyde with
acetophenone.
Reaction Cycle Isolated yield (%)
I 89
II 85
III 82
IV 80
V 75
Reaction conditions: Temperature 140 °C, Time 3 h, substrate/catalyst weight
ratio 5:1, 4-methylbenzaldehyde/acetophenone molar ratio 1:1.

Chapter 6
170
6.10 Conclusion
The study provides CaSFA catalyst as an efficient solid base catalyst
possessing significant amount of basicity and basic sites. Consecutive treatment of
TFA with NaOH and H2SO4 result in increased amorphous silica content and
converts fly ash into silica enriched fly ash (SFA). Further treatment with
Ca(NO3)2 modify SFA surface by generating Bronsted basic sites i.e. -Ca–OH.
These sites are responsible for catalytic activity of CaSFA, which has been
investigated by Claisen-Schmidt condensation reaction. Catalyst was recovered,
regenerated and reused with no noticeable changes in the yield, confirming almost
negligible leaching of active basic sites or slight deactivation of the catalyst under
the mentioned reaction conditions. The prepared CaSFA catalyst is stable, eco-
friendly, cost effective, reusable, easily recoverable and suitable for the
production of 4-methylchalcone. This study suggests that fly ash could be an
economical source of silica for synthesizing novel solid base catalysts for
catalyzing industrially important reactions in cost effective manner.
6.11 References
[1] J. Schlomach, M. Kind, J. Colloid Interface Sci. 277 (2004) 316.
[2] S. Music, N. Filipovic-Vincekovic, L. Sekovanic, Brazilian J. Chem. Eng.
28 (2011) 89.
[3] R. Ghosh, S. Bhattacherjee, J. Chem. Eng. Process Technol. 04 (2013) 1.
[4] A.E. Voinescu, M. Kellermeier, A.M. Carnerup, A. Larsson, D. Touraud,
S.T. Hyde, W. Kunz, J. Cryst. Growth Growth 306 (2007) 152.
[5] F. Adam, J. Nelson, A. Iqbal, Catal. Today 190 (2012) 2.
[6] E.A. Okoronkwo, P.E. Imoisili, S.O.O. Olusunle, Chem. Mater. Res. 3
(2013) 68.
[7] V. Hariharan, G. Sivakumar, Int. J. ChemTech Res. 5 (2013) 1263.
[8] R. Bal, K. Chaudhari, S. Sivasanker, Catal. Letters 70 (2000) 75.
[9] R. Gupta, M. Gupta, S. Paul, R. Gupta, Bull. Korean Chem. Soc. 30 (2009)
2419.
[10] S. Ahmed, J.B. Moffat, Appl. Catal. 58 (1990) 83.

Chapter 6
171
[11] W. Zhao, Y. Zhang, C. Qu, L. Zhang, J. Wang, Y. Cui, Catal. Letters
(2014).
[12] A. Davoodnia, G. Yassaghi, Chinese J. Catal. 33 (2012) 1950.
[13] K. Kordatos, S. Gavela, A. Ntziouni, K.N. Pistiolas, A. Kyritsi, V.K.
Rigopoulou, Microporous Mesoporous Mater. 115 (2008) 189.
[14] R. Rahul, J.K. Satyarthi, D. Srinivas, Indian J. Chem. 50 (2011) 1017.
[15] M.M.A. Sekkina, R.M. Issa, A.E.-D.M. Bastawisy, W.A. El Helece, Int. J.
Chem. 2 (2010) 81.
[16] D. Jain, A. Rani, Am. Chem. Sci. J. 1 (2011) 37.
[17] D. Jain, C. Khatri, A. Rani, Fuel 90 (2011) 2083.
[18] S. Kabra, S. Katara, A. Rani, Int. J. Innov. Res. Sci. Eng. Technol. 2 (2013)
4319.
[19] S. Katara, S. Kabra, A. Sharma, R. Hada, A. Rani, Int. Res. J. Pure Appl.
Chem. 3 (2013) 299.
[20] H. Handa, T. Baba, H. Sugisawa, Y. Ono, J. Mol. Catal. A Chem. 134
(1998) 171.
[21] B.J. Saikia, G. Parthasarathy, N.C. Sarmah, G.D. Baruah, Indian Acad. Sci.
31 (2008) 155.
[22] M.E.G. Frances I. Hurwitz, Denisse V. Aranda, in:, Am. Chem. Soc. 236th
Natl. Meet. Philadelphia, PA, August 20, 2008, 2008.
[23] D. Kishore, S. Kannan, J. Mol. Catal. A Chem. 223 (2004) 225.
[24] B. Yoosuk, P. Krasae, B. Puttasawat, P. Udomsap, N. Viriya-empikul, K.
Faungnawakij, Chem. Eng. J. 162 (2010) 58.
[25] A.M. Frey, J. Yang, C. Feche, N. Essayem, D.R. Stellwagen, F. Figueras,
K.P. de Jong, J.H. Bitter, J. Catal. 305 (2013) 1.
[26] K.S. Hui, K.N. Hui, S.K. Lee, World Acad. Sci. Eng. Technol. 3 (2009)
174.
[27] D. Jain, C. Khatri, A. Rani, Fuel Process. Technol. 91 (2010) 1015.
[28] S.M. Nyale, O.O. Babajide, G.D. Birch, N. Böke, L.F. Petrik, Procedia
Environ. Sci. 18 (2013) 722.

Annexure I and II
Annexure I
172
ANNEXURE I
Characterization Techniques
Physicochemical properties of all catalytic materials are studied by N2
adsorption-desorption, TGA, FT-IR, XRD, SEM, SEM-EDX and TEM
techniques. The reaction products are analyzed by 1H NMR and gas
chromatography.
1. BET analysis
Specific surface area and average pore diameter of samples are determined
by N2 adsorption-desorption, done by using Thermo ScientificTM Surfer surface
area analyzer. The samples are degassed under vacuum at 120°C for 4 h, prior to
adsorption in order to evacuate the physisorbed moisture. BET analysis is done at
University of Pune, Pune.
2. Thermo-gravimmetric analysis (TGA)
Thermo gravimetric analysis (TGA) of the samples is carried out using
DTG-60-H- Shimadzu thermal analyzer (C-30574400175), by heating the samples
in the range of 50–1000 °C with a heating rate of 10°C/min under nitrogen flow
(50 cm3/min). TGA analysis of samples is done at University of Pune, Pune and
IIT-Roorkee.
3. Fourier transform infra-red analysis (FT-IR)
FT-IR study is executed on Bruker FT-IR Spectrophotometer (TENSOR
27) in DRS (Diffuse Reflectance System) mode by mixing samples with KBr in
1:20 weight ratio. The spectra were recorded in the range of 550-4000 cm-1 with a
resolution of 4 cm-1. FT-IR analysis is conducted at Department of Pure and
Applied Chemistry, University of Kota, Kota.
4. X-ray diffraction analysis
The structural features of samples are analyzed by X-ray diffraction
studies. X-ray diffraction (XRD) patterns are recorded by Bruker D8 Advance
diffractometer, using Ni-filter and Cu Kα radiation (E = 8047.8 eV, λ = 1.5406A˚).

Annexure I
173
The samples are scanned in 2θ range of 5-75˚ at a scanning rate of 0.04˚s-1.
Crystallite size of the crystalline phase is determined from the peak of maximum
intensity by using Scherrer formula with a shape factor (K) of 0.9 as below:
Crystallite size = K. λ / W. Cos θ
Where, W = Wb-Ws; Wb is the broadened profile width of experimental sample and
Ws is the standard profile width of reference sample. XRD analysis has been done
at UGC-DAE CSR, Indore.
5. Scanning electron microscopy (SEM and SEM-EDX
analysis)
The detailed imaging information about the morphology and surface
topography is studied by Scanning electron microscope (SEM, Model-JEOL-JSM
5600). SEM analysis is done at UGC-DAE CSR Indore, University of Pune, Pune
and IIT-Roorkee.
6. Transmission electron microscopy (TEM analysis)
The surface morphology and texture of samples is further confirmed by
TEM analysis, Model: H-7500 (Hitachi Make). TEM analysis is done at SAIF-
Chandigarh.
7. 1H NMR analysis
1H NMR analysis of reaction products is carried out on Bruker AvIII HD-
300 NMR spectrometer. The analysis is done at CDRI Lucknow.
8. Mechanical activation
Mechanical activation of fly ash is carried out in a high energy planetary
ball mill (Retsch PM-100, Germany). As received fly ash is mechanically
activated in an agate jar using 5 mm agate balls with 10:1 ball to powder weight
ratio (BPR). The mechanical activation was done at 250 rpm rotation speed for
specified time period. Mehanical activation is at Department of Pure and Applied
Chemistry, University of Kota, Kota.

Annexure I
174
9. Gas Chromatography
The products are analyzed by Gas Chromatograph (Agilent Technologies
7820A) having FID and Agilent J&W Advanced Capillary HP 5 GC Columns of
30 m length and 0.320 mm diameter, programmed oven temperature of 60–325ºC
and N2 (1.5 ml/min) as a carrier gas. GC analysis is conducted at Department of
Pure and Applied Chemistry, University of Kota, Kota.

Annexure II
175
ANNEXURE II
List of publications
In International and National Journals
1. Surface Modification of Fly Ash by Thermal Activation: A DR/FTIR Study, Stuti Katara, Sakshi Kabra, Anita Sharma, Renu Hada and Ashu Rani, International Research Journal of Pure & Applied Chemistry, 2013, 3(4), 299-307.
2. Characterization and Study of Turkish Perlite, Sakshi Kabra, Stuti Katara
and Ashu Rani, International Journal of Innovative Research in Science, Engineering and Technology, 2013, 2(9), 4319-4326.
3. Acid Activated Fly Ash, as a Novel Solid Acid Catalyst for Esterification of
Aetic Acid, Anita Sharma, Stuti Katara, Sakshi Kabra and Ashu Rani, Indian Journal of Applied Research, 2013, 3(4) 37-39.
4. Synthesis of Nanosized Titania by Sol Gel Route, Renu Hada, Sakshi
Kabra, Stuti Katara, Ashu Rani, Vijay Devra and S. S. Amritphale, Indian Journal of Applied Research, 2013, 3(4), 49-50.
5. DRIFT- Spectroscopic Study of Modification of Surface Morphology of
Perlite during Thermal Activation, Sakshi Kabra, Anita Sharma, Stuti Katara, Renu Hada and Ashu Rani, Indian Journal of Applied Research, 2013, 3(4), 40-42.
6. An Efficient and Cost-Effective Solid Base Catalyst for Cross-Aldol
Condensation of Ketones with Aromatic Aldehydes under Solvent Free Condition. Stuti Katara, Sakshi Kabra, Renu Hada and Ashu Rani, Catalysis Communications (Communicated).
7. Fly Ash Supported Solid Base Catalyst for Microwave Assisted Michael
Addition Reaction. Stuti Katara, Renu Hada, Sakshi Kabra and Ashu Rani, Fuel Processing Technology (Communicated).
8. Microwave Assisted Solution Combustion Synthesis of Activated Fly Ash
Supported NiO Nanoparticles for Hydrogen Peroxide Decomposition, Renu Hada, Stuti Katara, Sakshi Kabra, Vijay Devra and Ashu Rani, Fuel (Communicated).

Annexure II
176
9. Perlite Supported Nickel Catalyst: Synthesis, Characterization and Catalytic Activity in Claisen-Schmidt Condensation Reactions, Sakshi Kabra, Stuti Katara, Renu Hada and Ashu Rani, Catalysis Communications (Communicated).
10. Non Aqueous Synthesis of Fly Ash Supported TiO2 Nanoparticles for Enhanced Photo-Oxidation of Congo Red Dye, Renu Hada, Sakshi Kabra, Stuti Katara, Vijay Devra and Ashu Rani, Fuel Processing Technology (Communicated).
11. Fly Ash Supported Phosphomolybdic Acid as A Highly Efficient Solid
Lewis Acid Catalyst for Microwave Assisted Friedel-Crafts Acylation Reactions, Sakshi Kabra, Renu Hada, Stuti Katara and Ashu Rani, Fuel (Communicated).
In International Conference/Workshop/Symposium –
1. An Abstract is accepted for Oral Presentation and three other abstracts are accepted for Poster Presentations at World of Coal Ash Conference-2015 to be held in May at Nashville, Tennessee (U.S.).
2. Paper presentation as co-author and won “Best Presentation Award” in 3rd International Conference on Advance Trends in Engineering, Technology and Research (ICATET-2014) held on 23-24 December 2014 at Bal Krishna Institute of Technology, Kota.
3. Paper presentation as first author in International Conference on Advanced Trends in Engineering, Technology and Research (ICATET-2014) held on 23-24 December 2014 at Bal Krishna Institute of Technology, Kota.
4. Paper presentation in International Conference on New Emerging Trends in Chemistry held on 3-4 March 2013 at IIS University, Jaipur.
5. Poster presentation at International Conference on Waste Wealth and
Health (ICWWH-2013) on 15-17 February 2013 at MPCST, Bhopal. 6. Poster presentation at International Workshop on Green Initiatives on
Energy, Environment & Health held on 2-3 Dec 2013, organized by the Green Chemistry Centre of Excellence, The Energy and Resources Institute, Green Chemistry Network Centre, DU, Gautam Buddha University, Green Chemistry Network and sponsored by Royal Society of Chemistry London (North India Section) at Delhi.

Annexure II
177
7. Participated in Indo – Swedish Symposium on Strategic Knowledge on climate Change held on 9 October 2013 at the Department of Pure & Applied Chemistry, University of Kota, Kota.
8. Paper presentation as first author in International Conference on Advanced
Trends in Engineering and Technology (ICATET) 2013 held on 19-20 December 2013 at Arya College of Engineering & I. T., Jaipur.
9. Paper presentation as co-author in International Conference on Advanced
Trends in Engineering and Technology (ICATET) 2013 held on 19-20 December 2013 at Arya College of Engineering & I.T., Jaipur.
National Conference/ Workshop/ Symposium/School-
1. Participated in National Seminar on Environmental Issues and Social Concerns held on 21-22 March 2014 at Department of Social Sciences, University of Kota, Kota.
2. Participated in Symposium of E-Resources held on 16-17 December 2013
at Department of Library and Information Science, University of Kota, Kota.
3. Oral paper presentation in National Conference on Frontiers in Physical, Chemical and Biological Sciences held on 4-6 Oct 2013 at Department of Chemistry, University of Pune, Pune.
4. Participated in 5th National Academic Workshop on Organic Reaction Mechanisms & Analytical Techniques used in Chemical Sciences held on 21-25 October 2013 at the Department of Pure & Applied Chemistry, University of Kota, Kota.
5. Participated in National Seminar on Chemistry for Economic Growth and
Human Comforts held on 31 August 2013 at Department of Chemistry, University of Rajasthan, Jaipur.
6. Participated in 5th BRNS-AEACI Winter School on Analytical
Chemistry-2012 held on 3-10 December 2012 at the Chemistry Department, IIT Roorkee.
7. Participated in Brainstorming Workshop on Perspective of Fly Ash
Characterization held on 7 Novomber 2012, organized by Center for Fly Ash Research & Management (C-Farm), New Delhi.

Annexure II
178
8. Poster presentation in a National Conference, National Symposium on
Recent Advances in Chemical Sciences held on 7-8 January 2011 at University of Kota, Kota.
9. Paper presentation in a National Conference, Emerging Views In Advanced Chemistry held on 17-19 December 2010 at Govt. College, Bhilwara.
___________________________________________________________________________________________
*Corresponding author: Email: [email protected];
International Research Journal of Pure &Applied Chemistry
3(4): 299-307, 2013
SCIENCEDOMAIN internationalwww.sciencedomain.org
Surface Modification of Fly Ash by ThermalActivation: A DR/FTIR Study
Stuti Katara1, Sakshi Kabra1, Anita Sharma1, Renu Hada1
and Ashu Rani1*
1Department of Pure and Applied Chemistry, University of Kota, Kota, Rajasthan, India.
Authors’ contributions
This work was carried out in collaboration between all authors. Authors SK and ARsupervised and designed the study. Author SK (Stuti Katara) performed the experimental
and analytical study, wrote the protocol, and wrote the first draft of the manuscript. AuthorsSK, AS and RH managed the literature searches and helped in analytical study. All authors
read and approved the final manuscript.
Received 31st March 2013Accepted 12th July 2013
Published 24th July 2013
ABSTRACT
To acquire a deeper understanding of surface chemistry of fly ash along with thermalactivation, the states of mineral phases, water and –OH groups on silica are studied in flyash at different calcination temperatures by DR/FTIR spectroscopic technique. DR/FTIRspectroscopy allows differentiation of various types of bonds in a material on a molecularlevel. The spectroscopic results are also supported by XRF, XRD and SEM analysis.Studied fly ash was collected from Jamshedpur Thermal Power Station as an extremelyfine ash, formed from the inorganic components of the coal, mainly silica and aluminawhich remain after combustion of the carbonaceous part of the coal. Distinguish changeswere observed in fly ash IR bands regarding absorbed water, -OH group and Si-O-Sigroup with thermal activation. This investigation reveals that as the temperatureincreases, the physically adsorbed water begins to remove first, then silanol groups onsurface is dehydrated. Increased temperature causes formation of different crystallinephases like quartz, mullite and hematite etc. and increased the crystallinity of the calcinedsamples.
Research Article

International Research Journal of Pure & Applied Chemistry, 3(4): 299-307, 2013
300
Keywords: DR/FTIR; thermal activation; silanol groups; fly ash.
1. INTRODUCTION
The coal fired power plant which consumes pulverized solid fuels composed of combustibleorganic matter with varying amount of inorganic mineral parts produce large amount of solidwaste fly ash. Every year a crude estimation of 600 million tons of fly ash generatedworldwide [1] and about 110 million tons only in India [2]. The combustible gasification takesplace in coal fired boiler at an operative temperature 1450ºC under reducing atmosphere.The mixture of effluent gases is cooled and fly ash gets solidify at temperature from 950ºC to400ºC. In the form of spherical particles consisting of SiO2 , Al2O3, Fe2O3, CaO, MgO andalkali in varying amounts with some unburned activated carbon [3]. As per the ASTM C618-12a guideline [4] the fly ash containing >70% SiO2, Al2O3 and Fe2O3 is classified as Class Ftype fly ash and those consists mainly of silica, alumina and calcium containing SiO2, Al2O3and Fe2O3 minimum upto 50 % are referred to as Class C fly ash. Class F type fly ash isused in agriculture, metal recovery, water and atmospheric pollution control [5] while class Ctype fly ash is used in cement production [6], steam cured bricks manufacturing [7] etc.Calcination temperature of fly ash before using as source material for synthesis of concretematerial and geopolymer etc. is reported to be crucial for the end product [8]. Fly ash has acomplex microstructure comprising of mixture of amorphous and crystalline components.The chemical and mineralogical compositions of fly ash vary with coal source as well ascalcination temperature [9]. Fly ash also contains different amount of unburned carbon whichmay reach upto 17% [10] responsible for high ignition loss and undesirable constituents forgeopolymerisation and concrete formation. Fly ash is also being used as heterogeneouscatalytic support material due to high silica, surface mineralogy, morphology and surfacesilanol groups [11, 12]. Both the adsorbed water and silanol groups on surface may affectthe surface modification process thus play important roles in catalytic application on silicasurface. It is difficult to distinguish between the adsorbed moisture and actual surfacehydroxyl groups in a form of crystalline water or amorphous silanol (Si-OH) [13]. Literaturereports that high temperature calcination forms new crystalline phases on fly ash surfacemodifying siloxane groups (Si-O-Si) and different forms of silanol groups [8]. Therefore it isof interest to understand the modification of fly ash mineralogy and morphology with thermalactivation by using Diffuse Reflectance Fourier Transform Infrared (DR\FTIR) spectroscopictechnique, which is one of the advance techniques to illustrate the chemical structure of thebonding materials. The results of the DR\FTIR study are supported by other characterizationtools such as X-ray Fluorescence (XRF), X-ray Diffraction (XRD) and Scanning ElectronMicroscopy (SEM).
2. EXPERIMENTAL DETAILS
2.1 Materials
The coal fly ash (Class F type with SiO2 and Al2O3 > 70%) used in this study was collectedfrom Jamshedpur Thermal Power Station (Jamshedpur, Jharkhand, India). Fly ash (FA) wasthermally activated by calcining in muffle furnace at 400, 600, 800 and 1000ºC for 3h andabbreviated as TFA-400, TFA-600, TFA-800 and TFA-1000 respectively (TFA –Thermallyactivated fly ash).

International Research Journal of Pure & Applied Chemistry, 3(4): 299-307, 2013
301
2.2 Sample Preparation and Characterization
DR/FTIR analysis of fly ash samples were carried out by diluting fly ash samples with KBr in1:20 weight ratio and mixed gently with the help of mortar and pestle, being careful aboutatmospheric moisture absorption. In this study, FTIR spectra of the materials were recordedusing FTIR Tensor 27 Brucker with DR (Diffuse Reflectance) accessory. The spectra wererecorded in the range 550 – 4000 cm−1 with a resolution of 4 cm−1. The chemicalcomposition was determined by wavelength dispersive X-ray fluorescence (WD-XRF) modelBruker S8 Tiger. The detailed imaging information about the morphology and surface textureof the sample was provided by SEM (Philips XL30 ESEM TMP). The XRD measurementswere carried out using Bruker D8 Advance X-ray diffractometer with monochromatic CuKαradiation (λ = 1.54056 Å) in a 2θ range of 5-70º.
3. RESULTS AND DISCUSSION
The chemical composition of FA and all TFA samples reveals that major components of flyash are SiO2 and Al2O3. Some minor components like Fe2O3, CaO, MgO, TiO2, Na2O, K2Oand trace elements around 1.5 wt% are also present in FA and all TFA samples (Table 1).The thermal activation of fly ash removes C, S, moisture and other adsorbed gases. Theremoval of moisture and co-existing unburned carbon increases with increasing temperature[14]. It can be concluded that all the compounds remained almost constant after thermaltreatment, besides a reduction in Na2O, K2O and other elements in all TFA samples.
Table 1. Chemical composition of FA and all TFA samples
Sample SiO2(wt%)
Al2O3(wt%)
Fe2O3(wt%)
CaO(wt%)
MgO(wt%)
TiO2(wt%)
Na2O(wt%)
K2O(wt%)
Otherelements(wt%)
FA 62 30 3.0 0.4 0.3 1.4 0.4 0.8 1.7TFA-400 62.3 30 3.2 0.4 0.3 1.4 0.3 0.5 1.6TFA-600 62.5 30.1 3.2 0.3 0.3 1.4 0.3 0.3 1.6TFA-800 62.8 30.3 3.2 0.3 0.2 1.3 0.2 0.2 1.5TFA-1000 63 30.5 3.2 0.3 0.2 1.3 0.2 0.1 1.2
The FTIR spectra in Fig. 1 shows a broad band between 3400-3000 cm−1, which isattributed to surface –OH groups of silanol groups (-Si-OH) and adsorbed water moleculeson the surface. The broadness of band indicates the presence of strong hydrogen bonding[11]. The gradual decrement in the intensity and broadness in this band, as shown in Fig. 1confirms loss of water in all TFA samples during thermal activation. Most of the molecularwater gets removed from the sample by heating up to 250ºC, while crystalline –OH remainsin the sample till 700ºC [15]. A peak around 1607 cm−1 (Fig. 1) is attributed to bending mode(δO-H) of water molecule [16] which is shown in all fly ash samples. A broad band rangingfrom 1070 cm−1 to 1170 cm−1 due to Si–O–Si asymmetric stretching vibrations [17] of silicais present in FA and all TFA samples. FA shows Si–O–Si asymmetric stretching vibrationcentered at 1100 cm−1 which get shifted towards higher wave number at 1162 cm−1 in caseof TFA-1000. This high wave number shift is the result of loss of water thus transformation ofQ3 units [Si (OH) (SiO4)3] to Q4 units [Si (SiO4)4] thus decrease in silanol groups (-Si-OH).This phenomenon shows reverse accordance with the statement that an increase in thehydroxide concentration shifts the position of the maximum absorbance of Si-O bandstoward lower number, indicating the transformation of Q4 units [Si (SiO4)4] to Q3 units [Si(OH)

International Research Journal of Pure & Applied Chemistry, 3(4): 299-307, 2013
302
(SiO4)3] [18]. Peak at 2887 cm−1 could be assigned to C-H stretching vibration of organiccontaminants which may be introduced during sample handling or some hydrocarbonpresent in fly ash [17.] This peak shows high intensity in FA while on thermal activationorganic contaminants get removed from FA and show low intense peak in all TFA samplesas compared to FA. Peaks appeared around 2343 cm-1 attributed to ν O-H stretching [19],2241 cm-1 responsible for H-SiO3 [20], 1984 cm-1 due to =Si-H monohydride [21], 1872 cm-1
due to calcium carbonate [22] present in FA and all TFA samples (Table 2). Peaks centeredat 1521 cm−1 [23] and 1681 cm−1 [17] are due to (CO3)2 – stretching vibration show highestintensity in FA, which is reduced on thermal activation in all TFA samples conferring thatduring thermal activation C and C associated impurities like CO2 are removed with increasedtemperature. A peak related to Al-O-Si stretching vibration appears around 600 cm−1 [24]and is present in FA and all TFA samples (Table 2) conferring that Si and Al are present insilico aluminate phase not affected by thermal activation [25].
Fig. 1. DR/FTIR spectra of (a) FA (b) TFA-400 (c) TFA-600 (d) TFA-800 (e) TFA-1000Table 2. Different DR/FTIR observed frequencies of (1.) FA (2.) TFA-400 (3.) TFA-600
(4.) TFA-800 (5.) TFA-1000 and their possible assignments

International Research Journal of Pure & Applied Chemistry, 3(4): 299-307, 2013
303
Assignments FA TFA-400 TFA-600 TFA-800 TFA-1000 Referenceno.
Si-O-Al stretchingvibration
600 611 589 592 603 24
Si-O-Si asymm.StretchingVibration
1100 1102 1113 1148 1162 17
(CO3)2- –stretchingvibration
1521,1679
1519,1686
1519,1680
1519,1683
1521,1681
23,17
H-O-H bendingVibration
1608 1606 1606 1607 1607 16
CalciumCarbonate
1872 1872 1872 1872 1873 22
=Si-H(monohydride)
1984 1984 1986 1984 1987 21
H-SiO3 2241 2240 2244 2236 2250 20
ν -O-H stretchingvibration
2343 2344 2341 2347 2345 19
-C–H stretchingvibration
2827 2887 2886 2890 2895 17
-O-H stretchingvibration
3553 3096 3276 3327 3260 11
The SEM image (Fig. 2) of FA demonstrates particles of different shapes and sizes, hollowcenospheres, irregularly shaped unburned carbon particles, miner aggregates andagglomerated particles whereas the typical SEM image of TFA-1000 shows different shapeand size particles while irregular shaped unburned carbon is not seen. Some fused silicaparticles are showing which has been formed during thermal activation [11].
(a) (b)
Fig. 2. SEM images of (a) FA (b) TFA-1000
The XRD patterns of FA and TFA-1000 are shown in Fig. 3. In both FA and TFA-1000,peaks at 2θ values of 16.4º, 25.9º and 26.2º show presence of mullite (alumino-silicate)
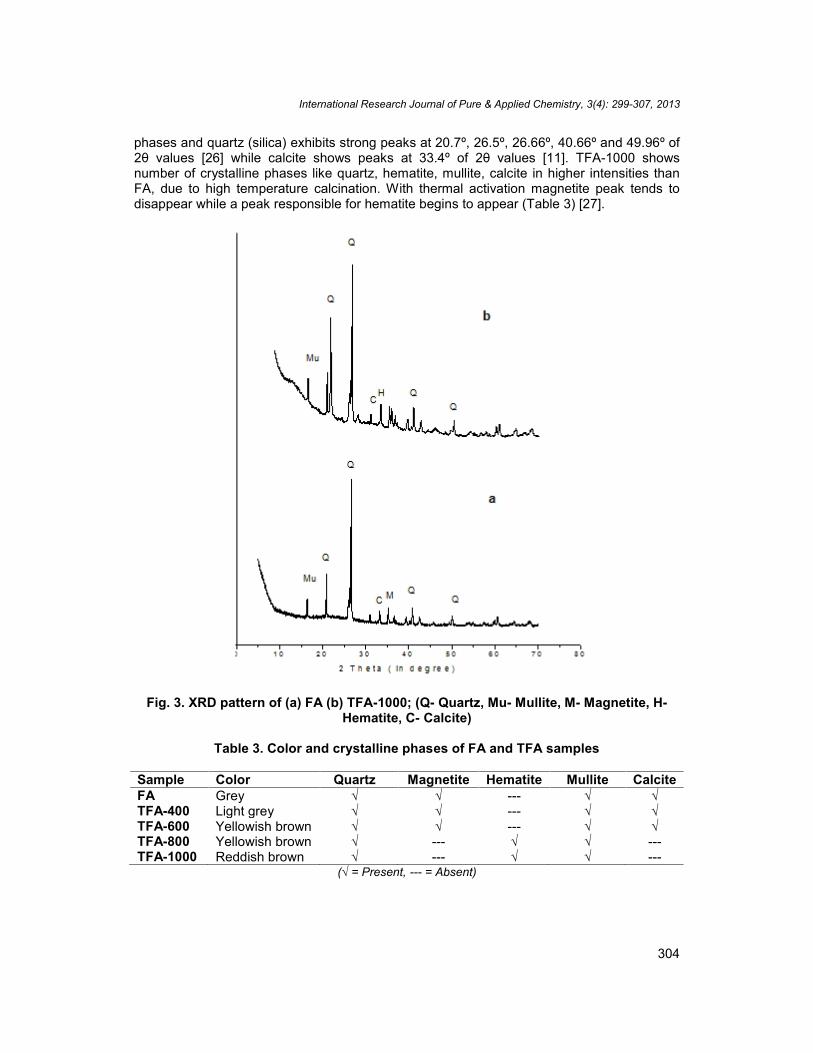
International Research Journal of Pure & Applied Chemistry, 3(4): 299-307, 2013
304
phases and quartz (silica) exhibits strong peaks at 20.7º, 26.5º, 26.66º, 40.66º and 49.96º of2θ values [26] while calcite shows peaks at 33.4º of 2θ values [11]. TFA-1000 showsnumber of crystalline phases like quartz, hematite, mullite, calcite in higher intensities thanFA, due to high temperature calcination. With thermal activation magnetite peak tends todisappear while a peak responsible for hematite begins to appear (Table 3) [27].
Fig. 3. XRD pattern of (a) FA (b) TFA-1000; (Q- Quartz, Mu- Mullite, M- Magnetite, H-Hematite, C- Calcite)
Table 3. Color and crystalline phases of FA and TFA samples
Sample Color Quartz Magnetite Hematite Mullite CalciteFA Grey √ √ --- √ √TFA-400 Light grey √ √ --- √ √TFA-600 Yellowish brown √ √ --- √ √TFA-800 Yellowish brown √ --- √ √ ---TFA-1000 Reddish brown √ --- √ √ ---
(√ = Present, --- = Absent)

International Research Journal of Pure & Applied Chemistry, 3(4): 299-307, 2013
305
Variation of colors and crystalline phases of FA and TFA calcined at different temperaturesis shown in Table 3. Initially fly ash was of grey color due to presence of unburned carboncontent with increase in thermal activation temperature grey color of fly ash changes toyellowish brown and then finally red brown possibly due to hematite crystallization [8].
4. CONCLUSION
In each DR/FTIR spectrum broad band ranging from 3000-3400 cm-1 is showing asuccessive decrement in the intensity with increasing thermal activation temperature. It isthus revealed that as the temperature increases, physically adsorbed water is removed first,then silanol groups on surface is dehydrated resulting in transformation of Q3 units [Si(OH)(SiO4)3] to Q4 units [Si (SiO4)4]. Due to thermal activation of fly ash, SiO2, Al2O3 are increasedwhich is also evidenced by increased intensity of quartz and mullite phases, the magnetitephases are converted into hematite phase at higher temperature. It can be concluded thatmodification in properties of fly ash with reference to Si-OH, intensity and crystallinity ofcrystalline phases can be achieved by thermal activation method to generate a solid supportmaterial for catalytic applications.
ACKNOWLEDGEMENT
SEM and XRD characterizations were performed at UGC-DAE Consortium for ScientificResearch, Indore. The authors are thankful to Dr. D.M. Phase and Er. V.K. Ahiray for SEM-EDX analysis and Dr. Mukul Gupta for XRD analysis. The authors are also thankful to SAIF,Punjab University for their XRF facility. Stuti katara is thankful to University GrantsCommission, New Delhi, India for their financial support through Senior Research Fellowshipscheme.
COMPETING INTERESTS
Authors have declared that no competing interests exist.
REFERENCES
1. Yao ZT, Xia MS, Ye Y, Zhang L. Synthesis of zeolite Li-ABW from fly ash by fusionmethod. J Hazard Mater. 2009;170(2):639-44. doi:10.1016/j.bbr.2011.03.031.
2. Senapati MR. Fly ash from thermal power plants - waste management and overview.Curr Sci. 2011;100(12).
3. Kutchko BG, Kim AG. Fly ash characterization by SEM–EDS. Fuel. 2006;85(17):2537-44. doi:10.1016/j.fuel.2006.05.016.
4. American Society for Testing and Materials (ASTM), ASTM C618 – 12a,“Standardspecification for coal fly ash and raw or calcined natural pozzolan for use in concrete”,Annual book of ASTM standards, Vol.04.02, Philadelphia, Pennsylvania,1994.
5. Blanco F, Garcia MP, Ayala J. The effect of mechanically and chemically activated flyashes on mortar properties. Fuel. 2006;85(14):2018–26.doi:10.1016/j.fuel.2006.03.031.
6. Sahu S, Majling J. Preparation of sulphoaluminate belite cement from fly ash. CemConcr Res. 1994;24(6):1065-72. doi:10.1016/0008-8846(94)90030-2.
7. Scheetz BE, Earle R. Utilization of fly ash. Curr Opin Solid State MaterSci.1998;3(5):510-20. doi:10.1016/S1359-0286(98)80017-X.
International Research Journal of Pure & Applied Chemistry, 3(4): 299-307, 2013
306
8. Temuujin J, Riessen AV. Effect of fly ash preliminary calcination on the properties ofgeopolymer. J Hazard Mater. 2009;164:634–39. doi:10.1016/j.jhazmat.2008.08.065.
9. Van Jaarsveld JSG, Van Deventer JSJ, Lukey GC. The characterisation of sourcematerials in fly ash-based geopolymers. Mater Lett. 2003;57(7):1272–80. doi:10.1016/S0167-577X(02)00971-0.
10. Gray ML, Champagne KJ, Soong Y, Killmeyer RP, Maroto-Valer MM, Andresen JM etal. Physical cleaning of high carbon fly ash. Fuel Process Technol. 2002;76(1):11–21.doi:10.1016/S0378-3820(02)00006-1.
11. Khatri C, Rani A. Synthesis of a nano-crystalline solid acid catalyst from fly ash and itscatalytic performance. Fuel. 2008;87(13):2886–92. doi:10.1016/j.fuel.2008.04.011.
12. Jain D, Rani A. MgO enriched coal fly ash as highly active heterogeneous basecatalyst for Claisen-Schmidt condensation reaction. Am Chem Sci J. 2011;1(2):37-49.
13. Peng L, Qisui W, Xi L, Chaocan Z. Investigation of the states of water and OH groupson the surface of silica. Colloids and Surfaces A: Physicochem Eng Aspects.2009;334:112–15. doi:10.1016/j.colsurfa.2008.10.028.
14. Kordatos K, Gavela S, Ntziouni A, Pistiolas KN, Kyritsi A, Rigopoulou VK. Synthesis ofhighly siliceous ZSM-5 zeolite using silica from rice husk ash. Micropor MesoporMater. 2008;115(1-2):189-96. doi:10.1016/S0167-577X(02)00971-0.
15. Richardson IG. The calcium silicate hydrates. Cem Concr Res. 2008;38:137–58.16. Palomo A, Grutzeck MW, Blanco MT. Alkali-activated fly ashes a cement for the
future. Cem Concr Res. 1999;29:1323-29.17. Saikia BJ, Parthasarthy G, Sarmah NC, Baruah GD. Fourier-transform infrared
spectroscopic characterization of naturally occurring glassy fulgurites. Bull Mater Sci.2008;31(2):155–58.
18. Morten ES, Camilla S, Li Z, Sogaard EG. Xps and Ft-Ir Investigation of SilicatePolymers. J Mater Sci. 2009;44:2079–88. doi:10.1007/s10853-009-3270-9.
19. Zaki MI, Knozinger H, Tese B, Mekhemer GAH. Influence of phosphonation andphosphation on surface acid–base and morphological properties of CaO asinvestigated by in situ FTIR spectroscopy and electron microscopy. J colloid InterfaceSci. 2006;303(1):9-17. doi: 10.1016/j.jcis.2006.07.011.
20. Sun XH, Wang SD, Wong NB, Ma DDD, Lee ST, Teo BK. FTIR spectroscopic studiesof the stabilities and reactivities of hydrogen-terminated surfaces of silicon nanowires.Inorg Chem. 2003;42(7):2398-404. doi:10.1021/ic020723e.
21. Blanco F, Garcia MP, Ayala J. Variation in fly ash properties with milling and acidleaching. Fuel. 2005;84(1):89-96. doi:10.1016/j.fuel.2004.05.010.
22. Jacox EM. Vibrational and Electronic Energy Levels of Polyatomic TransientMolecules Supplement B. J Phys Chem Ref Data. 2003;32(1). doi:10.1063/1.1497629.
23. Handa H, Baba T, Sugisawa H, Ono Y. Highly efficient self-condensation ofbenzaldehyde to benzyl benzoate over KF-loaded alumina. J Mol Catal A Chem.1998;134(1):171-77. doi:10.1016/S1381-1169(98)00033-8.
24. Frances IH, Denisse VA, Meghan EG. High temperature aerogels in the Al2O3-SiO2system. Presented at the American chemical society 236th national meetingPhiladelphia, Pa, August 20, 2008. Accessed 24 May 2013.Available: http://usrp.usra.edu/technicalPapers/glenn/arrandaAug08.pdf.
25. Temuujin J, Okada K, Kenneth JDM. Preparation and properties of potassiumaluminosilicate prepared from the waste solution of selectively leached calcinedkaolinite. Appl Clay Sci. 2002;21:125–31. doi:10.1016/S0169-1317(01)00082-5.
26. Sharma A, Srivastava K, Devra V, Rani A. Modification in Properties of Fly Ashthrough Mechanical and Chemical Activation. Am Chem Sci J. 2012;2(4):177-87.
International Research Journal of Pure & Applied Chemistry, 3(4): 299-307, 2013
307
27. Fox JM. Changes in fly ash with thermal treatment. Presented in 2005 World of CoalAsh (WOCA), April 11-15,2005, Lexington, Kentucky, USA. Accessed 24 May 2013.Available: http://www.flyash.info/2005/132fox.pdf.
_________________________________________________________________________© 2013 Katara et al.; This is an Open Access article distributed under the terms of the Creative CommonsAttribution License (http://creativecommons.org/licenses/by/3.0), which permits unrestricted use, distribution, andreproduction in any medium, provided the original work is properly cited.
Peer-review history:The peer review history for this paper can be accessed here:
http://www.sciencedomain.org/review-history.php?iid=245&id=7&aid=1733

ISSN: 2319-8753
International Journal of Innovative Research in Science,
Engineering and Technology
(An ISO 3297: 2007 Certified Organization)
Vol. 2, Issue 9, September 2013
Copyright to IJIRSET www.ijirset.com 4319
Characterization and Study of Turkish Perlite
Sakshi Kabra1, Stuti Katara
2, Ashu Rani
3*
Research Scholar, Department of Pure and Applied Chemistry, University of Kota, Kota, Rajasthan, India1
Research Scholar, Department of Pure and Applied Chemistry, University of Kota, Kota, Rajasthan, India2
Head, Department of Pure and Applied Chemistry, University of Kota, Kota, Rajasthan, India3*
Abstract: An examination of the structural, morphological and mineralogical features of Turkish perlite sample was
carried out by FT-IR, SEM, SEM-EDX, XRD, TGA and N2-adsorption-desorption analytical techniques. Perlite is a
natural, silica enriched igneous rock. This article features the primary step of study of basic characterization of perlite
to investigate its utilization in different areas. Higher silica and alumina content was shown by EDX analysis. Both
XRD and FT-IR studies reveal the presence of amorphous silica in perlite. TGA and LOI analysis illustrate the
presence of water in the sample. The irregular morphology was exposed through SEM images. It was evident from the
results that silica-enriched perlite could be developed further into a potential material in several area including catalyst
synthesis by using various activation techniques.
Keywords: perlite, characterization, XRD, FT-IR.
I. INTRODUCTION
The basic objective of this paper is to provide the comprehensive characterization of Turkish perlite and suggest its
suitability towards several fields of utilization. Perlite is a hydrated, widely occurring amorphous igneous rock formed
by cooling of volcanic eruptions. Its unique structure consists of numerous concentric layers having SiO2, Al2O3, K2O
and Na2O as major constituents while TiO2, CaO, MgO, Fe2O3 and hydrated water as well as unburned carbon remain
present in varying quantities [1]. On heating the perlite to its softening range, i.e., above 850°C, crystalline water
molecules vaporize and escape resulting in unusual expansion of perlite up to 7-16 times of its original volume,
creating inert, non-toxic, lightweight particles with specific surface area of about 1.22 m2g
-1 [2], density in the range of
0.6 - 2.30 gml-1
[3] and particle size in range of 0.2-4 mm. [4]. Physio-chemical properties of perlite need to be
examined prior to evaluation of its possible utilization in various fields. As far as applications of perlite are concerned,
it is mainly consumed as fillers, filter aids, in producing building construction materials [5], [6], adsorptive materials,
precursor for geo-polymer formation [7], removal of heavy metal ions and other pollutants from atmosphere [8], in
thermal insulation [9], removal of dyes [10], [11], in horticulture [12], sorption of oil [4] etc. Perlite is a naturally
occurring waste, estimating about 700 million tons worldwide reserves. Turkey has rich resources of perlite,
approximately 160 tons [13], since, domestic demand is very limited, so, most of the produced perlite is exported to
various countries including India. Thus its effective, conducive and eco-friendly utilization has always been a challenge
for scientific community. Above applications could thrive up to only some level in utilizing the huge reserves of perlite.
However, the search of new applications of the perlite as either catalyst or catalyst support material is still enduring.
Literature accounts only for the few applications of perlite as photo catalyst [14], pyrolysis catalyst [15] and catalyst
used for different chemical reactions such as, immobilization [16], methacrolein production [17], zeolite synthesis [18],
[19] etc.
The objective of the present work is to characterize perlite, in terms of structure, mineralogical composition,
chemical behaviour, colour and morphology. This is the foundation stone in our research work to investigate the
physio-chemical properties of perlite for its utilization in different fields. This paper mainly deals with identification of

ISSN: 2319-8753
International Journal of Innovative Research in Science,
Engineering and Technology
(An ISO 3297: 2007 Certified Organization)
Vol. 2, Issue 9, September 2013
Copyright to IJIRSET www.ijirset.com 4320
characteristics of perlite and their study using spectroscopic and microscopic analysis through FT-IR, SEM, SEM-
EDX, XRD, TGA and N2-adsorption-desorption techniques.
II. EXPERIMENTAL
A. Materials
Perlite sample was imported from Turkey and supplied to us by Indica Chem. Ind. Pvt. Ltd., India.
B. Procedure
Perlite sample was taken as such and thermally treated in a muffle furnace under static conditions at 800°C for 3 h and
named as TAP.
C. Characterization
Physiochemical properties of perlite and TAP were studied by FT-IR, SEM and SEM-EDX, XRD, TGA, and N2
adsorption-desorption studies.
The FT-IR study of the sample was done by Bruker FT-IR Spectrophotometer (TENSOR 27) in DRS mode by mixing
samples with KBr in 1:20 weight ratio. The spectra were recorded in the range 550-4000 cm-1
with a resolution of
4 cm-1
. SEM (Model-JEOL-JSM 5600) was used to investigate morphology and surface texture of the sample while
elemental analysis was studied by SEM-EDX analysis (Model-INCA Oxford). X-ray diffraction study was done by X-
ray powder diffractometer (Bruker D8 Advance) using Cu Kα radiation (λ = 1.5406A˚). The samples were scanned in
2θ range of 5-65˚ at a scanning rate of 0.04˚s-1
. TGA of the sample was carried out using Mettler Toledo thermal
analyser (TGA/DSC1 SF/752), by heating the sample in the range of 50–850 °C with a heating rate of 10 °C/min under
nitrogen flow (50 cm3/min). BET surface area of the samples was measured at liquid nitrogen temperature (77 K) using
Quantachrome NOVA 1000e surface area analyser. The samples were degassed under vacuum at 120 °C for 2 h, prior
to measurement.
III. RESULTS AND DISCUSSION
Perlite is white or light-gray coloured material which turns to light pinkish on thermal treatment. FT-IR spectrum of
perlite and TAP (Fig. 1) shows a broad band between 3600-3300 cm-1
, which is attributed to surface –OH groups of –
Si-OH and water molecules adsorbed on the surface. The broadness of band indicates the presence of strong hydrogen
bonding in the sample [20]. The hydroxyl groups exist in higher degree of association with each other which results in
extensive hydrogen bonding, while in FT-IR spectrum of TAP, the intensity and broadness of band is decreased which
confirms the loss of water (Fig. 1b). The strong band at 1178 cm-1
is due to the structural siloxane framework, which is
the vibrational frequency of the Si-O-Si bond. The peak is shifted to higher wave number, i.e., 1192 cm-1
after thermal
treatment, which is normally observed in amorphous silica samples [21]. An intense peak at 1633 cm-1
in the spectrum
of perlite is attributed to bending mode (δO-H) of water molecule [22], which is again highly decreased in case of TAP.
The region around 805 cm-1
is characteristic of Si-O-Si symmetric stretching modes [23], [24]. Amorphous silica
exhibited a relatively strong peak at about 800 cm–1
and it can be distinguished from the band of crystalline silicate
[25]. The observed frequencies of IR bands of perlite and their possible assignments are summarized in Table 1.
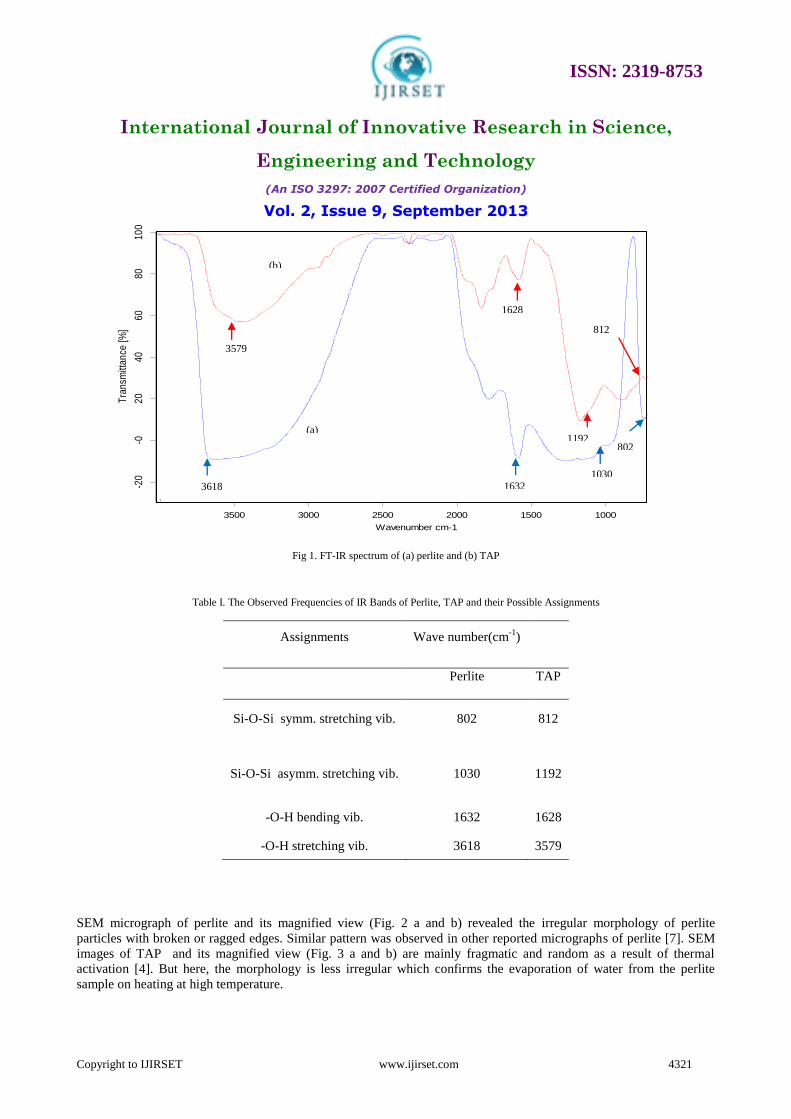
ISSN: 2319-8753
International Journal of Innovative Research in Science,
Engineering and Technology
(An ISO 3297: 2007 Certified Organization)
Vol. 2, Issue 9, September 2013
Copyright to IJIRSET www.ijirset.com 4321
Fig 1. FT-IR spectrum of (a) perlite and (b) TAP
Table I. The Observed Frequencies of IR Bands of Perlite, TAP and their Possible Assignments
Assignments Wave number(cm-1
)
Perlite TAP
Si-O-Si symm. stretching vib. 802 812
Si-O-Si asymm. stretching vib. 1030 1192
-O-H bending vib.
H-O-H bending vib.
1632 1628
-O-H stretching vib.
-O-H stretching vib.
3618 3579
SEM micrograph of perlite and its magnified view (Fig. 2 a and b) revealed the irregular morphology of perlite
particles with broken or ragged edges. Similar pattern was observed in other reported micrographs of perlite [7]. SEM
images of TAP and its magnified view (Fig. 3 a and b) are mainly fragmatic and random as a result of thermal
activation [4]. But here, the morphology is less irregular which confirms the evaporation of water from the perlite
sample on heating at high temperature.
D:\FTIR DATA\New Folder\BS\EXSTRA\BASE-RAW FA JAMESHEDPUR.0 BASE-RAW FA JAMESHEDPUR DRS
D:\FTIR DATA\New Folder\BS\EXSTRA\BASE-MAFA JAMESHEDPUR.0 BASE-MAFA JAMESHEDPUR DRS
17/03/2012
17/03/2012
3433
.43
1983
.54
1871
.98
1792
.88
1614
.45
1309
.23
1037
.17
752.
8670
8.07
635.
6659
4.70
100015002000250030003500
Wavenumber cm-1
-20
-02
04
06
08
01
00
Tra
nsm
ittan
ce [
%]
Page 1/1
(a)
(b)
3618
3579
1632
1628
1030
802 1192
812
D:\FTIR DATA\New Folder\BS\EXSTRA\BASE-RAW FA JAMESHEDPUR.0 BASE-RAW FA JAMESHEDPUR DRS
D:\FTIR DATA\New Folder\BS\EXSTRA\BASE-MAFA JAMESHEDPUR.0 BASE-MAFA JAMESHEDPUR DRS
17/03/2012
17/03/2012
3433
.43
1983
.54
1871
.98
1792
.88
1614
.45
1309
.23
1037
.17
752.
8670
8.07
635.
6659
4.70
100015002000250030003500
Wavenumber cm-1
-20
-02
04
06
08
01
00
Tra
nsm
ittan
ce [
%]
Page 1/1 D:\FTIR DATA\sakshi\VA NEW.0 VA NEW DRS
D:\FTIR DATA\sakshi\TAVA-800.3HUNWASH.1 TAVA-800.3HUNWASH DRS
20/09/2011
26/09/2011
36
17.8
5
34
64.9
8
23
45.5
523
35.8
2
18
69.6
918
15.6
5
16
32.5
316
26.2
1
13
09.8
7
12
27.0
2
94
1.6
6
80
2.5
167
7.4
960
8.4
060
5.7
658
3.0
457
9.5
357
2.3
5
100015002000250030003500
Wavenumber cm-1
20
40
60
80
10
0
Tra
nsm
itta
nce
[%
]
Page 1/1

ISSN: 2319-8753
International Journal of Innovative Research in Science,
Engineering and Technology
(An ISO 3297: 2007 Certified Organization)
Vol. 2, Issue 9, September 2013
Copyright to IJIRSET www.ijirset.com 4322
(a) (b)
Fig 2. SEM micrograph of (a) perlite and (b) its magnified view
(a) (b)
Fig 3. SEM micrograph of (a) TAP and (b) its magnified view
The chemical composition of perlite and TAP were determined by SEM-EDX technique which is shown in Table 2.
Table II. EDX Analysis of Perlite and TAP
Samples O(wt%) Si(wt%) Al(wt%) K(wt%) Na(wt%) Zn(wt%) Fe(wt%) Ti(wt%) S(wt%) LOI
Perlite 73.70 18.83 3.72 1.44 1.91 0.22 0.10 0.07 - 4.1
TAP 73.60 18.80 3.70 1.34 1.91 0.22 0.10 0.07 - -
Loss on ignition (LOI) was determined by heating a certain weighed quantity of perlite in muffle furnace at 800˚C for 3
h. The LOI amount was 4.1 wt % which corresponds to the removal of moisture and coexisting unburned carbon from
sample [26]. The TGA curve of perlite, as shown in Fig. 4, shows continuous decrease in weight of sample from 50-

ISSN: 2319-8753
International Journal of Innovative Research in Science,
Engineering and Technology
(An ISO 3297: 2007 Certified Organization)
Vol. 2, Issue 9, September 2013
Copyright to IJIRSET www.ijirset.com 4323
900°C. Weight loss in lower temperature range relates to the removal of moisture content of the sample together with
some volatile materials. While, the weight loss of sample within range of 550-900˚C would correspond to the burning
of carbonaceous materials that were firmly adsorbed on the surface of the solid materials remaining or volatilization of
some trace metal oxides [27].
Fig 4. TGA curve of perlite
BET surface area of perlite and TAP samples were found to be 2.6 and 2.3 m2/g respectively.
The broad powder X-ray diffraction pattern of perlite (Fig. 5a), confirmed the absence of any ordered crystalline
structure [28] which is typical for amorphous solids. However, heating of perlite at temperature over 800˚C for 3 h
could convert less ordered structure to a more highly ordered structure and a single crystalline peak appears at 2θ =
27.642˚ (Fig. 5b) which shows presence of quartz in the sample [29], along with a broad peak at 2θ = 22-23˚
confirming amorphous nature of silica [24], [30].
Fig 1. X-ray diffraction pattern of perlite

ISSN: 2319-8753
International Journal of Innovative Research in Science,
Engineering and Technology
(An ISO 3297: 2007 Certified Organization)
Vol. 2, Issue 9, September 2013
Copyright to IJIRSET www.ijirset.com 4324
IV. CONCLUSIONS
Results obtained in the present investigation confirm silica and alumina as major constituents of perlite. It is also
observed that the nature of silica in perlite is mainly amorphous with irregular morphology and only a single crystalline
peak appears on thermal treatment. On the basis of analysis, it can also be said that high number of hydroxyl groups
and Si-O-Si network is also present in perlite. Moreover, comparison of perlite with TAP shows the effects of thermal
treatment on structure, mineralogy, colour, surface area and morphology of perlite. The contemporary report aims at
study of fundamental characteristics of perlite for its further applications in novel fields. The results like presence of
amorphous silica network and surface hydroxyl groups in perlite indicate towards the potential capability of perlite as a
support material in catalyst synthesis.
Fig 5. X-ray diffraction pattern of (a) Perlite and (b) TAP
(a)
(b)
Inte
nsi
ty (
cou
2 Theta Degree
nts
)
2 Theta Degree

ISSN: 2319-8753
International Journal of Innovative Research in Science,
Engineering and Technology
(An ISO 3297: 2007 Certified Organization)
Vol. 2, Issue 9, September 2013
Copyright to IJIRSET www.ijirset.com 4325
ACKNOWLEDGEMENT
The authors are thankful to Dr. Mukul Gupta, Dr. D.M. Phase, Er. V.K. Ahiray from UGC-DAE CSR Lab, Indore,
India for XRD and SEM, SEM-EDX respectively. The financial support was provided by Fly Ash Mission, DST, New
Delhi, India. The authors are also grateful to UGC, New Delhi, India for their Junior Research Fellowship scheme.
REFERENCES
[1] Dogan, M., Alkan, M., Cakir, U., “Electrokinetic Properties of Perlite”, J. Colloid Interface Sci. Vol. 192, pp.114-18, 1997. [2] Dogan, M., Alkan, M., “Adsorption kinetics of methyl violet onto perlite”, Chemosphere, Vol.50, pp.517-28, 2003.
[3] Roulia, M., Chassapis, K.., Kapoutsis, J.A.., Kamitsos, E.I., Savvidis, T., “Influence of thermal treatment on the water release and the glassy
structure of perlite”,J. Mater. Sci., Vol.41, pp.5870-81, 2006. [4] Bastani, D., Safekordi, A.A., Alihosseini, A., Taghikhani, V., “Study of oil sorption by expanded perlite at 298.15 K”, Sep. Purif. Technol.,
Vol.52, pp.295-300, 2006.
[5] Morsy, M.S., Shebl, S.S., Abd El Gawad Saif, M., “Development of perlite-gypsum-slag-Lime sludge-composite system for building application”,Building Research Journal, Vol.56, pp.49-58, 2008.
[6] Aglan, H., Morsy, M., Allie, A., Fouad, F., “Evaluation of fiber reinforced nanostuctured perlite-cementitious surface compounds for building
skin applications”, Construction and Building Materials, Vol.23 (1), pp.138-45, 2009. [7] Vance, E.R., Perera, D.S., Imperia, P., Cassidy, D.J., Davis, J., Gourley, J.T., “Perlite Waste as a Precursor for Geopolymer Formation”,
Journal of the Australian Ceramic Society, Vol.45 (1), pp.44-49, 2009. [8] Mostaedi, M.T., Ghassabzadeh, H., Maragheh, M.G., Ahmadi, S.J., Taheri, H., “Removal of cadmium and nickel from aqueous solution using
expanded perlite”, Brazilian Journal of Chemical Engineering, Vol.27 (2), pp. 299-308, 2010.
[9] Vaou, V., Panias, D., “Thermal insulating foamy geopolymers from perlite”, Miner. Eng., Vol.23 (14), pp.1146-51, 2010. [10] Vijaykumar, G., Dharmendirakumar, M., Renganathan, S., Sivanesan, S., Baskar, G., Elango, K.P., “Removal of Congo Red from Aqueous
Solutions by Perlite”, Clean- Soil, Air, Water, Vol.37 (4-5), pp.355-64, 2009.
[11] Dogan, M., Alkan, M., “Removal of methyl violet from aqueous solution by perlite”, J. Colloid Interface Sci., Vol.267 (1), pp. 32-41, 2003. [12] Silber, A., Bar-Yosef, B., Levkovitch, I., Kautzky, L., Minz, D., “Kinetics and mechanisms of pH-dependent Mn (II) reactions in plant-growth
medium”, Soil Biol. Biochem., Vol. 40, pp. 2787-95, 2008.
[13] Celik, A.G., Kilic, A.M., Cakal, G.O., “Expanded perlite aggregate characterization for use as a lightweight construction raw material”, Physicochem. Probl. Miner. Process. Vol. 49 (2), pp. 689-700, 2013.
[14] Hosseini, S.N., Borghei, S.M., Vossoughi, M., Taghavinia, N., “Immobilization of TiO2 on perlite granules for photocatalytic degradation of
phenol”, Appl. Catal., B, Vol. 74 (1-2), pp. 53-62, 2007. [15] Balat, M., “Diesel-like Fuel Obtained by Catalytic Pyrolysis of Waste Engine Oil”, Energy, Exploration and Exploitation, Vol. 26 (3), pp. 197-
208, 2008.
[16] Jafarzadeh, N.K., Sharifnia, S., Hosseini, S.N., Rahimpour, F., “Statistical optimization of process conditions for photocatalytic degradation of phenol with immobilization of nano TiO2 on perlite granules”, Korean J. Chem. Eng., Vol. 28 (2), pp. 531-38, 2011.
[17] Schlaefer, Francis, W., Hansen, A., “Methacrolein production utilizing novel Catalyst”, George, US Patent, 05/428, pp. 150, 1978.
[18] Kongkachuichay, P., Lohsoontorn, P., “Phase Diagram of Zeolite Synthesized from Perlite and Rice Husk Ash”, Science Asia, Vol. 32, pp. 13-
16, 2006.
[19] Wang, P., Shen, B., Shen, D., Peng, T., Gao, “Synthesis of ZSM-5 zeolite from expanded perlite/kaolin and its catalytic performance for FCC
naphtha aromatization”, J. Catal. Commun., Vol. 8 (10), pp. 1452-56, 2007. [20] Silverstein, R.M., Webster, F.X. Spectrometric Identification of Organic Compounds, Sixth ed., John Wiley Pub., Wiley India Pvt. Ltd., pp.
88., 2006.
[21] Adam, F., Balakrishnan, S., Wong, P.L., “Rice Husk Ash Silica as a Support Material for Ruthenium based Heterogenous Catalyst”, Journal of Physical Science, Vol. 17 (2), pp. 1-13, 2006.
[22] Khatri, C., Rani, A., “Synthesis of a nano-crystalline solid acid catalyst from fly ash and its catalytic performance”, Fuel, Vol. 87, pp. 2886-92,
2008. [23] Kabra, S., Sharma, A., Katara, S., Hada, R., Rani, A., „DRIFT- spectroscopic study of modification of surface morphology of perlite during
thermal activation”, Indian Journal of Applied Research, Vol. 3 (4), pp. 40-42, 2013.
[24] Javed, S.H., Naveed, S., Feroze, N., Zafar, M., Shafaq, M., “Crystal and Amorphous Silica from KMnO4 treated and untreated Rice Husk Ash”, Journal of Quality and Technology Management, Vol. 6 (1), pp. 81-90, 2010.
[25] Ojima, J., “Determining of Crystalline Silica in Respirable Dust Samples by Infrared Spectrophotometry in the Presence of Interferences”, J.
Occup. Health, Vol. 45, pp. 94-103, 2003. [26] Kordatos, K., Gavela, S., Ntziouni, A., Pistiolas, K.N., Kyritsi, A., Kasselouri-Rigopoulou, V., “Synthesis of highly siliceous ZSM-5 zeolite
using silica from rice husk ash”, Microporous Mesoporous Mater., Vol. 115 (1-2), pp. 189-96, 2008.
[27] Sekkina, M.M.A., Issa, R.M., El-Deen, A., Bastawisy, M., El-Helece, W.A., “Characterization and Evaluation of Thermodynamic Parameters for Egyptian Heap Fired Rice Straw Ash (RSA”, Int. J. Chem., Vol. 2 (1), pp. 81-88, 2010.
[28] Kalapathy, U., Proctor, A., Shultz, J., “A simple method for production of pure silica from rice hull ash”, Bioresour. Technol., Vol. 73, pp.
257-62, 2000.
[29] Jain, D., Khatri, C., Rani, A., “Synthesis and characterization of novel solid base catalyst from fly ash”, Fuel, Vol. 90, pp.2083-88, 2011. [30] Amutha, K., Ravibaskar, R., Sivakumar, G., “Extraction, Synthesis and Characterization of Nanosilica from Rice Husk Ash”, International
Journal of Nanotechnology and Applications, Vol. 4 (1), pp. 61-66, 2010.

ISSN: 2319-8753
International Journal of Innovative Research in Science,
Engineering and Technology
(An ISO 3297: 2007 Certified Organization)
Vol. 2, Issue 9, September 2013
Copyright to IJIRSET www.ijirset.com 4326
BIOGRAPHY
Mrs. Sakshi Kabra is pursuing Ph.D. from Department of Pure and Applied Chemistry,
University of Kota, Kota (Rajasthan). She secured All India Rank 385 in National
Eligibility Test (June-2009) and acquired UGC-JRF. She is currently working as UGC-
SRF in the department. Her research interests mainly include synthesis of heterogeneous
acid catalysts and their various applications, solid waste management, material synthesis
etc.
Ms. Stuti Katara is doing Ph.D. from Department of Pure and Applied Chemistry,
University of Kota, Kota (Rajasthan). She got all India Rank 353 in National Eligibility
Test (June-2009) and attained UGC-JRF. She is associated with solid base catalysis, green
catalysis etc. and presently working as UGC-SRF in the department.
Prof. Ashu Rani is Head, Department of Pure and Applied Chemistry, Dean of post
graduate departments and Convenor of various boards at University of Kota, Kota
(Rajasthan). Several research scholars are pursuing M. Phil and Ph. D. under her guidance.
Her wide research interests involve Heterogeneous Catalysis, Waste management, climate
change, Lithospheric salt transport kinetics, Nanotechnology, Material Synthesis. She is
associated with several National and International Collaborations and is a Principle
Investigator of several projects funded by central and state governments.
INDIAN JOURNAL OF APPLIED RESEARCH X 37
Volume : 3 | Issue : 4 | April 2013 | ISSN - 2249-555XReseaRch PaPeR Chemistry
Acid Activated fly Ash, as a Novel Solid Acid Catalyst for Esterification of Aetic Acid
Anita Sharma Stuti KataraDepartment of Pure and Applied Chemistry, University
of Kota-324005, Rajasthan, IndiaDepartment of Pure and Applied Chemistry, University
of Kota-324005, Rajasthan, India
Sakshi Kabra Ashu RaniDepartment of Pure and Applied Chemistry, University
of Kota-324005, Rajasthan, IndiaDepartment of Pure and Applied Chemistry, University
of Kota-324005, Rajasthan, India
Keywords Fly ash; Mechanical activation; Chemical activation; Acid treatment
ABSTRACT An efficient solid acid catalyst (AAFA) has been synthesized by mechanical and thermal activation of F-type fly ash (SiO2 and Al2O3>70%) followed by chemical activation using concentrated HCl at 110ºC. The activation of
fly ash resulted in increased silica content (79%) and surface area (5.42 m2/g) having sufficient silanol activity for esterification of n-butanol. The Catalyst was characterized by XRD, FT-IR, and SEM techniques. The product n-butyl acetate is an important fine chemical intermediate, widely used in pharmaceutical and as flavoring agent in confectionary. The catalyst was com-pletely recyclable without significant loss in activity up to five reaction cycles, which confers its stability during reaction. The work reports an innovative use of solid waste fly ash as an effective solid acid catalyst.
1. Introduction Acid catalyzed esterification is one of the most important industrial reactions, which are widely employed in synthetic organic process industries. Generally n-butyl esters of acetic acid are prepared under liquid phase, refluxing the reactant in the presence of small amount of concentrated H2SO4, HCl, HI, AlCl3, BF3, ZnCl2, SbF5 phosphoric acid and p-toluenesul-fonic acid as the catalyst in homogenous systems [1]. The use of the above mentioned catalysts is undesirable from the environmental point of view as these chemicals are cor-rosive and generally encounter the problems of handling and transportation. Moreover reusability of the catalysts cannot be expected. For this purpose, the solid acid catalysts are employed as safe alternatives for conventional liquid acid catalysts in synthetic organic chemistry. Solid acids such as zeolites (ZSM-5), Metal oxides viz. Al2O3, SiO2, ZrO2 ZrO2–Al2O3, ZrO2–SiO2 and their sulphated forms have been exten-sively studied as possible alternatives to conventional Lewis/Bronsted acid catalysts for esterification reaction [2,3].
A number of solid acids such as ion exchange resin eg. Am-berlyst 15, smopex-101 [4,5] , mesoporous molecular sieves like mesoporous Al-MCM-41, H-Mordenite [6] , H-beta [7] , H-ZSM-5 and HY zeolites [8,9] , solid super acids [10] and heteropolyacids (salts), lipase, sulfonic acids supported on molecular sieves, active carbon [11-13] , niobic acid and supported heteropoly acids (eg. H4SiW12O40/ ZrO2), γ-alumina-supported vanadium oxide catalysts, sulfated zir-conia and tetravalent metals acid salts [14] , hafnium (IV) and zirconium (IV) salts [15] , Zr(SO4)2·4H2 [16] and modified zir-conia catalyst have also been found to be acidic in nature and catalyze esterification, alkylation and condensation re-actions [17,18]. In our previous work, fly ash has been used for developing several solid acid catalysts by loading cerium triflate, sulphated zirconia and used for the synthesis of as-pirin, oil of wintergreen, 3, 4-dimethoxyacetophenone (anti neoplastic) and diphenylmethane [19-21].
The present work elaborates the synthesis of AAFA catalyst to have high acidity and catalytic activity for esterification re-action to produce n-butyl acetate with high yield and purity up to four reaction cycles. This investigation brings into light the structural aspects of a solid acid which exhibit good con-version and yield of an industrially important chemical “n-
butyl acetate” an important chemical intermediate, widely used in pharmaceutical and as flavoring agent in confection-ary, under solvent free conditions and in low cost route.
2. Experimental methods2.1 Materials Class-F type fly ash was collected from Kota Thermal Power Plant, Kota (Rajasthan) HCl (98%); Acetic acid (98%) and n-butyl alcohol (99%) were purchased from S. D. Fine Chem. Ltd. and were used as such.
2.2 Catalyst SynthesisAs received fly ash was ball milled (1h at room temperature) followed by thermal activation at 900oC for 4h .The chemical activation of mechanically activated fly ash (MFA) was car-ried out in a stirred reactor by stirring 5M aqueous solution of mineral acid (HCl) in the ratio of 1:2 (FA: HCl ) for 5 days at 110ºC temperature followed by washing till pH 7.0 with complete removal of soluble ionic species (Cl-, NO3
-, SO42-,
ClO4- etc.) and drying at 110ºC for 24h. The obtained solid acid catalyst (AAFA) was calcined at 500ºC for 4h under static condition in a muffle furnace.
2.3 Characterization Techniques2.3.1. Physicochemical properties of AAFA
The silica content of the fly ash samples after mechano-chem-ical activations were analyzed by X-ray fluorescence spec-trometer (Philips PW1606). Powder X-ray diffraction studies were carried out by using (Philips X’pert) analytical diffrac-tometer with monochromatic CuKα radiation (k = 1.54056 Å) in a 2θ range of 0-80º. The FT-IR study of the samples was done using FT-IR spectrophotometer (Tensor-27, Bruker, Germany) in DRS (Diffuse Reflectance Spectroscopy) system. The detailed imaging information about the morphology and surface texture of the sample was provided by SEM-EDAX (Philips XL30 ESEM TMP).
2.3.2. Catalytic activity The esterification of n-butanol with acetic acid was per-formed in liquid phase batch reactor consisting of 50 ml round bottom flask with condenser in a constant temperature oil bath with magnetic stirring. A mixture of acetic acid and n-butanol (molar ratio of n-butanol and acetic acid is = 1:2)

38 X INDIAN JOURNAL OF APPLIED RESEARCH
Volume : 3 | Issue : 4 | April 2013 | ISSN - 2249-555XReseaRch PaPeR
were taken in a 50 ml round bottom flask. The catalyst (sub-strate to catalyst ratio = 10), activated at 500oC for 2h was added in the reaction mixture. After completion of the reac-tion the catalyst was filtered and the product was analyzed by Gas Chromatograph.
2.3.3 Catalyst regenerationThe spent catalyst was washed with acetone, dried in oven at 110°C for 12h followed by calcinations at 500°C for 2 h and reused for next reaction cycle under similar reaction condi-tions as earlier.
3. Result and Discussion3.1 Catalyst Characterization A comparison of FA, MFA, TFA and AAFA catalyst is given in Table 1, which shows that after mechanical activation BET surface area is increased from 0.97 m2/g to 2.57 m2/g, which is further increased to 5.42 m2/g after chemical activation. This result confirms that the AAFA catalyst has a higher spe-cific surface area of 5.42 m
2
/g than the heat-treated fly ash with 2.99 m
2
/g [22, 23]. The particle diameter is reduced from 37.7 µm to 3.12 µm during milling, increased slightly (3.71 µm) after chemical activation [24]. The mechanical activation did not indicate any perceptible change in silica content of fly ash but the chemical activation increased the silica amount greatly (58% to 79%) [25].
Table 1: Physico-chemical properties of FA, MFA, TFA and AAFA catalyst.
Catalyst Silica(Wt %)
Crystallitesize (nm)
BET surfacearea (m2/g)
Particlediameter (µm)
FA 58 33 0.97 37.7MFA 59 21 2.57 3.12TFA 70 18 2.99 3.10AAFA 79 16 5.42 3.71
FA (Fly ash); MFA (mechanically activated fly ash); TAFA (ther-mally activated fly ash) and AAFA (chemically activated fly ash).
The XRD pattern of the FA showed (figure 1a) the presences of quartz, mullite, iron oxide, hematite, sulfur oxide, small amounts of magnetite [26], CaO and amorphous phases. The XRD studies of milled fly ash (figure 1b) indicate that decrease in crystallite size from 33 to 21 nm results in increased amor-phous content in it but after thermal activation the crystallin-ity is increased slightly as indicated by higher peak intensities in Figure 1b and c. [27]. After chemical activation of thermally activated fly ash, the crystallinity is further decreased due to removal of most of the crystalline components present in FA, thus increasing the amorphous nature [28, 29].
Figure 1: X-ray diffraction pattern of (a) FA (b) MFA (c) TFA and (d) AAFA catalyst.
The FT-IR spectra of FA, MFA, TFA and AAFA in Figure2a-d show broad band between 3500-3000 cm-1, which is attrib-uted to surface -OH groups of Si-OH and adsorbed water molecules on the surface. The increment in broadness after ball milling is an evidence for the breaking down of the quartz structure and formation of Si-OH groups [30]. However, FT-IR studies clearly show changes in the broadening of IR peaks corresponding to Si-O-Si asymmetric stretching vibrations in-dicating structural rearrangement during mechanical milling.
The FT-IR spectra of AAFA shows the tremendous increment in broadness at 3500-3000 cm-1 region as compared with FA,MFA and TFA which reflects strong hydrogen bonding be-tween the hydroxyl groups due to increase in silica content and loss of significant amount of other components (Figure 2d). The increased amorphous silica in the activated fly ash can be characterized by an intense band in the range 1000-1300 cm-1 corresponding to the valence vibrations of the silicate oxygen skeleton. The main absorption band of the valence oscillations of the groups Si-O-Si in quartz appears with a main absorption maximum at 1162 cm-1 [20].
Figure 2: FT-IR of (a) FA (b) MFA (c) TFA and (d) AAFA catalyst.SEM micrograph of the FA (Figure 3a) indicates that the most of the particles present in the fly ash are micro-particles in the shape of smooth balls (microspheres) with a relatively smooth surface grain. SEM image of MFA (Figure 3b) shows the structural break down of larger particles and increased surface roughness. The smooth spherical cenospheres are affected most resulting remarkable changes in morphology. After chemical activation with acid, rough cenospheres are transformed into agglomerations of more amorphous unde-fined shapes with no observation of crystal formation as seen in SEM micrographs presented in Figure 3a-d [31].
Figure 3: SEM images of (a) FA (b) MFA (c) TFA (d) AAFA.
4. Catalytic performanceTo measure the catalytic performance of catalyst, esterifi-cation of acetic acid with 1-butanol over AAFA was carried out at 110°C for 4h, taking n-butanol/acetic acid molar ratio 1:2 and n-butanol to catalyst weight ratio of 10. The catalyst

INDIAN JOURNAL OF APPLIED RESEARCH X 39
Volume : 3 | Issue : 4 | April 2013 | ISSN - 2249-555XReseaRch PaPeR
AAFA was found highly active for esterification of acetic acid with 1-butanol giving high selectivity (99.6%) and yield of n-butyl acetate after 4h under optimized conditions, whereas both FA as well as MFA did not possess any catalytic activity.
The esterification of acetic acid with n-butanol was also car-ried out at different temperature ranging from 90°C to 130°C for 4h to optimize the reaction temperature giving maximum conversion of n-butanol to n-butyl acetate. The result shows that the maximum conversion (87.3%) of n-butanol to n-butyl acetate is found at 110°C, which remains almost, steady till 130°C.The spent catalyst from the reaction mixture was fil-tered, washed with acetone and regenerated at 450°C to use for the next reaction cycles. The catalyst was equally efficient up to five reaction cycles.
5. ConclusionThe study provides fly ash supported AAFA as an efficient solid acid catalyst possessing significant amount of acidity. The specific surface area of FA (0.97 m2/g) was greatly en-
hanced after mechanical, thermal and chemical activation using HCl. AAFA catalyst possessed surface area upto 5.42 m
2
/g with greater number of surface silanols responsible for surface acidity as evident by comparatively broad band at 3500-3000 cm-1 in FT-IR spectra.
AAFA catalyst catalyzed the esterification of acetic acid with n-butanol giving high yield of the product n-butyl acetate in heterogeneous, solvent free optimized reaction conditions. It is concluded that the mechno-chemical activation can gener-ate sufficient activity on fly ash surface rendering its potential application in heterogeneous catalysis.
6. AcknowledgementThe authors are thankful to Dr. D.D. Phase and Er. V.K. Ahi-ray for SEM-EDX analysis, conducted at UGC DAE-CSR Lab Indore.The financial support was provided by Fly Ash Unit, Department of Science and Technology, New Delhi, India, vide project sanction no. FAU/DST/600(23)/2009-10.
REFERENCE 1. Igbokwe,P.K., Ugonabo, V.I., Iwegbu, N.A., Akachukwu, P.C. and Olisa C.J., Journal of university of chemical technology and metallurgy, 43(3) (2008) 345-348. | 2. Kuriakose, G., Nagaraju, N., J. Mol. Cat. A: Chem. 223 (2004) 155-159. | 3. Mohamed Shamshuddin, S.Z., Nagaraju, N., Cat.
Comm., 7(2006) 593-599. | 4. Blagova, S., Paradaa, S., Bailerb, O., Moritzb, P., Lamc, D., Weinandd, R., Hassea, H., Chem. Eng. Sci. 61 (2006) 753-765. | 5. Zhang, Y., Ma L., Yang J., React. Funct. Polym. 6 (2004) 101-114. | 6. Mbaraka, I.K., Shanks, B.H J., Cat., 229 (2005) 365-373. | 7. Alvaro, M., Corma, A., Das D., Fornés, V., Garcia, H., J. Cat., 231 (2005) 48-55. | 8. Kirumakki, S.R., Nagaraju, N., Narayanan, S., Appl.Catal. A. 273 (2004)1-9. | 9. Rabindran,B., Jermy,A., Journal of Molecular Catalysis A: Chemical 237 (2005) 146–154. | 10. Jiang, Y.X., Chen, X.M., Mo Y.F., Tong, Z.F., J. Mol. Cat. A. Chem., 213 (2004) 231-234. | 11. Abd, E.l.,_Wahab ,M.M.M., Said A.A., J. Mol. Catal. A. Chem., 240 (2005) 109-118. | 12. Sepulveda, J.H., Yori J.C., Vera C.R., Appl. Catal. A, 288 (2005)18-24. | 13. Peres, C., Harper, N., Marco, D.R., da Silva, G., Bar reiros, S., Enz. Micro. Tech. 37(1) (2005) 145-149. | 14. Mitran, G., Makó ,E., Redey, A., Marcu, I. C .,Comptes Rendus Chimie, 15(9) (2012) 793–798. | 15. Ishihara, K., Nakayama, M., Ohara, S., Yamamoto, H., Tetrahedron, 58 (2002) 8179-8188. | 16. Juan, J.C., Zhang, J.C., Yarmo, M.A., Cat. Lett. 117 (2007)153-158. | 17. Patel, H.K., Joshi, R.S., Chudasama, U.V., Indian J. Chem. 47 (2008) 348-352. | 18. Dora, E., James, G., Goodwin, Jr., David, A., Appl. Catal. A: Gen. 339 (2008) 76-83. | 19. Khatri, C., Jain, D., Rani, A., Fuel, 89(2012)3853-3859. | 20. Khatri, C., Mishra M., Rani, A., Fuel Process. Technol., 91(10) (2010) 1288-1295. | 21. Khatri, C., Rani, A., Fuel 87 (2008)2886-2892. | 22. Sarbak Z., Kramer-Wachowiak M., Powder Technol, 123 (2002)53–8. | 23. Penilla PR, Bustos AG, Elizalde SG. Fuel 85 (2006) 823–32. | 24. Kumar S., Kumar R., (2010) The University of Wisconsin Milwaukee Centre for By-products Utilisation, Second International Conference on Sustainable Construction Materials and Technologies. June 28- June 30. | 25. Blanco F, Garcia MP, Ayala J., Fuel 84 (2005) 89-96. | 26. Bada S.O., Potgieter-Vermaak S,. J. Prac. Technol. 12 (2008) 37-48. | 27. John M.F., (2005), Changes in fly ash with thermal treatment. World of Coal Ash (WOCA), April 11-15; Kentucky, USA. | 28. Blanco F., Garcia M.P., Ayala J.,Mayoral G.,Garcia M.A.,Fuel, 85 (2006)2018-2026. | 29. Pengthamkeerati P., Satapanajaru T., Chularuengoaksorn P., Fuel, 87 (2008) 2469–2476. | 30. Patil, G.A., Anandhan, S., International. J. Energy Eng., 2 (2012) 57-62. | 31. Woolard, C.D., Petrus, K., van der Horst, M. Water SA, 26 (2002)531–6. |

40 X INDIAN JOURNAL OF APPLIED RESEARCH
Volume : 3 | Issue : 4 | April 2013 | ISSN - 2249-555XReseaRch PaPeR Chemistry
DRIFT- Spectroscopic Study of Modification of Surface Morphology of Perlite During Thermal
Activation
Sakshi Kabra Anita Sharma Stuti KataraDepartment of Pure and Applied
Chemistry, University of Kota, Kota 324005, Rajasthan, India
Department of Pure and Applied Chemistry, University of Kota, Kota
324005, Rajasthan, India
Department of Pure and Applied Chemistry, University of Kota, Kota
324005, Rajasthan, India
Renu Hada Ashu RaniDepartment of Pure and Applied Chemistry, University
of Kota, Kota 324005, Rajasthan, IndiaDepartment of Pure and Applied Chemistry, University
of Kota, Kota 324005, Rajasthan, India
Keywords perlite, DRIFT, thermal activation.
ABSTRACT This article presents the use of diffuse reflectance infrared Fourier transform (DRIFT) spectroscopic technique in investigation of the effect of thermal activation on morphology of perlite. Perlite, a naturally occurring waste
siliceous material formed by rapid cooling of volcanic eruptions was thermally treated over a range of temperatures. This study focuses on changes in both structure and chemical bonding of perlite due to thermal activation at different tempera-tures viz., 400, 600, 800, 1000°C for certain time period. The results reveal that on increasing temperature of thermal activa-tion, loss of water occurs which is confirmed by decrease in intensity and broadness of the band, appears between 3600-3300 cm-1, attributing to surface –OH groups. Other bands present in the DRIFT spectra shows the presence of Si-O-Si network and amorphous nature of silica in perlite.
IntroductionInfrared spectroscopy is a well established technique for the identification of chemical compounds and/or specific functional groups in compounds. An alternative is the use of Fourier Transform Infrared Spectroscopy (FTIR), which is both rapid, non-destructive and requires small, <1 mg, sized samples. Chemical bonds vibrate at a characteris-tic frequency representative of their structure, bond an-gle and length. Accordingly, individual molecules have the ability to interact with incident radiation by absorbing the radiation at specific wavelengths. FTIR spectroscopy takes advantage of this by recording the energy absorp-tion of a sample over a range of frequencies. Diffuse re-flectance infrared Fourier transform (DRIFT) spectroscopy in conjunction with other analytical techniques has been extensively applied over the years to explore the struc-ture and bonding in amorphous siliceous materials [1]. This technique has proved to be a powerful method to identify the isolated and H-bonded hydroxyl groups on surface of silica [2,3].
R.L. Frost et al. [4] proposed that DRIFT spectroscopy is more applicable than transmission infrared spectroscopy for powdered samples because it provides a rapid tech-nique for analyzing samples without any interference through sample preparation, suitable for the study on the hydroxyl stretching region of silicate minerals. DRIFT had several other advantages including ease of sample prepa-ration, greater number of useful bands and the ability to detect both major and minor components from the same spectra.
Perlite is a hydrated, naturally occurring amorphous vol-canic glass formed by cooling of volcanic eruptions, esti-mating about 700 million tonnes worldwide reserves. Its unique structure consists of numerous concentric layers hav-ing SiO2, Al2O3, K2O and Na2O as major constituents while TiO2, CaO, MgO, Fe2O3 and hydrated water as well as un-burned carbon remain present in varying quantities [5]. On heating the perlite to its softening range, i.e., above 850°C, water molecules vaporize and escape resulting in unusual expansion of perlite up to 7-16 times of its original volume,
creating inert, non-toxic, lightweight particles with specific surface area of about 1.22 m2g-1 [6], density in the range of 0.6 - 2.30 gml-1 [7] and particle size in range of 0.2-4 mm. [8]. As far as applications of perlite are concerned, it is mainly consumed as fillers, filter aids, in producing building construction materials [9,10].
In the current work, perlite was thermally treated at differ-ent temperatures viz., 400, 600, 800 and 1000°C for 3 h and then analyzed by DRIFT spectroscopy. The purpose of this investigation is to use DRIFT spectroscopy to characterize the structure and determine the chemical bonding of silica with other species present in the perlite, so that it can be further utilized for various applications in future.
MaterialPerlite sample was supplied by Indica Chem. Ind. Pvt. Ltd., India.
ExperimentalPerlite sample was then thermally treated in a muffle fur-nace under static conditions over a range of temperatures, 400, 600, 800 and 1000°C for 3h and abbreviated as TAP-400, TAP-600, TAP-800 and TAP-1000 respectively. The DRIFT spectroscopic study of the samples was done by Bruker FT-IR Spectrophotometer (TENSOR 27) in DRS (dif-fuse reflectance system) mode by homogenizing samples thoroughly with spectroscopic grade KBr in 1:20 weight ratio. The samples were crushed in an agate mortar. The spectra were recorded in the range 550-4000 cm-1 with a resolution of 4 cm-1.
Results and discussionThe colour change is seen in perlite from light grey to white-light pink on thermal treatment at higher tempera-ture. The chemical composition of perlite was determined by EDX analysis which is shown in Table 1. Loss on igni-tion (LOI) was determined by heating a certain weighed quantity of perlite in muffle furnace at 1000˚C for 3 h. The LOI amount was 4.4 wt % which corresponds to the re-moval of moisture and coexisting unburned carbon from sample [11].

INDIAN JOURNAL OF APPLIED RESEARCH X 41
Volume : 3 | Issue : 4 | April 2013 | ISSN - 2249-555XReseaRch PaPeR
Table 1. EDX analysis of perlite.
Samples O(wt%) Si(wt%) Al(wt%) K(wt%) Na(wt%) Zn(wt%) Fe(wt%) Ti(wt%) S(wt%) LOI
Perlite 73.70 18.83 3.72 1.44 1.91 0.22 0.10 0.07 - 4.4
LOI- Loss on ignition
The FT-IR spectrum of perlite and thermally activated perlite at different temperatures
(Fig. 1) confirmed that the calcination at any conditions in this experiment produced dehydroxylation in the perlite samples i.e. elimination of the -OH stretching from Si-OH [12,13]. In this fig., a broad band between 3600-3300 cm-1 is shown, which is attributed to surface –OH groups of –Si-OH and water mole-cules adsorbed on the surface. The broadness of band indicates the existence of hydroxyl groups in higher degree of association with each other which results in extensive hydrogen bonding [14], while in FT-IR spectra of thermally activated perlite sam-ples, the intensity and broadness of band is decreased, con-firming the loss of water, which is highest in case of TAP-1000 (Fig. 1e). The strong band at 1030 cm-1 is due to the structural siloxane framework, which is the vibrational frequency of the Si-O-Si bond. The peak gets shifted to higher wave number, i.e., 1227 cm-1 after thermal treatment in TAP-1000 (fig. 1e), normal-ly observed in amorphous silica samples [15]. An intense peak at 1632 cm-1 in the spectrum of perlite is attributed to bending mode (δO-H) of water molecule, is again highly decreased in case of TAP-1000. The shoulder at about 3200 cm-1 (fig. 1a) could be assigned to the stretching vibrations of Si-OH groups in the structure of amorphous SiO2 [16]. An intense band in the range of 1300-1100 cm-1, corresponding to valence vibrations of the silicate oxygen skeleton is usually assigned to the amorphous silica content. The region around 805 cm-1 is characteristic of Si-O-Si symmetric stretching modes [17,18,19]. In the Si–O stretch-ing vibration region (800–1195 cm–1), the bands at 802, 808, 812, 942, 1050 cm–1 are identical to the bands at 800, 958, 1088 cm–1 due to amorphous silica [20]. Amorphous silica exhibited a relatively strong peak at about 800 cm–1 and it can be distin-guished from the band of crystalline silicate [20]. The structure of most SiO2 is polymorphous, both crystalline and amorphous, based on tetrahedral unit of silicon coordinated to four oxygen atoms. In the Si–O–Si bending vibration region (400–700 cm–1) of quartz, the band at 695 cm–1 is determinative whether it is crystalline or amorphous [21]. The band at 695 cm–1 appears due to the vibrations in octahedral site symmetry [22]. In the amorphous state this band will be missing. In the perlite sam-ples, we did not get this band which indicates that the silica mineral in this sample is in amorphous form. Another evidence of the presence of amorphous silica in perlite sample is the ap-pearance of a peak at about 1100 cm-1, which is normally as-sumed to be formed by continuous network of Q4 species, char-acteristic in case of amorphous silica [23].
The major component of perlite is silica and untreated silica is totally hydroxylated and the hydroxyl layer is covered with physically adsorbed water. Thermal treatment of the sup-port leads first to removal of water (dehydration) and then to combination of adjacent hydroxyl groups to form water (dehydroxylation) [24].
Fig. 2 shows the magnified FT-IR spectra of all studied sam-ples in the range between 550-1750 cm-1.
Fig 1. FT-IR spectrum of (a) perlite, (b) TAP-400, (c) TAP-600, (d) TAP-800 and (e) TAP-1000.
Fig 2. Magnified FT-IR spectrum of (a) perlite (b) TAP-400 (c) TAP-600 (d) TAP-800 and (e) TAP-1000
The observed frequencies of IR bands of all samples and their possible assignments are summarized in Table 2.
Table 2. The observed frequencies of IR Bands of all samples and their possible assignments
AssignmentsWave number (cm-1)
Perlite TAP-400
TAP-600
TAP-800
TAP-1000
Si-O-Si symm. stretching vib. 802 802 808 812 942
Si-O-Si asymm. stretching vib.
1030 1030 1184 11921192
1227
Si-O-Si bending vib. 572 572 575 579 583 -O-H bending vib.H-O-H bending vib. 1632 1632 1628 1628 1626
1626-O-H stretching vib.-O-H stretching vib. 3618 3611 3591 3579 3465
ConclusionsResults found in this paper showed that DRIFT can be suc-cessfully employed in investigation of the effect of thermal treatment on perlite morphology. After calcination, physi-cally adsorbed water gets driven away from the surface, so intensity of –OH stretching and bending bands decreases. The present spectroscopic study could be useful in under-standing characteristic features of amorphous silica, changes occurred in its structure and chemical bonding because of thermal treatment. This knowledge may be employed in fur-ther utilization of perlite for several applications.
AcknowledgementThe authors are thankful to DST Lab, Deptt. Of Pure & Ap-plied Chemistry, University of Kota, for providing DRIFT spectroscopic facility. The authors are also grateful to Uni-versity Grants Commission, New Delhi, India for their Junior Research Fellowship scheme.

42 X INDIAN JOURNAL OF APPLIED RESEARCH
Volume : 3 | Issue : 4 | April 2013 | ISSN - 2249-555XReseaRch PaPeR
REFERENCE 1. A. Hamoudi, L. Khouchaf, C. Depecker, B. Revel, L. Montagne and P. Cordier, J. Non-crystalline Solids, 354 (2008) 5074–78. | 2. R K.Iller, The Chemistry of Silica, John Wiley & Sons, New York, 1979. | 3. H. E. Bergna. In the colloid chemistry of silica (ed. H.E. Bergna), American Chemical
Society, 1994. | 4. R. L. Frost, U. Johansson, Clays and Clay Minerals 46 (1998) 466. | 5. M. Dogan, M. Alkan, U. Cakir, J. Colloid Interface Sci. 192 (1997)114-118. | 6. M. Dogan, M. Alkan, Chemosphere, 50 (2003) 517-528. | 7. M. Roulia, K. Chassapis, J. A. Kapoutsis, E. I. Kamitsos, T. Savvidis, J. Mater. Sci., 41 (2006) 5870-81. | 8. D. Bastani, A.A. Safekordi, A. Alihosseini, V. Taghikhani, Sep. Purif. Technol., 52 (2006) 295-300. | 9. M.S. Morsy , S.S. Shebl SS, M. Abd El Gawad Saif, Building Research Journal, 56 (2008) 49-58. | 10. H. Aglan , M. Morsy, A. Allie, F. Fouad, Construction and Building Materials, 23(1) (2009) 138-145. | 11. K. Kordatos, S. Gavela, A. Ntziouni, K.N. Pistiolas, A. Kyritsi, V. Kasselouri-Rigopoulou, Microporous Mesoporous Mater., 115(1-2) (2008) 189-196. | 12. C. Belver, M.A.B Munoz and M.A.Vicente. Chem. Mater., 14 (2002) 2,033-43. | 13. R.A. Shawabkeh and M.F. Tutunji. Clay. Sci., 24 (2003) 111-120. | 14. R.M. Silverstein, F.X. Webster, Spectrometric Identification of Organic Compounds, Sixth ed., John Wiley Pub., 2006, pp. 88. | 15. F. Adam, S. Balakrishnan, P.L. Wong, Journal of Physical Science, 17(2) (2006) 1–13. | 16. S. Music, N.F. Vincekovic, L. Sekovanic, Brazilian Journal of Chemical Engineering, 28(1) (2011) 89-94. | 17. S.H. Javed, S. Naveed, N. Feroze, M. Zafar, M. Shafaq, Journal of Quality and Technology Management, 6(1) (2010) 81-90. | 18. K. Amutha, R. Ravibaskar, G. Sivakumar, International Journal of Nanotechnology and Applications, 4(1) (2010) 61-66. | 19. J.P. Nayak, J. Bera, Trans. Indian Ceram. Soc., 68 (2) (2009) 1-4. | 20. J. Ojima, J. Occup. Health 45 (2003) 94-103. | 21. G. Parthasarathy, A.C. Kunwar and R. Srinivasan, Eur. J. Mineral. 13 (2001) 127. | 22. H. Schneider, Contrib. Miner. Petr. 43 (1974) 233. | 23. F.I. Hurwitz, D.V. Aranda and M.E. Gallagher, Presented at the 236th National Meeting, American Chemical Society, Philadelphia, PA (2008) | 24. B.M. Reddy, G.K. Reddy, K.N. Rao, A. Khan, I. Ganesh, J. Mol. Catal. A: Chem., 265 (2007) 276-82.
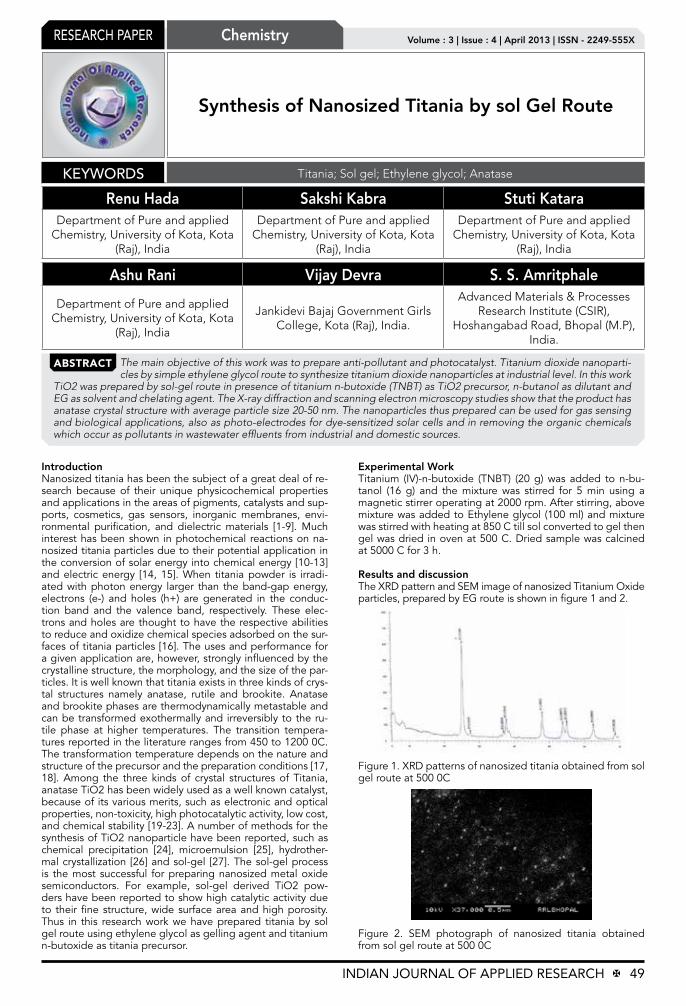
INDIAN JOURNAL OF APPLIED RESEARCH X 49
Volume : 3 | Issue : 4 | April 2013 | ISSN - 2249-555XReseaRch PaPeR Chemistry
Synthesis of Nanosized Titania by sol Gel Route
Renu Hada Sakshi Kabra Stuti KataraDepartment of Pure and applied
Chemistry, University of Kota, Kota (Raj), India
Department of Pure and applied Chemistry, University of Kota, Kota
(Raj), India
Department of Pure and applied Chemistry, University of Kota, Kota
(Raj), India
Ashu Rani Vijay Devra S. S. Amritphale
Department of Pure and applied Chemistry, University of Kota, Kota
(Raj), India
Jankidevi Bajaj Government Girls College, Kota (Raj), India.
Advanced Materials & Processes Research Institute (CSIR),
Hoshangabad Road, Bhopal (M.P), India.
Keywords Titania; Sol gel; Ethylene glycol; Anatase
ABSTRACT The main objective of this work was to prepare anti-pollutant and photocatalyst. Titanium dioxide nanoparti-cles by simple ethylene glycol route to synthesize titanium dioxide nanoparticles at industrial level. In this work
TiO2 was prepared by sol-gel route in presence of titanium n-butoxide (TNBT) as TiO2 precursor, n-butanol as dilutant and EG as solvent and chelating agent. The X-ray diffraction and scanning electron microscopy studies show that the product has anatase crystal structure with average particle size 20-50 nm. The nanoparticles thus prepared can be used for gas sensing and biological applications, also as photo-electrodes for dye-sensitized solar cells and in removing the organic chemicals which occur as pollutants in wastewater effluents from industrial and domestic sources.
IntroductionNanosized titania has been the subject of a great deal of re-search because of their unique physicochemical properties and applications in the areas of pigments, catalysts and sup-ports, cosmetics, gas sensors, inorganic membranes, envi-ronmental purification, and dielectric materials [1-9]. Much interest has been shown in photochemical reactions on na-nosized titania particles due to their potential application in the conversion of solar energy into chemical energy [10-13] and electric energy [14, 15]. When titania powder is irradi-ated with photon energy larger than the band-gap energy, electrons (e-) and holes (h+) are generated in the conduc-tion band and the valence band, respectively. These elec-trons and holes are thought to have the respective abilities to reduce and oxidize chemical species adsorbed on the sur-faces of titania particles [16]. The uses and performance for a given application are, however, strongly influenced by the crystalline structure, the morphology, and the size of the par-ticles. It is well known that titania exists in three kinds of crys-tal structures namely anatase, rutile and brookite. Anatase and brookite phases are thermodynamically metastable and can be transformed exothermally and irreversibly to the ru-tile phase at higher temperatures. The transition tempera-tures reported in the literature ranges from 450 to 1200 0C. The transformation temperature depends on the nature and structure of the precursor and the preparation conditions [17, 18]. Among the three kinds of crystal structures of Titania, anatase TiO2 has been widely used as a well known catalyst, because of its various merits, such as electronic and optical properties, non-toxicity, high photocatalytic activity, low cost, and chemical stability [19-23]. A number of methods for the synthesis of TiO2 nanoparticle have been reported, such as chemical precipitation [24], microemulsion [25], hydrother-mal crystallization [26] and sol-gel [27]. The sol-gel process is the most successful for preparing nanosized metal oxide semiconductors. For example, sol-gel derived TiO2 pow-ders have been reported to show high catalytic activity due to their fine structure, wide surface area and high porosity. Thus in this research work we have prepared titania by sol gel route using ethylene glycol as gelling agent and titanium n-butoxide as titania precursor.
Experimental WorkTitanium (IV)-n-butoxide (TNBT) (20 g) was added to n-bu-tanol (16 g) and the mixture was stirred for 5 min using a magnetic stirrer operating at 2000 rpm. After stirring, above mixture was added to Ethylene glycol (100 ml) and mixture was stirred with heating at 850 C till sol converted to gel then gel was dried in oven at 500 C. Dried sample was calcined at 5000 C for 3 h.
Results and discussionThe XRD pattern and SEM image of nanosized Titanium Oxide particles, prepared by EG route is shown in figure 1 and 2.
Figure 1. XRD patterns of nanosized titania obtained from sol gel route at 500 0C
Figure 2. SEM photograph of nanosized titania obtained from sol gel route at 500 0C
2Theta Scale

50 X INDIAN JOURNAL OF APPLIED RESEARCH
Volume : 3 | Issue : 4 | April 2013 | ISSN - 2249-555XReseaRch PaPeR
The XRD patterns of the calcined sample of nanosized titania powder prepared using sol gel route is given in Figure 1. The presence of peaks of anatase titania at‘d’ values 3.49, 1.88, 2.35 have been observed in XRD pattern. The d-values of the pattern recorded were compared and matched with the standard d-values along with the intensity given in JCPDS manuals. The average crystalline size of nanosized titania has been calculated by applying Scherrer’s equation (d = k λ / λ cos λ) to the 100 % intensity peak and is found 19 nm. The prepared nanosized powder of TiO2 was fired at 500 0C, leads to its conversion from amorphous phase to anatase phase.
The crystal size of the powder sample of TiO2 is of 19 nm size as estimated by Scherrer equation. SEM photograph shows that particles are strongly aggregated which is typical for par-ticles with a size less than 50 nm, so the particle size was estimated to be 20-50 nm.
ConclusionWe synthesized TiO2 nanoparticles by sol gel route using ethylene glycol as geling agent. The physical properties, such as crystallite size and crystallinity were investigated by XRD, and SEM. X-ray diffraction pattern shows that TiO2 particles calcined at 500°C have a stable anatase phase with 19 nm average crystallite size, determined according to the Scherrer equation. The SEM image shows that particles have spherical shape. The yield of the prepared photocatalyst was comparatively higher than other methods used for nanopar-ticles preparation i.e. microemulsion route.
AcknowledgementThe authors are grateful to the Director, AMPRI, CSIR, Bhopal for encouragement of the present research work. The finan-cial support was provided by Fly Ash Mission, Department of Science and Technology, New Delhi, India.
REFERENCE 1. T. Moritz, J. Reiss, K. Diesner, D. Su and A. Chemseddine, J. Phys. Chem. B, 1997 101, 8052-8053. | 2. J. Karch, R. Birriger and H. Gleiter, Nature, 1987, 330, 556-558. | 3. M. R. Hoffmann, S. T. Martin, W. Choi and D. W. Bahnemann, Chem. Rev., 1995, 95, 69-96. | 4. A. Fujishima and K. Honda,
Nature, 1972, 238, 37-38. | 5. M. A. Fox and M. T. Dulay, Chem. Rev., 1993, 93, 341-357. | 6. R. J. Gonzalez, R. Zallen and H. Berger, Phys. Rev. B, 1997, 55, 7014-7017. | 7. K.-N. P. Kumar, K. Keizer and A. J. Burggraaf, J. Mater. Chem., 1993, 3, 1141 - 1149. | 8. R.Wang, K. Hashimoto, A. Fujishima, M. Chikuni, E. Kojima, A. Kitamura, M. Shimohigoshi and T. Watanabe, Nature, 1997, 388, 431-443. | 9. P. A.Mandelbaum, A. E. Regazzoni, M. A. Blesa and S. A. Bilmes, J. Phys. Chem. B, 1999, 103, 5505-5511. | 10. K. Fujiwara, T. Ohno, M. Matsumura, J. Chem. Soc., Faraday Trans., 1998, 94, 3705- 3709. | 11. T. Ohno, K. Fujihara, K. Sarukawa, F. Tanigawa, M. Matsumura, Z. Phys. Chem., 1999, 213, 165-174. | 12. Z.G. Zou, H. Arakawa, J. Photochem. Photobiol. A: Chem., 2003, 158, 145-162. | 13. R. Abe, K. Sayama, H. Arakawa, Chem. Phys. Lett., 2003, 371, 360-364. | 14. J. Ye, Z. Zou, H. Arakawa, M. Oshikiri, M. Shimoda, A. Matsushita, T. Shishido, J. Photochem. Photobiol. A: Chem., 2002, 148, 79-83. | 15. B. O’Regan, M. Gr¨atzel, Nature, 1991, 353, 737-740. | 16. S. Kambe, S. Nakade, T. Kitamura, Y. Wada, S. Yanagida, J. Phys. Chem. B, 2002, 106, 2967- 2972. | 17. H. Goto, Y. Hanada, T. Ohno, M. Matshmura, J. Catal., 2004, 225, 223-229. | 18. V. Chhabra, V. Pillai, B.K. Mishra, A. Morrone, D.O. Shah, Langmuir, 1995, 11, 3307- 3311. | 19. A. Rammal, F. Brisach and M. Henry, C. R. Chimie, 2002, 5, 59-66. | 20. P.V. Kamat, Chem. Rev., 1999, 93, 267-300. | 21. A. Mills, G. Hill, S. Bhopal, I.P.Parkin and S.A. O'Neill, J. Photochem. Photobiol. A: | Chemistry, 2003, 160, 185-194. | 22. P.S. Awati, S.V. Awate, P.P. Shah and V. Ramaswamy, Catal. Comm, 2003, 4, 393-400. | 23. R. Zhang, L. Gao and Q. Zhang, Chemosphere,2004, 54, 405-411. | 24. S. Jeon and P.V. Braun, Chem. Mater., 2003, 15, 1256-1263. | 25. Y. Bessekhouad, D. Robert and J.W. Veber, J. Photochem. Photobiol. A: Chemistry, 2003, 157, 47- 53. | 26. M.M. Yusuf, H. Imai and H. Hirashima, J. Sol-Gel Sci. Technol., 2002, 25, 65-74. | 27. Y. Diaoued, S. Badilescu, P.V. Ashirt, D. Bersani, P.P. Lottici and J. Robichaud, J. Sol- | Gel Sci.Technol., 2002, 24, 255-264.


![Doctor of Medicine [MD] and Doctor of Dental Surgery [DDS](https://img.dokumen.tips/doc/110x75/6328cfa809048e4b7c061423/doctor-of-medicine-md-and-doctor-of-dental-surgery-dds-.jpg)


