Embed Size (px)
Citation preview
JENA ECONOMIC RESEARCH PAPERS
# 2011 – 058
Do not Trash the Incentive! Monetary incentives and waste sorting
by
Alessandro Bucciol Natalia Montinari Marco Piovesan
www.jenecon.de
ISSN 1864-7057
The JENA ECONOMIC RESEARCH PAPERS is a joint publication of the Friedrich
Schiller University and the Max Planck Institute of Economics, Jena, Germany.
For editorial correspondence please contact [email protected].
Impressum: Friedrich Schiller University Jena Max Planck Institute of Economics
Carl-Zeiss-Str. 3 Kahlaische Str. 10
D-07743 Jena D-07745 Jena www.uni-jena.de www.econ.mpg.de
© by the author.
DO NOT TRASH THE INCENTIVE!*
MONETARY INCENTIVES AND WASTE SORTING
Alessandro Bucciol†, Natalia Montinari‡, Marco Piovesan§
December 1, 2011
This paper examines whether monetary incentives are an effective tool for increasing
domestic waste sorting. We exploit the exogenous variation in the waste management policies
experienced during the years 1999–2008 by the 95 municipalities in the district of Treviso
(Italy). We estimate with a panel analysis that pay-as-you-throw (PAYT) incentive schemes
increase by 12.3% the sorted-total waste ratio. This increase reflects a change in the behavior
of households, who keep unaltered the production of total waste but sort it to a larger extent.
Our data show that household behavior is also influenced by the policies of adjacent
municipalities.
Keywords: Incentives, environment, waste management, PAYT.
JEL codes: D01, D78, Q53.
* We thank Arpav-Servizio Osservatorio Rifiuti e Compostaggio and the three consortia (Priula, Savno, and TV3) managing waste disposal in the district of Treviso for kindly providing us with the data and the information we needed to develop this analysis. We further thank Viola Angelini, Paolo Buonanno, Francesco Manaresi, Raffaele Miniaci, Giacomo Pasini, Bill Simpson, Sigrid Suetens, and the participants of the 2011 ICEEE conference in Pisa, the 2011 workshop on “Social Economics” in Forlì, and the 2011 EAERE conference in Rome for useful suggestions. The usual disclaimers apply. † University of Verona, University of Amsterdam and Netspar, University of Verona, Dept. of Economics, Via dell'Artigliere 19, 37129 Verona, Italy, e-mail: [email protected] ‡ Corresponding author. Postal address: Max Planck Institute of Economics, Strategic Interaction Group Kahlaische Straße 10, D-07745 Jena, Germany. Phone: +49(0)3641-686 636; Fax:+49(0)3641-686 667, e-mail: [email protected] , web page: https://sites.google.com/site/nmontinari82/. § Harvard Business School, Baker Library | Bloomberg Center, Soldiers Field, Boston, MA 02163, e-mail: [email protected]
Jena Economic Research Papers 2011 - 058
2
1. Introduction
In this paper we study the effectiveness of monetary incentives in the context of domestic
waste disposal. Nowadays this is considered a central issue in the policymaker’s agenda, as
the continuing growth in population size and wealth make our society produce increasingly
more waste that we must eliminate somehow. Waste disposal is challenging: available options
are to bury waste in landfills or burn it in incinerators. However, landfills can store only a
small part of the waste we produce, and they are often perceived as dangerous to the health of
citizens (Kinnaman and Fullerton, 2000). Incinerators, for their part, are expensive and their
consequences on health and the environment seem controversial (British Society for
Ecological Medicine, 2008; Health Protection Agency, 2005) with the consequence that
citizens are even less willing to host such plants in their neighbourhood. A viable solution is
then to ask domestic users to sort waste at home. However, sorting waste is not a pleasant
activity: it requires considerable effort, a lot of time and attention. The goal of this paper is
therefore to understand if monetary incentives can be used to increase the sorted waste ratio
(the ratio between sorted and total waste), thus reducing the amount of unsorted waste that
will end up in landfills and incinerators. As we explain below, the answer is not trivial and
monetary incentives could even have a negative impact on the sorted waste ratio.
Historically, in Western countries households used to drop off all their mixed waste in
special bins placed along the streets, and they were charged a flat fee related to parameters
such as the house size and /or the number of household members. Local administrators
progressively started promoting increasingly more accurate collection of sorted waste in the
streets. More recently, many municipalities have been choosing to collect sorted waste door-
to-door (DtD). DtD is a curbside collection system requiring users to separate their waste at
home in a specific way (e.g. in bags, bins, etc) and following a specific calendar. DtD
constitutes a nonmonetary incentive to sort waste, with a twofold effect: it makes sorting
easier for the users, who do not need to carry their waste and drop it off along the streets, and
at the same time it imposes limits on waste production, due to the constraint on the volume of
storable waste and frequency of waste collection (Naslund, 1973). In addition to DtD, some
local administrators abandoned the flat fee in favour of a per-unit fee, the so called “pay-as-
you-throw” (PAYT) system. This pricing system aims to encourage waste sorting by linking
the fee to the amount of residual (unsorted) waste actually produced. The PAYT pricing
system generally requires a DtD collection to measure exactly the amount of unsorted waste
Jena Economic Research Papers 2011 - 058
3
produced (Kinnaman, 2006). Previous research shows that the joint adoption of DtD and
PAYT produced outstanding results with an increase of the sorted waste ratio between 25%
and 35% (see Miranda et al., 1994; Allers and Hoeben, 2010; and the literature review in
Kinnaman, 2006).
However, not necessarily one should expect a positive effect on the sorted waste ratio of
the PAYT incentive scheme, net of the effect brought by DtD. Compared to the municipalities
that switched from drop-off to DtD collection throughout the world, only few adopted PAYT
as opposed to flat fee. One of the reasons is that PAYT may induce users to “hide” part of
their waste to pay a lower fee (see, e.g., Fullerton and Kinnaman, 1996: Levitt and Dubner,
2009); another is that policy makers may be reluctant toward PAYT since they fear that an
increase in user fees can disappoint the voters (De Jaeger, 2011). In addition, from a
psychological point of view, introducing a pricing system that sets a price for the production
of unsorted waste, may crowd out the users’ intrinsic motivation to sort (see, e.g., Ariely et
al., 2009; Benabou and Tirole, 2003; Gneezy and Rustichini, 2000; Fehr and Falk, 2002). Our
aim is to provide a proper assessment of the net effect of PAYT, using reliable administrative
data.
In this paper we use a unique panel dataset to disentangle the effect of PAYT from the
effect of DtD on the amount of waste sorted by domestic users. In addition we study the
effects of PAYT over time and over space. In particular, over time we isolate the potential
“learning” effect of every additional year of DtD and PAYT, because users may need time to
fully understand the incentive and adjust their behavior accordingly (see, e.g., Missios and
Ferrara, 2011). Over space, we investigate the relevance of the perverse behavior of hiding
waste and dump it illegally in adjacent municipalities to pay lower fees.
To this end, we collected annual administrative data on waste disposal over the years
1999–2008 for the 95 municipalities in the district of Treviso, Italy. We then merged this
dataset with data on the demographic characteristics of each municipality, provided by the
Italian National Institute of Statistics. The resulting dataset allows us to control for many
relevant characteristics of these municipalities and their inhabitants, and to estimate the effect
of these variables on the sorted waste ratio.
Our final dataset is unique for at least three reasons. First, prior to the period we consider,
a law divided the district in three geographic zones, each managed by a different consortium
to which most municipalities adhered. This means that nearly all the municipalities in our
sample were not directly responsible for the decisions on waste management; they just
followed the policy of their consortium. We argue that this exogenous intervention removes
Jena Economic Research Papers 2011 - 058
4
the potential endogeneity problem that is otherwise present in similar studies (an exception is
represented by Kinnaman and Fullerton, 2000), where different municipalities may choose
different waste management policies; however, in our analysis we investigate whether the
decision of the waste management policy is indeed exogenous. Second, our sample includes
wide heterogeneity of policies on waste collection (drop-off, DtD) and payment method (flat
fee, PAYT) enabling us to estimate separately the effect of these policies. Third, the panel
structure of our dataset allows us to control for exogenous features such as an increasing
concern for the environment, and to isolate potential “learning effects” of incentives over the
years.
Our results show that well-designed monetary incentives are effective even in the context
of domestic waste disposal. We find that the introduction of a PAYT system has a significant
and positive net effect of 12.3% on the sorted waste ratio, which is complementary to the
positive effect induced by DtD, 15.2%. In addition, the ratio increases by an additional 9.2%
when adjacent municipalities implement PAYT, and it falls by 11.1% when adjacent
municipalities implement neither PAYT nor DtD. Moreover, we find some evidence
suggesting that illegal dumping may be a relevant issue at the aggregate level, at least in
municipalities starting from low sorted waste ratios. Finally, we want to point out that PAYT
is designed to increase sorting and not to reduce the total amount of waste. Our analysis
shows that this is indeed what happens: the sorted waste ratio increases but there is no
reduction in the amount of total waste. This finding implies that users improve their attention,
ability, and consciousness about sorting, but they do not produce less waste.
The remainder of the paper is organized as follows. Section 2 describes the data source,
the history, and the characteristics of the municipalities in our dataset. Section 3 describes our
empirical strategy, and Section 4 reports the results. Section 5 discusses some open questions
and presents the directions of our future research. Two final appendices provide further details
on the data and the waste management systems in these municipalities.
2. The Data
We collected administrative data on the amount of waste produced annually between 1999
and 2008 in the municipalities of the district of Treviso, in north-eastern Italy; further details
on this small but highly populated district are given in Appendix A.1. Overall we have 10
annual time series observations for each of the 95 municipalities in the district. We ignore
Jena Economic Research Papers 2011 - 058
5
data before 1999 because they may be affected by measurement error, as municipalities were
still in the process of organizing their waste management. During the past decades the
municipalities in this district showed marked progress in terms of sorted solid waste
collection, moving from an average sorted waste ratio (the ratio between sorted waste and
total waste)1
The building blocks of our dataset are two: first, annual data on sorted and unsorted waste
production at the municipal level provided by the Regional Agency for Environmental
Prevention and Protection of Veneto (Agenzia Regionale per la Prevenzione e Protezione
Ambientale del Veneto, Arpav), that we double-checked with the data available to the
consortia; second, raw data on the demographic characteristics of each municipality, provided
by the Italian National Institute of Statistics (Istituto Nazionale di Statistica, Istat), and further
elaborated by the statistical unit of the Veneto region.
of 35.4% in 1999 to a ratio of 68.5% in 2008 (Arpav, 2000, 2009). The sorted
waste ratio in 2008 was outstanding compared with the national average (30.6%). Many of
these municipalities are now among the best practitioners of waste management in Italy
(Legambiente, 2009) as well as Europe, exceeding by far the targets of sorting set by the
European Commission (Eurostat, 2010). However, the sorted waste ratio in the district was
not outstanding in the late ‘90s when DtD and PAYT have been introduced. In the same
years, other regions in Northern Italy were sorting more than the district of Treviso (ISPRA,
2011) and countries such as Germany and the Netherlands were achieving sorting ratios
around 30-35% (Eurostat 2003). Hence, the excellent results the municipalities obtained in
more recent years are possibly related to the change in waste management policies arisen over
the decade we consider in the analysis.
Importantly, in our dataset we observe different policies along two dimensions: the
collection system (drop-off as opposed to DtD) and the pricing system (flat fee as opposed to
PAYT). Appendix B provides details on the collection and pricing systems. Here we briefly
describe the two pricing systems. The flat fee is proportional to the user’s house surface and
/or the number of household members:
( ) ( )0 1. .flat fee No of house square meters No of household membersφ φ= × + × (1)
where 0φ and 1φ are the costs, respectively, per square meter and per household member. In
this system there is no direct link between the actual production of waste and the fee paid,
1 Because sorted waste is potentially recyclable, many authors use the term “recycling ratio” instead of sorted waste ratio (Kinnaman, 2006).
Jena Economic Research Papers 2011 - 058
6
even though the number of house square meters and the number of household members seem
reasonable proxies for the production of waste. However, given a particular house and
household size, this scheme provides no incentive to sort waste.
In contrast, the pay-as-you-throw fee establishes a direct link between costs and user’s
sorting behavior. It is made of a fixed part – which can be identical for all users or determined
according to specific parameter, as the number of house square meters, etc. – and a variable
part depending on the amount of the unsorted waste produced:
( )0 1 .PAYT No of emptyings of unsorted wastebinθ θ= + × (2)
where 0θ and 1θ are, respectively, the fixed cost and the cost per unsorted waste bin emptied.
Notice that the above formula measures the production of unsorted waste in terms of
frequency (number of emptyings) rather than mass (kilograms of waste), which happens to be
less expensive to implement (Allers and Hoeben, 2010)2: to matter for the calculation of the
fee is only the number of emptyings of the bin for unsorted waste, disregarding whether the
bin is filled or not. 3
According to equation (2), accumulating unsorted waste is relatively costlier than
accumulating sorted waste. This may induce users to sort waste inappropriately in order to
lower the amount of unsorted waste. For this reason a system of monitoring and sanctioning is
applied jointly with the municipal authorities. Monitoring is simplified by the requirement to
use transparent bags to store unsorted waste in the bins, and no bag to store sorted waste. This
makes it easy to check if a household is indeed sorting waste properly; see Appendix B.3 for
further details.
Figure 1 shows the dynamics of collection and pricing systems in our dataset. In 1999, 94
out of 95 municipalities in the district were implementing drop-off collection systems with
flat-fee pricing; only one municipality (Vedelago) was implementing DtD with a flat fee.
Since 2000, municipalities gradually started changing the policy; as of 2008, 41 out of 95
were implementing DtD with flat fee pricing, 53 were implementing DtD with PAYT pricing, 2 In fact, PAYT pricing may be linked to either the mass or the frequency of waste. This latter method of counting unsorted waste may give rise to the infamous “Seattle Stomp“, where residents compact waste into the bin to reduce the number of emptyings. Although less expensive to implement and manage, volume-based fees seem less effective than mass-based fees in reducing the production of unsorted waste (Allers and Hoeben, 2010). In our analysis, however, we assess the effectiveness of the frequency-based fee using a mass measure. 3 Bins for unsorted waste have a capacity of 120 liters and they may be emptied every two weeks, for a total of 26 times per year. However, bins are emptied much less frequently (usually between 5 and 8 times per year in our sample, depending on the household size) because they are charged a cost. After each differentiable fraction of waste is sorted, the quantity of non-sortable waste is conspicuously reduced and it produces no smell. Therefore it can be easily stored for several weeks until the bin is filled.
Jena Economic Research Papers 2011 - 058
7
and just one municipality (Treviso) was still adopting drop-off with flat fee pricing. Hence,
our dataset includes municipalities with three types of waste management system: drop-off
with flat fee (306 observations), DtD with flat fee (372 observations), and DtD with PAYT
(272 observations). We observe no municipalities implementing drop-off and PAYT. In fact,
systems with drop-off and PAYT are rarely seen (Reschovsky and Stone, 1994; Kinnaman,
2006), because they make it extremely difficult to detect users’ incorrect behavior. Appendix
B reports more details on the historical evolution of pricing and collection systems in the
district.
FIGURE 1 ABOUT HERE
Figure 2 shows the dynamics of the sorted waste ratio in our sample. We observe an
increasing trend in the ratio with all the waste management systems, even the one with no
incentives at all (the system with drop-off collection and flat fee). The sorted waste ratio,
however, is steadily higher in the subsample of municipalities with DtD and PAYT. Our
analysis in Section 4 investigates whether the higher sorted waste ratio we observe in this case
is indeed attributable to the different waste management policy.
FIGURE 2 ABOUT HERE
2.1. Exogeneity of the Policy Assignment
In the late 1980s a regional (frame) law identified three geographic areas within the district
and encouraged the creation of independent, non-profit consortia of municipalities within
each area. The regional authority asked – but did not force – each municipality to join the
consortium in its area. After joining a consortium, a municipality delegates all decisions to the
consortium; therefore, the municipality is no longer able to make independent decisions on
waste management but it had to follow the prescriptions of its consortium, made by a board of
managers.
The district of Treviso was the first to follow the regional directions. At the end of 2008,
91 municipalities out of 95 joined the consortium operating in their area; these municipalities
joined their consortium in different years since they had to wait the expiration of previous
waste management contracts.4
4 Before the law was introduced, municipalities were in charge of the management of solid waste disposal, and they used to contract the provision of this service through external companies. In many cases, before joining a
Four municipalities remained independent, essentially for
Jena Economic Research Papers 2011 - 058
8
structural or geographic reasons; further details on the history of these municipalities and
consortia are given in Appendix A.2. Our main analysis, shown in Sections 4.1-4.3, is based
on 10 annual observations for all the 95 municipalities. In a robustness check, reported in
Section 4.4, we repeat the analysis based on a smaller sample, including only the
municipalities belonging to a consortium, and only in the years following adhesion.
As mentioned earlier, in our dataset we observe different policies along two dimensions:
the collection system (drop-off as opposed to DtD) and the pricing system (flat fee as opposed
to PAYT). We exploit this exogenous variation in the policies to disentangle the effect of the
introduction of PAYT net of the effect of adopting a DtD collection. This environment
resembles a quasi-natural experiment, because the collection and pricing systems are imposed
to the municipality by the consortium and, hence, they are not chosen directly by the
municipality (see Appendix A.2 for more details).5
One might argue that the selection of the policy is not a completely exogenous
mechanism, as municipalities can influence somehow the decisions of their consortium board
and the director. In particular, municipalities with more concern about sorting might push for
the implementation of DtD and PAYT policies. If that were the case we should see that,
before the implementation of new policies, such municipalities were having higher ratios of
sorted to total waste, and /or they were increasing this ratio faster than the other
municipalities.
To investigate this issue we focus on the 91 municipalities belonging to a consortium in
2008, we split them in several groups according to the policy they eventually chose, and we
test whether these groups had different characteristics in 1997, that is, two years before the
initial period in our sample (1999). Specifically, we compare two groups in terms of the
sorted waste ratio they had in 1997, or the variation in their ratio between 1997 and 1999. As
mentioned above, data before 1999 are not completely reliable for some municipalities. For
this reason we compare different groups by means of a Pearson’s non-parametric median test,
which is more robust to errors than alternative tests based on the mean or the data distribution.
We distinguish the sample of municipalities according to the policies they followed in
2008, where 39 municipalities were implementing DtD collection with flat fee pricing, and 52
were implementing DtD collection with PAYT pricing. Hence we test whether municipalities consortium they had to wait until the expiration of previous waste management contracts. For instance see http://www.comune.morgano.tv.it/ecologia.asp for the municipality of Morgano. 5 Ordinary decisions in each consortium are taken by a director and a board of managers, who is elected following a majority principle by the majors of all the municipalities adhering to the consortium; the representativeness of each municipality depends on the percentage of its population. Decisions on the waste management policy, however, have been made just once, right after the creation of the consortium, by the director, the managers and the majors involved at that time.
Jena Economic Research Papers 2011 - 058
9
choosing PAYT are systematically different than others. The chi-squared statistic of the
Pearson test is worth 2.477 (p-value: 0.116) as regards the sorted waste ratio in 1997, and
3.297 (p-value: 0.069) as regards the percentage variation in the ratio between 1997 and 1999.
Therefore, we do not find strong evidence of a systematically different pattern between those
implementing PAYT and those not implementing it.
Similarly, if we divide the sample according to the policies adopted in 2001, where 48
municipalities were implementing drop-off collection with flat fee pricing, and 43 DtD
collection with flat fee pricing, we find a statistic of 0.012 (p-value: 0.912) regarding the
sorted waste ratio in 1997, and 0.096 (p-value: 0.757) regarding the percentage variation in
the ratio between 1997 and 1999. Also in this case, the data suggest that municipalities
adopting DtD are not systematically different from municipalities not adopting it.
Although not conclusive, this evidence overall supports the view that there are no
intrinsic differences between the municipalities adopting one policy instead of another, and
thus the assignment of a specific policy is exogenous.
3. Empirical Strategy
Our empirical strategy is designed to verify the net effect of introducing a monetary incentive
(PAYT) on the sorted waste ratio, and to understand if this effect is complementary to, rather
than a substitute for, the one associated with a nonmonetary incentive (DtD).
The main analysis is based on the following model, where i denotes the municipality
and t denotes time:
0 1 2 3 4it it it it it i itY P C D Tβ β β β β µ ε′ ′ ′ ′= + + + + + + (3)
where β0, β1, β2, β3, and β4 are coefficients to be estimated, iµ represents municipality
effects, and itε is the error term. Our benchmark for the dependent variable itY is the
logarithm of the percentage sorted waste ratio (the ratio between the amount of sorted and
total waste); in addition we consider the logarithm of per capita (sorted, unsorted, total) waste
in kilograms.6
6 Notice that, although the PAYT formula refers to the frequency of unsorted waste disposal, we assess its effectiveness in terms of mass (kilograms).
A consequence of taking logarithms in the left-hand side of equation (3) is that
Jena Economic Research Papers 2011 - 058
10
the coefficients can be interpreted as relative variations in the dependent variables (thus,
abstracting from their scale) in response to unitary variations of the explanatory variables.
Estimation is performed by means of a fixed-effects panel regression model with standard
errors clustered at the municipality level. We chose this type of model for several reasons.
First, it provides consistent estimates even if the specification omits important time-invariant
variables on the structural characteristics of the municipalities. In general, the coefficients iµ
capture all the (fixed) heterogeneity among municipalities that is not explained with the other
variables in the specification, such as municipality surface or intrinsic efficiency of the public
administration. Second, we prefer this model for its statistical properties, since it turns out to
describe the data generally better than pooled regression models (without municipality
effects) and random-effects panel models (where municipality effects are not absorbed in the
error term); results of these statistical tests are reported in the bottom parts of Tables 2-4.
Below we describe the explanatory variables in equation (3) that we group in four
sets ( ), , ,it it it itP C D T , and why we take them into account. Table 1 reports descriptive statistics
of the key variables in the dataset.
Policy Variables
Set itP takes into account variations in waste management policies. We define the dummy
variable “DtD” equal to 1 when the municipality is implementing DtD and the dummy
variable “PAYT” equal to 1 when the municipality is implementing PAYT. The latter variable
captures the effect of PAYT net of DtD because, whenever a PAYT policy is implemented, a
DtD policy is always also active. In particular, we are interested in the sign of the coefficient
on PAYT. If it is significantly positive, then the monetary incentive represented by PAYT is
complementary to the nonmonetary one represented by DtD. If the coefficient is not
significant, we interpret it as an indication that the monetary incentive is not effective.
Finally, if it is significantly negative, the monetary incentive brought by PAYT is actually
detrimental and it goes against the nonmonetary incentive represented by DtD.
In addition, we include variables that capture a potential “learning process” in the
application of PAYT or DtD policies. What we mean is that users may need time to become
acquainted with the incentive scheme in the PAYT payment formula, or with the proper use
of the different waste bins provided by a DtD system. Ignoring this might be misleading and
could bias our estimates. We assume that this learning process follows a linear trend,7
7 PAYT and DtD programs in our sample started just a few years ago, and we do not have enough observations to treat further degree polynomials.
and we
Jena Economic Research Papers 2011 - 058
11
created the corresponding variables as follows: if a PAYT program started in year *t , the trend
variable for PAYT at year t is defined as ( ){ }*max 0, PAYT t t× − ; an equivalent definition
applies for DtD. Thus each variable captures the effect of having a PAYT or DtD program
active for one additional year.
Context Variables
Set itC includes three variables capturing the context faced by the municipalities. As we
know, each municipality may adopt one of three policy combinations: DtD collection with
PAYT billing, DtD collection with flat fee billing, or drop-off collection with flat fee billing.
The first option provides both monetary and non-monetary incentives to sort waste, while the
third option gives no incentive at all to sort waste. We expect that proximity to municipalities
with or without incentives may influence the decision to sort waste.
We therefore consider a dummy variable equal to 1 if the municipality has at least one
adjacent municipality adopting DtD and PAYT, and another dummy variable equal to 1 if the
municipality has at least one adjacent municipality adopting drop-off and flat fee. In the first
case we expect a positive “emulation effect” on the sorted waste ratio, with citizens sorting
waste to a larger extent just because their peers in near municipalities are forced to do so. In
the second case we expect a negative “dismay effect”, with citizens losing interest in sorting
waste because their peers in near municipalities do not pay much attention to the issue.
Finally, we consider a third dummy variable that is equal to 1 if the municipality
implements PAYT, and at least one adjacent municipality adopts drop-off and flat fee. In our
intention, this variable should capture a potentially positive “hiding effect” on the sorted
waste ratio.8
8 In principle this effect should also be observable, in the opposite direction, if we considered a dummy variable equal to one for a municipality implementing a drop-off system with flat fee, with at least one adjacent municipality adopting PAYT. In practice, this variable is generally equal to 0, especially in the latest years of our sample; this creates quasi-collinearity problems and makes it difficult to find a significant hiding effect.
In fact, illegal dumping is one of the main concerns for introducing PAYT:
Fullerton and Kinnaman (1996) estimate that 28% of the observed reduction of waste might
be due to improper or illegal disposal. In principle, users might throw unsorted waste in the
bins for sorted waste; however, as mentioned in Section 2, garbage collectors would easily
discover and sanction it. Alternatively, users might dump their waste in any place, for
instance in their neighbours’ property or in the street. It should be noticed, though, that in the
district under investigation i) each user is responsible for its bin, which is usually kept indoor,
and ii) in the streets there are no common bins where to throw waste, since the municipality
adopts a DtD collection method. If users really wanted to hide their waste the only viable
Jena Economic Research Papers 2011 - 058
12
options are: burn it, throw it in the countryside or in a forest area, or throw it in a nearby
municipality implementing drop-off, where common bins are available in the streets. The
latest is a pretty easy option in this district, where municipalities are very close to each other,
and many individuals regularly commute for work. Citizens are well aware of this option even
as a consequence of the many articles reported in local newspapers.9
Since the cost of moving
from one municipality to the other is minimal, users living in municipalities following a
PAYT program may choose to throw away their unsorted waste in nearby municipalities that
are still under a program with drop-off collection, so that they can pay lower fees (the
“hiding” effect). To limit this “garbage tourism”, municipalities with drop-off waste
collection put the most sensible bins under CCTV surveillance and ask their citizens to report
observed misbehaviour in waste disposal to environmental guardians or local authorities (see
Appendix B.3 for more details).
Demographic Variables
Set itD takes into account variations in the demographic composition of the municipality: the
logarithm of the population density (inhabitants per square kilometre), the percentage in the
population of children aged 14 or younger, the percentage in the population of individuals
aged 65 or older, and the percentage in the population of non-native residents. All these
variables show a pattern linearly increasing over time, with the population density going from
an average 295 inhabitants per square kilometre in 1999 to an average 339 inhabitants per
square kilometre in 2008, the percentage of children going from 14.41 to 18.16 percent, the
percentage or retirees from 16.93 to 17.86 percent, the percentage of non-native residents
from 3.48 to 11.24 percent.
We include these variables for three reasons: first, the population density gives a measure
of the complexity of waste collection. We expect municipalities with higher density to be
structurally different than smaller municipalities with lower density, which should have
implications on the effectiveness of changing the sorted waste ratio. Second, we expect the
sorted waste ratio to change in municipalities with a higher percentage of young people (who
are often the target group of media campaigns on environmental issues) and elderly people
(who usually do not work and have more time to sort waste efficiently). Finally, we may
expect that non-native residents are more reluctant than native ones to follow the prescriptions
of PAYT and DtD programs, for several reasons (culture, language barriers, etc.).
9 See for example the collection of articles published in 2007 and 2008 on local newspapers available online in the website of “Treviso Servizi”, the company managing the waste collection in the municipality of Treviso: http://www.trevisoservizi.com/index.php?title=rassegna.
Jena Economic Research Papers 2011 - 058
13
Time Variables
Set itT includes variables meant to capture the time trend: one macroeconomic indicator (the
annual unemployment rate in the district, taken from Istat) and a set of year dummy variables
(the base is represented by the years in the middle of the sample, 2003 and 2004). The idea is
that at the beginning of the sample period there was less concern for the environment than in
the following years, as a result of, for example, massive media campaigns. We expect this
increase in concern to make the sorted waste ratio rise anyway, even if no change is made in
the pricing or collection mechanism.
Identification of the year dummy variables together with the variables on the “learning
effect” of PAYT and DtD is possible in our dataset because in any given year we observe
municipalities without PAYT /DtD, municipalities that just started PAYT /DtD, and
municipalities that started PAYT /DtD some years earlier.
TABLE 1 ABOUT HERE
4. Results
Section 4.1 discusses the effects on the sorted waste ratio, while Section 4.2 focuses on the
effects conditional on the initial level of the sorted waste ratio. Section 4.3 comments on the
effects on the mass of sorted, unsorted and total waste. Finally, Section 4.4 discusses a
robustness check with a subsample of observations.
4.1. Effects on the Sorted Waste Ratio
Our main results are shown in Table 2. Among the explanatory variables of equation (3) and
discussed in Section 3, the regression in Column 1 includes only the dummy variable on
PAYT, and the demographic and time variables; the regression in Column 2 also considers
the dummy variable on DtD; finally, the regression in Column 3 includes all the policy,
context, demographic and time variables described in Section 3.
TABLE 2 ABOUT HERE
Jena Economic Research Papers 2011 - 058
14
Following the literature, the specification in Column 1 measures the effect of the PAYT
policy alone, without trying to disentangle it from the effect of DtD collection. We find a
significantly positive and large effect of the policy, informing that the introduction of PAYT
raises the sorted waste ratio by a large amount (28.9%.) This number is in line with previous
estimates in the literature (see the results reported in Kinnaman, 2006), derived from different
datasets that do not distinguish between the effects of DtD and PAYT.
The specification in Column 2 makes a split between the effects of PAYT and DtD.
Although significantly positive, the effect of PAYT (24.3%) is now slightly lower than in
Column 1. The reason is that we also find a significantly positive effect of DtD (16.3%),
consistently with previous works on the comparison between drop-off and DtD collection
methods (see, e.g., the literature review in Kinnaman, 2006). When not controlling for the
collection method, therefore, the effectiveness of the PAYT is over estimated. Our finding
that both the PAYT and the DtD have a positive and significant effect on the sorted waste
ratio supports the hypothesis that the monetary incentive of PAYT is complementary to the
nonmonetary incentive of DtD. The absence of negative (crowding-out) effects may suggest
that the incentive is well designed and aligned to the users’ intrinsic motivations.
Column 3 of Table 2, which adds all the variables to the specification, also supports a
significantly positive effect for both PAYT (12.3%) and DtD (15.2%). The smaller size of the
coefficient on PAYT compared to Column 2 may suggest that in the previous regression the
coefficient was incorporating also the effect of omitted variables. Indeed, in Column 3 we
also find evidence of an “emulation effect”: the sorted waste ratio rises by 9.2%, even in the
absence of incentives in the waste management system, just because adjacent municipalities
implement PAYT. In our view, users observe the behavior of their peers in adjacent
municipalities and tend to replicate it in their municipality.
Interestingly, there is evidence of a “learning effect” of PAYT (the sorted waste ratio
increases by an additional 3.1% for every further year of PAYT) but not of the DtD collection
methodology. We also find evidence that the presence of adjacent municipalities adopting a
drop-off collection system has a negative effect (-11.1%) on the sorted waste ratio. We
interpret this as a “dismay effect”: the proximity to environments in which citizens are not
required to make any particular effort in sorting (resulting in a low sorted waste ratio) may
weaken the motivation to sort, diminishing the effect of the monetary incentive. The size of
this effect is so high that it can potentially offset the positive effect of PAYT.10
10 The sum of the two coefficients, 0.123-0.111, is not significantly different from zero at the 5% level: F test 0.03, p-value 0.856.
Moreover, we
also find weak evidence (significantly at 10%) of a “hiding effect” of throwing waste
Jena Economic Research Papers 2011 - 058
15
produced in municipalities with PAYT in adjacent municipalities with drop-off collection. In
this case, the sorted waste ratio in the municipality with the PAT increases by 12.7%.11
All our findings are net of the effects on demographic and time variables. However, only
including the coefficients of the year dummy variables seems relevant, and it suggests – not
surprisingly – that the sorted waste ratio tends to increase anyway over the years, plausibly as
a consequence of a massive media campaign in the latest years.
Despite the possibility to make illegal disposal is relatively simple (due to the closeness of
municipalities and the high number of persons commuting for work), our results do not
suggest that this option is clearly exploited (the coefficient is only significant at 10% level).
We believe this may happen because of a social image concern: citizens fear to be caught in
illegally disposing the waste, therefore signalling misbehaviour or their poorness (considering
that the cost for the emptying of the unsorted waste bin is not high).
One concern with the implementation of PAYT is that it carries higher management
costs, which are (at least partly) paid by the users. As a final remark, we want to point out that
with PAYT we find an increase in the sorted waste ratio, and this increase has virtually no
cost to the households. In 2008 the per-capita cost was 96.00 Euros in consortium TV3 (DtD
collection and flat fee) and 95.50 in consortium Priula (DtD and PAYT).12
This happens
because in the municipalities where PAYT is active, households have a strong incentive to
reduce the production of unsorted waste.
4.2. Effects Conditional on the Initial Level of the Sorted Waste Ratio
Our analysis so far shows that both DtD and PAYT programs considerably increase sorting.
However, the effectiveness of monetary and nonmonetary incentives may depend on the
initial level of the sorted waste ratio, and one may expect the effect to be lower in
municipalities already having a high sorted waste ratio. In this Section we focus our attention
on this issue; our outcome results are shown in Table 3. First, we repeat the regressions in
Column (3) of Table 2 separately in two sub-samples of municipalities: weak and strong
sorters. We define “weak sorters” the municipalities with a sorted waste ratio below the first
quartile in 1999 (37.68%), and “strong sorters” the municipalities with a sorted waste ratio
above the third quartile in 1999 (44.25%).
11 In a separate regression, not reported, we included the interaction between the hiding effect and the additional years of PAYT, to understand whether hiding emerges gradually over time. Our results do not support this statement, and we find that hiding is stable over time. 12 From the Arpav website, http://www.arpa.veneto.it/rifiuti/htm/banca_dati_ru.asp.
Jena Economic Research Papers 2011 - 058
16
TABLE 2 ABOUT HERE
The output of this analysis is shown in Columns 1 and 2 of Table 3. We find some
interesting results. In particular, we find context to be relevant only for weak sorters: indeed,
only here there is evidence of an emulation effect (20.6%), a dismay effect (-21.7%) and a
hiding effect (23.2%). More importantly, the net effect of PAYT is significantly different
from zero in both groups, but it is larger among weak sorters (18%, as opposed to 11.7% for
strong sorters). This, together with the positive learning effect of PAYT (3.5%) we observe
only among weak sorters, possibly indicates that among weak sorters there are higher margins
to increase the ratio further. In contrast, the effect of DtD is significantly positive only among
strong sorters with a size of 16%.
Figure 3 summarizes the average marginal effect of both policies, separately by the initial
level of the sorted waste ratio. Effects and confidence intervals are derived from a Blundell-
Bover panel regression with the same specification as in Column (3), but including the (log)
sorted waste ratio in the previous year, and its interaction with the dummy variables for
PAYT and DtD; the output from this regression is shown in Column (3) of Table 3. The
figure shows a clear pattern, with PAYT becoming progressively less effective as the
municipality starts from a higher sorted waste ratio, and DtD becoming progressively more
effective as the municipality starts from a higher sorted waste ratio; the link with the initial
sorted waste ratio is however higher for PAYT. The figure informs that, for instance, if a
municipality starts from a sorted waste ratio of 20%, implementing DtD has no significant net
effect, while implementing PAYT has a net effect of increasing the ratio by 70% (from 20 to
34%); in contrast, if a municipality starts from a sorted waste ratio of 60%, implementing DtD
has a net effect of increasing the ratio by 30% (from 60 to 78%), while implementing PAYT
has no significant net effect. In general, the confidence intervals in Figure 3 (the shaded areas)
suggest that DtD has a significantly positive effect if the initial sorted waste ratio is not lower
than 25%, whereas PAYT has a significantly positive effect if the ratio is below 60%. It thus
seems that the monetary incentive of PAYT prevails over the non-monetary incentive of DtD
only when the municipality has a low production of sorted waste.
FIGURE 3 ABOUT HERE
Jena Economic Research Papers 2011 - 058
17
4.3. Components of the Sorted Waste Ratio
We then look more closely at the components of the sorted waste ratio: sorted waste, unsorted
waste and total (sorted plus unsorted) waste. Table 4 shows the estimates of the model in
equation (3), where the dependent variable is now the logarithm of per capita sorted waste
(Column 1), per capita unsorted waste (Column 2) and per capita total waste (Column 3) in
kilograms. In Columns 4 and 5 we repeat the estimation on the per capita total waste for the
weak and the strong sorters.
TABLE 4 ABOUT HERE
We chose to look at the determinants of these variables because the sorted waste ratio
may increase as a result of an increase in sorted waste, a reduction in total waste, or both.
From the regression analyses in Table 2, we cannot say anything on this issue. However,
knowing this is important because it provides more precise information on how the PAYT
incentive works. We expect that, by increasing the relative cost of producing unsorted waste,
PAYT makes it more convenient to increase sorted waste. In contrast, if the incentive is well
designed and effective, the introduction of PAYT should have no bearings on the production
of total waste, producing just a shift from unsorted to sorted waste. Clearly, when making
more expensive the production of unsorted waste, an alternative for citizens might be to buy
products with less packaging. This would actually lead to a reduction in the amount of total
waste. However, at least in the Italian context, this is not a real option since consumers do not
have the possibility to choose among products with different levels of packaging. They rather
face a uniform reduction in the packaging which is promoted at the national level by the
national packaging consortium (Consorzio Nazionale Imballaggi, CONAI), a specific agency
that essentially encourages firms to reduce the packaging of their products.13
The regression output supports our hypothesis. Indeed, we find for PAYT a significantly
positive effect on per capita sorted waste (which rises by 12.4%; see Column 1) and a
significantly negative effect on per capita unsorted waste (which decreases by 20.3%; see
Column 2), while an insignificant effect on per capita total waste (the coefficient 0.001 is
statistically equal to zero; see Column 3). This also suggests that users do not hide waste in
the presence of this payment system, unless they have a nearby municipality with street bins
13 Moreover, the shift toward products with less packaging encouraged by policymakers (see for example the Directive 2004/12/EC of the European Parliament) is not automatic especially in consideration of the new lifestyle (i.e. increase of single person households, tendency to consume meals outside) offsetting the technological improvements in packaging waste prevention, (EEA, (2005). For further information about the Italian case see EEA, (2005) and also www.conai.it.
Jena Economic Research Papers 2011 - 058
18
for drop-off collection. In fact, in Column 3 we find a significant hiding effect (-7.2%) for
total waste, that seems to regard only weak sorters (-10.4%, Column 4). In addition, we find
that the dismay effect concerns all the waste components, and it is relevant especially for
weak sorters (Column 4), while the emulation effect of nearby municipalities with PAYT is
significant only for sorted waste (9.9% for each nearby municipality, see Column 1). We
interpret this result as evidence that citizens are likely to follow the sorting behavior of the
neighbourhoods. This observation may influence their sorting behavior more than the total
production of waste, which is rather linked to consumption habits. In this case, in line with
Cailas et al. (1993) and Jenkins (1993), we also find that higher population density reduces
the overall production of waste, possibly because municipalities with higher population
density on average have houses with smaller surface, which in turn may induce more attention
in buying products with less packaging.
The effectiveness of PAYT is confirmed by the evidence of a learning effect that is
significantly positive for per capita sorted waste (which increases of about 2.4% for every
further year of PAYT adoption) and significantly negative for the unsorted waste (which
decrease of 4.2% for every subsequent year of PAYT adoption). These results confirm that
PAYT does not affect per capita total waste production, but it rather induces users to shift
from unsortable to sortable products.
In contrast, we find that DtD reduces per capita unsorted waste (by 3.22%; see Column 2)
and it also reduces per capita total waste (by 10.1%; see Column 3). Surprisingly, it does not
significantly increase the production of sorted waste (the coefficient 0.050 in Column 1 is not
significant). We also find a learning effect of DtD on total waste (that is reduced by 2.5%
every further year). This effect supports the view that DtD is a form of nonmonetary incentive
aimed at reducing total waste by imposing constraints to the amount of waste production (e.g.,
providing a given size of personal trash bin and setting a given frequency for waste
collection), while eliminating the time costs of carrying waste to the streets. While DtD
induces a reduction in the production of total waste it does not seem effective in increasing
sorted waste. Hence, even if we observe a similar effect in the sorted waste ratio, the PAYT
fee reaches this goal by sorting more waste, while the DtD collection method reaches it by
producing less waste.
Our results suggest that monetary incentives are an effective tool in fostering the sorting
behavior at the municipal level, and potentially they can be adapted to reach further goals,
primarily the reduction of per capita total waste (European Union, 2008). In fact, in Column 3
Jena Economic Research Papers 2011 - 058
19
of Table 4 we find that the production of total waste tends to increase over time.14
For
example, applying monetary incentives not only to the unsorted waste but also to specific
fractions of sorted waste (plastic, paper, etc.) may have interesting effects on the reduction of
the total waste produced and on the economic sustainability of DtD collection.
4.4. Robustness Check
We conclude the analysis by reporting on the outcome of a robustness check of our results. In
Section 2 we explained that municipalities in our dataset may delegate to a consortium all the
decisions regarding the waste management policies. The exogenous intervention of a
consortium removes potential endogeneity problems, in that policy makers and municipalities
with more pronounced concern for the environment – that we may expect to exhibit
intrinsically higher sorted waste ratios – opt for an incentive-based waste management
system. In our dataset nearly all the municipalities (91 out of 95) delegate the decisions to a
consortium, and they do so generally early (84% of the municipalities were already members
of a consortium in 1999; see Appendix A.2). However, we still include observations where
municipalities are free to choose their own policy.
For this purpose we replicate here our analysis on a smaller sample, by excluding all the
observations where the municipality is free to choose its own management system. This
means that we ignore the four municipalities currently not members of a consortium, as well
as the observations regarding the remaining municipalities prior to joining a consortium. Our
final dataset then consists of 865 observations on 91 municipalities (around 91% of the
original sample), in which the choice of the waste management policy is always set
exogenously.
The output from this analysis is reported in Table 5. Our previous results are largely
confirmed, both qualitatively and quantitatively. In particular, we find for PAYT an effect on
the amount of sorted waste of 11.7% (from Column 1, as opposed to 12.4%), and no effect on
the amount of total waste (from Column 2, as in the benchmark), and an effect on the sorted
waste ratio of 11% (from Column 3, instead of 12.3% as in the benchmark). If we then split
the sample in the two groups of weak and strong sorters (Columns 4 and 5), our previous
findings are also essentially confirmed. In particular, among strong sorters we still find a
smaller effect of PAYT (12.4%) and a larger effect of DtD (15.3%), while only among weak
14 Environmental economists link the growth in the production of waste, as well as the growth in the production of energy, to the increase in wealth and welfare (measured by the GDP). In the future they expect this high correlation to reduce, because of a more widespread concern for the environment. However, while there is already evidence of a “decoupling effect” on the production of energy, the production of waste still seems to follow closely the growth of GDP (Mazzanti and Zoboli, 2008).
Jena Economic Research Papers 2011 - 058
20
sorters we still find evidence of emulation, dismay and hiding effects (respectively 18.5%, -
24.9% and 24.5%).
TABLE 5 ABOUT HERE
5. Conclusions
In this paper we study the effectiveness of the monetary incentive represented by PAYT on
the ratio of sorted to total domestic waste. Our results suggest that, when well designed,
monetary incentives work. Indeed, we find that the PAYT incentive increases the sorted waste
ratio by around 12.3% and that it is complementary to the effect of the DtD incentive
(15.2%). In addition, municipalities with a PAYT program increase the amount of per capita
sorted waste by 12.4%, but have no bearings on the amount of per capita total waste. Our
results were obtained controlling for specific characteristics of the municipalities, and they are
robust to different assumptions of the model. Our findings thus confirm that, in aggregate,
well-designed monetary incentives are an effective tool; hence policy makers should not …
trash monetary incentives, but rather use them to increase the sorted waste ratio. However, we
find that a PAYT policy also induces an undesired hiding effect: users throw their waste in
adjacent towns where common bins are available in the streets – at least in municipalities
where the sorted waste ratio is relatively low. Therefore, a coordination of policies at a macro
level is necessary to avoid this undesired effect.
The analysis in the paper is performed at the municipal level. Future research should take
a closer look at individual data, where negative consequences may result from adopting
PAYT for particular users. In our future research we will focus on the following three issues.
First, we will dig out cases of illegal dumping and garbage tourism in which users try to
“hide” their waste so that they pay less. Second, we will consider the perceived unfairness of
PAYT pricing. PAYT is sometimes considered unfair (Batllevell and Hanf, 2008) because
citizens do not pay proportionally to their income or wealth. Third, we will look at free-riding
problems. These may arise when the payment depends on the behavior of many users, as in
multiproperty buildings. We tend to exclude that this issue has a major effect on the aggregate
results of the current paper, since on average in our dataset there are 1.48 households for
every building. This suggests that apartment buildings are not so frequent in the district of
Treviso.
Jena Economic Research Papers 2011 - 058
21
Appendix A. Municipalities and Consortia in the Dataset
In this appendix we describe the municipalities in the district of Treviso (Section A.1), the
changes introduced by the law on municipal waste management (Section A.2), the three
consortia operating in the district (Section A.3), and the history of their waste management
policies (Section A.4).
A.1. The District of Treviso
As shown in Figure A.1, the district of Treviso (the darker coloured area) is located in north-
eastern Italy, in the region called Veneto (the lighter coloured area).
FIGURE A.1 ABOUT HERE
The district covers an area of 2,477 square kilometres. It is one of the most highly populated
Italian districts (879,408 inhabitants in 2008), with a relatively high population density (355
inhabitants per square kilometre) and a relatively high rate of population growth (the birth rate
is 1.07% and the percentage of legal immigrants is 10.9%15
). The district is divided into 95
municipalities, all close with each other and almost all of relatively small size; an average
municipality has 9,303 inhabitants. Only one municipality, Treviso, has 82,206 inhabitants;
24 municipalities have between 10,000 and 50,000 inhabitants; 36 between 5,000 and 10,000,
and 34 fewer than 5,000 inhabitants. The area is also relatively rich: the average per capita
GDP in 2008 was 30,274 euros, as opposed to the national level of 26,278 euros.
A.2. The Legislative Framework on Waste Management
Italy has four administrative levels (national, regional, provincial/district, and municipal) and
each one takes some responsibility for waste management. The national level defines the
legislative framework and sets targets coherent with the European Directives. Since 1994
each region has delegated the management of waste to an office for “optimal territorial scope”
(Ambito Territoriale Ottimale, ATO). The office sets targets on landfills for biodegradable
municipal waste and separate collection of municipal waste. Districts are responsible for
15 Statistics are provided by Istat for 2008 (http://demo.istat.it). The birth rate is computed as the ratio between the number of births in the year and the average population with legal address in the district, multiplied by 100.
Jena Economic Research Papers 2011 - 058
22
meeting the targets defined by their ATO. To reach the targets, they are free to implement
their preferred waste management policies.
In 1988 the regional plan for the management of urban waste created three territorial
units in the Treviso district (TV1, TV2, and TV3), and promoted the birth of a consortium
within each territorial unit. The purpose was to centralize decisions regarding waste
management policies that, up to that time, had been made by each municipality
independently. Consortia set the targets for the sorting rates and costs of the system, and they
decide the management policy, in terms of waste collection and billing. After the creation of
the three consortia – Priula (in TV2), Savno (in TV1), and TV3 – municipalities were
encouraged, although not forced, to join at any time the “consortium” managing their
territorial unit (see Figure A.2). Once a municipality joins a consortium, it can no longer exit
and it delegates all decisions regarding waste management to the consortium board.
FIGURE A.2 ABOUT HERE
Participation was gradual since, according to the regional plan, municipalities were
allowed to join the consortium in later years, in order to let expire any active waste
management contract previously signed. In a few years, nearly all of the municipalities had
joined the consortium in their respective areas, although most of the municipalities (80 out of
95, or 84%) were already linked to a consortium at the beginning of our sample period in
1999 (see Figure A.3). Currently 91 out of the 95 municipalities belong to one consortium.
The four exceptions are Colle Umberto, Tarzo, Mogliano Veneto, and Treviso, which chose
not to adhere, respectively, to Savno (the first two municipalities), Priula, and TV3.16
FIGURE A.3 ABOUT HERE
A.3. The Three Consortia
We now report some facts on the three consortia.
Consortium Priula (www.consorziopriula.it), created in 1987 with the adhesion of 5
municipalities, now includes 24 municipalities covering an area of 640 square kilometres with
around 240,000 inhabitants. In 2000 the consortium, constituted by 14 municipalities, decides
16 Geographical limits for Colle Umberto and Tarzo, and high population density for Treviso, prevent these municipalities from freely choosing a waste management system. In contrast, Mogliano Veneto chose to follow a waste management system in line with the adjacent municipalities in the district of Venice.
Jena Economic Research Papers 2011 - 058
23
to introduce the DtD and the PAYT system. In 2008 the municipalities in the consortium
reached a sorted waste ratio of 77.06%, gaining first place in national rankings (Legambiente,
2009).
Consortium TV3 (www.tvtre.it), created in 1993 with the adhesion of 25 municipalities,
and operates within a territory of 620 square kilometres having around 220,000 inhabitants. In
2000 the consortium decides to introduce the DtD system. In 2008 the municipalities in the
consortium reached a sorted waste ratio of 66.56%.
Consortium Savno (www.savnoservizi.it), created in 1995 with the adhesion of 6
municipalities, now operates in 42 municipalities covering an area of 1,080 square kilometers
with around 298,000 inhabitants. In 2008 the municipalities in the consortium reached a
sorted waste ratio of 72.53%, gaining third place in national rankings (Legambiente, 2009).
A.4. The Waste Management Systems Adopted by the Consortia
Even though in 1999 all the municipalities were adopting the same collection methods (drop-
off) and pricing systems (flat fee), since 2000 they started to follow different policies. In
particular, in 2000, Priula introduced in some municipalities a DtD program paired in the
following year with a PAYT program based on the volume of unsorted nonrecyclable waste
produced. The volume is measured by counting the number of times during the year that
specific trash bins of unsorted waste are emptied. These bins have a capacity of 120 litres and
are emptied no more often than every two weeks. Given this limit on the maximal frequency,
a maximum of 26 emptyings per year is possible. In 2008 the average number of emptyings
per year was between 5 and 8, depending on the number of household members. In 2008 the
annual cost per household was approximately 140.11 euros in Priula.17
Consortium TV3 also started introducing DtD in 2000 but, contrary to Priula, it kept
using flat-fee pricing rather than PAYT pricing up to 2008. In the second semester of 2009
TV3 also started a PAYT program similar to the one in Priula. We did not use this
information in our analysis; we instead stopped our dataset at the end of 2008, because data
for 2009 are likely affected by the transition from one system to the other (our end-of-year
data would be a mix between what happened in both the first semester with flat-fee pricing,
17 Pricing follows the PAYT equation, Eq. (2). For flat buildings the variable part of PAYT depends on the volume of the common cart and on the number of times that the cart is emptied divided by the number of flats. On average, in 2008 the fixed cost 0θ was equal to 82.38 euros, and the variable cost 1θ was equal to 10.39 euros per emptying. Costs vary over the years. In particular, fixed costs depend on a number of factors, not all strictly related to the collection of waste (such as municipality taxes). Variable costs are instead independently determined by the consortium, and every year they grow with inflation.
Jena Economic Research Papers 2011 - 058
24
and the second semester with PAYT). In 2008 the annual cost per household was
approximately 140.84 euros in TV3.18
The third consortium, Savno, adopted a DtD collection system but it is more
heterogeneous in the pricing systems. In some municipalities the consortium experiments a
flat fee, which depends only on each house’s surface and/or on the number of family
components similar to the one adopted in TV3; in other municipalities the consortium adopts
a volume-based pricing system similar to the one in Priula.
In each municipality where a DtD program is active, the recyclable fractions of waste
(e.g. organic, plastic, paper, glass, cans, etc) are sorted by each user in the house and then
stored into specific bins provided by the consortium which have identical capacity for each
user. The collection of each fraction has different frequencies and follows a calendar. Specific
instructions are given for sorting every fraction of recyclable waste: i.e., glass and plastic
containers have to be cleaned and every piece of paper on them has to be removed, otherwise
the workers in charge cannot collect them.
Appendix B. Waste Collection and Pricing Systems
In this appendix we describe drop-off and DtD collection systems (Section B.1) and flat-fee
and PAYT pricing systems (Section B.2). We conclude this appendix with details on the
monitoring and sanctioning activity.
B.1. Waste Collection Systems
In 1999 all the municipalities in the district were implementing drop-off collection systems
with flat-fee pricing. Sorting of municipal waste through a drop-off program consists of
placing different types of large trash bins for different types of waste (drop-off points) at
various places along the street. Users then voluntarily leave their waste (see Figure B.1).
FIGURE B.1 ABOUT HERE
The DtD collection system assigns to each household different small trash bins for
different types of waste (see Figure B.2). Waste is sorted and kept in each house until the day 18 Pricing follows the flat-fee formula of Eq. (1). Coefficients differ for each municipality, because they depend on a number of factors such as population size and tourist arrivals. They also depend on the nature of the service (e.g., museums have to pay less than restaurants and private houses have to pay less than shops).
Jena Economic Research Papers 2011 - 058
25
on which it is going to be collected, where bins are placed in the streets, just outside each
house.
FIGURE B.2 ABOUT HERE
Waste is collected periodically according to a calendar that is given to the users, such as the
one shown in Figure B.3.
FIGURE B.3 ABOUT HERE
The consortia share similar schedules for waste collection and similar carts and bins for
waste storage. Moreover, the type of material admitted in each sorted fraction (plastic, paper,
glass, etc.) is identical across the consortia as defined in the European Commission Decision
2000/532/CE.
B.2. Waste Pricing Systems
Two alternative pricing systems have been adopted by the consortia in the district of Treviso:
a flat fee and PAYT.
The flat fee price is calculated according to Eq. (1) and it is proportional to the user’s
house surface and/or the number of household members. Table B.1 shows an example of how
the flat fee is calculated in TV3 in the 2008; the table informs on the lower bound of the cost
per square meter, 0φ , and the lower bound of the variable cost, 1φ , which differs with the
household size. Each municipality can freely increase the parameters 0φ and 1φ up to a
ceiling, depending on such factors as the population of the municipality and the level of
tourism.
TABLE B.1 ABOUT HERE
In contrast to the flat fee, PAYT links costs with users’ sorting behavior. Therefore, the
implementation of a PAYT pricing system requires the ability to identify who produces what.
In Priula and in some municipalities of Savno, identification is possible through an
electromagnetic transponder installed in every unsorted waste bin (see Figure B.4). Every
time the cart is placed outside the house for collection, a reader device turns the signal into an
Jena Economic Research Papers 2011 - 058
26
alphanumeric code that unequivocally identifies the cart and the owner. This way data on the
unsorted waste production for each user are recorder and processed.
In principle, identification of the amount of waste produced is possible not only with DtD
collection, but also with drop-off collection. For instance, each household might pass a
magnetic card through a card reader device every time it throws waste into a common bin. In
that case, it becomes difficult to measure the amount of waste thrown, because people might
choose to throw more waste less frequently or mix unsorted waste with sorted waste. For this
reason, cases with PAYT and drop-off collection are rare in practice and limited to few
municipalities.
FIGURE B.4 ABOUT HERE
The calculation of the PAYT fee is made according to Eq. (2) and it is proportional to the
number of emptyings of an unsorted waste cart. Fixed and variable costs vary over the years;
in 2008 the average fixed cost was equal to 0 82.38θ = Euros, and the average variable cost
was equal to 1 10.39θ = euros per emptied waste bin. Figure B.5 shows the growth of the
average PAYT fee per household in Priula from 2001 to 2008 as opposed to price growth (as
measured with the CPI index, from Istat). It turns out that the average PAYT fee has
decreased over the years in real terms, from 160.25 euros in 2001 to 140.11 euros in 2008
(based on 2008). Notice in particular that the average fee markedly dropped in 2002, that is,
in the year when many municipalities in Priula (14 out of 24) moved to a PAYT system.
FIGURE B.5 ABOUT HERE
B.3. The Monitoring Activity and Sanctioning System
In order for the PAYT system to be effective, it is necessary to detect and sanction
irregularities in the waste sorting with monitoring activities.
The monitoring activity is assigned to both the waste collectors and to the so-called
“ecovigili” (environmental guardians) with the power to inspect the quality of sorting also in
the users’ house by their own initiative or by call of other citizens. The management staff of
consortium Priula told us that around 2,000 inspections are run every year in the district of
Treviso. Once an irregularity is detected, by either the waste collector (see the report sheet in
Jena Economic Research Papers 2011 - 058
27
Figure B.6) or the “ecovigili”, each consortium applies sanctions which usually consist of
monetary fines but can even start a judicial procedure in front of a court.19
FIGURE B.6 ABOUT HERE
Generally monitoring and sanctioning systems are implemented not only in the municipalities
where a flat fee is applied but they are sometimes operating in municipalities where waste is
collected with a drop-off method. In this second case, as in Treviso, for example, the
monitoring system is also conducted by the company in charge of the waste management who
associate to each neighbourhood of the city an environmental operator who has the task of
taking care of the correct waste collection and sorting in that area and of detecting
irregularities in sorting preventing illegal dumping by inhabitants of adjacent municipalities
where a PAYT system is adopted. In addition, in the city of Treviso many bins are under
CCTV surveillance, especially those in areas where garbage tourism is more likely.
19 For example, for the consortium Priula, rules for inspections and fines are reported in the document (in
Italian) available at (www.consorziopriula.it/dynamic_downloads/_133_Regolamento_gestione_2006.pdf.
Jena Economic Research Papers 2011 - 058
28
References
Allers, M.A., and C. Hoeben (2010). “Effects of Unit Based Garbage Pricing: A Differences-
in-Differences Approach.” Environmental and Resource Economics, 45, pp. 405–428.
Ariely D., U. Gneezy, G. Loewenstein, and N. Mazar (2009). “Large Stakes and Big
Mistakes.” Review of Economic Studies, 75, pp. 1–19.
Arpav (2000). “La raccolta differenziata nella Regione Veneto.” Osservatorio Regionale
Rifiuti.
http://www.arpa.veneto.it/pubblicazioni/htm/scheda_pub.asp?id=7
Arpav (2009). “Produzione e gestione dei rifiuti nel veneto—anni 2007–2008.” Dipartimento
Provinciale di Treviso – Servizio Osservatorio Suoli e Rifiuti.
http://www.arpa.veneto.it/pubblicazioni/htm/scheda_pub.asp?id=215
Batllevell, M., and K. Hanf (2008). “The Fairness of PAYT Systems: Some Guidelines for
Decision Makers.” Waste Management, 28, pp. 2793–2800.
Benabou, R., and J. Tirole (2003). “Intrinsic and Extrinsic Motivation.” Review of Economic
Studies, 70, pp. 489–520.
British Society for Ecological Medicine (2008). “The Health Effects of Waste Incinerators.”
http://www.ecomed.org.uk/content/IncineratorReport_v3.pdf
Cailas, M.D., R.G. Kerzee, R. Swager, and R. Anderson (1993). “Development and
Application of a Comprehensive Approach for Estimating Solid Waste Generation in
Illinois: First Phase Results”. Urbana, ILL: The Center for Solid Waste management and
Research University of Illinois Urbana-Champaign.
CONAI (2007). Dossier prevenzione. 10 anni di progetti e soluzioni per imballaggi
ecocompatibili. Milan, October 2007.
Jena Economic Research Papers 2011 - 058
29
De Jaeger, S. (2011). “The Political Cost of Residual Municipal Solid Waste Taxation:
Perception Versus Reality.” Mimeo.
European Union (2008). “Directive 2008/98/Ec of the European Parliament and of the Council
of 19 November 2008 on Waste and Repealing Certain Directives.”
European Environmental Agency (2005). “Effectiveness of packaging waste management
systems in selected countries: an EEA pilot study.” EEA Report No 3/2005.
http://www.eea.europa.eu/publications/eea_report_2005_3/at_download/file
Eurostat (2003). “Waste generated and treated in Europe.”
http://epp.eurostat.ec.europa.eu/cache/ITY_OFFPUB/KS-55-03-471/EN/KS-55-03-471-EN.PDF
Eurostat (2010). “Environment in EU27.” Eurostat News Release 43/2010, March 19.
Fullerton, D., and T.C. Kinnaman (1996). “Household Responses to Pricing Garbage by the
Bag.” American Economic Review, 86, pp. 971–984.
Gneezy, U., and A. Rustichini (2000). “A Fine Is a Price.” Journal of Legal Studies, 29, 1–18.
Health Protection Agency (2005). “HPA Response to the British Society for Ecological
Medicine Report.”
http://www.ecomed.org.uk/content/IncineratorHPA.pdf
ISPRA (2011), “Annuario sui rifiuti.”
http://annuario.apat.it/capitoli/Ver_0/versione_integrale/Rifiuti.pdf
Jenkins, R.R. (1993). The Economics of Solid Waste Reduction: The Impact of Users Fees.
Brookfield, VT: Edward Elgar Publishing.
Kinnaman, T.C. (2006). “Policy Watch Examining the Justification for Residential
Recycling.” Journal of Economic Perspectives, 20, pp. 219–232.
Kinnaman, T.C., and D. Fullerton (2000). “Garbage and Recycling in Communities with
Curbside Recycling and Unit-Based Pricing.” Journal of Urban Economics, 48, 419–442.
Legambiente (2009). “Comuni Ricicloni 2008.”
http://risorse.legambiente.it/docs/DossierCR2008.0000001126.pdf
Jena Economic Research Papers 2011 - 058
30
Levitt, S., and S. Dubner (2009). SuperFreakonomics: Global Cooling, Patriotic Prostitutes,
and Why Suicide Bombers Should Buy Life Insurance. New York, NY: Harper Collins
Publishers.
Mazzanti, M., and R. Zoboli (2008). “Waste Generation, Incineration and Landfill Diversion.
De-coupling Trends, Socio-economic Drivers and Policy Effectiveness in the EU.”
Fondazione ENI Enrico Mattei Working Paper 94.2008.
Miranda, M.L., J. Everett, D. Blume, and B. Roy (1994). “Market-Based Incentives and
Residential Municipal Solid Waste.” Journal of Policy Analysis and Management, 13, pp.
681–697.
Missios P., and I. Ferrara (2011). “A Cross-Country Study of Waste Prevention and
Recycling.” Working Papers 028, Ryerson University, Department of Economics.
Naslund, B., (1973), “Pollution and the Value of Time”, European Economic Review, 4, pp.
181-196.
Reschovsky, J.D., and S.E. Stone (1994). “Market Incentives to Encourage Household Waste
Recycling: Paying for What You Throw Away.” Journal of Policy Analysis and
Management, 13, pp. 120–139.
Jena Economic Research Papers 2011 - 058
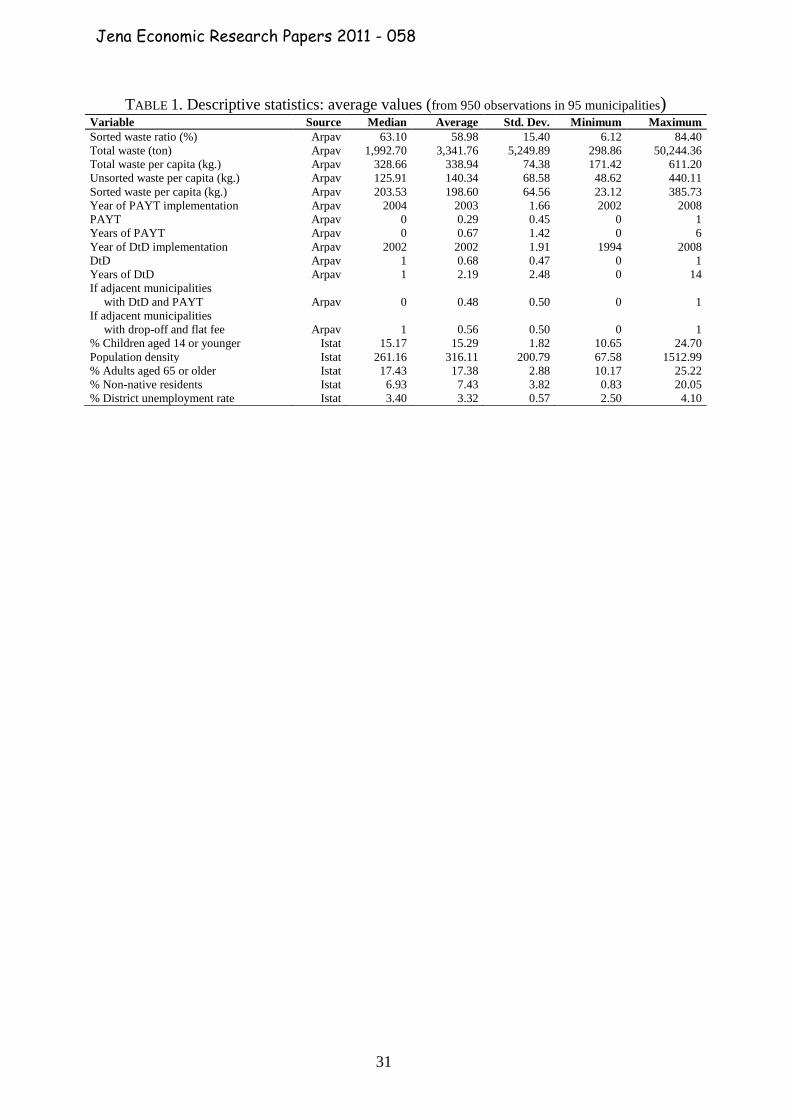
31
TABLE 1. Descriptive statistics: average values (from 950 observations in 95 municipalities) Variable Source Median Average Std. Dev. Minimum Maximum Sorted waste ratio (%) Arpav 63.10 58.98 15.40 6.12 84.40 Total waste (ton) Arpav 1,992.70 3,341.76 5,249.89 298.86 50,244.36 Total waste per capita (kg.) Arpav 328.66 338.94 74.38 171.42 611.20 Unsorted waste per capita (kg.) Arpav 125.91 140.34 68.58 48.62 440.11 Sorted waste per capita (kg.) Arpav 203.53 198.60 64.56 23.12 385.73 Year of PAYT implementation Arpav 2004 2003 1.66 2002 2008 PAYT Arpav 0 0.29 0.45 0 1 Years of PAYT Arpav 0 0.67 1.42 0 6 Year of DtD implementation Arpav 2002 2002 1.91 1994 2008 DtD Arpav 1 0.68 0.47 0 1 Years of DtD Arpav 1 2.19 2.48 0 14 If adjacent municipalities
with DtD and PAYT Arpav 0 0.48 0.50 0 1 If adjacent municipalities
with drop-off and flat fee Arpav 1 0.56 0.50 0 1 % Children aged 14 or younger Istat 15.17 15.29 1.82 10.65 24.70 Population density Istat 261.16 316.11 200.79 67.58 1512.99 % Adults aged 65 or older Istat 17.43 17.38 2.88 10.17 25.22 % Non-native residents Istat 6.93 7.43 3.82 0.83 20.05 % District unemployment rate Istat 3.40 3.32 0.57 2.50 4.10
Jena Economic Research Papers 2011 - 058
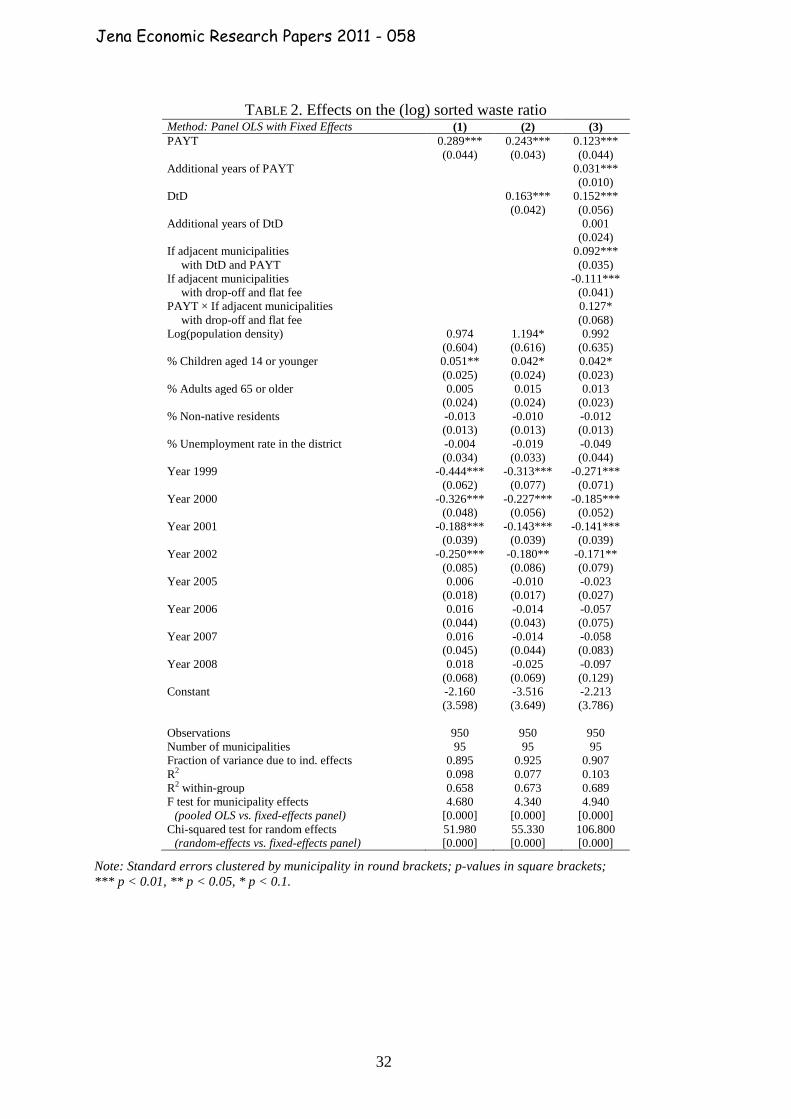
32
TABLE 2. Effects on the (log) sorted waste ratio Method: Panel OLS with Fixed Effects (1) (2) (3) PAYT 0.289*** 0.243*** 0.123*** (0.044) (0.043) (0.044) Additional years of PAYT 0.031*** (0.010) DtD 0.163*** 0.152*** (0.042) (0.056) Additional years of DtD 0.001 (0.024) If adjacent municipalities 0.092***
with DtD and PAYT (0.035) If adjacent municipalities -0.111***
with drop-off and flat fee (0.041) PAYT × If adjacent municipalities 0.127*
with drop-off and flat fee (0.068) Log(population density) 0.974 1.194* 0.992 (0.604) (0.616) (0.635) % Children aged 14 or younger 0.051** 0.042* 0.042* (0.025) (0.024) (0.023) % Adults aged 65 or older 0.005 0.015 0.013 (0.024) (0.024) (0.023) % Non-native residents -0.013 -0.010 -0.012 (0.013) (0.013) (0.013) % Unemployment rate in the district -0.004 -0.019 -0.049 (0.034) (0.033) (0.044) Year 1999 -0.444*** -0.313*** -0.271*** (0.062) (0.077) (0.071) Year 2000 -0.326*** -0.227*** -0.185*** (0.048) (0.056) (0.052) Year 2001 -0.188*** -0.143*** -0.141*** (0.039) (0.039) (0.039) Year 2002 -0.250*** -0.180** -0.171** (0.085) (0.086) (0.079) Year 2005 0.006 -0.010 -0.023 (0.018) (0.017) (0.027) Year 2006 0.016 -0.014 -0.057 (0.044) (0.043) (0.075) Year 2007 0.016 -0.014 -0.058 (0.045) (0.044) (0.083) Year 2008 0.018 -0.025 -0.097 (0.068) (0.069) (0.129) Constant -2.160 -3.516 -2.213 (3.598) (3.649) (3.786) Observations 950 950 950 Number of municipalities 95 95 95 Fraction of variance due to ind. effects 0.895 0.925 0.907 R2 0.098 0.077 0.103 R2 within-group 0.658 0.673 0.689 F test for municipality effects 4.680 4.340 4.940
(pooled OLS vs. fixed-effects panel) [0.000] [0.000] [0.000] Chi-squared test for random effects 51.980 55.330 106.800
(random-effects vs. fixed-effects panel) [0.000] [0.000] [0.000]
Note: Standard errors clustered by municipality in round brackets; p-values in square brackets; *** p < 0.01, ** p < 0.05, * p < 0.1.
Jena Economic Research Papers 2011 - 058
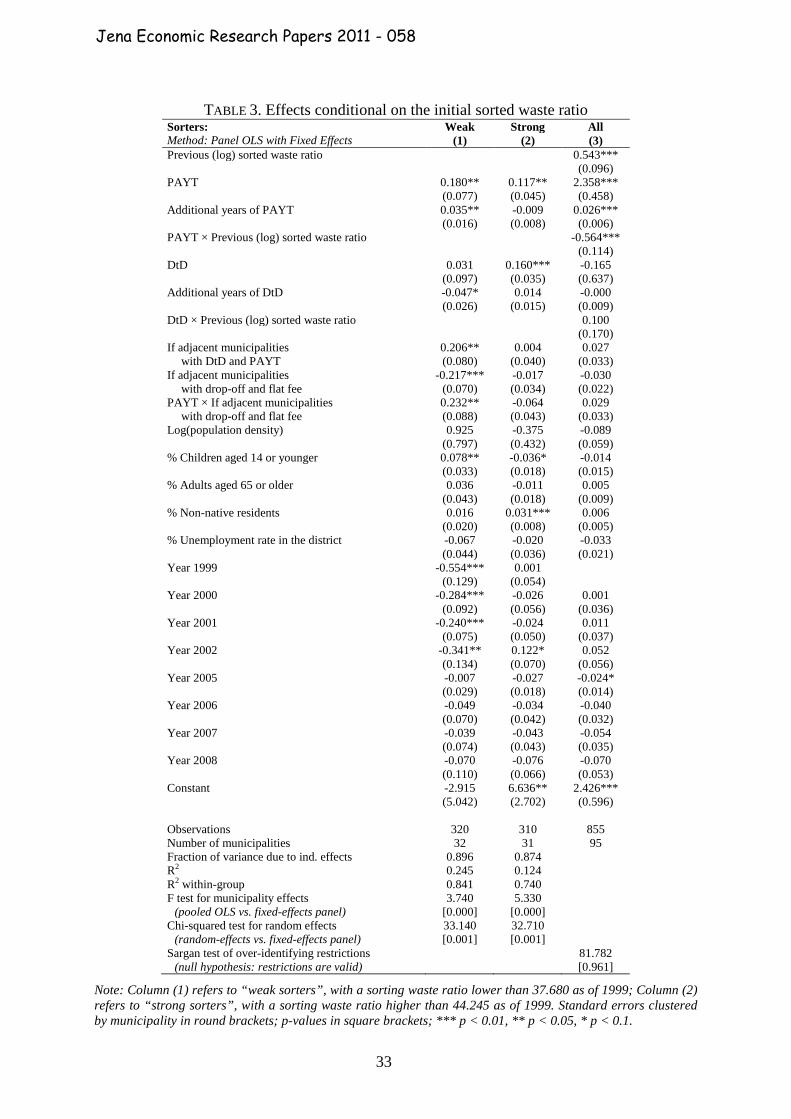
33
TABLE 3. Effects conditional on the initial sorted waste ratio Sorters: Weak Strong All Method: Panel OLS with Fixed Effects (1) (2) (3) Previous (log) sorted waste ratio 0.543*** (0.096) PAYT 0.180** 0.117** 2.358*** (0.077) (0.045) (0.458) Additional years of PAYT 0.035** -0.009 0.026*** (0.016) (0.008) (0.006) PAYT × Previous (log) sorted waste ratio -0.564*** (0.114) DtD 0.031 0.160*** -0.165 (0.097) (0.035) (0.637) Additional years of DtD -0.047* 0.014 -0.000 (0.026) (0.015) (0.009) DtD × Previous (log) sorted waste ratio 0.100 (0.170) If adjacent municipalities 0.206** 0.004 0.027
with DtD and PAYT (0.080) (0.040) (0.033) If adjacent municipalities -0.217*** -0.017 -0.030
with drop-off and flat fee (0.070) (0.034) (0.022) PAYT × If adjacent municipalities 0.232** -0.064 0.029
with drop-off and flat fee (0.088) (0.043) (0.033) Log(population density) 0.925 -0.375 -0.089 (0.797) (0.432) (0.059) % Children aged 14 or younger 0.078** -0.036* -0.014 (0.033) (0.018) (0.015) % Adults aged 65 or older 0.036 -0.011 0.005 (0.043) (0.018) (0.009) % Non-native residents 0.016 0.031*** 0.006 (0.020) (0.008) (0.005) % Unemployment rate in the district -0.067 -0.020 -0.033 (0.044) (0.036) (0.021) Year 1999 -0.554*** 0.001 (0.129) (0.054) Year 2000 -0.284*** -0.026 0.001 (0.092) (0.056) (0.036) Year 2001 -0.240*** -0.024 0.011 (0.075) (0.050) (0.037) Year 2002 -0.341** 0.122* 0.052 (0.134) (0.070) (0.056) Year 2005 -0.007 -0.027 -0.024* (0.029) (0.018) (0.014) Year 2006 -0.049 -0.034 -0.040 (0.070) (0.042) (0.032) Year 2007 -0.039 -0.043 -0.054 (0.074) (0.043) (0.035) Year 2008 -0.070 -0.076 -0.070 (0.110) (0.066) (0.053) Constant -2.915 6.636** 2.426*** (5.042) (2.702) (0.596) Observations 320 310 855 Number of municipalities 32 31 95 Fraction of variance due to ind. effects 0.896 0.874 R2 0.245 0.124 R2 within-group 0.841 0.740 F test for municipality effects 3.740 5.330
(pooled OLS vs. fixed-effects panel) [0.000] [0.000] Chi-squared test for random effects 33.140 32.710
(random-effects vs. fixed-effects panel) [0.001] [0.001] Sargan test of over-identifying restrictions 81.782
(null hypothesis: restrictions are valid) [0.961]
Note: Column (1) refers to “weak sorters”, with a sorting waste ratio lower than 37.680 as of 1999; Column (2) refers to “strong sorters”, with a sorting waste ratio higher than 44.245 as of 1999. Standard errors clustered by municipality in round brackets; p-values in square brackets; *** p < 0.01, ** p < 0.05, * p < 0.1.
Jena Economic Research Papers 2011 - 058
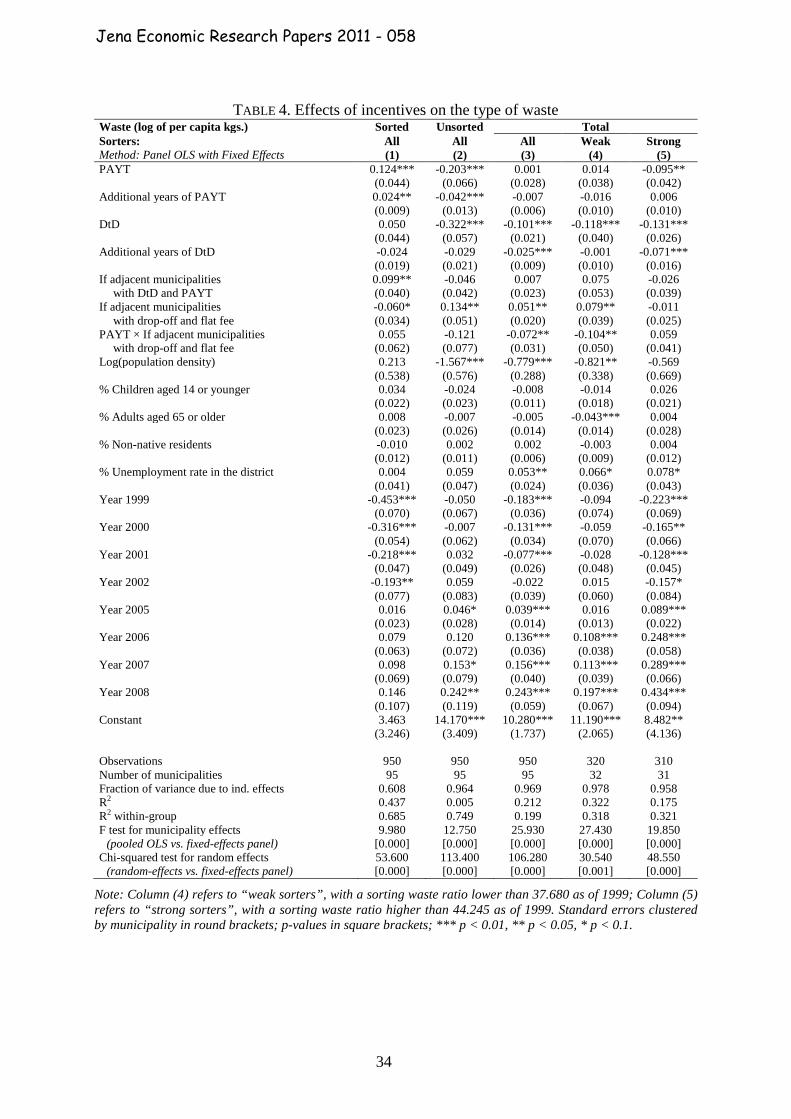
34
TABLE 4. Effects of incentives on the type of waste Waste (log of per capita kgs.) Sorted Unsorted Total Sorters: All All All Weak Strong Method: Panel OLS with Fixed Effects (1) (2) (3) (4) (5) PAYT 0.124*** -0.203*** 0.001 0.014 -0.095** (0.044) (0.066) (0.028) (0.038) (0.042) Additional years of PAYT 0.024** -0.042*** -0.007 -0.016 0.006 (0.009) (0.013) (0.006) (0.010) (0.010) DtD 0.050 -0.322*** -0.101*** -0.118*** -0.131*** (0.044) (0.057) (0.021) (0.040) (0.026) Additional years of DtD -0.024 -0.029 -0.025*** -0.001 -0.071*** (0.019) (0.021) (0.009) (0.010) (0.016) If adjacent municipalities 0.099** -0.046 0.007 0.075 -0.026
with DtD and PAYT (0.040) (0.042) (0.023) (0.053) (0.039) If adjacent municipalities -0.060* 0.134** 0.051** 0.079** -0.011
with drop-off and flat fee (0.034) (0.051) (0.020) (0.039) (0.025) PAYT × If adjacent municipalities 0.055 -0.121 -0.072** -0.104** 0.059
with drop-off and flat fee (0.062) (0.077) (0.031) (0.050) (0.041) Log(population density) 0.213 -1.567*** -0.779*** -0.821** -0.569 (0.538) (0.576) (0.288) (0.338) (0.669) % Children aged 14 or younger 0.034 -0.024 -0.008 -0.014 0.026 (0.022) (0.023) (0.011) (0.018) (0.021) % Adults aged 65 or older 0.008 -0.007 -0.005 -0.043*** 0.004 (0.023) (0.026) (0.014) (0.014) (0.028) % Non-native residents -0.010 0.002 0.002 -0.003 0.004 (0.012) (0.011) (0.006) (0.009) (0.012) % Unemployment rate in the district 0.004 0.059 0.053** 0.066* 0.078* (0.041) (0.047) (0.024) (0.036) (0.043) Year 1999 -0.453*** -0.050 -0.183*** -0.094 -0.223*** (0.070) (0.067) (0.036) (0.074) (0.069) Year 2000 -0.316*** -0.007 -0.131*** -0.059 -0.165** (0.054) (0.062) (0.034) (0.070) (0.066) Year 2001 -0.218*** 0.032 -0.077*** -0.028 -0.128*** (0.047) (0.049) (0.026) (0.048) (0.045) Year 2002 -0.193** 0.059 -0.022 0.015 -0.157* (0.077) (0.083) (0.039) (0.060) (0.084) Year 2005 0.016 0.046* 0.039*** 0.016 0.089*** (0.023) (0.028) (0.014) (0.013) (0.022) Year 2006 0.079 0.120 0.136*** 0.108*** 0.248*** (0.063) (0.072) (0.036) (0.038) (0.058) Year 2007 0.098 0.153* 0.156*** 0.113*** 0.289*** (0.069) (0.079) (0.040) (0.039) (0.066) Year 2008 0.146 0.242** 0.243*** 0.197*** 0.434*** (0.107) (0.119) (0.059) (0.067) (0.094) Constant 3.463 14.170*** 10.280*** 11.190*** 8.482** (3.246) (3.409) (1.737) (2.065) (4.136) Observations 950 950 950 320 310 Number of municipalities 95 95 95 32 31 Fraction of variance due to ind. effects 0.608 0.964 0.969 0.978 0.958 R2 0.437 0.005 0.212 0.322 0.175 R2 within-group 0.685 0.749 0.199 0.318 0.321 F test for municipality effects 9.980 12.750 25.930 27.430 19.850
(pooled OLS vs. fixed-effects panel) [0.000] [0.000] [0.000] [0.000] [0.000] Chi-squared test for random effects 53.600 113.400 106.280 30.540 48.550
(random-effects vs. fixed-effects panel) [0.000] [0.000] [0.000] [0.001] [0.000]
Note: Column (4) refers to “weak sorters”, with a sorting waste ratio lower than 37.680 as of 1999; Column (5) refers to “strong sorters”, with a sorting waste ratio higher than 44.245 as of 1999. Standard errors clustered by municipality in round brackets; p-values in square brackets; *** p < 0.01, ** p < 0.05, * p < 0.1.
Jena Economic Research Papers 2011 - 058
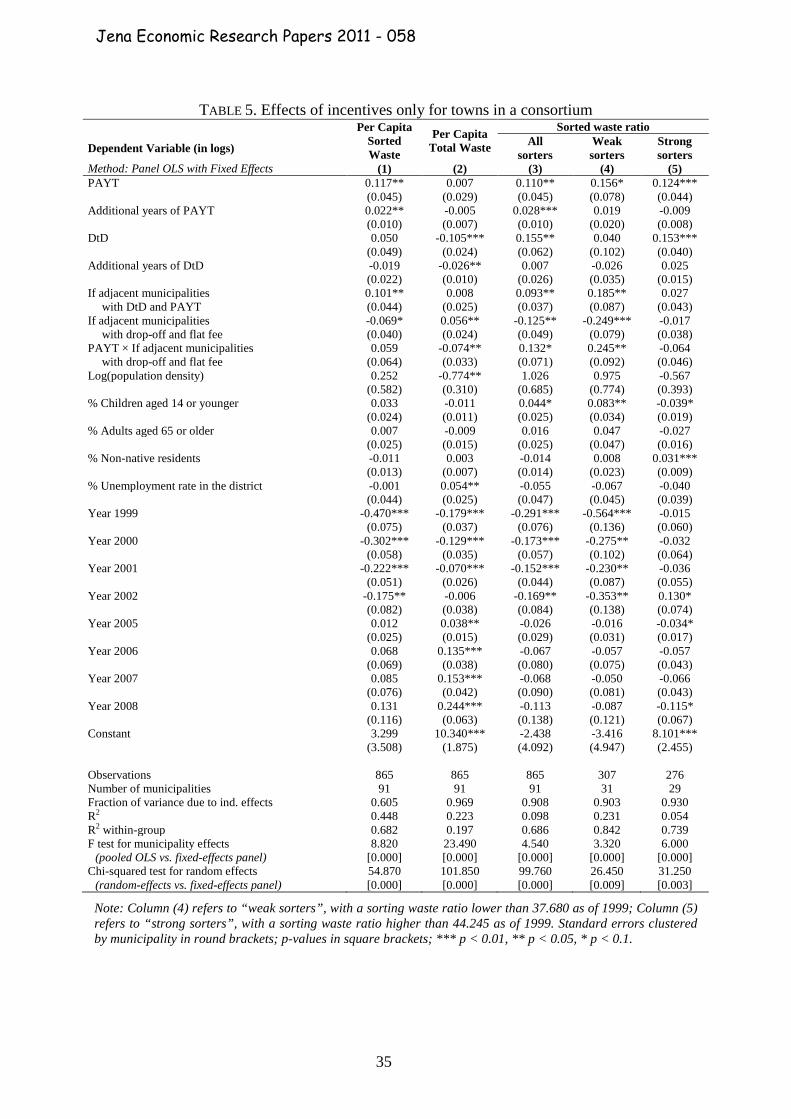
35
TABLE 5. Effects of incentives only for towns in a consortium Per Capita
Sorted Waste
Per Capita Total Waste
Sorted waste ratio
Dependent Variable (in logs) All sorters
Weak sorters
Strong sorters
Method: Panel OLS with Fixed Effects (1) (2) (3) (4) (5) PAYT 0.117** 0.007 0.110** 0.156* 0.124*** (0.045) (0.029) (0.045) (0.078) (0.044) Additional years of PAYT 0.022** -0.005 0.028*** 0.019 -0.009 (0.010) (0.007) (0.010) (0.020) (0.008) DtD 0.050 -0.105*** 0.155** 0.040 0.153*** (0.049) (0.024) (0.062) (0.102) (0.040) Additional years of DtD -0.019 -0.026** 0.007 -0.026 0.025 (0.022) (0.010) (0.026) (0.035) (0.015) If adjacent municipalities 0.101** 0.008 0.093** 0.185** 0.027
with DtD and PAYT (0.044) (0.025) (0.037) (0.087) (0.043) If adjacent municipalities -0.069* 0.056** -0.125** -0.249*** -0.017
with drop-off and flat fee (0.040) (0.024) (0.049) (0.079) (0.038) PAYT × If adjacent municipalities 0.059 -0.074** 0.132* 0.245** -0.064
with drop-off and flat fee (0.064) (0.033) (0.071) (0.092) (0.046) Log(population density) 0.252 -0.774** 1.026 0.975 -0.567 (0.582) (0.310) (0.685) (0.774) (0.393) % Children aged 14 or younger 0.033 -0.011 0.044* 0.083** -0.039* (0.024) (0.011) (0.025) (0.034) (0.019) % Adults aged 65 or older 0.007 -0.009 0.016 0.047 -0.027 (0.025) (0.015) (0.025) (0.047) (0.016) % Non-native residents -0.011 0.003 -0.014 0.008 0.031*** (0.013) (0.007) (0.014) (0.023) (0.009) % Unemployment rate in the district -0.001 0.054** -0.055 -0.067 -0.040 (0.044) (0.025) (0.047) (0.045) (0.039) Year 1999 -0.470*** -0.179*** -0.291*** -0.564*** -0.015 (0.075) (0.037) (0.076) (0.136) (0.060) Year 2000 -0.302*** -0.129*** -0.173*** -0.275** -0.032 (0.058) (0.035) (0.057) (0.102) (0.064) Year 2001 -0.222*** -0.070*** -0.152*** -0.230** -0.036 (0.051) (0.026) (0.044) (0.087) (0.055) Year 2002 -0.175** -0.006 -0.169** -0.353** 0.130* (0.082) (0.038) (0.084) (0.138) (0.074) Year 2005 0.012 0.038** -0.026 -0.016 -0.034* (0.025) (0.015) (0.029) (0.031) (0.017) Year 2006 0.068 0.135*** -0.067 -0.057 -0.057 (0.069) (0.038) (0.080) (0.075) (0.043) Year 2007 0.085 0.153*** -0.068 -0.050 -0.066 (0.076) (0.042) (0.090) (0.081) (0.043) Year 2008 0.131 0.244*** -0.113 -0.087 -0.115* (0.116) (0.063) (0.138) (0.121) (0.067) Constant 3.299 10.340*** -2.438 -3.416 8.101*** (3.508) (1.875) (4.092) (4.947) (2.455) Observations 865 865 865 307 276 Number of municipalities 91 91 91 31 29 Fraction of variance due to ind. effects 0.605 0.969 0.908 0.903 0.930 R2 0.448 0.223 0.098 0.231 0.054 R2 within-group 0.682 0.197 0.686 0.842 0.739 F test for municipality effects 8.820 23.490 4.540 3.320 6.000
(pooled OLS vs. fixed-effects panel) [0.000] [0.000] [0.000] [0.000] [0.000] Chi-squared test for random effects 54.870 101.850 99.760 26.450 31.250
(random-effects vs. fixed-effects panel) [0.000] [0.000] [0.000] [0.009] [0.003]
Note: Column (4) refers to “weak sorters”, with a sorting waste ratio lower than 37.680 as of 1999; Column (5) refers to “strong sorters”, with a sorting waste ratio higher than 44.245 as of 1999. Standard errors clustered by municipality in round brackets; p-values in square brackets; *** p < 0.01, ** p < 0.05, * p < 0.1.
Jena Economic Research Papers 2011 - 058
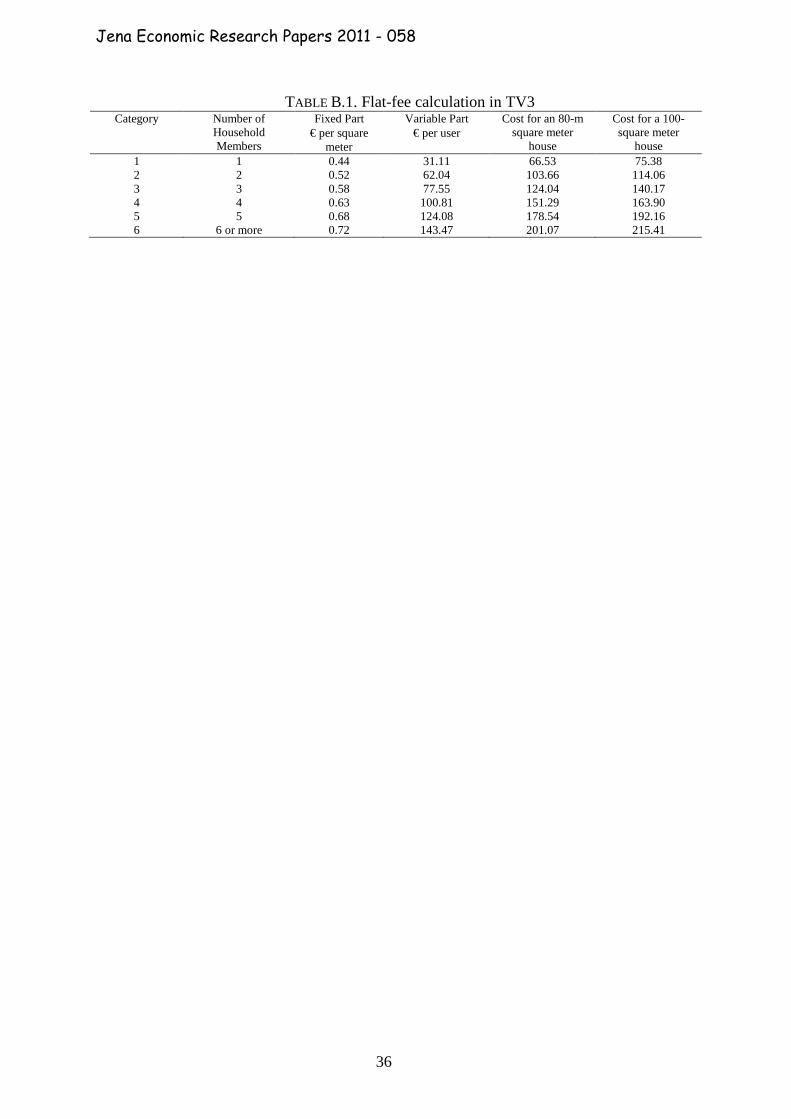
36
TABLE B.1. Flat-fee calculation in TV3 Category Number of
Household Members
Fixed Part Variable Part Cost for an 80-m
square meter house
Cost for a 100- square meter
house € per square
meter € per user
1 1 0.44 31.11 66.53 75.38 2 2 0.52 62.04 103.66 114.06 3 3 0.58 77.55 124.04 140.17 4 4 0.63 100.81 151.29 163.90 5 5 0.68 124.08 178.54 192.16 6 6 or more 0.72 143.47 201.07 215.41
Jena Economic Research Papers 2011 - 058
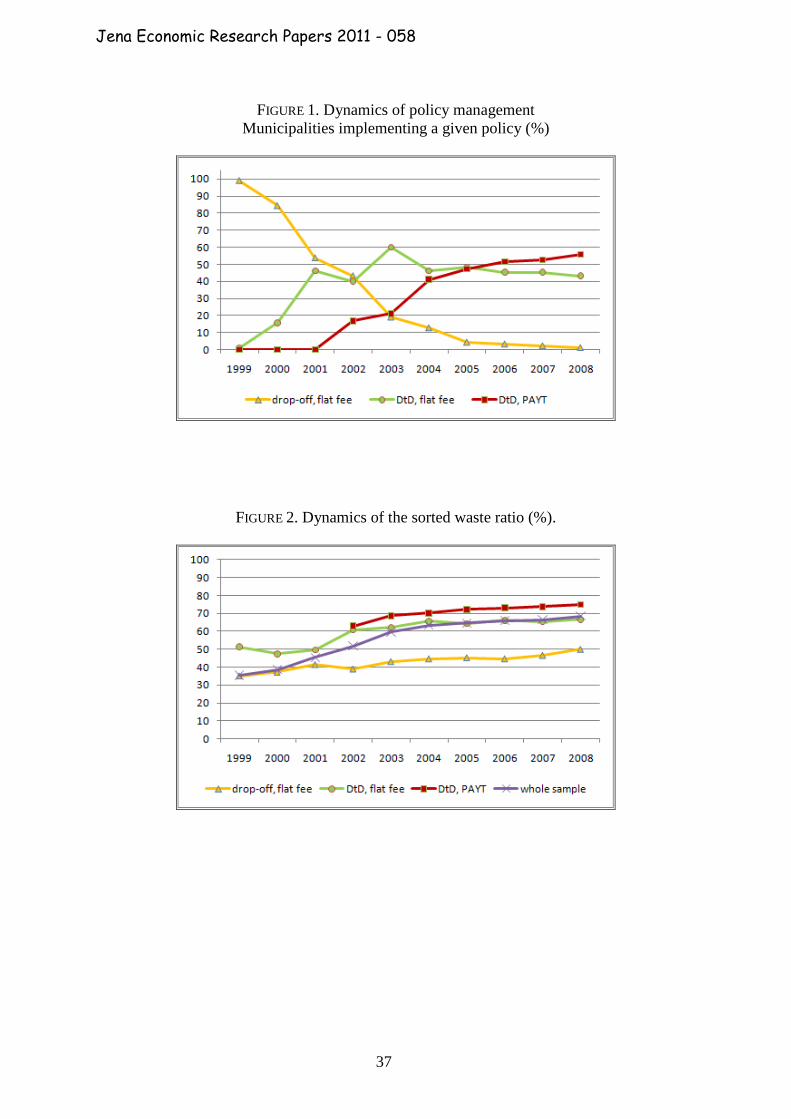
37
FIGURE 1. Dynamics of policy management Municipalities implementing a given policy (%)
FIGURE 2. Dynamics of the sorted waste ratio (%).
Jena Economic Research Papers 2011 - 058
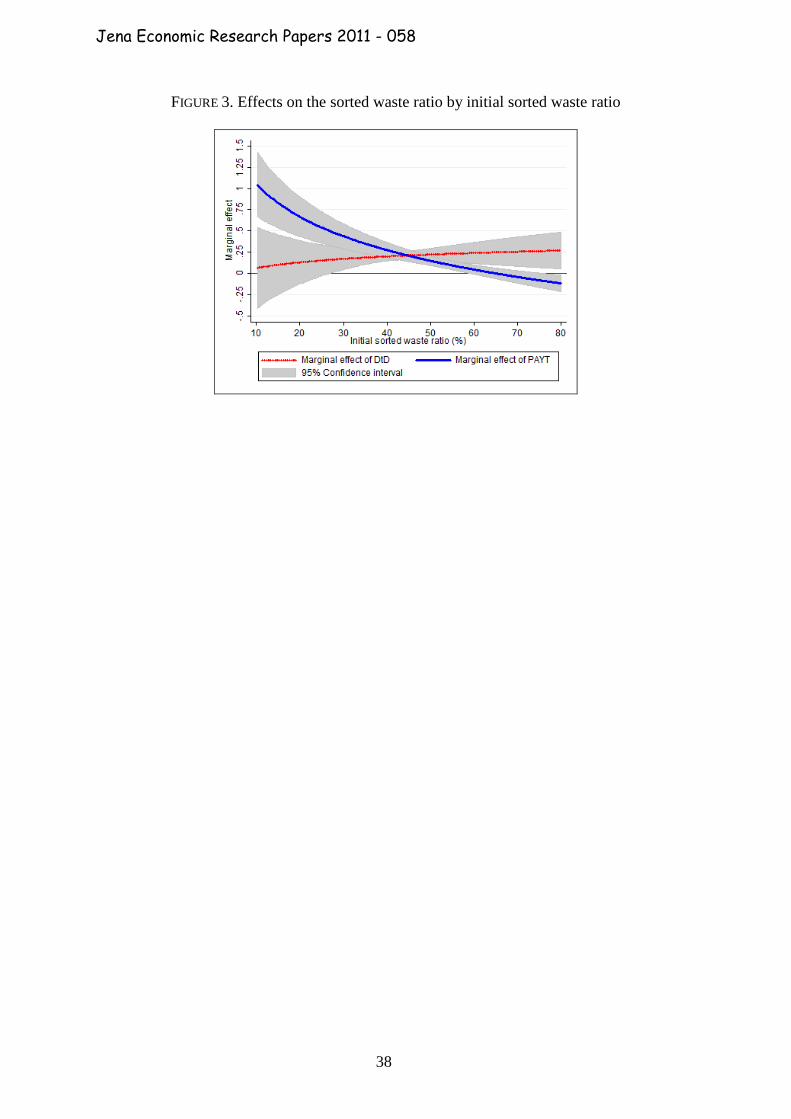
38
FIGURE 3. Effects on the sorted waste ratio by initial sorted waste ratio
Jena Economic Research Papers 2011 - 058
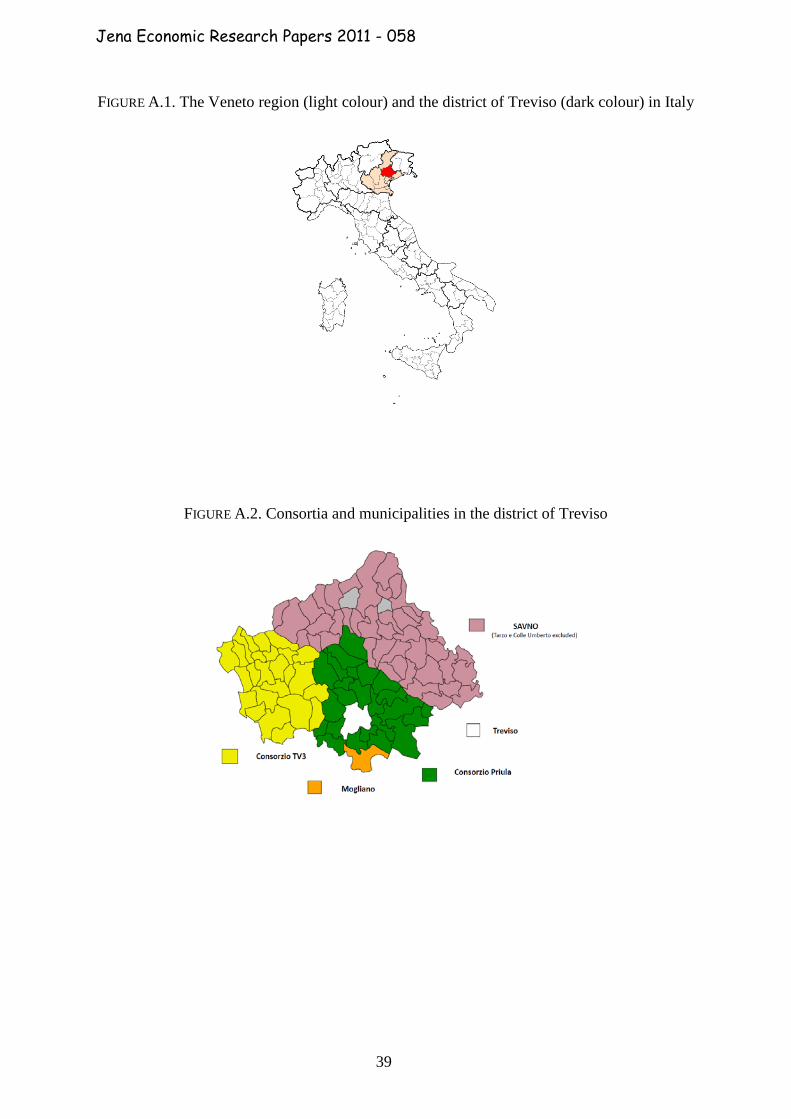
39
FIGURE A.1. The Veneto region (light colour) and the district of Treviso (dark colour) in Italy
FIGURE A.2. Consortia and municipalities in the district of Treviso
Jena Economic Research Papers 2011 - 058
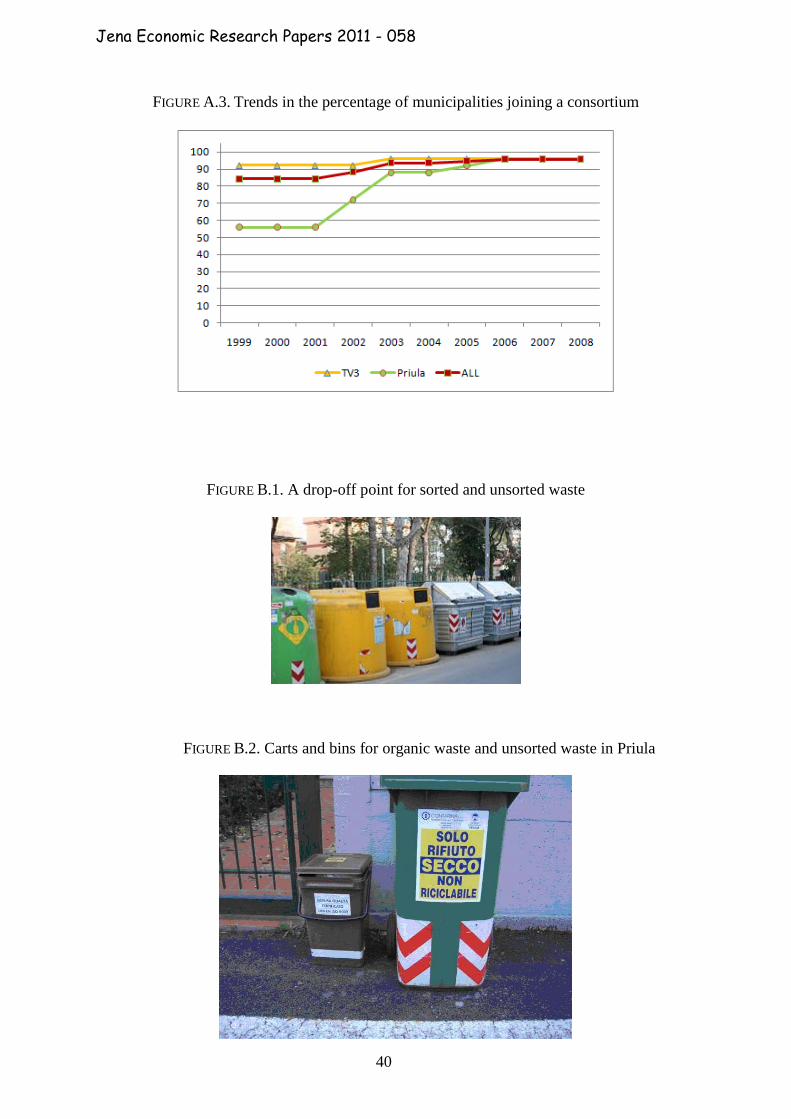
40
FIGURE A.3. Trends in the percentage of municipalities joining a consortium
FIGURE B.1. A drop-off point for sorted and unsorted waste
FIGURE B.2. Carts and bins for organic waste and unsorted waste in Priula
Jena Economic Research Papers 2011 - 058
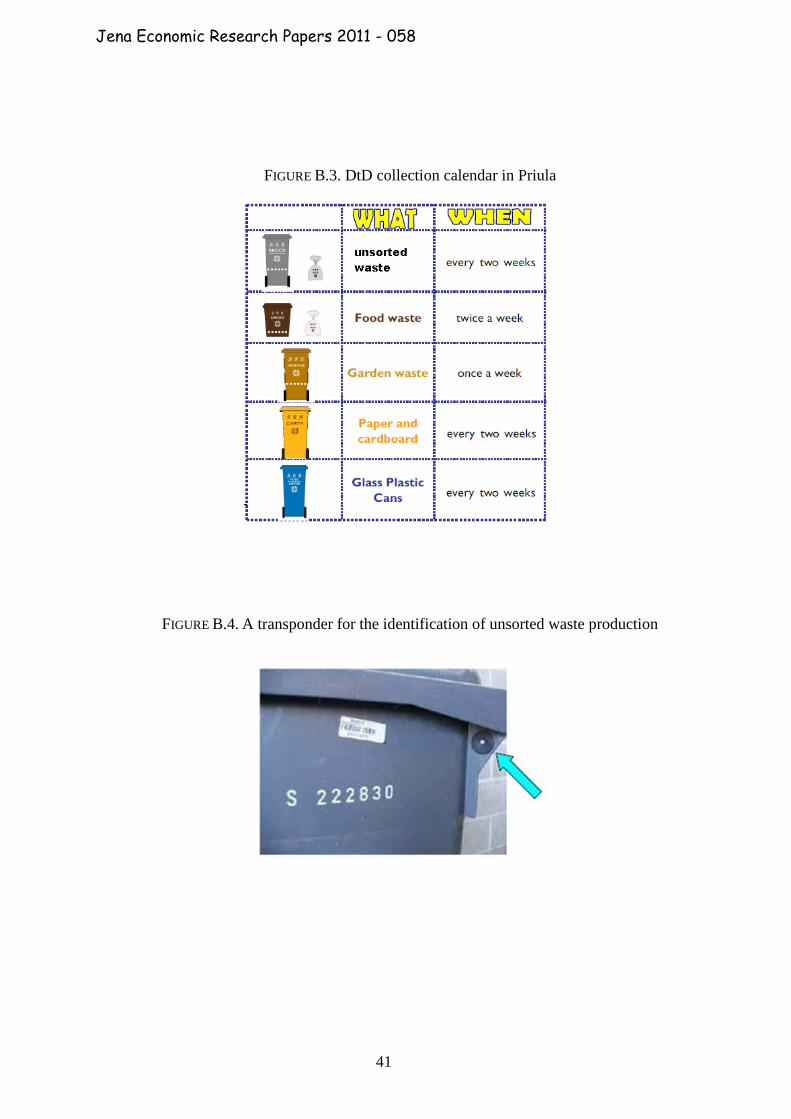
41
FIGURE B.3. DtD collection calendar in Priula
FIGURE B.4. A transponder for the identification of unsorted waste production
Jena Economic Research Papers 2011 - 058
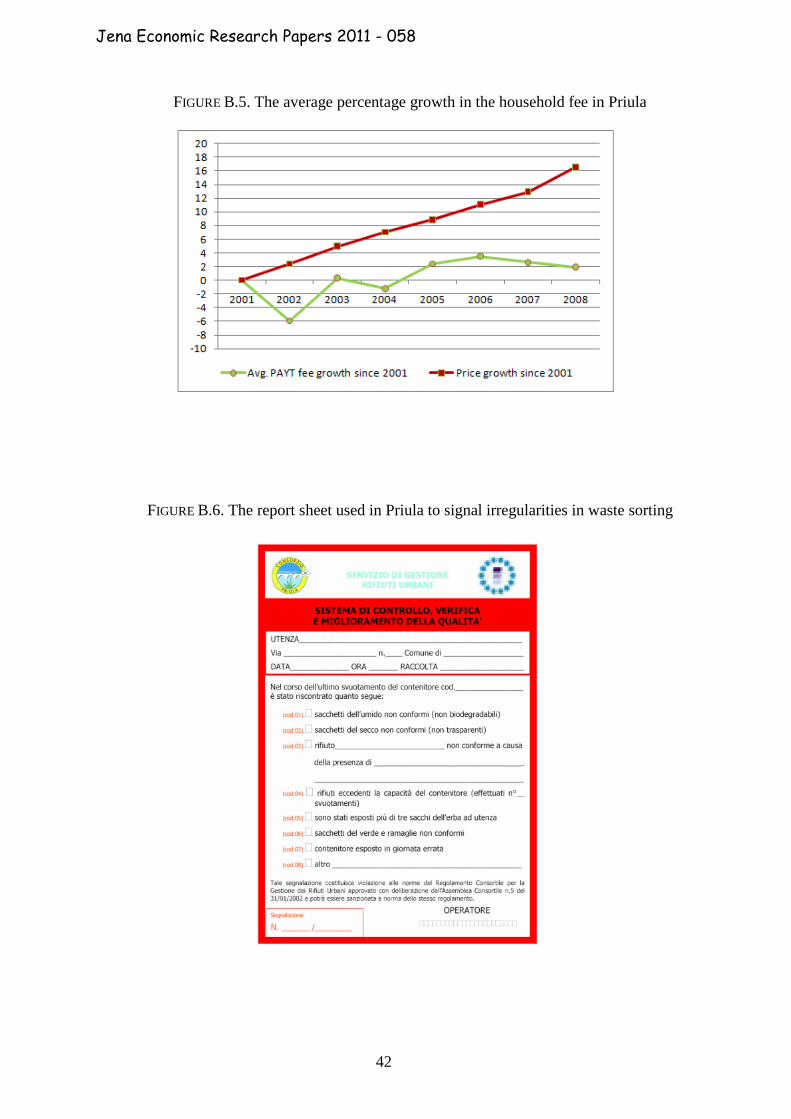
42
FIGURE B.5. The average percentage growth in the household fee in Priula
FIGURE B.6. The report sheet used in Priula to signal irregularities in waste sorting
Jena Economic Research Papers 2011 - 058


