Embed Size (px)
Citation preview
Do-it-yourself guide: How to use the modern single moleculetoolkit
Nils G. Walter, Cheng-Yen Huang, Anthony J. Manzo, and Mohamed A. SobhyDepartment of Chemistry, Single Molecule Analysis Group, University of Michigan, 930 NorthUniversity Avenue, Ann Arbor, MI 48109-1055, USA
AbstractSingle molecule microscopy has evolved into the ultimate-sensitivity toolkit to study systems fromsmall molecules to living cells, with the prospect of revolutionizing the modern biosciences. Herewe survey the current state-of-the-art in single molecule tools including fluorescence spectroscopy,tethered particle microscopy, optical and magnetic tweezers, and atomic force microscopy. Ourreview seeks to guide the biological scientist in choosing the right approach from the available singlemolecule toolkit for applications ranging as far as structural biology, enzymology, nanotechnology,and systems biology.
INTRODUCTIONIn late 1959 the visionary Richard Feynman gave his now classic talk suggesting that “there’splenty of room at the bottom”, which forecast that in the future “we could arrange the atomsone by one the way we want them” and that high-resolution microscopes would allow a directlook at single molecules in biological samples1. Nearly 50 years later, this prediction hasspawned the fields of nanotechnology and single molecule (SM) microscopy. In the 1980’s so-called scanning probe and near-field microscopes were developed that use sharp, nanoscaletips to image, probe and manipulate individual atoms or molecules2–4. Pioneering efforts inthe late 1980’s and early 1990’s realized optical SM detection in wide-field microscopes5–8.While at first limited to the observation of single chromophores embedded in a crystallinematrix at low temperatures, imaging of single molecules under ambient conditions soonbecame possible9–11, enabling the envisioned broad applications of SM tools in biology.
Many reviews have described the unprecedented insights into complex biological processesprovided by the observation and manipulation of single molecules (for a small selection ofrecent reviews see12–19). Briefly, according to the ergodicity hypothesis from statisticalmechanics, a sufficiently long time average (or sufficient number of observations) from a singlemolecule is equivalent to a standard population-averaged snapshot, suggesting that, inprinciple, an SM experiment contains all information of the molecular ensemble. Additionally,SM approaches: (i) reveal heterogeneity and disorder in a sample, albeit in a finite observationwindow (typically seconds to hours), which seem to contradict the ergodicity hypothesis butare commonplace in biological systems; (ii) afford precise localization (with nanometeraccuracy) and counting of molecules (up to 105 molecules/μm2) in spatially distributed samplessuch as a living cell; (iii) work at the low numbers found for most specific biopolymers(proteins, nucleic acids, polysaccharides) in a living cell (typically 1–1,000), eliminating theneed for artificial enrichment; (iv) enable the quantitative measurement of the kinetics (μs toseconds) or statistics of complex biological processes without the need for a perturbing
Correspondence should be addressed to N.G.W. ([email protected]).
NIH Public AccessAuthor ManuscriptNat Methods. Author manuscript; available in PMC 2009 June 1.
Published in final edited form as:Nat Methods. 2008 June ; 5(6): 475–489. doi:10.1038/nmeth.1215.
NIH
-PA Author Manuscript
NIH
-PA Author Manuscript
NIH
-PA Author Manuscript
synchronization of molecules to reach a sufficient ensemble-averaged signal; (v) reveal rareand/or transient species along a reaction pathway, which are typically averaged out in ensemblemeasurements; (vi) enable the ultimate miniaturization and multiplexing of biological assayssuch as SM sequencing20; (vii) facilitate the direct quantitative measurement of mechanicalproperties of single biopolymers and their assemblies, including the forces (10−2 to 104 pN)generated by biological motors; and (viii) provide a way to “just look at the thing”, as Feynmansuggested1, since one can argue that seeing SM behavior is believing. In combination, thesefeatures lead to the profound intellectual and scientific appeal of SM tools and their imminentpotential to revolutionize all aspects of the biosciences including structural biology,enzymology, nanotechnology, and systems biology. However, the capabilities of existing SMtechniques also have limitations, especially in the accessible measurement accuracies, timeresolutions, and time windows, as posed by the weak signal and potential for loss of theobserved molecule.
While many studies attest to the unique information gained from SM observation (aconservative estimate places relevant publications at currently ~2,000, with an exponentiallyincreasing trend over the past four decades14), two bottlenecks have impeded an even morerapid and widespread incorporation into the biological sciences. The first bottleneck derivesfrom the perceived requirement for expansive experience and expensive equipment. Theaccompanying review by Ha and coworkers seeks to encourage researchers to overcome thishurdle by building their own affordable SM fluorescence microscope19. A complementarysolution is the implementation of open-access resource centers, much like existing structuralbiology centers15, or other forms of collaborations with specialists. The second impedimentto a broader application of SM tools in biology stems from the need to identify the most suitabletechnique from the toolkit and develop the corresponding assay to solve the scientific questionat hand. The current review aims to provide practical “do-it-yourself” guidelines for choosingthe optimal SM tool for any number of research problems. The best choice will depend on theobservable of interest, which leads to an organization of the review by categories ofobservables. For each category, we will provide examples for successful SM assays, as wellas a discussion of data analysis, limitations, and possible advances in the future. First, however,we will survey the rapidly expanding optical and force microscopy toolkit available to the SMmicroscopist (electrophysiology techniques as applied to single membrane-bound ion channelsare beyond our scope).
METHODS BASED ON OPTICAL OBSERVATIONAn essential basis for making single molecule observations is to dilute the molecule of interestto low (typically < nM) concentrations. The optical, mostly fluorescence based, detection ofsingle molecules has therefore been likened to finding the proverbial needle in the haystack,particularly if the signal-to-noise ratio is not carefully optimized21,22. A number of opticalconfigurations stack the deck in one’s favor and routinely achieve single fluorescent moleculesensitivity (Fig. 1 and Table 1). Their basic components are the microscope, light source(s),optical detector(s), probe(s), and sample23.
Experimental configurationsMicroscope designs—An SM microscope needs to efficiently reject background, such asautofluorescence as well as elastic Rayleigh and inelastic Raman scattering of the mediumsurrounding the target molecule, by optically isolating the desired Stokes-(red-)shiftedfluorescence signal. A common way to decrease background while retaining signal is todecrease the excitation volume to where the molecule is expected, which can be accomplishedby four basic principles (Fig. 1).
Walter et al. Page 2
Nat Methods. Author manuscript; available in PMC 2009 June 1.
NIH
-PA Author Manuscript
NIH
-PA Author Manuscript
NIH
-PA Author Manuscript
First, the excitation volume can be confined using conventional optics. In wide-field epi-fluorescence microscopy the illumination and detection volumes are constrained by focusinglight to illuminate an area several μm in diameter and using the same optics to detectfluorescence with an area detector. If desired, the excitation beam waist can be further narrowedwith a 200–500 μm pinhole (narrow-field epi-fluorescence24, Fig. 1a). Another approach,termed HILO microscopy (Figure 1d and Table 1), uses a highly inclined beam near theobjective edge that refracts into a thin optical sheet to penetrate the sample at a shallowangle25.
Second, light from outside the focal volume can be eliminated using a small detection pinholeon the microscope side of the objective to keep out-of-focus light from reaching the detector(Fig. 1a). This method, called laser confocal microscopy (LCM), has several differentimplementations as discussed elsewhere26. In fluorescence correlation spectroscopy (FCS)and fluorescence cross-correlation spectroscopy (FCCS) (Table 1), target molecules of one andtwo fluorophore colors, respectively, either freely diffuse through a fixed confocal volume orare immobilized27, giving rise to stochastic fluorescence fluctuations that are temporallyautocorrelated and cross-correlated, respectively, or otherwise statistically analyzed. Withoutimmobilization the temporally autocorrelated molecules are not the same since new onescontinuously pass through the confocal volume, leading effectively to ensemble averaging anda limited ability to interrogate or track individual molecules.
Third, total internal reflection (TIR) at a glass(or quartz)-to-solution interface can be used togenerate a standing wave (“evanescent field”) that penetrates the solution to a depth of ~50–150 nm, depending mostly on the incident angle and relative refractive indices at theinterface28. Practical implementations of total internal reflection fluorescence microscopy(TIRFM, Table 1) use either a quartz prism (Fig. 1b) or the microscope objective (Fig. 1c) togenerate the evanescent field and illuminate surface-immobilized or –constrained molecules.The excitation beam paths of epi-fluorescence, HILO and objective TIRFM are relativelysimilar so that the same microscope can be switched between them (Fig. 1d). Finally, in near-field scanning optical microscopy (NSOM, Table 1), a metal-coated optical fiber with a taperedaperture of sub-wavelength diameter (~80 nm) generates a focused evanescent field that isscanned closely over a surface with immobilized target molecules and imaged using the samefiber or a high-numerical aperture objective (Fig. 1e). Although NSOM has found widespreadapplications in nanotechnology, it has proven difficult to apply to biological samples due tothe need for a flat, stable sample surface and the fragility of the fiber tip.
Fourth, the detection volume can be physically restricted by, for example, using photophysicsto silence neighboring molecules. More specifically, spatial resolution and signal-to-noise ratioare improved in stimulated emission depletion (STED) microscopy (Box 1) by depletion ofout-of-focus fluorescent molecules or in photoactivated localization microscopy (PALM) andstochastic optical reconstruction microscopy (STORM) by stochastic photoswitching ofneighboring fluorophores (Table 1). Alternatively, a small nanofluidic channel (Fig. 1f),capillary (Fig. 1g) or other compartment can be used to contain the target molecule in a volumesmaller than the excitation volume, often in combination with other approaches to create adecreased excitation volume. In TIRFM, for example, the detection volume of single moleculescan be physically further restricted by partially blocking the evanescent field withnanofabricated zero-mode waveguides29,30 or in partially etched optical fiber-bundlearrays31. Such physical containment strategies often lend themselves to integration with micro-and nanofluidic sample handling, which reduces the required sample volume and gives theopportunity to precisely control environmental conditions such as the timed release and mixingof reagents, fluid flow (shear force), and transient exposure to nanoscale manipulation andsensing devices32 (for a detailed discussion please also see the accompanying review byBrewer and Bianco33).
Walter et al. Page 3
Nat Methods. Author manuscript; available in PMC 2009 June 1.
NIH
-PA Author Manuscript
NIH
-PA Author Manuscript
NIH
-PA Author Manuscript
Light sources and optical detectors—In most cases lasers are used for SM detectiondue to their intense, coherent, and collimated excitation light with well-defined wavelength.Lasers are either continuous or, if additional information such as an excited state lifetime issought, pulsed34. The most common detector for the single-point measurements performed inconfocal fluorescence microscopy is the single-photon counting avalanche photodiode (SPADor APD)23 of nanosecond response time35. A photomultiplier tube (PMT) has a largerdetection area, but offers lower quantum efficiency and requires higher operating voltage,which produces noticeable dark counts even when cooled23. For detection of single moleculesin a wide-field microscope a specialized charge coupled device (CCD) is the area detector ofchoice. A CCD camera does not count single photons per se, but integrates photoelectrons overtime with good quantum efficiency. The noise in each pixel of a cooled CCD chip does notnotably increase with integration time so that longer integration leads to improved signal-to-noise. Modern CCD cameras that reach single fluorophore detection sensitivity with 1–100 msintegration times use image intensifier tubes with a photocathode, microchannel plate andphosphor screen (in an intensified CCD, or ICCD) or on-chip multiplication of photoelectrons(in an electron-multiplied CCD, or EMCCD). The CCD imaging of the diffraction-limited spotof a single fluorescent molecule described in the implementation section below has recentlybecome very popular since it enables measurement of the molecule’s position at nanometerprecision and can visualize position changes over time that report on molecular-scalemovement14,36–39. The time resolution of a single fluorescent molecule detected by an APDis mostly limited by the photon count rate, which is inversely related to the total observationtime before photobleaching, whereas detection by a CCD is limited by the frame readout rate.
Probes—Fluorophores suitable for SM detection fall into several categories: fluorescentorganic dye molecules (including nonlinear optical chromophores), semiconductornanocrystals, also known as quantum dots, fluorescent proteins, fluorescent microspheres, andgold nanoparticles. A suitable fluorophore needs to have: 1) high brightness, which is theproduct of the extinction coefficient of the fluorophore at the wavelength of excitation (shouldbe >20,000 M−1cm−1) and the fluorescence quantum yield (ratio of emitted to absorbedphotons) at the wavelength of emission (should be >10%); 2) a relatively short excited-statelifetime (of a few nanosecond) to quickly replenish the ground state; 3) a large Stokes shift tofacilitate rejection of scattered excitation light; and 4) stable photophysical properties (rarephotobleaching, low probability of dark states).
A widespread and powerful SM fluorescence application is to measure intra- or intermoleculardistances. For sensitive distance measurements by fluorescence resonance energy transfer(FRET) between two fluorophores, the detected distance(s) should fall within a range of 0.5-to 2-fold of the so-called Förster distance, which is the characteristic distance of half-maximalFRET efficiency of a specific fluorophore pair19,40. To observe single fluorophore quenchingby electron transfer the electron transfer partner should be within a distance of ~10 Å. For amore in-depth discussion of the criteria for selecting fluorophores suitable for SMmeasurements and strategies for their conjugation to a biopolymer the reader is referred toKapanidis and Weiss41 and the accompanying review by Ha and coworkers19.
The sample—In single “molecule” fluorescence microscopy the target may either be acovalently bonded molecule or a molecular assembly, which can be freely diffusing, spatiallyconstrained or completely immobilized. Techniques that use an evanescent field for excitationand/or seek an extended observation time window require partial or full immobilization of thetarget molecule. A number of approaches, discussed in ref. 42 and the accompanying reviewby Ha and coworkers19, have been successfully implemented to accomplish containment ofthe target molecule under conditions where it retains its native (solution-state) behavior. Recentadditions to this arsenal are dielectrophoretic and electrokinetic trapping of freely diffusing
Walter et al. Page 4
Nat Methods. Author manuscript; available in PMC 2009 June 1.
NIH
-PA Author Manuscript
NIH
-PA Author Manuscript
NIH
-PA Author Manuscript
molecules14. Which method is most suitable for a given problem depends on the stringencyof surface passivation necessary to suppress nonspecific adsorption in the biological context.
Implementation and general considerationsImaging—Both scanning and stationary modes of LCM can obtain images of biologicalsamples, but with very different characteristics. Scanning LCM can, for example, obtain three-dimensional images of a live cell, but the quality of the image depends heavily on the scanningrate, which limits its ability to observe dynamic processes. “Parking” a stationary LCM focuson an imaged, immobilized biomolecule then can capture dynamic processes on a fast (μs)timescale. Spinning-disc confocal imaging uses a pattern of slits on a disk spinning at typically3,000 rpm to create virtual pinholes for confocal detection from a larger area43. By comparison,confocal FCS analysis of diffusing molecules is suitable for determining the bulk concentration(nM and below), diffusive properties, and brightness as well as fast to intermediate dynamics(ms), and is limited by the photon count rate and focal residence time. New FCS detectionschemes therefore aim to more directly access slower biological processes, as well as highertarget concentrations, whereas dual-color FCCS was developed to probe multiple componentsassembling into complexes44,45. The spatial resolution of scanning LCM can be improved byincorporating “hardware” based high-resolution techniques (Box 1). Epi-fluorescence andTIRF based techniques are suitable to study intermediate to slow dynamics (≥1 ms), limitedby the CCD frame rate and image intensity requirements. In conjunction with “software” basedhigh-resolution techniques, epi-fluorescence and TIRF have developed into valuable tools forin vitro and live cell imaging as well as particle tracking (see next section).
Single particle localization and tracking—A multitude of methods are available andcontinuously being refined to allow biologists to probe the positions and distributions ofparticles in dynamic samples at high spatial and temporal resolutions, with wide-field opticalmicroscopy as the major work horse. Abbe intuitively postulated over 120 years ago that opticalresolution is impossible below ~200 nm (referred to as “Abbe’s law” or “Rayleigh’s resolutionlimit”)46. Beginning in the late 1980’s, however, light microscopy of fluorescent beads andmetallic nanoparticles attached to biological specimens allowed the localization and trackingof features with spatial resolutions of tens of nanometers and time resolutions of tens ofmilliseconds, resulting in related techniques with names such as nanovid microscopy, singleparticle tracking (SPT), and tethered particle microscopy (TPM)47–49 (Fig. 2a). As early as1996, tracking of diffusive motions of membrane constrained, dye labeled single moleculeswas reported50. A recent theoretical analysis has shown that the resolution of opticalmicroscopes is in fact not limited by Abbe’s law and can be improved by increasing the numberof detected photons51. Current ultrahigh-resolution fluorescent microscopy tools can beclassified either as techniques that utilize mathematical processing of the acquired diffractionlimited image, where the point-spread function (PSF) of an imaged fluorophore is analyzedusing a priori knowledge about its shape (“software” based solutions, discussed in thefollowing); or as techniques that take advantage of unique optical hardware configurations tosuppress the PSF size through the use of specific sample illumination patterns (“hardwaresolutions”, see Box 1)14.
Recent “software” based particle tracking of single fluorescent emitters has advanced toresolutions of up to 1.5 nm16,37. Fluorescence imaging with one-nanometer accuracy(FIONA) localizes and tracks SM emitters over time by finding the centers of their diffractionlimited PSFs in a sequence of wide-field images. This is typically done by approximating thediffraction limited Airy disk as a 2D Gaussian function (Fig. 3a)37,38. Since fitting is a post-measurement, software-based manipulation of wide-field images, it can be applied inconjunction with a broad range of microscope configurations including TIRFM, epi-fluorescence, and LCM. Most typically, images are recorded with a CCD and are thus pixilated.
Walter et al. Page 5
Nat Methods. Author manuscript; available in PMC 2009 June 1.
NIH
-PA Author Manuscript
NIH
-PA Author Manuscript
NIH
-PA Author Manuscript
The accuracy with which the center position of a PSF can be localized is then given by thestandard error of the mean36:
To first approximation, σSEM is the square root of the standard deviation s of the Gaussian fit,divided by the square root of the total number N of photons collected (first term), revealinghow important total photon count is for high accuracy. The effective pixel size of the camera,a, and the noise from background signal, b, also play a role (second and third terms).
Multiple particle localization and tracking—A number of ultrahigh-resolutiontechniques build upon FIONA to expand its applicability to larger fluorophore numbers.Single-molecule high-resolution co-localization (SHREC) is a two-color version of FIONAthat uses fiduciary markers to measure the registration between two detection channels ofseparable spectral range52. Single-molecule high-resolution imaging with photobleaching(SHRImP)53 and nanometer-localized multiple single-molecule (NALMS) fluorescencemicroscopy54 are capable of measuring distances between identical fluorescent probes thatoverlap in a diffraction limited spot. Upon stochastic photobleaching, the position of the lastbleached fluorophore is determined by FIONA. This PSF is then subtracted from the previousimage consisting of two overlapping PSFs from two proximal fluorophores, and FIONA isapplied to define the PSF location in this difference image (Fig. 3b). This process may continuefor an arbitrary number of fluorophores, with decreasing precision of centroid localization ofeach additional dye molecule.
Stochastic optical reconstruction microscopy (STORM)55 utilizes single photo-switchablefluorescent emitters that are turned on and off by excitation light sources. A stochasticallydifferent subset of proximal fluorophores is activated with each imaging cycle, allowing for ahigher chance of sufficiently separated PSFs for FIONA-type localization (Fig. 3c). Similarly,photoactivated localization microscopy (PALM)56 and fluorescence PALM (F-PALM)57photoactivate and subsequently bleach sparse subsets of photoactivatable fluorescent proteinmolecules within a sample with a high density of such probes. FIONA is applied to each imageand the aggregate position information assembled into an ultrahigh-resolution image with asmany as 105 PSFs per μm2 and separations of localized molecules resolved to ~10–60 nm.Finally, point accumulation for imaging in nanoscale topography (PAINT) is based oncontinuous transient (specific or nonspecific) binding of low concentrations of otherwise freelydiffusing single fluorophores to an imaged object; once bound and imaged the fluorophoresare bleached to repeat the process58. The centroids of the PSFs from these transient fluorescentsignals are determined by FIONA and used to assemble a composite image of relatively largeobjects, such as unilamellar vesicles.
METHODS BASED ON MECHANICAL INTERACTIONThe ability to apply force to or measure forces generated by a single biopolymer opens up newavenues to manipulating biomolecules and interrogate cellular processes12,17,18. Three formsof force microscopy are commonly used to study single molecules (Fig. 2) □ optical tweezers(OT), magnetic tweezers (MT), and atomic force microscopy (AFM) □ and are described indetail in the accompanying review by Neuman18. A fourth technique, tethered particlemicroscopy (TPM), is discussed here as well. They share some common features includingthat they typically operate chromophore(label-)free as they extend a long biopolymer betweentwo attachment sites (handles).
Walter et al. Page 6
Nat Methods. Author manuscript; available in PMC 2009 June 1.
NIH
-PA Author Manuscript
NIH
-PA Author Manuscript
NIH
-PA Author Manuscript
Experimental configurationsOptical tweezers (OT, optical traps) were developed since the 1970’s59. OT utilize theradiation pressure exerted by a focused laser beam on an object (usually a transparent sphericalbead) of distinct refractive index to levitate it (Fig. 2b). The equilibrium position of the beadis close to the center of the laser focus (a slightly downward displacement is due to scatteredlight). Any displacement from this equilibrium position will produce a restoring forceproportional to the displacement (as in a linear spring). In magnetic tweezers (MT), the opticallytransparent plastic bead is replaced by a superparamagnetic bead that is controlled by magneticforces (Fig. 2c). MT is an intrinsic force clamp device, since the magnetic field gradient exertsa constant force on the superparamagnetic bead due to the small size of the bead compared tothe magnet. An atomic force microscope utilizes a sharp tip mounted at the end of a flexiblecantilever as a scanning probe or force transducer (acting as a linear spring) and can be operatedin either an imaging or force mode. TPM (Fig. 2a) can be viewed as related since the restrictedBrownian motion of a biopolymer tethered bead is tracked over time by CCD-based videomicroscopy and used to calculate spring constants and other mechanical properties of thetethering biopolymer60 or to monitor changes in its length upon mechanical extension in alaminar flow61,62.
Force generation—In OT, an applied force can be generated by either changing the intensityof the laser (the trapped bead experiences a force proportional to the gradient of the laserintensity used to trap it) or displacing the trapped bead away from the equilibrium position(following Hooke’s spring law). A permanent-magnet MT acts like a constant force clamp. Bycontrast, an electromagnet MT can vary the applied force by changing the current through theelectromagnet. A force-mode AFM uses a flexible cantilever as a linear spring while pullingback from the surface to exert forces on a single molecule that is bound to the imaged surfaceand becomes physi– or chemisorbed to the tip (Fig. 2d). Finally, in TPM it is possible to applydefined forces to the tethered biopolymer by introducing laminar flow63.
Single molecule manipulation—A typical OT experiment suspends a single biopolymerbetween two beads or a bead and a flat surface (the latter typically controlled by a motorizedstage) and measures a force extension curve as the biopolymer ends are pulled apart or,conversely, the biopolymer length changes during a biological process and the bead is displacedfrom the trap center. In addition to a linear force, magnetic tweezers can apply controlledtorsional twist (torque) on a single molecule by simply rotating the magnetic field. OT havealso been demonstrated to have the ability to apply torque to the sample using non-sphericaltrapped microparticles and linearly polarized trapping beams64,65, although theimplementation is not as straightforward as in MT. In AFM, the bending of the flexiblecantilever is readily amplified and detected by deflection of a laser beam onto a quadrantphotodiode to generate a force-extension curve.
The sample—In force spectroscopy, the biomolecule of interest usually needs to be tetheredto a bead or other surface through specific binding or a covalent linkage. Therefore, the surfaceimmobilization strategies used in optical microscopy are equally applicable in forcespectroscopy. Surface attachment is simplified by the commercial availability of functionalizedpolystyrene beads, superparamagnetic beads, and AFM tips12,17,18. To sufficiently separateits two attachment sites, the target molecule oftentimes have to be extended with stiff handles(such as double-stranded DNA). While nonspecific adsorption to the tip is to be avoided inAFM imaging to ensure minimal disturbance of the sample, it is often desirable and sufficientin AFM force mode as long as the adsorption is strong enough to withstand the applied force.The yield of single biopolymers properly suspended between the two surfaces for forcemeasurements may have to be further increased by careful sorting of the obtained force-
Walter et al. Page 7
Nat Methods. Author manuscript; available in PMC 2009 June 1.
NIH
-PA Author Manuscript
NIH
-PA Author Manuscript
NIH
-PA Author Manuscript

extension curves and/or biochemical protocols that minimize incomplete assembly ornonspecific binding.
Implementation and general considerationsAFM imaging—The bending of the flexible cantilever in the AFM imaging mode generatesa surface contour map representing the morphology of the molecules. The surface density ofsingle molecules, as well as their surface contour map and changes thereof over time are directlyavailable from such AFM images66. Consequently, conformational changes due to ligandbinding or complex formation can be detected67. Due to their often random surface binding,the shape of identical molecules in AFM images may vary notably from one another as wellas from their solution structure so that proper controls and a shape classification scheme maybe necessary. If desired, additional SM properties can be measured or manipulated using relatedtechniques such as scanning electrochemical microscopy68 and scanning tunnelingmicroscopy69.
Force measurement—OT are arguably the most sensitive SM tool for linear force andmotion measurements. They can exert forces ranging from 0.1 to 300 pN with high timeresolution (down to 100 μs). Dual-trap dumbbell OT have the lowest mechanical noise thatcan be further reduced by passing the trapping laser beam through a gas of low refraction indexsuch as helium. Ångstrom-level displacements can thus be measured in real-time over longtimescales from min to h and at time resolutions as high as ms12,70. MT are most suitable formeasuring slow molecular processes that require both force and torque12,71. MT do not sufferfrom the sample heating and photodamage observed with OT, however, they have limitedspatial resolution (down to only 10 nm compared to 0.1 nm with OT) and are unable to providefull three-dimensional manipulation. The applied linear forces can range from 0.05–20 pN,with a torque of up to ~1,000 pN/nm, depending on the properties and dimensions of theparamagnetic bead attached to the biopolymer12. The measurement of rotations and torquegeneration in biology with MT can be impeded by the rather large torque exerted by thismethod. AFM in the force spectroscopy mode can affect large forces, in the range of 10–10,000pN, combined with large biopolymer extensions of 1–10,000 nm12. This wide range of forcesmakes AFM suitable for probing ligand-receptor interactions as well as covalent bondstrengths72. However, the high stiffness of the cantilever (10–105 pN.nm−1) results in a lowerbound on the applied force and a force resolution limit of ~10 pN.
CHOOSING THE RIGHT TOOLHow does one choose a suitable technique from the bulging SM toolbox? Given the substantialeffort that goes into developing an assay to answer the biological question(s) at hand, carefulconsideration needs to be given to the possible choices and their individual scope andlimitations. Figure 4 shows a flow chart to aid in making an initial choice. Further refinementrequires a consideration of scope and limitations in the context of the desired observable(s) aswell as examples of successful applications.
Target observable: Molecule count (concentration)Scope and limitations—SM assays can detect minute sample amounts and typically workat low (nM and below) target concentrations, a feature that becomes critical when it ischallenging or impractical to produce the larger quantities needed for ensemble experiments.The ability to precisely count the number of molecules present is one of the most immediatebenefits of all SM tools except for those focusing on mechanical properties (Fig. 4).
The advantage of imaging and counting single molecules by AFM is the fact that it works label-free since imaging is based on the physical interaction of a scanning stethoscopic tip with the
Walter et al. Page 8
Nat Methods. Author manuscript; available in PMC 2009 June 1.
NIH
-PA Author Manuscript
NIH
-PA Author Manuscript
NIH
-PA Author Manuscript
sample. However, the target molecules need to be bound to a flat mica or glass surface, and itmay be necessary to increase their molecular weight by attachment to a larger feature or handle,if they are otherwise too small (< ~14 kDa) to be visualized (Fig. 4)73. In addition to the surfacedensity of molecules, basic information on their shape at nm resolution is readily obtained fromthe AFM image66.
If at least one suitable intrinsic or extrinsic fluorophore is available (Fig. 4), SM fluorescencetools allow one to detect the number of target molecules both in vitro and in living cells. Recentreviews have dealt with strategies for extrinsic fluorescent probe attachment74,75. Once thatis accomplished, the most straightforward approach to detecting a target molecule is to let itdiffuse through a confocal laser excitation volume and detect the resulting photon burst. Theconcentration of the target and its diffusion coefficient and thus size can be measured, providedthe focal volume is calibrated, by single burst, photon counting histogram (PCH) orautocorrelation analysis in FCS16,44,76,77. Surface constrained fluorophore-labeledmolecules – where constraints may be imposed through direct surface attachment orcontainment within a living cell (membrane) – can be counted in images obtained by LCM,epi-fluorescence, HILO, TIRFM, and NSOM (Fig. 4). Epi-fluorescence and HILO microscopyilluminate target molecules throughout an imaged cell, while TIRFM can only image close tothe cell surface. Epi-fluoresence microscopy can lead to limited detection sensitivity due tobackground signal from out-of-focus planes. In TIRFM, this limitation is overcome by onlyilluminating molecules within the evanescent field. In all cases where fluorophores are usedcare has to be taken not to underestimate the number of molecules present due tophotobleaching or transitioning into temporary dark states (blinking), or to overestimate themdue to the presence of unbound probe. Using statistical models to account for such artifacts,components in aggregates or subunits in complexes can be counted as the number ofphotobleaching steps to zero signal78,79. Overcoming such limitations, a recently describedlabel-free optical detection scheme for single molecules in vitro uses a sophisticated surface-functionalized whispering-gallery silica microcavity to capture a target molecules, resulting ina resonant wavelength shift80. Microfluidic sample handling and particle trapping methodshave the potential to count small numbers of molecules in large volumes81. While futuredevelopments are likely to provide more label-free tools for the detection of single molecules,fluorescence offers additional observables that are outlined in the following and are less likelyto be replaced anytime soon.
Target observable: Dynamic intramolecular distancesScope and limitations in biopolymer folding and conformational dynamics—Thedetermination of intramolecular distances using FRET between a donor-acceptor fluorophorepair has found widespread applications in structural biology to characterize themultidimensional conformational landscape and dynamics of biopolymers12,13,16,82. As athrough-space interaction between two dipoles (the transition dipole moments of the twofluorophores), the efficiency of energy transfer falls off with a 1/(1+(R/R0)6) dependence onthe inter-dye distance R. The characteristic Förster distance R0 ranges between 30–80 Å formost fluorophore pairs, making FRET a suitable biomolecular ruler at the low-nanometerscale23. As further discussed in the accompanying review by Roy and Ha19, the SM versionof FRET is able to quantitatively dissect the temporal sequence of events in folding transitions,including the adoption of rare and transient intermediates that may exist under eitherequilibrium or non-equilibrium conditions, which is rarely possible in ensemble-averagingtechniques.
SM FRET measurements are performed on site-specifically doubly-labeled proteins or nucleicacids that either are freely diffusing or are immobilized on carefully passivated glass/quartzsurfaces (Fig. 4). Absolute distances are difficult to calibrate83, so that typically relative
Walter et al. Page 9
Nat Methods. Author manuscript; available in PMC 2009 June 1.
NIH
-PA Author Manuscript
NIH
-PA Author Manuscript
NIH
-PA Author Manuscript
distance changes or differences are measured with a resolution of down to a fewÅngstrom19. Importantly, opposite changes in donor and/or acceptor signal resolvebiopolymer dynamics to an extent that is influenced by the finite averaging window of the timegated observation84. A fast detector such as an APD in the single-point measurements of LCMor FCS is therefore optimal for observing conformational changes at the sub-ms and possiblyns timescale, whereas a slower area detector such as a CCD camera can observe more moleculesin parallel and rapidly build reliable single molecule statistics at ms time resolution. Processesslower than the detector resolution give rise to separate FRET histogram distributions, whilefaster processes lead to FRET signal averaging into a single distribution.
Fluorescence microscopy using single-pair FRET on surface-constrained or □trapped targetmolecules allows for the observation of structural dynamics over long periods of time. Timelapse experiments with intermittent excitation can preserve fluorophores in principle over manyhours before they photobleach. Control experiments need to be performed to ensure that thedoubly-labeling and immobilization of the target molecule has negligible effect on itsbiological properties. While FRET is sensitive over a distance range of ~2–8 nm, photoinducedelectron transfer (PET) reactions between an excited fluorophore and a redox-matched electrondonor or acceptor can probe distances on the scale of a few Ångstrom. This was demonstratedin the reversible electron transfer between flavin and a tyrosine residue in the catalytic core ofa single flavin enzyme molecule, where a 1 Å distance change manifests in a several-foldchange in flavin fluorescence lifetime and intensity85. A number of non-electron or □energytransfer techniques have started to address slightly longer length scales (10–100 nm) that arenot yet the domain of electron microscopy, among them the optical superresolution techniquesdescribed in Box 1, as well as the plasmon coupling of pairs of gold nanoparticles86. Besidesdetecting internal motions, SM FRET is also sensitive to changes in the rotational conformationas demonstrated by experiments on the ATP-dependent dynamics of F1-ATPase87.
Scope and limitations in enzymology—An enzyme’s turnover rate often depends onconformational fluctuations. Conversely, conformational changes often accompany andfacilitate enzymatic turnover. In these cases, SM tools allow one to quantitatively dissect anenzymatic mechanism by monitoring the dwell times of diverse conformational states asdefined by their FRET levels and/or dwell time constants13,88.
SM enzymology where the enzyme is surface immobilized and the substrate is diffusing, orvice versa, may be carried out using either LCM, epi-fluorescence or TIRFM microscopy. Thetemporal resolution of LCM is bound in the lower limit by the time needed to detect a singlephoton and in the higher limit by the diffusion time of the sample molecule in the detectionregion, which can be expanded by (partial) sample immobilization. Epi-fluorescence or TIRFMcan provide higher throughput from observing a large number of molecules simultaneously.
Among successful examples for SM enzymology are the experiments carried out on the smallhairpin ribozyme, one of the simplest catalytic RNAs, to determine the multistep enzymaticreaction pathway13. SM probing in combination with mechanistic modeling89, directmeasurement of the dwell times associated with catalytic events90, and kinetic fingerprintingby FRET91 were all used to uncover the constituent elementary steps in the catalytic reaction.The challenges associated with these approaches naturally increase with the complexity of theenzymatic mechanism13.
Doubly-labeling proteins site-specifically for SM FRET is often difficult due to the limitednumber of labeling chemistries; complementary genetically encoded fluorophores ofsatisfactory photophysical properties for SM detection are only slowly emerging74,75. Theproblem is simplified for nucleic acid binding motor proteins if the nucleic acid can be labeled,as has led, for example, to the dissection of the mechanism of an RNA polymerase and a DNA
Walter et al. Page 10
Nat Methods. Author manuscript; available in PMC 2009 June 1.
NIH
-PA Author Manuscript
NIH
-PA Author Manuscript
NIH
-PA Author Manuscript
helicase by confocal92 and TIR fluorescence microscopy93, respectively. Most naturallyoccurring intrinsic fluorophores do not have sufficient quantum efficiency and/orphotostability for current SM detection tools. An exception is the enzyme cofactor flavinadenine dinucleotide (FAD) that has allowed Xie and coworkers to observe the conformationaldynamics of single cholesterol oxidase molecules by monitoring the emission from theenzyme’s fluorescent active site FAD94. In a separate approach, a fluorogenic or fluorescentsubstrate may be employed such that enzymatic action changes or localizes the fluorescenceto a detectable extent29,95–97. If multiple turnover is involved in the latter approach,successive products may have to be photobleached96 or otherwise kept from saturating thedetector29. SM enzymology without the need for fluorophores but instead using forcespectroscopy can be pursued if the substrate is a biopolymer such as a long DNA moleculewhose length or helical twist is affected by the enzymatic reaction12,98.
Scope and limitations from heterogeneity—Since their inception94,99,100, SM toolshave often revealed heterogeneous behavior within a population of molecules, termed dynamicor static disorder (or memory), depending on the exchange rate between behaviors. A singleenzyme molecule, for example, often exhibits large fluctuations of its folding and/or turnoverrate constant at a broad range of time scales (from ms to many hours88,96,101). Suchheterogeneity, which may or may not have biological relevance, is best delineated using SMtechniques, but makes the acquisition and sorting of large data sets a necessity to ensurestatistical significance of the conclusions. One approach to increase the data richness of an SMFRET experiment is to use three-color alternating-laser excitation, which allows for thesimultaneous determination of three intramolecular distances102.
Target Observable: Intermolecular distanceScope and limitations—Self-assembly of macromolecular complexes is a process offundamental importance in biology as well as much of modern nanotechnology. Most SM toolsthat are suitable to measure intramolecular distances can also be applied to obtainintermolecular distances within complexes, and again offer the advantage over ensembletechniques to quantitatively resolve the temporal sequence of even rare and/or short-livedevents.
Successful applications of SM tools to complex assemblies include studies of the signalingpathway involving the calcium-binding protein calmodulin (CaM) by SM FRET andfluorescence polarization using confocal microscopy103. Moreover, the assembly offluorophore labeled tRNAs on immobilized ribosomes has been studied using FRET-basedTIRFM to dissect the ribosomal translation cycle95. In these cases, doubly-labeling for FRETis facilitated since the interaction partners only need to be site-specifically labeled with onefluorophore each. Directed self-assembly, such as the hybridization of a complementary strandto an RNA molecule, can also be exploited for the site-specific attachment of fluorophores incases where the assembly itself is not of interest104,105. A careful choice of the labeling patternusually depends on the system of interest. For example, attaching the donor to a DNA-bindingprotein in solution and the acceptor to its surface immobilized DNA partner facilitates TIRFMdetection of their interaction as a transition from negligible fluorescence signal to high FRET.
A “holy grail” in biology is the quantification of molecular interactions in living cells, ideallyat the single molecule level, a challenge that only recently has started to be met. Dual-colorFCCS detects two spectrally distinguishable, (ideally) non-interacting fluorophores withinliving cells in separate channels and cross-correlates their signals in real-time. FCCS thereforehas been utilized to detect, for example, intracellular protein-protein and DNA-proteininteractions without the need to measure actual distances44,106. TIRFM107 and spinning-discconfocal imaging43 have been employed to detect the association of membrane bound proteins
Walter et al. Page 11
Nat Methods. Author manuscript; available in PMC 2009 June 1.
NIH
-PA Author Manuscript
NIH
-PA Author Manuscript
NIH
-PA Author Manuscript
in live and fixed cells, respectively, by SM FRET. However, fluorophore labeling and rapidcellular diffusion are still the limiting factors for SM studies of interaction partners in livingcells43. A recent approach has taken advantage of the slowed diffusion of a fluorescent-proteinlabeled transcription factor when bound to its (large) DNA target, as wide-field imaging witha long CCD integration time leads to localization enhancement of bound and severe blurringof unbound transcription factor108. Conversely, stroboscopic imaging can be used to virtuallysuppress diffusion of intracellular single molecules109. Recently, ultrahigh-resolution imagingtechniques have provided independent access to the relative positioning, and thus informationon the association, of interacting biopolymers.
Target observable: Ultrahigh-resolution molecule localizationScope and limitation in biological imaging—An ultimate goal of the biosciences isarguably to detect the dynamic positioning (and functional state) of each single molecule in abiological specimen15. SM imaging techniques such as FIONA are now capable of trackingbiopolymers labeled with single organic dye fluorophores in vitro at low-nanometer precisionand 1–500 ms time resolution14,38. In living cells the resolution may be slightly lower, butSM imaging holds the promise to reveal biological processes in situ and in real-time to reacha true systems-level understanding.
SM imaging resolution improves with the photon count, which can be enhanced by using longerdetector integration times or brighter emitters such as quantum dots or nanoparticle scatterers.Quantum dots, for example, can be tracked in the sub-ms time range, even in vivo, but are oftenplagued by low labeling efficiency, large size and non-uniform shape, non-uniform excitationand emission characteristics, and blinking38,39. Using two-color FIONA, or SHREC, a betterthan 10-nm distance between static fluorophores can be determined, and the tens tens-of-nanometer steps of mobile motor proteins followed in real-time38,39. SHREC uses the samesetup as SM FRET and hence can be applied in conjunction. Using SHRImP or NALMSanalysis of sequential photobleaching events on static samples (Table 1), 10-nm distancesbetween multiple identical fluorophores attached to a single target molecule (or complex) canbe measured38,39. SHRIMP/NALMS allows for the localization of overlapping PSFs withsimilar spectral emission (i.e., from identical fluorophores), but becomes more difficult andnoisy with increasing photobleaching steps. Since the analysis starts from the lastphotobleaching event, complete bleaching is necessary for the analysis, limiting the analysisto non-moving targets. Excitation intensities for any of these methods can be as low as a fewmW/cm2, reducing photodamage in living cell samples. An application of these high-resolutionimaging tools to nanotechnology has also been suggested110.
Stochastic imaging techniques are rapidly evolving. STORM gives very high resolution images(20–30 nm in the lateral and 50–60 nm in the axial dimension111) due to the ability to collecta large number of photons from each molecule, but is currently limited to fixed samples sincea reducing agent is required. By comparison, PALM and F-PALM are well suited to livingsamples because they use fluorescent proteins, but current fixation methods may make themless suitable for fixed samples due to possible perturbation of fluorescent activity. ConventionalPALM permanently bleaches each molecule after imaging so each one is only counted once,whereas STORM, F-PALM, and PALMIRA (PALM with independently runningacquisition112) work by repeated activation and inactivation of probe subsets that may overlapwith one another. PALMIRA thereby achieves ~100-fold faster collection times compared toPALM, and in combination with its single excitation laser requirement for activation andreadout of the probes, results in lower background noise without the need for TIRF imagingand thin samples112. Two-color PALMIRA has successfully been used to image a intracellularmicrotubule network of whole fixed cells at image acquisition times of 40–60 seconds andposition precisions of 10–15 nm, showing that two-color imaging and protein colocalization
Walter et al. Page 12
Nat Methods. Author manuscript; available in PMC 2009 June 1.
NIH
-PA Author Manuscript
NIH
-PA Author Manuscript
NIH
-PA Author Manuscript
in cells is possible with precision on the macromolecular scale113. The stochastic imagingtechnique combining single particle tracking and PALM (sptPALM) has been utilized to imagemembrane proteins at 20 frames per second in living cells, mapping single molecule diffusionof up to thousands of molecules in the plasma membrane, and creating a spatially resolved mapof single molecule diffusion coefficients114.
An orthogonal approach to reaching ultrahigh resolution (often collectively referred tosuperresolution techniques) is to shape the PSF through the nonlinear effect that space-selectivesaturation has on emitter molecules surrounding the center of the excited region14,115. It isexpected that in the future the resulting “hardware” based ultrahigh-resolution techniques,generalized under the acronym RESOLFT (Table 1 and Box 1), will be applied to a greaterextent to single molecules. RESOLFT techniques such as STED (Table 1 and Box 1) can imagedynamical processes with ~20 nm resolution, even at two colors116,117. The combination ofSTED with 4Pi microscopy (Table 1 and Box 1) is expected to further improve resolution inthe axial dimension, and parallelization with multiple foci will allow larger areas to beexamined faster115. Suitable combinations of both “hardware“ and “software” basedtechniques may be envisioned to ultimately yield real-time measurements of the dynamiclocations and nanoscale distances of large ensembles of single molecules, with broadapplications in complex mixtures including living cells.
Target observable: (Un)folding of biopolymersScope and limitations—SM force manipulation and measurement techniques have beenrecognized as uniquely effective tools for characterizing the forces and motions thatbiopolymers can affect or withstand12,18. The reconstruction of folding free energy landscapesof biopolymers is one focus of SM force spectroscopy12,18. Inter- and intramolecularinteractions such as the unfolding of proteins and nucleic acids, the dissociation of molecularcomplexes, and even the breaking of single chemical bonds can be induced and characterizedthrough external mechanical force. The application of force along a specific (un)foldingdirection enforces a defined reaction pathway and can be related to the reversible work (freeenergy) done, even under partially irreversible conditions, by repeatedly performing bothfolding and unfolding reactions and applying the Crooks fluctuation theorem to the observedwork distributions118.
Available tools include OT, MT, AFM, and flow-extension TPM (Fig. 2 and Table 1), whichcan measure conformational changes on length scales both larger and smaller than FRET. Inaddition, they can be applied when labeling with fluorophores is challenging or not feasible.Force is transduced through a biopolymer-tethered dielectric or magnetic bead in the case ofOT, MT, and TPM, or through the AFM tip. Tight specific attachment of the biopolymer to itsforce transducer and suppression of non-specific binding are important requirements for forcespectroscopy.
AFM is often used to unfold proteins with tandem repeats, which can either be naturallyoccurring (as in the case of the muscle protein titin) or artificially introduced, leading to acharacteristic zig-zag pattern that effectively multiplexes the observation and facilitatesidentification of properly attached biopolymer chains119. In addition, by chemicalmodification of the AFM tip various specific and nonspecific biological interactions can bedirectly probed72.
Target observable: Mechanochemical force generationScope and limitations of OT and MT—The generation of force at the molecular level bycoupling movement with NTP hydrolysis is essential for a number of biological processes,including the transport of cellular cargo via molecular motors and the enzymatic action of
Walter et al. Page 13
Nat Methods. Author manuscript; available in PMC 2009 June 1.
NIH
-PA Author Manuscript
NIH
-PA Author Manuscript
NIH
-PA Author Manuscript
polymerases and helicases. The detailed characterization of kinesins120,121 andmyosins122 by OT based force spectroscopy to determine step size, stall force, and processivityhighlight the breadth of the unique information obtained.
Since long DNA can be readily attached to beads, force spectroscopy has also been extensivelyapplied to mechanochemical processes involving nucleic acid binding proteins. For example,OT assays have identified the bacteriophage Γ29 portal motor as one of the strongest biologicalmotors with a stall-force of nearly 60 pN during packaging of viral DNA into the capsid123.A particularly challenging biological question that OT probing has been able to address is thatof the mechanism by which enzymes such as RNA polymerase couple their chemical andmechanical cycles12,70. Furthermore, the incorporation of rotational control into OT or MThas begun to address the question of how biomolecular motors including F1F0 ATP synthase,topoisomerases, and polymerases generate torque17.
Scope and limitations of TPM—Prominent applications of TPM have arisen from thesingle molecule observation of motor enzymes that shorten or lengthen a tether over time61,62. In a variation of TPM, rotatory motions can be visualized through attachment of abead124 or actin filament87, although it is difficult to calibrate the drag forces exerted by thelatter. TPM is a rather passive technique in that it relies on the Brownian motion of amicroscopic bead at the end of an invisible single molecule tether. Artifacts from the presenceof multiple tethers can be minimized by using sufficiently small biopolymer:bead ratios andby sorting out beads with asymmetric radial position distributions. Additional challenges arisefrom spurious tethering and can only be avoided by careful controls and systematiccomparisons of samples60.
FUTURE TOOLSThe technical advances made by SM tools over the past two decades have been staggering.Consequently, whole new fields of biological inquiry have opened up, bringing to lifeFeynman’s vision from half a century ago1. One remaining limitation of SM tools is the factthat they typically access only a limited number of observables at a time, making anunderstanding of complex biological processes tedious since many assays have to bedeveloped. The future of SM microscopy will thus increasingly see applications that combinetools, for example, to measure and exert mechanical forces while monitoring in real-time thestructural response by SM fluorescence12,17 (Box 2). Such combinations will be synergisticsince optical tweezers, for example, do not reveal precisely where in a macromolecularcomplex a force is exerted, while single molecule fluorescence is a passive technique since itcannot favor and probe a specific reaction coordinate. Pioneering efforts in this direction arestill sparse125–128 and may need commercialization of instrumentation to reach mainstreambiology.
Another route to increased information content and experimental control in SM experimentscan be expected from further improvements of individual SM tools. For example, opticaltweezers can be multiplexed by controlling arrays of beads through splitting the trappingbeam129 or through computer-generating holograms with arbitrary three-dimensional lightpatterns130 (Box 2). Similarly, SM fluorescence imaging can be multiplexed by the use ofhigh-content screening approaches as currently employed at the ensemble level in drugdiscovery. Such approaches may eventually enable “single molecule systems biology”. Thefuture of the biosciences is thus illuminated by single molecule microscopy, a field that is readyfor more widespread utilization.
BOX 1. SUPERRESOLUTION IMAGING BY HARDWARE-BASED METHODS
Walter et al. Page 14
Nat Methods. Author manuscript; available in PMC 2009 June 1.
NIH
-PA Author Manuscript
NIH
-PA Author Manuscript
NIH
-PA Author Manuscript
Reversible saturable optical fluorescence transition (RESOLFT) techniques reduce the sizeof the PSF by the use of sophisticated excitation configurations14,115. Implementationsinclude stimulated emission depletion (STED)115,131 and saturated pattern excitationmicroscopy (SPEM)132. In STED microscopy a diffraction limited laser beam excites afocal sample volume and is followed (in pulsed STED) or accompanied (in continuous waveSTED) by a donut-shaped stimulated emission beam that depletes the excited states of allfluorophores but those in the very center of the originally excited region (see Figure). Onlymolecules in the center of the focal volume remain in the excited state so that they aredetected and imaged. Similarly to scanning LCM, the imaging beams are raster scannedacross the sample. The theoretical resolution limit of RESOLFT techniques is given by:
where λ is the wavelength, α the aperture angle of the lens, n the refractive index, Imax themaximum of the light intensity outside of the center position, and Isat the light intensity tosaturate the spectroscopic transition to be imaged115. This equation differs from Abbe’slaw by introducing Imax/Isat, which in principle can lead to infinite resolution, but at the costof very high excitation intensities that may damage living cells or other light sensitivesamples.
Saturated pattern excitation microscopy (SPEM)132,133 or saturated structuredillumination microscopy (SSIM)133 is a wide-field, non-scanning superresolutiontechnique that projects excitation patterns on a fluorescent sample, rendering otherwiseunresolvable high-resolution information visible in the form of low-resolution moiréfringes. SSIM builds up higher resolution by using many different patterns14. Imagesrequire computational construction from the raw data, with the practical resolving powerdetermined by the signal-to-noise ratio.
4Pi is a confocal fluorescence microscopy that increases the axial (z) resolution of LCM bya factor of ~3–7 through the use of two opposing lenses with high numerical aperture toilluminate a single focal spot; the two wavefronts of the opposing beams interfereconstructively at the focal point to narrow the focal maximum along the axial dimension.Interference of the spherical wavefronts above and below the focal plane creates side lobesin the image that are mathematically removed. I5M is a wide field, nonconfocal method thatimplements the same opposing lens aperture enhancement in the detection of fluorescence,but uses plane parallel standing waves for excitation. Even though 4Pi and I5M are alsohardware based methods that alter the PSF of the imaged fluorophore(s), they differ fromthe RESOLFT techniques, which utilize nonlinear effects from optical saturation of theemitters to shape the PSF. A combination of RESOLFT with 4Pi microscopy thus furtherincreases the axial resolution115.
Walter et al. Page 15
Nat Methods. Author manuscript; available in PMC 2009 June 1.
NIH
-PA Author Manuscript
NIH
-PA Author Manuscript
NIH
-PA Author Manuscript
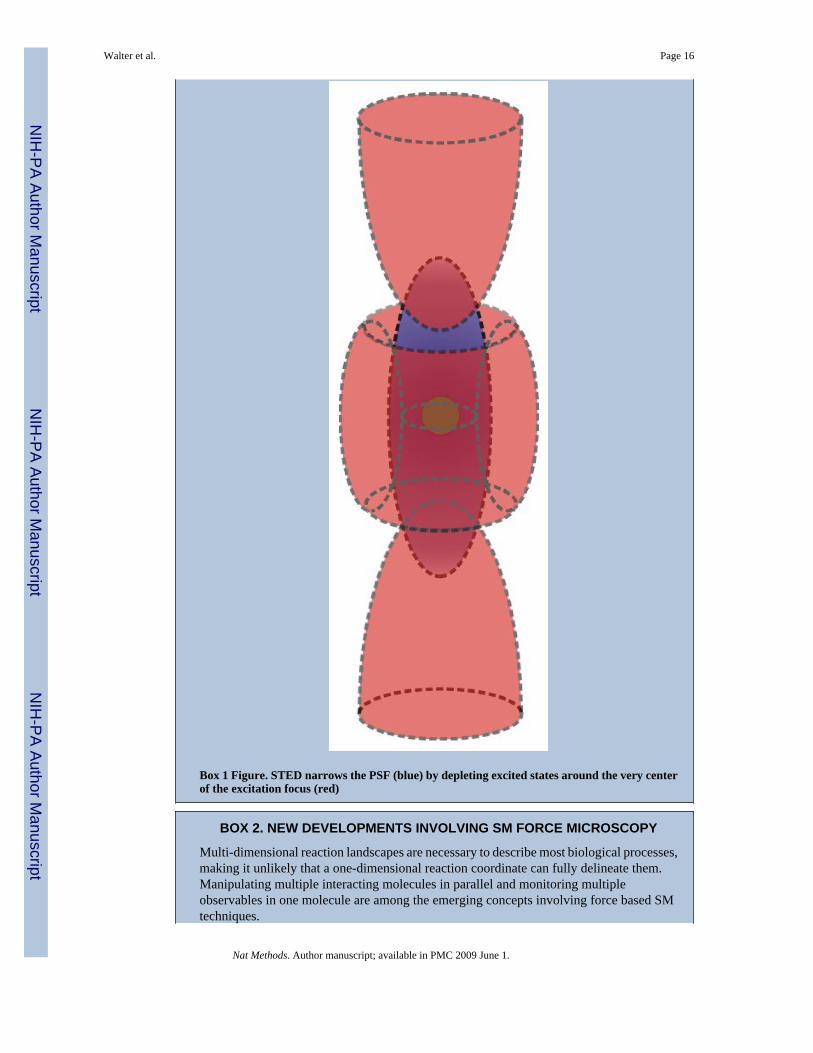
Box 1 Figure. STED narrows the PSF (blue) by depleting excited states around the very centerof the excitation focus (red)
BOX 2. NEW DEVELOPMENTS INVOLVING SM FORCE MICROSCOPY
Multi-dimensional reaction landscapes are necessary to describe most biological processes,making it unlikely that a one-dimensional reaction coordinate can fully delineate them.Manipulating multiple interacting molecules in parallel and monitoring multipleobservables in one molecule are among the emerging concepts involving force based SMtechniques.
Walter et al. Page 16
Nat Methods. Author manuscript; available in PMC 2009 June 1.
NIH
-PA Author Manuscript
NIH
-PA Author Manuscript
NIH
-PA Author Manuscript
A Quad-trap instrument can be generated by first splitting a laser beam into two orthogonallypolarized beams, one of which is used to form a continuous trap while the other beam istimeshared over three trap positions using acousto-optic deflectors. The continuous trap ismonitored by back-focal-plane interferometry whereas the other three are used tomanipulate trapped biopolymers such as two entangled DNA molecules129. Alternatively,holographic images can be used to generate up to 200 optical traps that can be positionedin three dimensions130.
Many molecular machines in cells not only generate linear but also rotatory force.Measuring torque using OT can be achieved by using magneto-optical tweezers134 or byintroducing a small “rotor” bead to the biomolecule17. An asymmetric shape or birefringentproperties of the trapped particle induces torque upon changing the angular momentum ofthe trapping light64. Hybrid methods can allow the simultaneous measurements of forceand torque or force and displacement along multiple axes17.
Combinations of force with optical SM detection techniques have been realized in a numberof ways. One example is the merger of AFM with fluorescence SM microscopy. Forcombining AFM imaging with confocal microscopy, an infrared light source (850 nm) canbe used to detect the position of the cantilever, which minimizes interference with opticaldetection. A tip assisted optics system with two scanners facilitates the positioning of thetip within the optical focus135. With an AFM-TIRFM combination, it is possible tomechanically manipulate a single molecule while monitoring its fluorescence136.
Hybrids of OT with SM fluorescence microscopy have recently started to emerge. Theintense near-infrared trapping beam of OT poses as challenges that the much weakerfluorescence emission is overpowered and multiphoton photodamage occurs. To mitigatethe problem, three basic solutions have been demonstrated. First, the simultaneousmonitoring of mechanical and ligand-binding events in a single myosin molecule has beenachieved by physically separating the locations of two trap beams and the TIRFM-generatedevanescent field125. Second, the unzipping of single 15-base-pair DNA molecules has beeninduced using OT and simultaneously been observed using TIRFM by careful selection offluorophores and optical filters126. Perhaps the most elegant approach is to interlace in timethe OT and TIRFM laser beams to prevent the simultaneous exposure of fluorophores toboth lasers127.
AcknowledgementsThis work was supported in part by US National Institutes of Health grants GM062357, GM081025, GM037006, andNSF Chemical Bonding Center award 0533019.
References1. Feynman, RP. Miniaturization. Gilbert, HD., editor. Reinhold Publishing Corporation; New York:
1961. p. 282-296.Feynman’s now famous deliberations on the “plenty of room at the bottom” inspiredseveral generations of scientists to seek to fill this room with nanometer-scale materials and techniquesto study them.
2. Binning G, Rohrer H, Gerber C, Weibel E. Surface Studies by Scanning Tunneling Microscopy. PhysRev Lett 1982;49:57–61.
3. Binning G, Quate CF, Gerber C. Atomic Force Microscope. Phys Rev Lett 1986;56:930–933. [PubMed:10033323]The authors demonstrate the concept of atomic force microscopy by the combination of ascanning tunneling microscope and a stylus profilometer that is able to investigate surfaces of insulatorson an atomic scale.
4. Pohl DW, Denk W, Lanz M. Optical Stethoscopy - Image Recording with Resolution Lambda/20.Appl Phys Lett 1984;44:651–653.
Walter et al. Page 17
Nat Methods. Author manuscript; available in PMC 2009 June 1.
NIH
-PA Author Manuscript
NIH
-PA Author Manuscript
NIH
-PA Author Manuscript
5. Moerner WE, Kador L. Optical-Detection and Spectroscopy of Single Molecules in a Solid. Phys RevLett 1989;62:2535–2538. [PubMed: 10040013]The authors report the first optical absorption spectrumfrom a single molecule of pentacene in a p-terphenyl crystal at the temperature of liquid helium.
6. Orrit M, Bernard J. Single Pentacene Molecules Detected by Fluorescence Excitation in a Para-Terphenyl Crystal. Phys Rev Lett 1990;65:2716–2719. [PubMed: 10042674]The authors report thefirst fluorescence detection of single pentacene molecules in a p-terphenyl crystal at low temperature.
7. Moerner WE. A dozen years of single-molecule spectroscopy in physics, chemistry, and biophysics.J Phys Chem B 2002;106:910–927.
8. Orrit M. Single-molecule spectroscopy: The road ahead. J Chem Phys 2002;117:10938–10946.9. Shera EB, Seitzinger NK, Davis LM, Keller RA, Soper SA. Detection of Single Fluorescent Molecules.
Chem Phys Lett 1990;174:553–557.The authors demonstrate for the first time single moleculefluorescence detection in solution at room temperature.
10. Dickson RM, Norris DJ, Tzeng YL, Moerner WE. Three-dimensional imaging of single moleculessolvated in pores of poly(acrylamide) gels. Science 1996;274:966–969. [PubMed: 8875935]
11. Funatsu T, Harada Y, Tokunaga M, Saito K, Yanagida T. Imaging of Single Fluorescent Moleculesand Individual Atp Turnovers by Single Myosin Molecules in Aqueous-Solution. Nature1995;374:555–559. [PubMed: 7700383]The authors refine epi-fluorescence and total internalreflection microscopy to achieve video-rate imaging of single molecules in aqueous solution.
12. Greenleaf WJ, Woodside MT, Block SM. High-resolution, single-molecule measurements ofbiomolecular motion. Annu Rev Biophys Biomol Struct 2007;36:171–190. [PubMed: 17328679]
13. Ditzler MA, Aleman EA, Rueda D, Walter NG. Focus on function: single molecule RNA enzymology.Biopolymers 2007;87:302–316. [PubMed: 17685395]
14. Moerner WE. New directions in single-molecule imaging and analysis. Proc Natl Acad Sci USA2007;104:12596–12602. [PubMed: 17664434]
15. Walter NG, et al. Under the microscope: Single molecule symposium at the University of Michigan,2006. Biopolymers 2007;85:106–114. [PubMed: 17080420]
16. Selvin, PR.; Ha, T., editors. Single-Molecule Techniques - A Laboratory Manual. Cold Spring HarborLaboratory; Cold Spring Harbor, NY: 2008.
17. Moffit JR, Chemla YR, Smith SB, Bustamante C. Recent advances in optical tweezers. Annu RevBiochem. 2008in press
18. Neuman K. Force spectroscopy and single molecule manipulation techniques. Nat Methods. 2008ibid19. Roy R, Hohng S, Ha T. A Practical Guide to Single Molecule FRET. Nat Methods. 2008ibid20. Harris TD, et al. Single-molecule DNA sequencing of a viral genome. Science 2008;320:106–109.
[PubMed: 18388294]21. Michalet X, Weiss S. Single-molecule spectroscopy and microscopy. Compt Rend Phys 2002;3:619–
644.22. Moerner WE, Fromm DP. Methods of single-molecule fluorescence spectroscopy and microscopy.
Rev Sci Instr 2003;74:3597–3619.23. Lakowicz, JR. Principles of Fluorescence Spectroscopy. 3. Springer; New York: 2006.24. Yang W, Gelles J, Musser SM. Imaging of single-molecule translocation through nuclear pore
complexes. Proc Natl Acad Sci USA 2004;101:12887–12892. [PubMed: 15306682]25. Tokunaga M, Imamoto N, Sakata-Sogawa K. Highly inclined thin illumination enables clear single-
molecule imaging in cells. Nat Methods 2008;5:159–161. [PubMed: 18176568]26. Conchello JA, Lichtman JW. Optical sectioning microscopy. Nat Methods 2005;2:920–931.
[PubMed: 16299477]27. Kim HD, et al. Mg2+-dependent conformational change of RNA studied by fluorescence correlation
and FRET on immobilized single molecules. Proc Natl Acad Sci USA 2002;99:4284–4289.[PubMed: 11929999]
28. Axelrod D. Total internal reflection fluorescence microscopy in cell biology. Methods Enzymol2003;361:1–33. [PubMed: 12624904]
29. Levene MJ, et al. Zero-mode waveguides for single-molecule analysis at high concentrations. Science2003;299:682–686. [PubMed: 12560545]
Walter et al. Page 18
Nat Methods. Author manuscript; available in PMC 2009 June 1.
NIH
-PA Author Manuscript
NIH
-PA Author Manuscript
NIH
-PA Author Manuscript
30. Korlach J, et al. Selective aluminum passivation for targeted immobilization of single DNApolymerase molecules in zero-mode waveguide nanostructures. Proc Natl Acad Sci USA. 2008
31. Gorris HH, Blicharz TM, Walt DR. Optical-fiber bundles. FEBS J 2007;274:5462–5470. [PubMed:17937772]
32. Mannion JT, Craighead HG. Nanofluidic structures for single biomolecule fluorescent detection.Biopolymers 2007;85:131–143. [PubMed: 17103421]
33. Brewer LR, Bianco PR. Multi-channel, laminar flow cells for single molecule studies of DNA-proteininteractions. Nat Methods. 2008ibid
34. Eggeling C, Fries JR, Brand L, Gunther R, Seidel CA. Monitoring conformational dynamics of asingle molecule by selective fluorescence spectroscopy. Proc Natl Acad Sci USA 1998;95:1556–1561. [PubMed: 9465054]
35. Lee TH, et al. Measuring the folding transition time of single RNA molecules. Biophys J2007;92:3275–3283. [PubMed: 17307831]
36. Thompson RE, Larson DR, Webb WW. Precise nanometer localization analysis for individualfluorescent probes. Biophys J 2002;82:2775–2783. [PubMed: 11964263]
37. Yildiz A, et al. Myosin V walks hand-over-hand: Single fluorophore imaging with 1.5-nmlocalization. Science 2003;300:2061–2065. [PubMed: 12791999]The authors demonstrate that singlefluorophore tracking can be refined to nanometer resolution in dynamic biological samples.
38. Toprak E, Selvin PR. New fluorescent tools for watching nanometer-scale conformational changesof single molecules. Ann Rev Biophys Biomol Struct 2007;36:349–369. [PubMed: 17298239]
39. Park H, Toprak E, Selvin PR. Single-molecule fluorescence to study molecular motors. Quart RevBiophys 2007;40:87–111.
40. Walter NG. Structural dynamics of catalytic RNA highlighted by fluorescence resonance energytransfer. Methods 2001;25:19–30. [PubMed: 11558994]
41. Kapanidis AN, Weiss S. Fluorescent probes and bioconjugation chemistries for single-moleculefluorescence analysis of biomolecules. J Chem Phys 2002;117:10953–10964.
42. Rasnik I, Mckinney SA, Ha T. Surfaces and orientations: Much to FRET about? Acc Chem Res2005;38:542–548. [PubMed: 16028888]
43. Yin J, et al. Single-cell FRET imaging of transferrin receptor trafficking dynamics by Sfp-catalyzed,site-specific protein labeling. Chem Biol 2005;12:999–1006. [PubMed: 16183024]
44. Haustein E, Schwille P. Fluorescence correlation spectroscopy: novel variations of an establishedtechnique. Annu Rev Biophys Biomol Struct 2007;36:151–169. [PubMed: 17477838]
45. Van Orden A, Jung J. Fluorescence correlation spectroscopy for probing the kinetics and mechanismsof DNA hairpin formation. Biopolymers 2008;89:1–16. [PubMed: 17696144]
46. Michalet X, Weiss S. Using photon statistics to boost microscopy resolution. Proc Natl Acad Sci USA2006;103:4797–4798. [PubMed: 16549771]
47. Geerts H, et al. Nanovid Tracking - a New Automatic Method for the Study of Mobility in LivingCells Based on Colloidal Gold and Video Microscopy. Biophys J 1987;52:775–782. [PubMed:3427186]
48. Gelles J, Schnapp BJ, Sheetz MP. Tracking Kinesin-Driven Movements with Nanometre-ScalePrecision. Nature 1988;331:450–453. [PubMed: 3123999]The authors demonstrate the tracking ofnanometer-scale motion in dynamic biological systems by attaching microscopic beads.
49. Schafer DA, Gelles J, Sheetz MP, Landick R. Transcription by Single Molecules of RNA-PolymeraseObserved by Light-Microscopy. Nature 1991;352:444–448. [PubMed: 1861724]
50. Schmidt T, Schutz GJ, Baumgartner W, Gruber HJ, Schindler H. Imaging of single molecule diffusion.Proc Natl Acad Sci USA 1996;93:2926–2929. [PubMed: 8610144]
51. Ram S, Ward ES, Ober RJ. Beyond Rayleigh’s criterion: A resolution measure with application tosingle-molecule microscopy. Proc Natl Acad Sci USA 2006;103:4457–4462. [PubMed: 16537357]
52. Churchman LS, Okten Z, Rock RS, Dawson JF, Spudich JA. Single molecule high-resolutioncolocalization of Cy3 and Cy5 attached to macromolecules measures intramolecular distancesthrough time. Proc Natl Acad Sci USA 2005;102:1419–1423. [PubMed: 15668396]
53. Gordon MP, Ha T, Selvin PR. Single-molecule high-resolution imaging with photobleaching. ProcNatl Acad Sci USA 2004;101:6462–6465. [PubMed: 15096603]
Walter et al. Page 19
Nat Methods. Author manuscript; available in PMC 2009 June 1.
NIH
-PA Author Manuscript
NIH
-PA Author Manuscript
NIH
-PA Author Manuscript
54. Qu XH, Wu D, Mets L, Scherer NF. Nanometer-localized multiple single-molecule fluorescencemicroscopy. Proc Natl Acad Sci USA 2004;101:11298–11303. [PubMed: 15277661]
55. Rust MJ, Bates M, Zhuang XW. Sub-diffraction-limit imaging by stochastic optical reconstructionmicroscopy (STORM). Nat Methods 2006;3:793–795. [PubMed: 16896339]
56. Betzig E, et al. Imaging intracellular fluorescent proteins at nanometer resolution. Science2006;313:1642–1645. [PubMed: 16902090]The authors demonstrate that intracellular proteins canbe imaged at nanometer spatial resolution by stochastic photoswitching.
57. Hess ST, Girirajan TPK, Mason MD. Ultra-high resolution imaging by fluorescence photoactivationlocalization microscopy. Biophys J 2006;91:4258–4272. [PubMed: 16980368]
58. Sharonov A, Hochstrasser RM. Wide-field subdiffraction imaging by accumulated binding ofdiffusing probes. Proc Natl Acad Sci USA 2006;103:18911–18916. [PubMed: 17142314]
59. Ashkin A. Acceleration and Trapping of Particles by Radiation Pressure. Phys Rev Lett1970;24:156.The author implements optical tweezers as a non-invasive manipulation technique.
60. Lambert MN, et al. Mg2+-Induced Compaction of Single RNA Molecules Monitored by TetheredParticle Microscopy. Biophys J 2006;90:3672–3685. [PubMed: 16500956]
61. Schafer DA, Gelles J, Sheetz MP, Landick R. Transcription by single molecules of RNA polymeraseobserved by light microscopy. Nature 1991;352:444–448. [PubMed: 1861724]
62. Dohoney KM, Gelles J. Chi-sequence recognition and DNA translocation by single RecBCD helicase/nuclease molecules. Nature 2001;409:370–374. [PubMed: 11201749]
63. van Oijen AM, et al. Single-molecule kinetics of lambda exonuclease reveal base dependence anddynamic disorder. Science 2003;301:1235–1238. [PubMed: 12947199]
64. La Porta A, Wang MD. Optical Torque Wrench: Angular Trapping, Rotation, and Torque Detectionof Quartz Microparticles. Phys Rev Lett 2004;92:190801. [PubMed: 15169392]
65. Deufel C, Forth S, Simmons CR, Dejgosha S, Wang MD. Nanofabricated quartz cylinders for angulartrapping: DNA supercoiling torque detection. Nat Methods 2007;4:223–225. [PubMed: 17322891]
66. Yang Y, Wang H, Erie DA. Quantitative characterization of biomolecular assemblies and interactionsusing atomic force microscopy. Methods 2003;29:175–187. [PubMed: 12606223]
67. Weber PC, Ohlendorf DH, Wendoloski JJ, Salemme FR. Structural Origins of High-Affinity BiotinBinding to Streptavidin. Science 1989;243:85–88. [PubMed: 2911722]
68. Fan FR, Bard AJ. Electrochemical Detection of Single Molecules. Science 1995;267:871–874.[PubMed: 17813918]
69. Hla SW, Rieder KH. STM control of chemical reaction: single-molecule synthesis. Annu Rev PhysChem 2003;54:307–330. [PubMed: 12626735]
70. Abbondanzieri EA, Greenleaf WJ, Shaevitz JW, Landick R, Block SM. Direct observation of base-pair stepping by RNA polymerase. Nature 2005;438:460–465. [PubMed: 16284617]The authorsshow that Ångstrom resolution can be obtained using ultrasensitive optical tweezers to observe singlesteps of RNA polymerase along a double-strand DNA template.
71. Charvin G, Strick TR, Bensimon D, Croquette V. Tracking topoisomerase activity at the single-molecule level. Annu Rev Biophys Biomol Struct 2005;34:201–219. [PubMed: 15869388]
72. Kedrov A, Janovjak H, Sapra KT, Muller DJ. Deciphering Molecular Interactions of NativeMembrane Proteins by Single-Molecule Force Spectroscopy. Annu Rev Biophys Biomol Struct2007;36:233–260. [PubMed: 17311527]
73. Ke Y, Lindsay S, Chang Y, Liu Y, Yan H. Self-assembled water-soluble nucleic acid probe tiles forlabel-free RNA hybridization assays. Science 2008;319:180–183. [PubMed: 18187649]
74. Michalet X, et al. The power and prospects of fluorescence microscopies and spectroscopies. AnnuRev Biophys Biomol Struct 2003;32:161–182. [PubMed: 12598370]
75. Tinnefeld P, Sauer M. Branching out of single-molecule fluorescence spectroscopy: challenges forchemistry and influence on biology. Angew Chem Int Ed Engl 2005;44:2642–2671. [PubMed:15849689]
76. Thompson NL, Lieto AM, Allen NW. Recent advances in fluorescence correlation spectroscopy.Curr Opin Struct Biol 2002;12:634–641. [PubMed: 12464316]
77. Elson EL. Quick tour of fluorescence correlation spectroscopy from its inception. J Biomed Opt2004;9:857–864. [PubMed: 15447006]
Walter et al. Page 20
Nat Methods. Author manuscript; available in PMC 2009 June 1.
NIH
-PA Author Manuscript
NIH
-PA Author Manuscript
NIH
-PA Author Manuscript
78. Leake MC, et al. Stoichiometry and turnover in single, functioning membrane protein complexes.Nature 2006;443:355–358. [PubMed: 16971952]
79. Shu D, Zhang H, Jin J, Guo P. Counting of six pRNAs of phi29 DNA-packaging motor withcustomized single-molecule dual-view system. EMBO J 2007;26:527–537. [PubMed: 17245435]
80. Armani AM, Kulkarni RP, Fraser SE, Flagan RC, Vahala KJ. Label-free, single-molecule detectionwith optical microcavities. Science 2007;317:783–787. [PubMed: 17615303]
81. Huang B, et al. Counting low-copy number proteins in a single cell. Science 2007;315:81–84.[PubMed: 17204646]
82. Zhuang X. Single-molecule RNA science. Annu Rev Biophys Biomol Struct 2005;34:399–414.[PubMed: 15869396]
83. Cosa G, et al. Secondary structure and secondary structure dynamics of DNA hairpins complexedwith HIV-1 NC protein. Biophys J 2004;87:2759–2767. [PubMed: 15454467]
84. Wang D, Geva E. Protein structure and dynamics from single-molecule fluorescence resonance energytransfer. J Phys Chem B 2005;109:1626–1634. [PubMed: 16851134]
85. Yang H, et al. Protein conformational dynamics probed by single-molecule electron transfer. Science2003:262–266. [PubMed: 14551431]
86. Reinhard BM, Sheikholeslami S, Mastroianni A, Alivisatos AP, Liphardt J. Use of plasmon couplingto reveal the dynamics of DNA bending and cleavage by single EcoRV restriction enzymes. ProcNatl Acad Sci USA 2007;104:2667–2672. [PubMed: 17307879]
87. Noji H, Yasuda R, Yoshida M, Kinosita K. Direct observation of the rotation of F-1-ATPase. Nature1997;386:299–302. [PubMed: 9069291]
88. Zhuang XW, et al. Correlating structural dynamics and function in single ribozyme molecules. Science2002;296:1473–1476. [PubMed: 12029135]A detailed study of the hairpin ribozyme revealsprofound molecular heterogeneities in single biomolecules that is largely lost in the ensembleaverage.
89. Rueda D, et al. Single-molecule enzymology of RNA: essential functional groups impact catalysisfrom a distance. Proc Natl Acad Sci U S A 2004;101:10066–10071. [PubMed: 15218105]
90. Nahas MK, et al. Observation of internal cleavage and ligation reactions of a ribozyme. Nat StructMol Biol 2004;11:1107–1113. [PubMed: 15475966]
91. Liu S, Bokinsky G, Walter NG, Zhuang X. Dissecting the multistep reaction pathway of an RNAenzyme by single-molecule kinetic “fingerprinting”. Proc Natl Acad Sci USA 2007;104:12634–12639. [PubMed: 17496145]
92. Kapanidis AN, et al. Initial transcription by RNA polymerase proceeds through a DNA-scrunchingmechanism. Science 2006;314:1144–1147. [PubMed: 17110578]
93. Myong S, Rasnik I, Joo C, Lohman TM, Ha T. Repetitive shuttling of a motor protein on DNA. Nature2005;437:1321–1325. [PubMed: 16251956]
94. Lu HP, Xun L, Xie XS. Single molecule enzymatic dynamics. Science 1998;282:1877–1882.[PubMed: 9836635]
95. Blanchard SC, Gonzalez RL, Kim HD, Chu S, Puglisi J. D tRNA selection and kinetic proofreadingin translation. Nat Struct Mol Biol 2004;11:1008–1014. [PubMed: 15448679]
96. English BP, et al. Ever-fluctuating single enzyme molecules: Michaelis-Menten equation revisited.Chem Biol 2006;2:87–94.
97. Luo G, Wang M, Konigsberg WH, Xie XS. Single-molecule and ensemble fluorescence assays for afunctionally important conformational change in T7 DNA polymerase. Proc Natl Acad Sci USA2007;104:12610–12615. [PubMed: 17640918]
98. Bustamante C, Bryant Z, Smith S. B Ten years of tension: single-molecule DNA mechanics.2003;421:423–427.
99. Rotman B. Measurement of Activity of Single Molecules of Beta-D-Galactosidase. Proc Natl AcadSci USA 1961;47:1981–1991. [PubMed: 14038788]
100. Xue QF, Yeung ES. Differences in the Chemical-Reactivity of Individual Molecules of an Enzyme.Nature 1995;373:681–683. [PubMed: 7854448]
Walter et al. Page 21
Nat Methods. Author manuscript; available in PMC 2009 June 1.
NIH
-PA Author Manuscript
NIH
-PA Author Manuscript
NIH
-PA Author Manuscript
101. Laurence TA, Kong X, Jager M, Weiss S. Probing structural heterogeneities and fluctuations ofnucleic acids and denatured proteins. Proc Natl Acad Sci USA 2005;102:17348–17353. [PubMed:16287971]
102. Lee NK, Koh HR, Han KY, Kim SK. Folding of 8–17 deoxyribozyme studied by three-coloralternating-laser excitation of single molecules. J Am Chem Soc 2007;129:15526–15534. [PubMed:18027936]
103. Liu R, Hu D, Tan X, Lu HP. Revealing Two-State Protein-Protein Interactions of Calmodulin bySingle-Molecule Spectroscopy. J Am Chem Soc 2006;128:10034–10042. [PubMed: 16881631]
104. Zhuang X, et al. A single-molecule study of RNA catalysis and folding. Science 2000;288:2048–2051. [PubMed: 10856219]
105. Dorywalska M, et al. Site-specific labeling of the ribosome for single-molecule spectroscopy.Nucleic Acids Res 2005;33:182–189. [PubMed: 15647501]
106. Bacia K, Kim SA, Schwille P. Fluorescence cross-correlation spectroscopy in living cells. NatMethods 2006;3:83–89. [PubMed: 16432516]
107. Murakoshi H, et al. Single-molecule imaging analysis of Ras activation in living cells. Proc NatlAcad Sci USA 2004;101:7317–7322. [PubMed: 15123831]
108. Elf J, Li GW, Xie XS. Probing transcription factor dynamics at the single-molecule level in a livingcell. Science 2007;316:1191–1194. [PubMed: 17525339]
109. Xie XS, Yu J, Yang WY. Living cells as test tubes. Science 2006;312:228–230. [PubMed: 16614211]110. Rueda D, Walter NG. Single molecule fluorescence control for nanotechnology. J Nanosci
Nanotechnol 2005;5:1990–2000. [PubMed: 16430133]111. Huang B, Wang W, Bates M, Zhuang X. Three-dimensional super-resolution imaging by stochastic
optical reconstruction microscopy. Science 2008;319:810–813. [PubMed: 18174397]112. Geisler C, et al. Resolution of lambda/10 in fluorescence microscopy using fast single molecule
photo-switching. Appl Phys A 2007;88:223–226.113. Bock H, et al. Two-color far-field fluorescence nanoscopy based on photoswitchable emitters. Appl
Phys B 2007;88:161–165.114. Manley S, et al. High-density mapping of single-molecule trajectories with photoactivated
localization microscopy. Nat Methods 2008;5:155–157. [PubMed: 18193054]115. Hell SW. Far-field optical nanoscopy. Science 2007;316:1153–1158. [PubMed: 17525330]116. Donnert G, et al. Two-color far-field fluorescence nanoscopy. Biophys J 2007;92:L67–69. [PubMed:
17307826]117. Willig KI, Harke B, Medda R, Hell SW. STED microscopy with continuous wave beams. Nat
Methods 2007;4:915–918. [PubMed: 17952088]118. Collin D, et al. Verification of the Crooks fluctuation theorem and recovery of RNA folding free
energies. Nature 2005;437:231–234. [PubMed: 16148928]119. Carrion-Vazquez M, Li H, Lu H, Marszalek PE, Oberhauser AF, Fernandez JM. The mechanical
stability of ubiquitin is linkage dependent. Nat Struct Biol 2003;10:674–676. [PubMed: 12942137]120. Block SM, Goldstein LS, Schnapp BJ. Bead movement by single kinesin molecules studied with
optical tweezers. Nature 1990;348:348–352. [PubMed: 2174512]121. Kuo SC, Sheetz MP. Force of single kinesin molecules measured with optical tweezers. Science
1993;260:232–234. [PubMed: 8469975]122. Nishizaka T, Miyata H, Yoshikawa H, Ishiwata S, Kinosita K Jr. Unbinding force of a single motor
molecule of muscle measured using optical tweezers. Nature 1995;377:251–254. [PubMed:7675112]
123. Smith DE, et al. The bacteriophage straight phi29 portal motor can package DNA against a largeinternal force. Nature 2001;413:748–752. [PubMed: 11607035]
124. Sowa Y, Rowe AD, Leake MC, Yakushi T, Homma M, et al. Direct observation of steps in rotationof the bacterial flagellar motor. Nature 2005;437:916–919. [PubMed: 16208378]
125. Ishijima A, et al. Simultaneous observation of individual ATPase and mechanical events by a singlemyosin molecule during interaction with actin. Cell 1998;92:161–171. [PubMed: 9458041]Theauthors demonstrate that a combination of single molecule fluorescence microscopy with opticaltweezers is possible.
Walter et al. Page 22
Nat Methods. Author manuscript; available in PMC 2009 June 1.
NIH
-PA Author Manuscript
NIH
-PA Author Manuscript
NIH
-PA Author Manuscript

126. Lang MJ, Fordyce PM, Engh AM, Neuman KC, Block SM. Simultaneous, coincident opticaltrapping and single-molecule fluorescence. Nat Methods 2004;1:133–139. [PubMed: 15782176]
127. Brau RR, Tarsa PB, Ferrer JM, Lee P, Lang MJ. Interlaced optical force-fluorescence measurementsfor single molecule biophysics. Biophys J 2006;91:1069–1077. [PubMed: 16648165]
128. Hohng S, Zhou R, Nahas MK, Yu J, Schulten K, Lilley DMJ, Ha T. Fluorescence-force spectroscopymaps two-dimensional reaction landscape of the Holliday junction. Science 2007;318:279–283.[PubMed: 17932299]
129. Noom MC, van den Broek B, van Mameren J, Wuite GJ. Visualizing single DNA-bound proteinsusing DNA as a scanning probe. Nat Methods 2007;4:1031–1036. [PubMed: 17994031]
130. Grier DG, Roichman Y. Holographic optical trapping. Appl Opt 2006;45:880–887. [PubMed:16512529]
131. Hell SW, Wichmann J. Breaking the Diffraction Resolution Limit by Stimulated-Emission -Stimulated-Emission-Depletion Fluorescence Microscopy. Optics Lett 1994;19:780–782.Theauthors present the concept of stimulated emission depletion (STED) fluorescence microscopy tobreak Abbe’s diffraction limit.
132. Heintzmann R, Jovin TM, Cremer C. Saturated patterned excitation microscopy - a concept foroptical resolution improvement. J Opt Soc Amer 2002;19:1599–1609.
133. Gustafsson MGL. Nonlinear structured-illumination microscopy: Wide-field fluorescence imagingwith theoretically unlimited resolution. Proc Natl Acad Sci USA 2005;102:13081–13086. [PubMed:16141335]
134. Crut A, Koster DA, Seidel R, Wiggins CH, Dekker NH. Fast dynamics of supercoiled DNA revealedby single-molecule experiments. Proc Natl Acad Sci USA 2007;104:11957–11962. [PubMed:17623785]
135. Owen RJ, Heyes CD, Knebel D, Rocker C, Nienhaus GU. An integrated instrumental setup for thecombination of atomic force microscopy with optical spectroscopy. Biopolymers 2006;82:410–414.[PubMed: 16302196]
136. Hugel T, et al. Single-molecule optomechanical cycle. Science 2002;296:1103–1106. [PubMed:12004125]
137. Kask P, Palo K, Ullmann D, Gall K. Fluorescence-intensity distribution analysis and its applicationin biomolecular detection technology. Proc Natl Acad Sci USA 1999;96:13756–13761. [PubMed:10570145]
138. Cox IJ, Sheppard CJR, Wilson T. Super-Resolution by Confocal Fluorescent Microscopy. Optik1982;60:391–396.
139. Edidin M. Near-field scanning optical microscopy, a siren call to biology. Traffic 2001;2:797–803.[PubMed: 11733046]
140. Chen Y, Muller JD, So PTC, Gratton E. The photon counting histogram in fluorescence fluctuationspectroscopy. Biophys J 1999;77:553–567. [PubMed: 10388780]
Walter et al. Page 23
Nat Methods. Author manuscript; available in PMC 2009 June 1.
NIH
-PA Author Manuscript
NIH
-PA Author Manuscript
NIH
-PA Author Manuscript
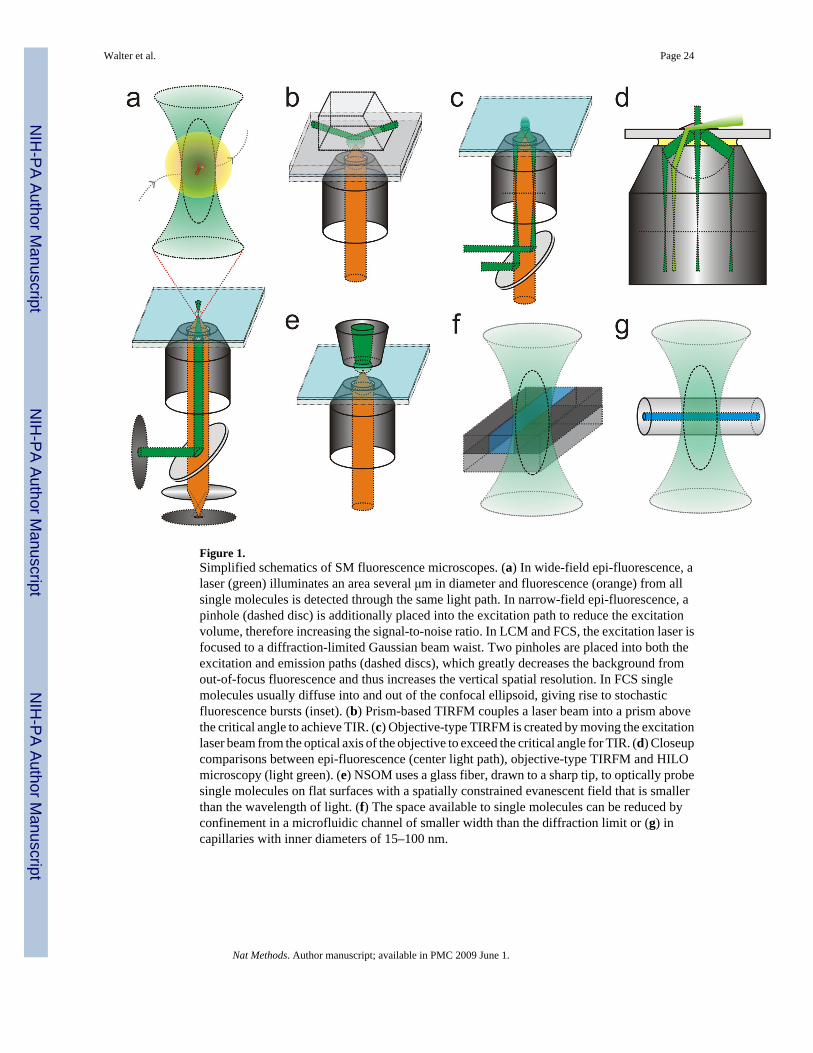
Figure 1.Simplified schematics of SM fluorescence microscopes. (a) In wide-field epi-fluorescence, alaser (green) illuminates an area several μm in diameter and fluorescence (orange) from allsingle molecules is detected through the same light path. In narrow-field epi-fluorescence, apinhole (dashed disc) is additionally placed into the excitation path to reduce the excitationvolume, therefore increasing the signal-to-noise ratio. In LCM and FCS, the excitation laser isfocused to a diffraction-limited Gaussian beam waist. Two pinholes are placed into both theexcitation and emission paths (dashed discs), which greatly decreases the background fromout-of-focus fluorescence and thus increases the vertical spatial resolution. In FCS singlemolecules usually diffuse into and out of the confocal ellipsoid, giving rise to stochasticfluorescence bursts (inset). (b) Prism-based TIRFM couples a laser beam into a prism abovethe critical angle to achieve TIR. (c) Objective-type TIRFM is created by moving the excitationlaser beam from the optical axis of the objective to exceed the critical angle for TIR. (d) Closeupcomparisons between epi-fluorescence (center light path), objective-type TIRFM and HILOmicroscopy (light green). (e) NSOM uses a glass fiber, drawn to a sharp tip, to optically probesingle molecules on flat surfaces with a spatially constrained evanescent field that is smallerthan the wavelength of light. (f) The space available to single molecules can be reduced byconfinement in a microfluidic channel of smaller width than the diffraction limit or (g) incapillaries with inner diameters of 15–100 nm.
Walter et al. Page 24
Nat Methods. Author manuscript; available in PMC 2009 June 1.
NIH
-PA Author Manuscript
NIH
-PA Author Manuscript
NIH
-PA Author Manuscript
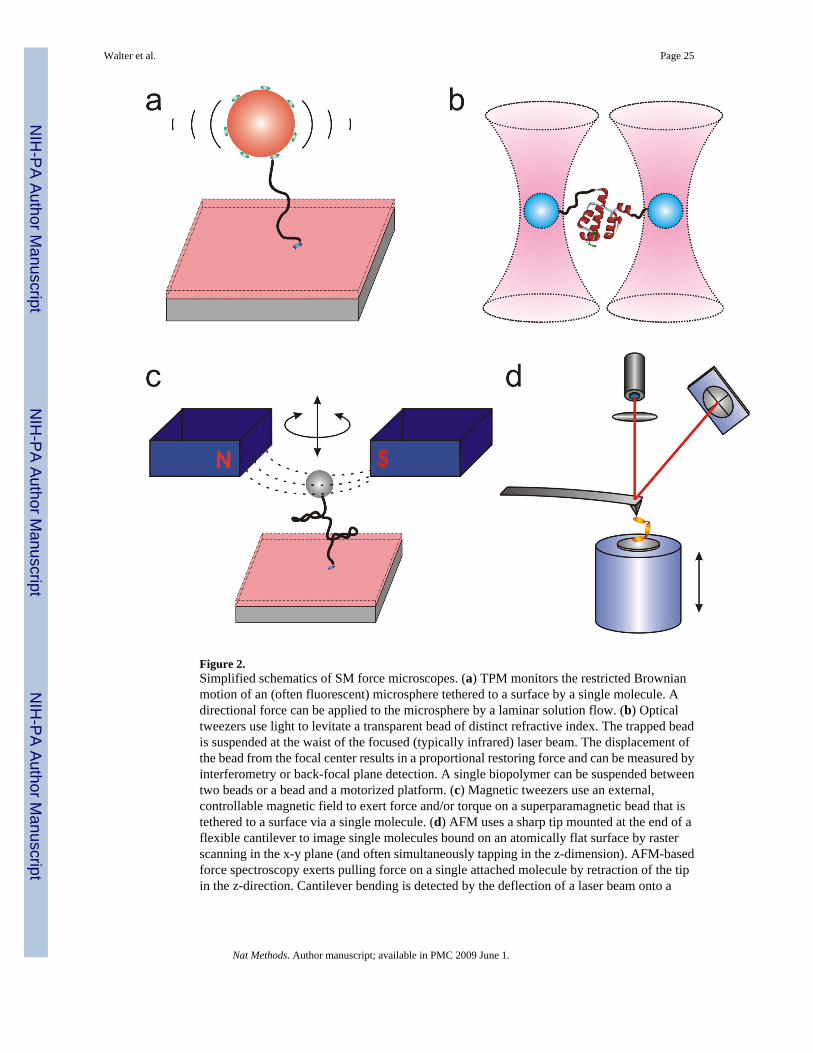
Figure 2.Simplified schematics of SM force microscopes. (a) TPM monitors the restricted Brownianmotion of an (often fluorescent) microsphere tethered to a surface by a single molecule. Adirectional force can be applied to the microsphere by a laminar solution flow. (b) Opticaltweezers use light to levitate a transparent bead of distinct refractive index. The trapped beadis suspended at the waist of the focused (typically infrared) laser beam. The displacement ofthe bead from the focal center results in a proportional restoring force and can be measured byinterferometry or back-focal plane detection. A single biopolymer can be suspended betweentwo beads or a bead and a motorized platform. (c) Magnetic tweezers use an external,controllable magnetic field to exert force and/or torque on a superparamagnetic bead that istethered to a surface via a single molecule. (d) AFM uses a sharp tip mounted at the end of aflexible cantilever to image single molecules bound on an atomically flat surface by rasterscanning in the x-y plane (and often simultaneously tapping in the z-dimension). AFM-basedforce spectroscopy exerts pulling force on a single attached molecule by retraction of the tipin the z-direction. Cantilever bending is detected by the deflection of a laser beam onto a
Walter et al. Page 25
Nat Methods. Author manuscript; available in PMC 2009 June 1.
NIH
-PA Author Manuscript
NIH
-PA Author Manuscript
NIH
-PA Author Manuscript

position-sensitive detector such as a quadrant photodiode. A piezoelectric actuator stage is usedto control the positioning of the sample relative to the tip.
Walter et al. Page 26
Nat Methods. Author manuscript; available in PMC 2009 June 1.
NIH
-PA Author Manuscript
NIH
-PA Author Manuscript
NIH
-PA Author Manuscript
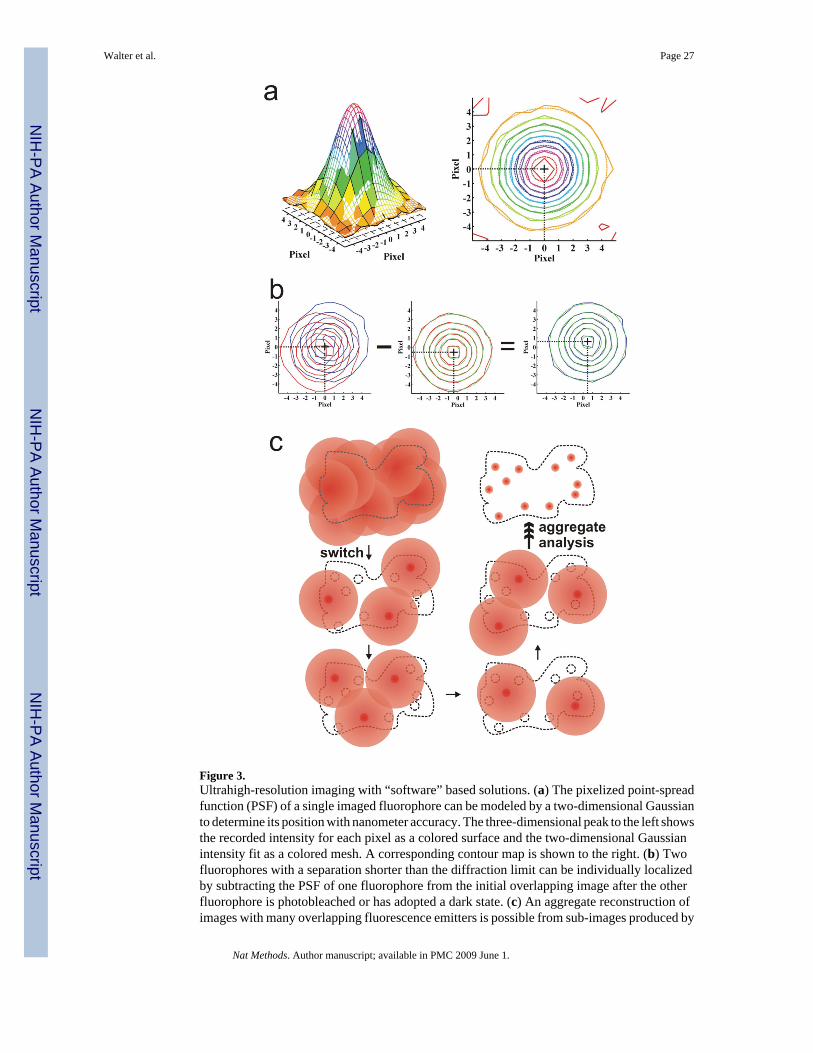
Figure 3.Ultrahigh-resolution imaging with “software” based solutions. (a) The pixelized point-spreadfunction (PSF) of a single imaged fluorophore can be modeled by a two-dimensional Gaussianto determine its position with nanometer accuracy. The three-dimensional peak to the left showsthe recorded intensity for each pixel as a colored surface and the two-dimensional Gaussianintensity fit as a colored mesh. A corresponding contour map is shown to the right. (b) Twofluorophores with a separation shorter than the diffraction limit can be individually localizedby subtracting the PSF of one fluorophore from the initial overlapping image after the otherfluorophore is photobleached or has adopted a dark state. (c) An aggregate reconstruction ofimages with many overlapping fluorescence emitters is possible from sub-images produced by
Walter et al. Page 27
Nat Methods. Author manuscript; available in PMC 2009 June 1.
NIH
-PA Author Manuscript
NIH
-PA Author Manuscript
NIH
-PA Author Manuscript

either sequentially photoactivating and photobleaching or cyclically photoswitching sparsestochastic subsets of fluorophores.
Walter et al. Page 28
Nat Methods. Author manuscript; available in PMC 2009 June 1.
NIH
-PA Author Manuscript
NIH
-PA Author Manuscript
NIH
-PA Author Manuscript
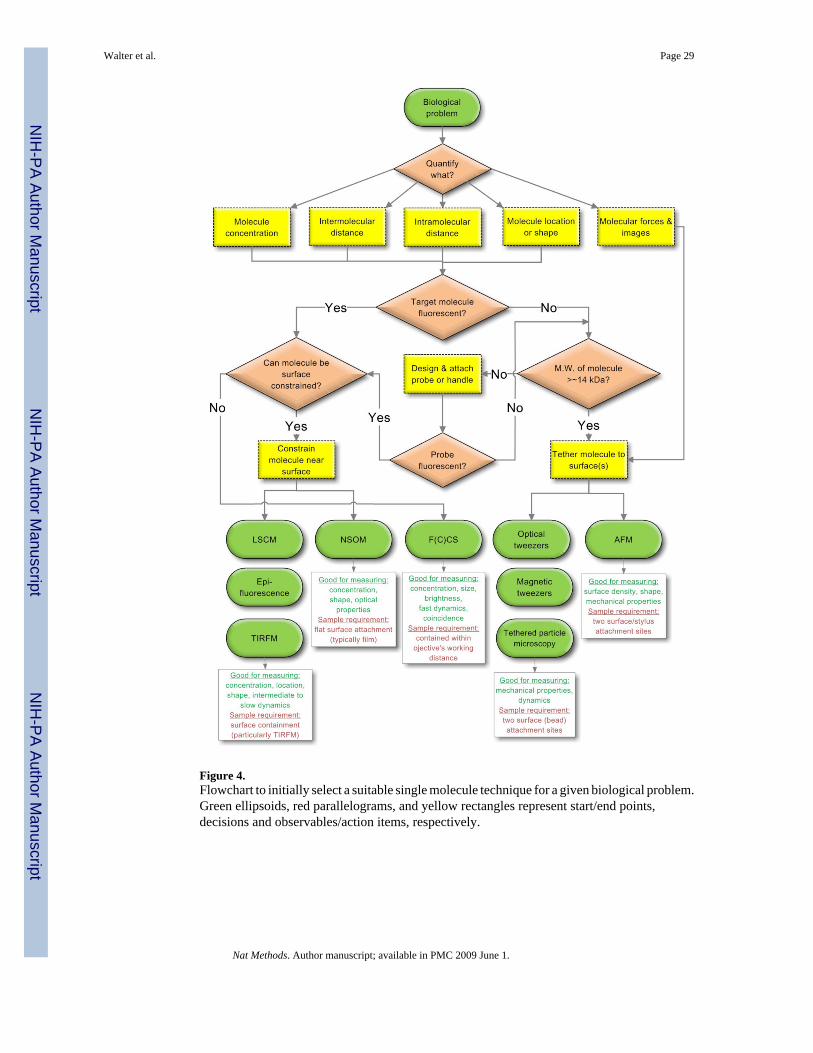
Figure 4.Flowchart to initially select a suitable single molecule technique for a given biological problem.Green ellipsoids, red parallelograms, and yellow rectangles represent start/end points,decisions and observables/action items, respectively.
Walter et al. Page 29
Nat Methods. Author manuscript; available in PMC 2009 June 1.
NIH
-PA Author Manuscript
NIH
-PA Author Manuscript
NIH
-PA Author Manuscript
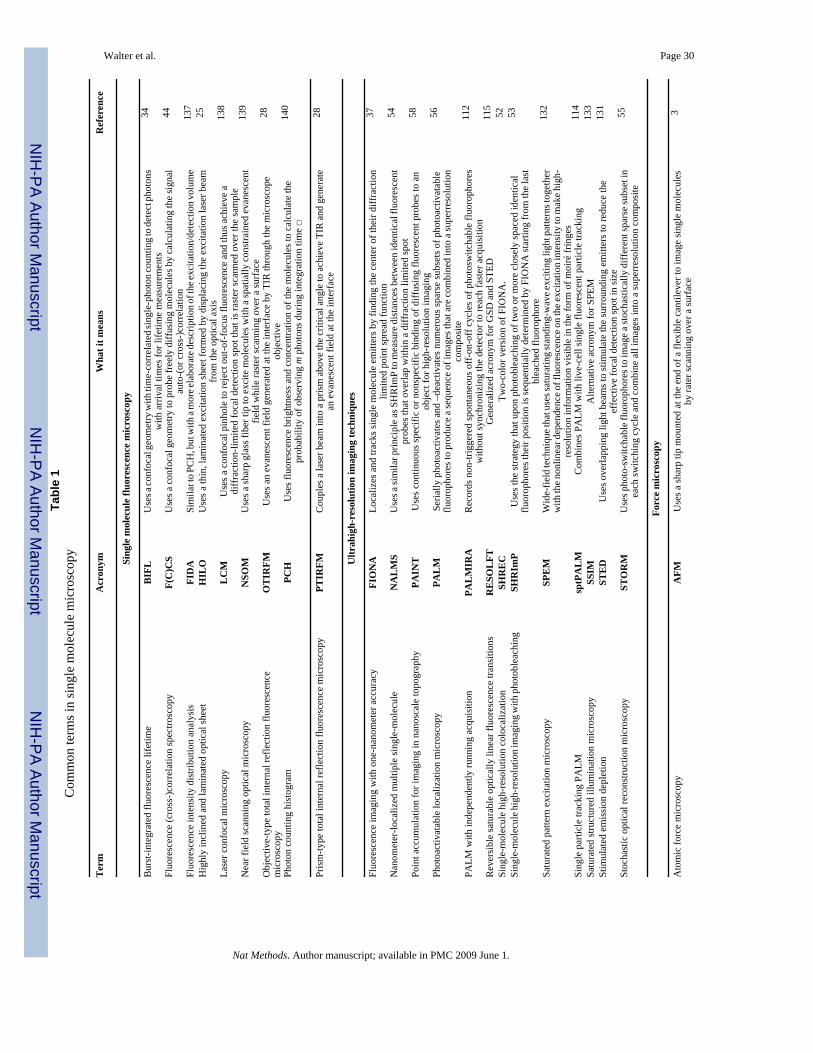
NIH
-PA Author Manuscript
NIH
-PA Author Manuscript
NIH
-PA Author Manuscript
Walter et al. Page 30Ta
ble
1C
omm
on te
rms i
n si
ngle
mol
ecul
e m
icro
scop
y
Ter
mA
cron
ymW
hat i
t mea
nsR
efer
ence
Sing
le m
olec
ule
fluor
esce
nce
mic
rosc
opy
Bur
st-in
tegr
ated
fluo
resc
ence
life
time
BIF
LU
ses a
conf
ocal
geom
etry
with
tim
e-co
rrel
ated
sing
le-p
hoto
n cou
ntin
g to d
etec
t pho
tons
with
arr
ival
tim
es fo
r life
time
mea
sure
men
ts34
Fluo
resc
ence
(cro
ss-)
corr
elat
ion
spec
trosc
opy
F(C
)CS
Use
s a c
onfo
cal g
eom
etry
to p
robe
free
ly d
iffus
ing
mol
ecul
es b
y ca
lcul
atin
g th
e si
gnal
auto
-(or
cro
ss-)
corr
elat
ion
44
Fluo
resc
ence
inte
nsity
dis
tribu
tion
anal
ysis
FID
ASi
mila
r to P
CH
, but
with
a m
ore e
labo
rate
desc
riptio
n of t
he ex
cita
tion/
dete
ctio
n vol
ume
137
Hig
hly
incl
ined
and
lam
inat
ed o
ptic
al sh
eet
HIL
OU
ses a
thin
, lam
inat
ed e
xcita
tion
shee
t for
med
by
disp
laci
ng th
e ex
cita
tion
lase
r bea
mfr
om th
e op
tical
axi
s25
Lase
r con
foca
l mic
rosc
opy
LC
MU
ses a
con
foca
l pin
hole
to re
ject
out
-of-
focu
s flu
ores
cenc
e an
d th
us a
chie
ve a
diff
ract
ion-
limite
d fo
cal d
etec
tion
spot
that
is ra
ster
scan
ned
over
the
sam
ple
138
Nea
r fie
ld sc
anni
ng o
ptic
al m
icro
scop
yN
SOM
Use
s a sh
arp
glas
s fib
er ti
p to
exc
ite m
olec
ules
with
a sp
atia
lly c
onst
rain
ed e
vane
scen
tfie
ld w
hile
rast
er sc
anni
ng o
ver a
surf
ace
139
Obj
ectiv
e-ty
pe to
tal i
nter
nal r
efle
ctio
n flu
ores
cenc
em
icro
scop
yO
TIR
FMU
ses a
n ev
anes
cent
fiel
d ge
nera
ted
at th
e in
terf
ace
by T
IR th
roug
h th
e m
icro
scop
eob
ject
ive
28
Phot
on c
ount
ing
hist
ogra
mPC
HU
ses f
luor
esce
nce
brig
htne
ss a
nd c
once
ntra
tion
of th
e m
olec
ules
to c
alcu
late
the
prob
abili
ty o
f obs
ervi
ng m
pho
tons
dur
ing
inte
grat
ion
time □
140
Pris
m-ty
pe to
tal i
nter
nal r
efle
ctio
n flu
ores
cenc
e m
icro
scop
yPT
IRFM
Cou
ples
a la
ser b
eam
into
a p
rism
abo
ve th
e cr
itica
l ang
le to
ach
ieve
TIR
and
gen
erat
ean
eva
nesc
ent f
ield
at t
he in
terf
ace
28
Ultr
ahig
h-re
solu
tion
imag
ing
tech
niqu
es
Fluo
resc
ence
imag
ing
with
one
-nan
omet
er a
ccur
acy
FIO
NA
Loca
lizes
and
trac
ks si
ngle
mol
ecul
e em
itter
s by
findi
ng th
e ce
nter
of t
heir
diff
ract
ion
limite
d po
int s
prea
d fu
nctio
n37
Nan
omet
er-lo
caliz
ed m
ultip
le si
ngle
-mol
ecul
eN
AL
MS
Use
s a si
mila
r prin
cipl
e as S
HR
ImP
to m
easu
re d
ista
nces
bet
wee
n id
entic
al fl
uore
scen
tpr
obes
that
ove
rlap
with
in a
diff
ract
ion
limite
d sp
ot54
Poin
t acc
umul
atio
n fo
r im
agin
g in
nan
osca
le to
pogr
aphy
PAIN
TU
ses c
ontin
uous
spec
ific
or n
onsp
ecifi
c bi
ndin
g of
diff
usin
g flu
ores
cent
pro
bes t
o an
obje
ct fo
r hig
h-re
solu
tion
imag
ing
58
Phot
oact
ivat
able
loca
lizat
ion
mic
rosc
opy
PAL
MSe
rially
pho
toac
tivat
es a
nd –
deac
tivat
es n
umer
ous s
pars
e su
bset
s of p
hoto
activ
atab
leflu
orop
hore
s to
prod
uce
a se
quen
ce o
f im
ages
that
are
com
bine
d in
to a
supe
rres
olut
ion
com
posi
te
56
PALM
with
inde
pend
ently
runn
ing
acqu
isiti
onPA
LM
IRA
Rec
ords
non
-trig
gere
d sp
onta
neou
s off
-on-
off c
ycle
s of p
hoto
switc
habl
e flu
orop
hore
sw
ithou
t syn
chro
nizi
ng th
e de
tect
or to
reac
h fa
ster
acq
uisi
tion
112
Rev
ersi
ble
satu
rabl
e op
tical
ly li
near
fluo
resc
ence
tran
sitio
nsR
ESO
LFT
Gen
eral
ized
acr
onym
for G
SD a
nd S
TED
115
Sing
le-m
olec
ule
high
-res
olut
ion
colo
caliz
atio
nSH
RE
CTw
o-co
lor v
ersi
on o
f FIO
NA
.52
Sing
le-m
olec
ule h
igh-
reso
lutio
n im
agin
g w
ith p
hoto
blea
chin
gSH
RIm
PU
ses t
he st
rate
gy th
at u
pon
phot
oble
achi
ng o
f tw
o or
mor
e cl
osel
y sp
aced
iden
tical
fluor
opho
res t
heir
posi
tion
is se
quen
tially
det
erm
ined
by
FIO
NA
star
ting
from
the
last
blea
ched
fluo
roph
ore
53
Satu
rate
d pa
ttern
exc
itatio
n m
icro
scop
ySP
EM
Wid
e-fie
ld te
chni
que t
hat u
ses s
atur
atin
g st
andi
ng-w
ave e
xciti
ng li
ght p
atte
rns t
oget
her
with
the n
onlin
ear d
epen
denc
e of f
luor
esce
nce o
n th
e exc
itatio
n in
tens
ity to
mak
e hig
h-re
solu
tion
info
rmat
ion
visi
ble
in th
e fo
rm o
f moi
ré fr
inge
s
132
Sing
le p
artic
le tr
acki
ng P
ALM
sptP
AL
MC
ombi
nes P
ALM
with
live
-cel
l sin
gle
fluor
esce
nt p
artic
le tr
acki
ng11
4Sa
tura
ted
stru
ctur
ed il
lum
inat
ion
mic
rosc
opy
SSIM
Alte
rnat
ive
acro
nym
for S
PEM
133
Stim
ulat
ed e
mis
sion
dep
letio
nST
ED
Use
s ove
rlapp
ing
light
bea
ms t
o st
imul
ate
the
surr
ound
ing
emitt
ers t
o re
duce
the
effe
ctiv
e fo
cal d
etec
tion
spot
in si
ze13
1
Stoc
hast
ic o
ptic
al re
cons
truct
ion
mic
rosc
opy
STO
RM
Use
s pho
to-s
witc
habl
e flu
orop
hore
s to
imag
e a st
ocha
stic
ally
diff
eren
t spa
rse s
ubse
t in
each
switc
hing
cyc
le a
nd c
ombi
ne a
ll im
ages
into
a su
perr
esol
utio
n co
mpo
site
55
Forc
e m
icro
scop
y
Ato
mic
forc
e m
icro
scop
yA
FMU
ses a
shar
p tip
mou
nted
at t
he e
nd o
f a fl
exib
le c
antil
ever
to im
age
sing
le m
olec
ules
by ra
ter s
cann
ing
over
a su
rfac
e3
Nat Methods. Author manuscript; available in PMC 2009 June 1.

NIH
-PA Author Manuscript
NIH
-PA Author Manuscript
NIH
-PA Author Manuscript
Walter et al. Page 31T
erm
Acr
onym
Wha
t it m
eans
Ref
eren
ce
Mag
netic
twee
zers
MT
Use
s an
exte
rnal
mag
netic
fiel
d to
exe
rt fo
rce
on a
supe
rpar
amag
netic
bea
d th
at is
teth
ered
to a
surf
ace
by a
sing
le m
olec
ule
71
Opt
ical
twee
zers
OT
Use
s lig
ht to
exe
rt fo
rce
on a
tran
spar
ent b
ead
that
is te
ther
ed to
a su
rfac
e by
a si
ngle
mol
ecul
e59
Teth
ered
par
ticle
mic
rosc
opy
TPM
Trac
ks th
e Bro
wni
an m
otio
n of
a m
icro
sphe
re te
ther
ed to
a su
rfac
e by
a sin
gle m
olec
ule
61
Nat Methods. Author manuscript; available in PMC 2009 June 1.