Embed Size (px)
Citation preview
Tobacco Use
District of Columbia Communities Putting Prevention to Work
NOTICE OF NON-DISCRIMINATION
In accordance with the D.C. Human Rights Act of 1977, as amended, D. C. Code section 2.1401.01 et seq., (“the Act”) the District of Columbia does not discriminate on the basis of race, color, reli-gion, national origin, sex, age, marital status, personal appearance, sexual orientation, familial status,
family responsibilities, matriculation, political affiliation, disability, source of income, or place of residednce or business. Discrimination in violation of the Act will not be tolerated. Violators will
be subject to disciplinary action.
June 2013
Acknowledgments
GOVERNMENT OF THE DISTRICT OF COLUMBIAVincent C. Gray, Mayor
DEPARTMENT OF HEALTHSaul M. Levin, MD., MPA, Interim Director
CENTER FOR POLICY, PLANNING AND EVALUATIONFern Johnson-Clarke, PhD, Senior Deputy DirectorJohn Davies-Cole, PhD, MPH, State Epidemiologist
BEHAVIORAL RISK FACTOR SURVEILLANCE SYSTEMTracy Garner, Program Coordinator
PUBLIC INFORMATION OFFICERNajma Roberts
AUTHORSTracy Garner, BRFSS Program Coordinator
Tilahun Kassaye, MPH CandidateTasha Lewis, Data Analyst
EDITORSFern Johnson-Clarke, PhD
John O. Davies-Cole, PhD, MPHNajma Roberts
SPECIAL THANKSDenise Grant, M.DIV, MA, Project Director
Tobacco Control Program
Bonita McGee Tobacco Control Program
Joelle Robinson, Tobacco Control Program
ICF Macro International, ContractorDistrict of Columbia
Behavioral Risk Factor Surveillance SystemCommunities Putting Prevention to Work survey
Table of Contents
EXECUTIVE SUMMARY ………………………………………………………………. 7 METHODOLOGY ……………………………………………………………………… 8 INTRODUCTION ………………………………………………………………………. 12 GLOBAL TREND ………………………………………………………………………. 13 TOBACCO USE IN THE US …………………………………………………………… 13 TOBACCO USE IN THE DISTRICT OF COLUMBIA ……………………………….... 14 Demographic Disparity in Tobacco Use …………………………………………. 15 HEALTH BURDEN ……………………………………………………………………... 18 ECONOMIC BURDEN ……………………………………………………………….… 18 HEALTHY PEOPLE 2020 ……………………………………………………….……… 19 COMMUNITY PUTTING PREVENTION TOGETHER (CPPW) ……………………. 20 Prevalence of Adult Tobacco Use ……………………………………………….. 20 Youth and Tobacco ……………………………………………………………… 20 Demographic Disparity in Tobacco Use …………………………………………. 32 Second Smoking …………………………………………………………………. 35 Smoking Cessation ………………………………………………………………. 37 Diabetes and Cardiovascular Disease Among Current Smokers ………………….. 38 Tobacco Use and Physical, Social and Mental Health ……………………….……. 40 Tobacco Use and Physical Activity ……………………………………………..… 43 Tobacco Use and Disability ………………………………………………………. 43 OUTLETS, POPULATION AND MEDIAN INCOME ………………………………... 44 OVERVIEW OF PROMOTION AND ADVERTISING RESTRICTION ……………... 45 STRATEGIES AND POLICIES ON TOBACCO USE IN THE DISTRICT …………… 49 REFERENCES …………………………………………………………………………… 51
Tables Table 1: Adult tobacco use in the District of Columbia in 2010 …………………………………… 20Table 2: Disparity in tobacco use by sex, race/ethnicity, and age…………………………………… 33Table 3: Exposure to secondhand smoking in the workplace ……………………………………… 35Table 4: Exposure to secondhand smoking in a vehicle …………………………………………… 35Table 5: Exposure to secondhand smoking in indoor public places ………………………………… 35Table 6: Exposure to secondhand smoking inside the home ………………………………………… 36Table 7: Exposure to secondhand smoking inside the home by someone else ……………………… 36Table 8: Exposure to secondhand smoking in own or lease vehicles ………………………………… 36Table 9: Exposure to secondhand smoking allowed at the workplace ……………………………… 36Table 10: Smoking cessation, aware of quitline …………………………………………………… 37Table 11: Smoking cessation, time frame in mind for quitting ……………………………………. 37Table 12 Tobacco use among diabetic respondents ……………………………………………… 38Table 13: Tobacco use by myocardial infarction ………………………………………………… 38Table 14: Tobacco use by coronary heart disease ………………………………………………… 38Table 15: Tobacco use by stroke …………………………………………………………………… 39Table 16: Tobacco use by social/emotional status ………………………………………………… 40Table 17: Tobacco use by emotional status ……………………………………………………… 40Table 18: Current smoker by mental health ………………………………………………………… 41Table 19: Current smoker by mental health - feeling restless ………………………………………… 41 Table 20: Current smoker by mental health - depression …………………………………………… 41Table 21: Current smoker by mental health - feeling worthless …………………………………… 42Table 22: Current smoker by mental health - effort ……………………………………………… 42Table 12: Tobacco use and physical activity ……………………………………………………… 43Table 13: Tobacco use and disability ………………………………………………………………… 43Table 25: Tobacco rate in relation to population, income and number of tobacco outlets ……………44
FiguresFigure 1: Trends in adult tobacco use Nationwide and District of Columbia, 1996 - 2010 …………... 14Figure 2: Tobacco use by gender in the District of Columbia in 2010 ……………………………….. 15Figure 3: Tobacco use by race/ethnicity in 2010 …………………………………………………….. 16Figure 4: Adult tobacco use by age in the District of Columbia in 2010 …………………………….. 16Figure 5: Tobacco use by income level in the District of Columbia in 2010 ………………………… 17Figure 6: Tobacco use by level of education in the District of Columbia in 2010 …………………… 17Figure 7: Students who ever tried cigarette smoking, even one or two puffs by gender ………………22Figure 8: Students who ever tried cigarette smoking, even one or two puffs by grade level ………….. 22Figure 9: Students who smoked a whole cigarette for the first time before age 13 years ……………... 23Figure 10: Students who smoked a whole cigarette for the first time before age 13 years …………..... 23Figure 11: Students who smoked cigarettes on one or more occasion ………………………………. 24Figure 12: Students who smoked cigarettes on one or more occasion …………………………..……24Figure 13: Students who smoked cigarettes on school property …………………………… ……….. 25Figure 14: Students who smoked cigarettes on school property ……………………………………... 25Figure 15: Students who smoked cigarettes on 20 or more of the past 30 days ………………………26Figure 16: Students who smoked cigarettes on 20 or more of the past 30 days ………………………26Figure 17: Students who ever smoked cigarettes daily, that is, at least one cigarette everyday …………27Figure 18: Students who ever smoked cigarettes daily, that is, at least one cigarette everyday …………27Figure 19: Students who used chewing tobacco, snuff,or dip on one or more occasion ………………28Figure 20: Students who used chewing tobacco, snuff,or dip on one or more occasion ………………28

Figure 21: Students who used chewing tobacco, snuff, or dip on school property……………………29Figure 22: Students who used chewing tobacco, snuff, or dip on school property ………………….. 29Figure 23: Students who smoked cigars,cigarillos,or little cigars on one or more occasion ………….30Figure 24: Students who smoked cigars,cigarillos,or little cigars on one or more occasion ………….30Figure 25: Students who smoked cigarettes or cigars or used chewing tobacco,snuff, or dip ……….. 31 Figure 26: Students who smoked cigarettes or cigars or used chewing tobacco,snuff, or dip ……….. 31
7
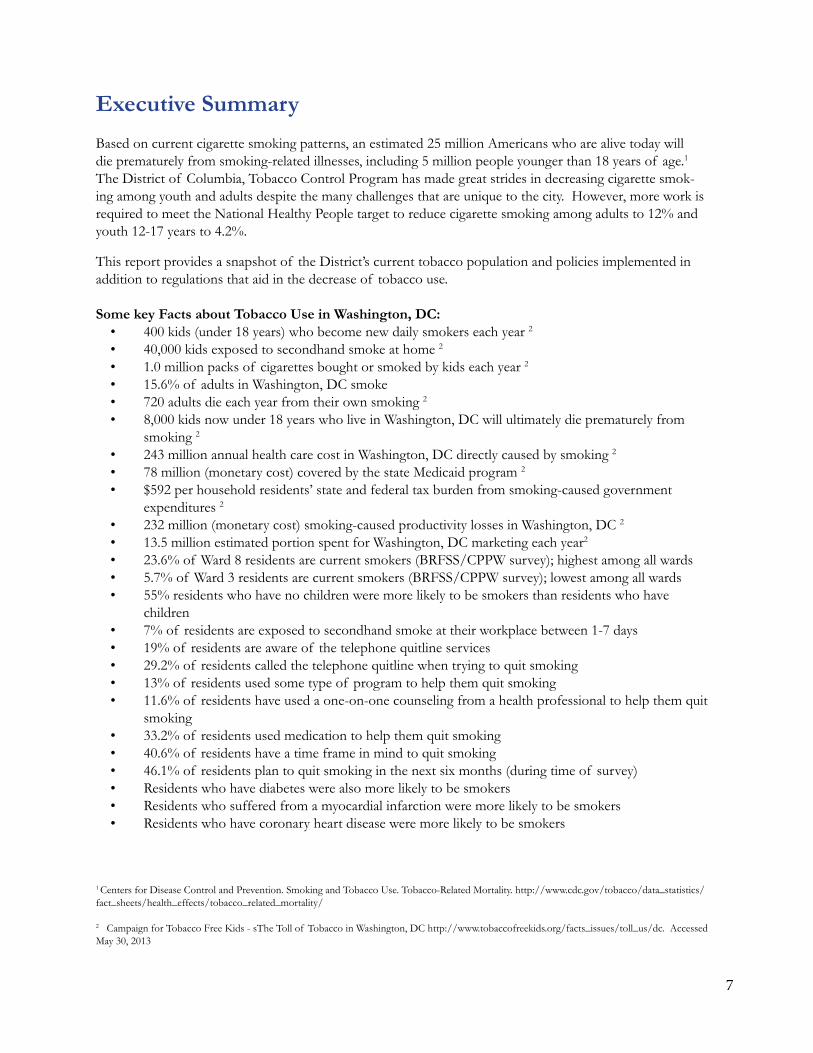
Executive Summary
Based on current cigarette smoking patterns, an estimated 25 million Americans who are alive today will die prematurely from smoking-related illnesses, including 5 million people younger than 18 years of age.1 The District of Columbia, Tobacco Control Program has made great strides in decreasing cigarette smok-ing among youth and adults despite the many challenges that are unique to the city. However, more work is required to meet the National Healthy People target to reduce cigarette smoking among adults to 12% and youth 12-17 years to 4.2%.
This report provides a snapshot of the District’s current tobacco population and policies implemented in addition to regulations that aid in the decrease of tobacco use.
Some key Facts about Tobacco Use in Washington, DC: • 400 kids (under 18 years) who become new daily smokers each year 2
• 40,000 kids exposed to secondhand smoke at home 2
• 1.0 million packs of cigarettes bought or smoked by kids each year 2
• 15.6% of adults in Washington, DC smoke • 720 adults die each year from their own smoking 2
• 8,000 kids now under 18 years who live in Washington, DC will ultimately die prematurely from smoking 2
• 243 million annual health care cost in Washington, DC directly caused by smoking 2
• 78 million (monetary cost) covered by the state Medicaid program 2
• $592 per household residents’ state and federal tax burden from smoking-caused government expenditures 2
• 232 million (monetary cost) smoking-caused productivity losses in Washington, DC 2
• 13.5 million estimated portion spent for Washington, DC marketing each year2
• 23.6% of Ward 8 residents are current smokers (BRFSS/CPPW survey); highest among all wards • 5.7% of Ward 3 residents are current smokers (BRFSS/CPPW survey); lowest among all wards • 55% residents who have no children were more likely to be smokers than residents who have children • 7% of residents are exposed to secondhand smoke at their workplace between 1-7 days • 19% of residents are aware of the telephone quitline services • 29.2% of residents called the telephone quitline when trying to quit smoking • 13% of residents used some type of program to help them quit smoking • 11.6% of residents have used a one-on-one counseling from a health professional to help them quit smoking • 33.2% of residents used medication to help them quit smoking • 40.6% of residents have a time frame in mind to quit smoking • 46.1% of residents plan to quit smoking in the next six months (during time of survey) • Residents who have diabetes were also more likely to be smokers • Residents who suffered from a myocardial infarction were more likely to be smokers • Residents who have coronary heart disease were more likely to be smokers
1 Centers for Disease Control and Prevention. Smoking and Tobacco Use. Tobacco-Related Mortality. http://www.cdc.gov/tobacco/data_statistics/fact_sheets/health_effects/tobacco_related_mortality/
2 Campaign for Tobacco Free Kids - sThe Toll of Tobacco in Washington, DC http://www.tobaccofreekids.org/facts_issues/toll_us/dc. Accessed May 30, 2013
8 Tobacco UseCommunities Putting Prevention to Work
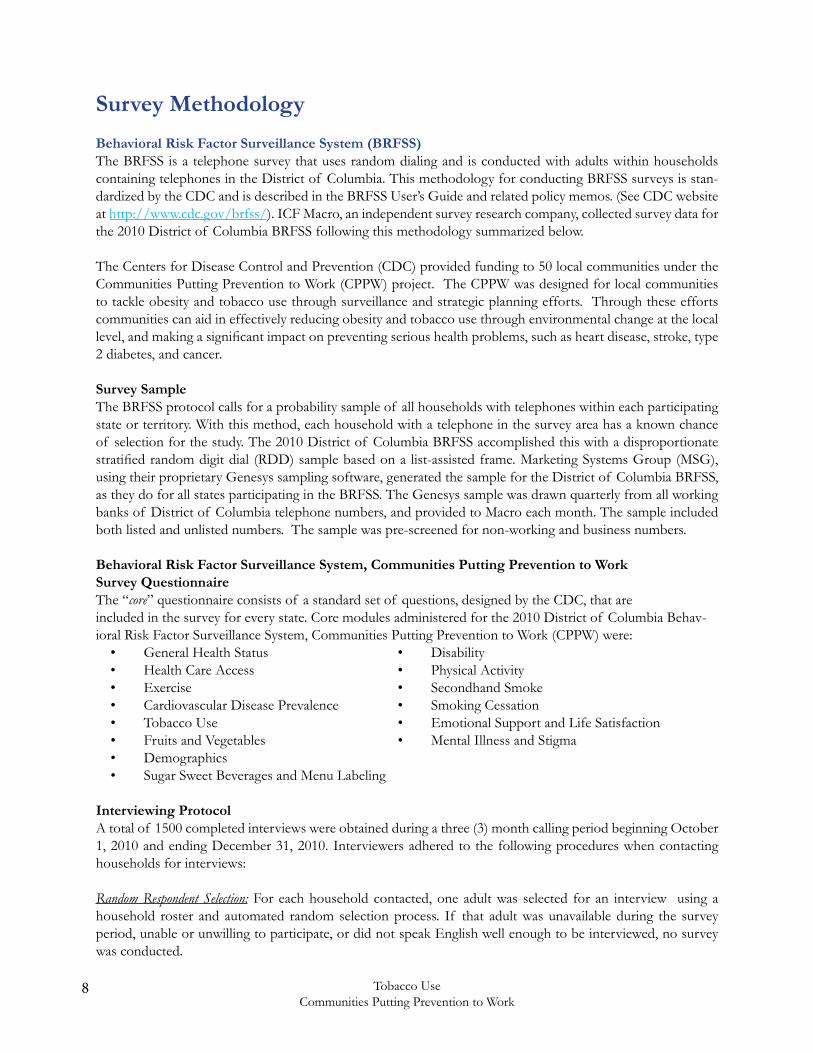
Survey Methodology
Behavioral Risk Factor Surveillance System (BRFSS)The BRFSS is a telephone survey that uses random dialing and is conducted with adults within households containing telephones in the District of Columbia. This methodology for conducting BRFSS surveys is stan-dardized by the CDC and is described in the BRFSS User’s Guide and related policy memos. (See CDC website at http://www.cdc.gov/brfss/). ICF Macro, an independent survey research company, collected survey data for the 2010 District of Columbia BRFSS following this methodology summarized below.
The Centers for Disease Control and Prevention (CDC) provided funding to 50 local communities under the Communities Putting Prevention to Work (CPPW) project. The CPPW was designed for local communities to tackle obesity and tobacco use through surveillance and strategic planning efforts. Through these efforts communities can aid in effectively reducing obesity and tobacco use through environmental change at the local level, and making a significant impact on preventing serious health problems, such as heart disease, stroke, type 2 diabetes, and cancer.
Survey SampleThe BRFSS protocol calls for a probability sample of all households with telephones within each participating state or territory. With this method, each household with a telephone in the survey area has a known chance of selection for the study. The 2010 District of Columbia BRFSS accomplished this with a disproportionate stratified random digit dial (RDD) sample based on a list-assisted frame. Marketing Systems Group (MSG), using their proprietary Genesys sampling software, generated the sample for the District of Columbia BRFSS, as they do for all states participating in the BRFSS. The Genesys sample was drawn quarterly from all working banks of District of Columbia telephone numbers, and provided to Macro each month. The sample included both listed and unlisted numbers. The sample was pre-screened for non-working and business numbers.
Behavioral Risk Factor Surveillance System, Communities Putting Prevention to Work Survey QuestionnaireThe “core” questionnaire consists of a standard set of questions, designed by the CDC, that are included in the survey for every state. Core modules administered for the 2010 District of Columbia Behav-ioral Risk Factor Surveillance System, Communities Putting Prevention to Work (CPPW) were: • General Health Status • Disability • Health Care Access • Physical Activity • Exercise • Secondhand Smoke • Cardiovascular Disease Prevalence • Smoking Cessation • Tobacco Use • Emotional Support and Life Satisfaction • Fruits and Vegetables • Mental Illness and Stigma • Demographics • Sugar Sweet Beverages and Menu Labeling Interviewing ProtocolA total of 1500 completed interviews were obtained during a three (3) month calling period beginning October 1, 2010 and ending December 31, 2010. Interviewers adhered to the following procedures when contacting households for interviews:
Random Respondent Selection: For each household contacted, one adult was selected for an interview using a household roster and automated random selection process. If that adult was unavailable during the survey period, unable or unwilling to participate, or did not speak English well enough to be interviewed, no survey was conducted.

9Tobacco UseCommunities Putting Prevention to Work
Contact Attempts: Up to 15 attempts, over a minimum five-day period (typically 15 days), were made to reach each sampled telephone number. Once contact was made at a residednce, as many calls as necessary were made to reach the randomly selected adult (within the permitted time schedule). Attempts were made on different days of the week and at different times of day, in a pattern chosen to maximize the likelihood of contact with the minimum number of calls.
No attempts were made to conduct an interview in a household where the randomly selected adult could not be interviewed in English. When a Spanish-speaking individual was contacted, a bilingual interviewer attempted to determine if the selected person was capable of completing the survey in English.
Converting Initial Refusals: Specially trained interviewers re-contacted households that initially refused, at least three days later, to persuade respondents to participate in the survey.
Quality Control Measures: Supervisors monitored 10% of interviews using a remote monitoring feature of the CATI software. During these sessions, the supervisor simultaneously monitored both the interviewer-respon-dent interaction on the telephone and the data entered by the interviewer into the CATI system; scoring the interviewer on a variety of performance measures. Neither interviewers nor respondents were aware when calls were monitored.
Data AnalysesData for the 2010 DC CPPW/BRFSS survey were delivered to the CDC each month; the data were then aggregated and weighted after interviewing was completed. Data were weighted to adjust for differences in the probabilities of selection of each respondent. This weight accounted for the probability of selection of a telephone number, the number of adults in a household, and the number of telephones in a household. In this report, all data are weighted unless otherwise noted.
Limitations of the DataAs with any sample survey, depending on the confidence limit selected, the results of the District of Co-lumbia BRFSS can vary from those that would have been obtained with a census of all adults living in tele-phone-equipped households. The results of this sample survey could differ from the “true” figures because some households cannot be reached and others refused to participate. These non-responding households may differ from respondents (those who actually participate in the survey) in terms of attributes relevant to the study.
The sample-design used in the District of Columbia BRFSS results in a 95% confidence interval. In other words, 95 times out of 100, the BRFSS results will vary no more than a given number of percentage points from the figure that would have been obtained if data had been collected for all adults in District of Colum-bia households with telephones.
Small NumbersSmall numbers of respondents are also an issue when analyzing data. A difference in the responses of only a few individuals can result in a large difference in percentage of the total for that group. Small numbers of respondents in a group generally occur in one of two ways. First, very few respondents in the total sample have a particular characteristic under analysis. Second, the survey logic limits the number of respondents receiving a particular question, thereby reducing the number of respondents in each analytical unit from that item. Where counts are less than 50 respondents per subgroup, caution should be used in drawing conclu-sions from the data.
10 Tobacco UseCommunities Putting Prevention to Work
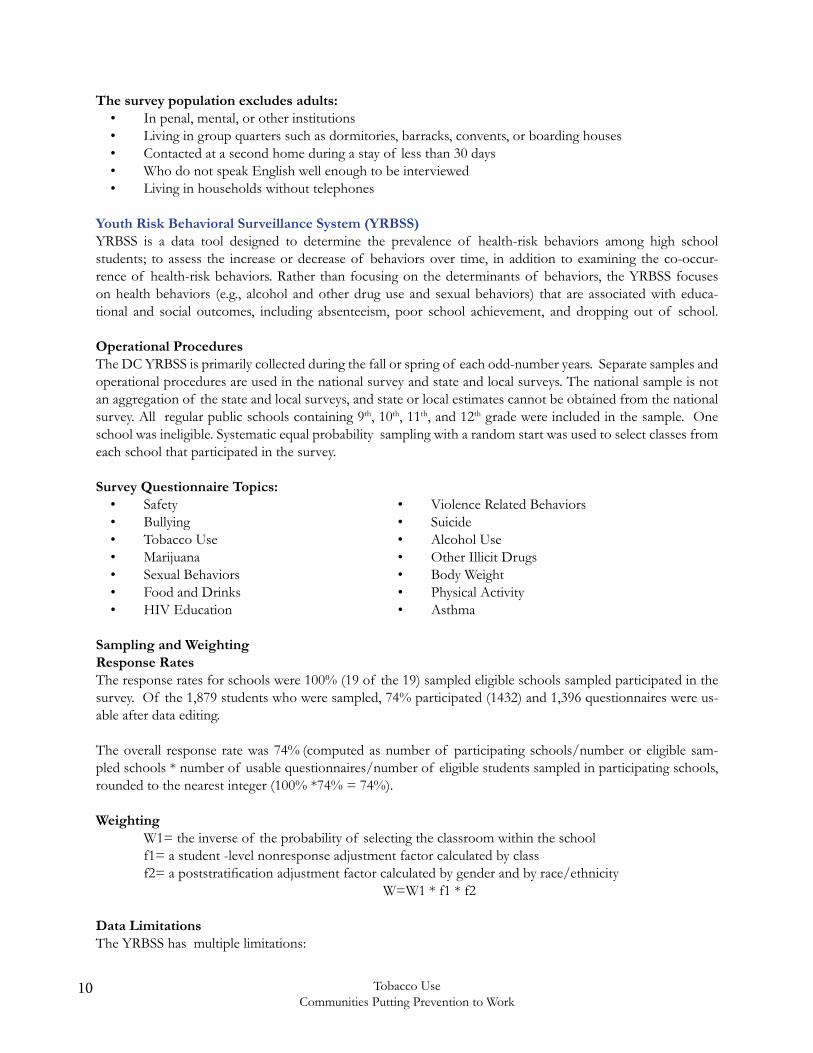
The survey population excludes adults: • In penal, mental, or other institutions • Living in group quarters such as dormitories, barracks, convents, or boarding houses • Contacted at a second home during a stay of less than 30 days • Who do not speak English well enough to be interviewed • Living in households without telephones
Youth Risk Behavioral Surveillance System (YRBSS)YRBSS is a data tool designed to determine the prevalence of health-risk behaviors among high school students; to assess the increase or decrease of behaviors over time, in addition to examining the co-occur-rence of health-risk behaviors. Rather than focusing on the determinants of behaviors, the YRBSS focuses on health behaviors (e.g., alcohol and other drug use and sexual behaviors) that are associated with educa-tional and social outcomes, including absenteeism, poor school achievement, and dropping out of school.
Operational ProceduresThe DC YRBSS is primarily collected during the fall or spring of each odd-number years. Separate samples and operational procedures are used in the national survey and state and local surveys. The national sample is not an aggregation of the state and local surveys, and state or local estimates cannot be obtained from the national survey. All regular public schools containing 9th, 10th, 11th, and 12th grade were included in the sample. One school was ineligible. Systematic equal probability sampling with a random start was used to select classes from each school that participated in the survey.
Survey Questionnaire Topics: • Safety • Violence Related Behaviors • Bullying • Suicide • Tobacco Use • Alcohol Use • Marijuana • Other Illicit Drugs • Sexual Behaviors • Body Weight • Food and Drinks • Physical Activity • HIV Education • Asthma
Sampling and WeightingResponse RatesThe response rates for schools were 100% (19 of the 19) sampled eligible schools sampled participated in the survey. Of the 1,879 students who were sampled, 74% participated (1432) and 1,396 questionnaires were us-able after data editing.
The overall response rate was 74% (computed as number of participating schools/number or eligible sam-pled schools * number of usable questionnaires/number of eligible students sampled in participating schools, rounded to the nearest integer (100% *74% = 74%).
Weighting W1= the inverse of the probability of selecting the classroom within the school f1= a student -level nonresponse adjustment factor calculated by class f2= a poststratification adjustment factor calculated by gender and by race/ethnicity W=W1 * f1 * f2
Data LimitationsThe YRBSS has multiple limitations:

11Tobacco UseCommunities Putting Prevention to Work
• Self report • Underreporting and over-reporting of behaviors cannot be determined • Not collected by ward and zip code • Data only applies to youth who attend school • Survey addresses behaviors that contribute to the leading causes of morbidity and mortality among youth and adults • Data is not available among all 50 states
12 Tobacco UseCommunities Putting Prevention to Work
IntroductionCigarette smoking over the last several years has seen a decline. Despite great efforts, 1 in 5 deaths occur each year in the United States from cigarette smoking and is estimated to cause 443,000 deaths annually (including deaths from secondhand smoke), 49,400 deaths per year from secondhand smoke exposure, 269,655 deaths annually among men and 173,940 deaths annually among women. 1
The Communities Putting Prevention to Work (CPPW) was designed for local communities to tackle obesity and tobacco use through surveillance, strategic planning and evidence based modeling in an effort to limit ac-cess and exposure of tobacco products among at risk populations. 2
Communities that are informed with accurate information regarding the harmful effects of tobacco are in a better position to create an environment that is responsive and participatory in ensuring that residents are able to obtain resources that prevent early onset of tobacco use and provide tobacco education and smoking cessation resources for current users. Getting communities actively involved in what goes on in their living environment can change many of the cultural norms and attitudes towards smoking.
Over the past several years, legislation has been passed not only to protect the health of current smokers but individuals who die or become ill due to the harmful effects of secondhand smoke. On average, adults who smoke cigarettes will die 14 years earlier than nonsmokers.2 Exposure to secondhand smoke—sometimes called environmental tobacco smoke—causes nearly 50,000 deaths each year among adults in the United States. Secondhand smoke causes 3,400 annual deaths from lung cancer and causes 46,000 annual deaths from heart disease.3
Approximately 3,800 youth under the age of 18 try their first cigarette every day. Since cigarette smoking nor-mally begins for many under the age of 18, many of those users tend to continue to smoke during their adult years.
Over the past several years, policies have been implemented to change how the tobacco industry can market cigarettes. The era of promoting cigarettes on television with the assistance of celebrities have changed. Under the new rules, the FDA 4 will: • Ban tobacco companies from sponsoring sporting and entertainment events. • Outlaw free cigarette samples and giveaways of non-tobacco items with the purchase of tobacco. • Prohibit the sale of cigarettes in packs of fewer than 20, eliminating so-called “kiddie packs” that public health experts say make cigarettes more affordable. • Restrict tobacco products in vending machines and self-service displays to adult-only facilities, and require stores to place them behind the counter. • Forbid tobacco sales to children younger than 18 and require photo identification for over-the-counter sales. • Provide for federal enforcement against violators, ranging from warning letters to criminal penalties.
Despite these efforts, the tobacco industry remains creative with various marketing ploys and has spent $13.5 million in the District of Columbia to attract new users.5 As older users quit or die of a premature death related to cigarette smoking, the tobacco industry in an effort to generate money must find a creative but indirect way to get replacements. More than 2,500 youth and young adults who have been occasional smokers will become regular smokers on any given day and an estimated third of these replacement smokers will die early from smoking.6
13Tobacco UseCommunities Putting Prevention to Work
Global Trend of Tobacco
“Tobacco kills up to half of those who use it. Yet tobacco use is common throughout the world due to low prices, aggressive and widespread marketing, lack of awareness about its dangers, and inconsistent public policies against its use.”7
According to the World Health Organization:8 • Tobacco kills nearly 6 million people each year, of which more than 5 million are users and ex-users and more than 600,000 are nonsmokers exposed to second-hand smoke.
• The annual death toll could rise to more than eight million by 2030 if aggressive action is not taken.
• Nearly 80% of the world's one billion smokers live in low and middle-income countries.
• Consumption of tobacco products is increasing globally despite decreasing in some high-income and upper middle-income countries.
Tobacco Use in the United States
According to the 2012 U.S. Surgeon General report, more than 1,200 people die daily due to smoking. For each of those deaths, at least two youth or young adults become regular smokers each day. Almost 90% of those replacement smokers smoke their first cigarette by age 18.9
During the period 2005 – 2010, 1 in 5 (45.3 million) adults in the U.S. were cigarette smokers. The smoking prevalence declined from 20.9% in 2005 to 19.3% in 2010, representing a decline by 3 million. If the decline in smoking continues at the same rate, adult smoking rates will reach approximately 17% by 2020, substantial-ly higher than the Healthy People 2020 target goal of ≤12%.10
Among the active adult smokers in 2010, non-Hispanic American Indian/Alaska Natives had the highest prevalence (31.4%), followed by non-Hispanic multiple race (25.9%) and non-Hispanic whites (21.0%). The smoking rate among non-Hispanic black was 20.6% and 12.5% among Hispanic.10
During the same year, the number of adult male smokers were higher (21.5%) than female smokers (17.3%). The smoking rate was also different by education and economic status.
Smoking prevalence generally decreased with increasing education and was higher among adults living below the poverty level (28.9%) than among those at or above the poverty level (18.3%).10
Results from the 2011 national Youth Risk Behavior Surveillance System (YRBSS) indicated that many high school students were engaged in behaviors associated with the leading causes of death among the age group ≥25 years. Eighteen percent (18.1%) of high school students smoked cigarettes and 7.7% had used smokeless tobacco.11
The harmful effects of smoking go beyond the smoker. Exposure to secondhand smoking accounts for an estimated 88 million nonsmoking Americans, including 54% of children aged 3 - 11 years.12
14 Tobacco UseCommunities Putting Prevention to Work
Tobacco Use in the District of Columbia
• In 2007, 17% of adults and 11% of high school students in the District of Columbia reported being active smokers.13
• The 2011 YRBSS indicated that among high school students, 43% tried cigarette smoking.14
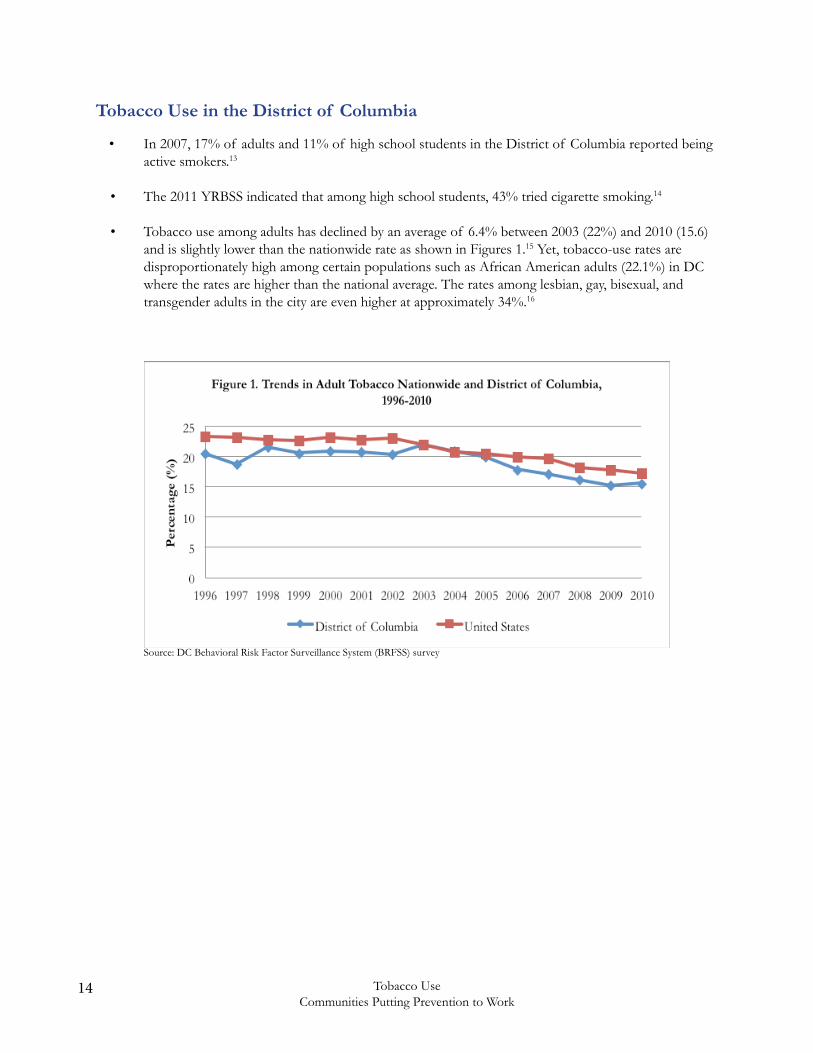
• Tobacco use among adults has declined by an average of 6.4% between 2003 (22%) and 2010 (15.6) and is slightly lower than the nationwide rate as shown in Figures 1.15 Yet, tobacco-use rates are disproportionately high among certain populations such as African American adults (22.1%) in DC where the rates are higher than the national average. The rates among lesbian, gay, bisexual, and transgender adults in the city are even higher at approximately 34%.16
Source: DC Behavioral Risk Factor Surveillance System (BRFSS) survey
15Tobacco UseCommunities Putting Prevention to Work
Demographic Tobacco Use
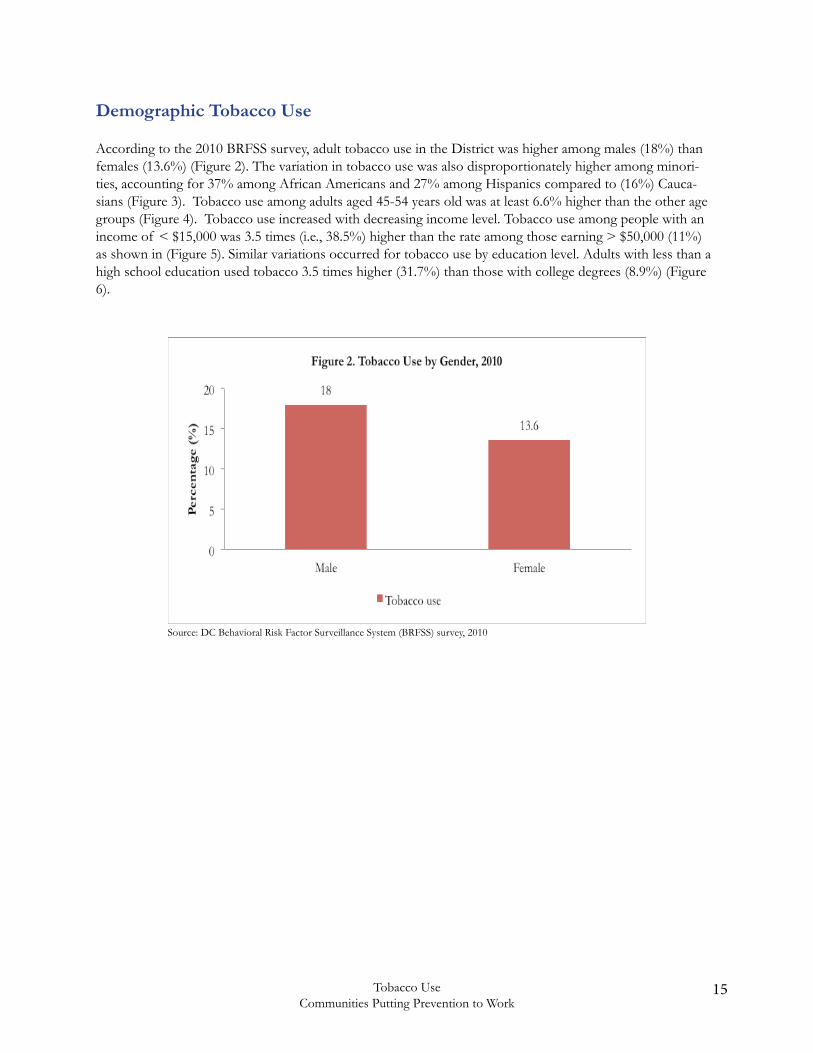
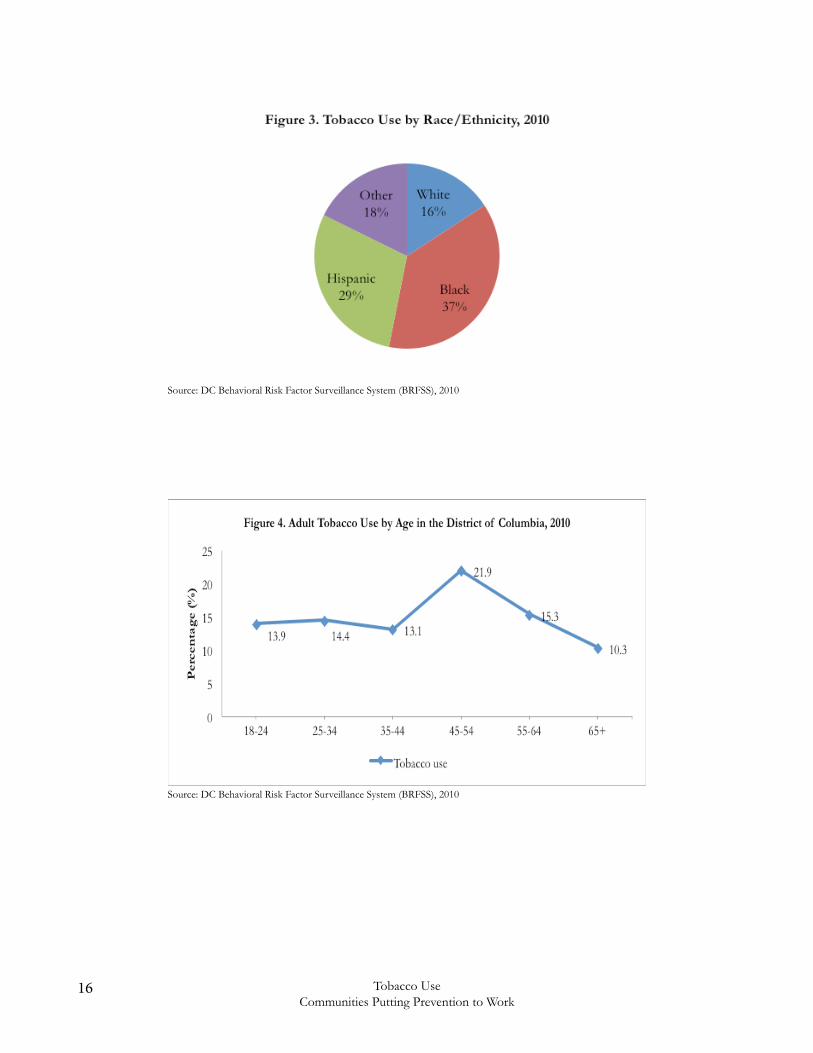
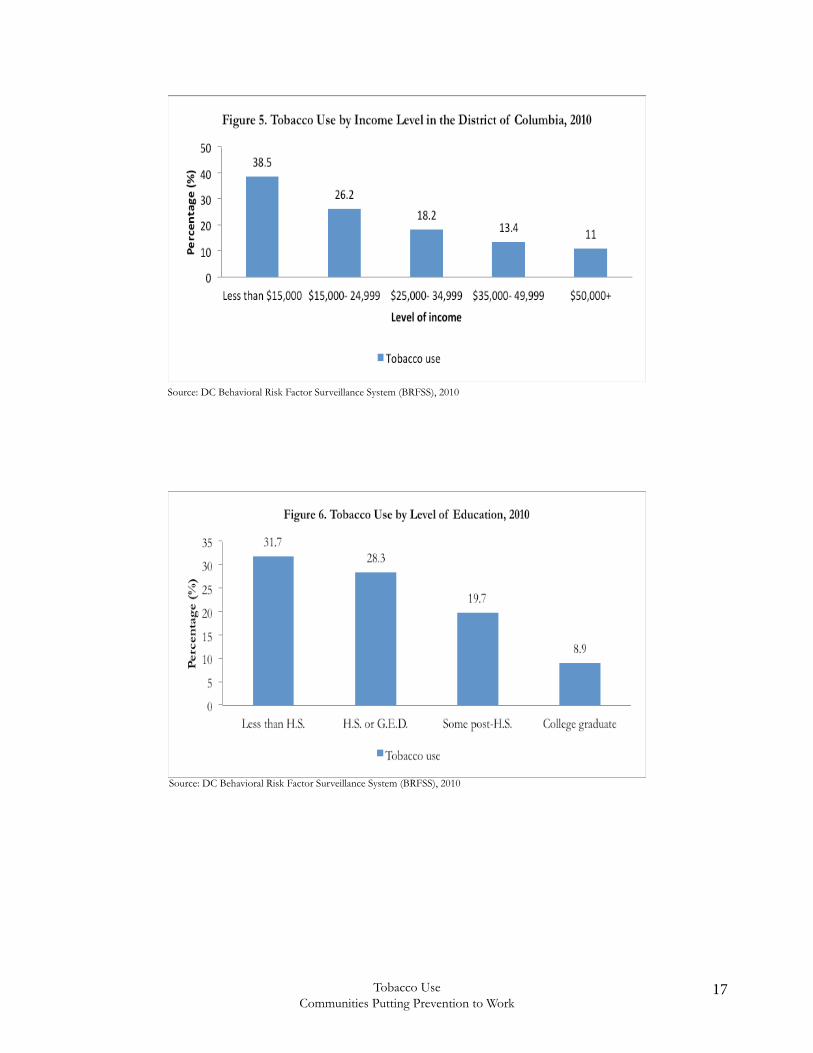
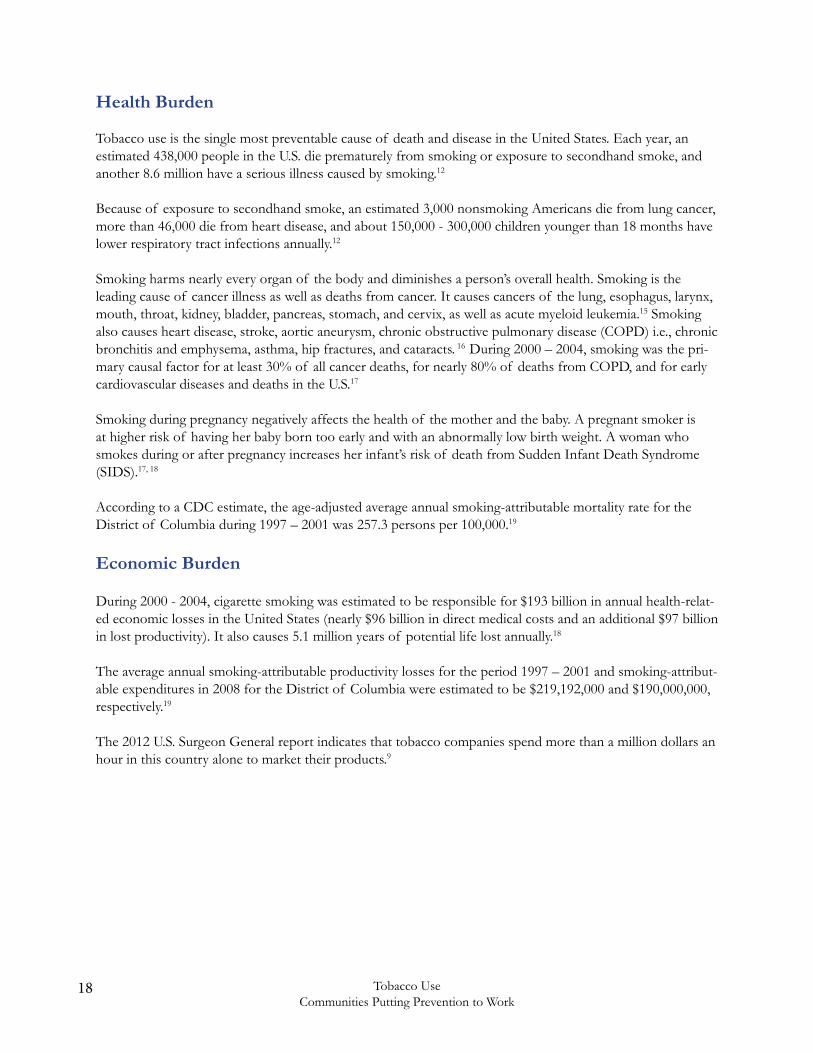
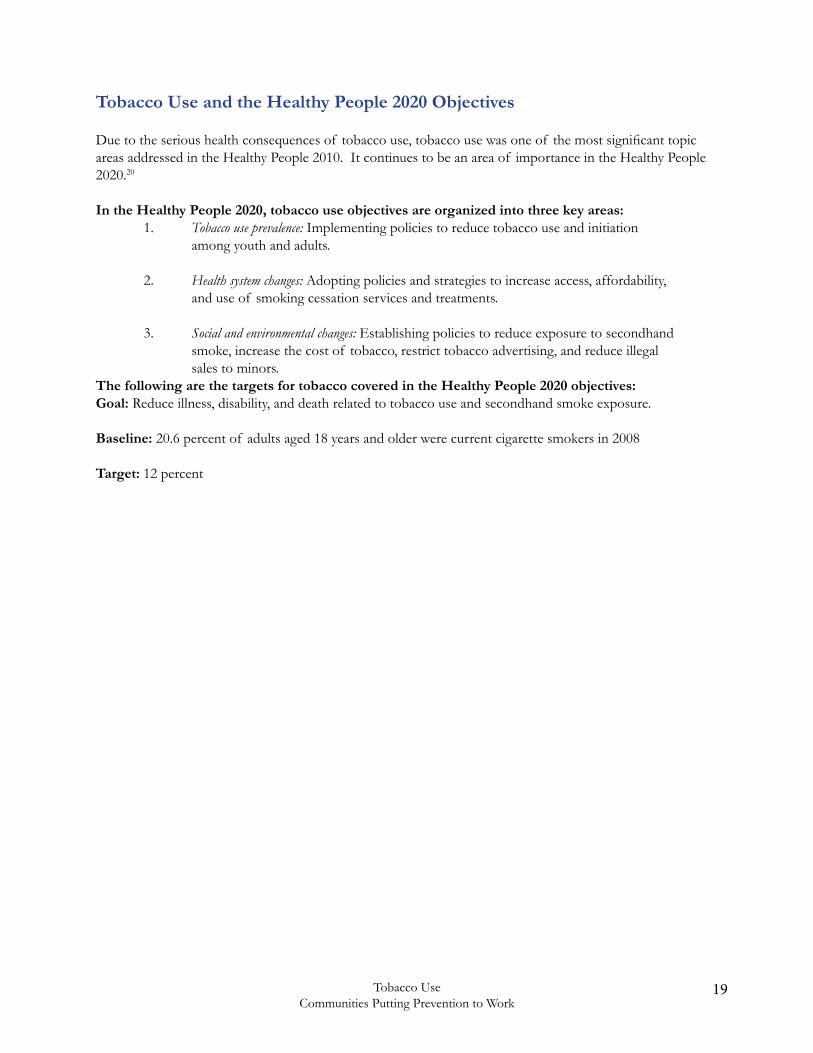
According to the 2010 BRFSS survey, adult tobacco use in the District was higher among males (18%) than females (13.6%) (Figure 2). The variation in tobacco use was also disproportionately higher among minori-ties, accounting for 37% among African Americans and 27% among Hispanics compared to (16%) Cauca-sians (Figure 3). Tobacco use among adults aged 45-54 years old was at least 6.6% higher than the other age groups (Figure 4). Tobacco use increased with decreasing income level. Tobacco use among people with an income of < $15,000 was 3.5 times (i.e., 38.5%) higher than the rate among those earning > $50,000 (11%) as shown in (Figure 5). Similar variations occurred for tobacco use by education level. Adults with less than a high school education used tobacco 3.5 times higher (31.7%) than those with college degrees (8.9%) (Figure 6).
Source: DC Behavioral Risk Factor Surveillance System (BRFSS) survey, 2010
16 Tobacco UseCommunities Putting Prevention to Work
Source: DC Behavioral Risk Factor Surveillance System (BRFSS), 2010
Source: DC Behavioral Risk Factor Surveillance System (BRFSS), 2010
17Tobacco UseCommunities Putting Prevention to Work
Source: DC Behavioral Risk Factor Surveillance System (BRFSS), 2010
Source: DC Behavioral Risk Factor Surveillance System (BRFSS), 2010
18 Tobacco UseCommunities Putting Prevention to Work
Health Burden
Tobacco use is the single most preventable cause of death and disease in the United States. Each year, an estimated 438,000 people in the U.S. die prematurely from smoking or exposure to secondhand smoke, and another 8.6 million have a serious illness caused by smoking.12
Because of exposure to secondhand smoke, an estimated 3,000 nonsmoking Americans die from lung cancer, more than 46,000 die from heart disease, and about 150,000 - 300,000 children younger than 18 months have lower respiratory tract infections annually.12
Smoking harms nearly every organ of the body and diminishes a person’s overall health. Smoking is the leading cause of cancer illness as well as deaths from cancer. It causes cancers of the lung, esophagus, larynx, mouth, throat, kidney, bladder, pancreas, stomach, and cervix, as well as acute myeloid leukemia.15 Smoking also causes heart disease, stroke, aortic aneurysm, chronic obstructive pulmonary disease (COPD) i.e., chronic bronchitis and emphysema, asthma, hip fractures, and cataracts. 16 During 2000 – 2004, smoking was the pri-mary causal factor for at least 30% of all cancer deaths, for nearly 80% of deaths from COPD, and for early cardiovascular diseases and deaths in the U.S.17
Smoking during pregnancy negatively affects the health of the mother and the baby. A pregnant smoker is at higher risk of having her baby born too early and with an abnormally low birth weight. A woman who smokes during or after pregnancy increases her infant’s risk of death from Sudden Infant Death Syndrome (SIDS).17, 18
According to a CDC estimate, the age-adjusted average annual smoking-attributable mortality rate for the District of Columbia during 1997 – 2001 was 257.3 persons per 100,000.19
Economic Burden
During 2000 - 2004, cigarette smoking was estimated to be responsible for $193 billion in annual health-relat-ed economic losses in the United States (nearly $96 billion in direct medical costs and an additional $97 billion in lost productivity). It also causes 5.1 million years of potential life lost annually.18
The average annual smoking-attributable productivity losses for the period 1997 – 2001 and smoking-attribut-able expenditures in 2008 for the District of Columbia were estimated to be $219,192,000 and $190,000,000, respectively.19
The 2012 U.S. Surgeon General report indicates that tobacco companies spend more than a million dollars an hour in this country alone to market their products.9
19Tobacco UseCommunities Putting Prevention to Work
Tobacco Use and the Healthy People 2020 Objectives
Due to the serious health consequences of tobacco use, tobacco use was one of the most significant topic areas addressed in the Healthy People 2010. It continues to be an area of importance in the Healthy People 2020.20
In the Healthy People 2020, tobacco use objectives are organized into three key areas: 1. Tobacco use prevalence: Implementing policies to reduce tobacco use and initiation among youth and adults.
2. Health system changes: Adopting policies and strategies to increase access, affordability, and use of smoking cessation services and treatments.
3. Social and environmental changes: Establishing policies to reduce exposure to secondhand smoke, increase the cost of tobacco, restrict tobacco advertising, and reduce illegal sales to minors.The following are the targets for tobacco covered in the Healthy People 2020 objectives: Goal: Reduce illness, disability, and death related to tobacco use and secondhand smoke exposure.
Baseline: 20.6 percent of adults aged 18 years and older were current cigarette smokers in 2008
Target: 12 percent
20 Tobacco UseCommunities Putting Prevention to Work
Communities Putting Prevention to Work
Prevalence of Adult Tobacco UseAs indicated in Table 1, 19.8% of the adults in the District of Columbia were more likely to use tobacco during the year 2010. Current and everyday smokers accounted for 13.3% followed by 6.5% occasional (some days) smokers.
Table 1. Adult Tobacco Use in the District of Columbia, 2010
Tobacco Use Estimate Unweighted CountNo 80.2% 1313
Yes 19.8% 178Total 1491Every day 13.3% 106Some days 6.5% 72Former smoker 22.7% 461Never smoked 57.5% 852Total 1491
N = Unweighted Count% = Weighted PercentageSource: 2010 District of Columbia Behavioral Risk Factor Surveillance System (BRFSS), Communities Putting Prevention to Work (CPPW) survey
Youth and Tobacco
The evidence is clear that clever marketing and strategic efforts to create a variety of tobacco flavors are some of the factors that influence youth interest and introduction to early smoking.
Each day in the United States, approximately 3,800 young people under 18 years of age smoke their first cig-arette, and an estimated 1,000 youth in that age group become daily cigarette smokers.16 Smoking at an early age leads to long-term adult smoking.21
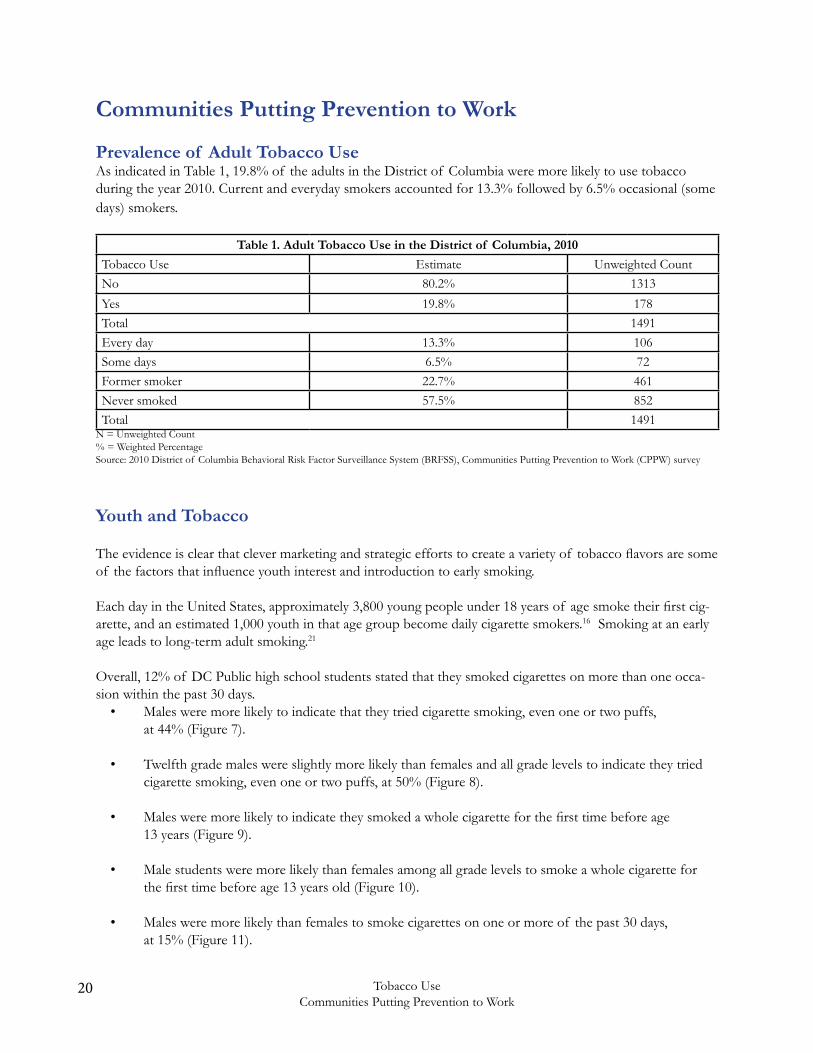
Overall, 12% of DC Public high school students stated that they smoked cigarettes on more than one occa-sion within the past 30 days. • Males were more likely to indicate that they tried cigarette smoking, even one or two puffs, at 44% (Figure 7).
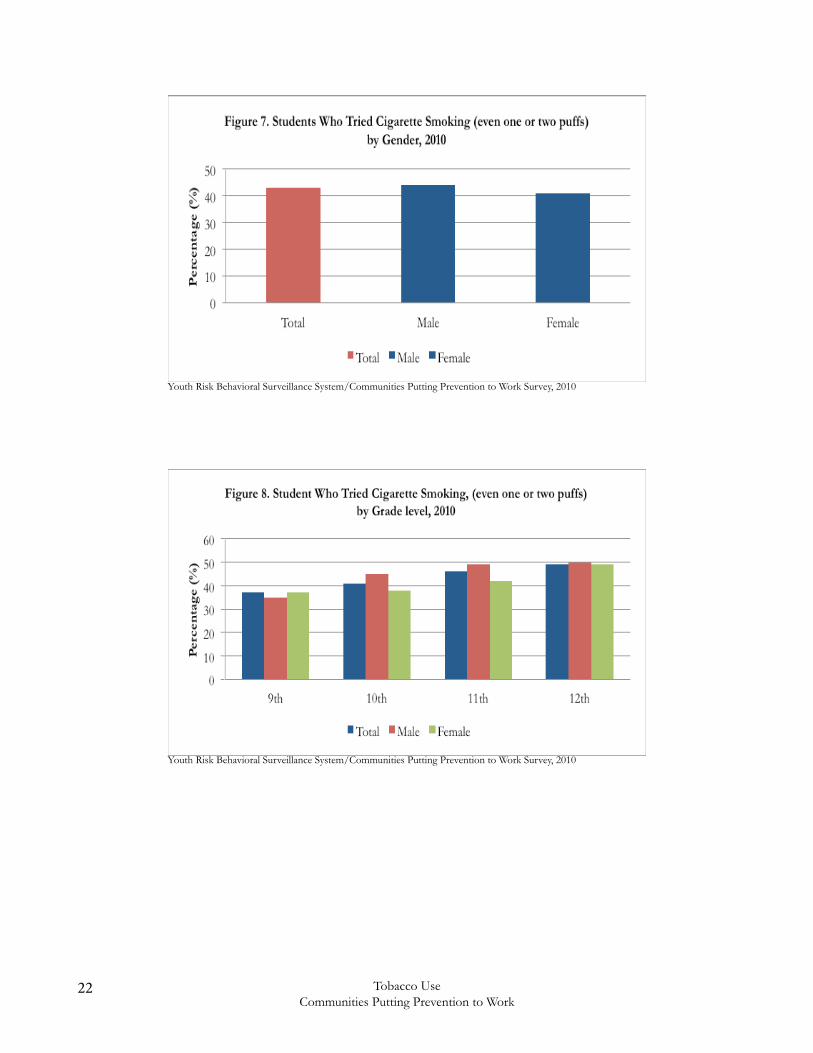
• Twelfth grade males were slightly more likely than females and all grade levels to indicate they tried cigarette smoking, even one or two puffs, at 50% (Figure 8).
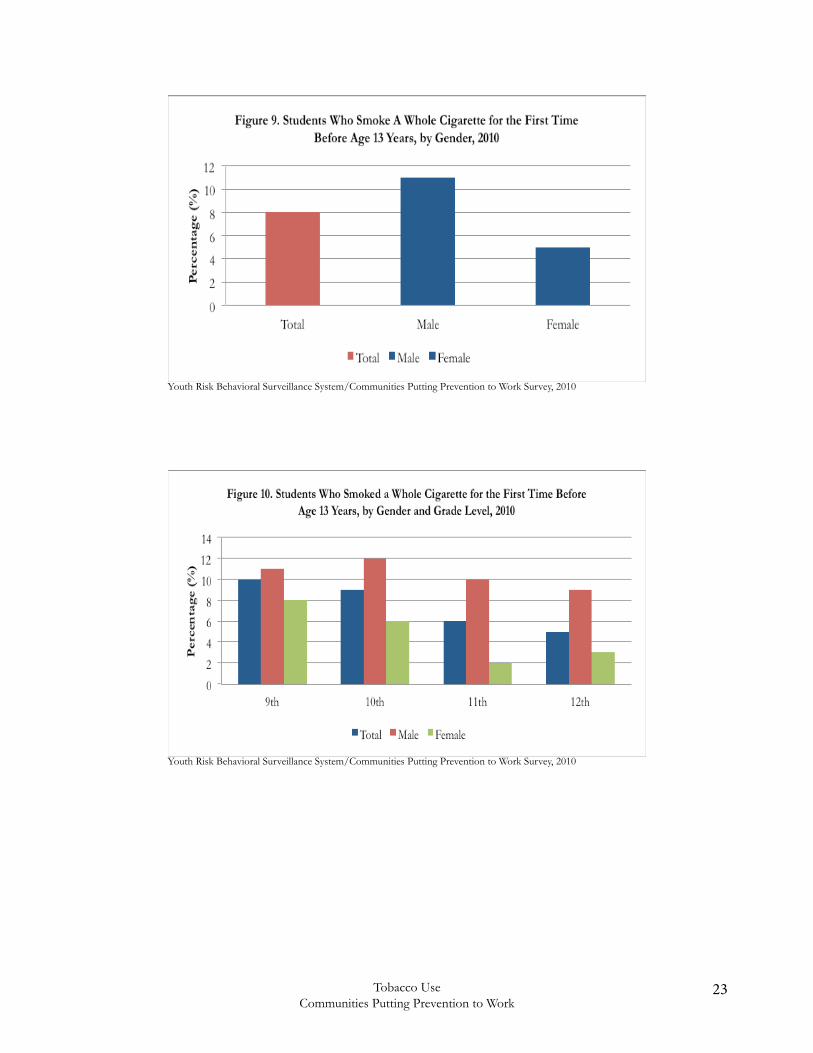
• Males were more likely to indicate they smoked a whole cigarette for the first time before age 13 years (Figure 9).
• Male students were more likely than females among all grade levels to smoke a whole cigarette for the first time before age 13 years old (Figure 10).
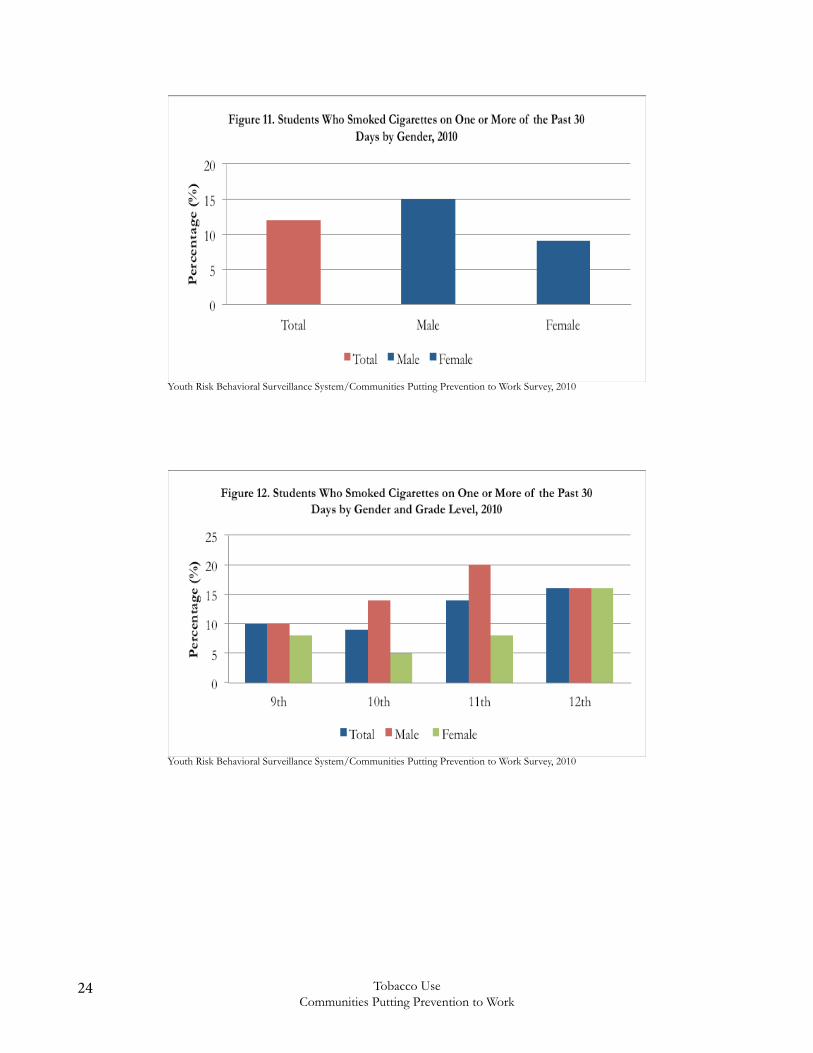
• Males were more likely than females to smoke cigarettes on one or more of the past 30 days, at 15% (Figure 11).

21Tobacco UseCommunities Putting Prevention to Work
• Eleventh grade males were more likely than females and all other grade levels to smoke cigarettes on one or more of the past 30 days, at 20% (Figure 12).
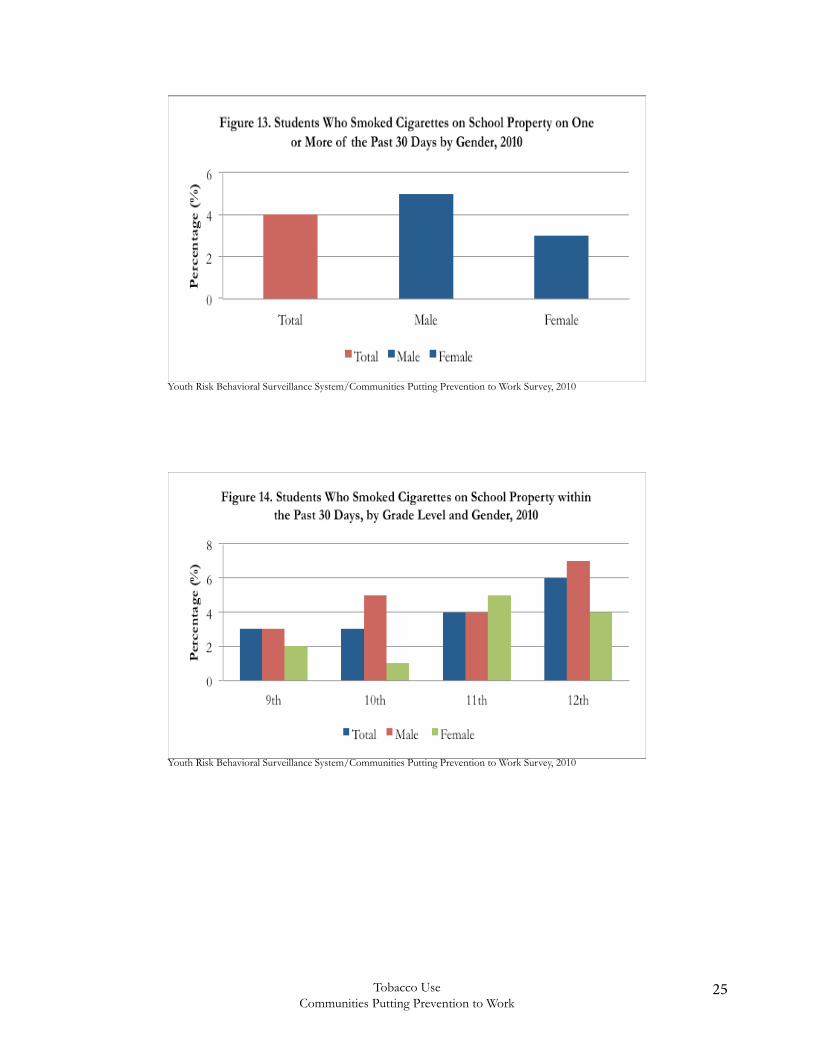
• Males were more likely than females to smoke cigarettes on school property on one or more of the past 30 days, at 5% ( Figure 13).
• Twelfth grade males were more likely than all other grade levels to smoke cigarettes on school property on one or more occasion of the past 30 days, at 7% (Figure 14).
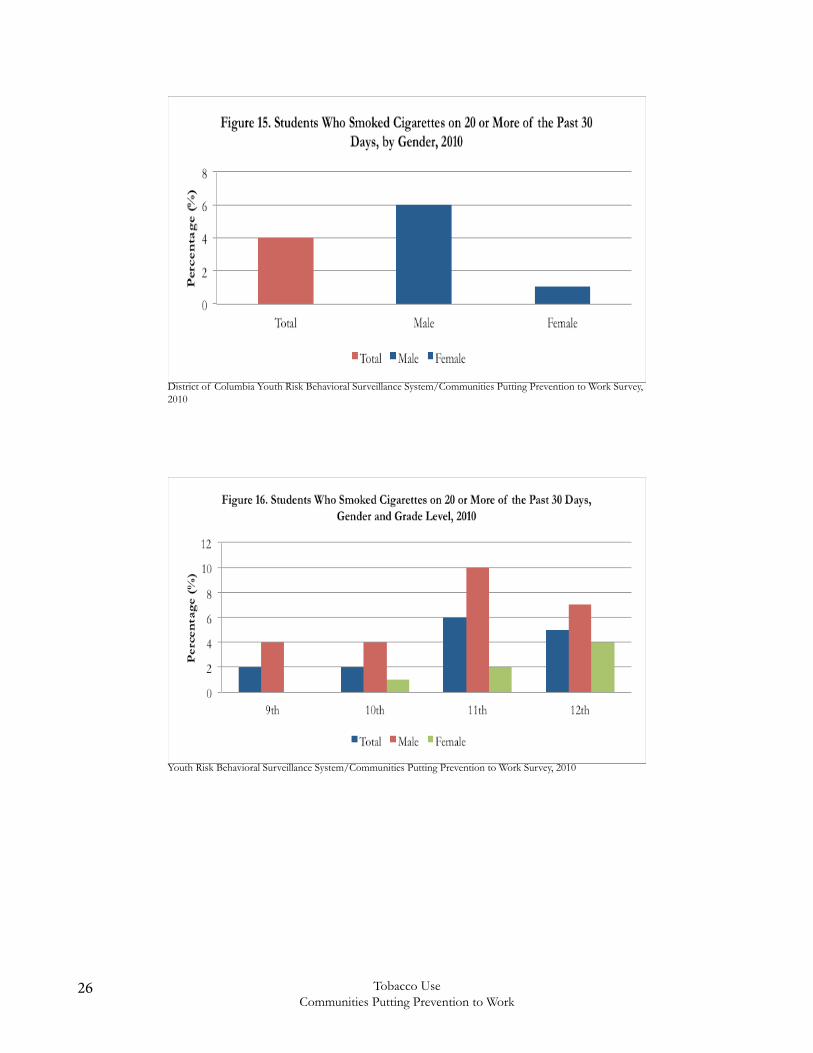
• Male students were more likely to indicate they smoked cigarettes on 20 or more occasions within the past 30 days, at 6% (Figure 15).
• Males in all grade levels were more likely than females to smoke cigarettes on 20 or more of the past 30 days (Figure 16).
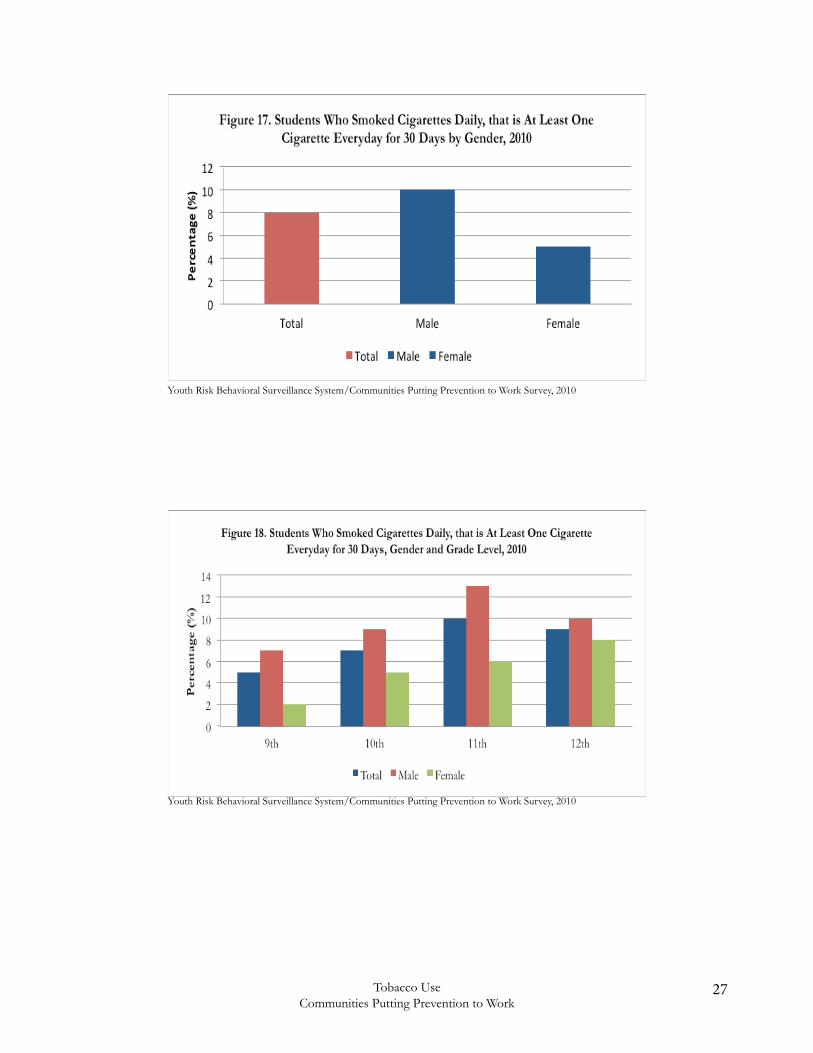
• Male students were more likely than females to smoke cigarettes daily, that is, at least one cigarette every day for 30 days, at 10% (Figure 17).
• Males in all grade levels were more likely than females to smoke cigarettes daily at least one cigarette everyday for 30 days (Figure 18).
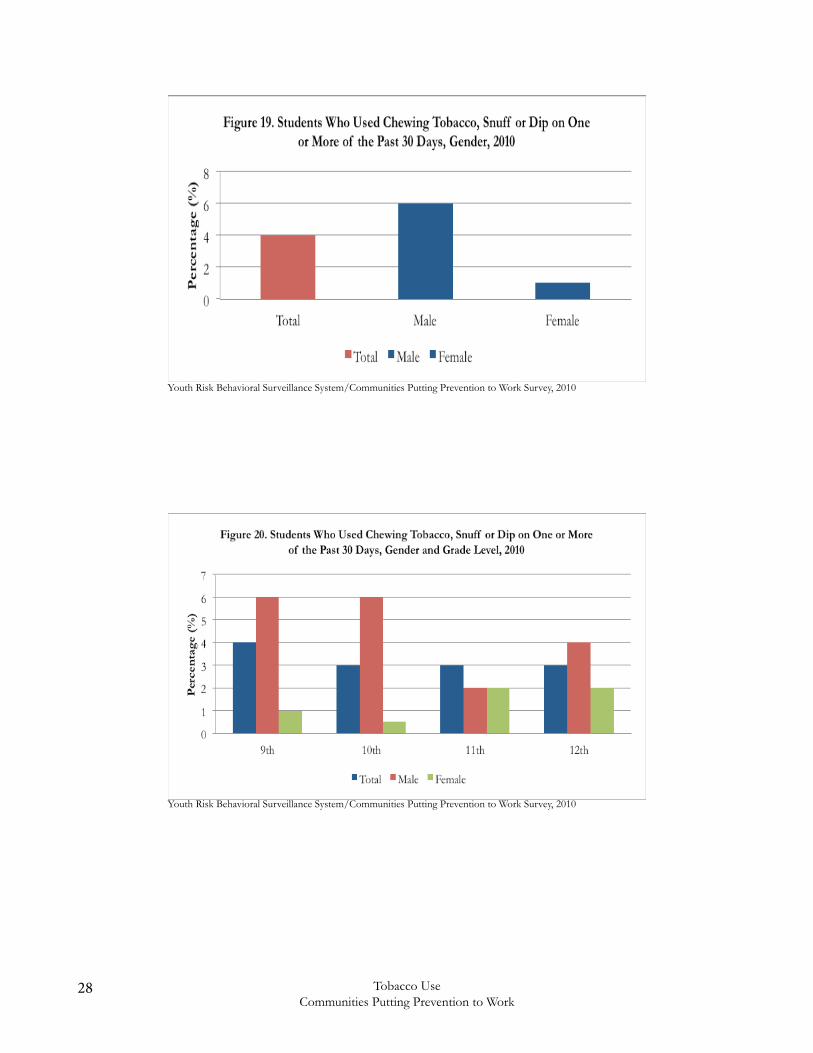
• Males were more likely than females to indicate they used chewing tobacco, snuff, or dip on one or more of the past 30 days, at 6% ( Figure 19).
• Ninth and 10th grade males were more likely than females at all grade levels to use chewing tobacco, snuff, or dip on one or more of the past 30 days, at 6% (Figure 20).
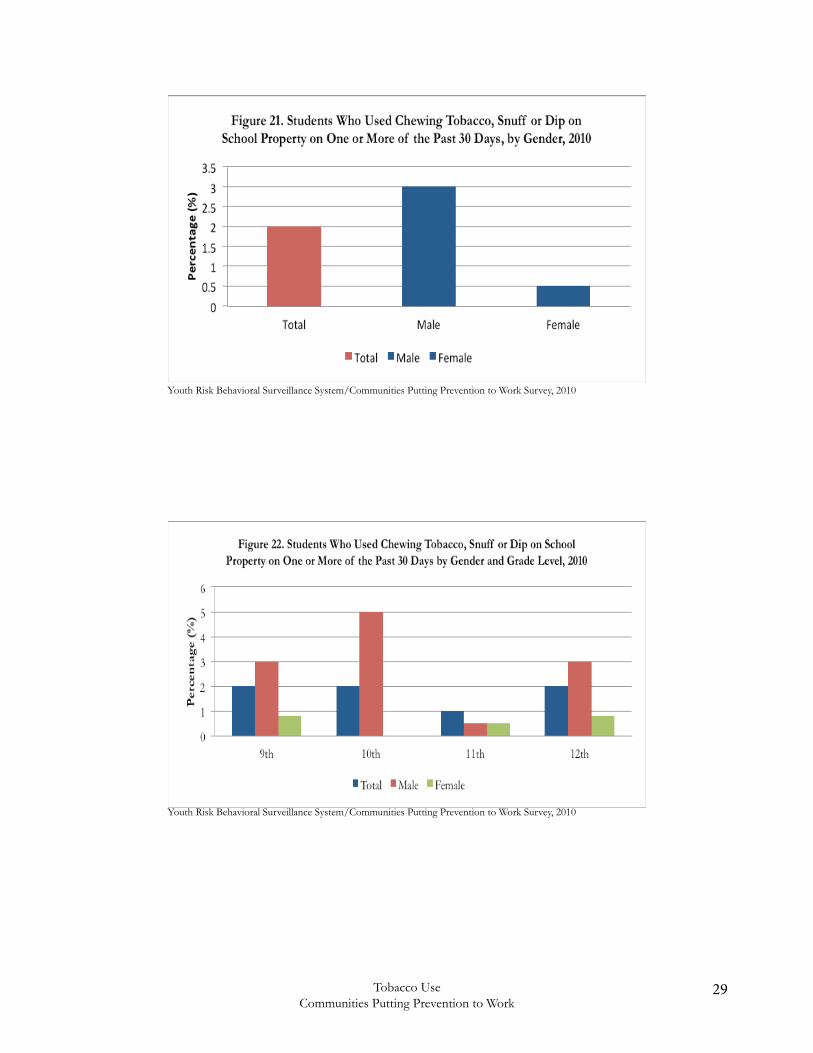
• Males were more likely than females to chew tobacco, snuff, or dip on school property one or more of the past 30 days, 3% (Figure 21). • Overall, males were more likely than females to chew tobacco, snuff, or dip on school property one or more of the past 30 days (Figure 22).
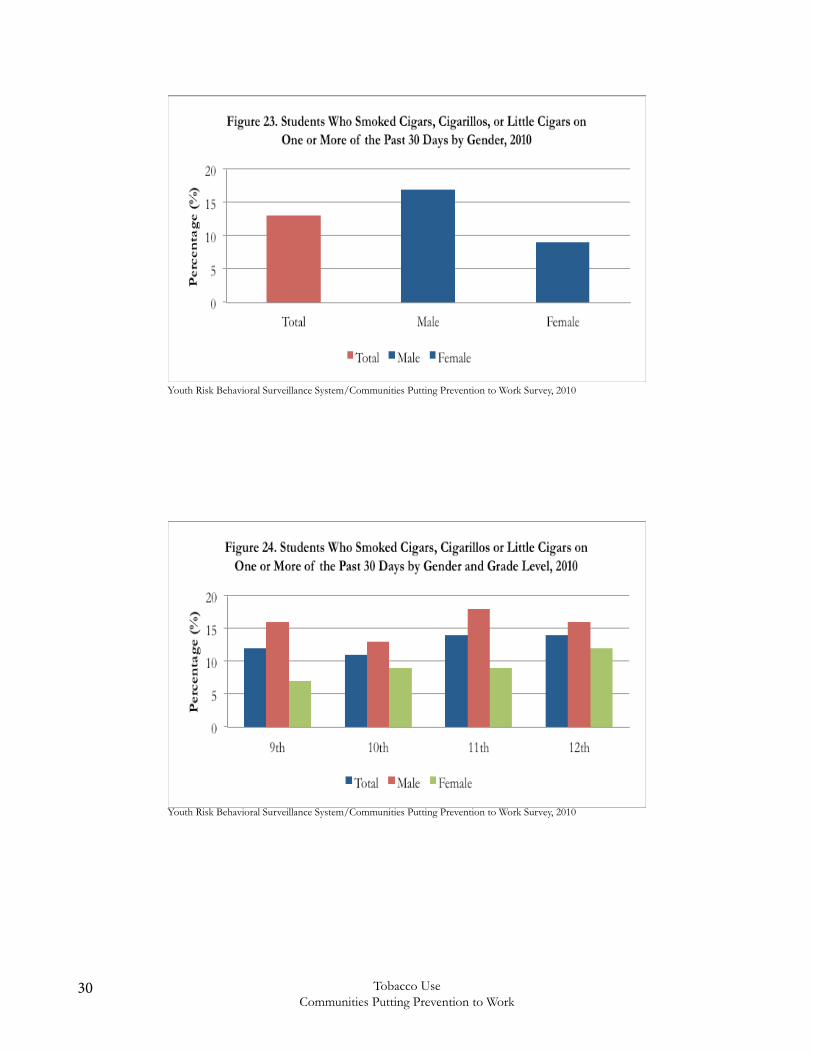
• Males were more likely than females to smoke cigars, cigarillos, or little cigars on one or more of the past 30 days, 17% (Figure 23).
• Males in all grade levels were more likely than females to smoke cigars, cigarillos, or little cigars on one or more of the past 30 days, at 18% (Figure 24).
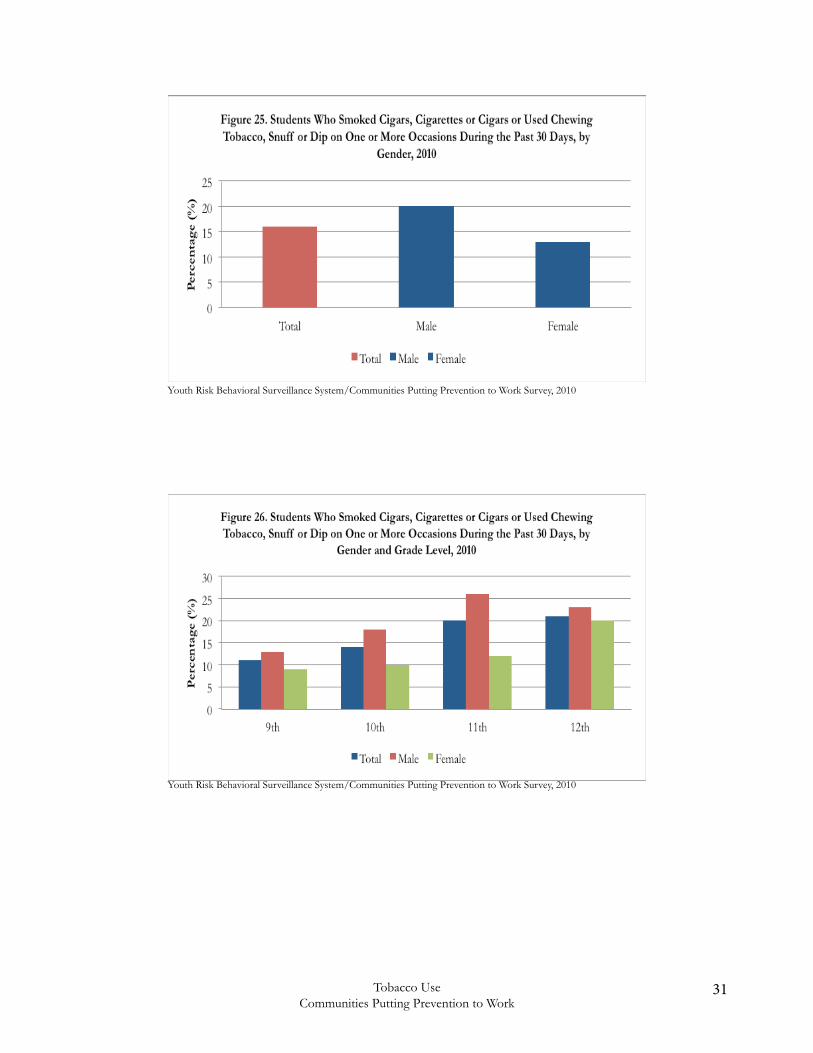
• Males were more likely than females to smoke cigarettes or cigars or cigars or used chewing tobacco, snuff, or dip on one or more of the past 30 days, at 20% (Figure 25).
• Males in all grade levels were more likely than females to smoke cigars, cigarettes, cigarillos or use chewing tobacco, snuff, or dip on one or more of the past 30 days (Figure 26).
22 Tobacco UseCommunities Putting Prevention to Work
Youth Risk Behavioral Surveillance System/Communities Putting Prevention to Work Survey, 2010
Youth Risk Behavioral Surveillance System/Communities Putting Prevention to Work Survey, 2010
23Tobacco UseCommunities Putting Prevention to Work
Youth Risk Behavioral Surveillance System/Communities Putting Prevention to Work Survey, 2010
Youth Risk Behavioral Surveillance System/Communities Putting Prevention to Work Survey, 2010
24 Tobacco UseCommunities Putting Prevention to Work
Youth Risk Behavioral Surveillance System/Communities Putting Prevention to Work Survey, 2010
Youth Risk Behavioral Surveillance System/Communities Putting Prevention to Work Survey, 2010
25Tobacco UseCommunities Putting Prevention to Work
Youth Risk Behavioral Surveillance System/Communities Putting Prevention to Work Survey, 2010
Youth Risk Behavioral Surveillance System/Communities Putting Prevention to Work Survey, 2010
26 Tobacco UseCommunities Putting Prevention to Work
Youth Risk Behavioral Surveillance System/Communities Putting Prevention to Work Survey, 2010
District of Columbia Youth Risk Behavioral Surveillance System/Communities Putting Prevention to Work Survey, 2010
27Tobacco UseCommunities Putting Prevention to Work
Youth Risk Behavioral Surveillance System/Communities Putting Prevention to Work Survey, 2010
Youth Risk Behavioral Surveillance System/Communities Putting Prevention to Work Survey, 2010
28 Tobacco UseCommunities Putting Prevention to Work
Youth Risk Behavioral Surveillance System/Communities Putting Prevention to Work Survey, 2010
Youth Risk Behavioral Surveillance System/Communities Putting Prevention to Work Survey, 2010
29Tobacco UseCommunities Putting Prevention to Work
Youth Risk Behavioral Surveillance System/Communities Putting Prevention to Work Survey, 2010
Youth Risk Behavioral Surveillance System/Communities Putting Prevention to Work Survey, 2010
30 Tobacco UseCommunities Putting Prevention to Work
Youth Risk Behavioral Surveillance System/Communities Putting Prevention to Work Survey, 2010
Youth Risk Behavioral Surveillance System/Communities Putting Prevention to Work Survey, 2010
31Tobacco UseCommunities Putting Prevention to Work
Youth Risk Behavioral Surveillance System/Communities Putting Prevention to Work Survey, 2010
Youth Risk Behavioral Surveillance System/Communities Putting Prevention to Work Survey, 2010
32 Tobacco UseCommunities Putting Prevention to Work
Demographic Disparity in Tobacco Use
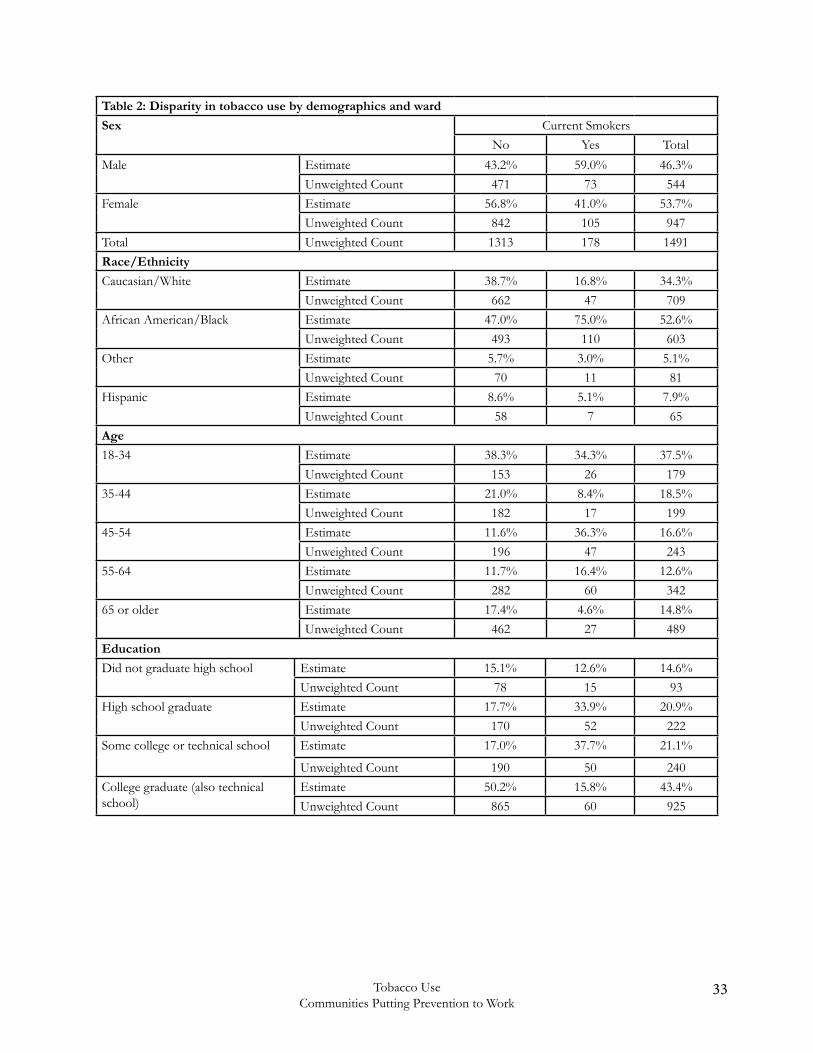
According to the BRFSS/CPPW survey, adult males were more likely to use tobacco (59%) than females (41%). The rate of tobacco use was higher among adults aged 45 – 54 years old (36.3%) followed by 18 – 34 years old (34.3%). Adults 65 years or older were less likely to use tobacco (4.6%) (Table 2).
The disparity in tobacco use by race/ethnicity is staggering; 75% of African Americans use tobacco, fol-lowed by Caucasians (16%), Hispanic (5.1%), and Other race/ethnic group (3%). This indicates that the rate of tobacco use among African Americans was 4.7 times higher than Caucasians and 14.7 times higher than Hispanic respondents.
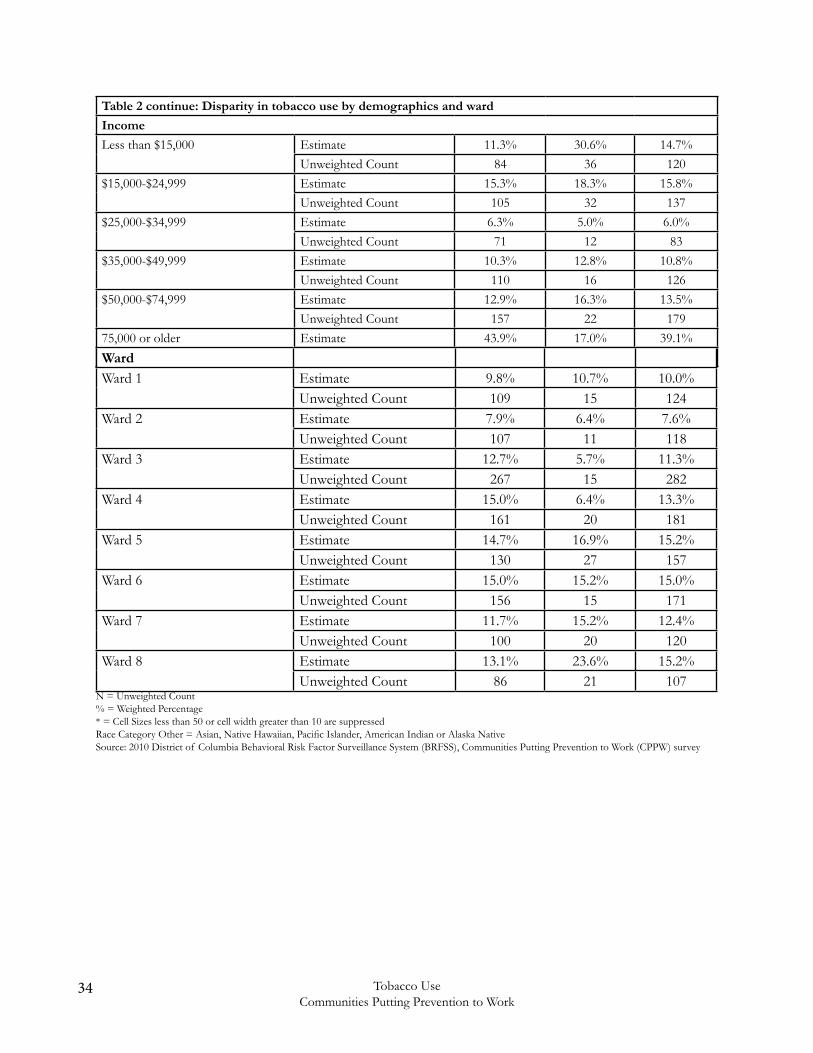
The rate of tobacco use was different by the level of education, income, marital status, and ward (Table 2). Adults with some college/technical school education were more likely to use tobacco (37.7%), followed by high school graduates (33.9%), college graduates (15.8%), and adults with less than a high school education (12.6%). The rate of tobacco use was higher among adults with the lowest household income (<$15,000, 30.6%), followed by adults with a household income of $15,000 - $24,999 (18.3%).
Adults who resided in Ward 8 had higher rate of tobacco use (23.6%) followed by Ward 5 (16.9%), Wards 6 (15.2%) and 7 (15.2%), (Table 2).
33Tobacco UseCommunities Putting Prevention to Work
Table 2: Disparity in tobacco use by demographics and ward
Sex Current SmokersNo Yes Total
Male Estimate 43.2% 59.0% 46.3%Unweighted Count 471 73 544
Female Estimate 56.8% 41.0% 53.7%Unweighted Count 842 105 947
Total Unweighted Count 1313 178 1491Race/Ethnicity
Caucasian/White Estimate 38.7% 16.8% 34.3%Unweighted Count 662 47 709
African American/Black Estimate 47.0% 75.0% 52.6%Unweighted Count 493 110 603
Other Estimate 5.7% 3.0% 5.1%Unweighted Count 70 11 81
Hispanic Estimate 8.6% 5.1% 7.9%Unweighted Count 58 7 65
Age
18-34 Estimate 38.3% 34.3% 37.5%Unweighted Count 153 26 179
35-44 Estimate 21.0% 8.4% 18.5%Unweighted Count 182 17 199
45-54 Estimate 11.6% 36.3% 16.6%Unweighted Count 196 47 243
55-64 Estimate 11.7% 16.4% 12.6%Unweighted Count 282 60 342
65 or older Estimate 17.4% 4.6% 14.8%Unweighted Count 462 27 489
Education
Did not graduate high school Estimate 15.1% 12.6% 14.6%Unweighted Count 78 15 93
High school graduate Estimate 17.7% 33.9% 20.9%Unweighted Count 170 52 222
Some college or technical school Estimate 17.0% 37.7% 21.1%
Unweighted Count 190 50 240College graduate (also technical school)
Estimate 50.2% 15.8% 43.4%Unweighted Count 865 60 925
34 Tobacco UseCommunities Putting Prevention to Work
Table 2 continue: Disparity in tobacco use by demographics and ward
Income
Less than $15,000 Estimate 11.3% 30.6% 14.7%Unweighted Count 84 36 120
$15,000-$24,999 Estimate 15.3% 18.3% 15.8%Unweighted Count 105 32 137
$25,000-$34,999 Estimate 6.3% 5.0% 6.0%Unweighted Count 71 12 83
$35,000-$49,999 Estimate 10.3% 12.8% 10.8%Unweighted Count 110 16 126
$50,000-$74,999 Estimate 12.9% 16.3% 13.5%Unweighted Count 157 22 179
75,000 or older Estimate 43.9% 17.0% 39.1%Unweighted Count 583 38 621Ward
Ward 1 Estimate 9.8% 10.7% 10.0%Unweighted Count 109 15 124
Ward 2 Estimate 7.9% 6.4% 7.6%Unweighted Count 107 11 118
Ward 3 Estimate 12.7% 5.7% 11.3%Unweighted Count 267 15 282
Ward 4 Estimate 15.0% 6.4% 13.3%Unweighted Count 161 20 181
Ward 5 Estimate 14.7% 16.9% 15.2%Unweighted Count 130 27 157
Ward 6 Estimate 15.0% 15.2% 15.0%Unweighted Count 156 15 171
Ward 7 Estimate 11.7% 15.2% 12.4%Unweighted Count 100 20 120
Ward 8 Estimate 13.1% 23.6% 15.2%Unweighted Count 86 21 107
N = Unweighted Count% = Weighted Percentage* = Cell Sizes less than 50 or cell width greater than 10 are suppressedRace Category Other = Asian, Native Hawaiian, Pacific Islander, American Indian or Alaska NativeSource: 2010 District of Columbia Behavioral Risk Factor Surveillance System (BRFSS), Communities Putting Prevention to Work (CPPW) survey
35Tobacco UseCommunities Putting Prevention to Work
Secondhand Smoking
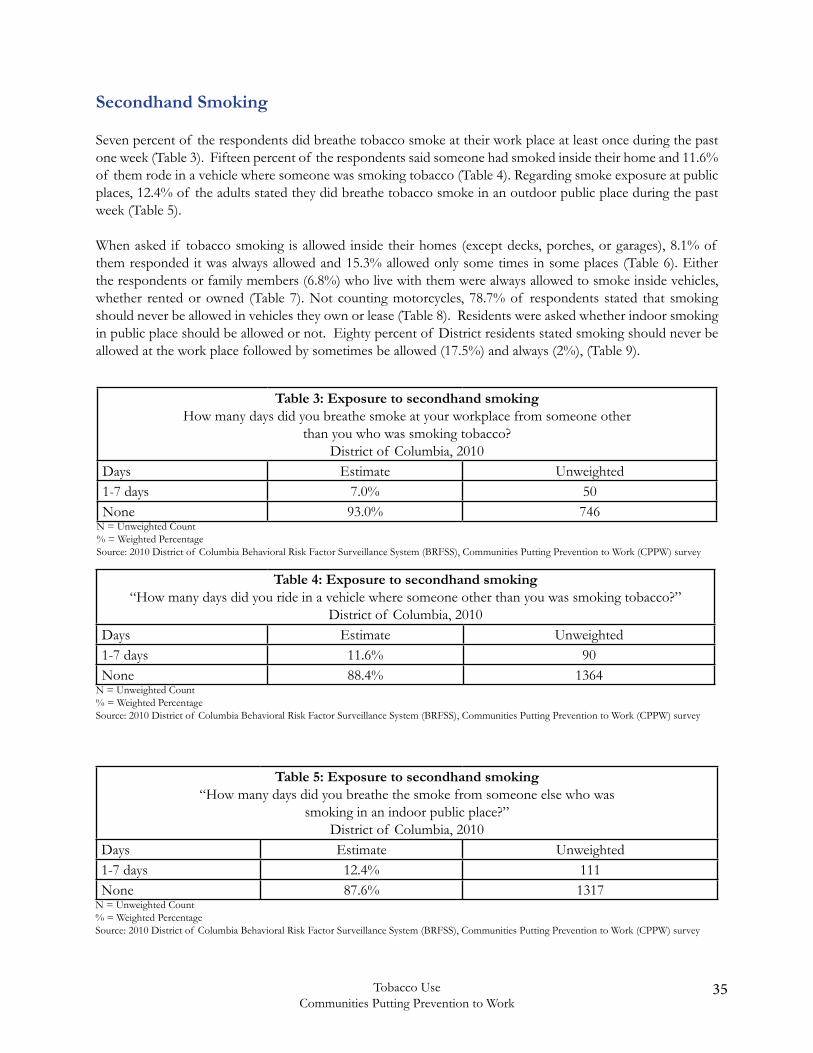
Seven percent of the respondents did breathe tobacco smoke at their work place at least once during the past one week (Table 3). Fifteen percent of the respondents said someone had smoked inside their home and 11.6% of them rode in a vehicle where someone was smoking tobacco (Table 4). Regarding smoke exposure at public places, 12.4% of the adults stated they did breathe tobacco smoke in an outdoor public place during the past week (Table 5).
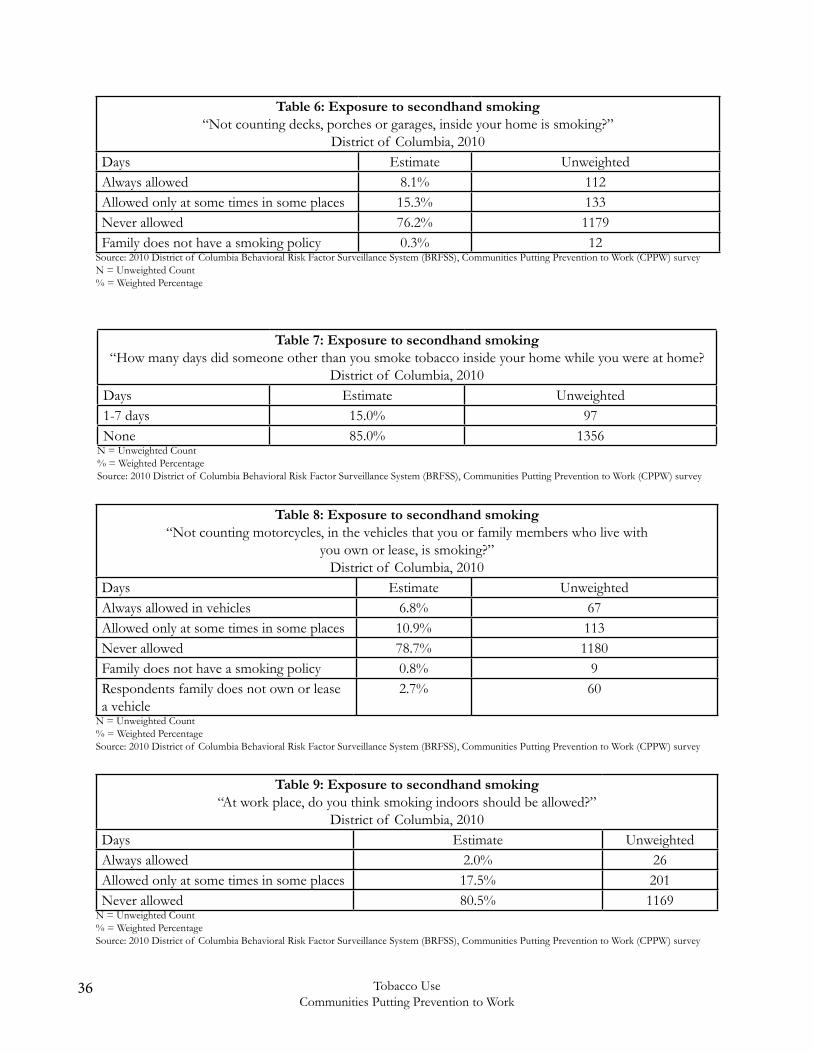
When asked if tobacco smoking is allowed inside their homes (except decks, porches, or garages), 8.1% of them responded it was always allowed and 15.3% allowed only some times in some places (Table 6). Either the respondents or family members (6.8%) who live with them were always allowed to smoke inside vehicles, whether rented or owned (Table 7). Not counting motorcycles, 78.7% of respondents stated that smoking should never be allowed in vehicles they own or lease (Table 8). Residents were asked whether indoor smoking in public place should be allowed or not. Eighty percent of District residents stated smoking should never be allowed at the work place followed by sometimes be allowed (17.5%) and always (2%), (Table 9).
Table 3: Exposure to secondhand smokingHow many days did you breathe smoke at your workplace from someone other
than you who was smoking tobacco?District of Columbia, 2010
Days Estimate Unweighted 1-7 days 7.0% 50None 93.0% 746
N = Unweighted Count% = Weighted PercentageSource: 2010 District of Columbia Behavioral Risk Factor Surveillance System (BRFSS), Communities Putting Prevention to Work (CPPW) survey
Table 4: Exposure to secondhand smoking“How many days did you ride in a vehicle where someone other than you was smoking tobacco?”
District of Columbia, 2010Days Estimate Unweighted 1-7 days 11.6% 90None 88.4% 1364
N = Unweighted Count% = Weighted PercentageSource: 2010 District of Columbia Behavioral Risk Factor Surveillance System (BRFSS), Communities Putting Prevention to Work (CPPW) survey
Table 5: Exposure to secondhand smoking“How many days did you breathe the smoke from someone else who was
smoking in an indoor public place?”District of Columbia, 2010
Days Estimate Unweighted 1-7 days 12.4% 111None 87.6% 1317
N = Unweighted Count% = Weighted PercentageSource: 2010 District of Columbia Behavioral Risk Factor Surveillance System (BRFSS), Communities Putting Prevention to Work (CPPW) survey
36 Tobacco UseCommunities Putting Prevention to Work
Table 7: Exposure to secondhand smoking“How many days did someone other than you smoke tobacco inside your home while you were at home?
District of Columbia, 2010Days Estimate Unweighted 1-7 days 15.0% 97None 85.0% 1356
N = Unweighted Count% = Weighted PercentageSource: 2010 District of Columbia Behavioral Risk Factor Surveillance System (BRFSS), Communities Putting Prevention to Work (CPPW) survey
Table 6: Exposure to secondhand smoking“Not counting decks, porches or garages, inside your home is smoking?”
District of Columbia, 2010Days Estimate Unweighted Always allowed 8.1% 112Allowed only at some times in some places 15.3% 133Never allowed 76.2% 1179Family does not have a smoking policy 0.3% 12
Source: 2010 District of Columbia Behavioral Risk Factor Surveillance System (BRFSS), Communities Putting Prevention to Work (CPPW) surveyN = Unweighted Count% = Weighted Percentage
Table 8: Exposure to secondhand smoking“Not counting motorcycles, in the vehicles that you or family members who live with
you own or lease, is smoking?”District of Columbia, 2010
Days Estimate Unweighted Always allowed in vehicles 6.8% 67Allowed only at some times in some places 10.9% 113Never allowed 78.7% 1180Family does not have a smoking policy 0.8% 9Respondents family does not own or lease a vehicle
2.7% 60
N = Unweighted Count% = Weighted PercentageSource: 2010 District of Columbia Behavioral Risk Factor Surveillance System (BRFSS), Communities Putting Prevention to Work (CPPW) survey
Table 9: Exposure to secondhand smoking“At work place, do you think smoking indoors should be allowed?”
District of Columbia, 2010Days Estimate Unweighted Always allowed 2.0% 26Allowed only at some times in some places 17.5% 201Never allowed 80.5% 1169
N = Unweighted Count% = Weighted PercentageSource: 2010 District of Columbia Behavioral Risk Factor Surveillance System (BRFSS), Communities Putting Prevention to Work (CPPW) survey
37Tobacco UseCommunities Putting Prevention to Work
Smoking Cessation
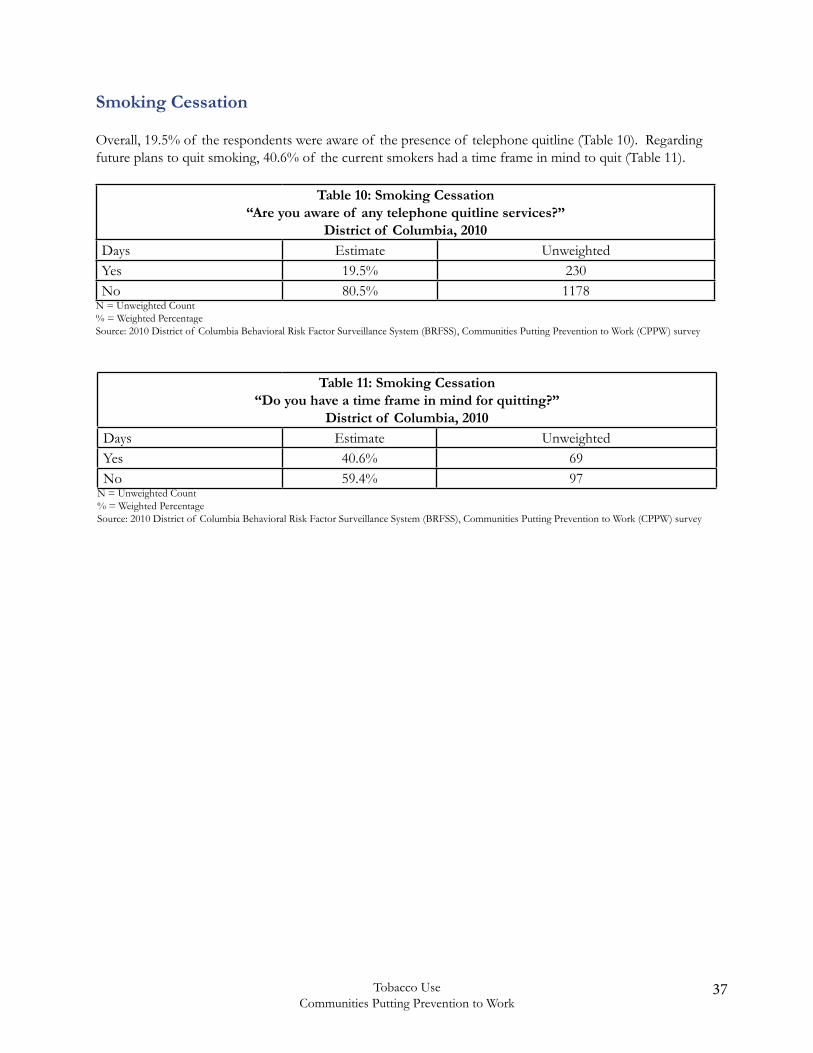
Overall, 19.5% of the respondents were aware of the presence of telephone quitline (Table 10). Regarding future plans to quit smoking, 40.6% of the current smokers had a time frame in mind to quit (Table 11).
Table 10: Smoking Cessation“Are you aware of any telephone quitline services?”
District of Columbia, 2010Days Estimate Unweighted Yes 19.5% 230No 80.5% 1178
N = Unweighted Count% = Weighted PercentageSource: 2010 District of Columbia Behavioral Risk Factor Surveillance System (BRFSS), Communities Putting Prevention to Work (CPPW) survey
Table 11: Smoking Cessation“Do you have a time frame in mind for quitting?”
District of Columbia, 2010Days Estimate Unweighted Yes 40.6% 69No 59.4% 97
N = Unweighted Count% = Weighted PercentageSource: 2010 District of Columbia Behavioral Risk Factor Surveillance System (BRFSS), Communities Putting Prevention to Work (CPPW) survey
38 Tobacco UseCommunities Putting Prevention to Work
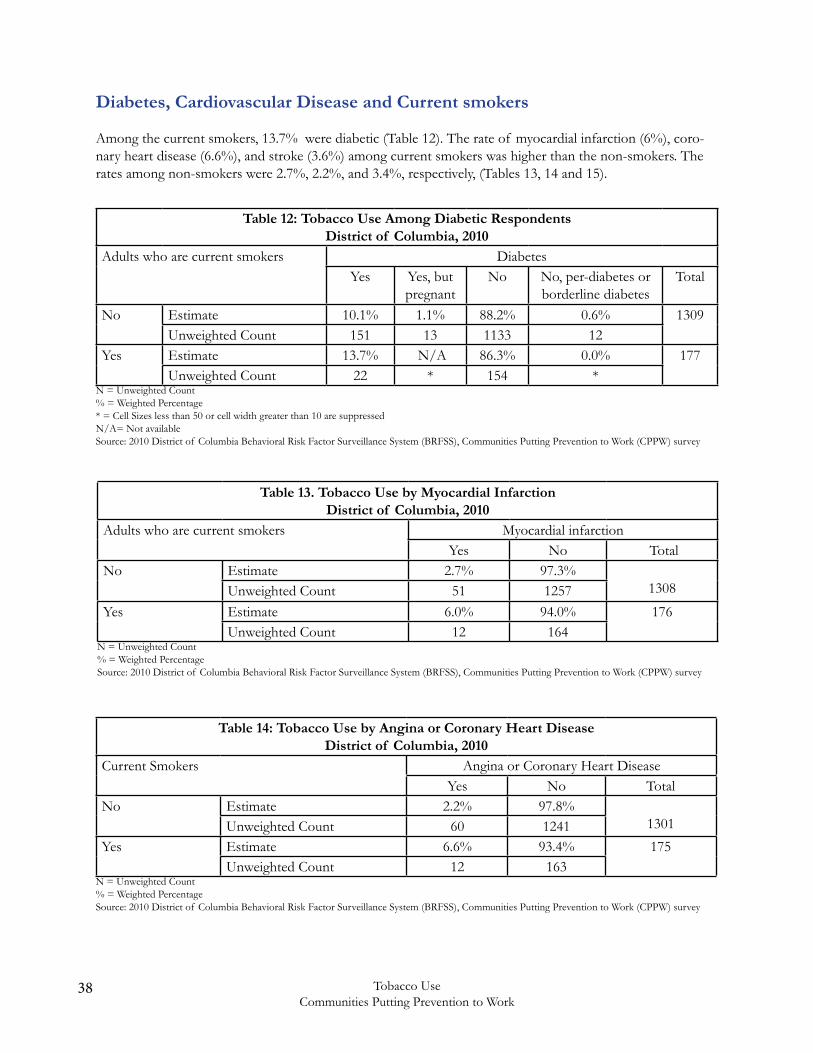
Diabetes, Cardiovascular Disease and Current smokers
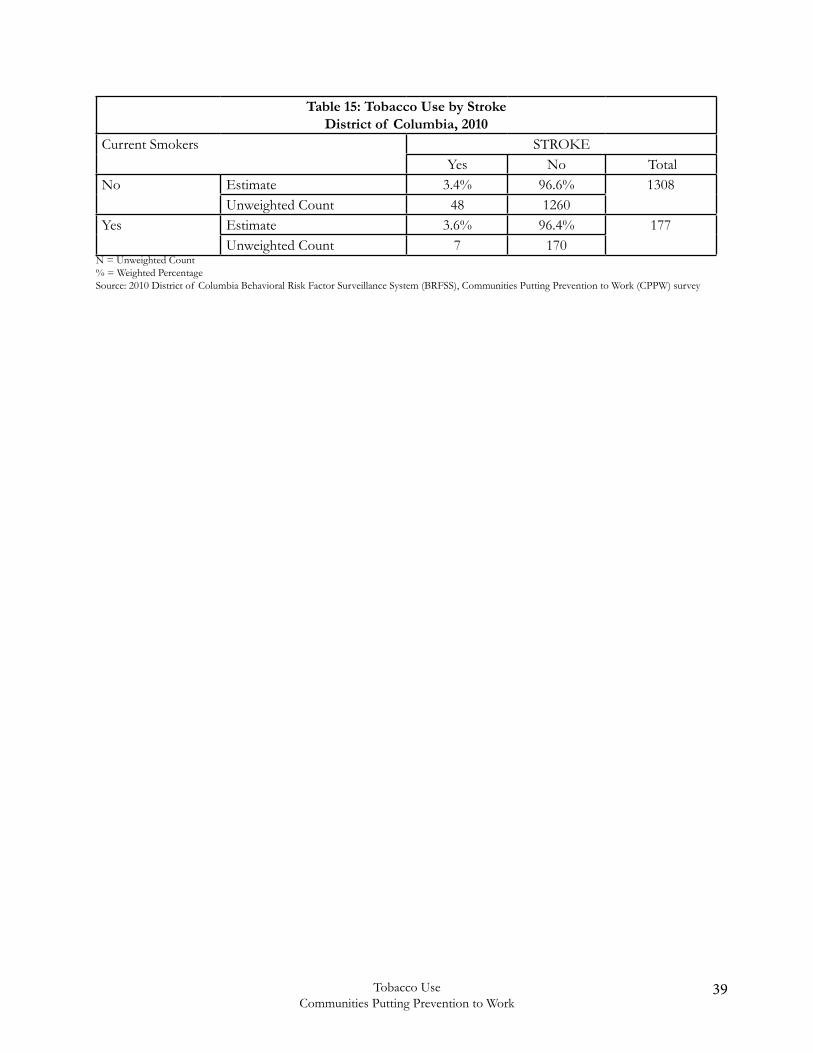
Among the current smokers, 13.7% were diabetic (Table 12). The rate of myocardial infarction (6%), coro-nary heart disease (6.6%), and stroke (3.6%) among current smokers was higher than the non-smokers. The rates among non-smokers were 2.7%, 2.2%, and 3.4%, respectively, (Tables 13, 14 and 15).
Table 12: Tobacco Use Among Diabetic RespondentsDistrict of Columbia, 2010
Adults who are current smokers DiabetesYes Yes, but
pregnantNo No, per-diabetes or
borderline diabetesTotal
No Estimate 10.1% 1.1% 88.2% 0.6% 1309Unweighted Count 151 13 1133 12
Yes Estimate 13.7% N/A 86.3% 0.0% 177Unweighted Count 22 * 154 *
N = Unweighted Count% = Weighted Percentage* = Cell Sizes less than 50 or cell width greater than 10 are suppressedN/A= Not availableSource: 2010 District of Columbia Behavioral Risk Factor Surveillance System (BRFSS), Communities Putting Prevention to Work (CPPW) survey
Table 13. Tobacco Use by Myocardial InfarctionDistrict of Columbia, 2010
Adults who are current smokers Myocardial infarctionYes No Total
No Estimate 2.7% 97.3%1308Unweighted Count 51 1257
Yes Estimate 6.0% 94.0% 176Unweighted Count 12 164
N = Unweighted Count% = Weighted PercentageSource: 2010 District of Columbia Behavioral Risk Factor Surveillance System (BRFSS), Communities Putting Prevention to Work (CPPW) survey
Table 14: Tobacco Use by Angina or Coronary Heart DiseaseDistrict of Columbia, 2010
Current Smokers Angina or Coronary Heart DiseaseYes No Total
No Estimate 2.2% 97.8%1301Unweighted Count 60 1241
Yes Estimate 6.6% 93.4% 175Unweighted Count 12 163
N = Unweighted Count% = Weighted PercentageSource: 2010 District of Columbia Behavioral Risk Factor Surveillance System (BRFSS), Communities Putting Prevention to Work (CPPW) survey
39Tobacco UseCommunities Putting Prevention to Work
Table 15: Tobacco Use by StrokeDistrict of Columbia, 2010
Current Smokers STROKEYes No Total
No Estimate 3.4% 96.6% 1308Unweighted Count 48 1260
Yes Estimate 3.6% 96.4% 177Unweighted Count 7 170
N = Unweighted Count% = Weighted PercentageSource: 2010 District of Columbia Behavioral Risk Factor Surveillance System (BRFSS), Communities Putting Prevention to Work (CPPW) survey
40 Tobacco UseCommunities Putting Prevention to Work
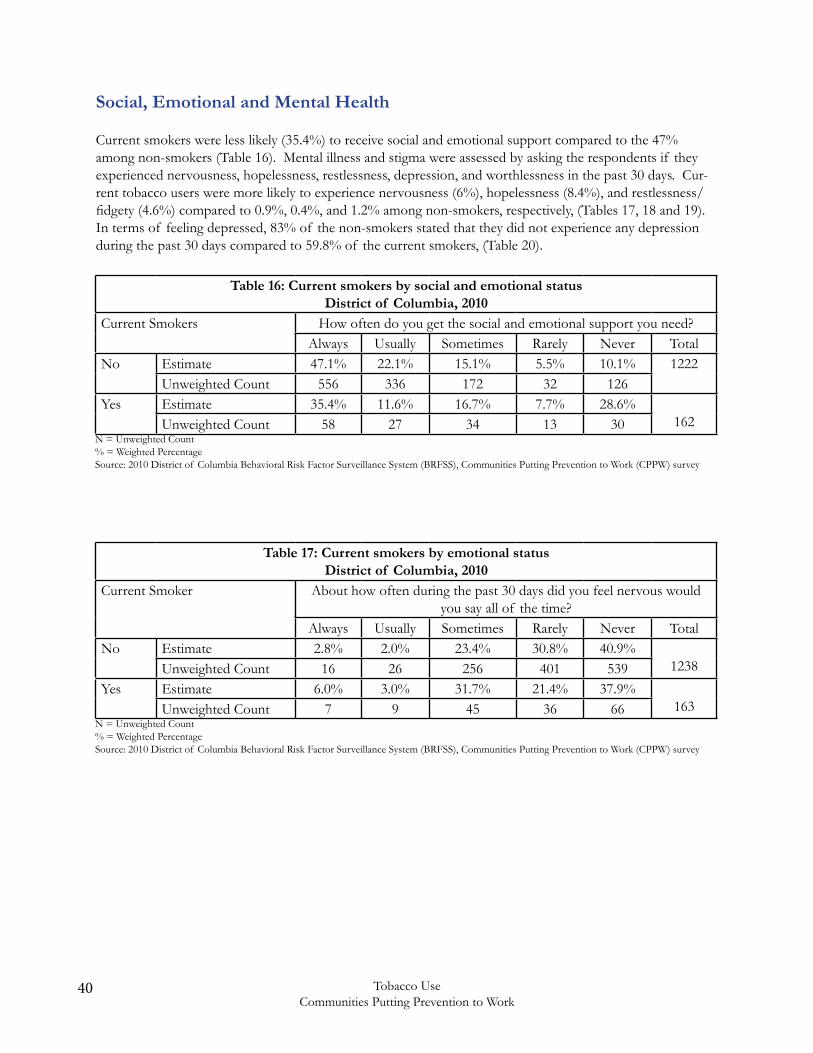
Social, Emotional and Mental Health
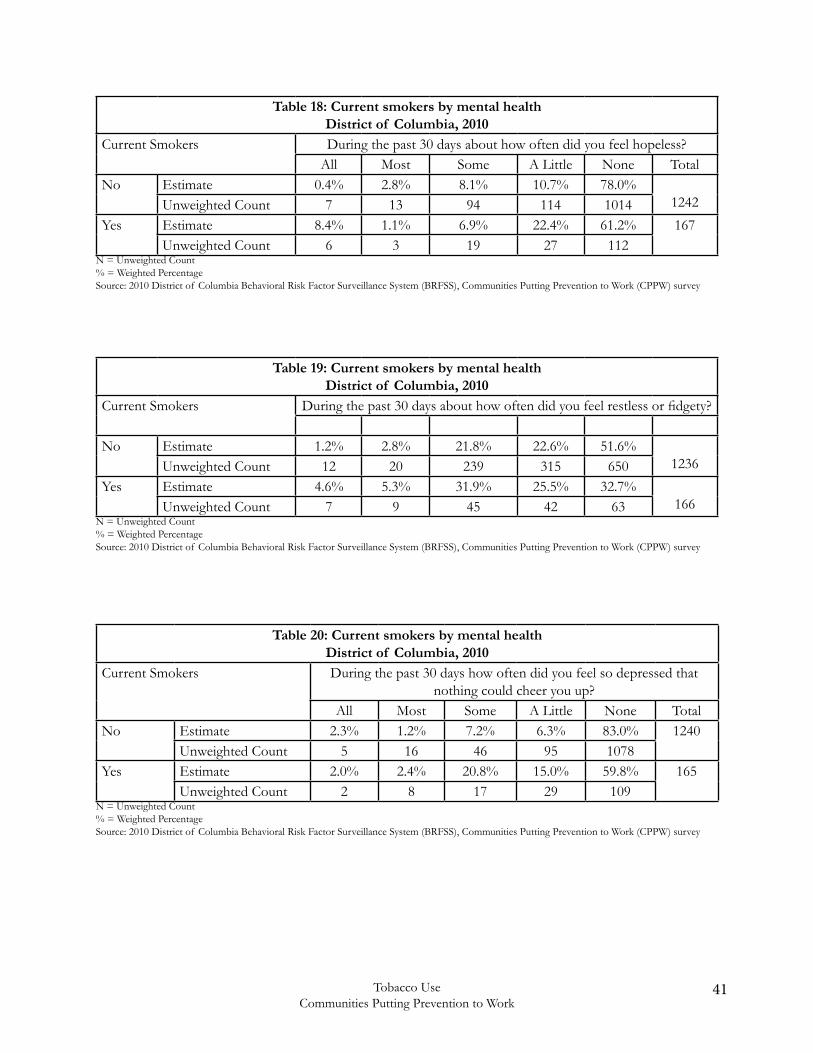
Current smokers were less likely (35.4%) to receive social and emotional support compared to the 47% among non-smokers (Table 16). Mental illness and stigma were assessed by asking the respondents if they experienced nervousness, hopelessness, restlessness, depression, and worthlessness in the past 30 days. Cur-rent tobacco users were more likely to experience nervousness (6%), hopelessness (8.4%), and restlessness/fidgety (4.6%) compared to 0.9%, 0.4%, and 1.2% among non-smokers, respectively, (Tables 17, 18 and 19). In terms of feeling depressed, 83% of the non-smokers stated that they did not experience any depression during the past 30 days compared to 59.8% of the current smokers, (Table 20).
Table 16: Current smokers by social and emotional statusDistrict of Columbia, 2010
Current Smokers How often do you get the social and emotional support you need?Always Usually Sometimes Rarely Never Total
No Estimate 47.1% 22.1% 15.1% 5.5% 10.1% 1222Unweighted Count 556 336 172 32 126
Yes Estimate 35.4% 11.6% 16.7% 7.7% 28.6%162Unweighted Count 58 27 34 13 30
N = Unweighted Count% = Weighted PercentageSource: 2010 District of Columbia Behavioral Risk Factor Surveillance System (BRFSS), Communities Putting Prevention to Work (CPPW) survey
Table 17: Current smokers by emotional statusDistrict of Columbia, 2010
Current Smoker About how often during the past 30 days did you feel nervous would you say all of the time?
Always Usually Sometimes Rarely Never TotalNo Estimate 2.8% 2.0% 23.4% 30.8% 40.9%
1238Unweighted Count 16 26 256 401 539Yes Estimate 6.0% 3.0% 31.7% 21.4% 37.9%
163Unweighted Count 7 9 45 36 66N = Unweighted Count% = Weighted PercentageSource: 2010 District of Columbia Behavioral Risk Factor Surveillance System (BRFSS), Communities Putting Prevention to Work (CPPW) survey
41Tobacco UseCommunities Putting Prevention to Work
Table 18: Current smokers by mental healthDistrict of Columbia, 2010
Current Smokers During the past 30 days about how often did you feel hopeless?All Most Some A Little None Total
No Estimate 0.4% 2.8% 8.1% 10.7% 78.0%1242Unweighted Count 7 13 94 114 1014
Yes Estimate 8.4% 1.1% 6.9% 22.4% 61.2% 167Unweighted Count 6 3 19 27 112
N = Unweighted Count% = Weighted PercentageSource: 2010 District of Columbia Behavioral Risk Factor Surveillance System (BRFSS), Communities Putting Prevention to Work (CPPW) survey
Table 19: Current smokers by mental healthDistrict of Columbia, 2010
Current Smokers During the past 30 days about how often did you feel restless or fidgety?
No Estimate 1.2% 2.8% 21.8% 22.6% 51.6%1236Unweighted Count 12 20 239 315 650
Yes Estimate 4.6% 5.3% 31.9% 25.5% 32.7%166Unweighted Count 7 9 45 42 63
N = Unweighted Count% = Weighted PercentageSource: 2010 District of Columbia Behavioral Risk Factor Surveillance System (BRFSS), Communities Putting Prevention to Work (CPPW) survey
Table 20: Current smokers by mental healthDistrict of Columbia, 2010
Current Smokers During the past 30 days how often did you feel so depressed that nothing could cheer you up?
All Most Some A Little None TotalNo Estimate 2.3% 1.2% 7.2% 6.3% 83.0% 1240
Unweighted Count 5 16 46 95 1078Yes Estimate 2.0% 2.4% 20.8% 15.0% 59.8% 165
Unweighted Count 2 8 17 29 109N = Unweighted Count% = Weighted PercentageSource: 2010 District of Columbia Behavioral Risk Factor Surveillance System (BRFSS), Communities Putting Prevention to Work (CPPW) survey
42 Tobacco UseCommunities Putting Prevention to Work
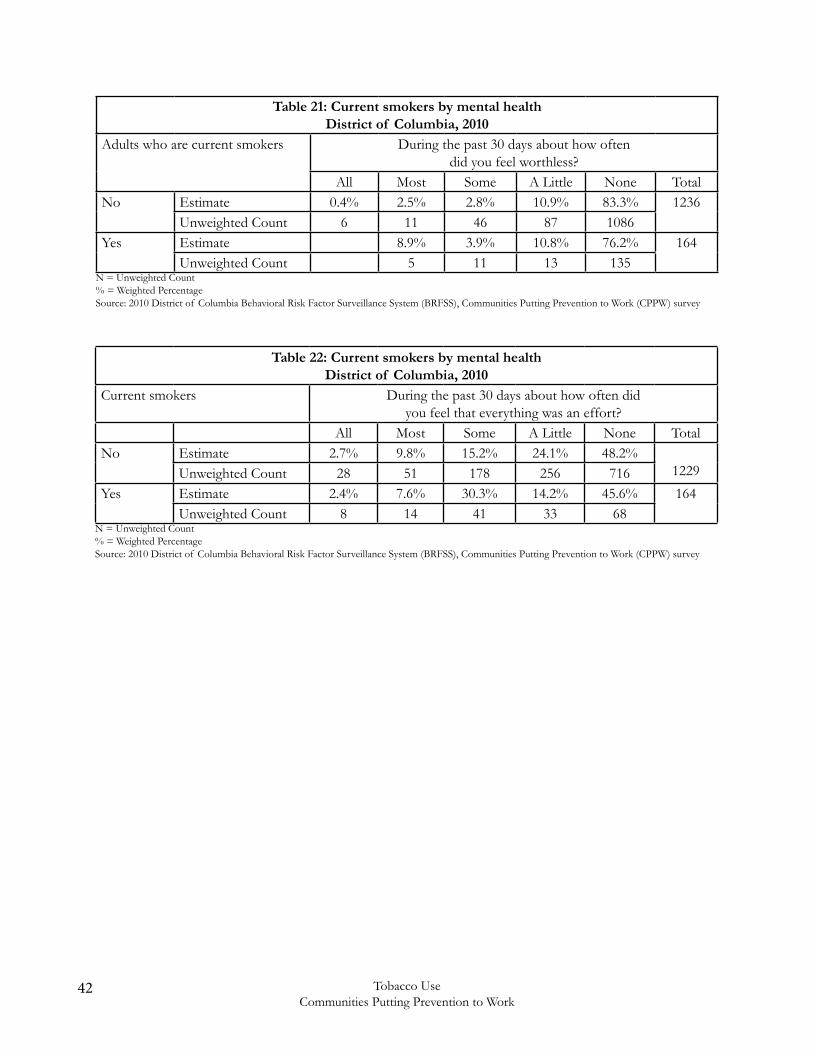
Table 21: Current smokers by mental healthDistrict of Columbia, 2010
Adults who are current smokers During the past 30 days about how often did you feel worthless?
All Most Some A Little None TotalNo Estimate 0.4% 2.5% 2.8% 10.9% 83.3% 1236
Unweighted Count 6 11 46 87 1086Yes Estimate 8.9% 3.9% 10.8% 76.2% 164
Unweighted Count 5 11 13 135N = Unweighted Count% = Weighted PercentageSource: 2010 District of Columbia Behavioral Risk Factor Surveillance System (BRFSS), Communities Putting Prevention to Work (CPPW) survey
Table 22: Current smokers by mental healthDistrict of Columbia, 2010
Current smokers During the past 30 days about how often did you feel that everything was an effort?
All Most Some A Little None TotalNo Estimate 2.7% 9.8% 15.2% 24.1% 48.2%
1229Unweighted Count 28 51 178 256 716Yes Estimate 2.4% 7.6% 30.3% 14.2% 45.6% 164
Unweighted Count 8 14 41 33 68N = Unweighted Count% = Weighted PercentageSource: 2010 District of Columbia Behavioral Risk Factor Surveillance System (BRFSS), Communities Putting Prevention to Work (CPPW) survey
43Tobacco UseCommunities Putting Prevention to Work
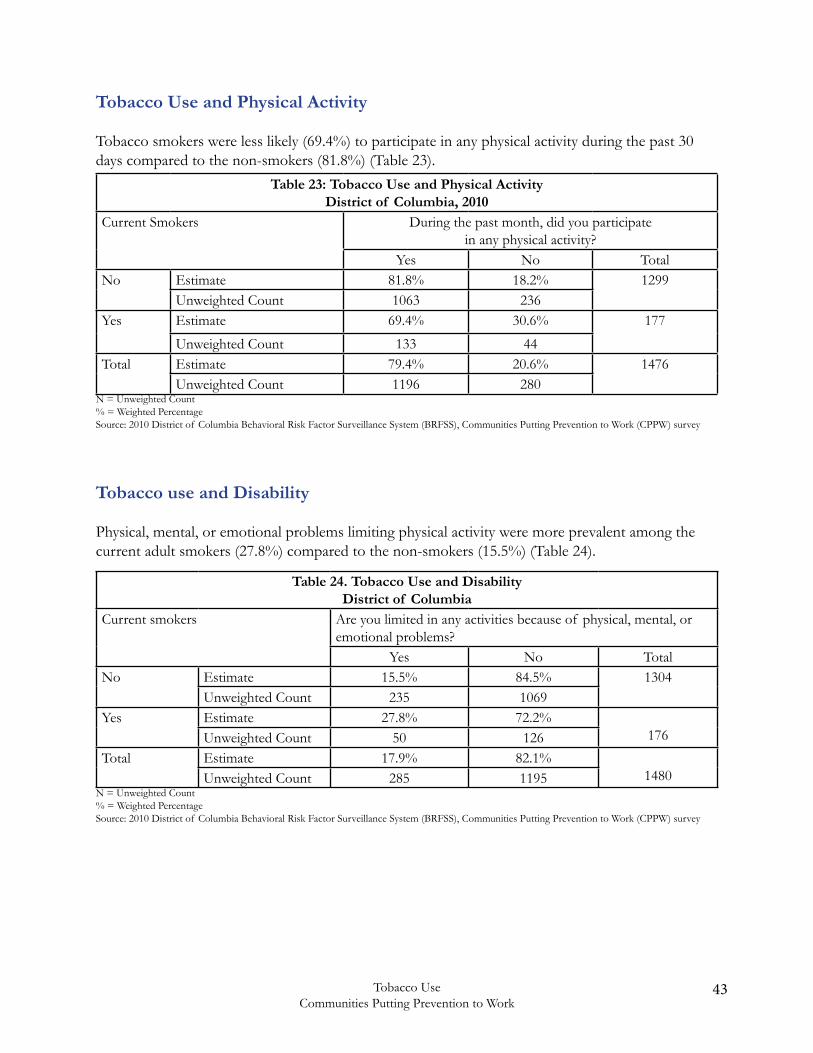
Tobacco Use and Physical Activity
Tobacco smokers were less likely (69.4%) to participate in any physical activity during the past 30 days compared to the non-smokers (81.8%) (Table 23).
Table 23: Tobacco Use and Physical ActivityDistrict of Columbia, 2010
Current Smokers During the past month, did you participate in any physical activity?
Yes No TotalNo Estimate 81.8% 18.2% 1299
Unweighted Count 1063 236Yes Estimate 69.4% 30.6% 177
Unweighted Count 133 44Total Estimate 79.4% 20.6% 1476
Unweighted Count 1196 280N = Unweighted Count% = Weighted PercentageSource: 2010 District of Columbia Behavioral Risk Factor Surveillance System (BRFSS), Communities Putting Prevention to Work (CPPW) survey
Table 24. Tobacco Use and DisabilityDistrict of Columbia
Current smokers Are you limited in any activities because of physical, mental, or emotional problems?
Yes No TotalNo Estimate 15.5% 84.5% 1304
Unweighted Count 235 1069Yes Estimate 27.8% 72.2%
176Unweighted Count 50 126Total Estimate 17.9% 82.1%
1480Unweighted Count 285 1195N = Unweighted Count% = Weighted PercentageSource: 2010 District of Columbia Behavioral Risk Factor Surveillance System (BRFSS), Communities Putting Prevention to Work (CPPW) survey
Tobacco use and Disability
Physical, mental, or emotional problems limiting physical activity were more prevalent among the current adult smokers (27.8%) compared to the non-smokers (15.5%) (Table 24).
44 Tobacco UseCommunities Putting Prevention to Work
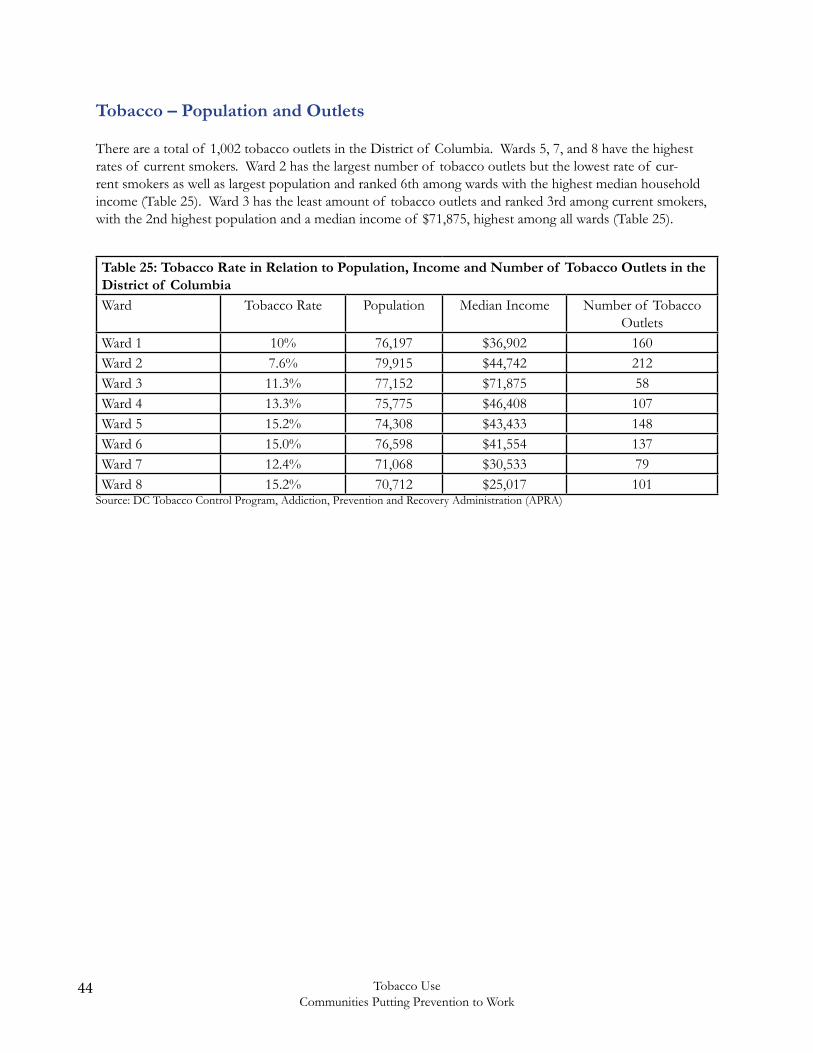
Tobacco – Population and Outlets
There are a total of 1,002 tobacco outlets in the District of Columbia. Wards 5, 7, and 8 have the highest rates of current smokers. Ward 2 has the largest number of tobacco outlets but the lowest rate of cur-rent smokers as well as largest population and ranked 6th among wards with the highest median household income (Table 25). Ward 3 has the least amount of tobacco outlets and ranked 3rd among current smokers, with the 2nd highest population and a median income of $71,875, highest among all wards (Table 25).
Table 25: Tobacco Rate in Relation to Population, Income and Number of Tobacco Outlets in the District of ColumbiaWard Tobacco Rate Population Median Income Number of Tobacco
OutletsWard 1 10% 76,197 $36,902 160Ward 2 7.6% 79,915 $44,742 212Ward 3 11.3% 77,152 $71,875 58Ward 4 13.3% 75,775 $46,408 107Ward 5 15.2% 74,308 $43,433 148Ward 6 15.0% 76,598 $41,554 137Ward 7 12.4% 71,068 $30,533 79Ward 8 15.2% 70,712 $25,017 101
Source: DC Tobacco Control Program, Addiction, Prevention and Recovery Administration (APRA)
45Tobacco UseCommunities Putting Prevention to Work
Overview of Promotion and Advertising Restrictions
On March 19, 2010, FDA published in the Federal Register its final regulations entitled Regulations Restrict-ing the Sale and Distribution of Cigarettes and Smokeless Tobacco to Protect Children and Adolescents; and these regulations became effective on June 22, 2010. These final regulations at 21 C.F.R. Part 1140 are designed to: 1) restrict access to cigarettes and smokeless tobacco by persons under the age of 18 years; and 2) reduce the appeal of such products to persons under the age of 18, through restrictions on marketing, labeling, and advertising.22
Specifically, the Regulations Restricting the Sale and Distribution of Cigarettes and Smokeless Tobacco to Protect Children and Adolescents impose the following restrictions: Prohibition of Sale and Distribution to Persons Younger than 18 Years of Age (Youth Access)22
Retailers of tobacco products MUST:18
• Not sell cigarettes or smokeless tobacco to persons younger than 18 years of age. 21 C.F.R. 1140.14(a).
• Verify the age of purchasers of cigarettes or smokeless tobacco who are under the age of 27 years by means of photographic identification that contains the bearer’s date of birth. 21 C.F.R. 1140.14(b).
• Sell cigarettes or smokeless tobacco in direct, face-to-face transactions, with certain exceptions. 21 C.F.R. 1140.14(c), 1140.16(c).
• Not have tobacco vending machines or self-service displays in their facilities unless they can ensure that persons younger than 18 years of age are never present or not permitted to enter at any time. 21 C.F.R. 1140.16(c).
• Not break or otherwise open any cigarette or smokeless tobacco package to sell or distribute individual cigarettes or a number of unpackaged cigarettes that is smaller than the quantity in a minimum cigarette package size of 20 cigarettes, or any quantity of cigarette tobacco or smokeless tobacco that is smaller than the smallest package distributed by the manufacturer for individual consumer use. 21 C.F.R. 1140.14(d), 21 C.F.R. 1140.16(b).
• Not distribute or cause to be distributed free samples of tobacco products, except for samples of smokeless tobacco products in a qualified adult-only facility, as defined by the regulations at 21 C.F.R. 1140.16(d)(2)(iii). 21 C.F.R. 1140.16(d). This provision also applies to manufacturers and distributors.
• Not sell or distribute, or cause to be sold or distributed, cigarettes or smokeless tobacco with labels, labeling, or advertising not in compliance with subpart D of 21 C.F.R. Part 1140 (specifically, 21 C.F.R. 1140.30, 1140.32, and 1140.34) and other applicable requirements. 21 C.F.R. 1140.16(e). This provision also applies to manufacturers and distributors.
Labeling and AdvertisingManufacturers, Distributors, and Retailers of tobacco products MUST: • Not market, distribute, license, or sell any item (other than cigarettes or smokeless tobacco or roll-your-own paper) or service that bears the brand name (alone or in conjunction with any other word), logo, symbol, motto, selling message, recognizable color or pattern of colors, or any other indicia of product identification identical to or similar to, or identifiable with, those used for any
46 Tobacco UseCommunities Putting Prevention to Work
brand of cigarettes or smokeless tobacco. 21 C.F.R. 1140.34(a). This provision only applies to manufacturers and certain distributors.
• Not offer any gift or item (other than cigarettes or smokeless tobacco) to any person purchasing cigarettes or smokeless tobacco in consideration of the purchase of the cigarettes or smokeless tobacco product or to any person in consideration of furnishing evidence, such as credits, proofs-of- purchase, or coupons, of such a purchase. 21 C.F.R. 1140.34(b).
• Not sponsor any athletic, musical, artistic, or other social or cultural event, or any entry or team in any event, in the brand name, logo, symbol, motto, selling message, recognizable color or pattern of colors, or any other indicia of product identification, identical or similar to, or identifiable with, those used for any brand of cigarettes or smokeless tobacco. 21 C.F.R. 1140.34(c).
• Notify FDA 30 days prior to the dissemination of advertising or labeling for cigarettes or smokeless tobacco in a medium not listed in 21 C.F.R. 1140.30(a)(1). 21 C.F.R. 1140.30(a)(2). The notice must describe the medium and discuss the extent to which the advertising or labeling may be seen by persons younger than 18 years of age.
There are two additional provisions of the regulations, 21 C.F.R. 1140.16(a) and 1140.32(a), that restrict label-ing and advertising of tobacco products. However, as discussed below, FDA intends to exercise enforcement discretion to not enforce these two provisions at this time.
21 C.F.R. 1140.16(a) [restriction on the use of trade name or brand name of a non-tobacco product as the trade name or brand name for a cigarette or smokeless tobacco product]. FDA is aware of concerns regarding this provision and is considering what changes, if any, would be appropriate to address those concerns. While FDA has this issue under consideration, it intends to exercise its enforcement discretion concerning 21 C.F.R. 1140.16(a) not to commence enforcement actions under this provision for the duration of its consideration where: (1) The trade or brand name of the cigarette or smokeless tobacco product was registered, or the product was marketed, in the United States on or before June 22, 2009; or
(2) The first marketing or registration in the United States of the tobacco product occurs before the first marketing or registration in the United States of the non-tobacco product bearing the same name; provided, however, that the tobacco and non-tobacco product are not owned, manufactured, or distributed by the same, related, or affiliated entities (including as a licensee).
The Tobacco Control Act amends the Federal Food, Drug, and Cosmetic Act (FD&C Act), 21 U.S.C. 301 et seq., and contains additional provisions relating to the promotion and advertising of tobacco products. Relevant sections of the Tobacco Control Act and the FD&C Act, as amended by the Tobacco Control Act, include, among others:
• Section 201(rr)(4) of the Tobacco Control Act (21 U.S.C. 321(rr)(4)) – a tobacco product shall not be marketed in combination with any other article or FDA-regulated product.
• Section 201 of the Tobacco Control Act, amending section 4 of the Federal Cigarette Labeling and Advertising Act (15 U.S.C. 1333) -- requires that cigarette packages and advertisements bear new, larger, and more prominent health warnings. FDA must issue regulations requiring that graphic images accompany the new health warning statements on cigarette packs and advertisements. Companies must submit rotation plans for the new health warning statements to the FDA for review
47Tobacco UseCommunities Putting Prevention to Work
and approval. These requirements are effective 15 months after issuance of the regulations requiring graphic images.
• Section 204 of the Tobacco Control Act, amending section 3 of the Comprehensive Smokeless Tobacco Health Education Act of 1986 (15 U.S.C. 4402) -- requires that smokeless tobacco packages and advertisements bear new, larger, and more prominent health warnings. Companies must submit rotation plans for the new health warning statements to the FDA for review and approval. These provisions took effect on June 22, 2010.
• Section 903(a)(1) of FD&C Act (21 U.S.C. 387c(a)(1)) – a tobacco product shall be deemed misbranded if its labeling is false or misleading in any particular. In addition, FDA may issue regulations implementing other misbranding provisions of FD&C Act, including the requirement that a tobacco product bear its (if it has one) established name prominently, and the requirement that its labeling bear adequate directions for use, or adequate warnings against use by children, that are necessary for the protection of users.
• Section 905 of FD&C Act (21 U.S.C. 387e) – requires every person who registers under FD&C Act to provide to FDA a list of all tobacco products that are being manufactured, prepared, compound- ed, or processed by that person for commercial distribution, and include copies of the labeling and a representative sampling of advertisements for such tobacco products.
• Section 907(a)(1)(A) of FD&C Act (21 U.S.C. 387g(a)(1)(A)) – this special rule for cigarettes bans all cigarettes containing an artificial or natural flavor (other than tobacco or menthol) or an herb or spice that is a characterizing flavor, including strawberry, grape, orange, clove, cinnamon, pineapple, vanilla, coconut, licorice, cocoa, chocolate, cherry, or coffee.
• Section 910(b)(1)(F) of FD&C Act (21 U.S.C. 387j(b)(1)(F)) -- requires any application for review of a new tobacco product to include specimens of the labeling proposed to be used for such tobacco product.
• Section 911(b)(2)(A)(ii) of FD&C Act (21 U.S.C. 387k(b)(2)(A)(ii)) – As of July 22, 2010, manufacturers, including importers of finished tobacco products, may not introduce into the domestic commerce of the U.S. any tobacco product for which the label, labeling, or advertising contains the descriptors “light,” “mild,” or “low,” or any similar descriptor, irrespective of the date of manufacture, without an FDA order in effect under section 911(g) of FD&C Act (21 U.S.C. 387k(g)) (permitting the marketing of a modified risk tobacco product).
• Sections 911(a) & (b) of FD&C Act (21 U.S.C. 387k(a) & (b)) – prohibit any person from introducing or delivering for introduction into interstate commerce any modified risk tobacco product without an FDA order in effect under section 911(g) of FD&C Act (21 U.S.C. 387k(g)). Whether a product is a modified risk tobacco product is based on representations made in the label, labeling, or advertising of such product and/or other actions directed to consumers taken by the manufacturer with respect to such product. • Section 911(d) of FD&C Act (21 U.S.C. 387k(d)) – any application for a modified risk tobacco product must include any proposed advertising and labeling for the product.
• Section 911(h)(5) of FD&C Act (21 U.S.C. 387k(h)(5)) – an order permitting a modified risk tobacco product to be commercially marketed may require that the product comply with requirements relating to advertising and promotion of the tobacco product.

48 Tobacco UseCommunities Putting Prevention to Work
In accordance with FDA regulations, it is also unlawful to advertise cigarettes or smokeless tobacco on any medium of electronic communications subject to the jurisdiction of the Federal Communications Commis-sion.
These guidances are available on FDA’s website at http://www.fda.gov/TobaccoProducts/default.htm.
49Tobacco UseCommunities Putting Prevention to Work
Strategies and Policies on Tobacco Use in the District
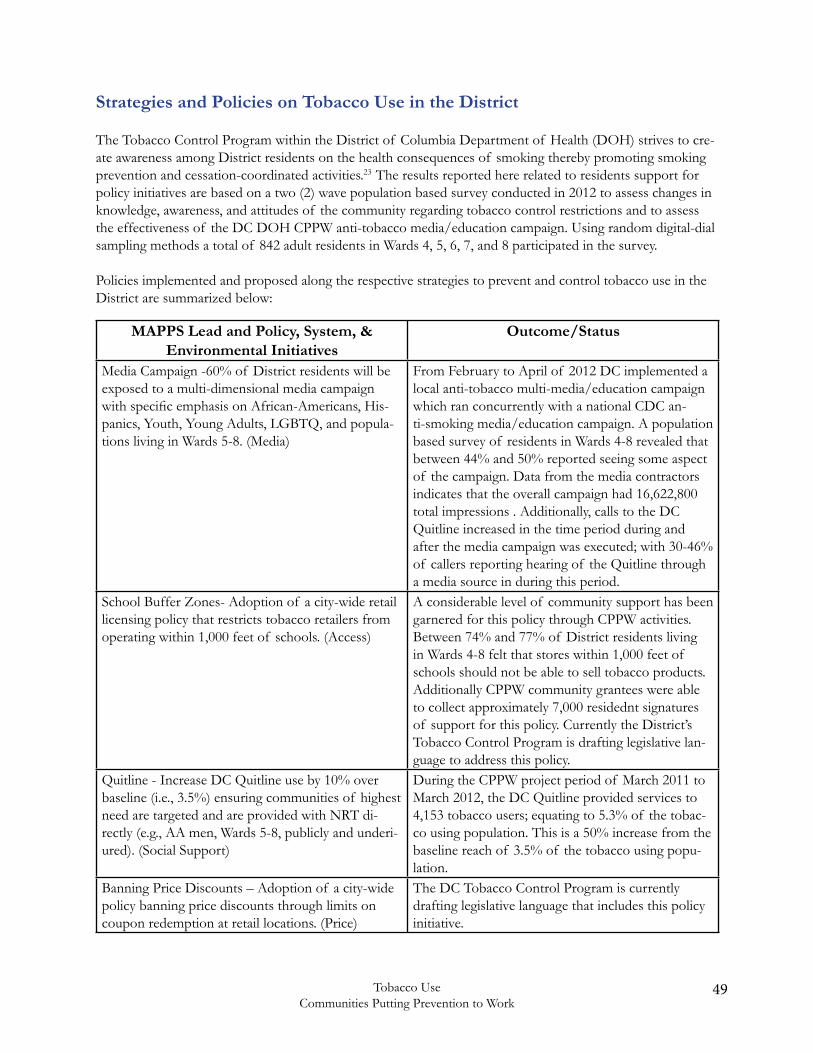
The Tobacco Control Program within the District of Columbia Department of Health (DOH) strives to cre-ate awareness among District residents on the health consequences of smoking thereby promoting smoking prevention and cessation-coordinated activities.23 The results reported here related to residents support for policy initiatives are based on a two (2) wave population based survey conducted in 2012 to assess changes in knowledge, awareness, and attitudes of the community regarding tobacco control restrictions and to assess the effectiveness of the DC DOH CPPW anti-tobacco media/education campaign. Using random digital-dial sampling methods a total of 842 adult residents in Wards 4, 5, 6, 7, and 8 participated in the survey.
Policies implemented and proposed along the respective strategies to prevent and control tobacco use in the District are summarized below:
MAPPS Lead and Policy, System, & Environmental Initiatives
Outcome/Status
Media Campaign -60% of District residents will be exposed to a multi-dimensional media campaign with specific emphasis on African-Americans, His-panics, Youth, Young Adults, LGBTQ, and popula-tions living in Wards 5-8. (Media)
From February to April of 2012 DC implemented a local anti-tobacco multi-media/education campaign which ran concurrently with a national CDC an-ti-smoking media/education campaign. A population based survey of residents in Wards 4-8 revealed that between 44% and 50% reported seeing some aspect of the campaign. Data from the media contractors indicates that the overall campaign had 16,622,800 total impressions . Additionally, calls to the DC Quitline increased in the time period during and after the media campaign was executed; with 30-46% of callers reporting hearing of the Quitline through a media source in during this period.
School Buffer Zones- Adoption of a city-wide retail licensing policy that restricts tobacco retailers from operating within 1,000 feet of schools. (Access)
A considerable level of community support has been garnered for this policy through CPPW activities. Between 74% and 77% of District residents living in Wards 4-8 felt that stores within 1,000 feet of schools should not be able to sell tobacco products. Additionally CPPW community grantees were able to collect approximately 7,000 residednt signatures of support for this policy. Currently the District’s Tobacco Control Program is drafting legislative lan-guage to address this policy.
Quitline - Increase DC Quitline use by 10% over baseline (i.e., 3.5%) ensuring communities of highest need are targeted and are provided with NRT di-rectly (e.g., AA men, Wards 5-8, publicly and underi-ured). (Social Support)
During the CPPW project period of March 2011 to March 2012, the DC Quitline provided services to 4,153 tobacco users; equating to 5.3% of the tobac-co using population. This is a 50% increase from the baseline reach of 3.5% of the tobacco using popu-lation.
Banning Price Discounts – Adoption of a city-wide policy banning price discounts through limits on coupon redemption at retail locations. (Price)
The DC Tobacco Control Program is currently drafting legislative language that includes this policy initiative.
50 Tobacco UseCommunities Putting Prevention to Work
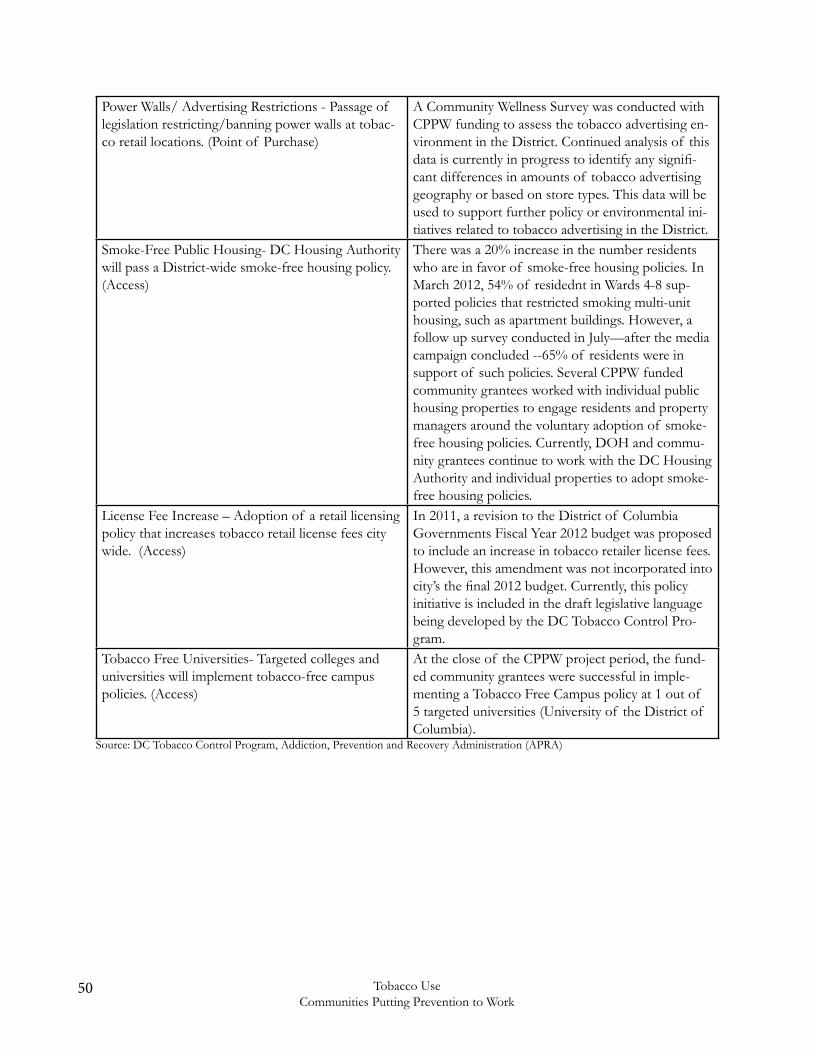
Power Walls/ Advertising Restrictions - Passage of legislation restricting/banning power walls at tobac-co retail locations. (Point of Purchase)
A Community Wellness Survey was conducted with CPPW funding to assess the tobacco advertising en-vironment in the District. Continued analysis of this data is currently in progress to identify any signifi-cant differences in amounts of tobacco advertising geography or based on store types. This data will be used to support further policy or environmental ini-tiatives related to tobacco advertising in the District.
Smoke-Free Public Housing- DC Housing Authority will pass a District-wide smoke-free housing policy. (Access)
There was a 20% increase in the number residents who are in favor of smoke-free housing policies. In March 2012, 54% of residednt in Wards 4-8 sup-ported policies that restricted smoking multi-unit housing, such as apartment buildings. However, a follow up survey conducted in July—after the media campaign concluded --65% of residents were in support of such policies. Several CPPW funded community grantees worked with individual public housing properties to engage residents and property managers around the voluntary adoption of smoke-free housing policies. Currently, DOH and commu-nity grantees continue to work with the DC Housing Authority and individual properties to adopt smoke-free housing policies.
License Fee Increase – Adoption of a retail licensing policy that increases tobacco retail license fees city wide. (Access)
In 2011, a revision to the District of Columbia Governments Fiscal Year 2012 budget was proposed to include an increase in tobacco retailer license fees. However, this amendment was not incorporated into city’s the final 2012 budget. Currently, this policy initiative is included in the draft legislative language being developed by the DC Tobacco Control Pro-gram.
Tobacco Free Universities- Targeted colleges and universities will implement tobacco-free campus policies. (Access)
At the close of the CPPW project period, the fund-ed community grantees were successful in imple-menting a Tobacco Free Campus policy at 1 out of 5 targeted universities (University of the District of Columbia).
Source: DC Tobacco Control Program, Addiction, Prevention and Recovery Administration (APRA)
51Tobacco UseCommunities Putting Prevention to Work
References
1 Centers for Disease Control and Prevention. Smoking and Tobacco Use. Tobacco-Related Mortality. http://www.cdc. gov/tobacco/data_statistics/fact_sheets/health_effects/tobacco_related_mortality/
2 Centers for Disease Control and Prevention. Communities Putting Prevention to Work. http://www.cdc.gov/commu- nitiesputtingpreventiontowork/
3 Campaign for Tobacco Free Kids - The Toll of Tobacco in Washington, DC http://www.tobaccofreekids.org/facts_is sues/ toll_us/dc. Accessed May 30, 2013
4 Washington Post. New FDA Rules Will Greatly Restrict Tobacco Advertising and Sales. http://www.washingtonpost.com/wp-dyn/content/article/2010/03/18/AR2010031803004.html
5. The Washington Informer - Anti Tobacco Groups Lobby D.C. Council. http://washingtoninformer.com/index.php /local/item/6104-anti-tobacco-groups-lobby-dc-council
6. Centers for Disease Control and Prevention - Preventing Tobacco Use Among Youth and Young Adults. http://www. cdc.gov/tobacco/data_statistics/sgr/2012/consumer_booklet/pdfs/consumer.pdf
7 World Health Organization. 2012. 10 facts on the global tobacco epidemic. Retrieved from http://www.who.int/ features/factfiles/tobacco_epidemic/en/.
8 Campaign for Tobacco Free Kids - sThe Toll of Tobacco in Washington, DC http://www.tobaccofreekids.org/facts_ issues/toll_us/dc. Accessed May 30, 2013
9 World Health Organization. 2012. Tobacco. Fact Sheet No. 339. Retrieved from http://www.who.int/mediacentre/ factsheets/fs339/en/index.html
10 U.S. Department of Health & Human Services. Preventing tobacco use among youth and young adults: A report of the Surgeon General, 2012. Retrieved from http://www.surgeongeneral.gov/library/reports/ preventing-youth-tobacco-use/index.html
11 Centers for Disease Control and Prevention. Vital signs: Current cigarette smoking among adults aged ≥18 years - United States, 2005–2010. Morbidity and Mortality Weekly Report 2011; 60(35): 1207 – 1212.
12 Centers for Disease Control and Prevention. Youth risk behavior surveillance - United States, 2011. Retrieved from http://www.cdc.gov/mmwr/pdf/ss/ss6104.pdf
13 Centers for Disease Control and Prevention. Tobacco use: Targeting the nation’s leading killer at a glance, 2011. Retrieved from http://www.cdc.gov/chronicdisease/resources/publications/aag/osh.htm
14 Center for Disease Control and Prevention. 2008. District of Columbia: Burden of chronic disease. Retrieved from http://www.cdc.gov/chronicdisease/states/pdf/dc.pdf
15 Centers for Disease Control and Prevention. 2011. Tobacco use and District of Columbia students. Retrieved from http://www.cdc.gov/healthyyouth/yrbs/pdf/tobacco/districtofcolumbia_tobacco_combo.pdf
16 Center for Disease Control and Prevention. 2012. Behavioral Risk Factor Surveillance System, data for 2010. Retrieved from http://www.cdc.gov/brfss/index.htm
17 Center for Disease Control and Prevention. Communities putting prevention to work (CPPW). Retrieved from http://www.cdc.gov/CommunitiesPuttingPreventiontoWork/communities/profiles/pdf/CPPW_CommunityProfile_B2_ Washington_DC_508.pdf
52 Tobacco UseCommunities Putting Prevention to Work
18 U.S. Department of Health and Human Services. How Tobacco Smoke Causes Disease: The Biology and Behavioral Basis for Smoking-Attributable Disease. A Report of the Surgeon General, 2010. Retrieved from http://www.cdc. gov/tobacco/data_statistics/sgr/2010/index.htm
19 U.S. Department of Health and Human Services. The Health Consequences of Smoking. A Report of the Surgeon General, 2004. Retrieved from http://www.cdc.gov/tobacco/data_statistics/sgr/2004/
20 Centers for Disease Control and Prevention. Smoking-attributable mortality, years of potential life lost, and productivity losses, United States, 2000–2004. Morbidity and Mortality Weekly Report 2008;57(45):1226–8.
21 U.S. Department of Health and Human Services. Healthy People 2020. Retrieved from http://www.healthypeople.gov/2020/topic sobjectives2020/overview.aspx?topicid=4122 Government of the District of Columbia, Department of Health. Tobacco control program. Retrieved from http://doh.dc.gov/doh/cwp/view,a,1374,q,580779,dohNav_GID,1802,dohNav,%7C33200%7C33253%7C.asp
23 Substance Abuse and Mental Health Services Administration. Results from the 2010 National Survey on Drug Use and Health: Summary of National Findings (PDF–2.56 MB). [accessed 2012 Feb 14].
24 U.S. Department of Health and Human Services. Preventing Tobacco Use Among Young People: A Report of the Surgeon General. Atlanta: U.S. Department of Health and Human Services, Centers for Disease Control and Prevention, Office on Smoking and Health, 1994 [accessed 2012 Feb 14].
25 http://www.cdc.gov/CommunitiesPuttingPreventiontoWork/communities/profiles/pdf/CPPW_CommunityProfile_B2_Washing- ton_DC_508.pdf (accessed 2012 Jul
26 Food and Drug Administration Tobacco Regulations - http://www.fda.gov/TobaccoProducts/GuidanceComplianceRegulatoryIn-formation/ucm271744.htm
Government of the District of ColumbiaDepartment of Health
Center for Policy, Planning and EvaluationBehavioral Risk Factor Surveillance System (BRFSS)
899 North Capitol Street NE 5th FloorWashington, DC 20002
Web Address: www.doh.dc.gov


