Embed Size (px)
Citation preview

ARTICLE
Received 15 Apr 2014 | Accepted 2 Apr 2015 | Published 22 May 2015
Dissecting the role of aberrant DNA methylationin human leukaemiaGiovanni Amabile1,2,*, Annalisa Di Ruscio1,2,*, Fabian Muller3,*, Robert S. Welner1,2, Henry Yang4,
Alexander K. Ebralidze1,2, Hong Zhang1,2, Elena Levantini1,2,5, Lihua Qi4, Giovanni Martinelli6,
Thijn Brummelkamp7, Michelle M. Le Beau8, Maria E. Figueroa9, Christoph Bock3,10,11 & Daniel G. Tenen1,2,4
Chronic myeloid leukaemia (CML) is a myeloproliferative disorder characterized by the
genetic translocation t(9;22)(q34;q11.2) encoding for the BCR-ABL fusion oncogene.
However, many molecular mechanisms of the disease progression still remain poorly
understood. A growing body of evidence suggests that the epigenetic abnormalities are
involved in tyrosine kinase resistance in CML, leading to leukaemic clone escape and disease
propagation. Here we show that, by applying cellular reprogramming to primary CML cells,
aberrant DNA methylation contributes to the disease evolution. Importantly, using a BCR-ABL
inducible murine model, we demonstrate that a single oncogenic lesion triggers DNA
methylation changes, which in turn act as a precipitating event in leukaemia progression.
DOI: 10.1038/ncomms8091
1 Harvard Medical School, Boston, Massachusetts 02115, USA. 2 Harvard Stem Cell Institute, Harvard University, Cambridge, Massachusetts 02138, USA.3 Max Plank Institute for Informatics, Saarbrucken 117599, Germany. 4 Cancer Science Institute, National University of Singapore, Singapore 66123, Singapore.5 Institute of Biomedical Technologies, National Research Council (CNR), Pisa 56124, Italy. 6 Department of Experimental, Diagnostic and Specialty Medicine,University of Bologna, Bologna 40126, Italy. 7 Netherlands Cancer Institute, Amsterdam 1066, The Netherlands. 8 Section of Hematology/Oncology and theComprehensive Cancer Center, University of Chicago, Chicago, Illinois 60637, USA. 9 University of Michigan, Department of Pathology, Ann Arbor, Michigan48109-2200, USA. 10 CeMM Research Center for Molecular Medicine of the Austrian Academy of Sciences, Vienna 1090, Austria. 11 Department ofLaboratory Medicine, Medical University of Vienna, Vienna 1090, Austria. * These authors contributed equally to this work. Correspondence and requests formaterials should be addressed to G.A. (email: [email protected]) or D.G.T. (email: [email protected]).
NATURE COMMUNICATIONS | 6:7091 | DOI: 10.1038/ncomms8091 | www.nature.com/naturecommunications 1
& 2015 Macmillan Publishers Limited. All rights reserved.

Genetic alterations impairing cellular differentiation andgrowth control are widely regarded as the molecularcauses of chronic myeloid leukaemia (CML) and acute
myeloid leukaemia1–3. Recent evidences suggest that epigeneticalterations such as DNA methylation can contribute to leukaemiapathogenesis4–6. In particular, abnormal epigenetic regulation ofspecific genes might play an important role in both leukaemiadevelopment and therapeutic responsiveness. CML is a particulartype of leukaemia characterized by the presence of the BCR-ABLoncogene. BCR-ABL is a constitutive active tyrosine kinasemediating the deregulation of several pathways involved inproliferation and differentiation7. Although the expression ofBCR-ABL is considered the primarily feature associated withCML onset, other molecular mechanisms contributing to CMLdevelopment remain to be elucidated. Both hypermethylation ofspecific genomic loci and genome-wide hypomethylation havebeen found to correlate with cancer development. Specifically,hypermethylation of tumour suppressor genes has been found toplay a crucial role in carcinogenesis by affecting normal cellgrowth8. Further, aberrant DNA methylation has been linked tothe onset of leukaemic clones resistant to tyrosine kinaseinhibitors and deemed responsible for CML propagation andprogression9. Among the genes found to be hypermethylated inCML and other lymphoid malignancies, and correlating with apoor outcome, are HOXA4 and HOXA5, both acting asdifferentiating genes during hematopoiesis10. Interestingly, theobservation that a member of CCAAT/enhancer-binding protein(CEBP) family of transcription factors: DNA damage-inducibletranscript 3 (DDIT3 gene, hypermethylated in CML11, suggeststhat the aberrant epigenetic regulation of the CEBP) gene mayalso play a role in leukaemia onset12.
Taken together, these findings indicate that aberrant DNAmethylation might contribute to leukaemia development bysynergizing with acquired genetic lesions. However, the lack ofsuitable animal models or other tools to directly address thisparticular question has constrained a thorough analysis.
Human-induced pluripotent stem (iPS) cells can be generatedfrom various cell types, including cancer cells, by overexpressing adefined set of transcription factors including OCT4, SOX2, KLF4and c-MYC (refs 13–17). Previous studies have shown thatcellular reprogramming might be able to erase tissue-specificDNA methylation and to re-establish an embryonic stem(ES)-like DNA methylation state18. Here by means of cellularreprogramming followed by in vitro re-differentiation we testedthe functional relevance of DNA aberrant methylome in CMLdevelopment. Reprogramming of CML cells into an iPS-like statewas able to erase the cancer-specific DNA methylation signatureand to identify a cell population no longer effective in producingCML when subsequently transplanted into immunocompromisedmice. Finally, using an inducible BCR-ABL transgenic mouse19,we demonstrate in vivo that a single genetic aberration perturbingDNA methylation profile acts as a crucial precipitating event inCML disease development.
ResultsReprogramming erases leukaemia-specific methylation pattern.To understand the role of DNA methylation during CMLdevelopment, we generated Leukaemia-iPS (LiPS) cells from twoCML cell lines, K562 and KBM7, as well as from human CMLprimary bone marrow cells obtained from a BCR-ABL-positiveCML patient. Leukaemia cells were transduced as previouslyreported13,20. Two weeks after infection, colonies withtypical human ES-like morphology were picked and expandedon mouse embryonic fibroblast feeder layers resulting in stableES-like cell lines: LiPS1-K562 and LiPS2-K562, both derived from
the K562 cell line, and CML-LiPS1 and CML-LiPS2, derived fromprimary CML cells. In addition, we included the previouslycharacterized KBM7 cell line and its reprogrammed counterpartin our analysis15. Remarkably, reprogrammed primary CML cellsstill preserved the BCR-ABL oncogene (Supplementary Fig. 1cand 15). A comprehensive SNP array analysis confirmed that LiPSclones derived from K562 and KBM7 cell lines retained the samegenetic alterations as the parental leukaemia cells (SupplementaryFig. 2 and Supplementary Data 1-2) ruling out the possibility thatan essentially normal subclone or contaminating cell was selectedduring reprogramming.
Having established several LiPS cell lines, we proceeded totest whether cellular reprogramming was sufficient to resetDNA methylation of the parental leukaemic cells. Genomic DNAmethylation profiles of K562, KBM7, primary CML cells andof the respective LiPS clones were assessed by ReducedRepresentation Bisulfite Sequencing (RRBS), which has beenshown to provide high sensitivity and specificity for detectingcancer-specific changes in DNA methylation not only in CpGislands but also throughout genes and in repetitive regions21,22.Compared with human ES cells, CD34þ -derived iPS cells(CD34þ -iPS) and CD34þ cells, K562 and KBM7 cell linesexhibited widespread hypermethylation throughout the genome,including CpG islands, genes and promoters (Fig. 1a) as well asacross families of repetitive elements. Primary CML cells alsodemonstrated significant hypermethylation in CpG islands, gene,and promoter regions, although to a lesser extent than in the celllines. Compared with pluripotent cells, primary CML cellsdemonstrated hypermethylation across families of repetitiveelements, similarly to CD34þ cells (Fig. 1a).
DNA methylation levels were substantially decreased through-out the genome in the LiPS cells as compared with their parentalleukaemic cell types, demonstrating the ability of cellularreprogramming to reset aberrant methylome (Fig. 1a). Overall,the LiPS clones acquired DNA methylation patterns that weresimilar but not identical to those of ES cell lines and CD34þ iPS,supporting the notion of cell-of-origin-specific ‘epigeneticmemory’ in many types of induced pluripotent cells23,24.Indeed, through genome-scale DNA methylation analysis, weidentified LiPS-specific DNA methylation changes of relevantpluripotent and hematopoietic-associated genes. Pluripotentgenes such as SALL4 were reactivated in LiPS andexhibited decreased DNA methylation levels, particularly at thepromoter regions consistent with the well-established role ofDNA demethylation as a key event in cellular reprogramming(Fig. 1b and Supplementary Fig. 3)18. Epigenetic reprogrammingaffected not only pluripotency-associated genes but also othergenomic loci, that is, hematopoietic transcription factors ortumour suppressor genes highly methylated across leukaemiacells and responding to cellular reprogramming with differentextent of LiPS demethylation (Fig. 1b).
Characterization of differentially methylated regions in CML.To characterize the changes in DNA methylation that are inducedby the reprogramming of CML cells to pluripotency, we used theRRBS data to bioinformatically identify differentially methylatedregions (DMRs) between LiPS clones and the cells they werederived from (see Materials and Methods). Among the 500strongest DMRs that are associated with gene promoters, the vastmajority were hypermethylated in CML cells as compared withthe derived LiPS cells (Fig. 2a). This observation is consistent withthe increased levels of promoter methylation that are commonamong cancer cells. To better understand the biological functionsof the genes that are characterized by differential promotermethylation, we performed gene ontology enrichment analyses.
ARTICLE NATURE COMMUNICATIONS | DOI: 10.1038/ncomms8091
2 NATURE COMMUNICATIONS | 6:7091 | DOI: 10.1038/ncomms8091 | www.nature.com/naturecommunications
& 2015 Macmillan Publishers Limited. All rights reserved.

The 500 gene promoters hypermethylated in CML cells as com-pared with LiPS cells were significantly enriched for functionalcategories associated with development, differentiation andsignalling (Fig. 2b and Supplementary Table 1), suggesting thatcertain aspects of these stem cell-associated processes may besilenced by DNA methylation in CML cells. In contrast, the 500gene promoters strongly hypermethylated in LiPS as comparedwith CML cells were enriched for hematopoietic regulatory genecategories such as lymphocyte activation and immune response(Fig. 2c and Supplementary Table 1), the latter recently shown tobe attenuated in iPS cells 25,26.
Beyond this gene promoter centric analysis of the potentialbiological functions of differential DNA methylation betweenCML cells and LiPS cells, we also investigated the co-localizationof DNA methylation changes with other epigenetic andregulatory mechanisms throughout the genome. To that end,we repeated the differential DNA methylation analysis on the 5-kb tiling regions spanning the whole genome, and we usedthe EpiExplorer software27 to compare the 500 most DMRs withthe background of all tiling regions. This analysis revealed thatDMRs are enriched for epigenetic marks associated with generegulatory sequences including promoters and enhancers.
DNA methylation DNA methylation
Methylation levelsPromoters genesCpG island
0.87K562K562-LiPS1K562-LiPS2
KBM7KBM7-LiPS1KBM7-LiPS2
CMLCML-LiPS1CML-LiPS2
hES H1CD34-iPS
CD34
chr7HOXA5
CpG island
K562K562-LiPS1K562-LiPS2
KBM7KBM7-LiPS1KBM7-LiPS2
CMLCML-LiPS1CML-LiPS2
hES H1CD34-iPS
CD34
K562K562-LiPS1K562-LiPS2
KBM7KBM7-LiPS1KBM7-LiPS2
CMLCML-LiPS1CML-LiPS2
hES H1CD34-iPS
CD34
0.100.010.910.010.000.390.010.010.010.060.12
0.660.160.120.480.140.110.220.120.150.130.170.17
Promoters genes0.830.700.800.850.140.130.710.550.800.060.370.28
0.880.800.850.870.010.010.730.530.780.030.200.30
Promoters genesCpG island
chr17BRCA1
41.2 m
0.430.040.080.960.000.000.970.910.880.890.910.44
0.780.470.580.710.440.350.840.820.800.700.790.49
0.5 10
SALL4chr20
50.4 mb 50.405 mb 50.41 mb 50.415 mb 50.42 mb
K56
2
CpG
isla
nds
Gen
esP
rom
oter
sS
INE
sLI
NE
sLT
Rs
K56
2-Li
PS
1K
562-
LiP
S2
KB
M7
KB
M7-
LiP
S1
KB
M7-
LiP
S2
CM
LC
ML-
LiP
S1
CM
L-Li
PS
2hE
S H
1C
D34
-iPS
CD
34
0.50 1
Figure 1 | Reprogramming erases the aberrant DNA methylation patterns in LiPS cells. (a) DNA methylation profile of K562 and KBM7 cell lines,
primary patient-derived CML cells, their corresponding LiPS clones, as well as human ES cells, CD34þ -iPS and primary CD34þ cells from healthy donors.
Each column of the heat map represents the average over two biological replicates. The heat map visualizes DNA methylation levels, with red colour
indicating low levels of DNA methylation and blue colour indicating high levels. White colour indicates DNA regions not covered by RRBS analysis. For each
genomic region type, shown are the 2% of regions that scored highest according to a ranking score in differential analysis comparing the group of K562,
KBM7 and primary CML samples to the group including all derived iPS cell lines (see also the Methods section). (b) DNA methylation profile of the SALL4
gene locus, hypermethylated in all the leukaemia cells and demethylated after reprogramming (upper panel). DNA methylation profiles of HOXA5 and
BRCA1 gene loci are shown in the middle and lower panels, respectively. Each row represents a sample, while each column represents a CpG dinucleotide.
Blue colour indicates high DNA methylation levels and red colour indicates low methylation levels. CpG islands are annotated with green bars. Mean
promoter and gene methylation levels are indicated on the right.
NATURE COMMUNICATIONS | DOI: 10.1038/ncomms8091 ARTICLE
NATURE COMMUNICATIONS | 6:7091 | DOI: 10.1038/ncomms8091 | www.nature.com/naturecommunications 3
& 2015 Macmillan Publishers Limited. All rights reserved.

Further, consistent with previous studies demonstrating a strongassociation between Polycomb binding in pluripotent cells andhypermethylation in cancer28,29, we observed that the CMLhypermethylated regions were highly enriched for Polycombbinding sites (Fig. 2d).
Overall, these observations confirm that CML reprogrammedinto LiPS cells undergo epigenome reprogramming that erasescharacteristic patterns of cancer-associated DNA methylationwhile establishing characteristic DNA methylation patterns ofpluripotent cells.
Reprogramming restores myeloid differentiation of CML cells.To assess whether epigenetic reprogramming observed in LiPScells coincides with phenotypic changes in their oncogenicpotential, we applied in vitro and in vivo strategies usingboth primary human CML cells and the CML model cell lineK562, chosen for its high efficiency of engraftment in
xenotransplantation approaches. By co-culture with OP9 stromacells30 (Supplementary Fig. 4a), we demonstrated thatCML-LiPS-derived CD45þ /CD34þ cells reacquire myeloidand erytroid differentiation capabilities giving rise toCD15þ /CD14þ /GlyAþ cells, despite the presence ofBCR-ABL oncogene (Supplementary Fig. 4a-d). With a similarOP9 co-culture we proved that K562-LiPS-derived CD45þ
cells exhibit a well-differentiated monocyte/macrophagephenotype in contrast with the leukaemia counterpart,locked into an undifferentiated cellular state (Fig. 3a andSupplementary Fig. 4e). Indeed, while the parental leukaemiaand LiPS cells showed low expression of the hematopoietictranscription factor CEBPA, the purified CD45þ LiPS-derived cells demonstrated the reactivation of this criticaldifferentiation-associated gene locus and increase of its levels ofexpression (Supplementary Fig. 4f-g). Remarkably, when K562-LiPS-derived CD45þ cells and the parental leukaemia cells(20,000 per mouse) were injected into immunocompromised
1.00
1.00Log10(P value)
G-protein couplesReceptor signaling
pathway
Neuron differentiation
Leukocyte cell–celladhesion
Regulation of T lymphocytedifferentiation
Lymphocyte aggregation
Defense response
Lymphocytedifferentiation
Log10(P value)0 1 2 3 4
Homeostasis of cellnumber
Organ morphogenesis
Tissue development
Multicellular organdevelopment
Development process
0
Hypomethylated Hypermethylated
1 2
7.3 × 10⁻³
1.35 × 10⁻³
1.12 × 10⁻³
5.13 × 10⁻⁴
2.9 × 10⁻⁴
2.27 × 10⁻⁴ 5.59 × 10⁻⁵
2.62 × 10⁻⁴
4.91 × 10⁻⁴
8.64 × 10⁻⁴
9.3 × 10⁻⁴
8.81 × 10⁻³
3
0.75
0.75
0.50
0.50
0.25
0.25
0.00
0.00Mean promoter
methylation (LiPS cells)
100
75
Ove
rlap
(%)
50
25
0
H3K
4me1
H3K
4me3
H3K
9me3
H3K
27m
e3
H3K
27ac
H3K
36m
e3
DN
asel
site
s
Act
ive
prom
oter
s
Poi
sed
prom
oter
s
Str
ong
enha
ncer
s
Insu
lato
rs
Pol
ycom
b re
pres
sed
Tra
nscr
iptio
nal
elon
gatio
n
Gen
es
Gen
es p
rom
oter
s
CpG
isla
nds
Con
serv
ed r
egio
ns
H3K
9ac
Differentially methylated regions
ENCODE ChiP-Seq ENCODE chromatin statesegmentation
UCSC genome annotation
Genomic background distribution (covered 5-kb tiling regions)
Mea
n pr
omot
erm
ethy
latio
n (C
ML
cells
)
Figure 2 | Characterization of DMRs distinguishing CML cells from their reprogrammed counterparts. (a) Scatterplot comparing mean promoter
methylation in CML cells with their derived LiPS cell lines. The blue colour gradient depicts point density. The 500 promoters with highest combined
ranking of absolute/relative differential methylation and statistical significance are depicted in red. (b–c) P values for significant Gene Ontology terms
enriched among the 500 most highly ranking hypomethylated (red) and hypermethylated (green) gene promoters in reprogrammed cells relative to CML
cells. (d) Overlap with genomic and epigenomic features in an EpiExplorer analysis27. The 500 most highly ranking differentially methylated tiling regions
(blue) are compared with a background of 72,469 of 5-kb tiling regions covered by RRBS (red). The ChIP-seq peak tracks are from the ENCODE project for
the GM12878, HMEC, NHLF, NHEK, HUVEC and H1 ES cell lines, chromatin state segmentations are based on chromHMM47 and the gene, gene promoter
(TSS� 5 kb to TSSþ 1 kb), CpG islands, repeat and conserved locus annotation are from the UCSC Genome Browser. Overlaps of at least 1 bp are shown as
percentage of all regions.
ARTICLE NATURE COMMUNICATIONS | DOI: 10.1038/ncomms8091
4 NATURE COMMUNICATIONS | 6:7091 | DOI: 10.1038/ncomms8091 | www.nature.com/naturecommunications
& 2015 Macmillan Publishers Limited. All rights reserved.
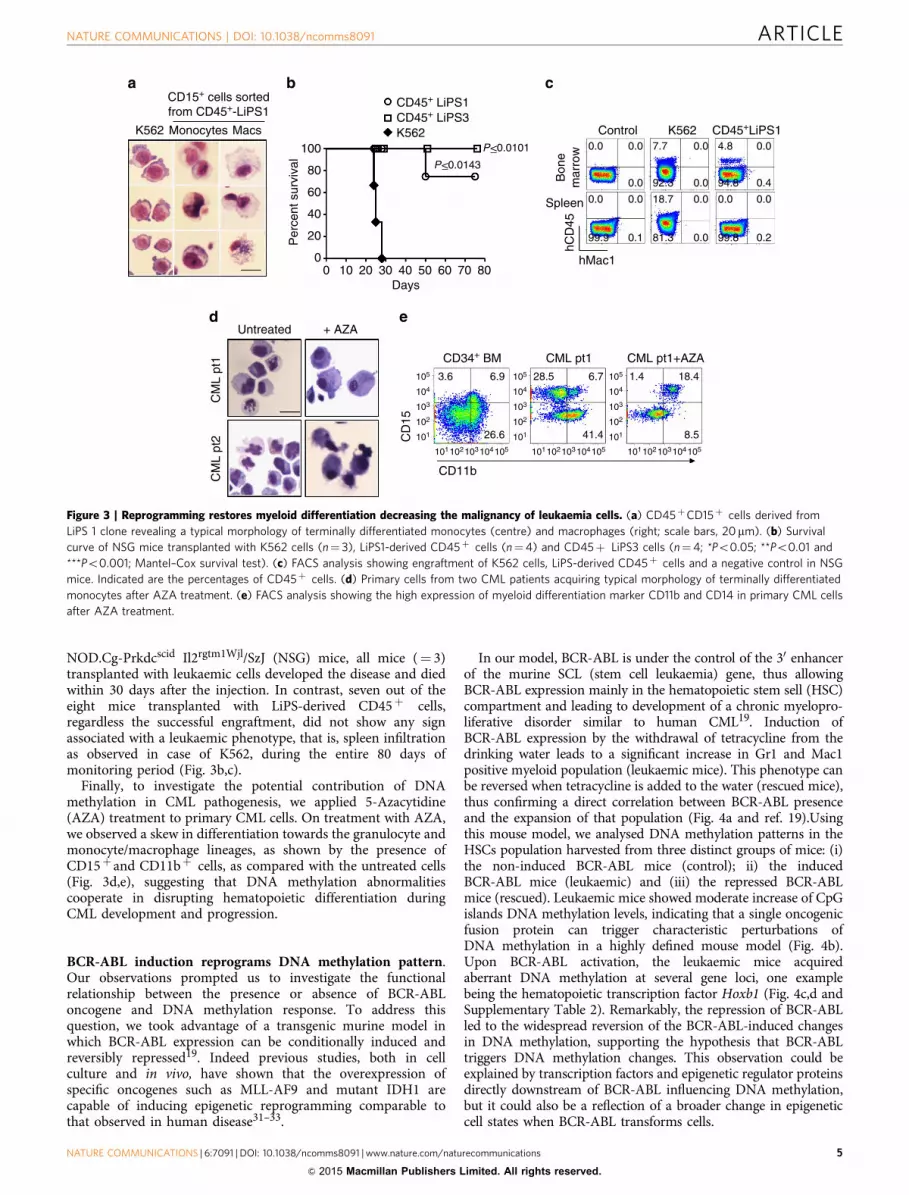
NOD.Cg-Prkdcscid Il2rgtm1Wjl/SzJ (NSG) mice, all mice (¼ 3)transplanted with leukaemic cells developed the disease and diedwithin 30 days after the injection. In contrast, seven out of theeight mice transplanted with LiPS-derived CD45þ cells,regardless the successful engraftment, did not show any signassociated with a leukaemic phenotype, that is, spleen infiltrationas observed in case of K562, during the entire 80 days ofmonitoring period (Fig. 3b,c).
Finally, to investigate the potential contribution of DNAmethylation in CML pathogenesis, we applied 5-Azacytidine(AZA) treatment to primary CML cells. On treatment with AZA,we observed a skew in differentiation towards the granulocyte andmonocyte/macrophage lineages, as shown by the presence ofCD15þ and CD11bþ cells, as compared with the untreated cells(Fig. 3d,e), suggesting that DNA methylation abnormalitiescooperate in disrupting hematopoietic differentiation duringCML development and progression.
BCR-ABL induction reprograms DNA methylation pattern.Our observations prompted us to investigate the functionalrelationship between the presence or absence of BCR-ABLoncogene and DNA methylation response. To address thisquestion, we took advantage of a transgenic murine model inwhich BCR-ABL expression can be conditionally induced andreversibly repressed19. Indeed previous studies, both in cellculture and in vivo, have shown that the overexpression ofspecific oncogenes such as MLL-AF9 and mutant IDH1 arecapable of inducing epigenetic reprogramming comparable tothat observed in human disease31–33.
In our model, BCR-ABL is under the control of the 30 enhancerof the murine SCL (stem cell leukaemia) gene, thus allowingBCR-ABL expression mainly in the hematopoietic stem sell (HSC)compartment and leading to development of a chronic myelopro-liferative disorder similar to human CML19. Induction ofBCR-ABL expression by the withdrawal of tetracycline from thedrinking water leads to a significant increase in Gr1 and Mac1positive myeloid population (leukaemic mice). This phenotype canbe reversed when tetracycline is added to the water (rescued mice),thus confirming a direct correlation between BCR-ABL presenceand the expansion of that population (Fig. 4a and ref. 19).Usingthis mouse model, we analysed DNA methylation patterns in theHSCs population harvested from three distinct groups of mice: (i)the non-induced BCR-ABL mice (control); ii) the inducedBCR-ABL mice (leukaemic) and (iii) the repressed BCR-ABLmice (rescued). Leukaemic mice showed moderate increase of CpGislands DNA methylation levels, indicating that a single oncogenicfusion protein can trigger characteristic perturbations ofDNA methylation in a highly defined mouse model (Fig. 4b).Upon BCR-ABL activation, the leukaemic mice acquiredaberrant DNA methylation at several gene loci, one examplebeing the hematopoietic transcription factor Hoxb1 (Fig. 4c,d andSupplementary Table 2). Remarkably, the repression of BCR-ABLled to the widespread reversion of the BCR-ABL-induced changesin DNA methylation, supporting the hypothesis that BCR-ABLtriggers DNA methylation changes. This observation could beexplained by transcription factors and epigenetic regulator proteinsdirectly downstream of BCR-ABL influencing DNA methylation,but it could also be a reflection of a broader change in epigeneticcell states when BCR-ABL transforms cells.
CD15+ cells sortedfrom CD45+-LiPS1
CD45+ LiPS1CD45+ LiPS3
Bon
em
arro
w
Spleen
hMac1
hCD
45
Control
CML pt1+AZACML pt1CD34+ BM
+ AZAUntreated
CM
L pt
1C
ML
pt2
CD11b
101
101
102
102
103
103
104
104
105
105
101
101
102
102
103
103
104
104
105
105
101
101
102
102
103
103
104
104
105
105
CD
15
18.4
8.541.4
6.728.56.9
26.6
3.6
K562 CD45+LiPS10.0
0.40.0
0.07.7
92.30.0
0.00.0
0.0 0.0 0.0
0.0
0.0 0.0
0.199.9 99.8 0.281.3
18.7
4.8
94.8
100
80
60
Per
cent
sur
viva
l
40
20
00 10 20 30 40
Days50 60 70 80
P<0.0101
P<0.0143
K562K562 Monocytes Macs
1.4
Figure 3 | Reprogramming restores myeloid differentiation decreasing the malignancy of leukaemia cells. (a) CD45þCD15þ cells derived from
LiPS 1 clone revealing a typical morphology of terminally differentiated monocytes (centre) and macrophages (right; scale bars, 20 mm). (b) Survival
curve of NSG mice transplanted with K562 cells (n¼ 3), LiPS1-derived CD45þ cells (n¼4) and CD45þ LiPS3 cells (n¼4; *Po0.05; **Po0.01 and
***Po0.001; Mantel–Cox survival test). (c) FACS analysis showing engraftment of K562 cells, LiPS-derived CD45þ cells and a negative control in NSG
mice. Indicated are the percentages of CD45þ cells. (d) Primary cells from two CML patients acquiring typical morphology of terminally differentiated
monocytes after AZA treatment. (e) FACS analysis showing the high expression of myeloid differentiation marker CD11b and CD14 in primary CML cells
after AZA treatment.
NATURE COMMUNICATIONS | DOI: 10.1038/ncomms8091 ARTICLE
NATURE COMMUNICATIONS | 6:7091 | DOI: 10.1038/ncomms8091 | www.nature.com/naturecommunications 5
& 2015 Macmillan Publishers Limited. All rights reserved.

In summary, these data demonstrate the functional effect of asingle genetic lesion in determining the aberrant methylome state,suggesting that epigenetic alterations act as a secondaryprecipitating event during leukaemia development.
5-Azacytidine reduces BCR-ABL cells oncogenic potential. Totest whether the inhibition of BCR-ABL-induced aberrant DNAmethylation could restore normal hematopoiesis during leukae-mogenesis, six leukaemic mice per group were treated for 4 weekswith AZA (2 mg kg� 1) or with the tyrosine kinase inhibitorimatinib (200 mg kg� 1; IM, first line treatment for CML),respectively. Mice treated with AZA exhibited no expansion ofthe Mac1þ Gr1þ myeloid population as compared with theuntreated counterpart, closely mimicking the results observed forthe IM-treated group used as a positive control. Furthermore,both AZA- and IM-treated mice displayed normal lymphopoiesis,absent in the untreated controls (Supplementary Fig. 5a). Thesedata indicate that despite their different mechanisms of action,both AZA, at the epigenetic level by correcting aberrant DNAmethylation and IM at the genetic level by blocking the BCR-ABLoncogene, are capable of re-establishing normal hematopoiesis.
To further evaluate the contribution of aberrant DNAmethylation to leukaemia development in vivo, 44 irradiatedB6.SJL-Ptprca Pepcb/BoyJ (pep boys) congenic recipient micewere transplanted with murine BCR-ABL leukaemic bonemarrow cells. Eight to ten mice were randomly assigned to five
groups: control (not leukaemic); leukaemic untreated, treatedwith AZA (2 mg kg� 1); or IM (200 mg kg� 1) or combination ofthe two drugs IM and AZA. The treatment was administered for4 weeks (Supplementary Fig. 5b) and the mice were followed upfor a period of up to 150 days. The untreated mice developedleukaemia (as expected) with a median survival of 41 days.Strikingly, the AZA treatment provided longer survival (mediansurvival 100 days; P¼ 0.0008) than the IM treatment (mediansurvival: 56 days; P¼ 0.03) as compared with the untreated mice.Unfortunately, the combination of AZA and IM, at their standarddosages, resulted in haematological and gastrointestinal toxicityfor the mice that did not allow us to make any conclusiveobservation on the potential benefits of using combination of thedrugs to correct the leukaemic phenotype. Future studies will benecessary to assess optimal dosage range and scheduling mode to:(1) reduce the toxicity and (2) understand the potential synergiceffect of the two drugs (Fig. 5b). Moreover, the AZA treatmentefficiently targeted the stem cell compartment (LSK populationfrom the CD45.2þ donor cells), restoring expression andpromoting demethylation of loci differentially methylatedbetween control and sick mice (Supplementary Data 2), such asthe Gdf3 (Growth differentiation factor 3) (SupplementaryFig. 6), a promising target of the BCR-ABL oncogene.
Taken together, these data indicate that DNA methylationaberrations play a critical role in CML development, supportingthe relevance of DNA methylation modulating drugs astherapeutic options.
RescuedCpG islands
LeukemicControl3.2105
105
104
104
103
103
102
102
101
101
105
105
104
104
103
103
102
102
101
101
105
105
104
104
103
103
102
102
101
101
105
105
104
104
103
103
102
102101
101
105
105
104
104
103
103
102
102101
101
105
105
104
104
103
103
102
102101
101
4 2.5
309126Sca1
cKit
Mac1
DNA methylation
Promoters
Leukemic
Rescued
Control
Genes
Leukemic
Rescued
Control
Leukemic
Hoxb1
96.228 mb 96.229 mb96.227 mbchr11
Rescued
Control
Leukemic
Rescued
Control
Leukemic
Rescued
Control
0 0.5 1
Gr1
Figure 4 | BCR-ABL activation induces the aberrant DNA methylation pattern in murine HSCs. (a) FACS analysis of BCR-ABL transgenic murine bone
marrow mononuclear cells in which the BCR-ABL oncogene is not expressed (‘control’), is expressed (‘leukaemic’) or repressed after previous expression
(‘rescued’). Leukaemic mice showed moderate expansion of the HSCs population cKitþ Sca1þ and a strong expansion of the Mac1þGr1þ myeloid
population compared with control and rescued animals. (b) DNA methylation analysis of CpG islands in the Lin�cKitþSca1þ population of BCR-ABL
transgenic mice with different status of oncogene expression. Zoomed-in region shows example of CpG islands differentially methylated between
leukaemic, control and rescue mice. Each row represents the average of two biological replicates. Each column represents a complete CpG island. Blue: high
methylation, red: low methylation. White colour indicates DNA regions not covered by RRBS analysis. (c) Heat map visualizing genes and promoters
hypermethylated in leukaemic mice versus control and rescued ones. (d) High-resolution view of DNA methylation of the Hoxb1 gene locus, which was
hypermethylated in leukaemic mice as compared with the control mice. Each row represents the average of two biological replicates; each column
represents a single CpG dinucleotide.
ARTICLE NATURE COMMUNICATIONS | DOI: 10.1038/ncomms8091
6 NATURE COMMUNICATIONS | 6:7091 | DOI: 10.1038/ncomms8091 | www.nature.com/naturecommunications
& 2015 Macmillan Publishers Limited. All rights reserved.

DiscussionThis study analysed the interconnection and functional relevanceof genetic and epigenetic alterations in CML. By derivinggenetically matched but epigenetically distinct LiPS cell linesfrom CML cell lines and human primary CML cells, and by usingan inducible mouse model of CML, we show that: (1) genetic andepigenetic alterations are both required to maintain the leukaemicpotential, and (2) that the BCR-ABL fusion protein is able totrigger DNA methylation changes that can act as a secondaryevent and contribute to leukaemia formation. Using nuclearreprogramming as an ‘epigenetic tool’ we were able to eraseaberrant DNA methylation from leukaemia cells, therebydelaying the onset of the malignancy. Among the leukaemia-specific DMRs, less than half were associated with promoters,whereas the vast majority corresponded to specific histone markssuch as enhancer-associated H3K4me1 and promoter-associatedH3K4me3. Interestingly, genes hypermethylated in LiPS com-pared with CML cells belonged to functional categories oflymphocyte activation and immune response. It has been shownthat iPS cells are defective in their antiviral response as a result ofthe downregulation of key genes involved in immuneresponse25,26. Similarly, attenuated antiviral response reportedin human ES cells is restored by differentiation, suggesting thatthe impaired antiviral response of iPS cells likely stemmed fromthe pluripotent state and might promote cell pluripotency25,26,34.
Our data show that the mice transplanted with CD45þ cellsderived from LiPS do not develop leukaemia within the 80 daysmonitoring time (Fig. 3b). In particular, we demonstrated thatleukaemia progression was susceptible not only to the geneticinhibition of the driving oncogene but also to the inhibition of thesecondary DNA methylation changes, which provides strongevidence for the cooperative role of both genetic and epigeneticalterations in leukaemia.
In a related study focusing on glioblastoma, Stricker et al.35
recently demonstrated that the reprogramming of glioblastoma
cells was also able to erase aberrant DNA methylation. But incontrast to our observations for CML, these induced epigeneticchanges were insufficient to compromise oncogenic potential, andneural progenitors derived from the reprogrammed glioblastomaremained highly malignant. This important difference betweenglioblastoma and CML supports the relevance of aberrant DNAmethylation specifically in CML, consistent with the much lowerrates of genetic alterations in leukaemia compared withglioblastoma36 and with the history of successful use of DNAmethylation inhibitors in leukaemias. This conclusion is furthersupported by comparing our results in CML with a recent studyfocusing on cells derived from Ewing sarcoma patients, which is asolid tumour driven by an oncogenic fusion protein EWS-FLI1.On knockdown, Tomazou et al.37 observed widespread changesin histone acetylation and histone methylation, whereas DNAmethylation patterns were largely unaffected. Consistent with thisobservation, AZA had a much weaker effect in EWS-FLI1-expressing cells than histone deacetylase inhibitors, whereas thefunctional impact of AZA on BCR-ABL-expressing cells in ourmouse model was striking and even exceeded those observed forimatinib.
Overall, these results highlight the specific relevance ofaberrant DNA methylation in CML, which are driven byBCR-ABL expression and are at the same time essential formaintaining a strong leukaemic phenotype in a mouse model.This study provides a rationale for broadly exploring the use ofdemethylating agents as adjuvant treatments in leukaemia, evenin subtypes with recurrent and well-characterized geneticabnormalities such as BCR-ABL.
Materials and methodsCell cultures and LiPS cells generation. Human K562 leukaemia cells (ATCCCCL-243) and U937 cells (ATCC CRL-1593.2) were cultured following the man-ufacturer’s instructions. KBM7 cells were a kind gift from the T. R. Brummelkamplaboratory. They were cultured in DMEM 10% fetal bovine serum (FBS). iPS
Control Untreated IM AZA+IM AZA
12.5%5.02%55.6%88.6%
Mac1
100
80
60
Per
cent
sur
viva
l
40
20
00 50 100 150 200
P=0.0008
UntreatedControl
AZAIM + AZAUnrelated death
IM
Days
6%
Gr1
0
0
102
102 103
103
104
104
105
105
0
0
102
102 103
103
104
104
105
105
0
0
102
102 103
103
104
104
105
105
0
0
102
102 103
103
104
104
105
105
0
0
102
102 103
103
104
104
105
105
Figure 5 | 5-Azacytidine reduces the oncogenic potential of BCR-ABL-expressing cells. (a) Peripheral blood FACS analysis of BCR-ABL transgenic mice
expressing BCR-ABL shows strong reduction of the Mac1þ and Gr1þ myeloid population in mice treated with imatinib, AZA or combination of the two
drugs. (b) Survival curve of B6.SJL-Ptprca Pepcb/BoyJ (pep boys) congenic recipient mice transplanted with BCR-ABL leukaemic bone marrow shows
prolonged survival rate upon AZA treatment as compared with imatinib group and untreated mice. Between 8–10 mice (diagram of treatment shown in
Supplementary Fig. 5b) were used per each group. (*Po0.05; **Po0.01 and ***Po0.001; Mantel-Cox Survival Test).
NATURE COMMUNICATIONS | DOI: 10.1038/ncomms8091 ARTICLE
NATURE COMMUNICATIONS | 6:7091 | DOI: 10.1038/ncomms8091 | www.nature.com/naturecommunications 7
& 2015 Macmillan Publishers Limited. All rights reserved.

derived from CD34þ cells were a gift from the George Daley laboratory and weremaintained in human ES cell media (Invitrogen) in the presence of FGF (Pepro-tech) and 20% of Replacement Serum (Invitrogen) as described in ref. 38. PrimaryCML total bone marrow mononuclear cells were obtained after a written informedconsent in accordance with the Declaration of Helsinki in agreement with theapproved protocol from the review board of the S.Orsola-Malpighi Hospital,Bologna, Italy. Primary samples were cultured in QBSF-60 (Quality Biological),20% FBS, SCF 50 mg ml� 1, TPO 20mg ml� 1, Flt3 10mg ml� 1, IL3 10 mg ml� 1.Retroviral infections were performed as described in refs 13,20. In brief, cells weretransduced with a pool of the four factors Oct4, Sox2, Klf4 and c-Myc in a ratio of1:1:1:1 for a 72 h period. At day 4 post transduction, regular medium was switchedto human ES cell media (Invitrogen) in the presence of FGF (Peprotech) and 20%of Replacement Serum (Invitrogen). After 15-16 days, human iPS-like colonieswere morphologically identified, picked and mechanically disaggregated onirradiated mouse embryonic fibroblasts (Globalstem). CML primary cells weretreated with 1 mM of 5-Azacytidine for 72 h to allow monocytic differentiation.
In vitro differentiation. Embryoid body (EB) formation was induced by culturinghuman LiPS in clumps in the absence of FGF in bacterial plates to avoid attach-ment to the bottom of the plates. To allow spontaneous endoderm formation, after3–4 days, embryoid bodies were transferred onto 0.2% gelatin-coated glass six-wellplates and cultured in differentiation medium (DMEM supplemented with 20%FBS, 2 mM l-glutamine, 0.1 mM 2-mercaptoethanol, nonessential amino acids andpenicillin–streptomycin, all from Invitrogen) for 2 to 3 weeks. The medium waschanged every other day. For mesoderm/cardiomyocyte differentiation, LiPS cellswere maintained on gelatin-coated plates in differentiated medium supplementedwith 100 mM ascorbic acid (Sigma).
For ectoderm differentiation, EBs were cultured on laminin (Stemgent) coatedsix-well plates. In brief, after 4 days in EB medium as a floating culture, the cellswere plated on laminin (Stemgent)-coated plates in N2B27 medium (Invitrogen),Sonic Hedgehog (0.1 mgml� 1) and FGF8 (100 ng ml� 1; both from Peprotech), andmaintained for 3 to 5 weeks in the absence of FGF2. The medium was changedevery other day.
Immunofluorescence analysis. Cells were grown in six-well plates and fixed with4% paraformaldehyde. The following antibodies were used: OCT4 (1:200; Abcam19857), NANOG (1:200; Abcam 21624), Tra1-81 (1:200; Abcam 16289), Tra1-60(1:200; Abcam 16288), Smooth Muscle Actinin (SMA; 1:200; Abcam 5694), Tuj1(1:200; Covance MMS-435P) and a-fetoprotein (1:200; Dako A 0008). Secondaryantibodies used were from Jackson Immunoresearch: DyLight 549-coniugatedAffiniPure Goat Anti-Rabbit IgG (1:250; 111-505-303); DyLight 488-coniugatedAffiniPure Donkey Anti-mouse IgG (1:250; 715-485-150) and were used accordingto the manufacturer’s guidelines. Images were taken using an Axiovert 200Mmicroscope (Zeiss).
Teratoma formation and analysis. Between 2 and 10 million iPS cells weremechanically scraped, pelleted, resuspended in 100ml of hES media and injectedsubcutaneously and intramuscularly into NOD.Cg-Prkdcscid Il2rgtm1Wjl/SzJ (NSG).Teratomas were harvested after 9 weeks, fixed overnight with 10% formaldehyde,embedded in paraffin, sectioned, HE stained and analysed using a BX40 micro-scope (Olympus). All the animal work and protocols were approved by theInstitutional Animal Care and Use Committee of Beth Israel Deaconess MedicalCenter (Protocol #006-2014) and were performed in accordance with the guide-lines set forth in the Guide for the Care and Use of Laboratory Animals of theNational Research Council of the National Institutes of Health.
Western blot analysis. Cells (200,000–500,000) were washed twice in PBSand then lysed in 50 mM Tris/HCl buffer, pH 8.0, containing 150 mM NaCl,1% Nonidet P-40, 2 mg ml� 1 aprotinin, 1 mg ml� 1 pepstatin, 2 mg ml� 1 leupeptinand 1 mM Na3VO4. Equal amounts of extracted proteins (50 mg) were loaded andseparated on SDS–PAGE (Invitrogen), and then transferred onto a nitrocellulosemembrane (Schleicher & Schuell Biosciences, Sandford, ME). Immunodetectionwas performed using the following primary antibodies: anti-ABL (1:500; MilliporeMABT203) and b-actin (1:2,000; Santa Cruz47778). Full western blot is presentedas Supplementary Fig. 7a.
Methylcellulose colony assay. Methylcellulose colony formation assays wereperformed with Methocult H4434 (Stem Cell Technologies) according to themanufacturer’s instructions. CD34þ /CD45þ cells sorted from Bone Marrow orfrom in vitro differentiated CML-LiPS were suspended in a culture mediumcontaining methylcellulose and plated onto 35-mm culture dishes at a densityof 103 (BM-derived) or 104 (CML-LiPS derived) cells/dish, in triplicates.Colonies were counted after 2 weeks and processed for differentiation markers byfluorescence-activated cell sorting (FACS) after 3 weeks.
SNP analysis. The analysis was performed using Affymetrix 6.0 SNP arraysplatform and then computationally using the Partek Genomics Suite. In brief,
normalization using global median was first performed for array intensities crossall chips. Copy numbers and allele ratios were then estimated by comparison with acommon reference to identify the copy number variations in the parental cell linesas well as the additional variations in copy numbers caused by reprogramming.Genomic segmentation was performed to smooth the data with the followingparameters: 10 as the minimum of data points (SNPs), 0.001 as the cutoff forP value, 0.2 as the noise-to-signal cutoff.
Reduced representation bisulfite sequencing. RRBS was performed as it follows.Genomic DNA was isolated from K562, K562-LiPS1, K562-LiPS2, KBM7, KBM7-LiPS1, KBM7-LiPS2, primary CML, CML-LiPS1 and CML-LiPS2, CD34þ iPS anddigested with MspI (NEB), a methylation-insensitive enzyme that cuts C’CGG sitesindependent of the DNA methylation status of the centre CpG. Digested DNA wassize selected on a 4% NuSieve 3:1 Agarose gel (Lonza). For each sample, two slicescontaining DNA fragments of 40–120 bp and 120–220 bp, respectively, wereexcised from the unstained preparative portion of the gel. These two size fractionswere kept apart throughout the procedure including the final sequencing. Pre-annealed Illumina adaptors containing 5’-methyl-cytosine instead of cytosine wereligated to ends of size-selected MspI fragments. Adapter-ligated fragments werebisulfite-treated using the Epitect kit (Qiagen). The products were PCR amplified,size selected and sequenced on the Illumina GA IIx at a reading length of 36 bp.Sequencing reads were mapped to the human genome assembly NCBI37/hg19 andmm9 for human and mouse data, respectively, using RRBSMAP39 allowing twomismatches. Methylation levels were called using the BisSNP software40. RRBSdata for human H1 ES line passage 37 and 38 and CD34þ cells were obtained fromthe Roadmap Epigenomics Project. Further processing was done using RnBeads(http://rnbeads.mpi-inf.mpg.de/)41.In this analysis, promoter methylation wasdefined as the mean across all scores for CpGs within a window of � 1,500 bp toþ 500 bp of the TSS of Ensembl-annotated genes. Differentially methylated siteswere identified using a ranking-based approach taking into account statisticaltesting as well as absolute and relative differences in methylation levels between thetwo groups of samples. In brief, we defined a combined ranking score for a singleCpG as the maximum, that is, worst, rank among the following three criteria: (a)absolute difference in group mean methylation levels, (b) absolute log ratios ingroup mean methylation levels and (c) P values originating from hierarchical linearmodels42. For genomic regions, such as CpG islands, genes, promoters, and so on,the combined ranking score was defined analogously based on (a) mean differencesin mean methylation levels across all CpGs in a particular region (b) meanratios of mean methylation levels across CpGs (c) combining the CpG specificP values using an extension of Fisher’s method43. Full RnBeads analysisreports, including tables characterizing differential methylation, can be accessedat http://reprogramming-leukemia.computational-epigenetics.org/.
Bisulfite sequencing. Methylation profiling of CEBPA, gene loci was performedusing 1 mg of genomic DNA. For the analysis DNA was bisulfite converted usingthe EpiTect kit (Qiagen). The primers and PCR conditions for bisulfite sequencingare: F-OCT4: 50-TAG TTG GGA TGT GTA GAG TTT GAGA-30 , R-OCT4:50-TAA ACC AAA ACA ATC CTT CTA CTC C-30 ; F- CEBPA: 50-TAG TTT YGTTAG TTT GGG GGG TTT-30 , R- CEBPA: 50-TCT AAT CTC CAA ACT ACCCCT ATA-30 ; F-CEBPA coding region: 50-AGG TTA AGG YGG TTG TGG GTTTTA-30 ; R- CEBPA: 50-CCA ACT ACT TAA CTT CAT CCT CCT-30 . PCRproducts were gel purified (Qiagen) and cloned into a plasmid vector, pGEM-TEasy Vector System (Promega). Sequencing results were analysed using BiQAnalyzer software44.
Methylation-specific PCR. Genomic DNA from B4� 10� 103 CD45þ /Lineage� / cKitþ / Sca1þ cells was directly bisulfite converted using the EZ DNAMethylation kit (Zymo Research) according to the manufacturer’s instructions.Bisulfite-treated genomic DNA was amplified using AmpliTaq Gold 360 MasterMix (Life Technology) and methylated (M) or unmethylated (UM)-specific primersets, designed with the MethPrimer software45. Gdf3-M Forward: 50-TTA TAGGTT TTA ATT TGT GTT TCG C-30 ; Gdf3-M Reverse: 50-AAT TTT TCT CTAATA AAC CCT CGA A-30 ; Gdf3-UM Forward: 50-ATA GGT TTT AAT TTGTGT TTT GTG T-30 and Gdf3-UM Reverse 50-AAT TTT TCT CTA ATA AACCCT CAA A-30 . Integral gel presented in Supplementary Fig. 7b.
In vitro hematopoietic differentiation. Embryoid bodies were produced byscraping of confluent LiPS cells and cultured in suspension in EB medium(90% DMEM, 10% FBS) for 96 h. Embryoid bodies were then placed over a feederlayer of confluent OP9 stromal cells and allowed to attach. The medium used forthe first 48 h of differentiation was 50% EB medium and 50% hematopoieticdifferentiation medium. The hematopoietic differentiation medium was preparedwith QBSF-60 serum-free medium (Quality Biological Inc) supplemented withcytokines BMP4 (10 ng ml� 1), VEGF (10 ng ml� 1), SCF (25 ng ml� 1), FGF(10 ng ml� 1), TPO (20 ng ml� 1) and Flt ligand (10 ng ml� 1; all from Peprotech).After 48 h, cells were cultured with hematopoietic differentiation medium, withmedium changes every 48 h until the end of the differentiation protocol. At day 26,OP9 and embryoid bodies were collected by trypsinization (0.05% trypsin), washedand labelled for the cytofluorimetric analysis.
ARTICLE NATURE COMMUNICATIONS | DOI: 10.1038/ncomms8091
8 NATURE COMMUNICATIONS | 6:7091 | DOI: 10.1038/ncomms8091 | www.nature.com/naturecommunications
& 2015 Macmillan Publishers Limited. All rights reserved.

FACS analysis and sorting. Cells were suspended in Caþ þ Mgþ þ -free PBScontaining 2% (vol/vol) FBS (Globalstem). Human hematopoietic progenitors cellswere identified by labelling with CD45-PE (1:50; clone HI30) and or CD34-APC(1:50; clone 561) while mature phenotypes were analysed using CD15-Pacific Blue(monocytes and granulocytes) (1:50; clone W6D3/HI98), CD14-FITC (monocytesand macrophages clone 1:50; M5E2); CD11b (1:50; ICRF44; macrophages) andGlycophorin-PECy5 (red blood cell membrane), and erythroid precursors(1:50; Clone HIR2; all from Biolegend). Murine hematopoietic cells were identifiedusing the following antibodies: Mac1/CD11b-PECy7 (1:200; clone M1/70), Gr1-PE(1:200; clone 8C5), B220-PECy5 (1:100; clone RA3-6B2), Sca1-APC (1:100; cloneE13-161-7), c-Kit-APCCy7 (1:100; clone 2B8): CD45.1-APC (1:100; clone A20)and CD45.2-FITC (1:100; clone 104; all from Biolegends). All antibodies wereincubated at the concentration suggested by the manufacturer for 30 min on ice.Non-specific signals and dead cells were excluded by appropriate fluorochrome-conjugated isotype and propidium iodide staining, respectively. Cell fluorescencewas analysed with the FACSAria II (Becton Dickinson).
Quantitative reverse transcription PCR. Total RNA was isolated from cells usingTRIzol reagent (Invitrogen) and RNeasy Plus Mini Kit (Qiagen). Genomic DNAwas eliminated with RNase-free DNase 1 (Roche), and total RNA was then sub-jected to another round of purification by phenol solution with pH4.3±0.2(Sigma-Aldrich). For pluripotent gene expression analysis, cDNA was generated bySuperScript II reverse transcriptase (Invitrogen) with random hexamers(Invitrogen) from 1 mg of total RNA, and real-time PCR was performed withGoTaq qPCR Master Mix (Promega). Expression of CEBPA was quantifiedusing Taqman one-step reverse transcription (RT)-PCR master mix (AppliedBiosystems) relative to b-Actin. Primers used for CEBPA qRT-PCR were FW50-TCG GTG GAC AAG AAC AG-30 ; REV 50-GCA GGC GGT CAT TG-30 ;Taqman Probe 50-FAM ACA AGG CCA AGC AGC GC-30 . b-ACTIN waspurchased from Applied Biosystem. Primers employed for BCR-ABL detection inqRT-PCR were: FW 50-GCA TTC CGC TGA CCA TCA AT-30 ; REV 50–TGG GTCCAG CGA GAA GGT T-30; probe 50-FAM-CCA GTA GCA TCT GAC TTT GAGCCT CAG GG-TAMRA-30 (ref. 46).
For Gdf3 RNA was isolated from whole bone marrow mononuclear cells orCD45.2þ /LSK cells using TRIzol reagent (Invitrogen) and RNeasy mini kit(QIAGEN). cDNA was synthesized with Superscript First-Strand Synthesis Systemaccording to manufacturer’s instructions (Invitrogen). qPCR was performed withSYBR reagent (Bio-Rad). Primers used were: Gdf3_F1 (Forward): 50-GAA CCT GCTTCA GCT TCT CC-30; Gdf3_R1 (Reverse): 50-CCA TGG TCA ACT TTG CCT TT-30 . Gdf3 expression levels were normalized to that of Gapdh: Forward 50-CCAGCC TCG TCC CGT AGA C-30; Reverse 50-CCC TTG ACT GTG CCG TTG-30 .
Transplantation of immunocompromised and B6.SJL-Ptprca Pepcb/BoyJ.Sorted LiPS-derived CD45þ cells and K562 cells were transferred by intra-orbitalinjection into sublethally irradiated (150 cGy) 6-week-old recipient NSG mice(20,000 cells per mice). Transplanted mice were sacrificed for isolation of bonemarrow and spleen. Transplantation was performed in quadruplicate for LiPS 1clone and K562 and in triplicate for LiPS3 clone.
1� 106 whole bone marrow cells obtained from SCL-tTA/BCR-ABL transgenicmice were transplanted by intra-orbital injection into 44-six-week-old CD45.1B6.SJL-Ptprca Pepcb/BoyJ congenic mice lethally irradiated. Tetracycline wasmaintained in the drinking water for 3 weeks after transplantation. BCR-ABLexpression was induced by the withdrawal of tetracycline and 2 weeks afterBCR-ABL induction, treatment was started. Mice were randomly assigned to fivegroups: Control (Bcr-Abl un-induced); untreated (Bcr-Abl induced); IM (Bcr-Ablinduced, treated with imatinib); AZA (Bcr-Abl induced, treated with 5-Azacytidine);IMþAZA (Bcr-Abl induced, treated with imatinib and 5-Azacytidine). The IMgroup received imatinib at the dosage of 200 mg kg� 1 by gavauge, every other day.The AZA group received 5-Azacytidine by intraperitoneal injection at the dosage of2 mg kg� 1 every other day. The IM-AZA group received a combination of imatinib,200 mg kg� 1 by gavage, and 5-Azacytidine by intraperitoneal injection at the dosageof 2 mg kg� 1 every other day. Mice were followed up for 150 days.
Statistical analysis. Survival curves were analysed using the Kaplan–Meiermethod. Differences in the survival curves were evaluated with the log-rank test.Values of P r0.05 were considered statistically significant.
Statistical analyses of qRT-PCR were performed with paired two-tailedStudent’s t-test. Error bars indicate mean (nZ3)±standard deviation (s.d.).
References1. Rosenbauer, F. et al. Acute myeloid leukemia induced by graded reduction of a
lineage-specific transcription factor, PU.1. Nat. Genet. 36, 624–630 (2004).2. Bereshchenko, O. et al. Hematopoietic stem cell expansion precedes the
generation of committed myeloid leukemia-initiating cells in C/EBPalphamutant AML. Cancer Cell 16, 390–400 (2009).
3. Ben-Neriah, Y., Daley, G. Q., Mes-Masson, A. M., Witte, O. N. & Baltimore, D.The chronic myelogenous leukemia-specific P210 protein is the product of thebcr/abl hybrid gene. Science 233, 212–214 (1986).
4. Herman, J. G. & Baylin, S. B. Gene silencing in cancer in association withpromoter hypermethylation. N. Engl. J. Med. 349, 2042–2054 (2003).
5. Feinberg, A. P. & Tycko, B. The history of cancer epigenetics. Nat. Rev. Cancer4, 143–153 (2004).
6. Jelinek, J. et al. Aberrant DNA methylation is associated with diseaseprogression, resistance to imatinib and shortened survival in chronicmyelogenous leukemia. PloS ONE 6, e22110 (2011).
7. Reynaud, D. et al. IL-6 controls leukemic multipotent progenitor cell fate andcontributes to chronic myelogenous leukemia development. Cancer Cell 20,661–673 (2011).
8. Feinberg, A. P., Ohlsson, R. & Henikoff, S. The epigenetic progenitor origin ofhuman cancer. Nat. Rev. Genet. 7, 21–33 (2006).
9. Machova Polakova, K., Koblihova, J. & Stopka, T. Role of epigenetics in chronicmyeloid leukemia. Curr. Hematol Malig. Rep. 8, 28–36 (2013).
10. Strathdee, G. et al. Inactivation of HOXA genes by hypermethylation inmyeloid and lymphoid malignancy is frequent and associated with poorprognosis. Clin. Cancer Res. 13, 5048–5055 (2007).
11. Wang, Y. L. et al. Methylation status of DDIT3 gene in chronic myeloidleukemia. J. Exp. Clin. Cancer Res. 29, 54 (2010).
12. Figueroa, M. E. et al. DNA methylation signatures identify biologically distinctsubtypes in acute myeloid leukemia. Cancer Cell 17, 13–27 (2010).
13. Takahashi, K. et al. Induction of pluripotent stem cells from adult humanfibroblasts by defined factors. Cell 131, 861–872 (2007).
14. Amabile, G. & Meissner, A. Induced pluripotent stem cells: currentprogress and potential for regenerative medicine. Trends. Mol. Med. 15, 59–68(2009).
15. Carette, J. E. et al. Generation of iPSCs from cultured human malignant cells.Blood 115, 4039–4042 (2010).
16. Miyoshi, N. et al. Defined factors induce reprogramming of gastrointestinalcancer cells. Proc. Natl Acad. Sci. USA 107, 40–45 (2010).
17. Kumano, K. et al. Generation of induced pluripotent stem cells from primarychronic myelogenous leukemia patient samples. Blood 119, 6234–6242 (2012).
18. Mikkelsen, T. S. et al. Dissecting direct reprogramming through integrativegenomic analysis. Nature 454, 49–55 (2008).
19. Koschmieder, S. et al. Inducible chronic phase of myeloid leukemia withexpansion of hematopoietic stem cells in a transgenic model of BCR-ABLleukemogenesis. Blood 105, 324–334 (2005).
20. Amabile, G. et al. In vivo generation of transplantable human hematopoieticcells from induced pluripotent stem cells. Blood 121, 1255–1264 (2013).
21. Bock, C. et al. Quantitative comparison of genome-wide DNA methylationmapping technologies. Nat. Biotechnol. 28, 1106–1114 (2010).
22. Gu, H. et al. Genome-scale DNA methylation mapping of clinical samples atsingle-nucleotide resolution. Nat. Methods 7, 133–136 (2010).
23. Kim, K. et al. Epigenetic memory in induced pluripotent stem cells. Nature 467,285–290 (2010).
24. Lister, R. et al. Hotspots of aberrant epigenomic reprogramming in humaninduced pluripotent stem cells. Nature 471, 68–73 (2011).
25. Chen, G. Y. et al. Defective antiviral responses of induced pluripotent stem cellsto baculoviral vector transduction. J. Virol. 86, 8041–8049 (2012).
26. Chen, L. L., Yang, L. & Carmichael, G. G. Molecular basis for an attenuatedcytoplasmic dsRNA response in human embryonic stem cells. Cell Cycle 9,3552–3564 (2010).
27. Halachev, K., Bast, H., Albrecht, F., Lengauer, T. & Bock, C. EpiExplorer: liveexploration and global analysis of large epigenomic datasets. Genome. Biol. 13,R96 (2012).
28. Ohm, J. E. et al. A stem cell-like chromatin pattern may predispose tumorsuppressor genes to DNA hypermethylation and heritable silencing. Nat. Genet.39, 237–242 (2007).
29. Schlesinger, Y. et al. Polycomb-mediated methylation on Lys27 of histone H3pre-marks genes for de novo methylation in cancer. Nat. Genet. 39, 232–236(2007).
30. Vodyanik, M. A., Bork, J. A., Thomson, J. A. & Slukvin, I. I. Human embryonicstem cell-derived CD34þ cells: efficient production in the coculture withOP9 stromal cells and analysis of lymphohematopoietic potential. Blood 105,617–626 (2005).
31. Krivtsov, A. V. et al. Cell of origin determines clinically relevant subtypes ofMLL-rearranged AML. Leukemia. 27, 852–860 (2013).
32. Alvarez, S. et al. DNA methylation profiles and their relationship withcytogenetic status in adult acute myeloid leukemia. PloS ONE 5, e12197 (2010).
33. Sasaki, M. et al. IDH1(R132H) mutation increases murine haematopoieticprogenitors and alters epigenetics. Nature 488, 656–659 (2012).
34. Hong, X. X. & Carmichael, G. G. Innate immunity in pluripotent humancells: attenuated response to interferon-beta. J. Biol. Chem. 288, 16196–16205(2013).
35. Stricker, S. H. et al. Widespread resetting of DNA methylation in glioblastoma-initiating cells suppresses malignant cellular behavior in a lineage-dependentmanner. Genes Dev. 27, 654–669 (2013).
NATURE COMMUNICATIONS | DOI: 10.1038/ncomms8091 ARTICLE
NATURE COMMUNICATIONS | 6:7091 | DOI: 10.1038/ncomms8091 | www.nature.com/naturecommunications 9
& 2015 Macmillan Publishers Limited. All rights reserved.

36. Appin, C. L. & Brat, D. J. Molecular genetics of gliomas. Cancer J. 20, 66–72(2014).
37. Tomazou, E. M. et al. Epigenome mapping reveals distinct modes of generegulation and widespread enhancer reprogramming by the oncogenic fusionProtein EWS-FLI1. Cell Rep. 10, 1082–1095 (2015).
38. Loh, Y. H. et al. Generation of induced pluripotent stem cells from humanblood. Blood 113, 5476–5479 (2009).
39. Xi, Y. & Li, W. BSMAP: whole genome bisulfite sequence MAPping program.BMC Bioinformatics 10, 232 (2009).
40. Liu, Y., Siegmund, K. D., Laird, P. W. & Berman, B. P. Bis-SNP: CombinedDNA methylation and SNP calling for Bisulfite-seq data. Genome Biol. 13, R61(2012).
41. Assenov, Y. et al. Comprehensive analysis of DNA methylation data withRnBeads. Nat. Methods 11, 1138–1140 (2014).
42. Smyth, G. K. Linear models and empirical bayes methods for assessingdifferential expression in microarray experiments. Stat. Appl. Genet. Mol. Biol.3, Article3 (2004).
43. Bock, C. Analysing and interpreting DNA methylation data. Nat. Rev. Genet.13, 705–719 (2012).
44. Bock, C. et al. BiQ Analyzer: visualization and quality control for DNAmethylation data from bisulfite sequencing. Bioinformatics 21, 4067–4068(2005).
45. Li, L. C. & Dahiya, R. MethPrimer: designing primers for methylation PCRs.Bioinformatics 18, 1427–1431 (2002).
46. Amabile, M. et al. Real-time quantification of different types of bcr-abltranscript in chronic myeloid leukemia. Haematologica 86, 252–259 (2001).
47. Ernst, J. & Kellis, M. ChromHMM: automating chromatin-state discovery andcharacterization. Nat. Methods 9, 215–216 (2012).
AcknowledgementsWe are grateful to Stephen Baylin and Pier Paolo Pandolfi for critical reading of themanuscript.
We thank Joseph E. Shay for initial help with karyotype. We are grateful to GeorgeDaley (HSCI) for providing the iPS clone derived from CD34þ human cells. G.A. was
supported by the American-Italian Cancer Foundation and by Collegio Ghislieri fel-lowship program during this study. A.D.R. was supported by the NIH training grant T32HL007917-11A1 to Beth Israel Deaconess Medical Center and the K99/R00 CareerDevelopment Award (1K99CA188595-01). R.S.W. was supported by the Jose CarrerasAward FIJC F 10/01. H.Z. was supported by the T32 training grant HL007917-16A1. E.L.was supported by the FAMRI YCSA 052409, FAMRI CIA 103063 and the Lauri StraussLeukemia Foundation Discovery grant. This project was supported by the Harvard StemCell Institute, the Amelia Peabody Foundation, NIH grant CA118316, and a SingaporeTranslational Research (STaR) Award to D.G.T.; and by LLS SCOR #7015 to M.M.L.
Author contributionsD.G.T. supervised the project; G.A., A.D.R. and R.S.W. conceived and designed the study;G.A., A.D.R., R.S.W., A.K.E., H.Z., L.Q., M.M.L. and E.L. performed the experiments;F.M. and H.Y. analysed RRBS and microarrays data; M.E.F. assisted in the RRBS analysis;G.M. provided procurement and initial characterization of the primary CML samples;T.B. provided the near-haploid leukaemic cell line KBM7. G.A., A.D.R., C.B. and D.G.T.wrote the paper.
Additional informationAccession codes: RRBS data have been deposited in the gene expression omnibus (GEO)database under the accession number GSE50456.
Supplementary Information accompanies this paper at http://www.nature.com/naturecommunications
Competing financial interests: The authors declare no competing financial interests.
Reprints and permission information is available at http://npg.nature.com/reprintsandpermissions/
How to cite this article: Amabile, G. et al. Dissecting the role of aberrant DNAmethylation in human leukaemia. Nat. Commun. 6:7091 doi: 10.1038/ncomms8091(2015).
ARTICLE NATURE COMMUNICATIONS | DOI: 10.1038/ncomms8091
10 NATURE COMMUNICATIONS | 6:7091 | DOI: 10.1038/ncomms8091 | www.nature.com/naturecommunications
& 2015 Macmillan Publishers Limited. All rights reserved.


