Embed Size (px)
Citation preview
Acta Universitatis Agriculturae Sueciae
Doctoral Thesis No. 2022:9
The overall aims of the thesis were to identify genetic variants associated with
athletic performance and conformation traits in horses, as well as to investigate
the level of inbreeding in Coldblooded trotters. The results contribute to the
understanding of the genetics of complex traits such as athletic performance,
blood pressure regulation, inflammation, and anthropometric traits in horses. This
information may also be valuable for humans and other mammalian species.
Maria Rosengren received her doctoral education at the Department of
Animal Breeding and Genetics, SLU. She obtained her MSc in Veterinary
Medicine at SLU and MSc in Medical Research at Uppsala University.
Acta Universitatis Agriculturae Sueciae presents doctoral theses from the
Swedish University of Agricultural Sciences (SLU).
SLU generates knowledge for the sustainable use of biological natural
resources. Research, education, extension, as well as environmental monitoring
and assessment are used to achieve this goal.
Online publication of thesis summary: http://pub.epsilon.slu.se/
ISSN 1652-6880
ISBN (print version) 978-91-7760-893-6
ISBN (electronic version) 978-91-7760-894-3
Doctoral T
hesis N
o. 2022:9 • Dissecting the genetics of athletic perform
ance and… • M
aria Rosengren
Doctoral Thesis No. 2022:9Faculty of Veterinary Medicine and Animal Science
Dissecting the genetics of athleticperformance and conformation traits in
horses
Maria Rosengren
Dissecting the genetics of athletic performance and conformation traits in
horses
Maria Rosengren Faculty of Veterinary Medicine and Animal Science
Department of Animal Breeding and Genetics Uppsala
DOCTORAL THESIS Uppsala 2022
Acta Universitatis agriculturae Sueciae 2022:9
Cover: Description of photograph (Åre istrav kallblod) (photo: Wille Carlsson / Fjellfotografen)
ISSN 1652-6880 ISBN (print version) 978-91-7760-893-6 ISBN (electronic version) 978-91-7760-894-3 © 2022 Maria Rosengren, Swedish University of Agricultural Sciences Uppsala Print: SLU Service/Repro, Uppsala 2022
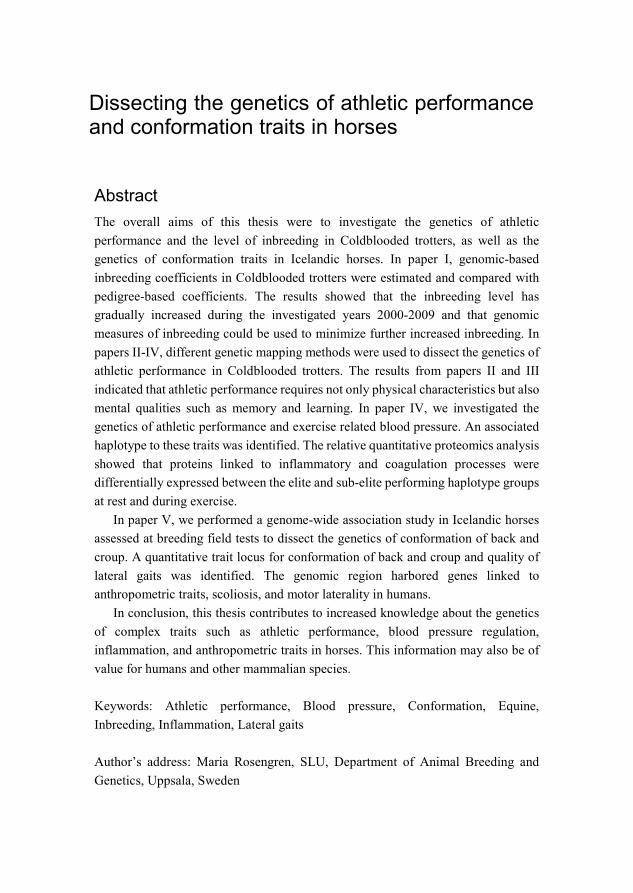
Abstract The overall aims of this thesis were to investigate the genetics of athletic performance and the level of inbreeding in Coldblooded trotters, as well as the genetics of conformation traits in Icelandic horses. In paper I, genomic-based inbreeding coefficients in Coldblooded trotters were estimated and compared with pedigree-based coefficients. The results showed that the inbreeding level has gradually increased during the investigated years 2000-2009 and that genomic measures of inbreeding could be used to minimize further increased inbreeding. In papers II-IV, different genetic mapping methods were used to dissect the genetics of athletic performance in Coldblooded trotters. The results from papers II and III indicated that athletic performance requires not only physical characteristics but also mental qualities such as memory and learning. In paper IV, we investigated the genetics of athletic performance and exercise related blood pressure. An associated haplotype to these traits was identified. The relative quantitative proteomics analysis showed that proteins linked to inflammatory and coagulation processes were differentially expressed between the elite and sub-elite performing haplotype groups at rest and during exercise.
In paper V, we performed a genome-wide association study in Icelandic horses assessed at breeding field tests to dissect the genetics of conformation of back and croup. A quantitative trait locus for conformation of back and croup and quality of lateral gaits was identified. The genomic region harbored genes linked to anthropometric traits, scoliosis, and motor laterality in humans.
In conclusion, this thesis contributes to increased knowledge about the genetics of complex traits such as athletic performance, blood pressure regulation, inflammation, and anthropometric traits in horses. This information may also be of value for humans and other mammalian species.
Keywords: Athletic performance, Blood pressure, Conformation, Equine, Inbreeding, Inflammation, Lateral gaits
Author’s address: Maria Rosengren, SLU, Department of Animal Breeding and Genetics, Uppsala, Sweden
Dissecting the genetics of athletic performance and conformation traits in horses
Dissecting the genetics of athletic performance and conformation traits in horses
Sammanfattning Det övergripande målet med denna avhandling var att undersöka den genetiska bakgrunden till atletisk prestation och inavelsgraden hos kallblodstravare samt den genetiska bakgrunden till exteriöra egenskaper hos islandshästar. I den första studien undersökte vi inavelsgraden hos kallblodstravare genom att använda både information från stamtavlor och molekylär genetisk data. Resultaten visade att inavelskoefficienten gradvis har ökat under de år som studerades (2000-2009) och att genomiska mått på inavelsgrad skulle kunna användas för att förhindra fortsatt ökad inavel. I delarbetena II-IV använde vi olika genetiska kartläggningsmetoder för att undersöka den genetiska bakgrunden till atletisk prestation hos kallblodstravare. Resultaten från delarbetena II och III indikerade att inte bara fysiska egenskaper är viktiga för atletisk prestation utan även mentala egenskaper som minne och inlärning. I delarbete IV undersökte vi den genetiska bakgrunden till atletisk prestation och träningsrelaterat blodtryck. En associerad haplotyp identifierades. Den relativa kvantitativa proteomik analysen visade att uttrycket av plasma proteiner kopplade till inflammation och koagulation skilde sig mellan haplotyp grupperna associerad med elit respektive subelit atletisk prestation.
I delarbete V undersöktes genomet hos islandshästar som bedömts vid avelsbedömning för att identifiera den genetiska bakgrunden till exteriör av rygg och kors. En genomisk region identifierades som inte bara påverkade exteriör av rygg och kors utan också kvaliteten av de laterala gångarterna passgång och tölt. Den genomiska regionen innehöll gener som hos människa är kända att vara kopplade till kroppslängd, skolios och motorisk lateralitet.
Sammanfattningsvis bidrar denna avhandling till ökad kunskap om den genetiska bakgrunden till komplexa egenskaper såsom atletisk prestation, blodtrycksreglering, inflammation och antropometriska egenskaper hos hästar. Denna information kan även vara värdefull för människor och andra däggdjursarter.
Nyckelord: Atletisk prestation, Blodtryck, Exteriör, Häst, Inflammation, Inavel, Laterala gångarter
Författarens adress: Maria Rosengren, Sveriges Lantbruksuniversitet, SLU, Institutionen för husdjursgenetik, Uppsala, Sverige

“Any living cell carries with it the experiences of a billion years of experimentation by its ancestors.” Max Delbruck, 1949.
Preface


To my family, friends, and all wonderful horses.
Dedication

List of publications ......................................................................... 11
Related work by the author ............................................................ 15
Abbreviations ................................................................................ 17
1. Introduction .......................................................................... 19 1.1 History of the horse and domestication ....................................... 19
1.1.1 Horse breeding and selection ......................................... 20 1.1.2 Inbreeding ....................................................................... 21 1.1.3 The horse as a model for genomic studies ..................... 21 1.1.4 Coldblooded trotters ....................................................... 22 1.1.5 Icelandic horses .............................................................. 23
1.2 Genomics and trait mapping ....................................................... 25 1.2.1 The horse genome ......................................................... 25 1.2.2 Genome-wide association studies .................................. 25 1.2.3 Selective sweep mapping ............................................... 26 1.2.4 Whole-genome sequencing ............................................ 26 1.2.5 Fine-mapping and identification of candidate causal genetic variants ........................................................................... 27 1.2.6 Functional genomics ....................................................... 28 1.2.7 Protein analysis .............................................................. 29
1.3 Athletic performance ................................................................... 30 1.3.1 Blood pressure regulation ............................................... 30 1.3.2 Blood pressure measurement ........................................ 32
1.4 Conformation of back and croup and gait quality........................ 33
2. Aims of the thesis ................................................................. 35
3. Summary of studies (I-V) ..................................................... 37
Contents
3.1 Study I – Genomic measures of inbreeding in the Norwegian–Swedish Coldblooded Trotter and their associations with known QTL for reproduction and health traits ........................................................... 37 3.2 Study II – Exploring the genetics of trotting racing ability in horses using a unique Nordic horse model ....................................................... 40 3.3 Study III – A genome-wide association study for harness racing success in the Norwegian-Swedish Coldblooded Trotter reveals genes for energy metabolism and learning ............................................................ 43 3.4 Study IV – Genetic regulation of racing performance and exercise related blood pressure in Coldblooded trotters ...................................... 46 3.5 Study V – A QTL for conformation of back and croup influences lateral gait quality in Icelandic horses .................................................... 48
4. General discussion and future perspectives ......................... 53
5. Concluding remarks ............................................................. 57
References .................................................................................... 59
Popular science summary ............................................................. 77
Populärvetenskaplig sammanfattning ............................................ 81
Acknowledgements ....................................................................... 85
11
This thesis is based on the work contained in the following papers, referred to by Roman numerals in the text:
I. Velie BD, Solé M, Jäderkvist Fegraeus K, Rosengren MK, RøedKH, Ihler CF, Strand E, Lindgren G. (2019). Genomic measuresof inbreeding in the Norwegian–Swedish Coldblooded Trotterand their associations with known QTL for reproductionand health traits. Genetics Selection Evolution. 51, 22.https://doi.org/10.1186/s12711-019-0465-7
II. Velie BD, Lillie M, Jäderkvist Fegraeus K, Rosengren MK, SoléM, Ihler CF, Strand E, Lindgren G. (2019). Exploring the geneticsof trotting racing ability in horses using a unique Nordic horsemodel. BMC Genomics. 20, 104. https://doi.org/10.1186/s12864-019-5484-9
III. Velie BD, Jäderkvist Fegraeus K, Solé M, Rosengren MK, RøedKH, Ihler CF, Strand E, Lindgren G. (2018). A genome-wideassociation study for harness racing success in the Norwegian-Swedish Coldblooded Trotter reveals genes for energymetabolism and learning. BMC Genetics. 19, 80.https://doi.org/10.1186/s12863-018-0670-3
IV. Rosengren MK, Naboulsi R, Åbrink M, Meadows JRS, Velie BD,Negro JJ, Jouni A, Thorsell A, Sihlbom C, Mattsson CM,Andersson G & Lindgren G. (2022). Genetic regulation of racingperformance and exercise related blood pressure in Coldbloodedtrotters. Manuscript
List of publications

12
V. Rosengren MK, Sigurðardóttir H, Eriksson S, Naboulsi R, JouniA, Novoa-Bravo M, Albertsdóttir E, Kristjánsson Þ, Rhodin M,Viklund Å, Velie BD, Negro JJ, Solé M, Lindgren G. (2021). AQTL for conformation of back and croup influences lateral gaitquality in Icelandic horses. BMC Genomics. 22, 267.https://doi.org/10.1186/s12864-021-07454-z
Papers I-III and V are reproduced with the permission of the publishers.
13
The contribution of Maria Rosengren to the papers included in this thesis was as follows:
I. Contributed to sample collection. Extracted DNA and preparedsamples for array analysis. Read, commented, and approved thefinal manuscript.
II. Contributed to sample collection. Extracted DNA and preparedsamples for sequencing. Discussed and contributed to dataanalysis. Read, commented, and approved the final manuscript.
III. Contributed to sample collection. Extracted DNA and preparedsamples for array analysis. Read, commented, and approved thefinal manuscript.
IV. Collected samples and measured blood pressure. Performed dataanalysis, and most of the bioinformatics and whole-genomesequence data analysis. Performed lab work. Extracted DNA,prepared samples for sequencing, performed genotyping, long-range PCR and gel electrophoresis. Interpretation of the resultstogether with the co-authors. Drafted the manuscript.
V. Collected samples, extracted DNA, and prepared the samples forarray analysis. Performed the GWAS and haplotype associationanalysis. Interpreted the results together with co-authors. Draftedthe manuscript together with the co-authors Heiðrún and Marina.Had the responsibility for the final version of the manuscript,submission process, and correspondence with the journal.

15
(Not included in the thesis)
Johansson MK, Jäderkvist Fegraeus K, Ekesten B & Lindgren G. The refractive state of the eye in Icelandic horses with the Silver mutation. BMC Veterinary Research. 2017,13:153. doi: 10.1186/s12917-017-1059-7.
Jäderkvist Fegraeus K, Lawrence C, Petäjistö K, Johansson MK, Wiklund M, Olsson C, Andersson L, Andersson LS, Røed KH, Ihler C-F, Strand E, Lindgren G, Velie BD. Lack of significant associations with early career performance suggest no link between the DMRT3 "Gait Keeper" mutation and precocity in Coldblooded trotters. PLoS One. 2017; 12(5): e0177351. doi: 10.1371/journal.pone.0177351.
Velie BD, Smith PM, Fjordbakk CT, Solé M, Jäderkvist Fegraeus K, Rosengren MK, Røed KH, Ihler CF, Lindgren G, Strand E. Exploring the genetics underpinning dynamic laryngeal collapse associated with poll flexion in Norwegian-Swedish Coldblooded Trotter racehorses. 2019 Aug 28 Equine vet J. doi: 10.1111/evj.13171.
Ghosh S, Davis BW, Rosengren MK, Jevit MJ, Castaneda C, Arnold C, Jaxheimer J, Love CC, Varner DD, Lindgren G, Wade CM, Raudsepp T. Characterization of a Homozygous Deletion of Steroid Hormone Biosynthesis Genes in Horse Chromosome 29 as a Risk Factor for Disorders of Sex Development and Reproduction. Genes 2020, 11, 251. https://doi.org/10.3390/genes11030251
Related work by the author
16
Lindholm J, Rosengren MK, Tengvall K, Hansson-Hamlin H, Hanson J. Survival analysis in 51 Standard Poodles diagnosed with naturally occurring hypoadrenocorticism (NOHA). Journal of Veterinary Internal Medicine. Submitted January 2022.
Sample collection (hair, blood, and biopsies), phenotyping, lab work, and data analysis within the ongoing hair growth project where we use the horse as a model to identify genetic factors associated with hair growth.
17
ACE Angiotensin converting enzyme
ChIP-Seq Chromatin Immunoprecipitation Sequencing
DMRT3 Doublesex and mab-3 related transcription factor 3
DNA Deoxyribonucleic acid
EBV Estimated breeding values
ECA Equus Caballus
EDNRA Endothelin receptor type A
EDNRB Endothelin receptor type B
ELISA Enzyme-Linked Immunosorbent Assay
EMSA Electrophoretic mobility shift assay
FAANG Functional Annotation of Animal Genomes
FPED Inbreeding coefficient based on pedigree data
FROH Inbreeding coefficient based on runs of homozygosity
Fst Fixation index
GERP Genomic Evolutionary Rate Profiling
GSDMC Gasdermin C
GWAS Genome-wide association study
HDO High-Definition Oscillometry
Hi-C Genome-wide chromosome conformation capture
Abbreviations
18
HiCap Hi-C with sequence capture
LD Linkage disequilibrium
MAP Mean arterial pressure
NGS Next-generation sequencing
NSCT Norwegian–Swedish Coldblooded trotter
NSD North Swedish draught horse
ONT Oxford Nanopore Technologies
PacBio Pacific Biosciences
PCR Polymerase chain reaction
PHYLOP Phylogenetic P-Values
TBP TATA-box binding protein
TSS Transcription start sites
QTL Quantitative trait locus
RAAS Renin angiotensin aldosterone system
RNA Ribonucleic acid
ROH Runs of homozygosity
SNP Single nucleotide polymorphism
SORCS3 Sortilin related VPS10 domain containing receptor 3
TBARS Thiobarbituric Acid Reactive Substances
WGS Whole-genome sequencing
ZFPM1 Zink finger protein multitype 1
19
1.1 History of the horse and domestication Improved whole-genome sequencing (WGS) techniques have made it possible to analyze ancient DNA from bone and other preserved remains from Equids. The earliest evidence of horse domestication is from about 5500 years ago in the Botai culture located in Kazakhstan. The Botai population was hunting wild horses, but gradually they started to utilize the wild horses for food production and transportation (Outram et al. 2009).
The Przewalski horse was previously considered a wild horse and the ancestor of our modern domestic horse (Equus ferus caballus). However, by investigating ancient DNA, it has been shown that Przewalski horses originated from the first domestic horses in Botai that returned wild, a process called feralisation. Thus, Przewalski horses are not ancestors to modern domestic horses (Gaunitz et al. 2018). Two separate extant horse lines have been found in Iberia (IBE) and Siberia (E. lenensis), which did not contribute as ancestors to the modern domestic horse (Fages et al. 2019). Recent information from ancient genomes reveals that all modern domestic horse breeds originate from Western Eurasia, mainly from the Volga-Don region of Russia, about 4200 years ago. These horses were strongly selected for weight-bearing and mental traits suited for riding and chariotry (Librado et al. 2021). They did not carry the mutation in the Doublesex and mab-3 related transcription factor 3 (DMRT3) gene known to play a significant role in gait ability (Andersson et al. 2012). However, they differed from the wild horse population at two other loci close to the Gasdermin C (GSDMC) gene associated with back pain and the Zink finger protein multitype 1 (ZFPM1) gene associated with fear memory and temperament (Aki & Miczek 2014;
1. Introduction
20
Suri et al. 2018; Librado et al. 2021). These horses expanded and replaced other existing horse populations in Eurasia (Librado et al. 2021).
Horses have played an essential role in human history. The horse made it possible for humans to travel more efficiently, which influenced how genes, languages, and diseases were spread worldwide. Horses also affected warfare by making mounted battles possible (Hyland 2003; Drews 2004). Horses were widely used for transportations and as animal power for farming until about the mid-20th century when machinery took over. In some parts of the world, horses are still used for meat production and agriculture (FAO 2021). Today, in the western societies, horses are mainly used for riding and sports, and the horse racing industry comprises multi-billions of euros per year (IFHA 2018). The total number of horses worldwide is estimated at 59 million, and horses still play an important role for many people (FAO 2021). In addition to these domesticated horses, numerous feral horses roam free in different parts of the world, totaling about 600,000 individuals (Rodríguez-Rodríguez et al in press).
1.1.1 Horse breeding and selection Darwin first defined the concept of natural selection in the 19th century. Natural selection means that adaptive traits that make an animal better suited for survival and reproduction within a population get more common over generations (Darwin 1859). However, during the domestication of the horse, people started to breed for desired traits such as endurance, speed, and strength. Different horse breeds have been created with a great variety in size and body type for different purposes of use, such as racing performance in Thoroughbreds (McGivney et al. 2020), and riding and gait ability in Icelandic horses (FEIF 2021). Another example is Swedish Warmbloods selected for sports performance specializing in jumping and/or dressage (Viklund et al. 2011; Ablondi et al. 2019). Today, there are more than 500 registered horse breeds worldwide (FAO 2021). Studbooks with pedigree recording were first established around the late 1700s to keep track of the horse breed populations and the relationship between horses (Weatherby 1791). However, most modern breeds were selected during the 19th century (Negro et al. 2021).
Due to the strong selection and limited stallion lines, the genetic diversity in domestic horse breeds has decreased during the last 2000 years (Lindgren et al. 2004; Wallner et al. 2013; Wutke et al. 2018; Fages et al. 2019). Genes
21
linked to behavior, athletic performance, and gait ability have been selected during domestication (Petersen et al. 2013a; Librado et al. 2016, 2021; Fages et al. 2019).
1.1.2 Inbreeding Breeding with a strong selection for desired traits can lead to inbreeding, especially if the population size is small. Inbreeding means mating between closely related individuals. An increased level of inbreeding has been observed in multiple horse breeds for example Thoroughbreds and Coldblooded trotters. Both these breeds are strongly selected for racing performance, and the population is based on a few popular stallion lines (Arnason et al. 1989; Uhlin 2007; Binns et al. 2012; McGivney et al. 2020; Svensk Travsport 2020). An increased inbreeding level can negatively affect health and racing performance (Klemetsdal 1998; Todd et al. 2018; Samsonstuen et al. 2020). Inbreeding increases the risk of acquiring rare defects or diseases as a result of increased homozygosity for rare recessive variants. It may also cause a loss of genetic variants that are important (Charlesworth & Charlesworth 1999).
The level of inbreeding can be estimated by studying pedigree data or genomic data based on, for example runs of homozygosity (ROH) (Howard et al. 2017). In paper I, both pedigree and genomic data were used to estimate the level of inbreeding in the Coldblooded trotter population.
1.1.3 The horse as a model for genomic studies Since domestication, the intense selection process in horses has resulted in the accumulation of new mutations linked to different phenotypes. The long history of selection and the population structure with different breeds make the horse and other domestic animals perfect models for studying functional genomics, i.e., the genetic background of different traits (Andersson 2016; Meadows & Lindblad-Toh 2017). Horses are genetically similar to humans, more than half of the chromosomes in horses display conserved synteny with human chromosomes (Wade et al. 2009). Many diseases and conditions that affect humans are also present in horses and by using the horse as a model we can get more information about biological mechanisms behind these conditions and thereby improve diagnosis and treatment. Conditions that have been studied in horses and that are also present in humans are for example allergic disorders (Shrestha et al. 2015, 2020; Velie et al. 2016),
22
insulin resistance (Lindåse et al. 2017; Nostell et al. 2019), melanoma (Rosengren Pielberg et al. 2008), and asthma (Couetil et al. 2020). High blood pressure is a common condition in humans (WHO 2021). In paper IV, we investigated the genetics of athletic performance and exercise related blood pressure regulation. Information from this study may also be of use in humans. The horse can serve as a model for athletic performance and biological processes activated by exercise. As well as elite human athletes, racehorses need to have the optimal genetic setup for athleticism to tolerate training and perform at an elite level to win races. This thesis focused on two horse breeds selected for sports performance; Coldblooded trotters and Icelandic horses.
1.1.4 Coldblooded trotters Coldblooded trotters originate from the Norwegian Döle horse and North Swedish draught horses (Bjørnstad & Røed 2001; Uhlin 2007). The studbook for Coldblooded trotters was founded in 1965. Sweden and Norway have had a common breeding program since 2000. The overall breeding goal is to preserve and further develop a competitive, healthy trotting horse by improving the horses' competitive performance, durability, conformation, and temperament. The aim is also to prevent inbreeding. Stallions are judged at breeding evaluation and estimated breeding values (EBV) based on racing performance records are applied by the breeders when selecting horses for breeding (Uhlin 2007; Svensk Travsport 2021a). The population size is limited, and the Coldblooded trotter is included on the Swedish Board of Agriculture list of breeds that should be preserved (Jordbruksverket). Today, there are about 12 000 Coldblooded trotters in Sweden (Svensk Travsport 2021b). In paper I we investigated the level of inbreeding in Coldblooded trotters born in Sweden and Norway. The first harness races started in the 1500s and have since been developed with separate races for Coldblooded trotters and Standardbreds (Uhlin 2007). Today, the horse racing industry in Sweden includes multi-billions of SEK (Svensk Travsport 2019).
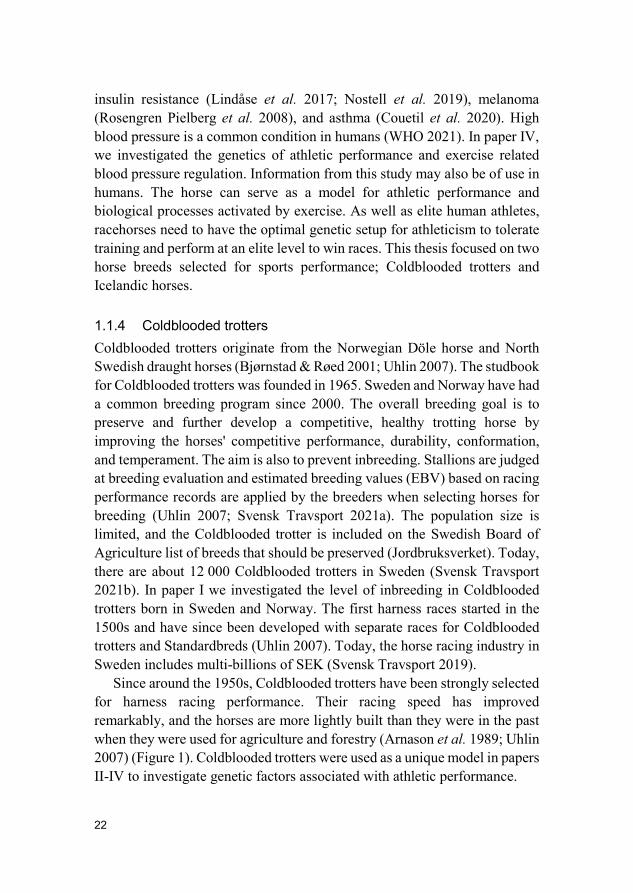
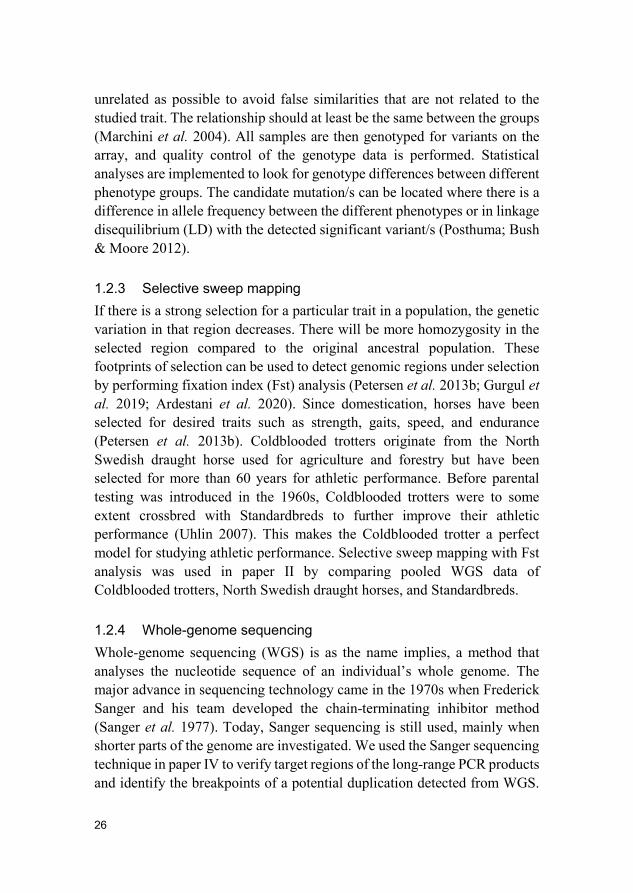
Since around the 1950s, Coldblooded trotters have been strongly selected for harness racing performance. Their racing speed has improved remarkably, and the horses are more lightly built than they were in the past when they were used for agriculture and forestry (Arnason et al. 1989; Uhlin 2007) (Figure 1). Coldblooded trotters were used as a unique model in papers II-IV to investigate genetic factors associated with athletic performance.
23
Figure 1. Coldblooded trotter on the harness racing track. Photo: Matilda Persson
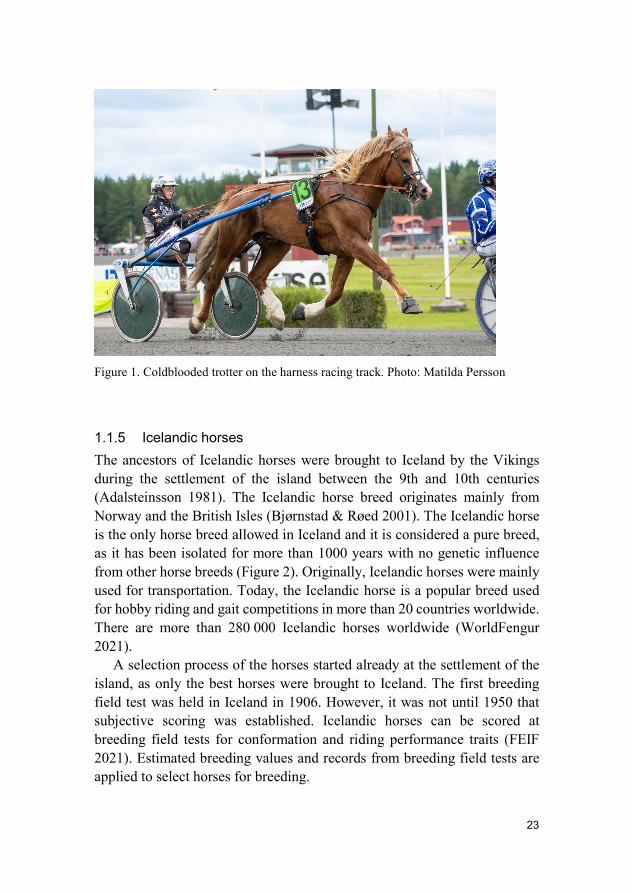
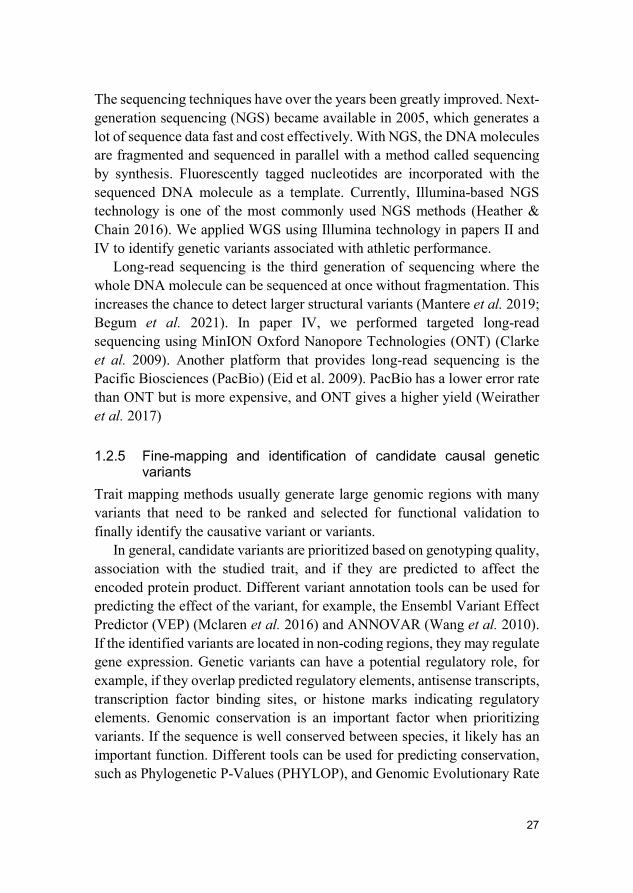
1.1.5 Icelandic horses The ancestors of Icelandic horses were brought to Iceland by the Vikings during the settlement of the island between the 9th and 10th centuries (Adalsteinsson 1981). The Icelandic horse breed originates mainly from Norway and the British Isles (Bjørnstad & Røed 2001). The Icelandic horse is the only horse breed allowed in Iceland and it is considered a pure breed, as it has been isolated for more than 1000 years with no genetic influence from other horse breeds (Figure 2). Originally, Icelandic horses were mainly used for transportation. Today, the Icelandic horse is a popular breed used for hobby riding and gait competitions in more than 20 countries worldwide. There are more than 280 000 Icelandic horses worldwide (WorldFengur 2021).
A selection process of the horses started already at the settlement of the island, as only the best horses were brought to Iceland. The first breeding field test was held in Iceland in 1906. However, it was not until 1950 that subjective scoring was established. Icelandic horses can be scored at breeding field tests for conformation and riding performance traits (FEIF 2021). Estimated breeding values and records from breeding field tests are applied to select horses for breeding.
24
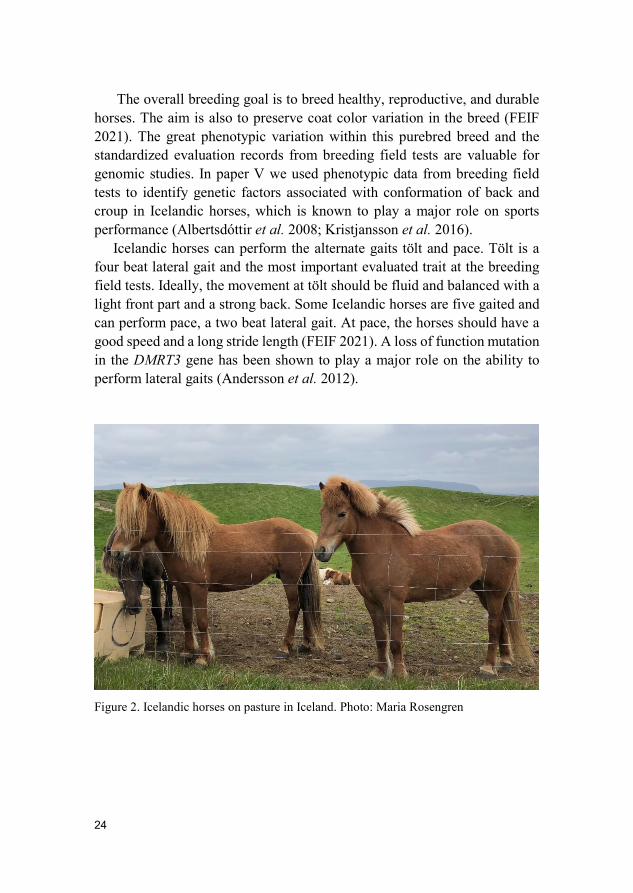
The overall breeding goal is to breed healthy, reproductive, and durable horses. The aim is also to preserve coat color variation in the breed (FEIF 2021). The great phenotypic variation within this purebred breed and the standardized evaluation records from breeding field tests are valuable for genomic studies. In paper V we used phenotypic data from breeding field tests to identify genetic factors associated with conformation of back and croup in Icelandic horses, which is known to play a major role on sports performance (Albertsdóttir et al. 2008; Kristjansson et al. 2016).
Icelandic horses can perform the alternate gaits tölt and pace. Tölt is a four beat lateral gait and the most important evaluated trait at the breeding field tests. Ideally, the movement at tölt should be fluid and balanced with a light front part and a strong back. Some Icelandic horses are five gaited and can perform pace, a two beat lateral gait. At pace, the horses should have a good speed and a long stride length (FEIF 2021). A loss of function mutation in the DMRT3 gene has been shown to play a major role on the ability to perform lateral gaits (Andersson et al. 2012).
Figure 2. Icelandic horses on pasture in Iceland. Photo: Maria Rosengren
25
1.2 Genomics and trait mapping The deoxyribonucleic acid (DNA) carries the genetic code for proteins, which are the molecular machinery for life and the system that controls the activity of the genes (Wold et al. 2014). Genomics means that the whole genome of an individual is investigated to get information about the structure and function and thereby link genetic factors to the studied traits. Within this thesis, we used different trait mapping methodologies to identify genetic variants associated with athletic performance and conformation traits in horses.
1.2.1 The horse genome The first draft of the reference genome in horses was completed in 2007, followed by a second version (EquCab2) released in 2009. The reference genome was based on one Thoroughbred mare named Twilight (Wade et al. 2009). This horse was selected because it had low level of heterozygosity (i.e., low genetic variability). The whole horse genome contains 2.5-2.7 Giga bases and about 20 322 protein coding genes. More than half of the horse chromosomes show conserved blocks of genes to human chromosomes (Wade et al. 2009). An updated horse reference genome (EquCab3) was released in January 2018 (Kalbfleisch et al. 2018).
1.2.2 Genome-wide association studies Genome-wide association study (GWAS) is a method for identifying associations between a particular trait and genetic variants in the DNA sequence. This trait mapping method was used in papers III and V. Traditionally, single nucleotide polymorphisms (SNPs) are used as genetic variants in GWA studies. A SNP is a difference at a single nucleotide position in the DNA sequence between individuals (Posthuma; Bush & Moore 2012). Shortly after the release of the first reference genome, the first equine genotyping array was developed. An improved high-density array was created in 2012 based on different breeds and related equids (McCue et al. 2012). In 2017, a next-generation high density genotyping 670k array became available, containing more markers evenly distributed across the genome (Schaefer et al. 2017).
GWAS can be performed as a quantitative trait and/or a case control study. Careful phenotyping is of importance and the individuals should be as
26
unrelated as possible to avoid false similarities that are not related to the studied trait. The relationship should at least be the same between the groups (Marchini et al. 2004). All samples are then genotyped for variants on the array, and quality control of the genotype data is performed. Statistical analyses are implemented to look for genotype differences between different phenotype groups. The candidate mutation/s can be located where there is a difference in allele frequency between the different phenotypes or in linkage disequilibrium (LD) with the detected significant variant/s (Posthuma; Bush & Moore 2012).
1.2.3 Selective sweep mapping If there is a strong selection for a particular trait in a population, the genetic variation in that region decreases. There will be more homozygosity in the selected region compared to the original ancestral population. These footprints of selection can be used to detect genomic regions under selection by performing fixation index (Fst) analysis (Petersen et al. 2013b; Gurgul et al. 2019; Ardestani et al. 2020). Since domestication, horses have been selected for desired traits such as strength, gaits, speed, and endurance (Petersen et al. 2013b). Coldblooded trotters originate from the North Swedish draught horse used for agriculture and forestry but have been selected for more than 60 years for athletic performance. Before parental testing was introduced in the 1960s, Coldblooded trotters were to some extent crossbred with Standardbreds to further improve their athletic performance (Uhlin 2007). This makes the Coldblooded trotter a perfect model for studying athletic performance. Selective sweep mapping with Fst analysis was used in paper II by comparing pooled WGS data of Coldblooded trotters, North Swedish draught horses, and Standardbreds.
1.2.4 Whole-genome sequencing Whole-genome sequencing (WGS) is as the name implies, a method that analyses the nucleotide sequence of an individual’s whole genome. The major advance in sequencing technology came in the 1970s when Frederick Sanger and his team developed the chain-terminating inhibitor method (Sanger et al. 1977). Today, Sanger sequencing is still used, mainly when shorter parts of the genome are investigated. We used the Sanger sequencing technique in paper IV to verify target regions of the long-range PCR products and identify the breakpoints of a potential duplication detected from WGS.
27
The sequencing techniques have over the years been greatly improved. Next-generation sequencing (NGS) became available in 2005, which generates a lot of sequence data fast and cost effectively. With NGS, the DNA molecules are fragmented and sequenced in parallel with a method called sequencing by synthesis. Fluorescently tagged nucleotides are incorporated with the sequenced DNA molecule as a template. Currently, Illumina-based NGS technology is one of the most commonly used NGS methods (Heather & Chain 2016). We applied WGS using Illumina technology in papers II and IV to identify genetic variants associated with athletic performance.
Long-read sequencing is the third generation of sequencing where the whole DNA molecule can be sequenced at once without fragmentation. This increases the chance to detect larger structural variants (Mantere et al. 2019; Begum et al. 2021). In paper IV, we performed targeted long-read sequencing using MinION Oxford Nanopore Technologies (ONT) (Clarke et al. 2009). Another platform that provides long-read sequencing is the Pacific Biosciences (PacBio) (Eid et al. 2009). PacBio has a lower error rate than ONT but is more expensive, and ONT gives a higher yield (Weirather et al. 2017)
1.2.5 Fine-mapping and identification of candidate causal genetic variants
Trait mapping methods usually generate large genomic regions with many variants that need to be ranked and selected for functional validation to finally identify the causative variant or variants.
In general, candidate variants are prioritized based on genotyping quality, association with the studied trait, and if they are predicted to affect the encoded protein product. Different variant annotation tools can be used for predicting the effect of the variant, for example, the Ensembl Variant Effect Predictor (VEP) (Mclaren et al. 2016) and ANNOVAR (Wang et al. 2010). If the identified variants are located in non-coding regions, they may regulate gene expression. Genetic variants can have a potential regulatory role, for example, if they overlap predicted regulatory elements, antisense transcripts, transcription factor binding sites, or histone marks indicating regulatory elements. Genomic conservation is an important factor when prioritizing variants. If the sequence is well conserved between species, it likely has an important function. Different tools can be used for predicting conservation, such as Phylogenetic P-Values (PHYLOP), and Genomic Evolutionary Rate
28
Profiling (GERP) scores (Jalali Sefid Dashti & Gamieldien 2017). Recently, the Zoonomia project published a powerful resource containing genome assemblies of 240 different mammals (Zoonomia Consortium, 2020).
1.2.6 Functional genomics To verify the effect of a candidate causative mutation, it needs to be validated in additional individuals and evaluated with functional tests. The equine Functional Annotation of Animal Genomes (FAANG) group has performed Ribonucleic acid (RNA) sequencing to get information about gene expression in different tissues and Chromatin Immunoprecipitation Sequencing (ChIP-Seq) to identify signatures of regulatory elements within the horse genome (Burns et al. 2018; Kingsley et al. 2020, 2021). Variants within non-coding regions can affect gene expression, for example, if they change the chromatin structure, overlap transcription factor binding sites located in transcriptional regulatory elements such as promoters, enhancers, and locus control regions (Jalali Sefid Dashti & Gamieldien 2017). Promoters are located 5’ of transcription start sites (TSS) and divided into core and regulatory promoter. The core promoter defines the TSS and binds general transcription factors such as TFIID with TATA-box binding protein (TBP) and TBP–associated proteins. The regulatory promoter binds a multitude of transcriptional activators and repressors (Nakatani et al. 1990; Haberle & Stark 2018). In contrast to promoters, enhancers can be located far away (> 1 Mbp), either 5’ or 3’ from their target gene/s as distant genomic regions can be brought together by looping (Müller et al. 1989; Krivega & Dean 2012; van der Valk et al. 2015). Chromatin interaction analysis is an informative method that can be applied to identify candidate causative mutations and their target genes (Lieberman-Aiden et al. 2009; Sahlén et al. 2015, 2021; Roytman et al. 2018). Genome-wide chromosome conformation capture (Hi-C) is a chromatin interaction analysis method that applies restriction enzymes and NGS to map looping structures of the genome (Lieberman-Aiden et al. 2009). Recently, HiCap (Hi-C with sequence capture) was developed. HiCap is an improved chromatin interactions mapping method that can map individual enhancer interactions with known promoters in the whole genome (Sahlén et al. 2015).
Protein interactions with the DNA sequence can be experimentally tested in vitro with electrophoretic mobility shift assay (EMSA) (Fried & Crothers 1981; Hellman & Fried 2007). For example, EMSA can investigate genetic
29
variants ability to bind both known DNA binding transcription factors as well as hitherto unknown transcription factors. Luciferase assays can be used to test if a genomic sequence regulates transcription of a candidate gene. A construct with the sequence of interest and regulatory region of the candidate gene is inserted in front of the reporter gene Luciferase, which emits fluorescent light when activated (Smale 2010).
Functional validation of potential causative mutations is performed using genome editing techniques, such as CRISPR-Cas9, in animal models or cell lines (Jiang & Doudna 2017).
1.2.7 Protein analysis Proteins are the products of protein encoding genes. The proteome is the total number of proteins expressed in an organism or a specified organ, tissue, or cell type, and proteomics means that the proteome is studied. Proteomics is a valuable component of functional genomics to understand the structure, interactions, and functions of proteins. The concentration of proteins changes with different conditions, and proteins can be modified after translation which can affect their function (Tyers & Mann 2003). Quantification and differences in protein levels between biological samples or cell types can be analyzed with different techniques, such as Mass spectrometry, Enzyme-Linked Immunosorbent Assay (ELISA), and Western blot (Patterson & Aebersold 1995; Blackstock & Weir 1999; Mathesius et al. 2003).
In paper IV, we used Relative Quantitative Mass Spectrometry with tandem mass tags and ELISA to investigate differences in plasma protein levels between the different haplotype groups, at rest and during exercise. ELISA is a technique to quantify specific proteins by using antibodies against the protein of interest (Alhajj & Farhana 2021). Relative Quantitative Mass Spectrometry with tandem mass tags can compare differences in the proteome between multiple samples. The proteins within the sample are digested into peptides and labeled with specific isobaric tags. The samples are then fractionated in a mass spectrometer and the peptides can be detected and quantified by a reporter ion within the isobaric tag. The fragments and peptides are then matched using databases with known peptide sequences to identify proteins (Zhang & Elias 2017).
30
1.3 Athletic performance Athletic performance is a complex trait influenced by environmental, genetic, and epigenetic factors. The horses need to have the correct phenotypic characteristics to function successfully for the desired purpose on the race track as well as for leisure riding. Genes linked to muscle mass and locomotion patterns have previously been reported to have a major impact on athletic performance in horses, for example, the Myostatin gene, which encodes a protein belonging to the transforming growth factor β family of growth factors that regulate skeletal muscle mass (McPherron et al. 1997). Myostatin is associated with conformation, racing performance, and endurance (Hill et al. 2010; Tozaki et al. 2011; McGivney et al. 2012; François et al. 2016). The DMRT3 gene encodes a transcription factor that affects locomotion patterns and plays a major role in lateral gait ability, riding traits, and harness racing performance (Andersson et al. 2012; Jäderkvist et al. 2014; Kristjánsson 2014; Jäderkvist Fegraeus et al. 2015; Jäderkvist et al. 2015).
In papers II and III, the horse genome was investigated to identify genetic variants associated with athletic performance. In paper IV we investigated genetic regulation of athletic performance and exercise related blood pressure. During exercise, the blood pressure needs to be highly regulated to supply the working muscles with energy and oxygen (Erickson 1993; Rowell 1993).
1.3.1 Blood pressure regulation Horses have a heart rate of about 28-40 beats per minute at rest (Erickson & Poole 2004). Intense exercise activates the sympathetic system with the “fight or flight” response to obtain more energy and oxygen for the working muscles. β-adrenoreceptors in the cardiac muscle respond by increasing heart rate and the contractility of the heart so that the blood is circulated more effectively (Rose & Evans 1987). During exercise, the heart rate rises to about 180-240 beats per minute. Cardiac output is defined as the blood volume pumped out from the heart per minute. During exercise, the cardiac output is increased up to 400 liters per minute to supply the working muscles with oxygen and energy (Poole & Erickson 2004). Blood pressure is defined as the pressure of the blood pumped against the vascular walls, and it is dependent on the cardiac output and the total resistance in the peripheral blood vessels. The diameter of the arteries and the viscosity of the blood
31
affect the total peripheral resistance. The blood flows more efficiently with less turbulence if the arteries are wide and if the blood is less viscous (Poole & Erickson 2004). During exercise, more blood needs to be distributed to the working muscles. The blood flow to skeletal musculature can increase during exercise more than 60 times compared to rest. This redistribution is mainly achieved by regional vasodilation in the working muscles and vasoconstriction to the, for exercise, non-essential tissues, i.e., the kidneys and intestines. Moreover, an increased blood volume is needed during work for sweating and temperature regulation. All these factors are essential for athletic performance and are highly regulated (Erickson 1993; Rowell 1993).
The Vasoactive peptide Endothelin and nitrogen oxide The peripheral resistance is mainly regulated by dilation or constriction of the blood vessels. Endothelins regulate the diameter of blood vessels (Yanagisawa et al. 1988). There are three isopeptides of Endothelin; Endothelin 1 (EDN1), Endothelin 2 (EDN2), and Endothelin 3 (EDN3). Separate genes encode each of them. Endothelin binds to specific G protein coupled receptors which are comprised of two main subtypes, Endothelin receptor type A (EDNRA) and Endothelin receptor type B (EDNRB). EDNRA has a high specificity for EDN1 and EDN2 but a low affinity for EDN3 (Arai et al. 1990). EDNRB has the same affinity for all three Endothelin types (Sakurai et al. 1990). Endothelins act regionally and the effect of the receptor subtypes varies depending on the tissue type. In general, EDNRA activation results in constriction of the blood vessels and increased blood pressure. In contrast, stimulation of EDNRB results in vasodilation by nitric oxide secretion and thus a decreased blood pressure. By regulating the diameter of the blood vessels locally, EDN1 and EDN3 contribute to the redistribution of the blood that is essential during exercise, i.e. dilatation in the working muscles and constriction to the non-essential tissues (Weitzberg et al. 1995; Maeda et al. 2002). EDN3 stimulates the release of vasopressin, which increases the blood volume by saving water and sodium in the kidneys. Vasopressin also acts as a vasoconstrictor (Rossi 1993, 1995).
Antidiuretic hormone (vasopressin) Vasopressin is a hormone released from the pituitary gland to regulate the blood volume and salt balance in the body. Vasopressin is secreted in response to a decreased blood volume reported by the baroreceptors in the heart and lungs, decreased arterial blood pressure reported by baroreceptors
32
in the arteries, and by osmolality differences of the plasma sensed by the cells in the hypothalamus (Wade & Freund 1990). In addition, EDN3 can stimulate the secretion of vasopressin (Rossi 1993, 1995). Vasopressin constricts arteries, saves water in the kidneys, and increases water and sodium absorption in the colon (Wade & Freund 1990; Mckeever et al. 1991). Vasopressin secretion results in increased blood volume, making the blood less viscous so it can flow more easily to supply the working muscles with oxygen and nutrients. A larger blood volume is also needed for thermoregulation during exercise (McKeever & Hinchcliff 1995). Plasma concentration of vasopressin increases linearly with increasing exercise intensity in horses and humans (Wade & Freund 1990; Mckeever et al. 1991).
The renin angiotensin aldosterone system (RAAS) Renin is a hormone secreted from the juxtaglomerular part of the kidneys. Renin stimulates the transformation of angiotensinogen into angiotensin I, which is then converted into angiotensin II by angiotensin converting enzyme (ACE). Angiotensin II is a potent vasoconstrictor that also triggers the secretion of vasopressin and aldosterone, which both acts on the kidneys to save sodium and water (Wade & Freund 1990). Plasma concentration of renin increases with exercise and is correlated with the intensity of the work in horses (McKeever et al. 1992). The renin angiotensin aldosterone system (RAAS) and Endothelin are two of the most powerful vasoregulatory systems. There are many interactions between these two systems that affect blood pressure (Rossi et al. 1999). Angiotensin II can activate the transcription of EDN1 (Chua et al. 1993; Sung et al. 1994). On the other hand, EDN1 can also activate the synthesis of angiotensin II probably by enhanced action of ACE (Kawaguchi et al. 1990, 1991). Another example of interaction between the two systems is that EDN1 can activate aldosterone secretion (Mazzocchi et al. 1990, 1992).
1.3.2 Blood pressure measurement Blood pressure can be measured by using invasive or non-invasive methods. With the invasive method, a catheter is placed within an artery. An electronic pressure transducer, either located at the end of the catheter or connected via an external system, continuously measures the blood pressure. This method is more accurate but is invasive and thus inflicts pain and a risk of infection
33
(Erhardt et al. 2007). Doppler or oscillometric techniques are most commonly used as non-invasive methods. Oscillometry is a technique where the mean arterial pressure (MAP) is measured when the largest pressure fluctuations (oscillations) in the artery wall are detected. In horses, non-invasive blood pressure is usually measured by placing a cuff around the base of the tail over the middle coccygeal artery. An updated oscillometry method, High-Definition Oscillometry (HDO), was developed in 2006 and HDO has been used in many different species, including horses (Söder et al. 2012; Nostell et al. 2016, 2021). With HDO, the deflation rate can be adjusted and pulse waves analyzed in real time in the MDSWIN Analyse Software. In addition, HDO gives information on parameters such as systemic vascular resistance, stroke volume, and arrhythmia. We used the oscillometry method to measure blood pressure in paper IV.
1.4 Conformation of back and croup and gait quality The back of the horse has a central role in the musculoskeletal system. The back plays a major role in the locomotion of the horse where the spine act as a spring in the stride cycle. The structure of the spine is complex and has two major functions; to support the body weight and to transfer the force from the hind legs in the forward movement (Slijper 1946). Back problems can cause pain and impaired performance. In general, back problems are hard to diagnose clinically in horses because the strong muscles and ligaments of the back can mask mild clinical signs (Jeffcott 1980).
It is well known that conformation traits are important for the health of the musculoskeletal system and sports performance in horses (Albertsdóttir et al. 2008; Rustin et al. 2009; Holmström & Back 2013; Solé et al. 2013; Jönsson et al. 2014a; b; Kristjansson et al. 2016; Sánchez-Guerrero et al. 2016; Janczarek et al. 2017; Sánchez-Guerrero et al. 2017). Traditionally, conformation traits are used in multiple horse breeds when horses are selected for breeding and performance. In Coldblooded trotters, the stallions are assessed for conformation traits at breeding evaluation (Svensk Travsport 2021a). Icelandic horses are assessed at breeding field tests and the evaluation includes both conformation and riding ability traits (FEIF 2021).
An uphill conformation (higher front part of the horse compared to hind), croup dimensions, and chest width are known to be the most important qualities for riding ability in Icelandic horses (Albertsdóttir et al. 2008;
34
Kristjansson et al. 2016). The uphill conformation is subjectively assessed using for reference the difference between measurements of the height of the withers and the height at the croup. This should ideally be accompanied by a well-balanced backline and an even trunk with a breast that is not too deep. The backline is defined as the line from withers back to the lumbosacral joint. It is subjectively assessed based on the difference between the measurements of the lowest point of the back and the height of the croup as reference. The lowest point of the back should ideally be located in the middle of the back (FEIF 2021).
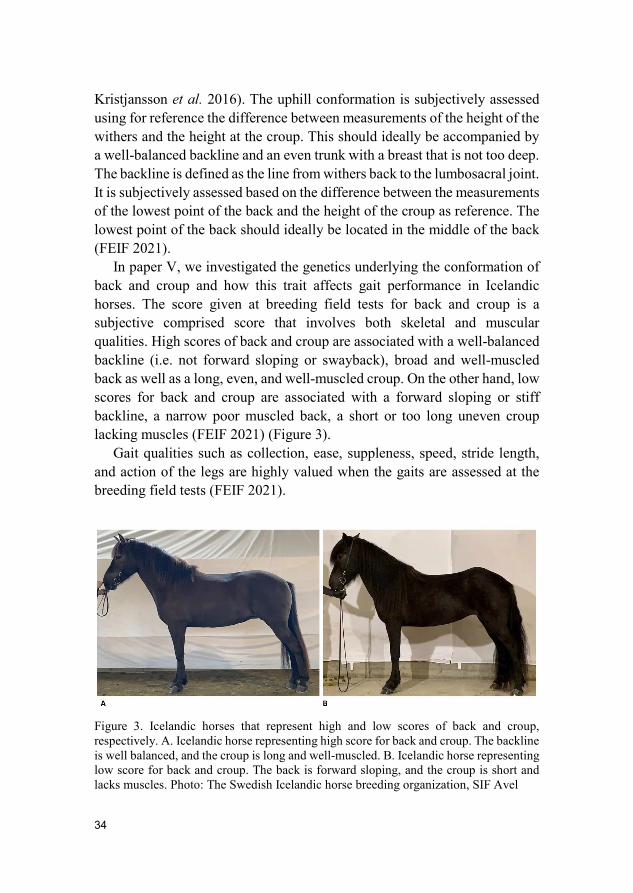
In paper V, we investigated the genetics underlying the conformation of back and croup and how this trait affects gait performance in Icelandic horses. The score given at breeding field tests for back and croup is a subjective comprised score that involves both skeletal and muscular qualities. High scores of back and croup are associated with a well-balanced backline (i.e. not forward sloping or swayback), broad and well-muscled back as well as a long, even, and well-muscled croup. On the other hand, low scores for back and croup are associated with a forward sloping or stiff backline, a narrow poor muscled back, a short or too long uneven croup lacking muscles (FEIF 2021) (Figure 3).
Gait qualities such as collection, ease, suppleness, speed, stride length, and action of the legs are highly valued when the gaits are assessed at the breeding field tests (FEIF 2021).
Figure 3. Icelandic horses that represent high and low scores of back and croup, respectively. A. Icelandic horse representing high score for back and croup. The backline is well balanced, and the croup is long and well-muscled. B. Icelandic horse representing low score for back and croup. The back is forward sloping, and the croup is short and lacks muscles. Photo: The Swedish Icelandic horse breeding organization, SIF Avel
35
2. Aims of the thesisThe overall aims of the thesis were to identify genetic variants associated with athletic performance and conformation traits in horses, as well as to investigate the level of inbreeding in Coldblooded trotters.
The specific aims were to:
Estimate genomic inbreeding coefficient for Coldblooded trottersand compare with the inbreeding level based on pedigree data inthe whole population.
Identify genetic variants associated with athletic performance inColdblooded trotters and investigate their potential effect onexercise related blood pressure regulation.
Identify genomic regions linked to conformation of back andcroup in Icelandic horses and investigate their effects on ridingperformance traits assessed at breeding field tests.

36
37
3. Summary of studies (I-V)This thesis consists of five studies with the aims to investigate the inbreeding level in Coldblooded trotters and identify genetic variants associated with athletic performance and conformation traits in horses.
3.1 Study I – Genomic measures of inbreeding in the Norwegian–Swedish Coldblooded Trotter and their associations with known QTL for reproduction and health traits
The inbreeding level in Coldblooded trotters, also known as Norwegian–Swedish Coldblooded trotters (NSCT), was estimated using both pedigree data and high-density genotyping array data in 566 raced horses born between 2000 and 2009. Of the 566 horses, 265 were born in Norway and 301 in Sweden. NSCT has been strongly selected for athletic performance for more than sixty years, and their racing performance has greatly improved. However, this strong selection has led to an increased inbreeding level, which can negatively affect health and athletic performance (Klemetsdal 1998; Todd et al. 2018; Samsonstuen et al. 2020). The aims of study I were to estimate genomic inbreeding coefficient for NSCT and compare it with the inbreeding level based on pedigree data in the whole NSCT population.
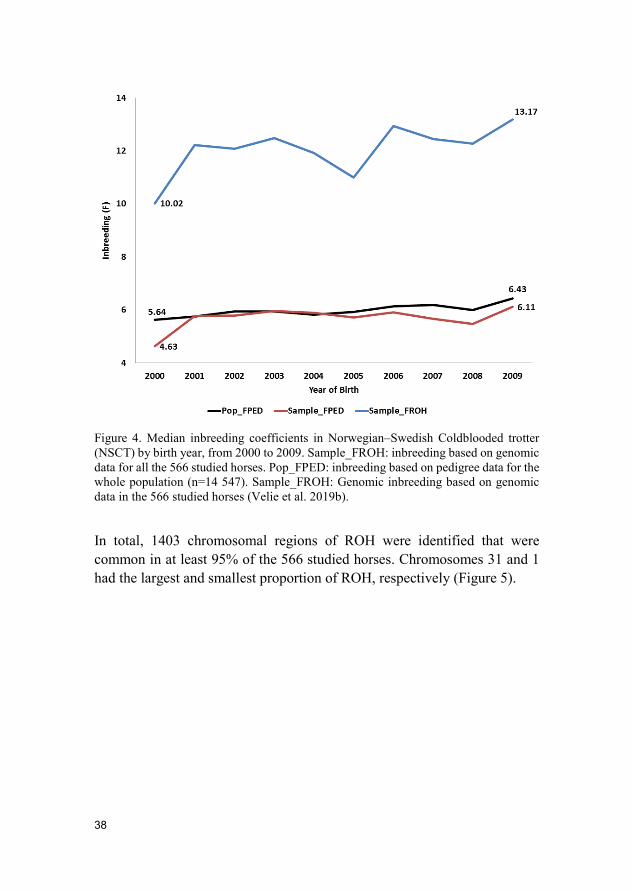
Results and discussion The inbreeding level had gradually increased in NSCT during the investigated years 2000 to 2009. The average inbreeding coefficient based on genomic data (FROH) ranged from 1.78 to 13.95%. A greater increase could be observed in horses born after 2005. FROH was higher than the inbreeding coefficient based on pedigree data (FPED), however, both methods showed a progressively increased level of inbreeding. FROH increased by 3.15% and FPED by 1.48% (Figure 4).
Different thresholds of runs of homozygosity (ROH) were tested. The threshold that resulted in the highest correlation (R=0.5629) between FROH
and FPED was selected to detect longer homozygous regions that were represented in the population.
38
Figure 4. Median inbreeding coefficients in Norwegian–Swedish Coldblooded trotter (NSCT) by birth year, from 2000 to 2009. Sample_FROH: inbreeding based on genomic data for all the 566 studied horses. Pop_FPED: inbreeding based on pedigree data for the whole population (n=14 547). Sample_FROH: Genomic inbreeding based on genomic data in the 566 studied horses (Velie et al. 2019b).
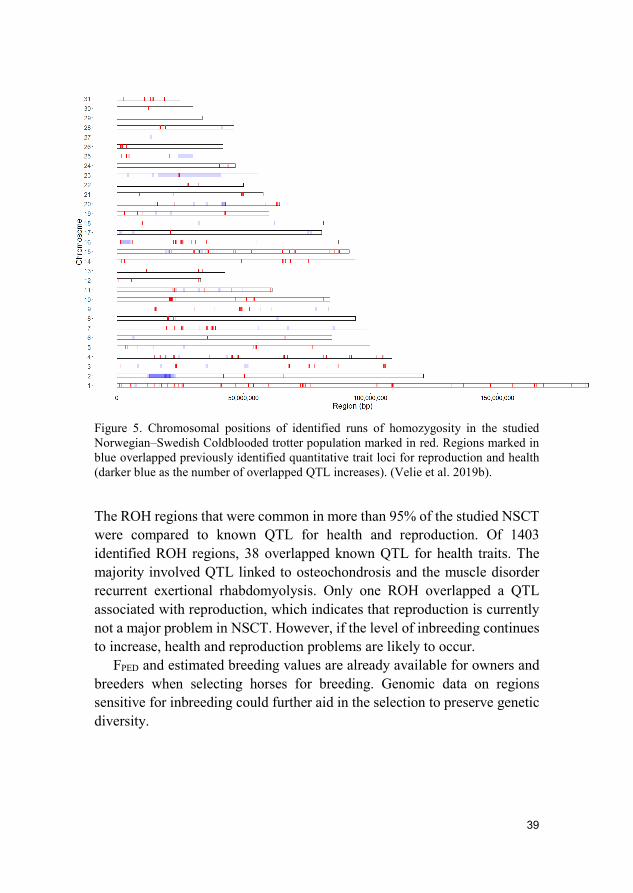
In total, 1403 chromosomal regions of ROH were identified that were common in at least 95% of the 566 studied horses. Chromosomes 31 and 1 had the largest and smallest proportion of ROH, respectively (Figure 5).
39
Figure 5. Chromosomal positions of identified runs of homozygosity in the studied Norwegian–Swedish Coldblooded trotter population marked in red. Regions marked in blue overlapped previously identified quantitative trait loci for reproduction and health (darker blue as the number of overlapped QTL increases). (Velie et al. 2019b).
The ROH regions that were common in more than 95% of the studied NSCT were compared to known QTL for health and reproduction. Of 1403 identified ROH regions, 38 overlapped known QTL for health traits. The majority involved QTL linked to osteochondrosis and the muscle disorder recurrent exertional rhabdomyolysis. Only one ROH overlapped a QTL associated with reproduction, which indicates that reproduction is currently not a major problem in NSCT. However, if the level of inbreeding continues to increase, health and reproduction problems are likely to occur.
FPED and estimated breeding values are already available for owners and breeders when selecting horses for breeding. Genomic data on regions sensitive for inbreeding could further aid in the selection to preserve genetic diversity.
40
3.2 Study II – Exploring the genetics of trotting racing ability in horses using a unique Nordic horse model
In study II, Coldblooded trotters were used as a unique model to identify genomic regions associated with harness racing performance. Coldblooded trotters are derived from the North Swedish draught horse (NSD), a breed used for agriculture and forestry. To further improve the racing performance, Coldblooded trotters were to some extent crossbred with Standardbreds before 1969 when parentage testing was introduced (Uhlin 2007). This might have introduced genetic variants favorable for racing performance. To identify these genomic regions, pooled whole-genome sequence data from 25 North Swedish draught horses, 18 Coldblooded trotters, and 22 Standardbreds were compared using selective sweep mapping with fixation index (Fst) analysis. The horses were carefully selected based on estimated breeding values for athletic performance and relationship. Candidate regions were defined where Coldblooded trotters were similar to Standardbreds and at the same time different from North Swedish draught horses. Fst cut off was set at (> 95% percentile, FST = 0.179 NSCT vs. NSD; < 5% percentile, FST = 0.013 NSCT vs. SB). Regions that were smaller than 1000 bp or contained less than two SNPs were filtered out. Candidate regions were screened in the Ensembl Biomart function and the generated list of genes was analyzed in PANTHER to get information on the molecular functions and biological processes.
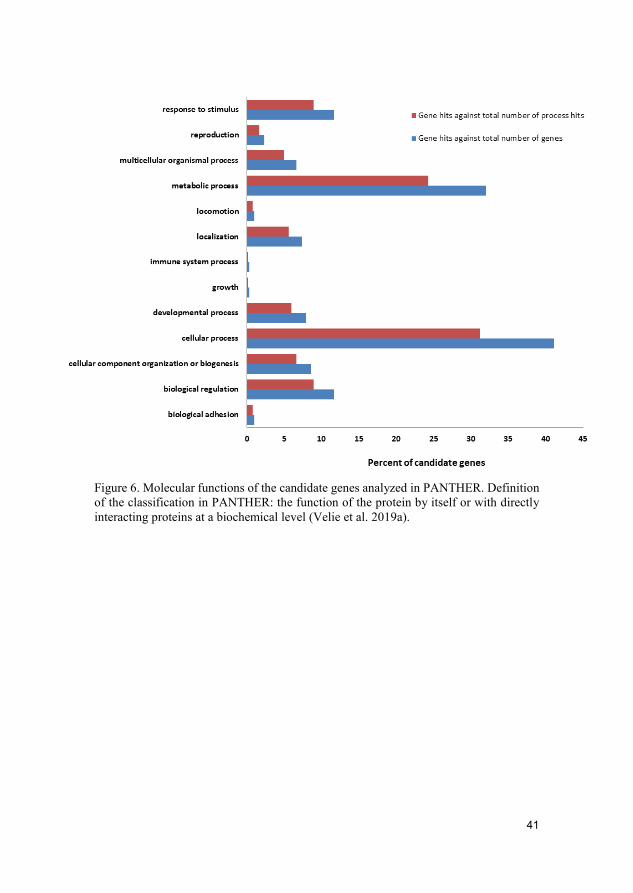
Results and discussion The selective sweep mapping resulted in 580 genomic candidate regions for trotting racing performance. Chromosomes 7 and 11 had the highest number of SNPs (214 and 147 SNPs, respectively). Many of the candidate genes were linked to metabolic and cellular processes (Figure 6). Biological processes of the candidate genes included mainly catalytic and binding activity (Figure 7).
41
Figure 6. Molecular functions of the candidate genes analyzed in PANTHER. Definition of the classification in PANTHER: the function of the protein by itself or with directly interacting proteins at a biochemical level (Velie et al. 2019a).
42
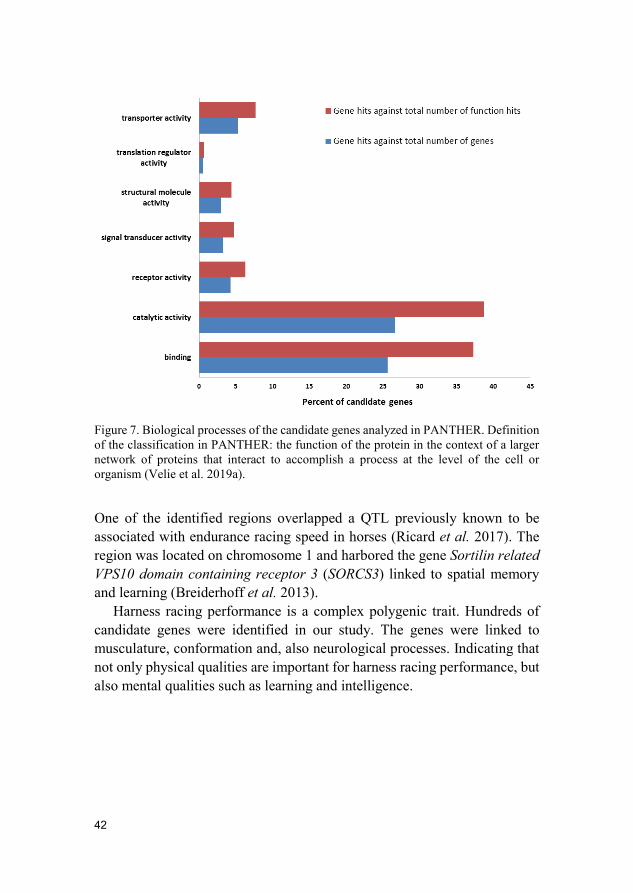
Figure 7. Biological processes of the candidate genes analyzed in PANTHER. Definition of the classification in PANTHER: the function of the protein in the context of a larger network of proteins that interact to accomplish a process at the level of the cell or organism (Velie et al. 2019a).
One of the identified regions overlapped a QTL previously known to be associated with endurance racing speed in horses (Ricard et al. 2017). The region was located on chromosome 1 and harbored the gene Sortilin related VPS10 domain containing receptor 3 (SORCS3) linked to spatial memory and learning (Breiderhoff et al. 2013).
Harness racing performance is a complex polygenic trait. Hundreds of candidate genes were identified in our study. The genes were linked to musculature, conformation and, also neurological processes. Indicating that not only physical qualities are important for harness racing performance, but also mental qualities such as learning and intelligence.
43
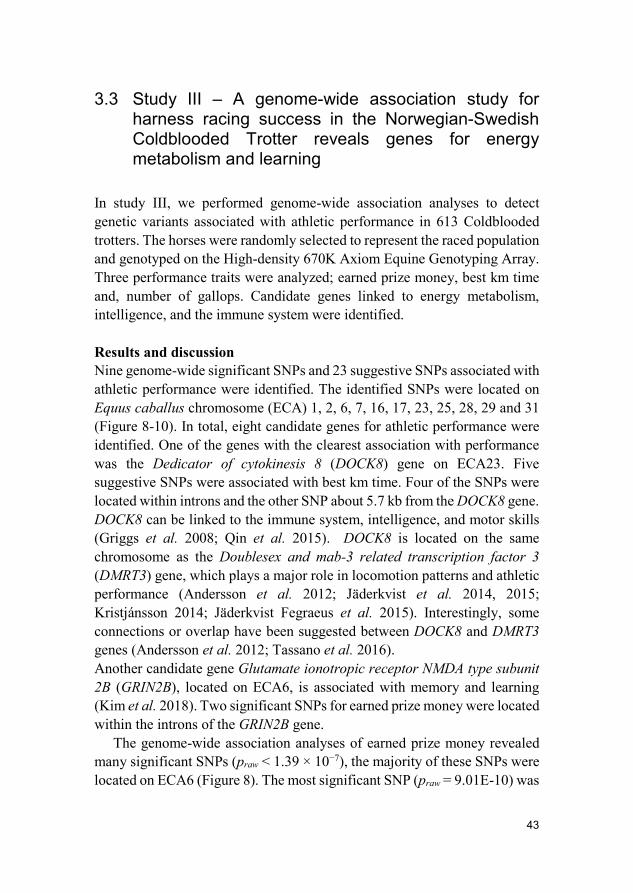
3.3 Study III – A genome-wide association study for harness racing success in the Norwegian-Swedish Coldblooded Trotter reveals genes for energy metabolism and learning
In study III, we performed genome-wide association analyses to detect genetic variants associated with athletic performance in 613 Coldblooded trotters. The horses were randomly selected to represent the raced population and genotyped on the High-density 670K Axiom Equine Genotyping Array. Three performance traits were analyzed; earned prize money, best km time and, number of gallops. Candidate genes linked to energy metabolism, intelligence, and the immune system were identified.
Results and discussion Nine genome-wide significant SNPs and 23 suggestive SNPs associated with athletic performance were identified. The identified SNPs were located on Equus caballus chromosome (ECA) 1, 2, 6, 7, 16, 17, 23, 25, 28, 29 and 31 (Figure 8-10). In total, eight candidate genes for athletic performance were identified. One of the genes with the clearest association with performance was the Dedicator of cytokinesis 8 (DOCK8) gene on ECA23. Five suggestive SNPs were associated with best km time. Four of the SNPs were located within introns and the other SNP about 5.7 kb from the DOCK8 gene. DOCK8 can be linked to the immune system, intelligence, and motor skills (Griggs et al. 2008; Qin et al. 2015). DOCK8 is located on the same chromosome as the Doublesex and mab-3 related transcription factor 3 (DMRT3) gene, which plays a major role in locomotion patterns and athletic performance (Andersson et al. 2012; Jäderkvist et al. 2014, 2015; Kristjánsson 2014; Jäderkvist Fegraeus et al. 2015). Interestingly, some connections or overlap have been suggested between DOCK8 and DMRT3 genes (Andersson et al. 2012; Tassano et al. 2016). Another candidate gene Glutamate ionotropic receptor NMDA type subunit 2B (GRIN2B), located on ECA6, is associated with memory and learning (Kim et al. 2018). Two significant SNPs for earned prize money were located within the introns of the GRIN2B gene.
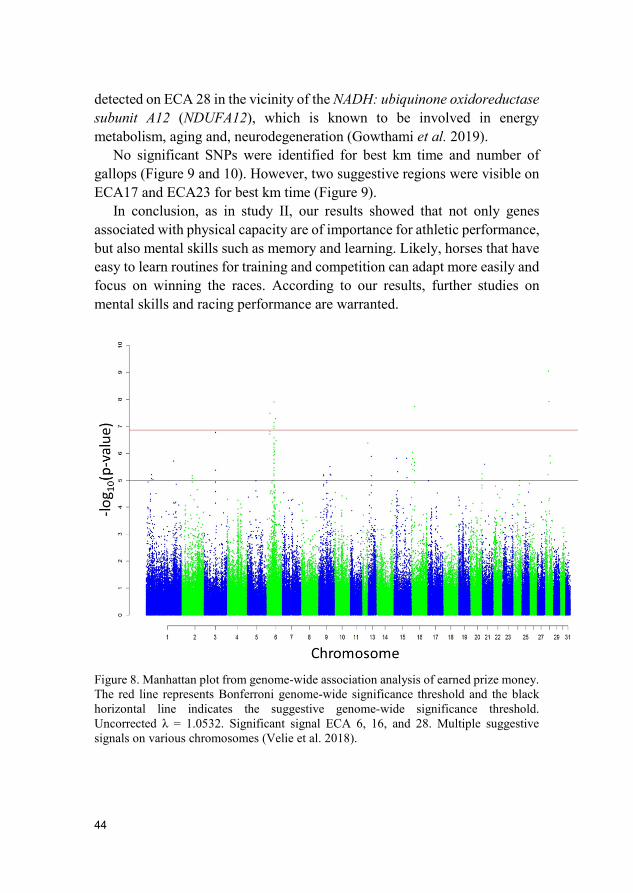
The genome-wide association analyses of earned prize money revealed many significant SNPs (praw < 1.39 × 10⁻⁷), the majority of these SNPs were located on ECA6 (Figure 8). The most significant SNP (praw = 9.01E-10) was
44
detected on ECA 28 in the vicinity of the NADH: ubiquinone oxidoreductase subunit A12 (NDUFA12), which is known to be involved in energy metabolism, aging and, neurodegeneration (Gowthami et al. 2019).
No significant SNPs were identified for best km time and number of gallops (Figure 9 and 10). However, two suggestive regions were visible on ECA17 and ECA23 for best km time (Figure 9).
In conclusion, as in study II, our results showed that not only genes associated with physical capacity are of importance for athletic performance, but also mental skills such as memory and learning. Likely, horses that have easy to learn routines for training and competition can adapt more easily and focus on winning the races. According to our results, further studies on mental skills and racing performance are warranted.
Figure 8. Manhattan plot from genome-wide association analysis of earned prize money. The red line represents Bonferroni genome-wide significance threshold and the black horizontal line indicates the suggestive genome-wide significance threshold. Uncorrected λ = 1.0532. Significant signal ECA 6, 16, and 28. Multiple suggestive signals on various chromosomes (Velie et al. 2018).
45
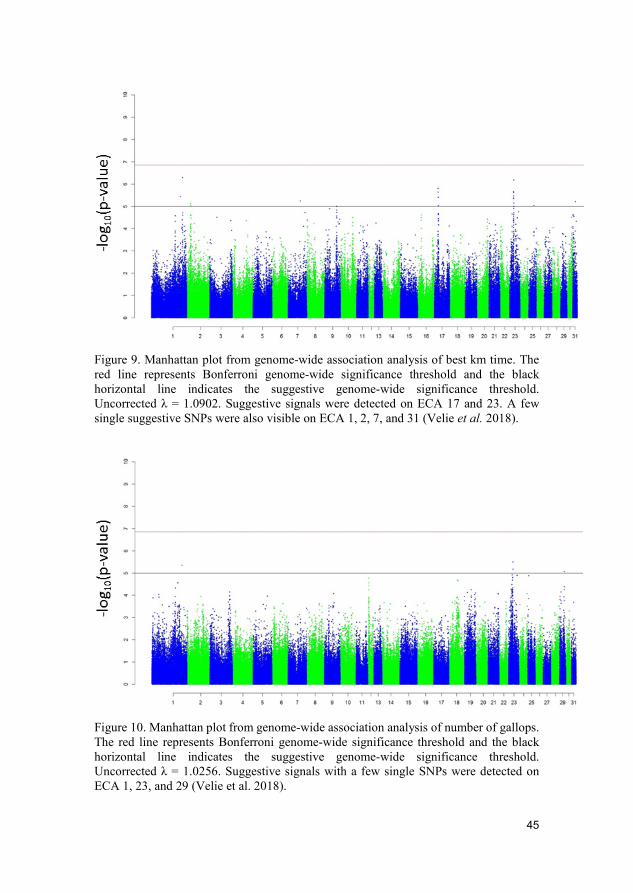
Figure 9. Manhattan plot from genome-wide association analysis of best km time. The red line represents Bonferroni genome-wide significance threshold and the black horizontal line indicates the suggestive genome-wide significance threshold. Uncorrected λ = 1.0902. Suggestive signals were detected on ECA 17 and 23. A few single suggestive SNPs were also visible on ECA 1, 2, 7, and 31 (Velie et al. 2018).
Figure 10. Manhattan plot from genome-wide association analysis of number of gallops. The red line represents Bonferroni genome-wide significance threshold and the black horizontal line indicates the suggestive genome-wide significance threshold. Uncorrected λ = 1.0256. Suggestive signals with a few single SNPs were detected on ECA 1, 23, and 29 (Velie et al. 2018).
46
3.4 Study IV – Genetic regulation of racing performance and exercise related blood pressure in Coldblooded trotters
In study IV, we dissected a genomic region from previous selective sweep mapping for athletic performance located about 50 kb from the Endothelin 3 (EDN3) gene (Jäderkvist Fegraeus et al. 2018). The overall aim was to study regulatory genetics of athletic performance and exercise related blood pressure. We also investigated differences in plasma proteins levels between the haplotype groups (sub-elite and elite performing) before and during exercise.
Results and discussion The associated genomic region did not harbor any protein coding genes and was syntenic to a region on human chromosome 20 between EDN3 and PHACTR3. Therefore, we hypothesized that a regulatory element was located within the associated region regulating candidate gene or genes outside. To identify candidate causal genetic variants, we applied WGS and targeted long-read sequencing in Coldblooded trotters selected based on associated haplotype and harness racing performance records (i.e. earnings per start). WGS revealed genetic variants with potential regulatory functions. One SNP of which the mutant overlapped a potential transcription factor binding site. The SNP was associated with multiple performance traits. In addition, a tandem duplication of 37.6 kb that involved the EDN3 promoter flank region and the two first exons of the EDN3 gene was detected in horses carrying the elite performing haplotype.
Horses carrying the sub-elite performing haplotype had higher plasma concentration of EDN1 and lower plasma concentration of EDN3 than the elite performing haplotype group. They also had higher blood pressure during exercise and 20 minutes after the complete exercise. There were no differences in blood pressure between the haplotype groups at rest.
The relative quantitative proteomics analysis showed that proteins linked to inflammatory and coagulation processes were differentially expressed between the haplotype groups. During exercise compared to rest, horses carrying the sub-elite performing haplotype had higher plasma levels of proteins involved in complement and coagulation processes. The complement system is a part of the innate immune system (Rus et al. 2005).
47
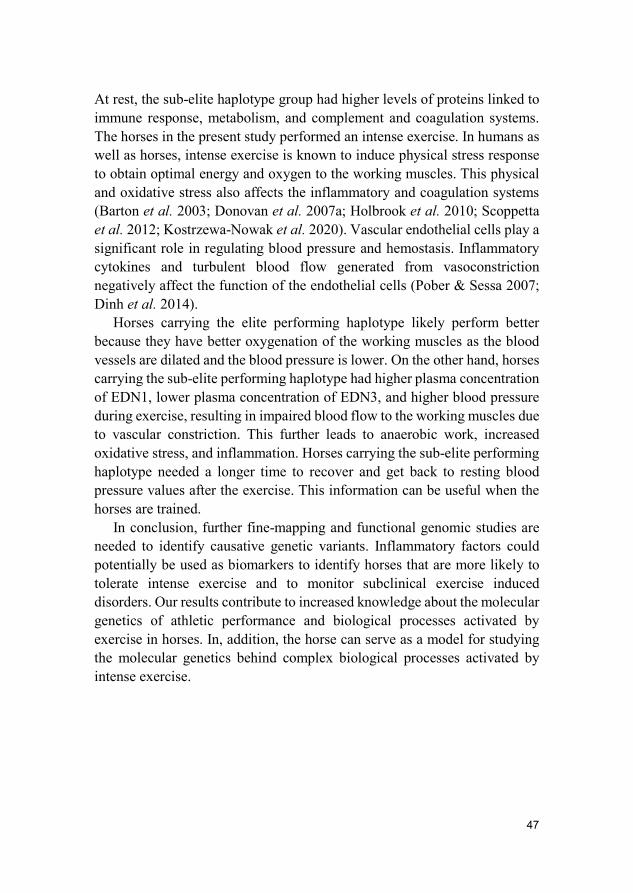
At rest, the sub-elite haplotype group had higher levels of proteins linked to immune response, metabolism, and complement and coagulation systems. The horses in the present study performed an intense exercise. In humans as well as horses, intense exercise is known to induce physical stress response to obtain optimal energy and oxygen to the working muscles. This physical and oxidative stress also affects the inflammatory and coagulation systems (Barton et al. 2003; Donovan et al. 2007a; Holbrook et al. 2010; Scoppetta et al. 2012; Kostrzewa-Nowak et al. 2020). Vascular endothelial cells play a significant role in regulating blood pressure and hemostasis. Inflammatory cytokines and turbulent blood flow generated from vasoconstriction negatively affect the function of the endothelial cells (Pober & Sessa 2007; Dinh et al. 2014).
Horses carrying the elite performing haplotype likely perform better because they have better oxygenation of the working muscles as the blood vessels are dilated and the blood pressure is lower. On the other hand, horses carrying the sub-elite performing haplotype had higher plasma concentration of EDN1, lower plasma concentration of EDN3, and higher blood pressure during exercise, resulting in impaired blood flow to the working muscles due to vascular constriction. This further leads to anaerobic work, increased oxidative stress, and inflammation. Horses carrying the sub-elite performing haplotype needed a longer time to recover and get back to resting blood pressure values after the exercise. This information can be useful when the horses are trained.
In conclusion, further fine-mapping and functional genomic studies are needed to identify causative genetic variants. Inflammatory factors could potentially be used as biomarkers to identify horses that are more likely to tolerate intense exercise and to monitor subclinical exercise induced disorders. Our results contribute to increased knowledge about the molecular genetics of athletic performance and biological processes activated by exercise in horses. In, addition, the horse can serve as a model for studying the molecular genetics behind complex biological processes activated by intense exercise.
48
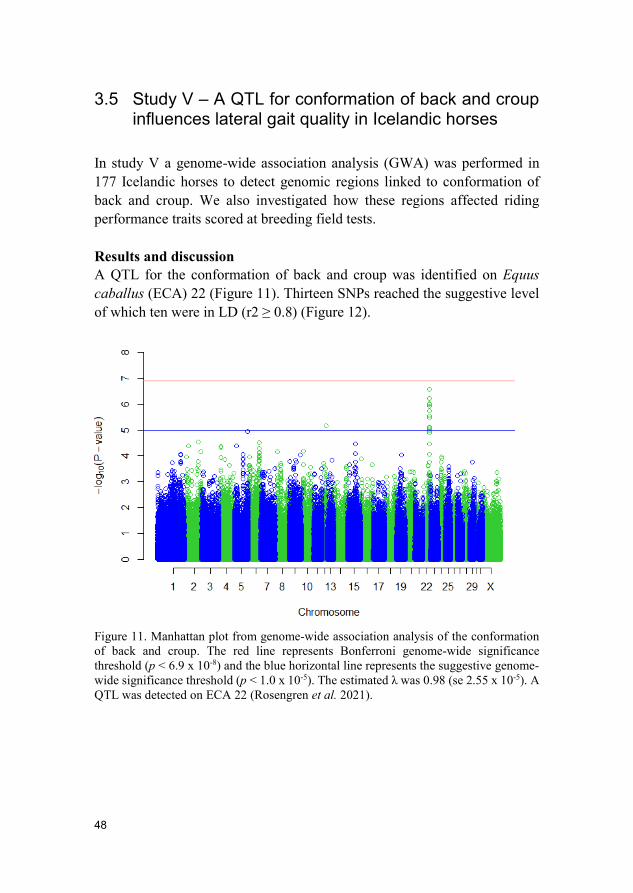
3.5 Study V – A QTL for conformation of back and croup influences lateral gait quality in Icelandic horses
In study V a genome-wide association analysis (GWA) was performed in 177 Icelandic horses to detect genomic regions linked to conformation of back and croup. We also investigated how these regions affected riding performance traits scored at breeding field tests.
Results and discussion A QTL for the conformation of back and croup was identified on Equus caballus (ECA) 22 (Figure 11). Thirteen SNPs reached the suggestive level of which ten were in LD (r2 ≥ 0.8) (Figure 12).
Figure 11. Manhattan plot from genome-wide association analysis of the conformation of back and croup. The red line represents Bonferroni genome-wide significance threshold (p < 6.9 x 10⁻⁸) and the blue horizontal line represents the suggestive genome-wide significance threshold (p < 1.0 x 10⁻⁵). The estimated λ was 0.98 (se 2.55 x 10⁻⁵). A QTL was detected on ECA 22 (Rosengren et al. 2021).
49
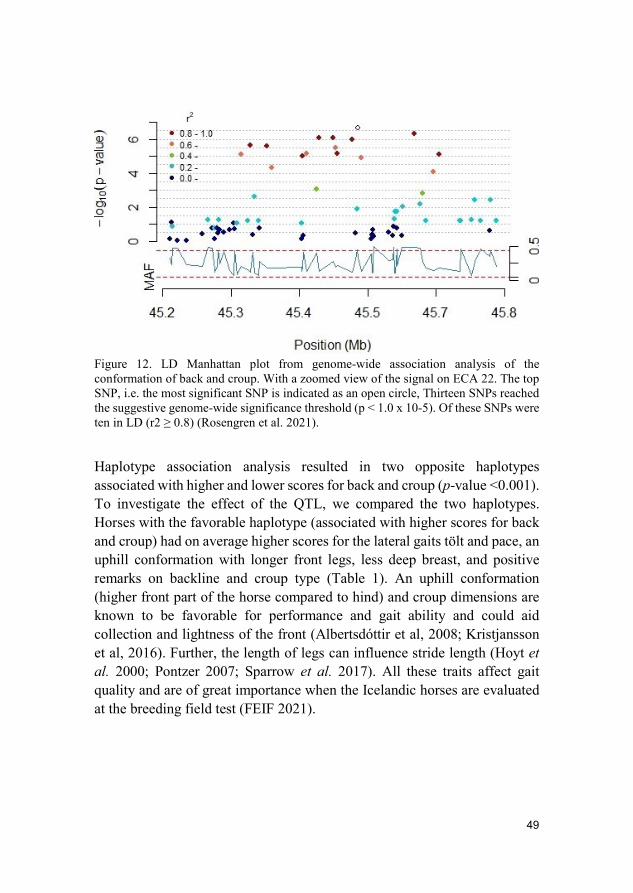
Figure 12. LD Manhattan plot from genome-wide association analysis of the conformation of back and croup. With a zoomed view of the signal on ECA 22. The top SNP, i.e. the most significant SNP is indicated as an open circle, Thirteen SNPs reached the suggestive genome-wide significance threshold (p < 1.0 x 10⁻⁵). Of these SNPs were ten in LD (r2 ≥ 0.8) (Rosengren et al. 2021).
Haplotype association analysis resulted in two opposite haplotypes associated with higher and lower scores for back and croup (p-value <0.001). To investigate the effect of the QTL, we compared the two haplotypes. Horses with the favorable haplotype (associated with higher scores for back and croup) had on average higher scores for the lateral gaits tölt and pace, an uphill conformation with longer front legs, less deep breast, and positive remarks on backline and croup type (Table 1). An uphill conformation (higher front part of the horse compared to hind) and croup dimensions are known to be favorable for performance and gait ability and could aid collection and lightness of the front (Albertsdóttir et al, 2008; Kristjansson et al, 2016). Further, the length of legs can influence stride length (Hoyt et al. 2000; Pontzer 2007; Sparrow et al. 2017). All these traits affect gait quality and are of great importance when the Icelandic horses are evaluated at the breeding field test (FEIF 2021).
50
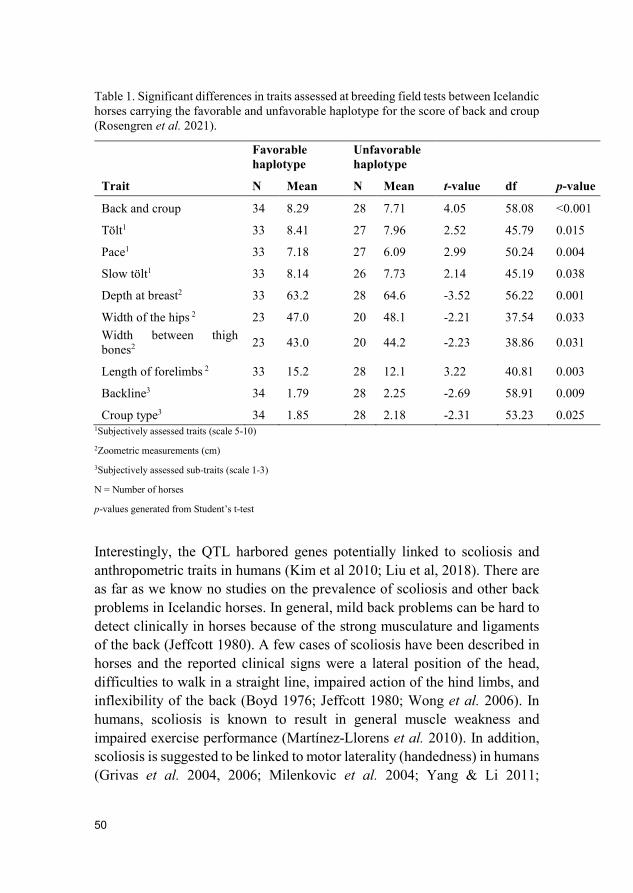
Table 1. Significant differences in traits assessed at breeding field tests between Icelandic horses carrying the favorable and unfavorable haplotype for the score of back and croup (Rosengren et al. 2021).
Favorable haplotype
Unfavorable haplotype
Trait N Mean N Mean t-value df p-value
Back and croup 34 8.29 28 7.71 4.05 58.08 <0.001
Tölt1 33 8.41 27 7.96 2.52 45.79 0.015
Pace1 33 7.18 27 6.09 2.99 50.24 0.004
Slow tölt1 33 8.14 26 7.73 2.14 45.19 0.038
Depth at breast2 33 63.2 28 64.6 -3.52 56.22 0.001
Width of the hips 2 23 47.0 20 48.1 -2.21 37.54 0.033 Width between thigh bones2 23 43.0 20 44.2 -2.23 38.86 0.031
Length of forelimbs 2 33 15.2 28 12.1 3.22 40.81 0.003
Backline3 34 1.79 28 2.25 -2.69 58.91 0.009
Croup type3 34 1.85 28 2.18 -2.31 53.23 0.025 1Subjectively assessed traits (scale 5-10) 2Zoometric measurements (cm) 3Subjectively assessed sub-traits (scale 1-3)
N = Number of horses
p-values generated from Student’s t-test
Interestingly, the QTL harbored genes potentially linked to scoliosis and anthropometric traits in humans (Kim et al 2010; Liu et al, 2018). There are as far as we know no studies on the prevalence of scoliosis and other back problems in Icelandic horses. In general, mild back problems can be hard to detect clinically in horses because of the strong musculature and ligaments of the back (Jeffcott 1980). A few cases of scoliosis have been described in horses and the reported clinical signs were a lateral position of the head, difficulties to walk in a straight line, impaired action of the hind limbs, and inflexibility of the back (Boyd 1976; Jeffcott 1980; Wong et al. 2006). In humans, scoliosis is known to result in general muscle weakness and impaired exercise performance (Martínez-Llorens et al. 2010). In addition, scoliosis is suggested to be linked to motor laterality (handedness) in humans (Grivas et al. 2004, 2006; Milenkovic et al. 2004; Yang & Li 2011;
51
Catanzariti et al. 2014). As well as humans, horses commonly show motor laterality (McGreevy & Thomson 2006; Lucidi et al. 2013; Cully et al. 2018). Some horses have harder finding balance and straightness during training, which is of great importance for lateral gaits.
In conclusion, our results showed that the detected QTL affected not only conformation of back and croup, but also quality of the lateral gaits tölt and pace. Based on the results from this study, a genetic test has been developed that may be valuable for breeders and trainers to help in their selection of breeding horses. In addition, horses can potentially serve as a model to increase the knowledge about scoliosis and motor laterality in humans. Further studies are warranted to fully understand the biological background of the QTL and how it affects back and croup conformation, as well as the quality of the lateral gaits in Icelandic horses and other breeds.

53
4. General discussion and future perspectives
In this thesis, the genetics of athletic performance and conformation in horses, as well as the level of inbreeding in Coldblooded trotters, were investigated.
In paper I, the genomic inbreeding coefficient in Coldblooded trotters was estimated. The coldblooded trotters have been strongly selected for racing performance since the 1950s, and their athletic capacity has remarkably improved (Arnason et al. 1989; Uhlin 2007). However, the selection has also resulted in a gradual increase in the inbreeding level, which can negatively affect health and racing performance (Klemetsdal 1998; Todd et al. 2018; Samsonstuen et al. 2020). Coldblooded trotters consist of a relatively small population, and a few popular stallions dominate the breeding (Svensk Travsport 2020). Effective methods are needed to monitor and limit inbreeding to avoid future problems with hereditary diseases. The change in the level of inbreeding was investigated between the years 2000 to 2009 using both pedigree and high-density genotyping array data. Both methods showed similar results with a gradually increased inbreeding level. However, the inbreeding coefficient based on pedigree data was lower, most likely because old pedigree data may contain incorrect information. Different definitions of ROH, such as minimum length, the minimum number of SNPs, missing genotypes, and heterozygous SNPs, affect the results. We tested different thresholds and selected the one that resulted in the highest correlation with the pedigree-based level of inbreeding to capture longer ROH common within the population. Genomic data gives more exact information and detects genomic regions sensitive to inbreeding. Genomic measures of inbreeding could be introduced into the EBV as a tool when selecting horses for breeding to preserve genetic diversity.
In this thesis, different genetic mapping methods were used to investigate the genetics of athletic performance and conformation traits in horses. Both performance and conformation are complex traits influenced by multiple factors. The results from papers II and III indicated that athletic performance requires not only physical characteristics but also mental qualities. One of the candidate genomic regions detected in paper II harbored the gene SORCS3 associated with spatial memory and learning (Breiderhoff et al. 2013). The genome scan in Coldblooded trotters in paper III revealed the
54
candidate genes DOCK8 associated with the immune system, intelligence, and motor skills, as well as GRIN2B linked to memory and learning (Griggs et al. 2008; Kim et al. 2018). Likely, horses that have easy to understand routines for training and competition can better adapt and focus on winning the races. During domestication, horses were selected for mental skills suited for horseback riding and chariotry. Horses that were docile and less sensitive to stress were easier to handle. The ZFPM1 gene associated with fear memory and temperament was selected during the domestication process (Aki & Miczek 2014; Suri et al. 2018; Librado et al. 2021). The identification of these candidate genes motivates future studies aimed to disentangle the molecular mechanisms behind mental skills and racing performance.
In paper IV we investigated regulatory genetics of athletic performance and exercise related blood pressure in Coldblooded trotters. Horses with the elite performing haplotype had higher plasma concentration of EDN3 and lower exercise induced blood pressure. In addition, these horses had lower plasma concentration of EDN1. EDN3 dilates arteries and increases the blood volume, whereas EDN1 overall has opposite effects (Yanagisawa et al. 1988; Rossi 1993; Rossi et al. 1999). The blood vessels need to be dilated during exercise to support the working muscles with energy and oxygen. Moreover, a larger blood volume is required to obtain sufficient blood flow to the active muscles and for sweating to regulate the temperature (McKeever & Hinchcliff 1995).
The relative quantitative proteomics analysis in paper IV revealed that proteins linked to inflammatory and coagulation processes were differentially expressed between the haplotype groups at rest and during exercise. During exercise compared to rest, horses carrying the sub-elite performing haplotype had higher levels of proteins related to inflammatory and coagulation processes. Intense exercise activates a physical stress response to obtain more energy for the working muscles. The released stress hormones also affect inflammatory and coagulation processes. (Donovan et al. 2007a; Holbrook et al. 2010; Scoppetta et al. 2012; Kim et al. 2021). Endothelial cells in the vascular wall have a significant role in maintaining blood flow by regulating the diameter of the blood vessels and by preventing the blood from clotting (Pober & Sessa 2007; Dinh et al. 2014). The blood flows more efficiently with less turbulence if the blood vessels are wide and if the blood is less viscous (Poole & Erickson 2004). The blood vessels need to be dilated during intense exercise to supply the working muscles with
55
energy and oxygen. However, inflammatory factors and turbulent flow disturb the function of the endothelial cells (Pober & Sessa 2007; Dinh et al. 2014). The oxidative stress marker Thiobarbituric Acid Reactive Substances (TBARS) is associated with decreased endurance in horses (Holbrook et al. 2010). Pro-inflammatory cytokines such as IL-6 and TNF-α are known the be activated during intense exercise in both horses and humans (Donovan et al. 2007b; Gondim et al. 2009; Holbrook et al. 2010; Scoppetta et al. 2012; Kim et al. 2021). The generated cytokines and oxidative stress markers could be used as biomarkers to monitor exercise induced disorders and identify horses that are more likely to tolerate intense training and maximum exercise. In future studies, we would like to follow up the horses included in paper IV, measure blood pressure while the horses are running, and take blood samples before, during, and as well as post exercise to validate potential biomarkers. In addition, the detected proteins need to be further validated with other protein detection methods such as ELISA and Western blot.
Conformation is essential for health, durability, and performance. It is well known that conformation of back and croup affects riding ability and performance in Icelandic horses (Albertsdóttir et al. 2008; Kristjansson et al. 2016). In paper V, we investigated the genome of 177 Icelandic horses assessed at breeding field tests to dissect the genetics of conformation of back and croup. A genomic region was detected containing genes linked to anthropometric traits, scoliosis, and motor laterality in humans. The genomic region affected conformation of back and croup and the quality of the lateral gaits tölt and pace. Horses with the genetic variants associated with a higher score for back and croup had higher scores for tölt and pace and an uphill conformation (higher front part of the horse compared to hind). They had a less deep breast, longer front legs, and a well-balanced backline. The backline is the line from the withers and back to the lumbosacral joint. The backline should not be forward sloping or swayback. An uphill conformation and croup dimensions play a significant role in sports performance and riding ability in Icelandic horses. The detected QTL harbored genes associated with scoliosis in humans (Liu et al. 2018). Interestingly, there is a potential link between scoliosis and motor laterality in humans (Grivas et al. 2004, 2006; Milenkovic et al. 2004; Yang & Li 2011; Catanzariti et al. 2014). In addition, scoliosis is known to result in general muscle weakness and impaired exercise performance in humans (Martínez-Llorens et al. 2010). Just like
56
humans, horses display handedness, and some horses even have problems walking in a straight line when they start to be trained. Usually, these horses need more training to strengthen their balance. In future research, we would like to use biomechanical monitoring tools to perform a detailed investigation of how the detected QTL affects the gait quality in Icelandic horses as well as in other gaited breeds. In addition, as conformation and locomotion patterns are associated with athletic performance, we would like to investigate whether the detected QTL for back and croup affects harness racing performance success.
The detected significant association signals from papers IV and V were located within non-coding regions and could therefore have a transcriptional regulatory function on genes encoding proteins of importance for the studied traits. High-resolution chromosome conformation assays such as 4C and HiCap would help us identify causative regulatory genetic variants and their target genes. With HiCap, it is possible to map individual enhancer interactions with known promoters in the whole genome (Sahlén et al. 2015). In future research, we would like to perform chromosome conformation experiments in cell types relevant for the studied traits in wild type and mutant horses followed by functional validation of detected potential causative genetic variants using CRISPR-Cas-based editing.
In conclusion, this thesis contributes to increased knowledge about the molecular genetics of athletic performance and biological processes activated by intense exercise as well as conformation traits in horses. The obtained results will be valuable for breeders and trainers in their selection of breeding horses and how to optimize the training of their horses. The horse can also serve as an excellent model to understand the genetics and biological mechanisms behind complex traits such as athletic performance, blood pressure regulation, inflammation, locomotion pattern, and anthropometric traits of importance for humans other mammalian species.
57
5. Concluding remarksThis thesis contributes to the understanding of the molecular genetics of athletic performance, conformation, and quality of lateral gaits in horses. The results can be valuable for trainers to adjust the training of the horses and for breeders when selecting horses for breeding. In addition, the horse can be used as a model for studying the molecular genetics of complex traits and biological processes activated by intense exercise.
The level of inbreeding had gradually increased in Coldbloodedtrotters during the investigated years 2000 to 2009. Genomicmeasures of relationship are more exact and can identify genomicregions sensitive for inbreeding. Thus, genomic measures ofrelationship between potential breeding horses could be introducedwhen selecting horses for breeding to minimize further increasedinbreeding.
The results from papers II and III indicated that athletic performancerequires not only physical characteristics but also mental qualitiessuch as memory and learning.
In paper IV, candidate genetic variants influencing athleticperformance and exercise related blood pressure regulation weredetected. Coldblooded trotters carrying the elite performinghaplotype likely perform better because they can achieve improvedoxygenation of the working muscles as the blood vessels are dilated,and the blood pressure is lower. On the other hand, Coldbloodedtrotters carrying the sub-elite performing haplotype had higher bloodpressure during exercise and needed a longer time to recover andreturn to resting blood pressure levels post-exercise. Thisinformation can be valuable when the horses are trained. In addition,horses harboring the sub-elite performing haplotype had higherplasma levels of proteins linked to inflammatory and coagulationprocesses. Inflammatory factors and oxidative stress markers couldbe used as biomarkers to monitor exercise induced disorders such asovertraining and identify horses that are more likely to tolerateintense training and maximum exercise.
58
A QTL for back and croup was detected in Icelandic horses thataffected the conformation of back and croup and the quality of lateralgaits. Based on the results from this study a genetic test wasdeveloped that can be useful when horses are selected for breeding.The results also highlighted potential links between scoliosis andmotor laterality.
59
Ablondi, M., Eriksson, S., Tetu, S., Sabbioni, A., Viklund, Å. & Mikko, S. (2019). Genomic Divergence in Swedish Warmblood Horses Selected for Equestrian Disciplines. Genes, vol. 10 (12), 976
Adalsteinsson, S. (1981). Origin and conservation of farm animal populations in Iceland. Journal of Animal Breeding and Genetics, vol. 98 (1–4), pp. 258–264
Aki, T. & Miczek, K.A. (2014). Neurogenetics of Aggressive Behavior – Studies in Rodents. Curr Top Behav Neurosci., pp. 1–41
Albertsdóttir, E., Eriksson, S., Näsholm, A., Strandberg, E. & Árnason, T. (2008). Genetic correlations between competition traits and traits scored at breeding field-tests in Icelandic horses. Livestock Science, vol. 114 (2–3), pp. 181–187
Alhajj, M. & Farhana, A. (2021). Enzyme Linked Immunosorbent Assay. StatPearls, StatPearls Publishing.
Andersson, L. (2016). Domestic animals as models for biomedical research. Upsala Journal of Medical Sciences, vol. 121 (1), pp. 1–11
Andersson, L.S., Larhammar, M., Memic, F., Wootz, H., Schwochow, D., Rubin, C.J., Patra, K., Arnason, T., Wellbring, L., Hjälm, G., Imsland, F., Petersen,J.L., McCue, M.E., Mickelson, J.R., Cothran, G., Ahituv, N., Roepstorff,L., Mikko, S., Vallstedt, A., Lindgren, G., Andersson, L. & Kullander, K.(2012). Mutations in DMRT3 affect locomotion in horses and spinal circuitfunction in mice. Nature, vol. 488 (7413), pp. 642–646 Nature PublishingGroup.
Arai, H., Hori, S., Aramori, lchiro, Ohkubo, H. & Nakanishi, S. (1990). Cloning and expression of a cDNA encoding an endothelin receptor. Nature, vol. 348 (December), pp. 730–732
Ardestani, S.S., Aminafshar, M., Maryam, M.B.Z.B., Banabazi, M.H., Sargolzaei, M. & Miar, Y. (2020). Whole-genome signatures of selection in sport horsesrevealed selection footprints related to musculoskeletal system developmentprocesses. Animals, vol. 10 (1)
Arnason, T., Bendroth, M., Philipsson, J., Henriksson, K. & Darenius, A. (1989). Genetic evaluation of Swedish trotters. In State of breeding evaluation in trotters., 1989. pp. 106–130. EAAP
Barton, M.H., Williamson, L., Jacks, S. & Norton, N. (2003). Effects on plasma endotoxin and eicosanoid concentrations and serum cytokine activities in horses competing in a 48-, 83-, or 159-km endurance ride under similar
References
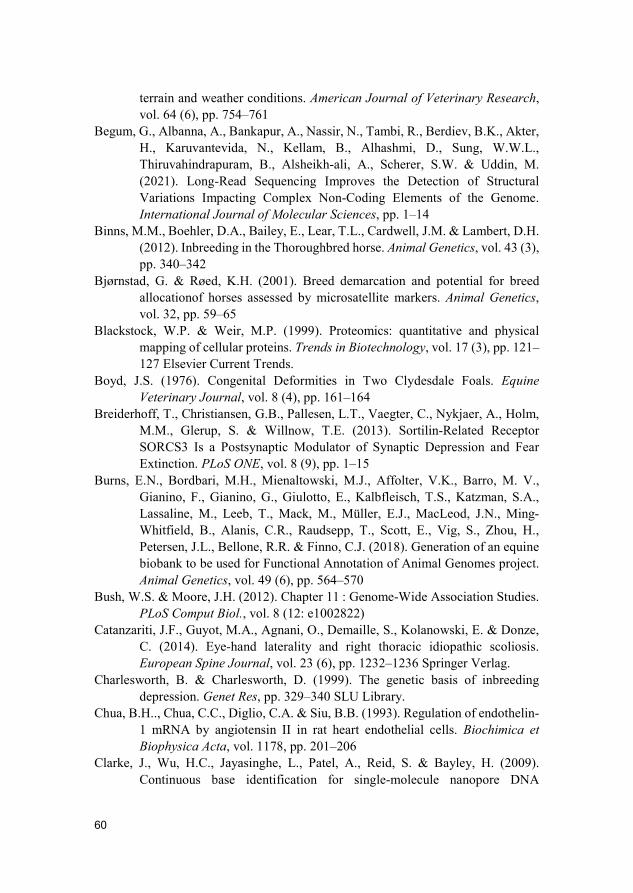
60
terrain and weather conditions. American Journal of Veterinary Research, vol. 64 (6), pp. 754–761
Begum, G., Albanna, A., Bankapur, A., Nassir, N., Tambi, R., Berdiev, B.K., Akter, H., Karuvantevida, N., Kellam, B., Alhashmi, D., Sung, W.W.L., Thiruvahindrapuram, B., Alsheikh-ali, A., Scherer, S.W. & Uddin, M. (2021). Long-Read Sequencing Improves the Detection of Structural Variations Impacting Complex Non-Coding Elements of the Genome. International Journal of Molecular Sciences, pp. 1–14
Binns, M.M., Boehler, D.A., Bailey, E., Lear, T.L., Cardwell, J.M. & Lambert, D.H. (2012). Inbreeding in the Thoroughbred horse. Animal Genetics, vol. 43 (3), pp. 340–342
Bjørnstad, G. & Røed, K.H. (2001). Breed demarcation and potential for breed allocationof horses assessed by microsatellite markers. Animal Genetics, vol. 32, pp. 59–65
Blackstock, W.P. & Weir, M.P. (1999). Proteomics: quantitative and physical mapping of cellular proteins. Trends in Biotechnology, vol. 17 (3), pp. 121–127 Elsevier Current Trends.
Boyd, J.S. (1976). Congenital Deformities in Two Clydesdale Foals. Equine Veterinary Journal, vol. 8 (4), pp. 161–164
Breiderhoff, T., Christiansen, G.B., Pallesen, L.T., Vaegter, C., Nykjaer, A., Holm, M.M., Glerup, S. & Willnow, T.E. (2013). Sortilin-Related ReceptorSORCS3 Is a Postsynaptic Modulator of Synaptic Depression and FearExtinction. PLoS ONE, vol. 8 (9), pp. 1–15
Burns, E.N., Bordbari, M.H., Mienaltowski, M.J., Affolter, V.K., Barro, M. V., Gianino, F., Gianino, G., Giulotto, E., Kalbfleisch, T.S., Katzman, S.A., Lassaline, M., Leeb, T., Mack, M., Müller, E.J., MacLeod, J.N., Ming-Whitfield, B., Alanis, C.R., Raudsepp, T., Scott, E., Vig, S., Zhou, H., Petersen, J.L., Bellone, R.R. & Finno, C.J. (2018). Generation of an equine biobank to be used for Functional Annotation of Animal Genomes project. Animal Genetics, vol. 49 (6), pp. 564–570
Bush, W.S. & Moore, J.H. (2012). Chapter 11 : Genome-Wide Association Studies. PLoS Comput Biol., vol. 8 (12: e1002822)
Catanzariti, J.F., Guyot, M.A., Agnani, O., Demaille, S., Kolanowski, E. & Donze, C. (2014). Eye-hand laterality and right thoracic idiopathic scoliosis.European Spine Journal, vol. 23 (6), pp. 1232–1236 Springer Verlag.
Charlesworth, B. & Charlesworth, D. (1999). The genetic basis of inbreeding depression. Genet Res, pp. 329–340 SLU Library.
Chua, B.H.., Chua, C.C., Diglio, C.A. & Siu, B.B. (1993). Regulation of endothelin-1 mRNA by angiotensin II in rat heart endothelial cells. Biochimica et Biophysica Acta, vol. 1178, pp. 201–206
Clarke, J., Wu, H.C., Jayasinghe, L., Patel, A., Reid, S. & Bayley, H. (2009). Continuous base identification for single-molecule nanopore DNA
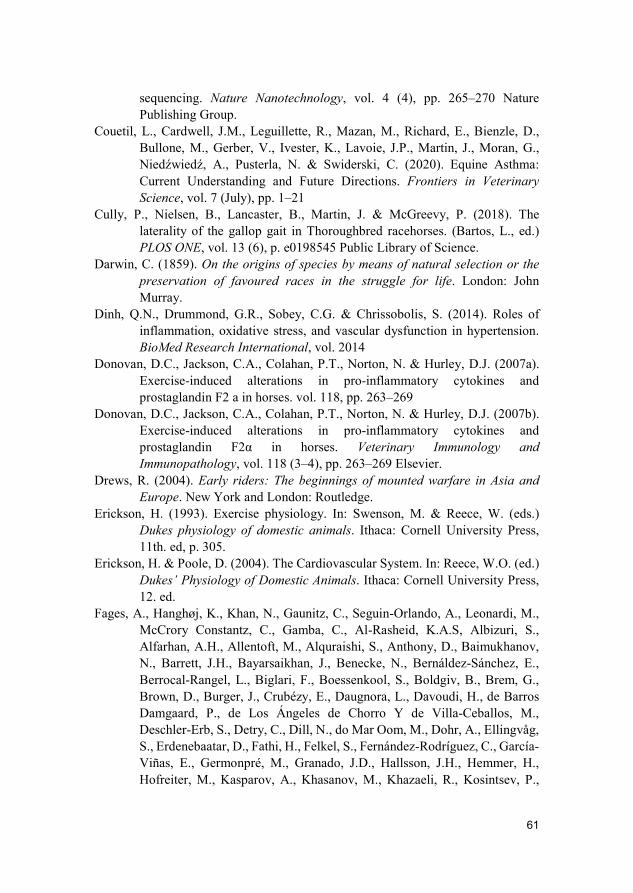
61
sequencing. Nature Nanotechnology, vol. 4 (4), pp. 265–270 Nature Publishing Group.
Couetil, L., Cardwell, J.M., Leguillette, R., Mazan, M., Richard, E., Bienzle, D., Bullone, M., Gerber, V., Ivester, K., Lavoie, J.P., Martin, J., Moran, G., Niedźwiedź, A., Pusterla, N. & Swiderski, C. (2020). Equine Asthma: Current Understanding and Future Directions. Frontiers in Veterinary Science, vol. 7 (July), pp. 1–21
Cully, P., Nielsen, B., Lancaster, B., Martin, J. & McGreevy, P. (2018). The laterality of the gallop gait in Thoroughbred racehorses. (Bartos, L., ed.) PLOS ONE, vol. 13 (6), p. e0198545 Public Library of Science.
Darwin, C. (1859). On the origins of species by means of natural selection or the preservation of favoured races in the struggle for life. London: John Murray.
Dinh, Q.N., Drummond, G.R., Sobey, C.G. & Chrissobolis, S. (2014). Roles of inflammation, oxidative stress, and vascular dysfunction in hypertension. BioMed Research International, vol. 2014
Donovan, D.C., Jackson, C.A., Colahan, P.T., Norton, N. & Hurley, D.J. (2007a). Exercise-induced alterations in pro-inflammatory cytokines and prostaglandin F2 a in horses. vol. 118, pp. 263–269
Donovan, D.C., Jackson, C.A., Colahan, P.T., Norton, N. & Hurley, D.J. (2007b). Exercise-induced alterations in pro-inflammatory cytokines and prostaglandin F2α in horses. Veterinary Immunology and Immunopathology, vol. 118 (3–4), pp. 263–269 Elsevier.
Drews, R. (2004). Early riders: The beginnings of mounted warfare in Asia and Europe. New York and London: Routledge.
Erickson, H. (1993). Exercise physiology. In: Swenson, M. & Reece, W. (eds.) Dukes physiology of domestic animals. Ithaca: Cornell University Press, 11th. ed, p. 305.
Erickson, H. & Poole, D. (2004). The Cardiovascular System. In: Reece, W.O. (ed.) Dukes’ Physiology of Domestic Animals. Ithaca: Cornell University Press, 12. ed.
Fages, A., Hanghøj, K., Khan, N., Gaunitz, C., Seguin-Orlando, A., Leonardi, M., McCrory Constantz, C., Gamba, C., Al-Rasheid, K.A.S, Albizuri, S., Alfarhan, A.H., Allentoft, M., Alquraishi, S., Anthony, D., Baimukhanov, N., Barrett, J.H., Bayarsaikhan, J., Benecke, N., Bernáldez-Sánchez, E., Berrocal-Rangel, L., Biglari, F., Boessenkool, S., Boldgiv, B., Brem, G., Brown, D., Burger, J., Crubézy, E., Daugnora, L., Davoudi, H., de Barros Damgaard, P., de Los Ángeles de Chorro Y de Villa-Ceballos, M., Deschler-Erb, S., Detry, C., Dill, N., do Mar Oom, M., Dohr, A., Ellingvåg, S., Erdenebaatar, D., Fathi, H., Felkel, S., Fernández-Rodríguez, C., García-Viñas, E., Germonpré, M., Granado, J.D., Hallsson, J.H., Hemmer, H., Hofreiter, M., Kasparov, A., Khasanov, M., Khazaeli, R., Kosintsev, P.,
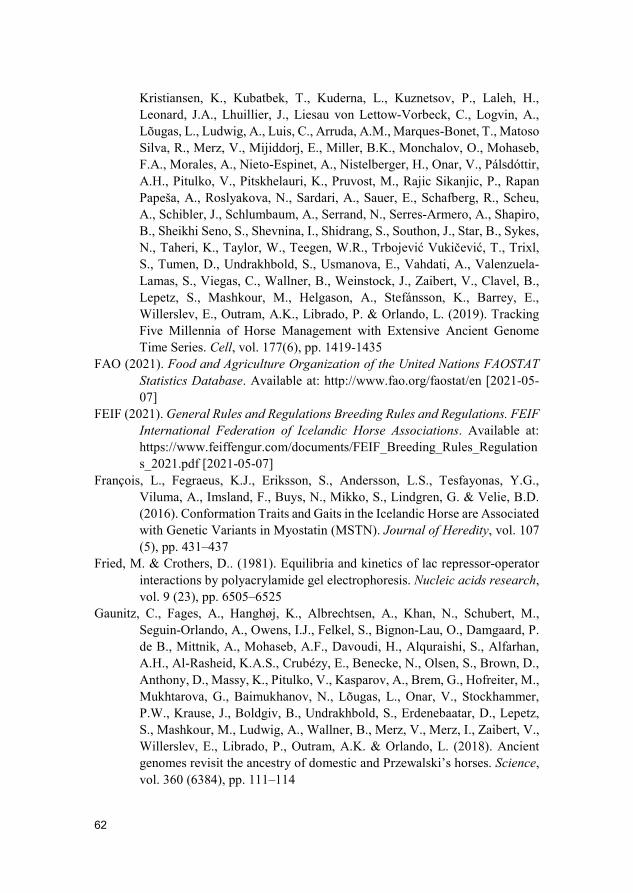
62
Kristiansen, K., Kubatbek, T., Kuderna, L., Kuznetsov, P., Laleh, H., Leonard, J.A., Lhuillier, J., Liesau von Lettow-Vorbeck, C., Logvin, A., Lõugas, L., Ludwig, A., Luis, C., Arruda, A.M., Marques-Bonet, T., Matoso Silva, R., Merz, V., Mijiddorj, E., Miller, B.K., Monchalov, O., Mohaseb, F.A., Morales, A., Nieto-Espinet, A., Nistelberger, H., Onar, V., Pálsdóttir, A.H., Pitulko, V., Pitskhelauri, K., Pruvost, M., Rajic Sikanjic, P., Rapan Papeša, A., Roslyakova, N., Sardari, A., Sauer, E., Schafberg, R., Scheu, A., Schibler, J., Schlumbaum, A., Serrand, N., Serres-Armero, A., Shapiro, B., Sheikhi Seno, S., Shevnina, I., Shidrang, S., Southon, J., Star, B., Sykes, N., Taheri, K., Taylor, W., Teegen, W.R., Trbojević Vukičević, T., Trixl, S., Tumen, D., Undrakhbold, S., Usmanova, E., Vahdati, A., Valenzuela-Lamas, S., Viegas, C., Wallner, B., Weinstock, J., Zaibert, V., Clavel, B., Lepetz, S., Mashkour, M., Helgason, A., Stefánsson, K., Barrey, E., Willerslev, E., Outram, A.K., Librado, P. & Orlando, L. (2019). Tracking Five Millennia of Horse Management with Extensive Ancient Genome Time Series. Cell, vol. 177(6), pp. 1419-1435
FAO (2021). Food and Agriculture Organization of the United Nations FAOSTAT Statistics Database. Available at: http://www.fao.org/faostat/en [2021-05-07]
FEIF (2021). General Rules and Regulations Breeding Rules and Regulations. FEIF International Federation of Icelandic Horse Associations. Available at: https://www.feiffengur.com/documents/FEIF_Breeding_Rules_Regulations_2021.pdf [2021-05-07]
François, L., Fegraeus, K.J., Eriksson, S., Andersson, L.S., Tesfayonas, Y.G., Viluma, A., Imsland, F., Buys, N., Mikko, S., Lindgren, G. & Velie, B.D. (2016). Conformation Traits and Gaits in the Icelandic Horse are Associated with Genetic Variants in Myostatin (MSTN). Journal of Heredity, vol. 107 (5), pp. 431–437
Fried, M. & Crothers, D.. (1981). Equilibria and kinetics of lac repressor-operator interactions by polyacrylamide gel electrophoresis. Nucleic acids research, vol. 9 (23), pp. 6505–6525
Gaunitz, C., Fages, A., Hanghøj, K., Albrechtsen, A., Khan, N., Schubert, M., Seguin-Orlando, A., Owens, I.J., Felkel, S., Bignon-Lau, O., Damgaard, P. de B., Mittnik, A., Mohaseb, A.F., Davoudi, H., Alquraishi, S., Alfarhan, A.H., Al-Rasheid, K.A.S., Crubézy, E., Benecke, N., Olsen, S., Brown, D., Anthony, D., Massy, K., Pitulko, V., Kasparov, A., Brem, G., Hofreiter, M., Mukhtarova, G., Baimukhanov, N., Lõugas, L., Onar, V., Stockhammer, P.W., Krause, J., Boldgiv, B., Undrakhbold, S., Erdenebaatar, D., Lepetz, S., Mashkour, M., Ludwig, A., Wallner, B., Merz, V., Merz, I., Zaibert, V., Willerslev, E., Librado, P., Outram, A.K. & Orlando, L. (2018). Ancient genomes revisit the ancestry of domestic and Przewalski’s horses. Science, vol. 360 (6384), pp. 111–114
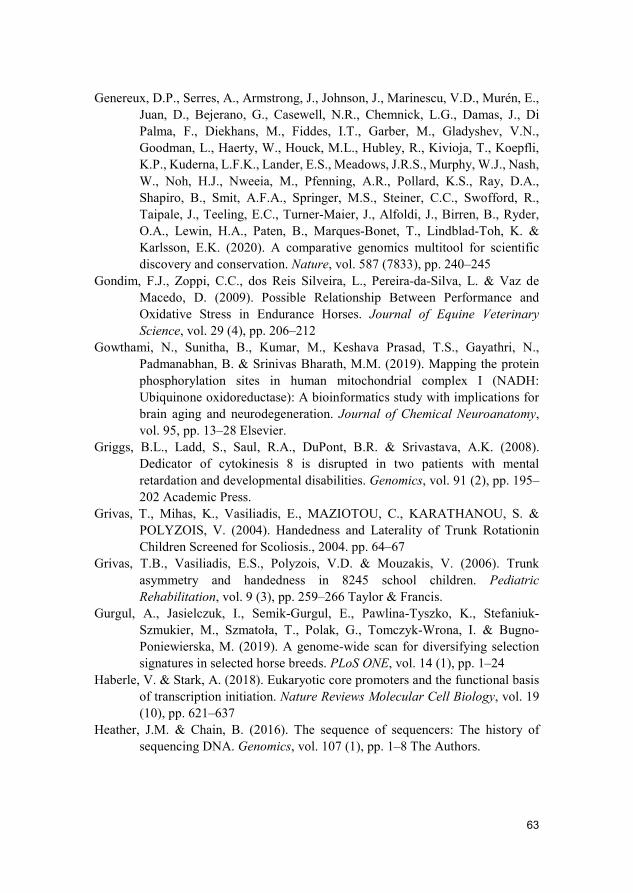
63
Genereux, D.P., Serres, A., Armstrong, J., Johnson, J., Marinescu, V.D., Murén, E., Juan, D., Bejerano, G., Casewell, N.R., Chemnick, L.G., Damas, J., Di Palma, F., Diekhans, M., Fiddes, I.T., Garber, M., Gladyshev, V.N., Goodman, L., Haerty, W., Houck, M.L., Hubley, R., Kivioja, T., Koepfli, K.P., Kuderna, L.F.K., Lander, E.S., Meadows, J.R.S., Murphy, W.J., Nash,W., Noh, H.J., Nweeia, M., Pfenning, A.R., Pollard, K.S., Ray, D.A.,Shapiro, B., Smit, A.F.A., Springer, M.S., Steiner, C.C., Swofford, R.,Taipale, J., Teeling, E.C., Turner-Maier, J., Alfoldi, J., Birren, B., Ryder,O.A., Lewin, H.A., Paten, B., Marques-Bonet, T., Lindblad-Toh, K. &Karlsson, E.K. (2020). A comparative genomics multitool for scientificdiscovery and conservation. Nature, vol. 587 (7833), pp. 240–245
Gondim, F.J., Zoppi, C.C., dos Reis Silveira, L., Pereira-da-Silva, L. & Vaz de Macedo, D. (2009). Possible Relationship Between Performance and Oxidative Stress in Endurance Horses. Journal of Equine Veterinary Science, vol. 29 (4), pp. 206–212
Gowthami, N., Sunitha, B., Kumar, M., Keshava Prasad, T.S., Gayathri, N., Padmanabhan, B. & Srinivas Bharath, M.M. (2019). Mapping the protein phosphorylation sites in human mitochondrial complex I (NADH: Ubiquinone oxidoreductase): A bioinformatics study with implications for brain aging and neurodegeneration. Journal of Chemical Neuroanatomy, vol. 95, pp. 13–28 Elsevier.
Griggs, B.L., Ladd, S., Saul, R.A., DuPont, B.R. & Srivastava, A.K. (2008). Dedicator of cytokinesis 8 is disrupted in two patients with mental retardation and developmental disabilities. Genomics, vol. 91 (2), pp. 195–202 Academic Press.
Grivas, T., Mihas, K., Vasiliadis, E., MAZIOTOU, C., KARATHANOU, S. & POLYZOIS, V. (2004). Handedness and Laterality of Trunk Rotationin Children Screened for Scoliosis., 2004. pp. 64–67
Grivas, T.B., Vasiliadis, E.S., Polyzois, V.D. & Mouzakis, V. (2006). Trunk asymmetry and handedness in 8245 school children. Pediatric Rehabilitation, vol. 9 (3), pp. 259–266 Taylor & Francis.
Gurgul, A., Jasielczuk, I., Semik-Gurgul, E., Pawlina-Tyszko, K., Stefaniuk-Szmukier, M., Szmatoła, T., Polak, G., Tomczyk-Wrona, I. & Bugno-Poniewierska, M. (2019). A genome-wide scan for diversifying selection signatures in selected horse breeds. PLoS ONE, vol. 14 (1), pp. 1–24
Haberle, V. & Stark, A. (2018). Eukaryotic core promoters and the functional basis of transcription initiation. Nature Reviews Molecular Cell Biology, vol. 19 (10), pp. 621–637
Heather, J.M. & Chain, B. (2016). The sequence of sequencers: The history of sequencing DNA. Genomics, vol. 107 (1), pp. 1–8 The Authors.
64
Hellman, L.M. & Fried, M.G. (2007). Electrophoretic mobility shift assay (EMSA) for detecting protein-nucleic acid interactions. Nature Protocols, vol. 2 (8), pp. 1849–1861 Nature Publishing Group.
Hill, E.W., Gu, J., Eivers, S.S., Fonseca, R.G., McGivney, B.A., Govindarajan, P., Orr, N., Katz, L.M. & MacHugh, D. (2010). A sequence polymorphism in MSTN predicts sprinting ability and racing stamina in thoroughbred horses. PLoS ONE, vol. 5 (1), pp. 2–7
Holbrook, T.C., McFarlane, D. & Schott II, H.C. (2010). Neuroendocrine and non-neuroendocrine markers of inflammation associated with performance in endurance horses. Equine Veterinary Journal, vol. 42, pp. 123–128
Holmström, M. & Back, W. (2013). The effects of conformation. Equine Locomotion. London: WB Saunders, 2nd. ed, pp. 229–243.
Howard, J.T., Pryce, J.E., Baes, C. & Maltecca, C. (2017). Invited review: Inbreeding in the genomics era: Inbreeding, inbreeding depression, and management of genomic variability. Journal of Dairy Science, vol. 100 (8), pp. 6009–6024 American Dairy Science Association.
Hoyt, D.F., Wickler, S.J. & Cogger, E.A. (2000). Time of contact and step length: the effect of limb length, running speed, load carrying and incline. Journal of Experimental Biology, vol. 203 (2), pp. 221–227
Hyland, A. (2003). The Horse in the Ancient World. Gloucestershire: Sutton Publishing.
IFHA (2018). International Federation of Horseracing Authorities. Available at: https://www.ifhaonline.org/resources/Annual_Report_2018.pdf [2021-05-07]
Jäderkvist Fegraeus, K., Johansson, L., Maenpaa, M., Mykkanen, A., Andersson, L.S., Velie, B.D., Andersson, L., Arnason, T. & Lindgren, G. (2015). Different DMRT3 genotypes are best adapted for harness racing and riding in finnhorses. Journal of Heredity, vol. 106 (6), pp. 734–740
Jäderkvist Fegraeus, K., Velie, B.D., Axelsson, J., Ang, R., Hamilton, N.A., Andersson, L., Meadows, J.R.S. & Lindgren, G. (2018). A potential regulatory region near the EDN3 gene may control both harness racing performance and coat color variation in horses. Physiological Reports, vol. 6 (10)
Jäderkvist, K., Andersson, L.S., Johansson, A.M., Árnason, T., Mikko, S., Eriksson, S., Andersson, L. & Lindgren, G. (2014). The DMRT3 ‘ Gait keeper ’ mutation affects performance of Nordic and Standardbred trotters. Journal of Animal Science, vol. 92 (10), pp. 4279–4286
Jäderkvist, K., Holm, N., Imsland, F., Árnason, T., Andersson, L., Andersson, L.S. & Lindgren, G. (2015). The importance of the DMRT3 “Gait keeper” mutation on riding traits and gaits in Standardbred and Icelandic horses. Livestock Science, vol. 176, pp. 33–39 Elsevier.
65
Jalali Sefid Dashti, M. & Gamieldien, J. (2017). A practical guide to filtering and prioritizing genetic variants. BioTechniques, vol. 62 (January), pp. 18–30
Janczarek, I., Wilk, I. & Strzelec, K. (2017). Correlations between body dimensions of young trotters and motion parameters and racing performance. Pferdeheilkunde, vol. 33 (2), pp. 139–145
Jeffcott, L.B. (1980). Disorders of the thoracolumbar spine of the horse — a survey of 443 cases. Equine Veterinary Journal, vol. 12 (4), pp. 197–210 American Medical Association (AMA).
Jiang, F. & Doudna, J.A. (2017). CRISPR – Cas9 Structures and Mechanisms. Annual review of biophysics, vol. 46, pp. 505–531
Jönsson, L., Egenvall, A., Roepstorff, L., Näsholm, A., Dalin, G. & Philipsson, J. (2014a). Associations of health status and conformation with longevity and lifetime competition performance in young Swedish Warmblood riding horses: 8,238 cases (1983-2005). Journal of the American Veterinary Medical Association, vol. 244 (12), pp. 1449–1461 American Veterinary Medical Association.
Jönsson, L., Näsholm, A., Roepstorff, L., Egenvall, A., Dalin, G. & Philipsson, J. (2014b). Conformation traits and their genetic and phenotypic associations with health status in young Swedish warmblood riding horses. Livestock Science, vol. 163 (1), pp. 12–25 Elsevier.
Jordbruksverket Bevara, nyttja och utveckla – handlingsplan för uthållig förvaltning av svenska husdjursraser 2010–2020. Available at: http://www2.jordbruksverket.se/webdav/files/SJV/trycksaker/Pdf_rapporter/ra10_14.pdf
Kalbfleisch, T.S., Rice, E.S., DePriest, M.S., Walenz, B.P., Hestand, M.S., Vermeesch, J.R., O′Connell, B.L., Fiddes, I.T., Vershinina, A.O., Saremi, N.F., Petersen, J.L., Finno, C.J., Bellone, R.R., McCue, M.E., Brooks, S.A.,Bailey, E., Orlando, L., Green, R.E., Miller, D.C., Antczak, D.F. &MacLeod, J.N. (2018). Improved reference genome for the domestic horseincreases assembly contiguity and composition. Communications Biology,vol. 1 (197), pp. 1–8
Kawaguchi, H., Sawa, H. & Yasuda, H. (1990). Endothelin stimulates angiotensin I to angiotensin II conversion in cultured pulmonary artery endothelial cells. J Mol Cell Cardiol, vol. 22, pp. 839–842
Kawaguchi, H., Sawa, H. & Yasuda, H. (1991). Effect of endothelin on angiotensin converting enzyme activity in cultured pulmonary artery endothelial cells. J Hypertens, vol. 9 (2), pp. 171–174
Kim, D.S., Wheeler, M.T. & Ashley, E.A. (2021). The genetics of human performance. Nature Reviews Genetics, vol. 23 (January) Springer US.
Kim, J.I., Yoo, J.H., Kim, D., Jeong, B. & Kim, B.N. (2018). The effects of GRIN2B and DRD4 gene variants on local functional connectivity in attention-
66
deficit/hyperactivity disorder. Brain Imaging and Behavior, vol. 12 (1), pp. 247–257 Brain Imaging and Behavior.
Kingsley, N.B., Hamilton, N.A., Lindgren, G., Orlando, L., Bailey, E., Brooks, S., McCue, M., Kalbfleisch, T.S., MacLeod, J.N., Petersen, J.L., Finno, C.J. & Bellone, R.R. (2021). “Adopt-a-Tissue” Initiative Advances Efforts to Identify Tissue-Specific Histone Marks in the Mare. Frontiers in Genetics, vol. 12 (March), pp. 1–9
Kingsley, N.B., Kern, C., Creppe, C., Hales, E.N., Zhou, H., Kalbfleisch, T.S., Macleod, J.N., Petersen, J.L., Finno, C.J. & Bellone, R.R. (2020). Functionally annotating regulatory elements in the equine genome using histone mark chip-seq. Genes, vol. 11 (1)
Klemetsdal, G. (1998). Inbreeding on Racing Performance. Genetics Selection Evolution, vol. 30, pp. 351–366
Kostrzewa-Nowak, D., Kubaszewska, J., Nowakowska, A. & Nowak, R. (2020). Effect of Aerobic and Anaerobic Exercise on the Complement System of Proteins in Healthy Young Males. Journal of clinical medicine, vol. 9 (2357)
Kristjansson, T., Bjornsdottir, S., Albertsdóttir, E., Sigurdsson, A., Pourcelot, P., Crevier-Denoix, N. & Arnason, T. (2016). Association of conformation and riding ability in Icelandic horses. Livestock Science, vol. 189 (July 2016), pp. 91–101
Kristjánsson, Þ. (2014). Riding Ability in Icelandic Horses – Effect of Conformation and the ‘Gait Keeper’ – Mutation in the DMRT3 Gene.
Krivega, I. & Dean, A. (2012). Enhancer and promoter interactions — long distance calls. Curr Opin Genet Dev, vol. 22 (2), pp. 79–85
Librado, P., Fages, A., Gaunitz, C., Leonardi, M., Wagner, S., Khan, N., Hanghøj, K., Alquraishi, S.A., Alfarhan, A.H., Al-Rasheid, K.A., Der Sarkissian, C., Schubert, M. & Orlando, L. (2016). The evolutionary origin and genetic makeup of domestic horses. Genetics. Genetics Society of America. DOI: https://doi.org/10.1534/genetics.116.194860
Librado, P., Khan, N., Fages, A., Kusliy, M.A., Suchan, T., Tonasso-Calvière, L., Schiavinato, S., Alioglu, D., Fromentier, A., Perdereau, A., Aury, J.M., Gaunitz, C., Chauvey, L., Seguin-Orlando, A., Der Sarkissian, C., Southon, J., Shapiro, B., Tishkin, A.A., Kovalev, A.A., Alquraishi, S., Alfarhan, A.H., Al-Rasheid, K.A.S., Seregély, T., Klassen, L., Iversen, R., Bignon-Lau, O., Bodu, P., Olive, M., Castel, J.C., Boudadi-Maligne, M., Alvarez,N., Germonpré, M., Moskal-Del Hoyo, M., Wilczyński, J., Pospuła, S.,Lasota-Kuś, A., Tunia, K., Nowak, M., Rannamäe, E., Saarma, U.,Boeskorov, G., Lōugas, L., Kyselý, R., Peške, L., Bălășescu, A.,Dumitrașcu, V., Dobrescu, R., Gerber, D., Kiss, V., Szécsényi-Nagy, A.,Mende, B.G., Gallina, Z., Somogyi, K., Kulcsár, G., Gál, E., Bendrey, R.,Allentoft, ME., Sirbu, G., Dergachev, V., Shephard, H., Tomadini, N.,
67
Grouard, S., Kasparov, A., Basilyan, A.E., Anisimov, M.A., Nikolskiy, P.A., Pavlova, E.Y., Pitulko, V., Brem, G., Wallner, B., Schwall, C., Keller, M., Kitagawa, K., Bessudnov, A.N., Bessudnov, A., Taylor, W., Magail, J., Gantulga, J.O., Bayarsaikhan, J., Erdenebaatar, D., Tabaldiev, K., Mijiddorj, E., Boldgiv, B., Tsagaan, T., Pruvost, M,. Olsen, S., Makarewicz, C.A., , Lamas, S., Albizuri Canadell, S., Nieto Espinet, A., Iborra, M.P., Lira Garrido, J., Rodríguez González, E., Celestino, S., Olària, C., Arsuaga, J.L., Kotova, N., Pryor, A., Crabtree, P., Zhumatayev, R., Toleubaev, A., Morgunova, N.L., Kuznetsova, T., Lordkipanize, D., Marzullo, M., Prato, O., Bagnasco Gianni, G., Tecchiati, U., Clavel, B., Lepetz, S., Davoudi, H., Mashkour, M., Berezina, N.Y., Stockhammer, P.W., Krause, J., Haak, W., Morales-Muñiz, A., Benecke, N., Hofreiter, M., Ludwig, A., Graphodatsky, A.S., Peters, J., Kiryushin, K.Y., Iderkhangai, T.O., Bokovenko, N.A., Vasiliev, S.K., Seregin, N.N., Chugunov, K.V, Plasteeva, N.A., Baryshnikov, G.F., Petrova, E., Sablin, M., Ananyevskaya, E., Logvin, A., Shevnina, I., Logvin, V., Kalieva, S., Loman, V., Kukushkin, I., Merz, I., Merz, V., Sakenov, S., Varfolomeyev, V., Usmanova, E., Zaibert, V., Arbuckle, B., Belinskiy, A.B., Kalmykov, A., Reinhold, S., Hansen, S., Yudin, A.I., Vybornov, A.A., Epimakhov, A., Berezina, N.S., Roslyakova, N., Kosintsev, P.A., Kuznetsov, P.F., Anthony, D., Kroonen, G.J., Kristiansen, K., Wincker, P., Outram, A & Orlando, L. (2021). The origins and spread of domestic horses from the Western Eurasian steppes. Nature, vol. 598, pp. 634–640
Lieberman-Aiden, E., Berkum, N.L. Van, Williams, L., Ragoczy, T., Telling, A., Amit, I., Lajoie, B.R., Peter, J., Dorschner, M.O., Sandstrom, R., Bernstein, B., Groudine, M., Gnirke, A., Stamatoyannopoulos, J. & Leonid, A. (2009). Comprehensive mapping of long range interactions reveals folding principles of the human genome. Science, vol. 326 (October 9), pp. 289–293
Lindåse, S., Nostell, K., Söder, J. & Bröjer, J. (2017). Relationship Between β-cell Response and Insulin Sensitivity in Horses based on the Oral Sugar Test and the Euglycemic Hyperinsulinemic Clamp. Journal of Veterinary Internal Medicine, vol. 31 (5), pp. 1541–1550
Lindgren, G., Backström, N., Swinburne, J., Hellborg, L., Einarsson, A., Sandberg, K., Cothran, G., Vilà, C., Binns, M. & Ellegren, H. (2004). Limited number of patrilines in horse domestication. Nature Genetics, vol. 36 (4), pp. 335–336
Liu, J., Zhou, Y., Liu, S., Song, X., Yang, X.Z., Fan, Y., Chen, W., Akdemir, Z.C., Yan, Z., Zuo, Y., Du, R., Liu, Z., Yuan, B., Zhao, S., Liu, G., Chen, Y., Zhao, Y., Lin, M., Zhu, Q., Niu, Y., Liu, P., Ikegawa, S., Song, Y.Q., Posey, J.E., Qiu, G., Zhang, F., Wu, Z., Lupski, J.R. & Wu, N. (2018). The coexistence of copy number variations (CNVs) and single nucleotide
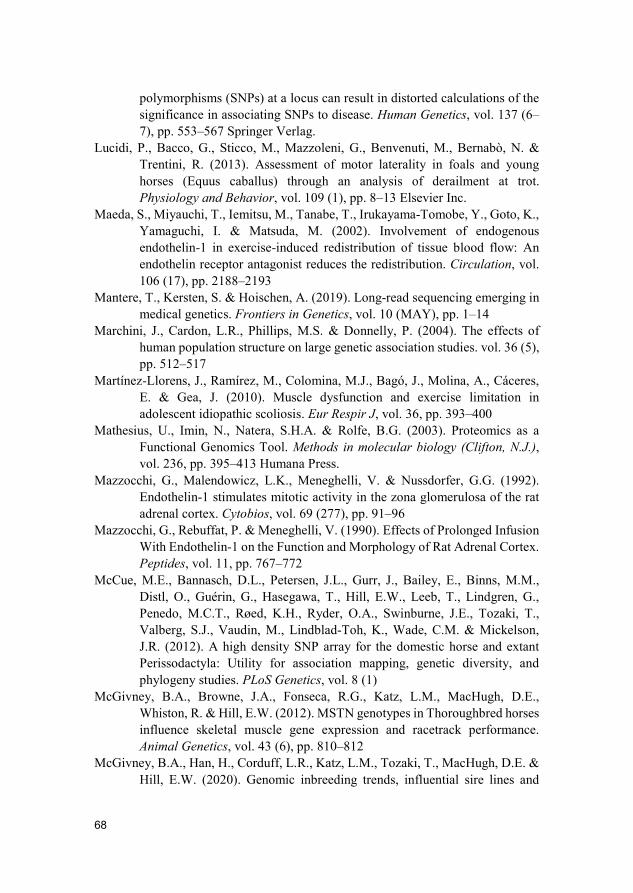
68
polymorphisms (SNPs) at a locus can result in distorted calculations of the significance in associating SNPs to disease. Human Genetics, vol. 137 (6–7), pp. 553–567 Springer Verlag.
Lucidi, P., Bacco, G., Sticco, M., Mazzoleni, G., Benvenuti, M., Bernabò, N. & Trentini, R. (2013). Assessment of motor laterality in foals and young horses (Equus caballus) through an analysis of derailment at trot. Physiology and Behavior, vol. 109 (1), pp. 8–13 Elsevier Inc.
Maeda, S., Miyauchi, T., Iemitsu, M., Tanabe, T., Irukayama-Tomobe, Y., Goto, K., Yamaguchi, I. & Matsuda, M. (2002). Involvement of endogenous endothelin-1 in exercise-induced redistribution of tissue blood flow: An endothelin receptor antagonist reduces the redistribution. Circulation, vol. 106 (17), pp. 2188–2193
Mantere, T., Kersten, S. & Hoischen, A. (2019). Long-read sequencing emerging in medical genetics. Frontiers in Genetics, vol. 10 (MAY), pp. 1–14
Marchini, J., Cardon, L.R., Phillips, M.S. & Donnelly, P. (2004). The effects of human population structure on large genetic association studies. vol. 36 (5), pp. 512–517
Martínez-Llorens, J., Ramírez, M., Colomina, M.J., Bagó, J., Molina, A., Cáceres, E. & Gea, J. (2010). Muscle dysfunction and exercise limitation inadolescent idiopathic scoliosis. Eur Respir J, vol. 36, pp. 393–400
Mathesius, U., Imin, N., Natera, S.H.A. & Rolfe, B.G. (2003). Proteomics as a Functional Genomics Tool. Methods in molecular biology (Clifton, N.J.), vol. 236, pp. 395–413 Humana Press.
Mazzocchi, G., Malendowicz, L.K., Meneghelli, V. & Nussdorfer, G.G. (1992). Endothelin-1 stimulates mitotic activity in the zona glomerulosa of the rat adrenal cortex. Cytobios, vol. 69 (277), pp. 91–96
Mazzocchi, G., Rebuffat, P. & Meneghelli, V. (1990). Effects of Prolonged Infusion With Endothelin-1 on the Function and Morphology of Rat Adrenal Cortex. Peptides, vol. 11, pp. 767–772
McCue, M.E., Bannasch, D.L., Petersen, J.L., Gurr, J., Bailey, E., Binns, M.M., Distl, O., Guérin, G., Hasegawa, T., Hill, E.W., Leeb, T., Lindgren, G., Penedo, M.C.T., Røed, K.H., Ryder, O.A., Swinburne, J.E., Tozaki, T., Valberg, S.J., Vaudin, M., Lindblad-Toh, K., Wade, C.M. & Mickelson, J.R. (2012). A high density SNP array for the domestic horse and extant Perissodactyla: Utility for association mapping, genetic diversity, and phylogeny studies. PLoS Genetics, vol. 8 (1)
McGivney, B.A., Browne, J.A., Fonseca, R.G., Katz, L.M., MacHugh, D.E., Whiston, R. & Hill, E.W. (2012). MSTN genotypes in Thoroughbred horses influence skeletal muscle gene expression and racetrack performance. Animal Genetics, vol. 43 (6), pp. 810–812
McGivney, B.A., Han, H., Corduff, L.R., Katz, L.M., Tozaki, T., MacHugh, D.E. & Hill, E.W. (2020). Genomic inbreeding trends, influential sire lines and
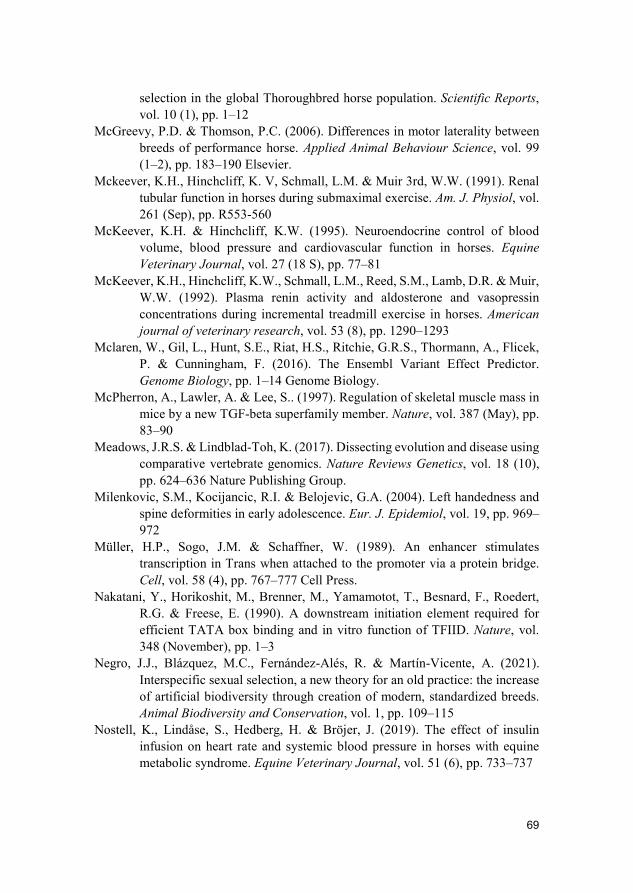
69
selection in the global Thoroughbred horse population. Scientific Reports, vol. 10 (1), pp. 1–12
McGreevy, P.D. & Thomson, P.C. (2006). Differences in motor laterality between breeds of performance horse. Applied Animal Behaviour Science, vol. 99 (1–2), pp. 183–190 Elsevier.
Mckeever, K.H., Hinchcliff, K. V, Schmall, L.M. & Muir 3rd, W.W. (1991). Renal tubular function in horses during submaximal exercise. Am. J. Physiol, vol. 261 (Sep), pp. R553-560
McKeever, K.H. & Hinchcliff, K.W. (1995). Neuroendocrine control of blood volume, blood pressure and cardiovascular function in horses. Equine Veterinary Journal, vol. 27 (18 S), pp. 77–81
McKeever, K.H., Hinchcliff, K.W., Schmall, L.M., Reed, S.M., Lamb, D.R. & Muir, W.W. (1992). Plasma renin activity and aldosterone and vasopressin concentrations during incremental treadmill exercise in horses. American journal of veterinary research, vol. 53 (8), pp. 1290–1293
Mclaren, W., Gil, L., Hunt, S.E., Riat, H.S., Ritchie, G.R.S., Thormann, A., Flicek, P. & Cunningham, F. (2016). The Ensembl Variant Effect Predictor. Genome Biology, pp. 1–14 Genome Biology.
McPherron, A., Lawler, A. & Lee, S.. (1997). Regulation of skeletal muscle mass in mice by a new TGF-beta superfamily member. Nature, vol. 387 (May), pp. 83–90
Meadows, J.R.S. & Lindblad-Toh, K. (2017). Dissecting evolution and disease using comparative vertebrate genomics. Nature Reviews Genetics, vol. 18 (10), pp. 624–636 Nature Publishing Group.
Milenkovic, S.M., Kocijancic, R.I. & Belojevic, G.A. (2004). Left handedness and spine deformities in early adolescence. Eur. J. Epidemiol, vol. 19, pp. 969–972
Müller, H.P., Sogo, J.M. & Schaffner, W. (1989). An enhancer stimulates transcription in Trans when attached to the promoter via a protein bridge. Cell, vol. 58 (4), pp. 767–777 Cell Press.
Nakatani, Y., Horikoshit, M., Brenner, M., Yamamotot, T., Besnard, F., Roedert, R.G. & Freese, E. (1990). A downstream initiation element required for efficient TATA box binding and in vitro function of TFIID. Nature, vol. 348 (November), pp. 1–3
Negro, J.J., Blázquez, M.C., Fernández-Alés, R. & Martín-Vicente, A. (2021). Interspecific sexual selection, a new theory for an old practice: the increase of artificial biodiversity through creation of modern, standardized breeds. Animal Biodiversity and Conservation, vol. 1, pp. 109–115
Nostell, K., Lindåse, S., Hedberg, H. & Bröjer, J. (2019). The effect of insulin infusion on heart rate and systemic blood pressure in horses with equine metabolic syndrome. Equine Veterinary Journal, vol. 51 (6), pp. 733–737
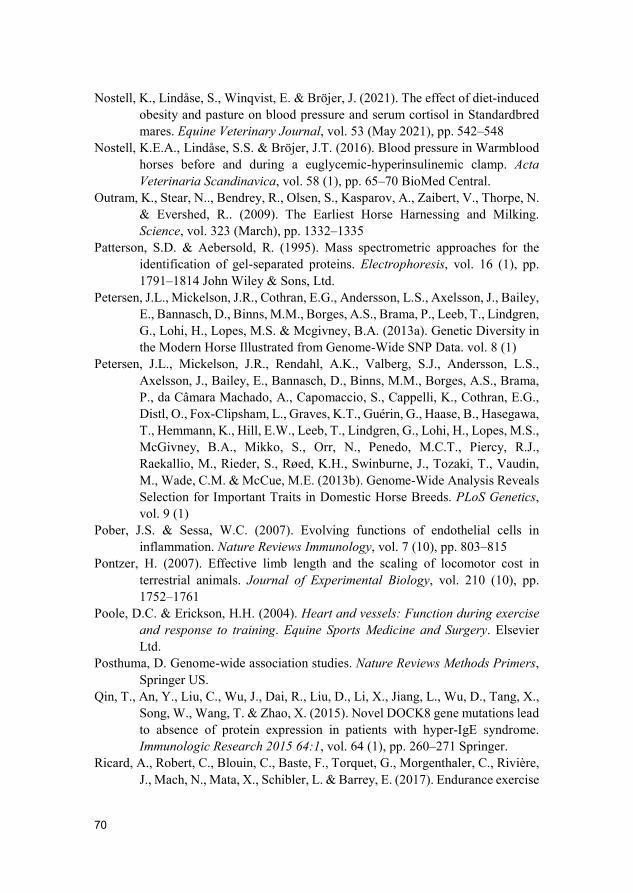
70
Nostell, K., Lindåse, S., Winqvist, E. & Bröjer, J. (2021). The effect of diet-induced obesity and pasture on blood pressure and serum cortisol in Standardbred mares. Equine Veterinary Journal, vol. 53 (May 2021), pp. 542–548
Nostell, K.E.A., Lindåse, S.S. & Bröjer, J.T. (2016). Blood pressure in Warmblood horses before and during a euglycemic-hyperinsulinemic clamp. Acta Veterinaria Scandinavica, vol. 58 (1), pp. 65–70 BioMed Central.
Outram, K., Stear, N.., Bendrey, R., Olsen, S., Kasparov, A., Zaibert, V., Thorpe, N. & Evershed, R.. (2009). The Earliest Horse Harnessing and Milking. Science, vol. 323 (March), pp. 1332–1335
Patterson, S.D. & Aebersold, R. (1995). Mass spectrometric approaches for the identification of gel-separated proteins. Electrophoresis, vol. 16 (1), pp. 1791–1814 John Wiley & Sons, Ltd.
Petersen, J.L., Mickelson, J.R., Cothran, E.G., Andersson, L.S., Axelsson, J., Bailey, E., Bannasch, D., Binns, M.M., Borges, A.S., Brama, P., Leeb, T., Lindgren, G., Lohi, H., Lopes, M.S. & Mcgivney, B.A. (2013a). Genetic Diversity in the Modern Horse Illustrated from Genome-Wide SNP Data. vol. 8 (1)
Petersen, J.L., Mickelson, J.R., Rendahl, A.K., Valberg, S.J., Andersson, L.S., Axelsson, J., Bailey, E., Bannasch, D., Binns, M.M., Borges, A.S., Brama, P., da Câmara Machado, A., Capomaccio, S., Cappelli, K., Cothran, E.G., Distl, O., Fox-Clipsham, L., Graves, K.T., Guérin, G., Haase, B., Hasegawa, T., Hemmann, K., Hill, E.W., Leeb, T., Lindgren, G., Lohi, H., Lopes, M.S., McGivney, B.A., Mikko, S., Orr, N., Penedo, M.C.T., Piercy, R.J., Raekallio, M., Rieder, S., Røed, K.H., Swinburne, J., Tozaki, T., Vaudin, M., Wade, C.M. & McCue, M.E. (2013b). Genome-Wide Analysis Reveals Selection for Important Traits in Domestic Horse Breeds. PLoS Genetics, vol. 9 (1)
Pober, J.S. & Sessa, W.C. (2007). Evolving functions of endothelial cells in inflammation. Nature Reviews Immunology, vol. 7 (10), pp. 803–815
Pontzer, H. (2007). Effective limb length and the scaling of locomotor cost in terrestrial animals. Journal of Experimental Biology, vol. 210 (10), pp. 1752–1761
Poole, D.C. & Erickson, H.H. (2004). Heart and vessels: Function during exercise and response to training. Equine Sports Medicine and Surgery. Elsevier Ltd.
Posthuma, D. Genome-wide association studies. Nature Reviews Methods Primers, Springer US.
Qin, T., An, Y., Liu, C., Wu, J., Dai, R., Liu, D., Li, X., Jiang, L., Wu, D., Tang, X., Song, W., Wang, T. & Zhao, X. (2015). Novel DOCK8 gene mutations lead to absence of protein expression in patients with hyper-IgE syndrome. Immunologic Research 2015 64:1, vol. 64 (1), pp. 260–271 Springer.
Ricard, A., Robert, C., Blouin, C., Baste, F., Torquet, G., Morgenthaler, C., Rivière, J., Mach, N., Mata, X., Schibler, L. & Barrey, E. (2017). Endurance exercise
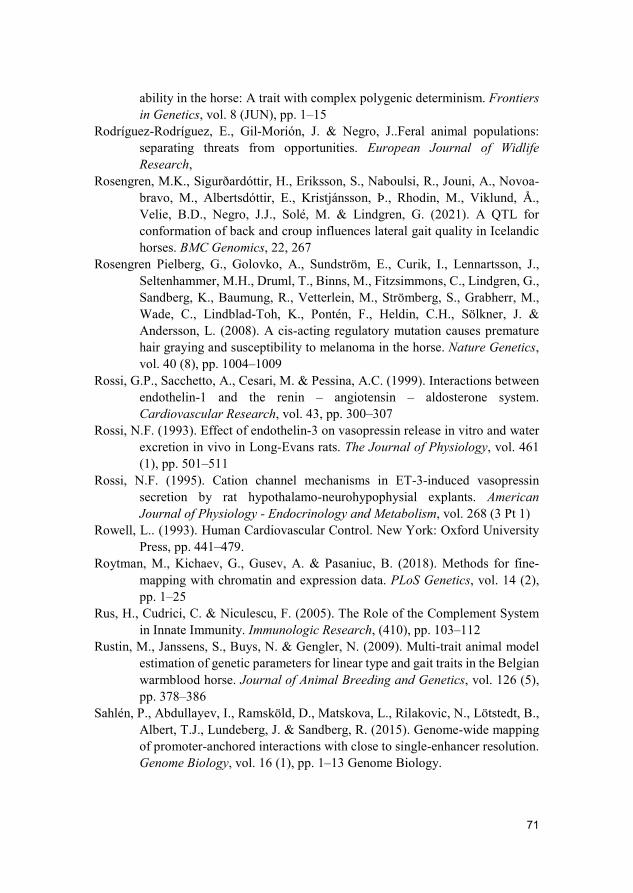
71
ability in the horse: A trait with complex polygenic determinism. Frontiers in Genetics, vol. 8 (JUN), pp. 1–15
Rodríguez-Rodríguez, E., Gil-Morión, J. & Negro, J..Feral animal populations: separating threats from opportunities. European Journal of Widlife Research,
Rosengren, M.K., Sigurðardóttir, H., Eriksson, S., Naboulsi, R., Jouni, A., Novoa-bravo, M., Albertsdóttir, E., Kristjánsson, Þ., Rhodin, M., Viklund, Å., Velie, B.D., Negro, J.J., Solé, M. & Lindgren, G. (2021). A QTL for conformation of back and croup influences lateral gait quality in Icelandic horses. BMC Genomics, 22, 267
Rosengren Pielberg, G., Golovko, A., Sundström, E., Curik, I., Lennartsson, J., Seltenhammer, M.H., Druml, T., Binns, M., Fitzsimmons, C., Lindgren, G., Sandberg, K., Baumung, R., Vetterlein, M., Strömberg, S., Grabherr, M., Wade, C., Lindblad-Toh, K., Pontén, F., Heldin, C.H., Sölkner, J. & Andersson, L. (2008). A cis-acting regulatory mutation causes premature hair graying and susceptibility to melanoma in the horse. Nature Genetics, vol. 40 (8), pp. 1004–1009
Rossi, G.P., Sacchetto, A., Cesari, M. & Pessina, A.C. (1999). Interactions between endothelin-1 and the renin – angiotensin – aldosterone system. Cardiovascular Research, vol. 43, pp. 300–307
Rossi, N.F. (1993). Effect of endothelin‐3 on vasopressin release in vitro and water excretion in vivo in Long‐Evans rats. The Journal of Physiology, vol. 461 (1), pp. 501–511
Rossi, N.F. (1995). Cation channel mechanisms in ET-3-induced vasopressin secretion by rat hypothalamo-neurohypophysial explants. American Journal of Physiology - Endocrinology and Metabolism, vol. 268 (3 Pt 1)
Rowell, L.. (1993). Human Cardiovascular Control. New York: Oxford University Press, pp. 441–479.
Roytman, M., Kichaev, G., Gusev, A. & Pasaniuc, B. (2018). Methods for fine-mapping with chromatin and expression data. PLoS Genetics, vol. 14 (2), pp. 1–25
Rus, H., Cudrici, C. & Niculescu, F. (2005). The Role of the Complement System in Innate Immunity. Immunologic Research, (410), pp. 103–112
Rustin, M., Janssens, S., Buys, N. & Gengler, N. (2009). Multi-trait animal model estimation of genetic parameters for linear type and gait traits in the Belgian warmblood horse. Journal of Animal Breeding and Genetics, vol. 126 (5), pp. 378–386
Sahlén, P., Abdullayev, I., Ramsköld, D., Matskova, L., Rilakovic, N., Lötstedt, B., Albert, T.J., Lundeberg, J. & Sandberg, R. (2015). Genome-wide mapping of promoter-anchored interactions with close to single-enhancer resolution. Genome Biology, vol. 16 (1), pp. 1–13 Genome Biology.
72
Sahlén, P., Spalinskas, R., Asad, S., Mahapatra, K. Das, Höjer, P., Anil, A., Eisfeldt, J., Srivastava, A., Nikamo, P., Mukherjee, A., Kim, K.H., Bergman, O., Ståhle, M., Sonkoly, E., Pivarcsi, A., Wahlgren, C.F., Nordenskjöld, M., Taylan, F., Bradley, M. & Tapia-Páez, I. (2021). Chromatin interactions in differentiating keratinocytes reveal novel atopic dermatitis– and psoriasis-associated genes. Journal of Allergy and Clinical Immunology, vol. 147 (5), pp. 1742–1752
Sakurai, T., Yanagisawa, M., Takuwat, Y., Miyazaki, H., Kimura, S., Goto, K. & Masaki, T. (1990). Cloning of a cDNA encoding a non-isopeptide-selective subtype of the endothelin receptor. Nature, vol. 348 (December), pp. 732–735
Samsonstuen, S., Dolvik, N.I., Olsen, H.F., Lykkjen, S. & Klemetsdal, G. (2020). Inbreeding affects racing performance negatively in the Standardbred trotter. Acta Agriculturae Scandinavica A: Animal Sciences, pp. 152–156 Taylor & Francis.
Sánchez-Guerrero, M.J., Cervantes, I., Molina, A., Gutiérrez, J.P. & Valera, M. (2017). Designing an early selection morphological linear traits index for dressage in the Pura Raza Español horse. Animal, vol. 11 (6), pp. 948–957
Sánchez-Guerrero, M.J., Molina, A., Gómez, M.D., Peña, F. & Valera, M. (2016). Relationship between morphology and performance: Signature of mass-selection in Pura Raza Español horse. Livestock Science, vol. 185, pp. 148–155 Elsevier.
Sanger, F., Nicklen, S. & Coulson, A.R. (1977). DNA sequencing with chain-terminating inhibitors. Proc Natl Acad Sci U S A, vol. 74 (12), pp. 5463–5467
Schaefer, R.J., Schubert, M., Bailey, E., Bannasch, D.L., Barrey, E., Bar-Gal, G.K., Brem, G., Brooks, S.A., Distl, O., Fries, R., Finno, C.J., Gerber, V., Haase, B., Jagannathan, V., Kalbfleisch, T., Leeb, T., Lindgren, G., Lopes, M.S., Mach, N., da Câmara Machado, A., MacLeod, J.N., McCoy, A., Metzger, J., Penedo, C., Polani, S., Rieder, S., Tammen, I., Tetens, J., Thaller, G., Verini-Supplizi, A., Wade, C.M., Wallner, B., Orlando, L., Mickelson, J.R. & McCue, M.E. (2017). Developing a 670k genotyping array to tag ~2M SNPs across 24 horse breeds. BMC Genomics, vol. 18 (1), pp. 1–18 BMC Genomics.
Scoppetta, F., Tartaglia, M., Renzone, G., Avellini, L., Gaiti, A., Scaloni, A. & Chiaradia, E. (2012). Plasma protein changes in horse after prolonged physical exercise: A proteomic study. Journal of Proteomics, vol. 75 (14), pp. 4494–4504 Elsevier B.V.
Shrestha, M., Eriksson, S., Schurink, A., Andersson, L.S., Sundquist, M., Frey, R., Broström, H., Bergström, T., Ducro, B. & Lindgren, G. (2015). Genome-Wide Association Study of Insect Bite Hypersensitivity in Swedish-Born Icelandic Horses. pp. 366–374
73
Shrestha, M., Solé, M., Ducro, B.J., Sundquist, M., Thomas, R., Schurink, A., Eriksson, S. & Lindgren, G. (2020). Genome-wide association study for insect bite hypersensitivity susceptibility in horses revealed novel associated loci on chromosome 1. Journal of Animal Breeding and Genetics, vol. 137 (2), pp. 223–233
Slijper, E.J. (1946). Comparative biologic-anatomical investigations on the vertebral column and spinal musculature of mammals. K. Ned. Acad. Wetensch.
Smale, S.T. (2010). Luciferase Assay. Cold Spring Harbor Protocols, Söder, J., Bröjer, J.T. & Nostell, K.E. (2012). Interday variation and effect of
transportation on indirect blood pressure measurements, plasma endothelin-1 and serum cortisol in Standardbred and Icelandic horses. Acta veterinaria Scandinavica, vol. 54, p. 37
Solé, M., Gómez, M.D., Galisteo, A.M., Santos, R. & Valera, M. (2013). Kinematic Characterization of the Menorca Horse at the Walk and the Trot: Influence of Hind Limb Pastern Angle. Journal of Equine Veterinary Science, vol. 33 (9), pp. 726–732 Elsevier Inc.
Sparrow, L.M., Pellatt, E., Yu, S.S., Raichlen, D.A., Pontzer, H. & Rolian, C. (2017). Gait changes in a line of mice artificially selected for longer limbs. PeerJ, vol. 2017 (2), p. e3008 PeerJ Inc.
Sung, C., Arleth, A., Storer, B. & Ohlstein, E. (1994). Angiotensin type 1 receptors mediate smooth muscle proliferation and endothelin biosynthesis in rat vascular smooth muscle. Pharmacol Exp Ther., vol. 1 (Oct 271), pp. 429–437
Suri, P., Palmer, M.R., Tsepilov, Y.A., Freidin, M.B., Boer, C.G., Yau, M.S., Evans, D.S. & Gelemanovic, A. (2018). Genome-wide meta-analysis of 158,000individuals of European ancestry identifies three loci associated withchronic back pain. PLOS ONE, vol. 48 (7), pp. 1–23
Svensk Travsport (2019). ÅRSSTATISTIK 2019. Available at: https://www.travsport.se/siteassets/relaterade-dokument/tavling/statistik/arsstatistik-2019.pdf?823
Svensk Travsport (2020). Kallblodsaveln travar på 2020. Available at: https://www.travsport.se/arkiv/nyheter/2020/december/kallblodsaveln-travar-pa-2020/ [2021-10-20]
Svensk Travsport (2021a). Avelsvärdering av kallblodiga hingstar. Available at: https://www.travsport.se/avel-och-uppfodning/avelshingstar/avelsvardering-av-kallblod/ [2021-05-07]
Svensk Travsport (2021b). Hästarna. Available at: https://www.travsport.se/svensk-travsport/travsporten-i-sverige/hastarna/ [2021-08-23]
Tassano, E., Accogli, A., Pavanello, M., Bruno, C., Capra, V., Gimelli, G. & Cuoco, C. (2016). Interstitial 9p24.3 deletion involving only DOCK8 and KANK1
74
genes in two patients with non-overlapping phenotypic traits. European Journal of Medical Genetics, vol. 59 (1), pp. 20–25 Elsevier Masson.
Todd, E.T., Ho, S.Y.W., Thomson, P.C., Ang, R.A., Velie, B.D. & Hamilton, N.A. (2018). Founder-specific inbreeding depression affects racing performance in Thoroughbred horses. Scientific Reports, vol. 8 (1), pp. 1–10
Tozaki, T., Sato, F., Hill, E.W., Miyake, T., Endo, Y., Kakoi, H., Gawahara, H., Hirota, K. ichi, Nakano, Y., Nambo, Y. & Kurosawa, M. (2011). Sequence variants at the myostatin gene locus influence the body composition ofthoroughbred horses. Journal of Veterinary Medical Science, vol. 73 (12), pp. 1617–1624
Tyers, M. & Mann, M. (2003). From genomics to proteomics. Nature, vol. 422 (March), pp. 193–197
Uhlin, H.-E. (2007). Vår kallblodstravare. Ulleriks Hb. van der Valk, R.A., Vreede, J.A., Crémazy, F. & Dame, R.T. (2015). Genomic
Looping: A Key Principle of Chromatin Organization. J Mol Microbiol Biotechnol, pp. 344–359
Velie, B.D., Fegraeus, K.J., Solé, M., Rosengren, M.K., Røed, K.H., Ihler, C.-F., Strand, E. & Lindgren, G. (2018). A genome-wide association study for harness racing success in the Norwegian-Swedish coldblooded trotter reveals genes for learning and energy metabolism. BMC Genetics, vol. 19 (1)
Velie, B.D., Lillie, M., Fegraeus, K.J., Rosengren, M.K., Solé, M., Wiklund, M., Ihler, C.-F., Strand, E. & Lindgren, G. (2019a). Exploring the genetics of trotting racing ability in horses using a unique Nordic horse model. BMC Genomics, vol. 20 (1)
Velie, B.D., Shrestha, M., Franҫois, L., Schurink, A., Tesfayonas, Y.G., Stinckens, A., Blott, S., Ducro, B.J., Mikko, S., Thomas, R., Swinburne, J.E., Sundqvist, M., Eriksson, S., Buys, N. & Lindgren, G. (2016). Using an Inbred Horse Breed in a High Density Genome-Wide Scan for Genetic Risk Factors of Insect Bite Hypersensitivity (IBH). (Barendse, W., ed.) PLOS ONE, vol. 11 (4), p. e0152966 Public Library of Science.
Velie, B.D., Solé, M., Fegraeus, K.J., Rosengren, M.K., Røed, K.H., Ihler, C.-F., Strand, E. & Lindgren, G. (2019b). Genomic measures of inbreeding in the Norwegian-Swedish Coldblooded Trotter and their associations with known QTL for reproduction and health traits. Genetics Selection Evolution, vol. 51 (1)
Viklund, Å., Näsholm, A., Strandberg, E. & Philipsson, J. (2011). Genetic trends for performance of Swedish Warmblood horses. Livestock Science, vol. 141 (2–3), pp. 113–122 Elsevier B.V.
Wade, C. & Freund, B. (1990). Hormonal control of blood volume during and following exercise. In: Gisolfi, C. V & Lamb, D.R. (eds.) Fluid Homeostasis
75
During Exercise (Perspectives in Exercise Science & Sports Medicine, Vol. 3). Camel, Indiana: Benchmark Press, pp. 207–241.
Wade, C.M., Giulotto, E., Sigurdsson, S., Zoli, M., Gnerre, S., Imsland, F., Lear, T.L., Adelson, D.L., Bailey, E., Bellone, R.R., Blöcker, H., Distl, O., Edgar,R.C., Garber, M., Leeb, T., Mauceli, E., MacLeod, J.N., Penedo, M.C.T.,Raison, J.M., Sharpe, T., Vogel, J., Andersson, L., Antczak, D.F., Biagi, T.,Binns, M.M., Chowdhary, B.P., Coleman, S.J., Della Valle, G., Fryc, S.,Guérin, G., Hasegawa, T., Hill, E.W., Jurka, J., Kiialainen, A., Lindgren,G., Liu, J., Magnani, E., Mickelson, J.R., Murray, J., Nergadze, S.G.,Onofrio, R., Pedroni, S., Piras, M.F., Raudsepp, T., Rocchi, M., Røed, K.H.,Ryder, O.A., Searle, S., Skow, L., Swinburne, J.E., Syvänen, A.C., Tozaki,T., Valberg, S.J., Vaudin, M., White, J.R., Zody, M.C., Lander, E.S. &Lindblad-Toh, K. (2009). Genome sequence, comparative analysis, andpopulation genetics of the domestic horse. Science, vol. 326 (5954), pp.865–867
Wallner, B., Vogl, C., Shukla, P., Burgstaller, J.P., Druml, T. & Brem, G. (2013). Identification of Genetic Variation on the Horse Y Chromosome and the Tracing of Male Founder Lineages in Modern Breeds. vol. 8 (4)
Wang, K., Li, M. & Hakonarson, H. (2010). ANNOVAR : functional annotation of genetic variants from high-throughput sequencing data. Nucleic Acids Research, vol. 38 (16), pp. 1–7
Weatherby, J. (1791). An Introduction to a General Stud-Book. London. Weirather, J., de Cesare, M., Wang, Y., Piazza, P., Sebastiano, V., Wang, X., Buck,
D. & Au, K. (2017). Comprehensive comparison of Pacific Biosciences andOxford Nanopore Technologies and their applications to transcriptomeanalysis [ version 2 ; referees : 2 approved ] Jason L Weirather RefereeStatus : F1000Research, vol. 6
Weitzberg, E., Hemsen, A., Lundberg, J.M. & Ahlborg, G. (1995). ET-3 is extracted by and induces potent vasoconstriction in human splanchnic and renal vasculatures. Journal of Applied Physiology, vol. 79 (4), pp. 1255–1259
WHO (2021). Hypertension. Available at: https://www.who.int/news-room/fact-sheets/detail/hypertension [2021-10-23]
Wold, M.S., Rich, A., Weeks, D. & Lutter, L.C. (2014). Deoxyribonucleic acid (DNA). Access Science, McGraw-Hill Education.
Wong, D., Miles, K. & Sponseller, B. (2006). CONGENITAL SCOLIOSIS IN A QUARTER HORSE FILLY. Veterinary Radiology & Ultrasound, vol. 47 (3), pp. 279–282 John Wiley & Sons, Ltd.
WorldFengur The Studbook of Origin for the Icelandic horse. Available at: https://www.worldfengur.com/ [2021-05-07]
Wutke, S., Sandoval-Castellanos, E., Benecke, N., Döhle, H.J., Friederich, S., Gonzalez, J., Hofreiter, M., Lõugas, L., Magnell, O., Malaspinas, A.S., Morales-Muñiz, A., Orlando, L., Reissmann, M., Trinks, A. & Ludwig, A.
76
(2018). Decline of genetic diversity in ancient domestic stallions in Europe. Science Advances, vol. 4 (4)
Yanagisawa, M., Kurihara, H., Kimura, S., Torno be, Y., Kobayashi, M., Mitsui, Y., YazakP, Y., Goto, K. & Masaki, T. (1988). A novel potent vasoconstrictor peptide produced by vascular endothelial cells. Nature, vol. 332, pp. 411–415
Yang, Z. de & Li, M. (2011). There may be a same mechanism of the left-right handedness and left-right convex curve pattern of adolescent idiopathic scoliosis. Medical Hypotheses, vol. 76 (2), pp. 274–276 Churchill Livingstone.
Zhang, L. & Elias, J.E. (2017). Relative Protein Quantification Using Tandem Mass Tag Mass Spectrometry. In: Comai, L., Katz, J., & Mallick, P. (eds.) Proteomics. New York, NY.: Humana Press, pp. 185–198.
77
Horses are amazing athletes. They have big hearts that can pump up to 400 liters of blood per minute. In a well-trained elite horse, up to 90 percent of the blood can be distributed to the working muscles. By nature, horses need to escape from predators to survive, and they have since domestication about 4000-5500 years ago been selected for desired traits such as strength, speed, and gait ability. The long history of selection and the population structure with many different breeds make the horse a perfect model for studying the genetics behind complex biological processes. Many diseases and conditions that affect humans are also present in horses. Using the horse as a model, we can get more information about the biological mechanisms behind these conditions and thereby improve diagnosis and treatment.
The overall aims of this thesis were to dissect the genetics of athletic performance and conformation in horses as well as investigate the level of inbreeding in Coldblooded trotters. A strong selection in a limited population can result in inbreeding, negatively affecting performance and health. Coldblooded trotters have been strongly selected for harness racing performance for more than sixty years and a few popular stallions dominate the breeding. Traditionally, the level of inbreeding is monitored by using information from pedigree data. However, improved methods to investigate the horse genome open up the possibility of using genomic data to estimate the level of inbreeding. The genetic diversity decreases when there is a selection, and these genomic footprints of selection can be identified using genomic data. In study I, we investigated the level of inbreeding in Coldblooded trotters using both pedigree and genomic data. The results showed that the level of inbreeding had gradually increased during the studied years 2000 to 2009. The inbreeding coefficient based on genomic
Popular science summary
78
data was higher compared to pedigree data. Pedigree data may contain errors, and genomic data give more exact information and can identify genomic regions sensitive for inbreeding. Thus, genomic measures of relationship between potential breeding horses could be introduced when selecting horses for breeding to minimize further increased inbreeding.
As well as elite human athletes, racehorses need to have an ideal genetic setup for athleticism to tolerate training and perform at an elite level to win races. Athletic performance is a complex trait influenced by multiple factors. In studies II-IV we used different genetic mapping methods to identify genetic factors associated with athletic performance in Coldblooded trotters. The results from studies II and III revealed that athletic performance is influenced by several genes and indicated that not only physical characteristics are important for racing performance, but also mental qualities such as learning and intelligence. Horses that have easy to learn and remember the routines likely have easier to adapt to training and better focus on the race.
In study IV, we investigated genetic regulation of athletic performance and exercise related blood pressure in Coldblooded trotters. The intense exercise that horses perform during training and races induces a physical stress response known as “the fight or flight response” to obtain more energy for the working muscles. The stress hormones that are released also affect inflammatory processes and blood pressure. Horses with the unfavorable genetic variants (negatively associated with athletic performance) had higher plasma concentration of the protein Endothelin 1, which are known to constrict blood vessels. In addition, they had a lower concentration of the vasodilator protein Endothelin 3. These horses had higher blood pressure during exercise and needed a longer time to return to resting blood pressure values after the exercise than the horses carrying the favorable genetic variants (associated with elite performance). High blood pressure results in impaired blood flow to the working muscles due to vascular constriction, which leads to increased oxidative stress and inflammation. Horses with the unfavorable genetic variants had higher levels of proteins linked to inflammation and coagulation processes. Biomarkers for inflammatory factors could be introduced to monitor subclinical exercise induced disorders such as overtraining. Previous studies in horses have shown that the inflammatory factors return to resting values between two to 24 hours after
79
intense exercise. However, there is a risk for chronic inflammation and overtraining if the horses do not recover between the races.
Conformation is essential for health, durability, and performance. It is well known that conformation of back and croup affects riding ability and performance in Icelandic horses. In study V, we investigated the genome in Icelandic horses assessed at breeding field tests to investigate the genetics of conformation of back and croup. A genomic region was detected containing genes linked to body length, scoliosis, and motor laterality in humans. The genomic region affected conformation of back and croup and the quality of the lateral gaits tölt and pace. Horses with the genetic variants associated with a higher score for back and croup had higher scores for tölt and pace. A genetic test for the detected significant genetic markers has been developed in Icelandic horses.
In conclusion, this thesis contributes to increased knowledge about the molecular genetics of athletic performance, biological processes activated by training as well as conformation traits in horses. The results are valuable for trainers and breeders to aid when selecting horses for breeding. The horse can also serve as a model to understand the genetics and biological mechanisms behind complex traits such as athletic performance, blood pressure regulation, inflammation, and locomotion pattern in humans and other mammalian species.

80
81
Hästar är utmärkta atleter, deras stora hjärtan kan pumpa upp till 400 liter blod per minut. Hos en vältränad elithäst kan upp till 90 procent av blodet som pumpas ut från hjärtat fördelas till de arbetande musklerna. I hästens ursprung ligger förmågan att kunna fly från rovdjur för att överleva. Dessutom har hästen sedan domesticeringen för ungefär 4000-5500 år sedan selekterats för önskvärda egenskaper som styrka, snabbhet och gångartsförmåga. Den långa selektionsprocessen och populationsstrukturen med många olika raser gör hästen till en perfekt modell för att studera genetiken bakom komplexa biologiska processer. Många sjukdomar och tillstånd som påverkar människor förekommer också hos hästar. Med hästen som modell kan vi få mer information om de biologiska mekanismerna bakom dessa tillstånd och därigenom förbättra diagnostik och behandling.
Det övergripande målet med denna avhandling var att undersöka den genetiska bakgrunden till atletisk prestation och exteriör hos hästar samt undersöka inavelsgraden hos kallblodstravare. Ett för starkt urval i en begränsad population kan resultera i inavel, vilket påverkar prestation och hälsa negativt. Kallblodstravare har sedan mer än sextio år starkt selekterats för prestation på travbanan och ett fåtal populära hingstar dominerar aveln. Inavelsgraden övervakas genom att använda information från stamtavlor. Förbättrade metoder för att undersöka hästgenomet öppnar upp möjligheten att använda molekylär genetisk data för att uppskatta inavelsgraden. Vid selektion minskar den genetiska variationen och dessa genomiska fotavtryck av selektion kan identifieras med hjälp av molekylär genetisk data. I den första studien undersökte vi inavelsgraden hos kallblodstravare genom att använda både information från stamtavlor och molekylär genetisk data. Våra resultat visade att inavelsgraden gradvis ökat under de studerade åren 2000-2009 och att uppskattningen av inavelsgraden baserad på molekylär genetisk
Populärvetenskaplig sammanfattning
82
data var högre jämfört med information från stamtavlor. Stamtavlor kan innehålla fel och molekylär genetisk data ger en mera exakt information om inavelsgraden och kan att identifiera regioner i arvsmassan som är känsliga för inavel. Därför skulle genomiska mått på inavelsgrad kunna användas för att förhindra fortsatt ökad inavel.
Liksom elitidrottare måste tävlingshästar ha optimala genetiska förutsättningar för att tolerera hård träning och prestera på elitnivå för att vinna tävlingslopp. Atletisk prestation är en komplex egenskap som påverkas av många faktorer. I studie två till fyra använde vi olika genetiska kartläggningsmetoder för att identifiera genetiska faktorer som påverkar atletisk prestation hos kallblodstravare. Resultaten från studie två och tre visade att atletisk prestation påverkas av många gener och att inte bara fysiska egenskaper är viktiga utan också mentala egenskaper som exempelvis minne och inlärning. Hästar som har lätt att lära sig rutinerna för träning och tävling har sannolikt lättare att anpassa sig och fokusera på tävlingsloppen.
I den fjärde studien undersökte vi genetisk reglering av atletisk prestation och blodtryck hos kallblodstravare. Det intensiva arbetet som hästar utför under träning och tävlingslopp framkallar en fysisk stressreaktion som kallas "fight or flight response" för att få mer energi till de arbetande musklerna. Stresshormonerna som frigörs påverkar även inflammatoriska processer samt blodtrycket. Hästarna som bar på de ogynnsamma genetiska varianterna (negativt associerad med atletisk prestation) hade högre koncentration av proteinet Endotelin 1 som är känt för att dra ihop blodkärlen. Dessutom hade de en lägre koncentration av det kärlvidgande proteinet Endotelin 3. Dessa hästar hade även högre blodtryck under träning och behövde längre tid för att återgå till vilovärden efter träningen jämfört med hästarna som bar på de gynnsamma genetiska varianterna (förknippad med elitprestation). Högt blodtryck ger ett försämrat blodflöde till de arbetande musklerna på grund av att kärlen är sammandragna, vilket leder till ökad oxidativ stress och inflammation. Hästarna med de ogynnsamma genetiska varianterna hade högre nivåer av proteiner kopplade till inflammation och koagulation (blodets levringsförmåga). Biomarkörer för inflammatoriska faktorer skulle kunna utformas för att övervaka träningsrelaterade tillstånd såsom överträning. Tidigare studier hos häst har visat att de inflammatoriska faktorerna återgår till vilovärden mellan två till 24 timmar efter intensiv
83
träning. Det finns dock risk för kronisk inflammation och överträning om hästarna inte återhämtar sig mellan träningspassen och loppen.
Ryggen och korsets exteriör är viktigt för hälsa, hållbarhet och prestation. Det är välkänt att exteriör av rygg och kors påverkar prestationsförmågan hos islandshästar. I den femte studien undersökte vi arvsmassan hos islandshästar som bedömts vid avelsbedömning för att identifiera genetiska bakgrunden till exteriör av rygg och kors. En region hittades i arvsmassan som innehöll gener associerade med kroppslängd, skolios och motorik hos människa. Den genetiska regionen påverkade inte bara exteriör av rygg och kors utan också kvaliteten av de laterala gångarterna passgång och tölt. Hästar med de genetiska varianterna förknippade med högre poäng för rygg och kors hade även högre poäng för tölt och passgång. Ett gentest för de identifierade genetiska markörerna har utvecklats på islandshästar.
Sammanfattningsvis bidrar denna avhandling till ökad kunskap om genetiken bakom atletisk prestation, biologiska processer aktiverade av träning samt exteriör hos hästar. Resultaten är värdefulla för tränare för att anpassa träningen samt för uppfödare som hjälp när hästar ska väljas för avel. Hästen kan också fungera som en modell för att förstå genetiken och de biologiska mekanismerna bakom komplexa egenskaper som atletisk prestation, blodtrycksreglering, inflammation och rörelsemönster hos människor och andra däggdjur.

84
85
The work presented in this thesis was performed at the Department of Animal Breeding and Genetics, Swedish University of Agricultural Sciences (SLU).
I enjoy working with the projects, genomics and horses are my biggest interests. I have learned so much and met many new colleagues. There are many that have contributed and made these projects possible that I would like to thank. I would like to mention a few specifically that I am grateful to:
My supervisors, my main supervisor Gabriella Lindgren for all support, for being a great supervisor and mentor. For sharing your great knowledge in genomics and letting me work with so many very interesting projects. Juanjo Negro for always being positive and willing to help. For contribution with your valuable knowledge in evolutionary and conservation biology. Brandon Velie for your support, inspiration, and help with bioinformatics. Rakan Naboulsi for all your help and clever ideas. For nice collaboration within the projects, we complement each other very well in the projects. Also for all the fun when we were out sampling horses. Åsa Viklund and Susanne Eriksson for your support and valuable help with heritability estimations and statistics.
Göran Andersson for sharing your great knowledge in genomics and gene regulation. For all support and very interesting scientific discussions.
Magnus Åbrink for contributing with your valuable knowledge in immunology. For your inspiration and coming up with brilliant ideas.
Acknowledgements
86
Pelin Sahlén and her research group at KTH and SciLifeLab for sharing your unique knowledge in functional genomics and gene regulation. Special thanks to Jörg Bachmann that helps us with the lab work within the chromatin interaction analysis.
Jennifer Meadows for your support and for sharing your great knowledge in genomics.
Mikael Mattsson and Anna Jansson, for contributing with your valuable knowledge in physiology.
Tytti Vanhala, Anna Svensson, and Haleh, for all valuable help and collaboration in the lab. Anna Darlene van der Heiden for the help with the ONT sequencing.
Susanne Gustafsson and the others working at HGEN lab for collaboration and advice in the lab. Cano for the help when I had data problems. The Administrators and Head of the department and all others working at The Department of Animal Breeding and Genetics. I am grateful that I had the opportunity to meet and work with you.
Björn Nylander for arranging the Bioinformatics Advisory Program at NBIS SciLifeLab and my supervisor Anna Johansson. I am very grateful that I had the opportunity to be a part of this program. I learned a lot about bioinformatics and how to analyze sequence data.
There are many Ph.D. students and master students that I had the opportunity to meet and work with. Just to mention a few. Kim and Laura thanks for all the help and all fun we had when we sampled horses in Spain. Paulina for your valuable support in the sample collections. Marina for all your help and for sharing your knowledge in genetics. You have also helped a lot with sampling horses in Iceland. Ahmad who helped with genotyping. Heiðrún for all collaboration and your valuable knowledge in Icelandic horses. Anna K and Sariha for our valuable collaboration and exchanging experiences in the lab.
87
Malin Erkas at the Department of Clinical Sciences (KV) Clinical training center (KTC) at SLU for kindly providing Cardell Veterinary monitor for the blood pressure measurements.
Annika Thorsell and Carina Sihlbom at the Proteomics Core Facility, Sahlgrenska Academy at the University of Gothenburg, Gothenburg, Sweden. For the help with the relative quantitative proteomics analysis.
There are many researchers that we collaborate with and that contribute with special competence within the projects. Just to mention some of the valuable collaborators: Rebecca Bellone, The equine FAANG group, Ludovic Orlando, Miguel Novoa Bravo, Marie Rhodin, Elin Hernström, Heimir Gunnarsson, Elsa Albertsdóttir, Þorvaldur Kristjánsson, Christina Olsson, Beate and Wolfgang Egner, and many more.
The Swedish Trotting Association, and The Norwegian Trotting Association for providing pedigree and performance data. The Swedish Icelandic horse breeding organization, SIF Avel. All trainers and horse owners that have helped and contributed with valuable samples from their horses. Special thanks to the trainer Jan-Olov Persson and his staff, Lasse and all others working with the horses, for all help during the projects. Many thanks also to my friend Selina Hedström who helped a lot when measuring blood pressure in the horses. This would not have been possible without you.
Last, but not least, I would like to thank my family and friends. My parents Elsa and Börje, my sister Katarina for your support and help with the kids. My husband Fredrik for always being there and that has helped a lot when I was out sampling and working a lot. To our children August and Hilma for being so good and bringing so much happiness and love, you are the best!
The work within this thesis was financially supported by; The Swedish Research Council (VR), The Swedish Research Council for Environment, Agricultural Sciences and Spatial Planning (FORMAS), The Swedish Icelandic horse breeding organization, SIF Avel, and The Swedish Norwegian Foundation for Equine Research.

88

Ι

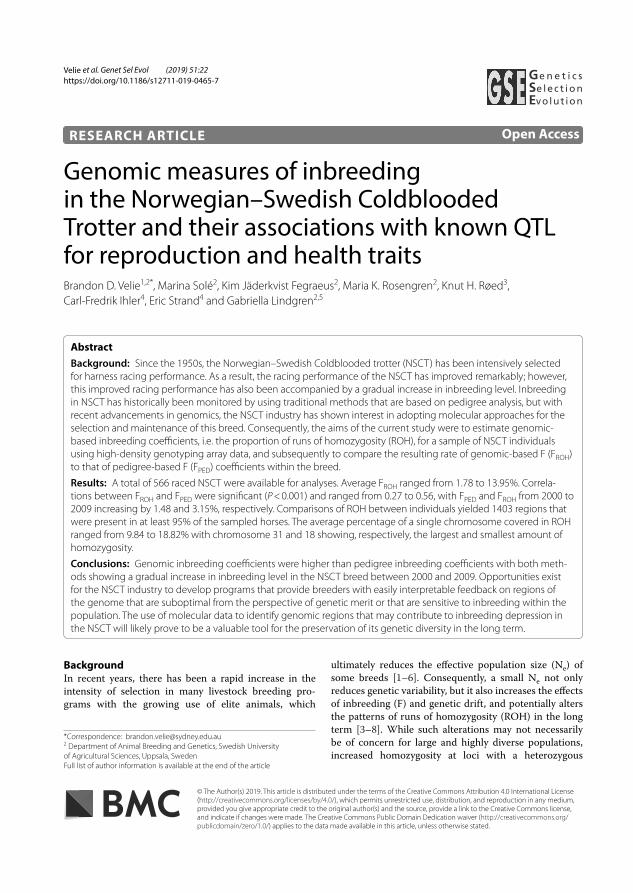
Velie et al. Genet Sel Evol (2019) 51:22 https://doi.org/10.1186/s12711-019-0465-7
RESEARCH ARTICLE
Genomic measures of inbreeding in the Norwegian–Swedish Coldblooded Trotter and their associations with known QTL for reproduction and health traitsBrandon D. Velie1,2*, Marina Solé2, Kim Jäderkvist Fegraeus2, Maria K. Rosengren2, Knut H. Røed3, Carl‑Fredrik Ihler4, Eric Strand4 and Gabriella Lindgren2,5
Abstract
Background: Since the 1950s, the Norwegian–Swedish Coldblooded trotter (NSCT) has been intensively selected for harness racing performance. As a result, the racing performance of the NSCT has improved remarkably; however, this improved racing performance has also been accompanied by a gradual increase in inbreeding level. Inbreeding in NSCT has historically been monitored by using traditional methods that are based on pedigree analysis, but with recent advancements in genomics, the NSCT industry has shown interest in adopting molecular approaches for the selection and maintenance of this breed. Consequently, the aims of the current study were to estimate genomic‑based inbreeding coefficients, i.e. the proportion of runs of homozygosity (ROH), for a sample of NSCT individuals using high‑density genotyping array data, and subsequently to compare the resulting rate of genomic‑based F (FROH) to that of pedigree‑based F (FPED) coefficients within the breed.
Results: A total of 566 raced NSCT were available for analyses. Average FROH ranged from 1.78 to 13.95%. Correla‑tions between FROH and FPED were significant (P < 0.001) and ranged from 0.27 to 0.56, with FPED and FROH from 2000 to 2009 increasing by 1.48 and 3.15%, respectively. Comparisons of ROH between individuals yielded 1403 regions that were present in at least 95% of the sampled horses. The average percentage of a single chromosome covered in ROH ranged from 9.84 to 18.82% with chromosome 31 and 18 showing, respectively, the largest and smallest amount of homozygosity.
Conclusions: Genomic inbreeding coefficients were higher than pedigree inbreeding coefficients with both meth‑ods showing a gradual increase in inbreeding level in the NSCT breed between 2000 and 2009. Opportunities exist for the NSCT industry to develop programs that provide breeders with easily interpretable feedback on regions of the genome that are suboptimal from the perspective of genetic merit or that are sensitive to inbreeding within the population. The use of molecular data to identify genomic regions that may contribute to inbreeding depression in the NSCT will likely prove to be a valuable tool for the preservation of its genetic diversity in the long term.
© The Author(s) 2019. This article is distributed under the terms of the Creative Commons Attribution 4.0 International License (http://creat iveco mmons .org/licen ses/by/4.0/), which permits unrestricted use, distribution, and reproduction in any medium, provided you give appropriate credit to the original author(s) and the source, provide a link to the Creative Commons license, and indicate if changes were made. The Creative Commons Public Domain Dedication waiver (http://creat iveco mmons .org/publi cdoma in/zero/1.0/) applies to the data made available in this article, unless otherwise stated.
BackgroundIn recent years, there has been a rapid increase in the intensity of selection in many livestock breeding pro-grams with the growing use of elite animals, which
ultimately reduces the effective population size (Ne) of some breeds [1–6]. Consequently, a small Ne not only reduces genetic variability, but it also increases the effects of inbreeding (F) and genetic drift, and potentially alters the patterns of runs of homozygosity (ROH) in the long term [3–8]. While such alterations may not necessarily be of concern for large and highly diverse populations, increased homozygosity at loci with a heterozygous
Open Access
Ge n e t i c sSe lec t ionEvolut ion
*Correspondence: [email protected] 2 Department of Animal Breeding and Genetics, Swedish University of Agricultural Sciences, Uppsala, SwedenFull list of author information is available at the end of the article
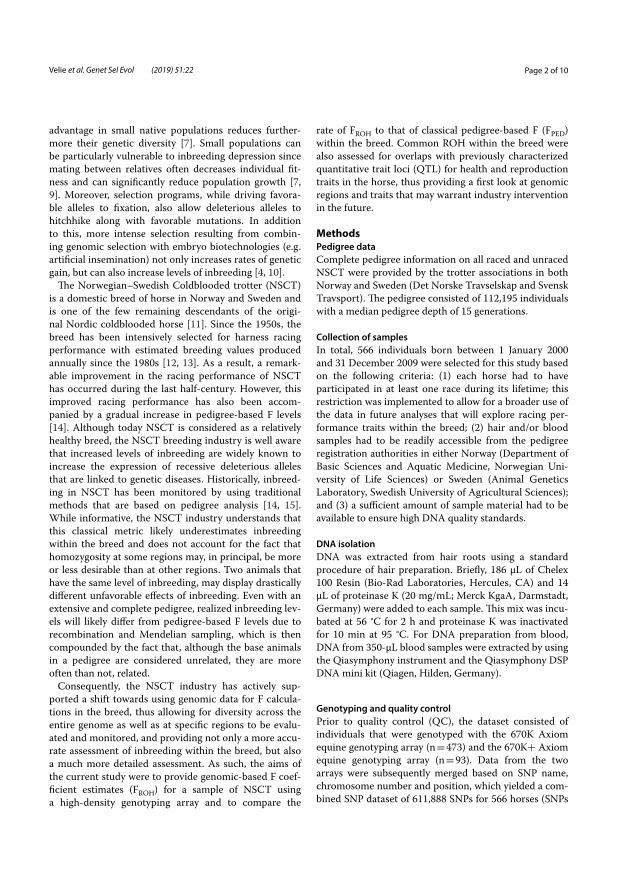
Page 2 of 10Velie et al. Genet Sel Evol (2019) 51:22
advantage in small native populations reduces further-more their genetic diversity [7]. Small populations can be particularly vulnerable to inbreeding depression since mating between relatives often decreases individual fit-ness and can significantly reduce population growth [7, 9]. Moreover, selection programs, while driving favora-ble alleles to fixation, also allow deleterious alleles to hitchhike along with favorable mutations. In addition to this, more intense selection resulting from combin-ing genomic selection with embryo biotechnologies (e.g. artificial insemination) not only increases rates of genetic gain, but can also increase levels of inbreeding [4, 10].
The Norwegian–Swedish Coldblooded trotter (NSCT) is a domestic breed of horse in Norway and Sweden and is one of the few remaining descendants of the origi-nal Nordic coldblooded horse [11]. Since the 1950s, the breed has been intensively selected for harness racing performance with estimated breeding values produced annually since the 1980s [12, 13]. As a result, a remark-able improvement in the racing performance of NSCT has occurred during the last half-century. However, this improved racing performance has also been accom-panied by a gradual increase in pedigree-based F levels [14]. Although today NSCT is considered as a relatively healthy breed, the NSCT breeding industry is well aware that increased levels of inbreeding are widely known to increase the expression of recessive deleterious alleles that are linked to genetic diseases. Historically, inbreed-ing in NSCT has been monitored by using traditional methods that are based on pedigree analysis [14, 15]. While informative, the NSCT industry understands that this classical metric likely underestimates inbreeding within the breed and does not account for the fact that homozygosity at some regions may, in principal, be more or less desirable than at other regions. Two animals that have the same level of inbreeding, may display drastically different unfavorable effects of inbreeding. Even with an extensive and complete pedigree, realized inbreeding lev-els will likely differ from pedigree-based F levels due to recombination and Mendelian sampling, which is then compounded by the fact that, although the base animals in a pedigree are considered unrelated, they are more often than not, related.
Consequently, the NSCT industry has actively sup-ported a shift towards using genomic data for F calcula-tions in the breed, thus allowing for diversity across the entire genome as well as at specific regions to be evalu-ated and monitored, and providing not only a more accu-rate assessment of inbreeding within the breed, but also a much more detailed assessment. As such, the aims of the current study were to provide genomic-based F coef-ficient estimates (FROH) for a sample of NSCT using a high-density genotyping array and to compare the
rate of FROH to that of classical pedigree-based F (FPED) within the breed. Common ROH within the breed were also assessed for overlaps with previously characterized quantitative trait loci (QTL) for health and reproduction traits in the horse, thus providing a first look at genomic regions and traits that may warrant industry intervention in the future.
MethodsPedigree dataComplete pedigree information on all raced and unraced NSCT were provided by the trotter associations in both Norway and Sweden (Det Norske Travselskap and Svensk Travsport). The pedigree consisted of 112,195 individuals with a median pedigree depth of 15 generations.
Collection of samplesIn total, 566 individuals born between 1 January 2000 and 31 December 2009 were selected for this study based on the following criteria: (1) each horse had to have participated in at least one race during its lifetime; this restriction was implemented to allow for a broader use of the data in future analyses that will explore racing per-formance traits within the breed; (2) hair and/or blood samples had to be readily accessible from the pedigree registration authorities in either Norway (Department of Basic Sciences and Aquatic Medicine, Norwegian Uni-versity of Life Sciences) or Sweden (Animal Genetics Laboratory, Swedish University of Agricultural Sciences); and (3) a sufficient amount of sample material had to be available to ensure high DNA quality standards.
DNA isolationDNA was extracted from hair roots using a standard procedure of hair preparation. Briefly, 186 μL of Chelex 100 Resin (Bio-Rad Laboratories, Hercules, CA) and 14 μL of proteinase K (20 mg/mL; Merck KgaA, Darmstadt, Germany) were added to each sample. This mix was incu-bated at 56 °C for 2 h and proteinase K was inactivated for 10 min at 95 °C. For DNA preparation from blood, DNA from 350-μL blood samples were extracted by using the Qiasymphony instrument and the Qiasymphony DSP DNA mini kit (Qiagen, Hilden, Germany).
Genotyping and quality controlPrior to quality control (QC), the dataset consisted of individuals that were genotyped with the 670K Axiom equine genotyping array (n = 473) and the 670K+ Axiom equine genotyping array (n = 93). Data from the two arrays were subsequently merged based on SNP name, chromosome number and position, which yielded a com-bined SNP dataset of 611,888 SNPs for 566 horses (SNPs
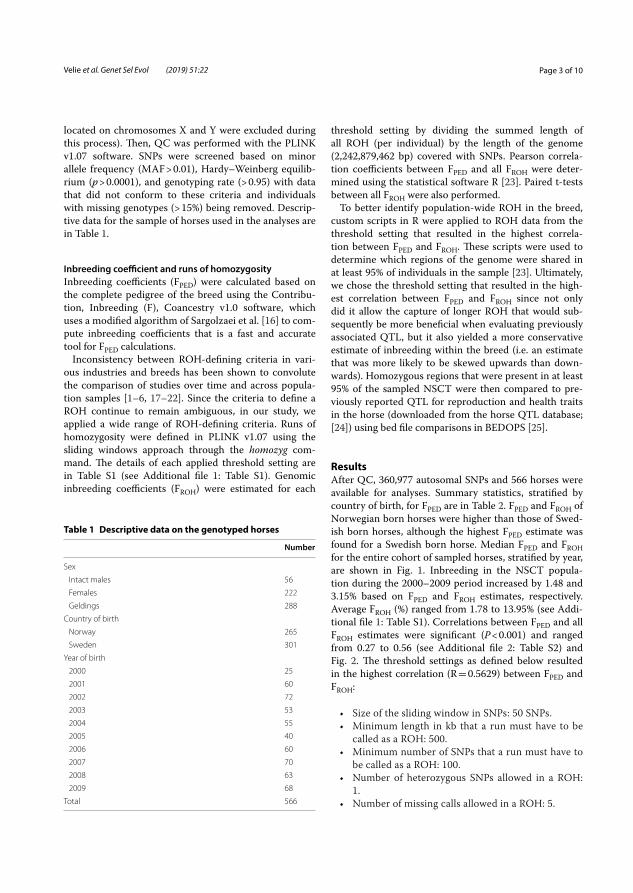
Page 3 of 10Velie et al. Genet Sel Evol (2019) 51:22
located on chromosomes X and Y were excluded during this process). Then, QC was performed with the PLINK v1.07 software. SNPs were screened based on minor allele frequency (MAF > 0.01), Hardy–Weinberg equilib-rium (p > 0.0001), and genotyping rate (> 0.95) with data that did not conform to these criteria and individuals with missing genotypes (> 15%) being removed. Descrip-tive data for the sample of horses used in the analyses are in Table 1.
Inbreeding coefficient and runs of homozygosityInbreeding coefficients (FPED) were calculated based on the complete pedigree of the breed using the Contribu-tion, Inbreeding (F), Coancestry v1.0 software, which uses a modified algorithm of Sargolzaei et al. [16] to com-pute inbreeding coefficients that is a fast and accurate tool for FPED calculations.
Inconsistency between ROH-defining criteria in vari-ous industries and breeds has been shown to convolute the comparison of studies over time and across popula-tion samples [1–6, 17–22]. Since the criteria to define a ROH continue to remain ambiguous, in our study, we applied a wide range of ROH-defining criteria. Runs of homozygosity were defined in PLINK v1.07 using the sliding windows approach through the homozyg com-mand. The details of each applied threshold setting are in Table S1 (see Additional file 1: Table S1). Genomic inbreeding coefficients (FROH) were estimated for each
threshold setting by dividing the summed length of all ROH (per individual) by the length of the genome (2,242,879,462 bp) covered with SNPs. Pearson correla-tion coefficients between FPED and all FROH were deter-mined using the statistical software R [23]. Paired t-tests between all FROH were also performed.
To better identify population-wide ROH in the breed, custom scripts in R were applied to ROH data from the threshold setting that resulted in the highest correla-tion between FPED and FROH. These scripts were used to determine which regions of the genome were shared in at least 95% of individuals in the sample [23]. Ultimately, we chose the threshold setting that resulted in the high-est correlation between FPED and FROH since not only did it allow the capture of longer ROH that would sub-sequently be more beneficial when evaluating previously associated QTL, but it also yielded a more conservative estimate of inbreeding within the breed (i.e. an estimate that was more likely to be skewed upwards than down-wards). Homozygous regions that were present in at least 95% of the sampled NSCT were then compared to pre-viously reported QTL for reproduction and health traits in the horse (downloaded from the horse QTL database; [24]) using bed file comparisons in BEDOPS [25].
ResultsAfter QC, 360,977 autosomal SNPs and 566 horses were available for analyses. Summary statistics, stratified by country of birth, for FPED are in Table 2. FPED and FROH of Norwegian born horses were higher than those of Swed-ish born horses, although the highest FPED estimate was found for a Swedish born horse. Median FPED and FROH for the entire cohort of sampled horses, stratified by year, are shown in Fig. 1. Inbreeding in the NSCT popula-tion during the 2000–2009 period increased by 1.48 and 3.15% based on FPED and FROH estimates, respectively. Average FROH (%) ranged from 1.78 to 13.95% (see Addi-tional file 1: Table S1). Correlations between FPED and all FROH estimates were significant (P < 0.001) and ranged from 0.27 to 0.56 (see Additional file 2: Table S2) and Fig. 2. The threshold settings as defined below resulted in the highest correlation (R = 0.5629) between FPED and FROH:
• Size of the sliding window in SNPs: 50 SNPs.• Minimum length in kb that a run must have to be
called as a ROH: 500.• Minimum number of SNPs that a run must have to
be called as a ROH: 100.• Number of heterozygous SNPs allowed in a ROH:
1.• Number of missing calls allowed in a ROH: 5.
Table 1 Descriptive data on the genotyped horses
Number
Sex
Intact males 56
Females 222
Geldings 288
Country of birth
Norway 265
Sweden 301
Year of birth
2000 25
2001 60
2002 72
2003 53
2004 55
2005 40
2006 60
2007 70
2008 63
2009 68
Total 566
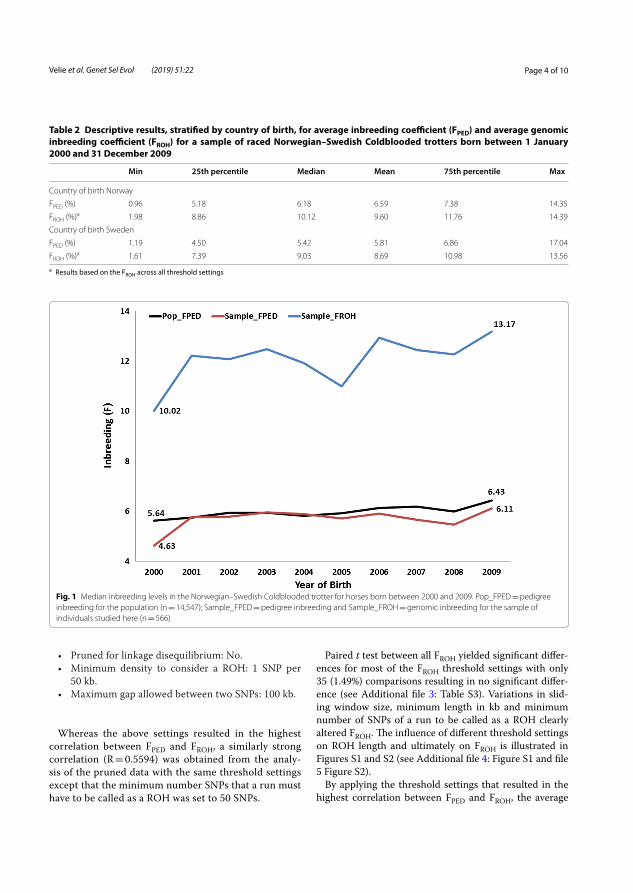
Page 4 of 10Velie et al. Genet Sel Evol (2019) 51:22
• Pruned for linkage disequilibrium: No.• Minimum density to consider a ROH: 1 SNP per
50 kb.• Maximum gap allowed between two SNPs: 100 kb.
Whereas the above settings resulted in the highest
correlation between FPED and FROH, a similarly strong correlation (R = 0.5594) was obtained from the analy-sis of the pruned data with the same threshold settings except that the minimum number SNPs that a run must have to be called as a ROH was set to 50 SNPs.
Paired t test between all FROH yielded significant differ-ences for most of the FROH threshold settings with only 35 (1.49%) comparisons resulting in no significant differ-ence (see Additional file 3: Table S3). Variations in slid-ing window size, minimum length in kb and minimum number of SNPs of a run to be called as a ROH clearly altered FROH. The influence of different threshold settings on ROH length and ultimately on FROH is illustrated in Figures S1 and S2 (see Additional file 4: Figure S1 and file 5 Figure S2).
By applying the threshold settings that resulted in the highest correlation between FPED and FROH, the average
Table 2 Descriptive results, stratified by country of birth, for average inbreeding coefficient (FPED) and average genomic inbreeding coefficient (FROH) for a sample of raced Norwegian–Swedish Coldblooded trotters born between 1 January 2000 and 31 December 2009
a Results based on the FROH across all threshold settings
Min 25th percentile Median Mean 75th percentile Max
Country of birth Norway
FPED (%) 0.96 5.18 6.18 6.59 7.38 14.35
FROH (%)a 1.98 8.86 10.12 9.60 11.76 14.39
Country of birth Sweden
FPED (%) 1.19 4.50 5.42 5.81 6.86 17.04
FROH (%)a 1.61 7.39 9.03 8.69 10.98 13.56
Fig. 1 Median inbreeding levels in the Norwegian–Swedish Coldblooded trotter for horses born between 2000 and 2009. Pop_FPED = pedigree inbreeding for the population (n = 14,547); Sample_FPED = pedigree inbreeding and Sample_FROH = genomic inbreeding for the sample of individuals studied here (n = 566)
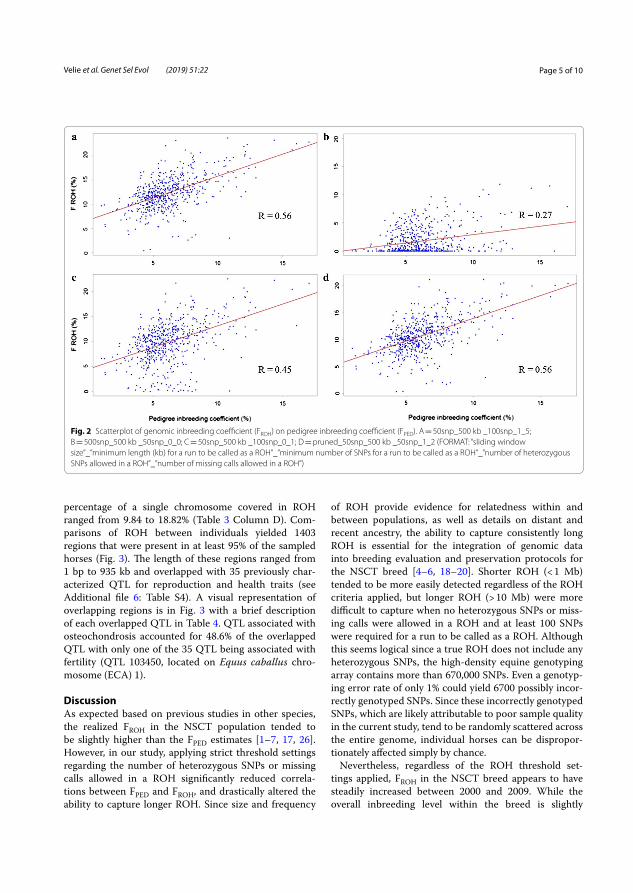
Page 5 of 10Velie et al. Genet Sel Evol (2019) 51:22
percentage of a single chromosome covered in ROH ranged from 9.84 to 18.82% (Table 3 Column D). Com-parisons of ROH between individuals yielded 1403 regions that were present in at least 95% of the sampled horses (Fig. 3). The length of these regions ranged from 1 bp to 935 kb and overlapped with 35 previously char-acterized QTL for reproduction and health traits (see Additional file 6: Table S4). A visual representation of overlapping regions is in Fig. 3 with a brief description of each overlapped QTL in Table 4. QTL associated with osteochondrosis accounted for 48.6% of the overlapped QTL with only one of the 35 QTL being associated with fertility (QTL 103450, located on Equus caballus chro-mosome (ECA) 1).
DiscussionAs expected based on previous studies in other species, the realized FROH in the NSCT population tended to be slightly higher than the FPED estimates [1–7, 17, 26]. However, in our study, applying strict threshold settings regarding the number of heterozygous SNPs or missing calls allowed in a ROH significantly reduced correla-tions between FPED and FROH, and drastically altered the ability to capture longer ROH. Since size and frequency
of ROH provide evidence for relatedness within and between populations, as well as details on distant and recent ancestry, the ability to capture consistently long ROH is essential for the integration of genomic data into breeding evaluation and preservation protocols for the NSCT breed [4–6, 18–20]. Shorter ROH (< 1 Mb) tended to be more easily detected regardless of the ROH criteria applied, but longer ROH (> 10 Mb) were more difficult to capture when no heterozygous SNPs or miss-ing calls were allowed in a ROH and at least 100 SNPs were required for a run to be called as a ROH. Although this seems logical since a true ROH does not include any heterozygous SNPs, the high-density equine genotyping array contains more than 670,000 SNPs. Even a genotyp-ing error rate of only 1% could yield 6700 possibly incor-rectly genotyped SNPs. Since these incorrectly genotyped SNPs, which are likely attributable to poor sample quality in the current study, tend to be randomly scattered across the entire genome, individual horses can be dispropor-tionately affected simply by chance.
Nevertheless, regardless of the ROH threshold set-tings applied, FROH in the NSCT breed appears to have steadily increased between 2000 and 2009. While the overall inbreeding level within the breed is slightly
Fig. 2 Scatterplot of genomic inbreeding coefficient (FROH) on pedigree inbreeding coefficient (FPED). A = 50snp_500 kb _100snp_1_5; B = 500snp_500 kb _50snp_0_0; C = 50snp_500 kb _100snp_0_1; D = pruned_50snp_500 kb _50snp_1_2 (FORMAT: “sliding window size”_”minimum length (kb) for a run to be called as a ROH”_”minimum number of SNPs for a run to be called as a ROH”_”number of heterozygous SNPs allowed in a ROH”_”number of missing calls allowed in a ROH”)
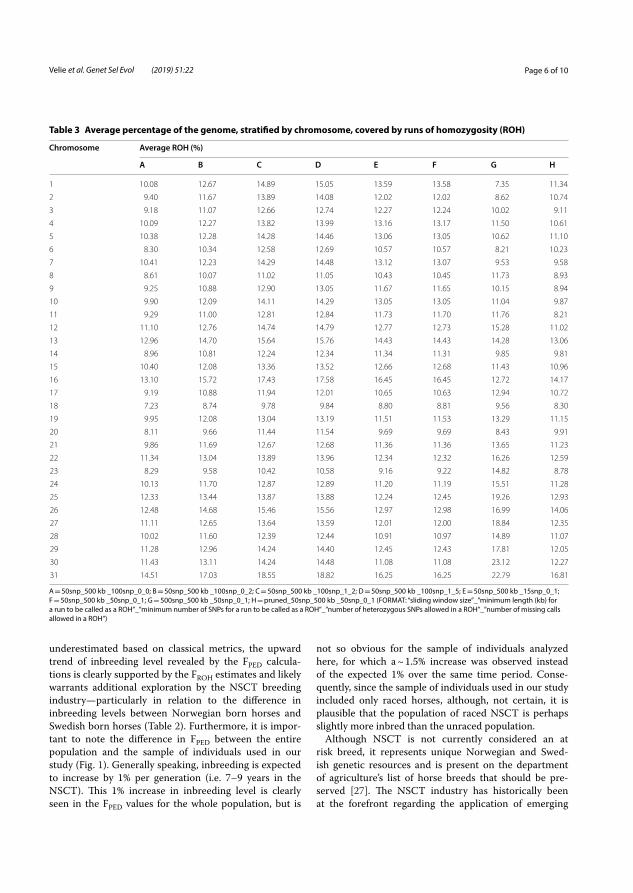
Page 6 of 10Velie et al. Genet Sel Evol (2019) 51:22
underestimated based on classical metrics, the upward trend of inbreeding level revealed by the FPED calcula-tions is clearly supported by the FROH estimates and likely warrants additional exploration by the NSCT breeding industry—particularly in relation to the difference in inbreeding levels between Norwegian born horses and Swedish born horses (Table 2). Furthermore, it is impor-tant to note the difference in FPED between the entire population and the sample of individuals used in our study (Fig. 1). Generally speaking, inbreeding is expected to increase by 1% per generation (i.e. 7–9 years in the NSCT). This 1% increase in inbreeding level is clearly seen in the FPED values for the whole population, but is
not so obvious for the sample of individuals analyzed here, for which a ~ 1.5% increase was observed instead of the expected 1% over the same time period. Conse-quently, since the sample of individuals used in our study included only raced horses, although, not certain, it is plausible that the population of raced NSCT is perhaps slightly more inbred than the unraced population.
Although NSCT is not currently considered an at risk breed, it represents unique Norwegian and Swed-ish genetic resources and is present on the department of agriculture’s list of horse breeds that should be pre-served [27]. The NSCT industry has historically been at the forefront regarding the application of emerging
Table 3 Average percentage of the genome, stratified by chromosome, covered by runs of homozygosity (ROH)
A = 50snp_500 kb _100snp_0_0; B = 50snp_500 kb _100snp_0_2; C = 50snp_500 kb _100snp_1_2; D = 50snp_500 kb _100snp_1_5; E = 50snp_500 kb _15snp_0_1; F = 50snp_500 kb _50snp_0_1; G = 500snp_500 kb _50snp_0_1; H = pruned_50snp_500 kb _50snp_0_1 (FORMAT: “sliding window size”_”minimum length (kb) for a run to be called as a ROH”_”minimum number of SNPs for a run to be called as a ROH”_”number of heterozygous SNPs allowed in a ROH”_”number of missing calls allowed in a ROH”)
Chromosome Average ROH (%)
A B C D E F G H
1 10.08 12.67 14.89 15.05 13.59 13.58 7.35 11.34
2 9.40 11.67 13.89 14.08 12.02 12.02 8.62 10.74
3 9.18 11.07 12.66 12.74 12.27 12.24 10.02 9.11
4 10.09 12.27 13.82 13.99 13.16 13.17 11.50 10.61
5 10.38 12.28 14.28 14.46 13.06 13.05 10.62 11.10
6 8.30 10.34 12.58 12.69 10.57 10.57 8.21 10.23
7 10.41 12.23 14.29 14.48 13.12 13.07 9.53 9.58
8 8.61 10.07 11.02 11.05 10.43 10.45 11.73 8.93
9 9.25 10.88 12.90 13.05 11.67 11.65 10.15 8.94
10 9.90 12.09 14.11 14.29 13.05 13.05 11.04 9.87
11 9.29 11.00 12.81 12.84 11.73 11.70 11.76 8.21
12 11.10 12.76 14.74 14.79 12.77 12.73 15.28 11.02
13 12.96 14.70 15.64 15.76 14.43 14.43 14.28 13.06
14 8.96 10.81 12.24 12.34 11.34 11.31 9.85 9.81
15 10.40 12.08 13.36 13.52 12.66 12.68 11.43 10.96
16 13.10 15.72 17.43 17.58 16.45 16.45 12.72 14.17
17 9.19 10.88 11.94 12.01 10.65 10.63 12.94 10.72
18 7.23 8.74 9.78 9.84 8.80 8.81 9.56 8.30
19 9.95 12.08 13.04 13.19 11.51 11.53 13.29 11.15
20 8.11 9.66 11.44 11.54 9.69 9.69 8.43 9.91
21 9.86 11.69 12.67 12.68 11.36 11.36 13.65 11.23
22 11.34 13.04 13.89 13.96 12.34 12.32 16.26 12.59
23 8.29 9.58 10.42 10.58 9.16 9.22 14.82 8.78
24 10.13 11.70 12.87 12.89 11.20 11.19 15.51 11.28
25 12.33 13.44 13.87 13.88 12.24 12.45 19.26 12.93
26 12.48 14.68 15.46 15.56 12.97 12.98 16.99 14.06
27 11.11 12.65 13.64 13.59 12.01 12.00 18.84 12.35
28 10.02 11.60 12.39 12.44 10.91 10.97 14.89 11.07
29 11.28 12.96 14.24 14.40 12.45 12.43 17.81 12.05
30 11.43 13.11 14.24 14.48 11.08 11.08 23.12 12.27
31 14.51 17.03 18.55 18.82 16.25 16.25 22.79 16.81
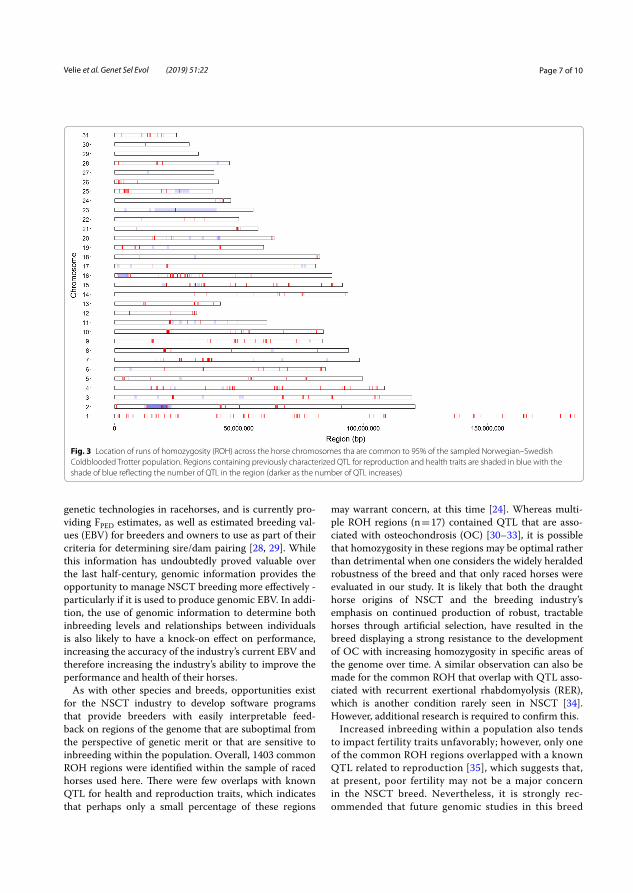
Page 7 of 10Velie et al. Genet Sel Evol (2019) 51:22
genetic technologies in racehorses, and is currently pro-viding FPED estimates, as well as estimated breeding val-ues (EBV) for breeders and owners to use as part of their criteria for determining sire/dam pairing [28, 29]. While this information has undoubtedly proved valuable over the last half-century, genomic information provides the opportunity to manage NSCT breeding more effectively - particularly if it is used to produce genomic EBV. In addi-tion, the use of genomic information to determine both inbreeding levels and relationships between individuals is also likely to have a knock-on effect on performance, increasing the accuracy of the industry’s current EBV and therefore increasing the industry’s ability to improve the performance and health of their horses.
As with other species and breeds, opportunities exist for the NSCT industry to develop software programs that provide breeders with easily interpretable feed-back on regions of the genome that are suboptimal from the perspective of genetic merit or that are sensitive to inbreeding within the population. Overall, 1403 common ROH regions were identified within the sample of raced horses used here. There were few overlaps with known QTL for health and reproduction traits, which indicates that perhaps only a small percentage of these regions
may warrant concern, at this time [24]. Whereas multi-ple ROH regions (n = 17) contained QTL that are asso-ciated with osteochondrosis (OC) [30–33], it is possible that homozygosity in these regions may be optimal rather than detrimental when one considers the widely heralded robustness of the breed and that only raced horses were evaluated in our study. It is likely that both the draught horse origins of NSCT and the breeding industry’s emphasis on continued production of robust, tractable horses through artificial selection, have resulted in the breed displaying a strong resistance to the development of OC with increasing homozygosity in specific areas of the genome over time. A similar observation can also be made for the common ROH that overlap with QTL asso-ciated with recurrent exertional rhabdomyolysis (RER), which is another condition rarely seen in NSCT [34]. However, additional research is required to confirm this.
Increased inbreeding within a population also tends to impact fertility traits unfavorably; however, only one of the common ROH regions overlapped with a known QTL related to reproduction [35], which suggests that, at present, poor fertility may not be a major concern in the NSCT breed. Nevertheless, it is strongly rec-ommended that future genomic studies in this breed
Fig. 3 Location of runs of homozygosity (ROH) across the horse chromosomes tha are common to 95% of the sampled Norwegian–Swedish Coldblooded Trotter population. Regions containing previously characterized QTL for reproduction and health traits are shaded in blue with the shade of blue reflecting the number of QTL in the region (darker as the number of QTL increases)
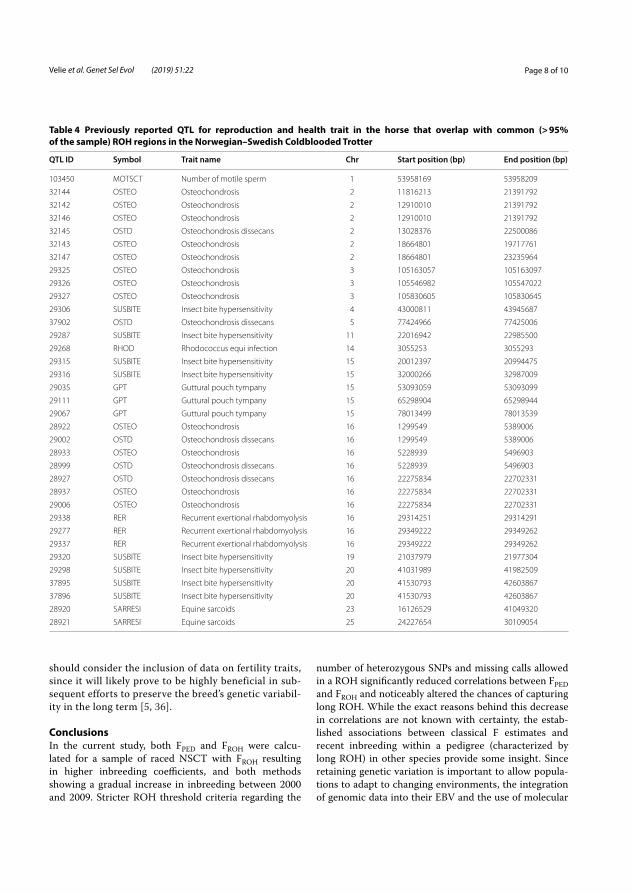
Page 8 of 10Velie et al. Genet Sel Evol (2019) 51:22
should consider the inclusion of data on fertility traits, since it will likely prove to be highly beneficial in sub-sequent efforts to preserve the breed’s genetic variabil-ity in the long term [5, 36].
ConclusionsIn the current study, both FPED and FROH were calcu-lated for a sample of raced NSCT with FROH resulting in higher inbreeding coefficients, and both methods showing a gradual increase in inbreeding between 2000 and 2009. Stricter ROH threshold criteria regarding the
number of heterozygous SNPs and missing calls allowed in a ROH significantly reduced correlations between FPED and FROH and noticeably altered the chances of capturing long ROH. While the exact reasons behind this decrease in correlations are not known with certainty, the estab-lished associations between classical F estimates and recent inbreeding within a pedigree (characterized by long ROH) in other species provide some insight. Since retaining genetic variation is important to allow popula-tions to adapt to changing environments, the integration of genomic data into their EBV and the use of molecular
Table 4 Previously reported QTL for reproduction and health trait in the horse that overlap with common (> 95% of the sample) ROH regions in the Norwegian–Swedish Coldblooded Trotter
QTL ID Symbol Trait name Chr Start position (bp) End position (bp)
103450 MOTSCT Number of motile sperm 1 53958169 53958209
32144 OSTEO Osteochondrosis 2 11816213 21391792
32142 OSTEO Osteochondrosis 2 12910010 21391792
32146 OSTEO Osteochondrosis 2 12910010 21391792
32145 OSTD Osteochondrosis dissecans 2 13028376 22500086
32143 OSTEO Osteochondrosis 2 18664801 19717761
32147 OSTEO Osteochondrosis 2 18664801 23235964
29325 OSTEO Osteochondrosis 3 105163057 105163097
29326 OSTEO Osteochondrosis 3 105546982 105547022
29327 OSTEO Osteochondrosis 3 105830605 105830645
29306 SUSBITE Insect bite hypersensitivity 4 43000811 43945687
37902 OSTD Osteochondrosis dissecans 5 77424966 77425006
29287 SUSBITE Insect bite hypersensitivity 11 22016942 22985500
29268 RHOD Rhodococcus equi infection 14 3055253 3055293
29315 SUSBITE Insect bite hypersensitivity 15 20012397 20994475
29316 SUSBITE Insect bite hypersensitivity 15 32000266 32987009
29035 GPT Guttural pouch tympany 15 53093059 53093099
29111 GPT Guttural pouch tympany 15 65298904 65298944
29067 GPT Guttural pouch tympany 15 78013499 78013539
28922 OSTEO Osteochondrosis 16 1299549 5389006
29002 OSTD Osteochondrosis dissecans 16 1299549 5389006
28933 OSTEO Osteochondrosis 16 5228939 5496903
28999 OSTD Osteochondrosis dissecans 16 5228939 5496903
28927 OSTD Osteochondrosis dissecans 16 22275834 22702331
28937 OSTEO Osteochondrosis 16 22275834 22702331
29006 OSTEO Osteochondrosis 16 22275834 22702331
29338 RER Recurrent exertional rhabdomyolysis 16 29314251 29314291
29277 RER Recurrent exertional rhabdomyolysis 16 29349222 29349262
29337 RER Recurrent exertional rhabdomyolysis 16 29349222 29349262
29320 SUSBITE Insect bite hypersensitivity 19 21037979 21977304
29298 SUSBITE Insect bite hypersensitivity 20 41031989 41982509
37895 SUSBITE Insect bite hypersensitivity 20 41530793 42603867
37896 SUSBITE Insect bite hypersensitivity 20 41530793 42603867
28920 SARRESI Equine sarcoids 23 16126529 41049320
28921 SARRESI Equine sarcoids 25 24227654 30109054

Page 9 of 10Velie et al. Genet Sel Evol (2019) 51:22
data to identify both genomic regions contributing to inbreeding depression and pedigree errors will likely prove invaluable as the NSCT industry moves forward in its conservation and selection efforts.
Additional files
Additional file 1: Table S1. Threshold settings used to define runs of homozygosity in PLINK and the corresponding average FROH for a sample of raced Norwegian‑Swedish Coldblooded trotters born between 1 Janu‑ary 2000 and 31 December 2009.
Additional file 2: Table S2. Correlation matrix between FPED and all FROH estimates.
Additional file 3: Table S3. Results of the paired t‑test (P‑values) between FPED and all FROH estimates.
Additional file 4: Figure S1. Histograms for run of homozygosity (ROH) lengths based on four different threshold combinations in PLINK v 1.07. A = 50snp_500kb _100snp_0_0; B = 50snp_500kb _100snp_0_2; C = 50snp_500kb _100snp_1_2; D = 50snp_500kb _100snp_1_5 (FORMAT: “sliding window size”_”minimum length (kb) to be called as homozygous”_”minimum number of SNPs to be called as homozygous”_”number of heterozygotes allowed”_”number of missing calls allowed”).
Additional file 5: Figure S2. Histograms for run of homozygosity (ROH) lengths based on varying window size thresholds in PLINK v 1.07. A = 50snp_500kb _15snp_0_1; B = 50snp_500kb _50snp_0_1; C = 500snp_500kb _50snp_0_1; D = pruned_50snp_500kb _50snp_0_1 (FORMAT: “sliding window size”_”minimum length (kb) for a run to be called as a ROH”_”minimum number of SNPs for a run to be called as a ROH”_”number of heterozygous SNPs allowed in a ROH”_”number of miss‑ing calls allowed in a ROH”).
Additional file 6: Table S4. Homozygous regions of the genome that are shared by at least 95% of the sample of Norwegian‑Swedish Coldblooded Trotters (n = 566).
AcknowledgementsWe want to thank Christina Olsson, Annica Edberg, Knut Larsen, Chameli Lilja Lawrence, Thorvaldur Árnason, the Swedish Trotter Association, and the Nor‑wegian Trotter Association for providing their support and the data/samples for the study.
Authors’ contributionsBDV, KJF, CI, ES, and GL conceived and designed the experiments; KJF, MKR, and KHR contributed to sampling. GL and ES contributed the reagents and MKR extracted the DNA; BDV analyzed the data and drafted the manuscript; KJF, MS, CI, ES, and GL discussed and contributed to data analysis. All authors read and approved the final manuscript.
FundingThis work was supported by the Swedish‑Norwegian Foundation for Equine Research, H‑15‑47‑075, http://hastf orskn ing.se (GL, ES). The funders had no role in the design of the study, data collection and analysis, decision to pub‑lish, or preparation of the manuscript.
Availability of data and materialsThe data that support the findings of this study are available from the Swedish Trotter Association (Stockholm, Sweden) and the Norwegian Trotter Associa‑tion (Oslo, Norway), but restrictions apply to the availability of these data, which were used under license for the current study, and so are not publicly available. However, data are available from the authors upon reasonable request and with permission of the Swedish Trotter Association (Stockholm, Sweden) and the Norwegian Trotter Association (Oslo, Norway).
Ethics approval and consent to participateAll experimental procedures and sample collection methods were approved by the Ethics Committee for Animal Experiments in Uppsala, Sweden [Num‑ber: C 121/14]. Samples used in this study were already available at either the Animal Genetics Laboratory at SLU in Uppsala, Sweden or the Department of Basic Sciences and Aquatic Medicine at the Norwegian University of Life Sciences in Oslo, Norway, since they had been previously used for parentage testing. Permission to use the samples was granted from the Swedish Trotting Association and the Norwegian Trotting Association (the owners of the sam‑ples per the rules/guidelines of the industry).
Consent for publicationNot applicable.
Competing interestsThe authors have the following interests: GL is a co‑inventor on a granted patent concerning commercial testing of the DMRT3 mutation: A method to predict the pattern of locomotion in horses. PCT EP 12,747,875.8. European patent registration date: 2011‑05‑05, US patent registration date: 2011‑08‑03. There are no further patents, products in development, or marketed products to declare.
Author details1 School of Life and Environmental Sciences, University of Sydney, Sydney, Australia. 2 Department of Animal Breeding and Genetics, Swedish University of Agricultural Sciences, Uppsala, Sweden. 3 Department of Basic Sciences and Aquatic Medicine, Norwegian University of Life Sciences, Oslo, Norway. 4 Department of Companion Animal Clinical Sciences, Norwegian University of Life Sciences, Oslo, Norway. 5 Livestock Genetics, Department of Biosystems, KU Leuven, Leuven, Belgium.
Received: 27 November 2018 Accepted: 14 May 2019
References 1. Solé M, Gori A, Faux P, Bertrand A, Farnir F, Gautier M, et al. Age‑based
partitioning of individual genomic inbreeding levels in Belgian Blue cat‑tle. Genet Sel Evol. 2017;49:92.
2. Luan T, Yu X, Dolezal M, Bagnato A, Meuwissen THE. Genomic prediction based on runs of homozygosity. Genet Sel Evol. 2014;46:64.
3. Pryce JE, Haile‑Mariam M, Goddard ME, Hayes BJ. Identification of genomic regions associated with inbreeding depression in Holstein and Jersey dairy cattle. Genet Sel Evol. 2014;46:71.
4. Howard JT, Pryce JE, Baes C, Maltecca C. Inbreeding in the genomics era: inbreaeding, inbreeding depression, and management of genomic vari‑ability. J Dairy Sci. 2017;100:6009–24.
5. Peripolli E, Munari DP, Silva MVGB, Lima ALF, Irgang R, Baldi F. Runs of homozygosity: current knowledge and applications in livestock. Anim Genet. 2017;48:255–71.
6. Kim ES, Sonstegard TS, Van Tassell CP, Wiggans G, Rothschild MF. The rela‑tionship between runs of homozygosity and inbreeding in Jersey cattle under selection. PLoS One. 2015;10:e0129967.
7. Kardos M, Akesson M, Fountain T, Flagstad O, Liberg O, Olason P, et al. Genomic consequences of intensive inbreeding in an isolated wolf popu‑lation. Nat Ecol Evol. 2018;2:124–31.
8. Ayroles JF, Hughes KA, Rowe KC, Reedy MM, Rodriguez‑Zas SL, Drnevich JM, et al. A genomewide assessment of inbreeding depression: gene number, function, and mode of action. Conserv Biol. 2009;23:920–30.
9. Charlesworth D, Willis JH. The genetics of inbreeding depression. Nat Rev Genet. 2009;10:783–96.
10. Ponsart C, Le Bourhis D, Knijn H, Fritz S, Guyader‑Joly C, Otter T, et al. Reproductive technologies and genomic selection in dairy cattle. Reprod Fertil Dev. 2013;26:12–21.
11. Jäderkvist Fegraeus K, Velie BD, Axelsson J, Ang R, Hamilton NA, Anders‑son L, et al. A potential regulatory region near the EDN3 gene may con‑trol both harness racing performance and coat color variation in horses. Physiol Rep. 2018;6:e13700.
12. Klemetsdal G. Norwegian trotter breeding and estimation of breeding values. In: State of breeding evaluation in trotters. In Proceedings of the
Page 10 of 10Velie et al. Genet Sel Evol (2019) 51:22
• fast, convenient online submission
•
thorough peer review by experienced researchers in your field
• rapid publication on acceptance
• support for research data, including large and complex data types
•
gold Open Access which fosters wider collaboration and increased citations
maximum visibility for your research: over 100M website views per year •
At BMC, research is always in progress.
Learn more biomedcentral.com/submissions
Ready to submit your research ? Choose BMC and benefit from:
European Federation of Animal Science Symposium of the Commission on Horse Production: 27 June–1 July 1988; Helsinki.; 1989. pp 95–105.
13. Arnason T, Bendroth M, Philipsson J, Henriksson K, Darenius A. Genetic evaluation of Swedish trotters. In State of breeding evaluation in trotters. In Proceedings of the European Federation of Animal Science Sympo‑sium of the Commission on Horse Production: 27 June–1 July 1988; Helsinki.; 1989. pp 106–30.
14. Svensk Travsport. 2018. https ://www.travs port.se/wicke t/bookm arkab le/se.atg.web.travs port.page.polop oly.Artic lePag e?6&cid=2.255. Accessed 1 Sept 2018.
15. Klemetsdal G. The effect of inbreeding on racing performance in Norwe‑gian cold‑blooded trotters. Genet Sel Evol. 1998;30:351–66.
16. Sargolzaei M, Iwaisaki H, Colleau JJ. CFC, A tool for monitoring genetic diversity. In: Proceedings of the 8th World Congress on Genetics Applied to Livestock Production: 13–18 August 2006; Belo Horizonte; 2006.
17. Forneris NS, Steibel JP, Legarra A, Vitezica ZG, Bates RO, Ernst CW, et al. A comparison of methods to estimate genomic relationships using pedigree and markers in livestock populations. J Anim Breed Genet. 2016;133:452–62.
18. Druml T, Neuditschko M, Grilz‑Seger G, Horna M, Ricard A, Mesaric M, et al. Population networks associated with runs of homozygosity reveal new insights into the breeding history of the Haflinger horse. J Hered. 2018;109:384–92.
19. Keller MC, Visscher PM, Goddard ME. Quantification of inbreeding due to distant ancestors and its detection using dense single nucleotide polymorphism data. Genetics. 2011;189:237–49.
20. Ferencakovic M, Solkner J, Curik I. Estimating autozygosity from high‑throughput information: effects of SNP density and genotyping errors. Genet Sel Evol. 2013;45:42.
21. Metzger J, Karwath M, Tonda R, Beltran S, Agueda L, Gut M, et al. Runs of homozygosity reveal signatures of positive selection for reproduction traits in breed and non‑breed horses. BMC Genomics. 2015;16:764.
22. Kaminski S, Hering DM, Jaworski Z, Zabolewicz T, Rusc A. Assessment of genomic inbreeding in Polish Konik horses. Pol J Vet Sci. 2017;20:603–5.
23. R Development Core Team: R‑A Language and environment for statistical computing; 2018 https ://www.r‑proje ct.org/. Accessed 1 April 2018.
24. Hu ZL, Park CA, Reecy JM. Developmental progress and current status of the Animal QTLdb. Nucleic Acids Res. 2016;44:D827–33.
25. Neph S, Kuehn MS, Reynolds AP, Haugen E, Thurman RE, Johnson AK, et al. BEDOPS: high‑performance genomic feature operations. Bioinfor‑matics. 2012;28:1919–20.
26. Kardos M, Luikart G, Allendorf FW. Measuring individual inbreeding in the age of genomics: marker‑based measures are better than pedigrees. Heredity (Edinb). 2015;115:63–72.
27. Department of Agriculture. Delmål för husdjursgenetiska resurser åren 2010 till 2020; 2009. http://www.jordb ruksv erket .se/downl oad/18.29580 36f12 11efb 32978 00030 8/rappo rt%2B070 511.pdf. Accessed 1 Sept 2018.
28. Svensk Travsport; 2018 https ://www.travs port.se/artik el/kvali ficer ings‑_&_premi elopp . Accessed 1 Sept 2018.
29. Det Norske Travselskap; 2018 https ://www.travs port.no. Accessed 1 Sept 2018.
30. Dierks C, Komm K, Lampe V, Distl O. Fine mapping of a quantitative trait locus for osteochondrosis on horse chromosome 2. Anim Genet. 2010;41:S87–90.
31. Orr N, Hill EW, Govindarajan P, Conroy J, van Grevenhof EM, Ducro BJ, et al. Genome‑wide association study of osteochondrosis in the tarsocrural joint of Dutch Warmblood horses identifies susceptibility loci on chromo‑somes 3 and 10. Anim Genet. 2013;44:408–12.
32. Lykkjen S, Dolvik NI, McCue ME, Rendahl AK, Mickelson JR, Roed KH. Genome‑wide association analysis of osteochondrosis of the tibiotarsal joint in Norwegian Standardbred trotters. Anim Genet. 2010;41:S111–20.
33. Lampe V, Dierks C, Distl O. Refinement of a quantitative gene locus on equine chromosome 16 responsible for osteochondrosis in Hanoverian warmblood horses. Animal. 2009;3:1224–31.
34. Fritz KL, McCue ME, Valberg SJ, Rendahl AK, Mickelson JR. Genetic map‑ping of recurrent exertional rhabdomyolysis in a population of North American Thoroughbreds. Anim Genet. 2012;43:730–8.
35. Gottschalk M, Metzger J, Martinsson G, Sieme H, Distl O. Genome‑wide association study for semen quality traits in German Warmblood stallions. Anim Reprod Sci. 2016;171:81–6.
36. de Simoni Gouveia JJ, da Silva MVGB, Paiva SR, de Oliveira SMP. Iden‑tification of selection signatures in livestock species. Genet Mol Biol. 2014;37:330–42.
Publisher’s NoteSpringer Nature remains neutral with regard to jurisdictional claims in pub‑lished maps and institutional affiliations.

ΙI

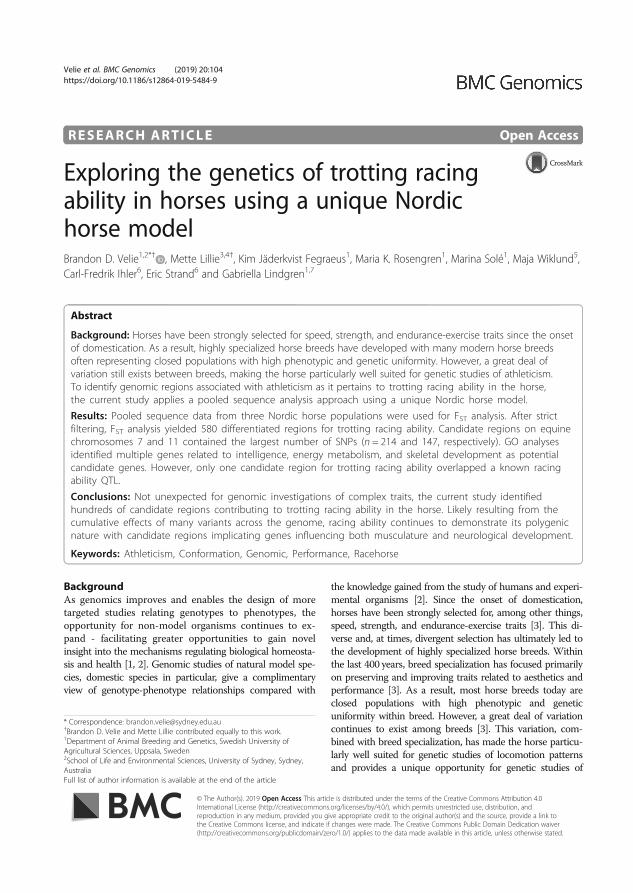
RESEARCH ARTICLE Open Access
Exploring the genetics of trotting racingability in horses using a unique Nordichorse modelBrandon D. Velie1,2*† , Mette Lillie3,4†, Kim Jäderkvist Fegraeus1, Maria K. Rosengren1, Marina Solé1, Maja Wiklund5,Carl-Fredrik Ihler6, Eric Strand6 and Gabriella Lindgren1,7
Abstract
Background: Horses have been strongly selected for speed, strength, and endurance-exercise traits since the onsetof domestication. As a result, highly specialized horse breeds have developed with many modern horse breedsoften representing closed populations with high phenotypic and genetic uniformity. However, a great deal ofvariation still exists between breeds, making the horse particularly well suited for genetic studies of athleticism.To identify genomic regions associated with athleticism as it pertains to trotting racing ability in the horse,the current study applies a pooled sequence analysis approach using a unique Nordic horse model.
Results: Pooled sequence data from three Nordic horse populations were used for FST analysis. After strictfiltering, FST analysis yielded 580 differentiated regions for trotting racing ability. Candidate regions on equinechromosomes 7 and 11 contained the largest number of SNPs (n = 214 and 147, respectively). GO analysesidentified multiple genes related to intelligence, energy metabolism, and skeletal development as potentialcandidate genes. However, only one candidate region for trotting racing ability overlapped a known racingability QTL.
Conclusions: Not unexpected for genomic investigations of complex traits, the current study identifiedhundreds of candidate regions contributing to trotting racing ability in the horse. Likely resulting from thecumulative effects of many variants across the genome, racing ability continues to demonstrate its polygenicnature with candidate regions implicating genes influencing both musculature and neurological development.
Keywords: Athleticism, Conformation, Genomic, Performance, Racehorse
BackgroundAs genomics improves and enables the design of moretargeted studies relating genotypes to phenotypes, theopportunity for non-model organisms continues to ex-pand - facilitating greater opportunities to gain novelinsight into the mechanisms regulating biological homeosta-sis and health [1, 2]. Genomic studies of natural model spe-cies, domestic species in particular, give a complimentaryview of genotype-phenotype relationships compared with
the knowledge gained from the study of humans and experi-mental organisms [2]. Since the onset of domestication,horses have been strongly selected for, among other things,speed, strength, and endurance-exercise traits [3]. This di-verse and, at times, divergent selection has ultimately led tothe development of highly specialized horse breeds. Withinthe last 400 years, breed specialization has focused primarilyon preserving and improving traits related to aesthetics andperformance [3]. As a result, most horse breeds today areclosed populations with high phenotypic and geneticuniformity within breed. However, a great deal of variationcontinues to exist among breeds [3]. This variation, com-bined with breed specialization, has made the horse particu-larly well suited for genetic studies of locomotion patternsand provides a unique opportunity for genetic studies of
* Correspondence: [email protected]†Brandon D. Velie and Mette Lillie contributed equally to this work.1Department of Animal Breeding and Genetics, Swedish University ofAgricultural Sciences, Uppsala, Sweden2School of Life and Environmental Sciences, University of Sydney, Sydney,AustraliaFull list of author information is available at the end of the article
© The Author(s). 2019 Open Access This article is distributed under the terms of the Creative Commons Attribution 4.0International License (http://creativecommons.org/licenses/by/4.0/), which permits unrestricted use, distribution, andreproduction in any medium, provided you give appropriate credit to the original author(s) and the source, provide a link tothe Creative Commons license, and indicate if changes were made. The Creative Commons Public Domain Dedication waiver(http://creativecommons.org/publicdomain/zero/1.0/) applies to the data made available in this article, unless otherwise stated.
Velie et al. BMC Genomics (2019) 20:104 https://doi.org/10.1186/s12864-019-5484-9
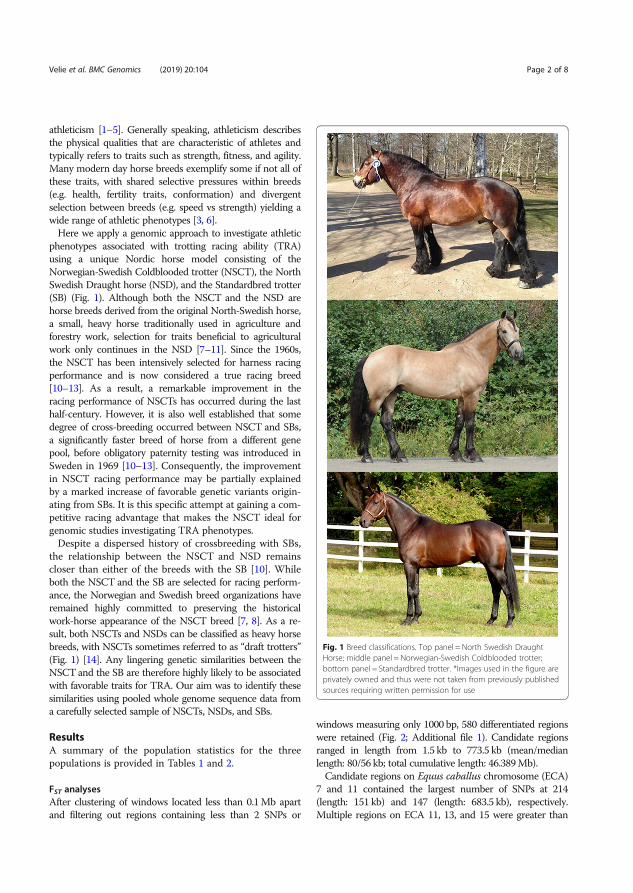
athleticism [1–5]. Generally speaking, athleticism describesthe physical qualities that are characteristic of athletes andtypically refers to traits such as strength, fitness, and agility.Many modern day horse breeds exemplify some if not all ofthese traits, with shared selective pressures within breeds(e.g. health, fertility traits, conformation) and divergentselection between breeds (e.g. speed vs strength) yielding awide range of athletic phenotypes [3, 6].Here we apply a genomic approach to investigate athletic
phenotypes associated with trotting racing ability (TRA)using a unique Nordic horse model consisting of theNorwegian-Swedish Coldblooded trotter (NSCT), the NorthSwedish Draught horse (NSD), and the Standardbred trotter(SB) (Fig. 1). Although both the NSCT and the NSD arehorse breeds derived from the original North-Swedish horse,a small, heavy horse traditionally used in agriculture andforestry work, selection for traits beneficial to agriculturalwork only continues in the NSD [7–11]. Since the 1960s,the NSCT has been intensively selected for harness racingperformance and is now considered a true racing breed[10–13]. As a result, a remarkable improvement in theracing performance of NSCTs has occurred during the lasthalf-century. However, it is also well established that somedegree of cross-breeding occurred between NSCT and SBs,a significantly faster breed of horse from a different genepool, before obligatory paternity testing was introduced inSweden in 1969 [10–13]. Consequently, the improvementin NSCT racing performance may be partially explainedby a marked increase of favorable genetic variants origin-ating from SBs. It is this specific attempt at gaining a com-petitive racing advantage that makes the NSCT ideal forgenomic studies investigating TRA phenotypes.Despite a dispersed history of crossbreeding with SBs,
the relationship between the NSCT and NSD remainscloser than either of the breeds with the SB [10]. Whileboth the NSCT and the SB are selected for racing perform-ance, the Norwegian and Swedish breed organizations haveremained highly committed to preserving the historicalwork-horse appearance of the NSCT breed [7, 8]. As a re-sult, both NSCTs and NSDs can be classified as heavy horsebreeds, with NSCTs sometimes referred to as “draft trotters”(Fig. 1) [14]. Any lingering genetic similarities between theNSCTand the SB are therefore highly likely to be associatedwith favorable traits for TRA. Our aim was to identify thesesimilarities using pooled whole genome sequence data froma carefully selected sample of NSCTs, NSDs, and SBs.
ResultsA summary of the population statistics for the threepopulations is provided in Tables 1 and 2.
FST analysesAfter clustering of windows located less than 0.1Mb apartand filtering out regions containing less than 2 SNPs or
windows measuring only 1000 bp, 580 differentiated regionswere retained (Fig. 2; Additional file 1). Candidate regionsranged in length from 1.5 kb to 773.5 kb (mean/medianlength: 80/56 kb; total cumulative length: 46.389Mb).Candidate regions on Equus caballus chromosome (ECA)
7 and 11 contained the largest number of SNPs at 214(length: 151 kb) and 147 (length: 683.5 kb), respectively.Multiple regions on ECA 11, 13, and 15 were greater than
Fig. 1 Breed classifications. Top panel = North Swedish DraughtHorse; middle panel = Norwegian-Swedish Coldblooded trotter;bottom panel = Standardbred trotter. *Images used in the figure areprivately owned and thus were not taken from previously publishedsources requiring written permission for use
Velie et al. BMC Genomics (2019) 20:104 Page 2 of 8
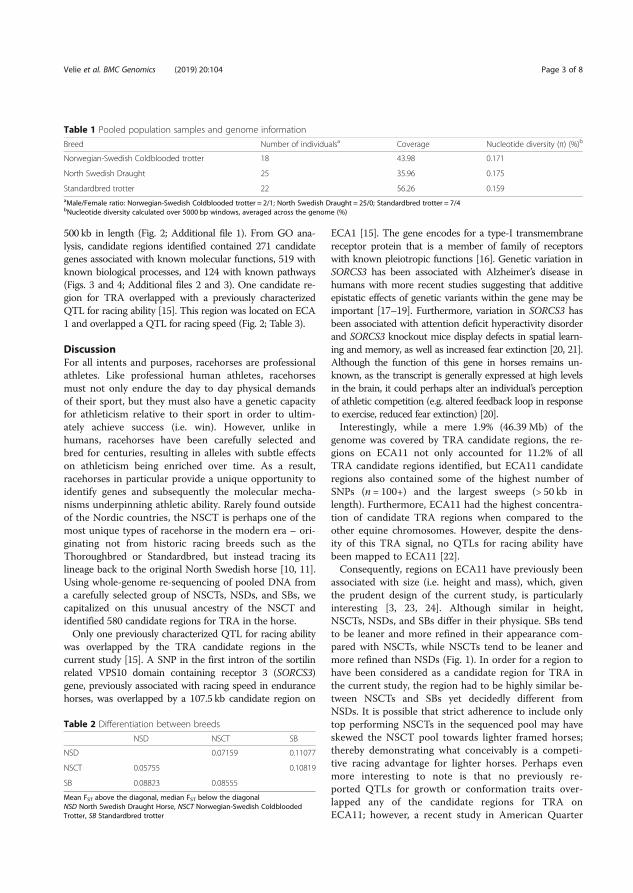
500 kb in length (Fig. 2; Additional file 1). From GO ana-lysis, candidate regions identified contained 271 candidategenes associated with known molecular functions, 519 withknown biological processes, and 124 with known pathways(Figs. 3 and 4; Additional files 2 and 3). One candidate re-gion for TRA overlapped with a previously characterizedQTL for racing ability [15]. This region was located on ECA1 and overlapped a QTL for racing speed (Fig. 2; Table 3).
DiscussionFor all intents and purposes, racehorses are professionalathletes. Like professional human athletes, racehorsesmust not only endure the day to day physical demandsof their sport, but they must also have a genetic capacityfor athleticism relative to their sport in order to ultim-ately achieve success (i.e. win). However, unlike inhumans, racehorses have been carefully selected andbred for centuries, resulting in alleles with subtle effectson athleticism being enriched over time. As a result,racehorses in particular provide a unique opportunity toidentify genes and subsequently the molecular mecha-nisms underpinning athletic ability. Rarely found outsideof the Nordic countries, the NSCT is perhaps one of themost unique types of racehorse in the modern era – ori-ginating not from historic racing breeds such as theThoroughbred or Standardbred, but instead tracing itslineage back to the original North Swedish horse [10, 11].Using whole-genome re-sequencing of pooled DNA froma carefully selected group of NSCTs, NSDs, and SBs, wecapitalized on this unusual ancestry of the NSCT andidentified 580 candidate regions for TRA in the horse.Only one previously characterized QTL for racing ability
was overlapped by the TRA candidate regions in thecurrent study [15]. A SNP in the first intron of the sortilinrelated VPS10 domain containing receptor 3 (SORCS3)gene, previously associated with racing speed in endurancehorses, was overlapped by a 107.5 kb candidate region on
ECA1 [15]. The gene encodes for a type-I transmembranereceptor protein that is a member of family of receptorswith known pleiotropic functions [16]. Genetic variation inSORCS3 has been associated with Alzheimer’s disease inhumans with more recent studies suggesting that additiveepistatic effects of genetic variants within the gene may beimportant [17–19]. Furthermore, variation in SORCS3 hasbeen associated with attention deficit hyperactivity disorderand SORCS3 knockout mice display defects in spatial learn-ing and memory, as well as increased fear extinction [20, 21].Although the function of this gene in horses remains un-known, as the transcript is generally expressed at high levelsin the brain, it could perhaps alter an individual’s perceptionof athletic competition (e.g. altered feedback loop in responseto exercise, reduced fear extinction) [20].Interestingly, while a mere 1.9% (46.39Mb) of the
genome was covered by TRA candidate regions, the re-gions on ECA11 not only accounted for 11.2% of allTRA candidate regions identified, but ECA11 candidateregions also contained some of the highest number ofSNPs (n = 100+) and the largest sweeps (> 50 kb inlength). Furthermore, ECA11 had the highest concentra-tion of candidate TRA regions when compared to theother equine chromosomes. However, despite the dens-ity of this TRA signal, no QTLs for racing ability havebeen mapped to ECA11 [22].Consequently, regions on ECA11 have previously been
associated with size (i.e. height and mass), which, giventhe prudent design of the current study, is particularlyinteresting [3, 23, 24]. Although similar in height,NSCTs, NSDs, and SBs differ in their physique. SBs tendto be leaner and more refined in their appearance com-pared with NSCTs, while NSCTs tend to be leaner andmore refined than NSDs (Fig. 1). In order for a region tohave been considered as a candidate region for TRA inthe current study, the region had to be highly similar be-tween NSCTs and SBs yet decidedly different fromNSDs. It is possible that strict adherence to include onlytop performing NSCTs in the sequenced pool may haveskewed the NSCT pool towards lighter framed horses;thereby demonstrating what conceivably is a competi-tive racing advantage for lighter horses. Perhaps evenmore interesting to note is that no previously re-ported QTLs for growth or conformation traits over-lapped any of the candidate regions for TRA onECA11; however, a recent study in American Quarter
Table 1 Pooled population samples and genome information
Breed Number of individualsa Coverage Nucleotide diversity (π) (%)b
Norwegian-Swedish Coldblooded trotter 18 43.98 0.171
North Swedish Draught 25 35.96 0.175
Standardbred trotter 22 56.26 0.159aMale/Female ratio: Norwegian-Swedish Coldblooded trotter = 2/1; North Swedish Draught = 25/0; Standardbred trotter = 7/4bNucleotide diversity calculated over 5000 bp windows, averaged across the genome (%)
Table 2 Differentiation between breeds
NSD NSCT SB
NSD 0.07159 0.11077
NSCT 0.05755 0.10819
SB 0.08823 0.08555
Mean FST above the diagonal, median FST below the diagonalNSD North Swedish Draught Horse, NSCT Norwegian-Swedish ColdbloodedTrotter, SB Standardbred trotter
Velie et al. BMC Genomics (2019) 20:104 Page 3 of 8
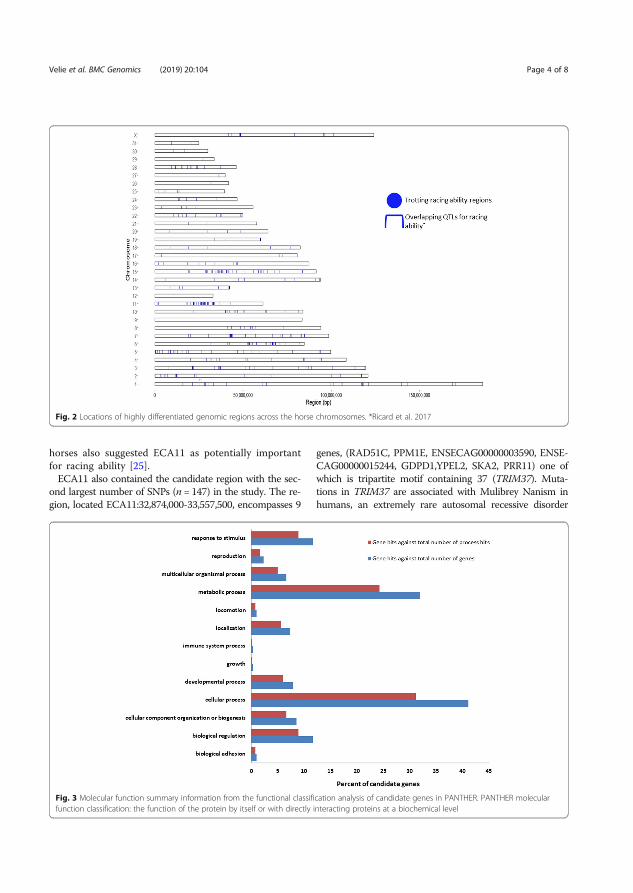
horses also suggested ECA11 as potentially importantfor racing ability [25].ECA11 also contained the candidate region with the sec-
ond largest number of SNPs (n = 147) in the study. The re-gion, located ECA11:32,874,000-33,557,500, encompasses 9
genes, (RAD51C, PPM1E, ENSECAG00000003590, ENSE-CAG00000015244, GDPD1,YPEL2, SKA2, PRR11) one ofwhich is tripartite motif containing 37 (TRIM37). Muta-tions in TRIM37 are associated with Mulibrey Nanism inhumans, an extremely rare autosomal recessive disorder
Fig. 2 Locations of highly differentiated genomic regions across the horse chromosomes. *Ricard et al. 2017
Fig. 3 Molecular function summary information from the functional classification analysis of candidate genes in PANTHER. PANTHER molecularfunction classification: the function of the protein by itself or with directly interacting proteins at a biochemical level
Velie et al. BMC Genomics (2019) 20:104 Page 4 of 8
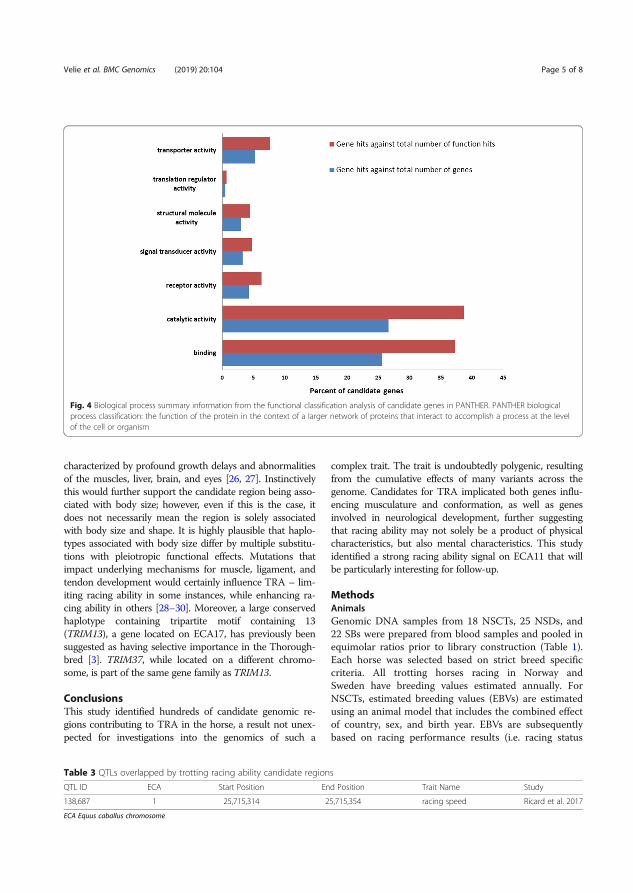
characterized by profound growth delays and abnormalitiesof the muscles, liver, brain, and eyes [26, 27]. Instinctivelythis would further support the candidate region being asso-ciated with body size; however, even if this is the case, itdoes not necessarily mean the region is solely associatedwith body size and shape. It is highly plausible that haplo-types associated with body size differ by multiple substitu-tions with pleiotropic functional effects. Mutations thatimpact underlying mechanisms for muscle, ligament, andtendon development would certainly influence TRA – lim-iting racing ability in some instances, while enhancing ra-cing ability in others [28–30]. Moreover, a large conservedhaplotype containing tripartite motif containing 13(TRIM13), a gene located on ECA17, has previously beensuggested as having selective importance in the Thorough-bred [3]. TRIM37, while located on a different chromo-some, is part of the same gene family as TRIM13.
ConclusionsThis study identified hundreds of candidate genomic re-gions contributing to TRA in the horse, a result not unex-pected for investigations into the genomics of such a
complex trait. The trait is undoubtedly polygenic, resultingfrom the cumulative effects of many variants across thegenome. Candidates for TRA implicated both genes influ-encing musculature and conformation, as well as genesinvolved in neurological development, further suggestingthat racing ability may not solely be a product of physicalcharacteristics, but also mental characteristics. This studyidentified a strong racing ability signal on ECA11 that willbe particularly interesting for follow-up.
MethodsAnimalsGenomic DNA samples from 18 NSCTs, 25 NSDs, and22 SBs were prepared from blood samples and pooled inequimolar ratios prior to library construction (Table 1).Each horse was selected based on strict breed specificcriteria. All trotting horses racing in Norway andSweden have breeding values estimated annually. ForNSCTs, estimated breeding values (EBVs) are estimatedusing an animal model that includes the combined effectof country, sex, and birth year. EBVs are subsequentlybased on racing performance results (i.e. racing status
Fig. 4 Biological process summary information from the functional classification analysis of candidate genes in PANTHER. PANTHER biologicalprocess classification: the function of the protein in the context of a larger network of proteins that interact to accomplish a process at the levelof the cell or organism
Table 3 QTLs overlapped by trotting racing ability candidate regions
QTL ID ECA Start Position End Position Trait Name Study
138,687 1 25,715,314 25,715,354 racing speed Ricard et al. 2017
ECA Equus caballus chromosome
Velie et al. BMC Genomics (2019) 20:104 Page 5 of 8
and earnings) occurring between 3 and 6 years of age[31]. For inclusion in the current study, NSCT horseswere required to have an estimated breeding value of atleast 115 and sire/progeny ratios were restricted to re-flect the larger population as accurately as possible(Additional file 4) [7, 8].For EBVs in SBs, the animal model includes genetic
base group and a combination of sex and birth year withthe evaluation based on racing performance results oc-curring between 2 and 5 years of age [31]. For inclusionin the current study, Standardbreds were also requiredto have estimated breeding values of at least 115 andboth SBs and NSDs were not allowed to have a commonancestor within three generations (i.e. no shared sires,dams, grandsires, granddams) [7, 9]. An EBV require-ment for NSDs was not possible as EBVs are not calcu-lated for this breed.
Pool sequencing, genome alignments, variant calling, andpopulation analysesGenome sequencing library construction and sequencingwas carried out by SciLifeLab (Uppsala, Sweden) usingtwo lanes on the Illumina HiSeq2500 (150 bp paired-end).Sequencing libraries were prepared from 100 ng DNAusing the TruSeq Nano DNA sample preparation kit tar-geting an insert size of 350 bp. Reads were aligned to theEquus caballus genome (EquCab2.70) using BWA(v0.7.15) [32]. Duplicates were marked with Picard(v1.118; http://broadinstitute.github.io/picard/) and GATKwas used for realignment around indels [33]. Samtools(v1.8 [34, 35]) was used to generate the mpileup filesneeded for Popoolation (v1.2.2) and PoPoolation2 (v1.201)[36]. Nucleotide diversity (π) was calculated across 5000bp windows for each population pool using Popoolation[36]. PoPoolation2 was used to calculate FST over 1000 bpsliding windows with 50% overlap between the selectedpopulation samples using the Karlsson et al. method[36, 37]. Minimum count was set at 3, minimum cover-age at 10, maximum coverage at 100, and minimumcoverage fraction at 1.
Differentiated regionsGiven the close relationship between NSCTs and NSDs,candidate regions for athletic traits were defined as gen-omic regions where FST values were relatively high betweenNSCTs and NSDs, but low between NSCTs and SBs. Assuch, stringent FST cutoffs (> 95% percentile, FST = 0.179NSCT vs. NSD; < 5% percentile, FST = 0.013 NSCT vs. SB)were used when defining candidate regions. Windows withFST values that met these criteria were clustered into candi-date sweep regions when they were less than 0.1Mb fromone another (custom R scripts) [38]. Clusters containingonly a single 1000 bp window or less than 2 SNPs were ex-cluded. Candidate gene screening was subsequently carried
out using the bioinformatics database Ensembl (http://www.ensembl.org/). Candidate regions from the FST ana-lyses were used to generate a list of annotated genes usingthe Ensembl Biomart function. The resulting list of candi-date genes was then piped into the PANTHER Classifica-tion system in order to obtain an overview of the molecularfunctions and biological processes affected by the candidategenes [39, 40]. Previously reported racing ability QTLs inthe horse (downloaded from the horse QTL database; [22])were also compared to differentiated regions to determineoverlaps using bed file comparisons in BEDOPS [41].
Additional files
Additional file 1: Summary information for trotting racing abilitycandidate sweep regions. (XLSX 53 kb)
Additional file 2: Functional classification gene list from PANTHERanalysis of trotting racing ability candidate sweep regions. (XLSX 42 kb)
Additional file 3: Pathway summary information from the functionalclassification analysis of trotting racing ability candidate sweep regions.(XLSX 12 kb)
Additional file 4: Pedigree breakdown for the 18 Norwegian-SwedishColdblooded trotters (NSCT) included in the NSCT pool. (XLSX 11 kb)
AbbreviationsEBVs: Estimated breeding values; ECA: Equus caballus chromosome;GDPD1: Glycerophospodiester phosphodiesterase domain containing 1;NSCT: Norwegian-Swedish Coldblooded trotter; NSD: North Swedish Draughthorse; PPM1E: Protein phosphatase Mg2+/Mn2+ dependent 1E;PRR11: Proline rich 11; RAD51C: RAD51 paralog C; SB: Standardbred trotter;SKA2: Spindle and kinetochore associated complex subunit 2;SORCS3: Sortilin related VPS10 domain containing receptor 3; TRA: Trottingracing ability; TRIM13: Tripartite motif containing 13; TRIM37: Tripartite motifcontaining 37; YPEL2: Yippee like 2
AcknowledgementsWe want to thank Christina Olsson, Annica Edberg, Knut Larsen, ThorvaldurÁrnason, the Swedish Trotting Association, and the Norwegian TrottingAssociation for providing their support and the data/samples for the study.Sequencing was performed by the SNP&SEQ Technology Platform in Uppsala.The facility is part of the National Genomics Infrastructure (NGI) Sweden andScience for Life Laboratory. The SNP&SEQ Platform is also supported by theSwedish Research Council and the Knut and Alice Wallenberg Foundation.
FundingThis work was supported by the Swedish Research Council for Environment,Agricultural Science and Spatial Planning (Formas), 2016–00947, (GL).www.formas.se. The funders had no role in study design, data collection andanalysis, decision to publish, or preparation of the manuscript.
Availability of data and materialsThe data that support the findings of this study are available from theSwedish Trotting Association (Stockholm, Sweden) and the NorwegianTrotting Association (Oslo, Norway), but restrictions apply to the availabilityof these data, which were used under license for the current study, and soare not publicly available. However, data are available from the authors uponreasonable request and with permission of the Swedish Trotting Association(Stockholm, Sweden) and the Norwegian Trotting Association (Oslo, Norway).
Authors’ contributionsBDV, KJF, and GL conceived and designed the experiments; BDV, KJF, MKR, MW,and ES contributed to sampling. GL and ES contributed the reagents and KJF andMKR extracted the DNA; BDV and ML analyzed the data and drafted themanuscript; KJF, MKR, MW, ES, MS, CFI, ML, and GL discussed and contributed todata analysis; All authors read and approved the final manuscript.
Velie et al. BMC Genomics (2019) 20:104 Page 6 of 8
Ethics approval and consent to participateAll experimental procedures and sample collection methods were approvedby the Ethics Committee for Animal Experiments in Uppsala, Sweden[Number: C 121/14]. Samples used in the study were already available ateither the Animal Genetics Laboratory at SLU in Uppsala, Sweden or theDepartment of Basic Sciences and Aquatic Medicine at the NorwegianUniversity of Life Sciences in Oslo, Norway as they previously had been usedfor parentage testing. Permission to use the samples was granted from theSwedish Trotting Association and the Norwegian Trotting Association (theowners of the samples per the rules/guidelines of the industry).
Consent for publicationNot applicable.
Competing interestsThe authors have the following interest: GL is a co-inventor on a granted pa-tent concerning commercial testing of the DMRT3 mutation: A method topredict the pattern of locomotion in horses. PCT EP 12747875.8. Europeanpatent registration date: 2011-05-05, US patent registration date: 2011-08-03.There are no further patents, products in development, or marketed productsto declare.
Publisher’s NoteSpringer Nature remains neutral with regard to jurisdictional claims inpublished maps and institutional affiliations.
Author details1Department of Animal Breeding and Genetics, Swedish University ofAgricultural Sciences, Uppsala, Sweden. 2School of Life and EnvironmentalSciences, University of Sydney, Sydney, Australia. 3Department of Biologicaland Environmental Sciences, University of Gothenburg, Gothenburg, Sweden.4Department of Ecology and Genetics, Uppsala University, Uppsala, Sweden.5Department of Clinical Sciences, Swedish University of Agricultural Sciences,Uppsala, Sweden. 6Department of Companion Animal Clinical Sciences,Norwegian University of Life Sciences, Oslo, Norway. 7Livestock Genetics,Department of Biosystems, KU Leuven, Leuven, Belgium.
Received: 19 September 2018 Accepted: 28 January 2019
References1. Meadows JRS, Lindblad-Toh K. Dissecting evolution and disease using
comparative vertebrate genomics. Nat Rev Genet. 2017;18:624–36.2. Andersson L. Domestic animals as models for biomedical research. Ups J
Med Sci. 2016;121:1–11.3. Petersen JL, Mickelson JR, Rendahl AK, Valberg SJ, Andersson LS, Axelsson J,
et al. Genome-wide analysis reveals selection for important traits indomestic horse breeds. PLoS Genet. 2013;9:e1003211.
4. Andersson L. How selective sweeps in domestic animals provide newinsight into biological mechanisms. J Intern Med. 2012;271:1–14.
5. Andersson LS, Larhammar M, Memic F, Wootz H, Schwochow D, Rubin CJ,et al. Mutations in DMRT3 affect locomotion in horses and spinal circuitfunction in mice. Nature. 2012;30:642–6.
6. Petersen JL, Mickelson JR, Cothran EG, Andersson LS, Axelsson J, Bailey E, etal. Genetic diversity in the modern horse illustrated from genome-wide SNPdata. PLoS One. 2013;8:e54997.
7. Svensk Travsport:Uppfödning. https://www.travsport.se/artikel/uppfodning(2018). Accessed 31 Aug 2018.
8. Det Norske Travselskap: Næring og Avl. https://www.travsport.no (2018).Accessed 31 Aug 2018.
9. Föreningen Nordsvenska Hästen. http://www.nordsvensken.org/ (2018).Accessed 31 Aug 2018.
10. Jäderkvist Fegraeus K, Velie BD, Axelsson J, Ang R, Hamilton NA, AnderssonL, et al. A potential regulatory region near the EDN3 gene may control bothharness racing performance and coat color variation in horses. Physiol Rep.2018;6:e13700.
11. Bohin O, Rönningen K. Inbreeding and relationship within the north-Swedishhorse. Acta Agric Scand. 1975;25:121–5.
12. Árnason T. Trends and asymptotic limits for racing speed in Standardbredtrotters. Livest Prod Sci. 2001;72:135–45.
13. Árnason T, Bendroth M, Philipsson J, Henriksson K, Darenius A. Geneticevaluations of Swedish trotters-state of breeding evaluation in trotters.Proceedings of the European Federation of Animal Science symposiumof the commission on horse production. Wageningen, the Netherlands:Pudoc; 1989. p. 106–29.
14. Pedigree Online All Breed Database. https://www.allbreedpedigree.com/(2018). Accessed 31 Aug 2018.
15. Ricard A, Robert C, Blouin C, Baste F, Torquet G, Morgenthaler C, Riviére J,Mach N, Mata X, Schibler L, Barrey E. Endurance exercise ability in thehorses: a trait with complex polygenic determinism. Front Genet. 2017;8:89.
16. Hermey G. The Vps10p-domain receptor family. Cell Mol Life Sci. 2009;66:2677–89.
17. Reitz C, Tosto G, Vardarajan B, Rogaeva E, Ghani M, Rogers RS, et al.Independent and epistatic effects of variants in VPS10-d receptors onAlzheimer disease risk and processing of the amyloid precursor protein(APP). Transl Psychiatry. 2013;3:e256.
18. Reitz C. The role of the retromer complex in aging-relatedneurodegeneration: a molecular and genomic review. Mol Gen Genomics.2015;290:413–27.
19. Binzer S, Stenager E, Binzer M, Kyvik KO, Hillert J, Imrell K. Genetic analysis ofthe isolated Faroe Islands reveals SORCS3 as a potential multiple sclerosisrisk gene. Mult Scler. 2016;22:733–40.
20. Breiderhoff T, Christiansen GB, Pallesen LT, Vaegter C, Nykjaer A, Holm MM,et al. Sortilin-related receptor SORCS3 is a postsynaptic modulator ofsynaptic depression and fear extinction. PLoS One. 2013;8:e75006.
21. Lionel AC, Crosbie J, Barbosa N, Goodale T, Thiruvahindrapuram B, Rickaby J,et al. Rare copy number variation discovery and cross-disorder comparisonsidentify risk genes for ADHD. Sci Transl Med. 2011;3:95ra75.
22. Hu Z, Park CA, Reecy JM. Developmental progress and current status of theanimal QTLdb. Nucleic Acids Res. 2016;44:D827–33.
23. Frischknecht M, Jagannathan V, Plattet P, Neuditschko M, Signer-Hasler H,Bachmann I, et al. A non-synonymous HMGA2 variant decreases height inShetland ponies and other small horses. PLoS One. 2015;10:e0140749.
24. Metzger J, Schrimpf R, Philipp U, Distl O. Expression levels of LCORL areassociated with body size in horses. PLoS One. 2013;8:e56497.
25. Avila F, Mickelson JR, Schaefer RJ, McCue ME. Genome-wide signatures ofselection reveal genes associated with performance in American quarterhorse subpopulations. Front Genet. 2018;9:249.
26. Tang SL, Gao YL, Wen-Zhong H. Knowdown of TRIM37 suppresses theproliferation, migration and invasion of glioma cells through the inactivation ofPI3K/Akt signaling pathway. Biomed Pharmacother. 2018;99:59–64.
27. Jobic F, Morin G, Vincent-Delorme C, Cadet E, Cabry R, Mathieu-Dramard M,et al. New intragenic rearrangements in non-Finnish mulibrey nanism.Am J Med Genet A. 2017;173:2782–8.
28. Mosher DS, Quigon P, Bustamante CD, Sutter NB, Mellersh CS, Parker HG,Ostrander EA. A mutation in the myostatin gene increases muscle mass andenhances racing performance in heterozygote dogs. PLoS Genet. 2007;3:e79.
29. Hill EW, McGivney BA, Gu J, Whiston R, MacHugh DE. A genome-wide SNP-association study confirms a sequence variant (g.66493737C>T) in theequine myostatin (MSTN) gene as the most powerful predictor of optimumracing distance for thoroughbred racehorses. BMC Genomics. 2010;11:552.
30. McGivney BA, Browne JA, Fonseca RG, Katz LM, MacHugh DE, Whiston R,Hill EW. MSTN genotypes in thoroughbred horses influence skeletal musclegene expression and racetrack performance. Anim Genet. 2012;43:810–2.
31. Árnason T. Genetic evaluation of Swedish Standardbred trotters for racingperformance traits and racing status. J Anim Breed Genet. 1999;116:387–98.
32. Li H, Durbin R. Fast and accurate short read alignment with burrows-wheeler transform. Bioinformatics. 2009;25:1754–60.
33. McKenna A, Hanna M, Banks E, Sivachenko A, Cibulskis K, Kernytsky A, et al.The genome analysis toolkit: a MapReduce framework for analyzingnext-generation DNA sequencing data. Genome Res. 2010;20:1297–303.
34. Li H, Handsaker B, Wysoker A, Fennell T, Ruan J, Homer N, et al. Genomeproject data P: the sequence alignment/map format and SAMtools.Bioinformatics. 2009;25:2078–9.
35. Li H. A statistical framework for SNP calling, mutation discovery, associationmapping and population genetical parameter estimation from sequencingdata. Bioinformatics. 2011;27:2987–93.
36. Kofler R, Orozco-terWengel P, De Maio N, Pandey RV, Nolte V,Futschik A, et al. PoPoolation: a toolbox for population geneticanalysis of next generation sequencing data from pooled individuals.PLoS One. 2011;6:e15925.
Velie et al. BMC Genomics (2019) 20:104 Page 7 of 8
37. Karlsson EK, Baranowska I, Wade CM, Salmon Hillbertz NHC, Zody MC,Anderson N, et al. Efficient mapping of mendelian traits in dogs throughgenome-wide association. Nat Genet. 2007;39:1321–8.
38. R Development Core Team: R-A Language and Environment for StatisticalComputing. https://www.r-project.org/. (2018). Accessed 13 Jan 2018.
39. Thomas PD, Campbell MJ, Kejariwal A, Mi HY, Karlak B, Daverman R, et al.PANTHER: a library of protein families and subfamilies indexed by function.Genome Res. 2003;13:2129–41.
40. Mi H, Poudel S, Muruganujan A, Casagrande JT, Thomas PD. PANTHERversion 10: expanded protein families and functions, and analysis tools.Nucleic Acids Res. 2016;44:D336–42.
41. Neph S, Kuehn MS, Reynolds AP, Haugen E, Thurman RE, Johnson AK, et al.BEDOPS: high-performance genomic feature operations. Bioinformatics.2012;28:1919–20.
Velie et al. BMC Genomics (2019) 20:104 Page 8 of 8

ΙII

RESEARCH ARTICLE Open Access
A genome-wide association study forharness racing success in the Norwegian-Swedish coldblooded trotter reveals genesfor learning and energy metabolismBrandon D. Velie1* , Kim Jäderkvist Fegraeus1, Marina Solé1, Maria K. Rosengren1, Knut H. Røed2,Carl-Fredrik Ihler3, Eric Strand3 and Gabriella Lindgren1,4
Abstract
Background: Although harness racing is of high economic importance to the global equine industry, significantgenomic resources have yet to be applied to mapping harness racing success. To identify genomic regionsassociated with harness racing success, the current study performs genome-wide association analyses with threeracing performance traits in the Norwegian-Swedish Coldblooded Trotter using the 670 K Axiom EquineGenotyping Array.
Results: Following quality control, 613 horses and 359,635 SNPs were retained for further analysis. After strictBonferroni correction, nine genome-wide significant SNPs were identified for career earnings. No genome-widesignificant SNPs were identified for number of gallops or best km time. However, four suggestive genome-widesignificant SNPs were identified for number of gallops, while 19 were identified for best km time. Multiple genesrelated to intelligence, energy metabolism, and immune function were identified as potential candidate genes forharness racing success.
Conclusions: Apart from the physiological requirements needed for a harness racing horse to be successful, theresults of the current study also advocate learning ability and memory as important elements for harness racingsuccess. Further exploration into the mental capacity required for a horse to achieve racing success is likely warranted.
Keywords: Genetic, Horse, Performance, Racehorse
BackgroundRegardless of horseracing discipline, speed, or perhapsmore appropriately, unparalleled speed, is the “holygrail” of almost every horse owner, trainer, and breeder.However, speed alone does not necessarily equate tosuccess on the racecourse. The manner in which a horsedemonstrates speed is critical to its racing success [1–3].For example, while the ability to gallop fast may result ina champion Thoroughbred (TB) or Quarter Horse (QH),the same ability in a Standardbred (SB) or ColdbloodedTrotter (CT) is of little value. In SB and CT racing, horses
undoubtedly require speed, but galloping, a four-beat gait,results in disqualification [1–3]. Thus, speed in thesebreeds must be demonstrated at trot, a contralateraltwo-beat gait, or pace, an ipsilateral two-beat gait [1–4].Consequently, racing success in SBs, CTs, and other har-ness racing breeds depends not on an individual’s capacityfor speed, but on an individual’s capacity for speed in aspecific gait.To date, significant genomic resources have been ap-
plied in studies attempting to map speed and racing suc-cess in TBs and QHs [4–18]. While these studies haveproven to be of great value for gallop racing breeds, theirapplicability to harness racing breeds has been limited[19–21]. In fact, a genomic study exploring locomotionpattern in Icelandic horses is arguably the most influential
* Correspondence: [email protected] of Animal Breeding & Genetics, Swedish University ofAgricultural Sciences, Uppsala, SwedenFull list of author information is available at the end of the article
© The Author(s). 2018 Open Access This article is distributed under the terms of the Creative Commons Attribution 4.0International License (http://creativecommons.org/licenses/by/4.0/), which permits unrestricted use, distribution, andreproduction in any medium, provided you give appropriate credit to the original author(s) and the source, provide a link tothe Creative Commons license, and indicate if changes were made. The Creative Commons Public Domain Dedication waiver(http://creativecommons.org/publicdomain/zero/1.0/) applies to the data made available in this article, unless otherwise stated.
Velie et al. BMC Genetics (2018) 19:80 https://doi.org/10.1186/s12863-018-0670-3
study to date when it comes to racing success in harnessracing breeds [22]. The study discovered that a prematurestop codon in the doublesex and mab-3 related transcrip-tion factor 3 (DMRT3) gene had a major effect on the pat-tern of locomotion in the horse, resulting in some horsespossessing the ability to trot or pace at high speed withouttransitioning into gallop [22]. Follow-up studies were thenable to demonstrate that for many harness racing breedsthe DMRT3 mutation was associated with racing success(e.g. increased earned prize money) [20, 23–26]. However,the mutation appears to only account for between 0 and6.3% of the phenotypic variation in traits widely used toevaluate racing success [24, 26]. Considering that herit-ability estimates for some of these traits are as high as 0.38,the likelihood of other genes playing a significant role in aharness racing horse’s success is high [20, 23, 27–38].Nevertheless, genome-wide association (GWA) studieswith harness racing performance are lacking [23].Despite the fact that harness racing success is of high
economic importance to the global equine industry, gen-ome scans for performance appear to predominantly tar-get Thoroughbreds and sport horses (e.g. Warmbloods)[4–6, 8–14, 39–41]. Most studies involving harness ra-cing breeds tend to focus on detecting genes underlyingcertain conditions and diseases [42–47]. While diseasestudies are undoubtedly important for improved animalwell-being, a greater awareness of the genes, and by ex-tension the underlying biological mechanisms, involvedin racing success are also likely to prove highly valuable.A deeper understanding of the biology underpinningsuccess in a racehorse ultimately can lead to more tar-geted medical treatments as well as a heightened aware-ness of the physical limitations (e.g. lack of speed at trot)some horses will inevitably possess.Motivated by these facts, we conducted a GWA study
to identify genomic regions and genes associated withharness racing success using the Norwegian-SwedishColdblooded Trotter (NSCT). Norwegian-Swedish Cold-blooded Trotters are ideally suited for GWA analyses ofharness racing performance as their small population isnot only likely to correspond with low within breed gen-etic variation, but the limited region in which NSCTsare eligible to race is also likely to reduce environmentalvariation. Thus, a more accurate assessment of the rela-tionship between genomic regions and harness racingperformance is achievable.
MethodsData collectionPedigree information and performance data on all racedand unraced NSCTs born between 1 January 2000 and31 December 2009 were provided by the trotting associ-ations in both Norway and Sweden (Norsk Rikstoto andSvensk Travsport). Pedigree information included horse
name, horse id, date of birth, country of birth, sex,breeder, sire id, and dam id. Performance data, as of 8February 2017, was presented per race per horse (i.e.data included individual race records with each recordcorresponding to a given horse’s specific performance inthe race). This data included non-competitive premieand qualification races, with each record containing in-formation on horse id, race date, race track, race type,race distance, trainer, owner, driver, finish position, prizemoney earned, gallop status, and average km time [48, 49].
Sample acquisitionIn order to reflect the raced population as accurately aspossible, a list of raced individuals was randomly gener-ated from the data described above using the statisticalsoftware R [50]. In addition to having raced, two require-ments were set for inclusion in the study: 1. Hair and/orblood samples had to be readily accessible from thepedigree registration authorities in either Norway (De-partment of Basic Sciences and Aquatic Medicine, Nor-wegian University of Life Sciences) or Sweden (AnimalGenetics Laboratory, Swedish University of AgriculturalSciences) 2. Sufficient sample material had to be avail-able to ensure DNA quality standards would likely beachieved. The first 661 horses on the list that met thesecriteria were included in the study. Average relatednesswithin the selected group, estimated using the geneticsoftware Contribution, Inbreeding, Coancestry, was 0.16(interquartile range [IQR] 0.11–0.18) [51].
DNA isolationDeoxyribonucleic acid was prepared from the hair rootsusing a standard hair-preparation procedure. Briefly,186 μL Chelex 100 Resin (Bio-Rad Laboratories, Hercules,CA) and 14 μL of proteinase K (20 mg/mL; Merck KgaA,Darmstadt, Germany) were added to the sample. The mixwas incubated at 56 °C for 2 h and the proteinase K wasinactivated for 10 min at 95 °C. For DNA preparationfrom blood samples, 350 μL of blood was used and iso-lated on the Qiasymphony instrument using the Qia-symphony DSP DNA mini kit (Qiagen, Hilden, Germany).A summary of the final horses selected for genotyping isshown in Table 1.
Genotyping and quality controlPrior to quality control (QC) the data set consisted ofindividuals genotyped using the 670 K Axiom EquineGenotyping Array (n = 570) and the 670 K+ AxiomEquine Genotyping Array (n = 91). The data from thetwo arrays were subsequently merged based on SNPname, chromosome, and position, yielding a combinedSNP data set of 611,888 SNPs for 661 horses. IterativeQC was then performed with the GenABEL package inR to remove poorly genotyped and noisy data using the
Velie et al. BMC Genetics (2018) 19:80 Page 2 of 13
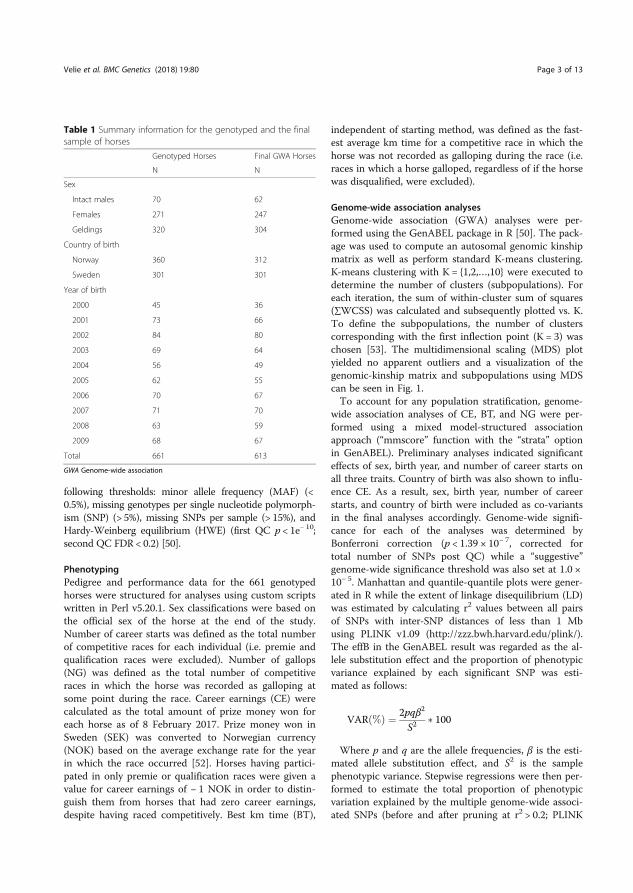
following thresholds: minor allele frequency (MAF) (<0.5%), missing genotypes per single nucleotide polymorph-ism (SNP) (> 5%), missing SNPs per sample (> 15%), andHardy-Weinberg equilibrium (HWE) (first QC p < 1e− 10;second QC FDR < 0.2) [50].
PhenotypingPedigree and performance data for the 661 genotypedhorses were structured for analyses using custom scriptswritten in Perl v5.20.1. Sex classifications were based onthe official sex of the horse at the end of the study.Number of career starts was defined as the total numberof competitive races for each individual (i.e. premie andqualification races were excluded). Number of gallops(NG) was defined as the total number of competitiveraces in which the horse was recorded as galloping atsome point during the race. Career earnings (CE) werecalculated as the total amount of prize money won foreach horse as of 8 February 2017. Prize money won inSweden (SEK) was converted to Norwegian currency(NOK) based on the average exchange rate for the yearin which the race occurred [52]. Horses having partici-pated in only premie or qualification races were given avalue for career earnings of − 1 NOK in order to distin-guish them from horses that had zero career earnings,despite having raced competitively. Best km time (BT),
independent of starting method, was defined as the fast-est average km time for a competitive race in which thehorse was not recorded as galloping during the race (i.e.races in which a horse galloped, regardless of if the horsewas disqualified, were excluded).
Genome-wide association analysesGenome-wide association (GWA) analyses were per-formed using the GenABEL package in R [50]. The pack-age was used to compute an autosomal genomic kinshipmatrix as well as perform standard K-means clustering.K-means clustering with K = {1,2,…,10} were executed todetermine the number of clusters (subpopulations). Foreach iteration, the sum of within-cluster sum of squares(∑WCSS) was calculated and subsequently plotted vs. K.To define the subpopulations, the number of clusterscorresponding with the first inflection point (K = 3) waschosen [53]. The multidimensional scaling (MDS) plotyielded no apparent outliers and a visualization of thegenomic-kinship matrix and subpopulations using MDScan be seen in Fig. 1.To account for any population stratification, genome-
wide association analyses of CE, BT, and NG were per-formed using a mixed model-structured associationapproach (“mmscore” function with the “strata” optionin GenABEL). Preliminary analyses indicated significanteffects of sex, birth year, and number of career starts onall three traits. Country of birth was also shown to influ-ence CE. As a result, sex, birth year, number of careerstarts, and country of birth were included as co-variantsin the final analyses accordingly. Genome-wide signifi-cance for each of the analyses was determined byBonferroni correction (p < 1.39 × 10− 7, corrected fortotal number of SNPs post QC) while a “suggestive”genome-wide significance threshold was also set at 1.0 ×10− 5. Manhattan and quantile-quantile plots were gener-ated in R while the extent of linkage disequilibrium (LD)was estimated by calculating r2 values between all pairsof SNPs with inter-SNP distances of less than 1 Mbusing PLINK v1.09 (http://zzz.bwh.harvard.edu/plink/).The effB in the GenABEL result was regarded as the al-lele substitution effect and the proportion of phenotypicvariance explained by each significant SNP was esti-mated as follows:
VAR %ð Þ ¼ 2pqβ2
S2� 100
Where p and q are the allele frequencies, β is the esti-mated allele substitution effect, and S2 is the samplephenotypic variance. Stepwise regressions were then per-formed to estimate the total proportion of phenotypicvariation explained by the multiple genome-wide associ-ated SNPs (before and after pruning at r2 > 0.2; PLINK
Table 1 Summary information for the genotyped and the finalsample of horses
Genotyped Horses Final GWA Horses
N N
Sex
Intact males 70 62
Females 271 247
Geldings 320 304
Country of birth
Norway 360 312
Sweden 301 301
Year of birth
2000 45 36
2001 73 66
2002 84 80
2003 69 64
2004 56 49
2005 62 55
2006 70 67
2007 71 70
2008 63 59
2009 68 67
Total 661 613
GWA Genome-wide association
Velie et al. BMC Genetics (2018) 19:80 Page 3 of 13
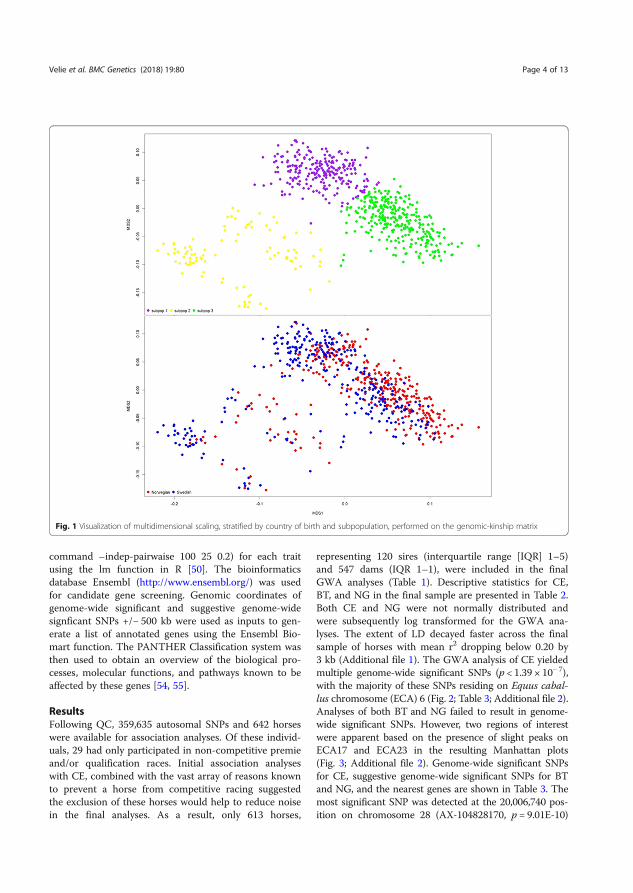
command –indep-pairwaise 100 25 0.2) for each traitusing the lm function in R [50]. The bioinformaticsdatabase Ensembl (http://www.ensembl.org/) was usedfor candidate gene screening. Genomic coordinates ofgenome-wide significant and suggestive genome-widesignficant SNPs +/− 500 kb were used as inputs to gen-erate a list of annotated genes using the Ensembl Bio-mart function. The PANTHER Classification system wasthen used to obtain an overview of the biological pro-cesses, molecular functions, and pathways known to beaffected by these genes [54, 55].
ResultsFollowing QC, 359,635 autosomal SNPs and 642 horseswere available for association analyses. Of these individ-uals, 29 had only participated in non-competitive premieand/or qualification races. Initial association analyseswith CE, combined with the vast array of reasons knownto prevent a horse from competitive racing suggestedthe exclusion of these horses would help to reduce noisein the final analyses. As a result, only 613 horses,
representing 120 sires (interquartile range [IQR] 1–5)and 547 dams (IQR 1–1), were included in the finalGWA analyses (Table 1). Descriptive statistics for CE,BT, and NG in the final sample are presented in Table 2.Both CE and NG were not normally distributed andwere subsequently log transformed for the GWA ana-lyses. The extent of LD decayed faster across the finalsample of horses with mean r2 dropping below 0.20 by3 kb (Additional file 1). The GWA analysis of CE yieldedmultiple genome-wide significant SNPs (p < 1.39 × 10− 7),with the majority of these SNPs residing on Equus cabal-lus chromosome (ECA) 6 (Fig. 2; Table 3; Additional file 2).Analyses of both BT and NG failed to result in genome-wide significant SNPs. However, two regions of interestwere apparent based on the presence of slight peaks onECA17 and ECA23 in the resulting Manhattan plots(Fig. 3; Additional file 2). Genome-wide significant SNPsfor CE, suggestive genome-wide significant SNPs for BTand NG, and the nearest genes are shown in Table 3. Themost significant SNP was detected at the 20,006,740 pos-ition on chromosome 28 (AX-104828170, p = 9.01E-10)
Fig. 1 Visualization of multidimensional scaling, stratified by country of birth and subpopulation, performed on the genomic-kinship matrix
Velie et al. BMC Genetics (2018) 19:80 Page 4 of 13
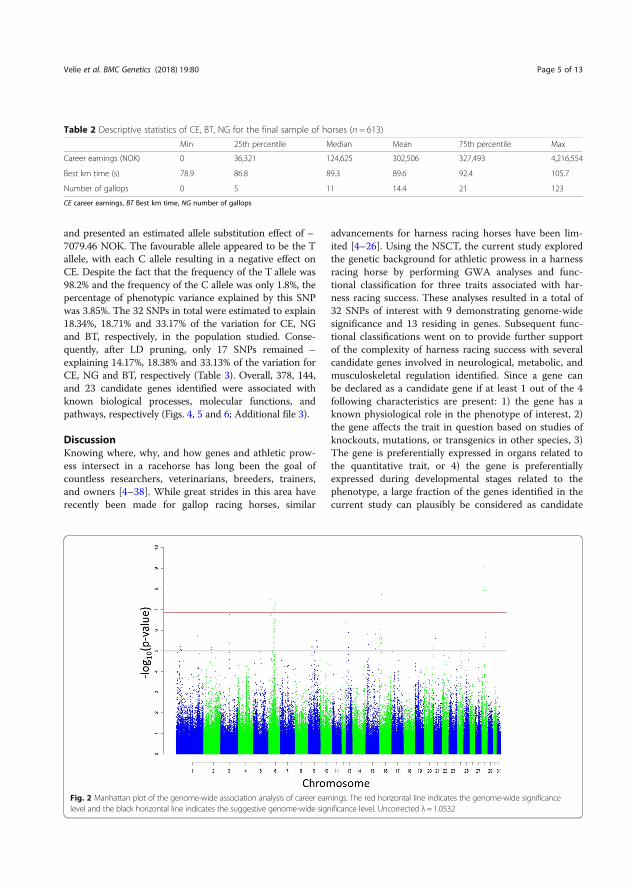
and presented an estimated allele substitution effect of −7079.46 NOK. The favourable allele appeared to be the Tallele, with each C allele resulting in a negative effect onCE. Despite the fact that the frequency of the T allele was98.2% and the frequency of the C allele was only 1.8%, thepercentage of phenotypic variance explained by this SNPwas 3.85%. The 32 SNPs in total were estimated to explain18.34%, 18.71% and 33.17% of the variation for CE, NGand BT, respectively, in the population studied. Conse-quently, after LD pruning, only 17 SNPs remained –explaining 14.17%, 18.38% and 33.13% of the variation forCE, NG and BT, respectively (Table 3). Overall, 378, 144,and 23 candidate genes identified were associated withknown biological processes, molecular functions, andpathways, respectively (Figs. 4, 5 and 6; Additional file 3).
DiscussionKnowing where, why, and how genes and athletic prow-ess intersect in a racehorse has long been the goal ofcountless researchers, veterinarians, breeders, trainers,and owners [4–38]. While great strides in this area haverecently been made for gallop racing horses, similar
advancements for harness racing horses have been lim-ited [4–26]. Using the NSCT, the current study exploredthe genetic background for athletic prowess in a harnessracing horse by performing GWA analyses and func-tional classification for three traits associated with har-ness racing success. These analyses resulted in a total of32 SNPs of interest with 9 demonstrating genome-widesignificance and 13 residing in genes. Subsequent func-tional classifications went on to provide further supportof the complexity of harness racing success with severalcandidate genes involved in neurological, metabolic, andmusculoskeletal regulation identified. Since a gene canbe declared as a candidate gene if at least 1 out of the 4following characteristics are present: 1) the gene has aknown physiological role in the phenotype of interest, 2)the gene affects the trait in question based on studies ofknockouts, mutations, or transgenics in other species, 3)The gene is preferentially expressed in organs related tothe quantitative trait, or 4) the gene is preferentiallyexpressed during developmental stages related to thephenotype, a large fraction of the genes identified in thecurrent study can plausibly be considered as candidate
Table 2 Descriptive statistics of CE, BT, NG for the final sample of horses (n = 613)
Min 25th percentile Median Mean 75th percentile Max
Career earnings (NOK) 0 36,321 124,625 302,506 327,493 4,216,554
Best km time (s) 78.9 86.8 89.3 89.6 92.4 105.7
Number of gallops 0 5 11 14.4 21 123
CE career earnings, BT Best km time, NG number of gallops
Fig. 2 Manhattan plot of the genome-wide association analysis of career earnings. The red horizontal line indicates the genome-wide significancelevel and the black horizontal line indicates the suggestive genome-wide significance level. Uncorrected λ = 1.0532
Velie et al. BMC Genetics (2018) 19:80 Page 5 of 13
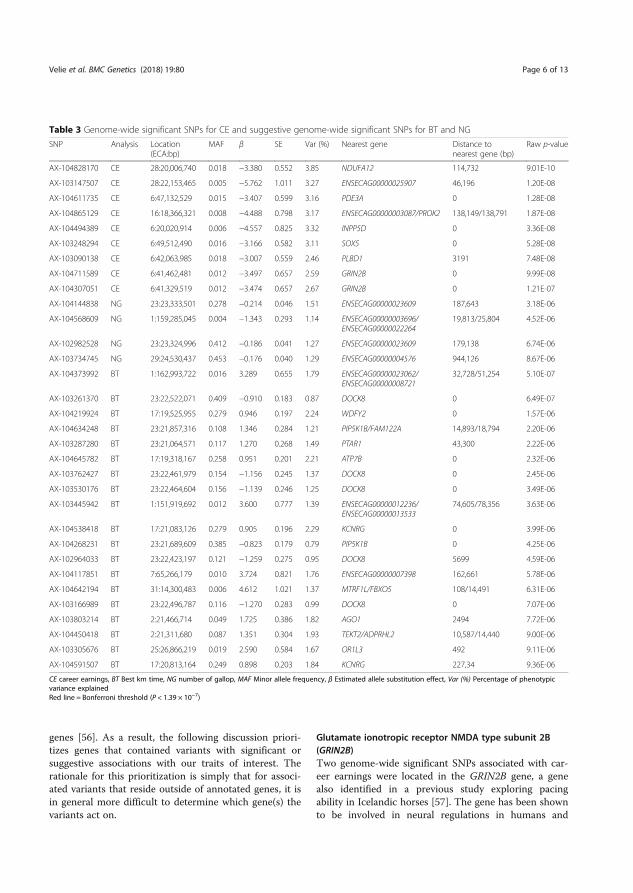
genes [56]. As a result, the following discussion priori-tizes genes that contained variants with significant orsuggestive associations with our traits of interest. Therationale for this prioritization is simply that for associ-ated variants that reside outside of annotated genes, it isin general more difficult to determine which gene(s) thevariants act on.
Glutamate ionotropic receptor NMDA type subunit 2B(GRIN2B)Two genome-wide significant SNPs associated with car-eer earnings were located in the GRIN2B gene, a genealso identified in a previous study exploring pacingability in Icelandic horses [57]. The gene has been shownto be involved in neural regulations in humans and
Table 3 Genome-wide significant SNPs for CE and suggestive genome-wide significant SNPs for BT and NG
SNP Analysis Location(ECA:bp)
MAF β SE Var (%) Nearest gene Distance tonearest gene (bp)
Raw p-value
AX-104828170 CE 28:20,006,740 0.018 −3.380 0.552 3.85 NDUFA12 114,732 9.01E-10
AX-103147507 CE 28:22,153,465 0.005 −5.762 1.011 3.27 ENSECAG00000025907 46,196 1.20E-08
AX-104611735 CE 6:47,132,529 0.015 −3.407 0.599 3.16 PDE3A 0 1.28E-08
AX-104865129 CE 16:18,366,321 0.008 −4.488 0.798 3.17 ENSECAG00000003087/PROK2 138,149/138,791 1.87E-08
AX-104494389 CE 6:20,020,914 0.006 −4.557 0.825 3.32 INPP5D 0 3.36E-08
AX-103248294 CE 6:49,512,490 0.016 −3.166 0.582 3.11 SOX5 0 5.28E-08
AX-103090138 CE 6:42,063,985 0.018 −3.007 0.559 2.46 PLBD1 3191 7.48E-08
AX-104711589 CE 6:41,462,481 0.012 −3.497 0.657 2.59 GRIN2B 0 9.99E-08
AX-104307051 CE 6:41,329,519 0.012 −3.474 0.657 2.67 GRIN2B 0 1.21E-07
AX-104144838 NG 23:23,333,501 0.278 −0.214 0.046 1.51 ENSECAG00000023609 187,643 3.18E-06
AX-104568609 NG 1:159,285,045 0.004 −1.343 0.293 1.14 ENSECAG00000003696/ENSECAG00000022264
19,813/25,804 4.52E-06
AX-102982528 NG 23:23,324,996 0.412 −0.186 0.041 1.27 ENSECAG00000023609 179,138 6.74E-06
AX-103734745 NG 29:24,530,437 0.453 −0.176 0.040 1.29 ENSECAG00000004576 944,126 8.67E-06
AX-104373992 BT 1:162,993,722 0.016 3.289 0.655 1.79 ENSECAG00000023062/ENSECAG00000008721
32,728/51,254 5.10E-07
AX-103261370 BT 23:22,522,071 0.409 −0.910 0.183 0.87 DOCK8 0 6.49E-07
AX-104219924 BT 17:19,525,955 0.279 0.946 0.197 2.24 WDFY2 0 1.57E-06
AX-104634248 BT 23:21,857,316 0.108 1.346 0.284 1.21 PIP5K1B/FAM122A 14,893/18,794 2.20E-06
AX-103287280 BT 23:21,064,571 0.117 1.270 0.268 1.49 PTAR1 43,300 2.22E-06
AX-104645782 BT 17:19,318,167 0.258 0.951 0.201 2.21 ATP7B 0 2.32E-06
AX-103762427 BT 23:22,461,979 0.154 −1.156 0.245 1.37 DOCK8 0 2.45E-06
AX-103530176 BT 23:22,464,604 0.156 −1.139 0.246 1.25 DOCK8 0 3.49E-06
AX-103445942 BT 1:151,919,692 0.012 3.600 0.777 1.39 ENSECAG00000012236/ENSECAG00000013533
74,605/78,356 3.63E-06
AX-104538418 BT 17:21,083,126 0.279 0.905 0.196 2.29 KCNRG 0 3.99E-06
AX-104268231 BT 23:21,689,609 0.385 −0.823 0.179 0.79 PIP5K1B 0 4.25E-06
AX-102964033 BT 23:22,423,197 0.121 −1.259 0.275 0.95 DOCK8 5699 4.59E-06
AX-104117851 BT 7:65,266,179 0.010 3.724 0.821 1.76 ENSECAG00000007398 162,661 5.78E-06
AX-104642194 BT 31:14,300,483 0.006 4.612 1.021 1.37 MTRF1L/FBXO5 108/14,491 6.31E-06
AX-103166989 BT 23:22,496,787 0.116 −1.270 0.283 0.99 DOCK8 0 7.07E-06
AX-103803214 BT 2:21,466,714 0.049 1.725 0.386 1.82 AGO1 2494 7.72E-06
AX-104450418 BT 2:21,311,680 0.087 1.351 0.304 1.93 TEKT2/ADPRHL2 10,587/14,440 9.00E-06
AX-103305676 BT 25:26,866,219 0.019 2.590 0.584 1.67 OR1L3 492 9.11E-06
AX-104591507 BT 17:20,813,164 0.249 0.898 0.203 1.84 KCNRG 227,34 9.36E-06
CE career earnings, BT Best km time, NG number of gallop, MAF Minor allele frequency, β Estimated allele substitution effect, Var (%) Percentage of phenotypicvariance explainedRed line = Bonferroni threshold (P < 1.39 × 10⁻⁷)
Velie et al. BMC Genetics (2018) 19:80 Page 6 of 13
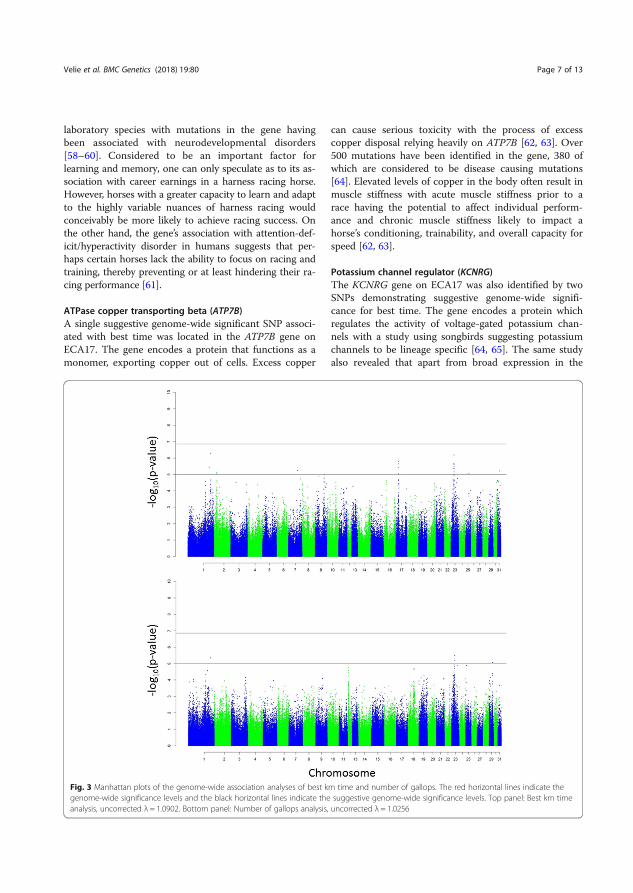
laboratory species with mutations in the gene havingbeen associated with neurodevelopmental disorders[58–60]. Considered to be an important factor forlearning and memory, one can only speculate as to its as-sociation with career earnings in a harness racing horse.However, horses with a greater capacity to learn and adaptto the highly variable nuances of harness racing wouldconceivably be more likely to achieve racing success. Onthe other hand, the gene’s association with attention-def-icit/hyperactivity disorder in humans suggests that per-haps certain horses lack the ability to focus on racing andtraining, thereby preventing or at least hindering their ra-cing performance [61].
ATPase copper transporting beta (ATP7B)A single suggestive genome-wide significant SNP associ-ated with best time was located in the ATP7B gene onECA17. The gene encodes a protein that functions as amonomer, exporting copper out of cells. Excess copper
can cause serious toxicity with the process of excesscopper disposal relying heavily on ATP7B [62, 63]. Over500 mutations have been identified in the gene, 380 ofwhich are considered to be disease causing mutations[64]. Elevated levels of copper in the body often result inmuscle stiffness with acute muscle stiffness prior to arace having the potential to affect individual perform-ance and chronic muscle stiffness likely to impact ahorse’s conditioning, trainability, and overall capacity forspeed [62, 63].
Potassium channel regulator (KCNRG)The KCNRG gene on ECA17 was also identified by twoSNPs demonstrating suggestive genome-wide signifi-cance for best time. The gene encodes a protein whichregulates the activity of voltage-gated potassium chan-nels with a study using songbirds suggesting potassiumchannels to be lineage specific [64, 65]. The same studyalso revealed that apart from broad expression in the
Fig. 3 Manhattan plots of the genome-wide association analyses of best km time and number of gallops. The red horizontal lines indicate thegenome-wide significance levels and the black horizontal lines indicate the suggestive genome-wide significance levels. Top panel: Best km timeanalysis, uncorrected λ = 1.0902. Bottom panel: Number of gallops analysis, uncorrected λ = 1.0256
Velie et al. BMC Genetics (2018) 19:80 Page 7 of 13
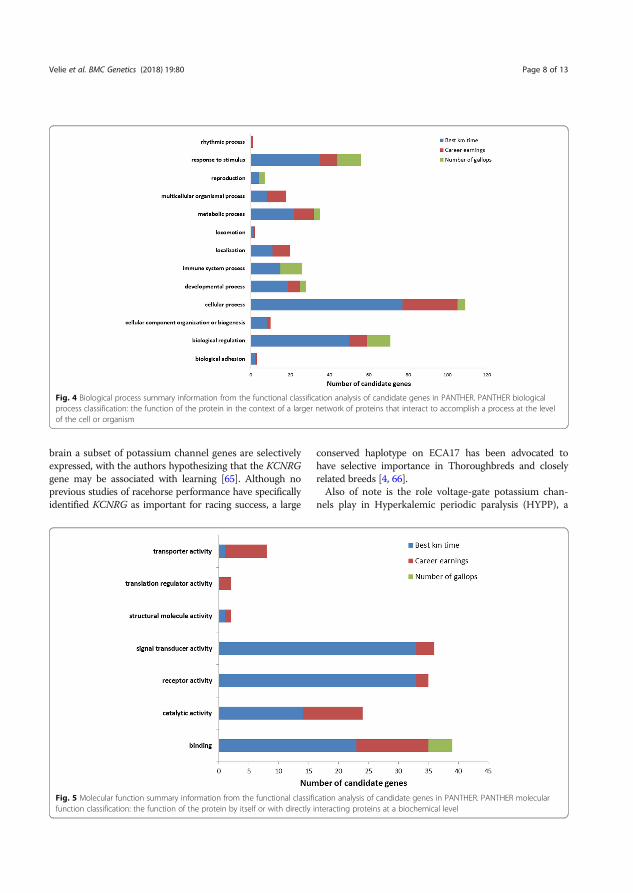
brain a subset of potassium channel genes are selectivelyexpressed, with the authors hypothesizing that the KCNRGgene may be associated with learning [65]. Although noprevious studies of racehorse performance have specificallyidentified KCNRG as important for racing success, a large
conserved haplotype on ECA17 has been advocated tohave selective importance in Thoroughbreds and closelyrelated breeds [4, 66].Also of note is the role voltage-gate potassium chan-
nels play in Hyperkalemic periodic paralysis (HYPP), a
Fig. 4 Biological process summary information from the functional classification analysis of candidate genes in PANTHER. PANTHER biologicalprocess classification: the function of the protein in the context of a larger network of proteins that interact to accomplish a process at the levelof the cell or organism
Fig. 5 Molecular function summary information from the functional classification analysis of candidate genes in PANTHER. PANTHER molecularfunction classification: the function of the protein by itself or with directly interacting proteins at a biochemical level
Velie et al. BMC Genetics (2018) 19:80 Page 8 of 13
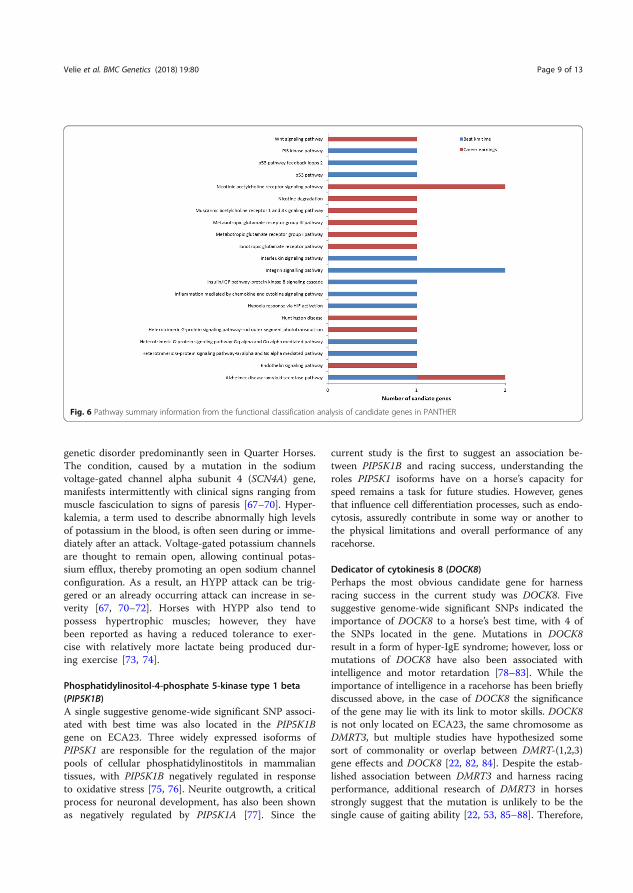
genetic disorder predominantly seen in Quarter Horses.The condition, caused by a mutation in the sodiumvoltage-gated channel alpha subunit 4 (SCN4A) gene,manifests intermittently with clinical signs ranging frommuscle fasciculation to signs of paresis [67–70]. Hyper-kalemia, a term used to describe abnormally high levelsof potassium in the blood, is often seen during or imme-diately after an attack. Voltage-gated potassium channelsare thought to remain open, allowing continual potas-sium efflux, thereby promoting an open sodium channelconfiguration. As a result, an HYPP attack can be trig-gered or an already occurring attack can increase in se-verity [67, 70–72]. Horses with HYPP also tend topossess hypertrophic muscles; however, they havebeen reported as having a reduced tolerance to exer-cise with relatively more lactate being produced dur-ing exercise [73, 74].
Phosphatidylinositol-4-phosphate 5-kinase type 1 beta(PIP5K1B)A single suggestive genome-wide significant SNP associ-ated with best time was also located in the PIP5K1Bgene on ECA23. Three widely expressed isoforms ofPIP5K1 are responsible for the regulation of the majorpools of cellular phosphatidylinostitols in mammaliantissues, with PIP5K1B negatively regulated in responseto oxidative stress [75, 76]. Neurite outgrowth, a criticalprocess for neuronal development, has also been shownas negatively regulated by PIP5K1A [77]. Since the
current study is the first to suggest an association be-tween PIP5K1B and racing success, understanding theroles PIP5K1 isoforms have on a horse’s capacity forspeed remains a task for future studies. However, genesthat influence cell differentiation processes, such as endo-cytosis, assuredly contribute in some way or another tothe physical limitations and overall performance of anyracehorse.
Dedicator of cytokinesis 8 (DOCK8)Perhaps the most obvious candidate gene for harnessracing success in the current study was DOCK8. Fivesuggestive genome-wide significant SNPs indicated theimportance of DOCK8 to a horse’s best time, with 4 ofthe SNPs located in the gene. Mutations in DOCK8result in a form of hyper-IgE syndrome; however, loss ormutations of DOCK8 have also been associated withintelligence and motor retardation [78–83]. While theimportance of intelligence in a racehorse has been brieflydiscussed above, in the case of DOCK8 the significanceof the gene may lie with its link to motor skills. DOCK8is not only located on ECA23, the same chromosome asDMRT3, but multiple studies have hypothesized somesort of commonality or overlap between DMRT-(1,2,3)gene effects and DOCK8 [22, 82, 84]. Despite the estab-lished association between DMRT3 and harness racingperformance, additional research of DMRT3 in horsesstrongly suggest that the mutation is unlikely to be thesingle cause of gaiting ability [22, 53, 85–88]. Therefore,
Fig. 6 Pathway summary information from the functional classification analysis of candidate genes in PANTHER
Velie et al. BMC Genetics (2018) 19:80 Page 9 of 13
it is conceivable that DOCK8 also significantly contrib-utes to gaiting ability, ultimately playing some role in aharness racing horse’s propensity to exhibit speed at trotor pace.
Phosphodiesterase 3A (PDE3A)The protein encoded by the PDE3A gene, a gene onECA6 in which a single genome-wide significant SNPassociated with career earnings is located, plays a criticalrole in cardiovascular function [89–91]. The encodedprotein regulates vascular smooth muscle contractionand relaxation and has been linked to familial hyperten-sion, cardiovascular disease, and fertility [89–92]. Healthycardiovascular function is important for racing success asthe act of racing undeniably requires a higher thanresting-level of oxygen to support the horse’s increasedmuscle activity. A mutation in the PDE3A gene that ultim-ately alters cardiovascular function could potentiallyprevent a horse from meeting the higher metabolic de-mands of racing, thus decreasing his/her chances ofwinning and limiting his/her career earnings. On the con-trary, an advantageous mutation in the gene could allowsome horses to perform at an even greater cardiovascularlevel, increasing their likelihood of winning races andearning more prize money.
Inositol polyphosphate-5-phosphatase D (INPP5D) & SRY-box 5 (SOX5)Also identified by single genome-wide significant SNPson ECA6 were the INPP5D and the SOX5 genes. TheINPP5D gene is an important regulator of immune cellsignaling, while the SOX5 gene is involved in embryonicdevelopment and has been associated with multiple hu-man diseases and disorders [93–99]. Moreover, bothgenes have been suggested as important in B cell activityindicating that their association with career earnings inthe current study may be rooted in the immune responseof a horse [95, 100]. However, mutations in SOX5 havealso been theorized to disrupt neuronal development andfunction [101, 102].
Other candidate genesRegions on ECA1, ECA7, and ECA16 have also previ-ously been described as important for endurance per-formance traits, while regions on ECA14 and ECA18associated with gallop racing in other studies do notappear to play a significant role in harness racing[4–8, 10–15, 19–21, 39, 66]. This likely suggest agreater demand for endurance in harness racingcompared to gallop racing and is perhaps a sign ofthe different physiological demands for speed in trotversus speed in gallop. Candidate genes for harnessracing success in the current study were also identi-fied on ECA1, ECA2, ECA6, ECA7, ECA16, ECA17,
ECA23, ECA25, ECA28, ECA29, and ECA31. How-ever, it is important to note that the MAF thresholdapplied in the current study is slightly lower than isgenerally accepted. Although this may have inadvert-ently resulted in some SNP associations being simplyby chance, it is also plausible that the lower MAFthreshold allowed for the capture of candidate genes/regions that are perhaps the difference between anelite horse and a very, very good horse. Racing per-formance is undoubtedly complex and the uniquehistory of the NSCT, being a blend of draught horseand racehorse, means that rare variants cannot beruled out purely because they are rare – particularlywhen one considers the rarity of an elite racehorse.While not all candidate variants/genes are discussedabove, the results of the current analyses clearlysuggest that different molecular and cellular eventsmediate adaptive processes in the neuromusculoske-letal system in response to exercise. High intensityexercise (e.g. racing) is known to be associated with sig-nificant physiological adaptations in the neuromuscularsystem in equine athletes with prolonged and intense ex-ercise potentially resulting in oxidative damage to cellularconstituents [103]. Moreover, the importance of the cen-tral nervous system (CNS) as a critical “central governing”factor in sporting performance has been previouslydocumented in endurance horses with exercise shown toinduce several biological processes that regulate neuro-logical functions that help to maintain good mental health[104]. Our results add to this line of thought, providingfurther evidence that genes involved in neural regulations(e.g. GRIN2B) likely play an important role in controllingthe fundamental biological processes underlying adapta-tion to equine athletic performance.
ConclusionsAfter strict Bonferroni correction, 9 genome-wide sig-nificant and 23 suggestive genome-wide significant SNPsassociated with harness racing success were identified.These SNPs were located on ECA1, ECA2, ECA6,ECA7, ECA16, ECA17, ECA23, ECA25, ECA28, ECA29,and ECA31 with eight genes (GRIN2B, DOCK8, ATP7B,KCNRG, PIP5K1B, PDE3A, INPP5D, SOX5) suggested asstrong candidate genes for harness racing success. Apartfrom the physical attributes required to achieve racingsuccess, multiple candidate genes identified in thecurrent study also advocate learning ability and memoryas critical to success. However, further analyses of thesegenes based on additional genetic and functionalstudies are required to explore this notion in greaterdetail. Moreover, future studies should also consider avalidation study with an independent population aswell as sequencing of candidate genes to better iden-tify causal alleles.
Velie et al. BMC Genetics (2018) 19:80 Page 10 of 13
Additional files
Additional file 1: Extent of linkage disequilibrium of the final sampleof horses. Pairwise r2 was calculated between each SNP within 1 Mb.(TIFF 15316 kb)
Additional file 2: QQ plots for earnings, best km time, and number ofgallops analyses. Top panel - corrected QQ plot for earnings analysis(Uncorrected λ = 1.0532); Middle panel – corrected QQ plot for best kmtime analysis (λ = 1.0902); Bottom panel – corrected QQ plot for numberof gallops analysis (λ = 1.0256). (TIF 111 kb)
Additional file 3: Functional classification gene list from PANTHERanalysis. (XLSX 27 kb)
AbbreviationsATP7B: ATPase copper transporting beta; BT: Best km time; CE: Careerearnings; CT: Coldblooded trotter; DMRT3: Doublesex and mab-3 relatedtranscription factor 3; DOCK8: Dedicator of cytokinesis; ECA: Equus caballuschromosome; GRIN2B: Glutamate ionotropic receptor NMDA type subunit 2B;GWA: Genome-wide association; INPP5D: Inositol polyphosphate-5-phosphatase D; KCNRG: Potassium channel regulator; NG: Number of gallops;NSCT: Norwegian-Swedish Coldblooded Trotter; PDE3A: Phosphodiesterase3A; PIP5K1B: Phosphatidylinositol-4-phosphate 5-kinase type 1 beta;QH: Quarter horse; SB: Standardbred trotter; SOX5: SRY-box 5;TB: Thoroughbred
AcknowledgementsWe want to thank Christina Olsson, Annica Edberg, Knut Larsen, Chameli LiljaLawrence, Thorvaldur Árnason, the Swedish Trotting Association, and theNorwegian Trotting Association for providing their support and the data/samples for the study.
FundingThis work was supported by the Swedish-Norwegian Foundation for EquineResearch, H-15-47-075, http://hastforskning.se (GL, ES). The funders had norole in study design, data collection and analysis, decision to publish, orpreparation of the manuscript.
Availability of data and materialsThe data that support the findings of this study are available from theSwedish Trotting Association (Stockholm, Sweden) and the NorwegianTrotting Association (Oslo, Norway), but restrictions apply to the availabilityof these data, which were used under license for the current study, and soare not publicly available. However, data are available from the authors uponreasonable request and with permission of the Swedish Trotting Association(Stockholm, Sweden) and the Norwegian Trotting Association (Oslo, Norway).
Authors’ contributionsBDV, KJF, CI, ES, and GL conceived and designed the experiments; KJF, MKR,and KHR contributed to sampling. GL and ES contributed the reagents andMKR extracted the DNA; BDV and MS analyzed the data and drafted themanuscript; KJF, MS, CI, ES, and GL discussed and contributed to dataanalysis; All authors read and approved the final manuscript.
Ethics approval and consent to participateAll experimental procedures and sample collection methods were approvedby the Ethics Committee for Animal Experiments in Uppsala, Sweden[Number: C 121/14]. Samples used in the study were already available ateither the Animal Genetics Laboratory at SLU in Uppsala, Sweden or theDepartment of Basic Sciences and Aquatic Medicine at the NorwegianUniversity of Life Sciences in Oslo, Norway as they previously had been usedfor parentage testing. Permission to use the samples was granted from theSwedish Trotting Association and the Norwegian Trotting Association (theowners of the samples per the rules/guidelines of the industry).
Consent for publicationNot applicable.
Competing interestsThe authors have the following interest: GL is a co-inventor on a granted pa-tent concerning commercial testing of the DMRT3 mutation: A method topredict the pattern of locomotion in horses. PCT EP 12747875.8. Europeanpatent registration date: 2011-05-05, US patent registration date: 2011-08-03.There are no further patents, products in development, or marketed productsto declare.
Publisher’s NoteSpringer Nature remains neutral with regard to jurisdictional claims inpublished maps and institutional affiliations.
Author details1Department of Animal Breeding & Genetics, Swedish University ofAgricultural Sciences, Uppsala, Sweden. 2Department of Basic Sciences andAquatic Medicine, Norwegian University of Life Sciences, Oslo, Norway.3Department of Companion Animal Clinical Sciences, Norwegian School ofVeterinary Science, Oslo, Norway. 4Department of Biosystems, KU Leuven,3001 Leuven, Belgium.
Received: 3 February 2018 Accepted: 20 August 2018
References1. United States Trotting Association. Charter, Bylaws, Rules and regulations. In:
Rule book. United States trotting association. 2018. http://www.ustrotting.com/pdf/USTARuleBook.pdf. Accessed 10 Jan 2018.
2. Harness Racing Australia. Australian harness racing rules. Harness racingAustralia Inc. 2017. http://www.harness.org.au/rules/AHRRules.pdf. Accessed10 Jan 2018.
3. Union Européenne du Trot. International Agreement On Trotting Races.Union Européenne du Trot. 2018. http://www.uet-trot.eu/images/pdf-uet/en/publications/international_agreement_on_trotting_races.pdf. Accessed10 Jan 2018.
4. Petersen JL, Mickelson JR, Rendahl AK, Valberg SJ, Andersson LS, Axelsson J,et al. Genome-wide analysis reveals selection for important traits indomestic horse breeds. PLoS Genet. 2013;9:e1003211.
5. Hill EW, McGivney BA, Gu J, Whiston R, MacHugh DE. A genome-wide SNP-association study confirms a sequence variant (g.66493737C>T) in theequine myostatin (MSTN) gene as the most powerful predictor of optimumracing distance for thoroughbred racehorses. BMC Genomics. 2010;11:552.
6. Petersen JL, Valberg SJ, Mickelson JR, McCue ME. Haplotype diversity in theequine myostatin gene with focus on variants associated with race distancepropensity and muscle fiber type proportions. Anim Genet. 2014;45:827–35.
7. Tozaki T, Hill EW, Hirota K, Kakoi H, Gamahara H, Miyake T, Sugita S,Hasegawa T, Ishida N, Nakano Y, Kurosawa M. A cohort study of racingperformance in Japanese thoroughbred racehorses using genomeinformation on ECA18. Anim Genet. 2011;43:42–52.
8. Shin DH, Lee JW, Park JE, Choi IY, Oh HS, Kim HJ, Kim H. Multiple genesrelated to muscle identified through a joint analysis of a two-stagegenome-wide association study for racing performance of 1,156thoroughbreds. Asian Australas J Anim Sci. 2015;28:771–81.
9. Moon S, Lee JW, Shin D, Shin KY, Kim J, Choi IY, Kim J, Kim H. A genome-wide scan for selective sweeps in racing horses. Asian Australas J Anim Sci.2015;28:1525–31.
10. Tozaki T, Miyake T, Kakoi H, Gawahara H, Sugita S, Hasegawa T, Ishida N,Hirota K, Nakano Y. A genome-wide association study for racingperformances in thoroughbreds clarifies a candidate region near the MSTNgene. Anim Genet. 2010;41:28–35.
11. Hill EW, Gu J, Eivers SS, Fonseca RG, McGivney BA, Govindarajan P, Orr N,Katz LM, MacHugh DE. A sequence polymorphism in MSTN predictssprinting ability and racing stamina in thoroughbred horses. PLoS One.2010;5:e8645.
12. Binns MM, Boehler DA, Lambert DH. Identification of the myostatin locus(MSTN) as having a major effect on optimum racing distance in thethoroughbred horse in the USA. Anim Genet. 2010;41:154–8.
13. Hill EW, Fonseca RG, McGivney BA, Gu J, MacHugh DE, Katz LM. MSTNgenotype (g.66493737C/T) association with speed indices in thoroughbredracehorses. J Appl Physiol. 2012:86–90.
14. Tozaki T, Sato F, Hill EW, Miyake T, Endo Y, Kakoi H, Gawahara H, Hirota K,Nakano Y, Nambo Y, Kurosawa M. Sequence variants at the myostatin gene
Velie et al. BMC Genetics (2018) 19:80 Page 11 of 13
locus influence the body composition of thoroughbred horses. J Vet MedSci. 2011;73:1617–24.
15. McGivney BA, Browne JA, Fonseca RG, Katz LM, MacHugh DE, Whiston R.Hill EW. MSTN genotypes in thoroughbred horses influence skeletal musclegene expression and racetrack performance. Anim Genet. 2012;43:810–2.
16. Gu J, MacHugh DE, McGivney BA, Park SDE, Katz LM, Hill EW. Association ofsequence variants in CKM (creatine kinase, muscle) and COX412(cytochrome c oxidase, subunit 4, isoform 2) genes with racingperformance in thoroughbred horses. Equine Vet J. 2010;42:569–75.
17. Hill EW, Gu J, McGivney BA, MacHugh DE. Targets of selection in thethoroughbred genome contain exercise-relevant gene SNPs associated withelite racecourse performance. Anim Genet. 2010;41:56–63.
18. Meira CT, Fortes MRS, Farah MM, Porto-Neto LR, Kelly M, Moore SS, PereiraGL, Chardulo LAL, Curi RA. Speed index in the racing quarter horse: agenome-wide association study. J Equine Vet Sci. 2014;34:1263–8.
19. Dall’Olio S, Fontanesi L, Nanni Costa L, Tassinari M, Minieri L, Falaschini A.Analysis of horse myostatin gene and identification of single nucleotidepolymorphisms in breeds of different morphological types. J BiomedBiotechnol. 2010;542945.
20. Negro Rama S, Valera M, Membrillo A, Gómez MD, Solé M, Menendez-Buxadera A, Anaya G, Molina A. Quantitative analysis of short- and long-distance racing performance in young and adult horses and associationanalysis with functional candidate genes in Spanish trotter horses. J AnimBreed Genet. 2016;133:347–56.
21. Velie BD, Bas Conn L, Petäjistö K, Røed KH, Ihler CF, Strand E, Fegraeus KJ,Lindgren G. The importance of MSTN for harness racing performance in theNorwegian-Swedish coldblooded trotter and the Finnhorse. Proc 10thWorld Congr Genet Appl Livest Prod. 2018;11:36.
22. Andersson LS, Larhammar M, Memic F, Wootz H, Schwochow D, Rubin CJ,et al. Mutations in DMRT3 affect locomotion in horses and spinal circuitfunction in mice. Nature. 2012;30:642–6.
23. Ricard A. Does heterozygosity at the DMRT3 gene make French trottersbetter racers? Genet Sel Evol. 2015;47:10.
24. Jäderkvist K, Andersson LS, Johansson AM, Arnason T, Mikko S, Eriksson S,Anderson L, Lindgren L. The DMRT3 ‘gait keeper’ mutation affectsperformance of Nordic and Standardbred trotters. J Anim Sci. 2014;92:4279–86.
25. Jäderkvist Fegraeus K, Lawrence C, Petäjistö K, Johansson MK, Wiklund M,Olsson C, Andersson L, Andersson LS, Røed KH, Ihler CF, Strand E, LindgrenG, Velie BD. Lack of significant associations with early career performancesuggest no link between the DMRT3 “gait keeper” mutation and precocityin coldblooded trotters. PLoS One. 2017;12:e01777351.
26. Jäderkvist Fegraeus K, Johansson L, Mäenpää M, Mykkänen A, Andersson LS,Velie BD, Andersson L, Arnason T, Lindgren G. Different DMRT3 genotypesare best adapted for harness racing and riding in Finnhorses. J Hered. 2015;106:734–40.
27. Solé M, Valera M, Gómez MD, Sölkner J, Molina A, Mészáros G. Heritabilityand factors associated with number of harness race starts in the Spanishtrotter horse population. Equine Vet J. 2017;49:288–93.
28. Thiruvenkadan AK, Kandasamy N, Panneerselvam S. Inheritance of racingperformance of trotter horses: an overview. Livest Sci. 2009;124:163–81.
29. Saastamoinen MT, Ojala MJ. Estimates of genetic and phenotypicparameters for racing performance in young trotters. Acta Agr Scand. 1991;41:427–36.
30. Saastamoinen MT, Nylander A. Genetic and phenotypic parameters for ageat starting to race and racing performance during early career in trotters.Livest Prod Sci. 1996;45:63–8.
31. Suontama M, van der Werf JH, Juga J, Ojala M. Genetic parameters forracing records in trotters using linear and generalized linear models. J AnimSci. 2012;90:2921–30.
32. Olsen HF, Klemetsdal G, Odegård J, Arnason T. Validation of alternativemodels in genetic evaluation of racing performance in North Swedish andNorwegian cold-blooded trotters. J Anim Breed Genet. 2012;129:164–70.
33. Gómez MD, Menendez-Buxadera A, Valera M, Molina A. Estimation ofgenetic parameters for racing speed at different distances in young andadult Spanish trotter horses using the random regression model. J AnimBreed Genet. 2010;127:385–94.
34. Thiruvenkadan AK, Kandasamy N, Panneerselvam S. Inheritance of racingperformance of thoroughbred horses. Livest Sci. 2009;121:308–26.
35. Velie BD, Hamilton NA, Wade CM. Heritability of racing performance in theAustralian thoroughbred racing population. Anim Genet. 2015;46:23–9.
36. Tozaki T, Miyake T, Kakoi H, Gawahara H, Hirota K, Nakano Y, Kurosawa M.Heritability estimates for racing performance in Japanese thoroughbredracehorses using linear and non-linear model analyses. J Anim Breed Genet.2012;129:402–8.
37. Velie BD, Hamilton NA, Wade CM. Performance selection for thoroughbredsracing in Hong Kong. Equine Vet J. 2015;47:43–47.
38. Sharman P, Wilson AJ. Racehorses are getting faster. Biol Lett. 2015;11:20150310.
39. Ricard A, Robert C, Blouin C, Baste F, Torquet G, Morgenthaler C, Riviére J,Mach N, Mata X, Schibler L, Barrey E. Endurance exercise ability in thehorses: a trait with complex polygenic determinism. Front Genet. 2017;8:89.
40. Frischnkecht M, Signer-Hasler H, Leeb T, Rieder S, Neuditschko M. Genome-wide association studies based on sequence-derived genotypes reveal newQTL associated with conformation and performance traits in the Franches-Montagnes horse breed. Anim Genet. 2016;47:227–9.
41. Schröder W, Klostermann A, Stock KF, Distl O. A genome-wide associationstudy for quantitative trait loci of show-jumping in Hanoverian warmbloodhorses. Anim Genet. 2012;43:392–400.
42. Lykkjen S, Dolvik NI, McCue ME, Rendahl AK, Mickelson JR, Røed KH. Equinedevelopmental orthopaedic diseases—a genome-wide association study offirst phalanx plantar osteochondral fragments in Standardbred trotters.Anim Genet. 2013;44:766–9.
43. Teyssédre S, Dupuis MC, Guérin G, Schibler L, Denoix JM, Elsen JM, Ricard A.Genome-wide association studies for osteochondrosis in French trotterhorses. J Anim Sci. 2012;90:45–53.
44. McCoy AM, Beeson SK, Splan RK, Lykkjen S, Ralston SL, Mickelson JR, McCueME. Identification and validation of risk loci for osteochondrosis inStandardbreds. BMC Genomics. 2016;17:41.
45. Lykkjen S, Dolvik NI, McCue ME, Rendahl AK, Mickelson JR, Roed KH.Genome-wide association analysis of osteochondrosis of the tibiotarsal jointin Norwegian Standardbred trotters. Anim Genet. 2010;41:111–20.
46. Dupuis MC, Zhang Z, Druet T, Denoix JM, Charlier C, Lekeux P, Georges M.Results of a haplotype-based GWAS for recurrent laryngeal neuropathy inthe horse. Mamm Genome. 2011;22:613–20.
47. Dupuis MC, Zhang Z, Durkin K, Charlier C, Lekeux P, Georges M. Detectionof copy number variants in the horse genome and examination of theirassociation with recurrent laryngeal neuropathy. Anim Genet. 2013;44:206–8.
48. Svensk Travsport: Kvalificerings- & premielopp. https://www.travsport.se/artikel/kvalificerings-_&_premielopp (2017). Accessed 1 Nov 2017.
49. Det Norske Travselskap: Lover & Reglement. https://www.travsport.no (2017).Accessed 1 Nov 2017.
50. R Development Core Team: R-A Language and Environment for StatisticalComputing. https://www.r-project.org/ (2018). Accessed 13 Jan 2018.
51. Sargolzaei M, Iwaisaki H, Colleau JJ. CFC, a tool for monitoring geneticdiversity. In: Proceedings of the 8th world congress on genetics applied tolivestock production, vol. 8. Brazil: Belo Horizonte; 2006. p. 27–8.
52. OFX: Historical Exchange Rates. https://www.ofx.com/en-au/forex-news/historical-exchange-rates/ (2017). Accessed 1 Nov 2017.
53. Everitt BS, Hothorn TA. Handbook of statistical analyses using R: Chapman &Hall/CRC; 2010.
54. Mi H, Huang X, Muruganujan A, Tang H, Mills C, Kang D, Thomas PD.PANTHER version 11: expanded annotation data from gene ontology andReactome pathways, and data analysis tool enhancments. Nucl Acids Res.2016; https://doi.org/10.1093/nar/gkw1138.
55. Mi H, Muruganujan A, Casagrande JT, Thomas PD. Large-scale genefunction analysis with the PANTHER classification system. Nat Protoc. 2013;8:1551–66.
56. Weller JI. Quantitative trait loci analysis in animals. 2nd ed. Oxfordshire:CABI; 2009.
57. Jäderkvist Fegraeus K, Hirschberg I, Arnason T, Andersson L, Velie BD,Andersson LS, Lindgren G. To pace or not to pace: a pilot study of four-and five-gaited Icelandic horses homozygous for the DMRT3 ‘Gait Keeper’mutation. Anim Gent. 2017;48:694–7.
58. Tang YP, Shimizu E, Dube GR, Rampon C, Kerchner GA, Zhuo M, Liu G, TsienJZ. Genetic enhancement of learning and memory in mice. Nature. 1999;401:63–9.
59. Zamanillo D, Sprengel R, Hvalby O, Jensen V, Burnashev N, Rozov A, et al.Importance of AMPA receptors for hippocampal synaptic plasticity but notfor spatial learning. Science. 1999;284:1805–11.
60. Hu C, Chen W, Myers SJ, Yuan H, Traynelis SF. Human GRIN2B variants inneurodevelopmental disorders. J Pharmacol Sci. 2016;132:115–21.
Velie et al. BMC Genetics (2018) 19:80 Page 12 of 13
61. Kim JI, Yoo JH, Kim D, Jeong B, Kim BN. The effects of GRIN2B and DRD4gene variants on local functional connectivity in attention-deficit/hyperactivity disorder. Brain Imaging Behav. 2017; https://doi.org/10.1007/s11682-017-9690-2.
62. Concilli M, Iacobacci S, Chesi G, Carissimo A, Polishchuk R. A systemsbiology approach reveals new endoplasmic reticulum-associated targets forthe correction of the ATP7B mutant causing Wilson disease. Metallomics.2016;8:920–30.
63. Kieffer DA, Medici V. Wilson disease: at the crossroads between geneticsand epigenetics-a review of the evidence. Liver Res. 2017;1:121–30.
64. Usman H, Mathew MK. Potassium channel regulator KCNRG regulatessurface expression of shaker-type potassium channels. Biochem Biophys ResCommun. 2010;391:1301–5.
65. Lovell PV, Carleton JB, Mello CV. Genomics analysis of potassium channelgenes in songbirds reveals molecular specializations of brain circuits for themaintenance and production of learned vocalizations. BMC Genomics. 2013;14:470.
66. Gu J, Orr N, Park SD, Katz LM, Sulimova G, MacHugh DE, Hill EW. A genomescan for positive selection in thoroughbred horses. PLoS One. 2009;4:e5767.
67. Naylor JM. Hyperkalemic periodic paralysis. Vet Clin North Am Equine Pract.1997;13:129–44.
68. Bowling AT, Byrns G, Spier S. Evidence for a single pedigree source of thehyperkalemic periodic paralysis susceptibility gene in quarter horses. AnimGenet. 1996;27:279–81.
69. Naylor JM, Robinson JA, Bertone J. Familial incidence of hyperkalemicperiodic paralysis in quarter horses. J Am Vet Med Assoc. 1992;200:340–3.
70. Hinchcliff KW, Kaneps AJ, Geor RJ. Musculoskeletal System. In: Equine sportsmedicine and surgery: Saunders Elsevier; 2014. p. 109–43.
71. Cannon SC, Brown RH Jr, Corey DP. A sodium channel defect inhyperkalemic periodic paralysis: potassium-induced failure of inactivation.Neuron. 1991;6:619–26.
72. Ricker K, Camacho LM, Grafe P, Lehmann-Horn F, Rüdel R. Adynamia episodicahereditaria: what causes the weakness? Muscle Nerve. 1989;12:883–91.
73. Steele D, Naylor JM. Hyperkalemic periodic paralysis, plasma lactate andexercise tolerance. J Equine Vet Sci. 1996;202:933–7.
74. Maxson-Sage A, Parente EJ, Beech J, Lindborg S, May LL, Teleis DC. Effect ofhigh-intensity exercise on arterial blood gas tensions and upper airway andcardiac function in clinically normal quarter horses and horses heterozygousand homozygous for hyperkalemic periodic paralysis. Am J Vet Res. 1998;59:615–8.
75. van den Bout I, Jones DR, Shah ZH, Halstead JR, Keune WJ, Mohammed S,D’Santos CS, Divecha N. Collaboration of AMPK and PKC to inducephosphorylation of Ser413 on PIP5K1B resulting in decreased kinase activityand reduced PtdIns(4,5)P2 synthesis in response to oxidative stress andenergy restriction. Biochem J. 2013;455:347–58.
76. Szalinski CM, Guerriero CJ, Ruiz WG, Docter BE, Rbaibi Y, Pastor-Soler NM,Apodaca G, Puthenveedu MA, Weisz OA. PIP5K1β selectively modulates apicalendocytosis in polarized renal epithelial cells. PLoS One. 2013;8:e53790.
77. Liu T, Lee SY. Phosphatidylinositol 4-phosphate 5-kinase α negativelyregulates nerve growth factor-induced neurite outgrowth in PC12 cells. ExpMol Med. 2013;45:e16.
78. Qin T, An Y, Liu C, Wu J, Dai R, Liu D, Li X, Jiang L, Wu D, Tang X, Song W,Wang T, Zhao X. Novel DOCK8 gene mutations lead to absence of proteinexpression in patients with hyper-IgE syndrome. Immunol Res. 2016;64:260–71.
79. Biggs CM, Lu HY, Turvey SE. Monogenic immune disorders and severeatopic disease. Nat Genet. 2017;49:1162–3.
80. Burbank AJ, Shah SN, Montgomery M, Peden D, Tarrant TK, Weimer ET.Clinically focused exome sequencing identifies an homozygous mutationthat confers DOCK8 deficiency. Pediatr Allergy Immunol. 2016;27:96–8.
81. Zhang Q, Davis JC, Lamborn IT, Freeman AF, Jing H, Favreau AJ, Matthews HF,Davis J, Turner ML, Uzel G, Holland SM, Su HC. Combined immunodeficiencyassociated with DOCK8 mutations. N Engl J Med. 2009;361:2046–55.
82. Pedurupillay CR, Misceo D, Gamage TH, Dissanyayake VH, Frengen E. Post-zygotic breakage of a dicentric chromosome results in mosaicism for atelocentric 9p marker chromosome in a boy with developmental delay.Gene. 2014;533:403–10.
83. Griggs BL, Ladd S, Saul RA, DuPont BR, Srivastava AK. Dedicator ofcytokinesis 8 is disrupted in two patients with mental retardation anddevelopmental disabilities. Genomics. 2008;91:195–202.
84. Tassano E, Accogli A, Pavanello M, Bruno C, Capra V, Gimelli G, Cuoco C.Interstitial 9p24.3 deletion involving only DOCK8 and KANK1 genes in two
patients with non-overlapping phenotypic traits. Eur J Med Genet. 2016;59:20–5.
85. Jäderkvist K, Kangas N, Andersson LS, Lindgren G. Gaitedness is associatedwith the DMRT3 ‘Gait keeper’ mutation in Morgan and American curlyhorses. Anim Genet. 2014;45:908–9.
86. Jäderkvist K, Holm N, Imsland F, Arnason T, Andersson L, Andersson LS,Lindgren G. The effect of the DMRT3 ‘Gait keeper’ mutation on riding traitsand gaits in Standardbred and Icelandic horses. Livest Sci. 2015;176:33–9.
87. Regatieri IC, Eberth JE, Sarver F, Lear TL, Bailey E. Comparison of DMRT3genotypes among American Saddlebred horses with reference to gait.Anim Genet. 2016;47:603–5.
88. Promerová M, Andresson LS, Juras R, Penedo MC, Reissmann M, Tozaki T, etal. Worldwide frequency distribution of the ‘Gait keeper’ mutation in theDMRT3 gene. Anim Genet. 2014;45:274–82.
89. Vasan RS, Glazer NL, Felix JF, Lieb W, Wild PS, Felix SB, et al. Genetic variantsassociated with cardiac structure and function: a meta-analysis andreplication of genome-wide association data. JAMA. 2009;302:168–78.
90. Netherton SJ, Jimmo SL, Palmer D, Tilley DG, Dunkerley HA, Raymond DR,Russell JC, Absher PM, Sage EH, Vernon RB, Maurice DH. Alteredphosphodiesterase 3-mediated cAMP hydrolysis contributes to ahypermotile phenotype in obese JCR:LA-cp rat aortic vascular smoothmuscle cells: implications for diabetes-associated cardiovascular disease.Diabetes. 2002;51:1194–200.
91. Boda H, Uchida H, Takaiso N, Ouchi Y, Fujita N, Kuno A, Hata T, Nagatani A,Funamoto Y, Miyata M, Yoshikawa T, Kurahashi H, Inagaki H. A PDE3Amutation in familial hypertension and brachydactyly syndrome. J HumGenet. 2016;61:701–3.
92. Campos-Chillon F, Farmerie TA, Bouma GJ, Clay CM, Carnevale EM. Effects ofaging on gene expression and mitochondrial DNA in the equine oocyteand follicle cells. Reprod Fertil Dev. 2015;27:925–33.
93. Hamilton MJ, Halvorsen EC, LePard NE, Bosiljcic M, Ho VW, Lam V, Banáth J,Bennewith KL, Krystal G. SHIP represses lung inflammation and inhibitsmammary tumor metastasis in BALB/c mice. Oncotarget. 2016;7:3677–91.
94. Somasundaram R, Fernandes S, Deuring JJ, de Haar C, Kuipers EJ, VogelaarL, Middleton FA, van der Woude CJ, Peppelenbosch MP, Kerr WG, FuhlerGM. Analysis of SHIP1 expression and activity in Crohn’s disease patients.PLoS One. 2017;12:e0182308.
95. Pauls SD, Ray A, Hou S, Vaughan AT, Cragg MS, Marshall AJ. FcyRIIB-independent mechanisms controlling membrane localization of theinhibitory phosphatase SHIP in human B cells. J Immunol. 2016;197:1587–96.
96. Eijgelsheim M, Newton-Cheh C, Sotoodehnia N, de Bakker PI, Müller M,Morrison AC, et al. Genome-wide association analysis identifies multiple locirelated to resting heart rate. Hum Mol Genet. 2010;19:3885–94.
97. Pfeufer A, van Noord C, Marciante KD, Arking DE, Larson MG, Smith AV, etal. Genome-wide association study of PR interval. Nat Genet. 2010;42:153–9.
98. Della-Morte D, Beecham A, Rundek T, Wang L, McClendon MS, Slifer S,Blanton SH, Di Tullio MR, Sacco RL. A follow-up study for left ventricularmass on chromosome 12p11 identifies potential candidate genes. BMCMed Genet. 2011;12:100.
99. Hersh CP, Silverman EK, Gascon J, Bhattacharya S, Klanderman BJ, LitonjuaAA, Lefebvre V, Sparrow D, Reilly JJ, Anderson WH, Lomas DA, Mariani TJ.SOX5 is a candidate gene for chronic obstructive pulmonary diseasesusceptibility and is necessary for lung development. Am J Respir Crit CareMed. 2011;183:1482–9.
100. Rakhmanov M, Sic H, Kienzler AK, Fischer B, Rizzi M, Seidl M, et al. Highlevels of SOX5 decrease proliferative capacity of human B cells, but permitplasmablast differentiation. PLoS One. 2014;9:e100328.
101. Li A, Hooli B, Mullin K, Tate RE, Bubnys A, Kirchner R, Chapman B, HofmannO, Hide W, Tanzi RE. Silencing of the Drosophila ortholog of SOX5 leads toabnormal neuronal development and behavioral impairment. Hum MolGenet. 2017;26:1472–82.
102. Lamb AN, Rosenfeld JA, Neill NJ, Talkowski ME, Blumenthal I, Girirajan S, etal. Haploinsufficiency of SOX5 at 12p12.1 is associated with developmentaldelays with prominent language delay, behavior problems, and milddysmorphic features. Hum Mutat. 2012;33:728–40.
103. Powers SK, Jackson MJ. Exercise-induced oxidative stress: cellularmechanisms and impact on muscle force production. Physiol Rev. 2008;88:1243–76.
104. Lee HJ, Baek SS. Role of exercise on molecular mechanisms in theregulation of antidepressant effects. J Exerc Rehabil. 2017;13:617–20.
Velie et al. BMC Genetics (2018) 19:80 Page 13 of 13

V

RESEARCH ARTICLE Open Access
A QTL for conformation of back and croupinfluences lateral gait quality in IcelandichorsesMaria K. Rosengren1*† , Heiðrún Sigurðardóttir1,2†, Susanne Eriksson1, Rakan Naboulsi1, Ahmad Jouni1,Miguel Novoa-Bravo1,3, Elsa Albertsdóttir4, Þorvaldur Kristjánsson2, Marie Rhodin5, Åsa Viklund1, Brandon D. Velie6,Juan J. Negro7, Marina Solé1† and Gabriella Lindgren1,8†
Abstract
Background: The back plays a vital role in horse locomotion, where the spine functions as a spring during thestride cycle. A complex interaction between the spine and the muscles of the back contribute to locomotionsoundness, gait ability, and performance of riding and racehorses. Conformation is commonly used to select horsesfor breeding and performance in multiple horse breeds, where the back and croup conformation plays a significantrole. The conformation of back and croup plays an important role on riding ability in Icelandic horses. However, thegenes behind this trait are still unknown. Therefore, the aim of this study was to identify genomic regionsassociated with conformation of back and croup in Icelandic horses and to investigate their effects on riding ability.One hundred seventy-seven assessed Icelandic horses were included in the study. A genome-wide associationanalysis was performed using the 670 K+ Axiom Equine Genotyping Array, and the effects of different haplotypes inthe top associated region were estimated for riding ability and additional conformation traits assessed duringbreeding field tests.
Results: A suggestive quantitative trait loci (QTL) for the score of back and croup was detected on Equus caballus(ECA) 22 (p-value = 2.67 × 10− 7). Haplotype analysis revealed two opposite haplotypes, which resulted in higher andlower scores of the back and croup, respectively (p-value < 0.001). Horses with the favorable haplotype were moreinclined to have a well-balanced backline with an uphill conformation and had, on average, higher scores for thelateral gaits tölt (p-value = 0.02) and pace (p-value = 0.004). This genomic region harbors three genes: C20orf85,ANKRD60 and LOC100056167. ANKRD60 is associated with body height in humans. C20orf85 and ANKRD60 arepotentially linked to adolescent idiopathic scoliosis in humans.
(Continued on next page)
© The Author(s). 2021 Open Access This article is licensed under a Creative Commons Attribution 4.0 International License,which permits use, sharing, adaptation, distribution and reproduction in any medium or format, as long as you giveappropriate credit to the original author(s) and the source, provide a link to the Creative Commons licence, and indicate ifchanges were made. The images or other third party material in this article are included in the article's Creative Commonslicence, unless indicated otherwise in a credit line to the material. If material is not included in the article's Creative Commonslicence and your intended use is not permitted by statutory regulation or exceeds the permitted use, you will need to obtainpermission directly from the copyright holder. To view a copy of this licence, visit http://creativecommons.org/licenses/by/4.0/.The Creative Commons Public Domain Dedication waiver (http://creativecommons.org/publicdomain/zero/1.0/) applies to thedata made available in this article, unless otherwise stated in a credit line to the data.
* Correspondence: [email protected] K Rosengren & Heiðrún Sigurðardóttir share first authorship.†Marina Solé & Gabriella Lindgren share senior authorship.1Department of Animal Breeding and Genetics, Swedish University ofAgricultural Sciences, Uppsala, SwedenFull list of author information is available at the end of the article
Rosengren et al. BMC Genomics (2021) 22:267 https://doi.org/10.1186/s12864-021-07454-z
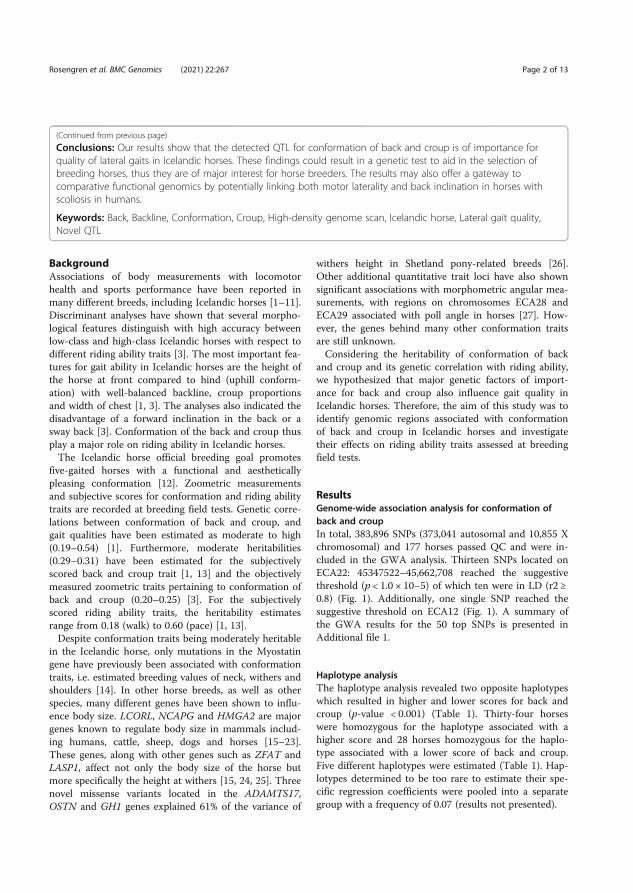
(Continued from previous page)
Conclusions: Our results show that the detected QTL for conformation of back and croup is of importance forquality of lateral gaits in Icelandic horses. These findings could result in a genetic test to aid in the selection ofbreeding horses, thus they are of major interest for horse breeders. The results may also offer a gateway tocomparative functional genomics by potentially linking both motor laterality and back inclination in horses withscoliosis in humans.
Keywords: Back, Backline, Conformation, Croup, High-density genome scan, Icelandic horse, Lateral gait quality,Novel QTL
BackgroundAssociations of body measurements with locomotorhealth and sports performance have been reported inmany different breeds, including Icelandic horses [1–11].Discriminant analyses have shown that several morpho-logical features distinguish with high accuracy betweenlow-class and high-class Icelandic horses with respect todifferent riding ability traits [3]. The most important fea-tures for gait ability in Icelandic horses are the height ofthe horse at front compared to hind (uphill conform-ation) with well-balanced backline, croup proportionsand width of chest [1, 3]. The analyses also indicated thedisadvantage of a forward inclination in the back or asway back [3]. Conformation of the back and croup thusplay a major role on riding ability in Icelandic horses.The Icelandic horse official breeding goal promotes
five-gaited horses with a functional and aestheticallypleasing conformation [12]. Zoometric measurementsand subjective scores for conformation and riding abilitytraits are recorded at breeding field tests. Genetic corre-lations between conformation of back and croup, andgait qualities have been estimated as moderate to high(0.19–0.54) [1]. Furthermore, moderate heritabilities(0.29–0.31) have been estimated for the subjectivelyscored back and croup trait [1, 13] and the objectivelymeasured zoometric traits pertaining to conformation ofback and croup (0.20–0.25) [3]. For the subjectivelyscored riding ability traits, the heritability estimatesrange from 0.18 (walk) to 0.60 (pace) [1, 13].Despite conformation traits being moderately heritable
in the Icelandic horse, only mutations in the Myostatingene have previously been associated with conformationtraits, i.e. estimated breeding values of neck, withers andshoulders [14]. In other horse breeds, as well as otherspecies, many different genes have been shown to influ-ence body size. LCORL, NCAPG and HMGA2 are majorgenes known to regulate body size in mammals includ-ing humans, cattle, sheep, dogs and horses [15–23].These genes, along with other genes such as ZFAT andLASP1, affect not only the body size of the horse butmore specifically the height at withers [15, 24, 25]. Threenovel missense variants located in the ADAMTS17,OSTN and GH1 genes explained 61% of the variance of
withers height in Shetland pony-related breeds [26].Other additional quantitative trait loci have also shownsignificant associations with morphometric angular mea-surements, with regions on chromosomes ECA28 andECA29 associated with poll angle in horses [27]. How-ever, the genes behind many other conformation traitsare still unknown.Considering the heritability of conformation of back
and croup and its genetic correlation with riding ability,we hypothesized that major genetic factors of import-ance for back and croup also influence gait quality inIcelandic horses. Therefore, the aim of this study was toidentify genomic regions associated with conformationof back and croup in Icelandic horses and investigatetheir effects on riding ability traits assessed at breedingfield tests.
ResultsGenome-wide association analysis for conformation ofback and croupIn total, 383,896 SNPs (373,041 autosomal and 10,855 Xchromosomal) and 177 horses passed QC and were in-cluded in the GWA analysis. Thirteen SNPs located onECA22: 45347522–45,662,708 reached the suggestivethreshold (p < 1.0 × 10⁻⁵) of which ten were in LD (r2 ≥0.8) (Fig. 1). Additionally, one single SNP reached thesuggestive threshold on ECA12 (Fig. 1). A summary ofthe GWA results for the 50 top SNPs is presented inAdditional file 1.
Haplotype analysisThe haplotype analysis revealed two opposite haplotypeswhich resulted in higher and lower scores for back andcroup (p-value < 0.001) (Table 1). Thirty-four horseswere homozygous for the haplotype associated with ahigher score and 28 horses homozygous for the haplo-type associated with a lower score of back and croup.Five different haplotypes were estimated (Table 1). Hap-lotypes determined to be too rare to estimate their spe-cific regression coefficients were pooled into a separategroup with a frequency of 0.07 (results not presented).
Rosengren et al. BMC Genomics (2021) 22:267 Page 2 of 13
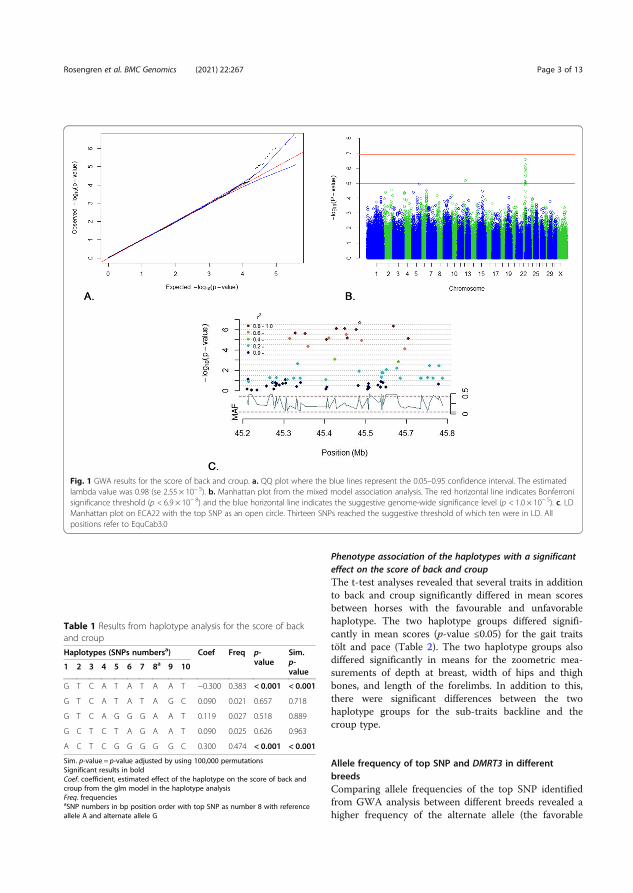
Phenotype association of the haplotypes with a significanteffect on the score of back and croupThe t-test analyses revealed that several traits in additionto back and croup significantly differed in mean scoresbetween horses with the favourable and unfavorablehaplotype. The two haplotype groups differed signifi-cantly in mean scores (p-value ≤0.05) for the gait traitstölt and pace (Table 2). The two haplotype groups alsodiffered significantly in means for the zoometric mea-surements of depth at breast, width of hips and thighbones, and length of the forelimbs. In addition to this,there were significant differences between the twohaplotype groups for the sub-traits backline and thecroup type.
Allele frequency of top SNP and DMRT3 in differentbreedsComparing allele frequencies of the top SNP identifiedfrom GWA analysis between different breeds revealed ahigher frequency of the alternate allele (the favorable
Fig. 1 GWA results for the score of back and croup. a. QQ plot where the blue lines represent the 0.05–0.95 confidence interval. The estimatedlambda value was 0.98 (se 2.55 × 10− 5). b. Manhattan plot from the mixed model association analysis. The red horizontal line indicates Bonferronisignificance threshold (p < 6.9 × 10− 8) and the blue horizontal line indicates the suggestive genome-wide significance level (p < 1.0 × 10− 5). c. LDManhattan plot on ECA22 with the top SNP as an open circle. Thirteen SNPs reached the suggestive threshold of which ten were in LD. Allpositions refer to EquCab3.0
Table 1 Results from haplotype analysis for the score of backand croup
Haplotypes (SNPs numbersa) Coef Freq p-value
Sim.p-value
1 2 3 4 5 6 7 8a 9 10
G T C A T A T A A T −0.300 0.383 < 0.001 < 0.001
G T C A T A T A G C 0.090 0.021 0.657 0.718
G T C A G G G A A T 0.119 0.027 0.518 0.889
G C T C T A G A A T 0.090 0.025 0.626 0.963
A C T C G G G G G C 0.300 0.474 < 0.001 < 0.001
Sim. p-value = p-value adjusted by using 100,000 permutationsSignificant results in boldCoef. coefficient, estimated effect of the haplotype on the score of back andcroup from the glm model in the haplotype analysisFreq. frequenciesaSNP numbers in bp position order with top SNP as number 8 with referenceallele A and alternate allele G
Rosengren et al. BMC Genomics (2021) 22:267 Page 3 of 13
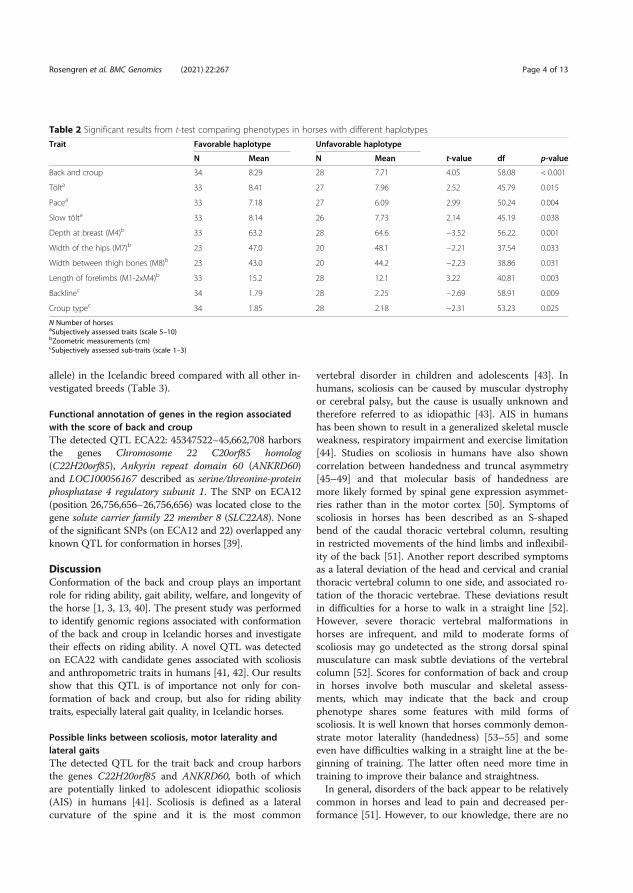
allele) in the Icelandic breed compared with all other in-vestigated breeds (Table 3).
Functional annotation of genes in the region associatedwith the score of back and croupThe detected QTL ECA22: 45347522–45,662,708 harborsthe genes Chromosome 22 C20orf85 homolog(C22H20orf85), Ankyrin repeat domain 60 (ANKRD60)and LOC100056167 described as serine/threonine-proteinphosphatase 4 regulatory subunit 1. The SNP on ECA12(position 26,756,656–26,756,656) was located close to thegene solute carrier family 22 member 8 (SLC22A8). Noneof the significant SNPs (on ECA12 and 22) overlapped anyknown QTL for conformation in horses [39].
DiscussionConformation of the back and croup plays an importantrole for riding ability, gait ability, welfare, and longevity ofthe horse [1, 3, 13, 40]. The present study was performedto identify genomic regions associated with conformationof the back and croup in Icelandic horses and investigatetheir effects on riding ability. A novel QTL was detectedon ECA22 with candidate genes associated with scoliosisand anthropometric traits in humans [41, 42]. Our resultsshow that this QTL is of importance not only for con-formation of back and croup, but also for riding abilitytraits, especially lateral gait quality, in Icelandic horses.
Possible links between scoliosis, motor laterality andlateral gaitsThe detected QTL for the trait back and croup harborsthe genes C22H20orf85 and ANKRD60, both of whichare potentially linked to adolescent idiopathic scoliosis(AIS) in humans [41]. Scoliosis is defined as a lateralcurvature of the spine and it is the most common
vertebral disorder in children and adolescents [43]. Inhumans, scoliosis can be caused by muscular dystrophyor cerebral palsy, but the cause is usually unknown andtherefore referred to as idiopathic [43]. AIS in humanshas been shown to result in a generalized skeletal muscleweakness, respiratory impairment and exercise limitation[44]. Studies on scoliosis in humans have also showncorrelation between handedness and truncal asymmetry[45–49] and that molecular basis of handedness aremore likely formed by spinal gene expression asymmet-ries rather than in the motor cortex [50]. Symptoms ofscoliosis in horses has been described as an S-shapedbend of the caudal thoracic vertebral column, resultingin restricted movements of the hind limbs and inflexibil-ity of the back [51]. Another report described symptomsas a lateral deviation of the head and cervical and cranialthoracic vertebral column to one side, and associated ro-tation of the thoracic vertebrae. These deviations resultin difficulties for a horse to walk in a straight line [52].However, severe thoracic vertebral malformations inhorses are infrequent, and mild to moderate forms ofscoliosis may go undetected as the strong dorsal spinalmusculature can mask subtle deviations of the vertebralcolumn [52]. Scores for conformation of back and croupin horses involve both muscular and skeletal assess-ments, which may indicate that the back and croupphenotype shares some features with mild forms ofscoliosis. It is well known that horses commonly demon-strate motor laterality (handedness) [53–55] and someeven have difficulties walking in a straight line at the be-ginning of training. The latter often need more time intraining to improve their balance and straightness.In general, disorders of the back appear to be relatively
common in horses and lead to pain and decreased per-formance [51]. However, to our knowledge, there are no
Table 2 Significant results from t-test comparing phenotypes in horses with different haplotypes
Trait Favorable haplotype Unfavorable haplotype
N Mean N Mean t-value df p-value
Back and croup 34 8.29 28 7.71 4.05 58.08 < 0.001
Tölta 33 8.41 27 7.96 2.52 45.79 0.015
Pacea 33 7.18 27 6.09 2.99 50.24 0.004
Slow tölta 33 8.14 26 7.73 2.14 45.19 0.038
Depth at breast (M4)b 33 63.2 28 64.6 −3.52 56.22 0.001
Width of the hips (M7)b 23 47.0 20 48.1 −2.21 37.54 0.033
Width between thigh bones (M8)b 23 43.0 20 44.2 −2.23 38.86 0.031
Length of forelimbs (M1-2xM4)b 33 15.2 28 12.1 3.22 40.81 0.003
Backlinec 34 1.79 28 2.25 −2.69 58.91 0.009
Croup typec 34 1.85 28 2.18 −2.31 53.23 0.025
N Number of horsesaSubjectively assessed traits (scale 5–10)bZoometric measurements (cm)cSubjectively assessed sub-traits (scale 1–3)
Rosengren et al. BMC Genomics (2021) 22:267 Page 4 of 13
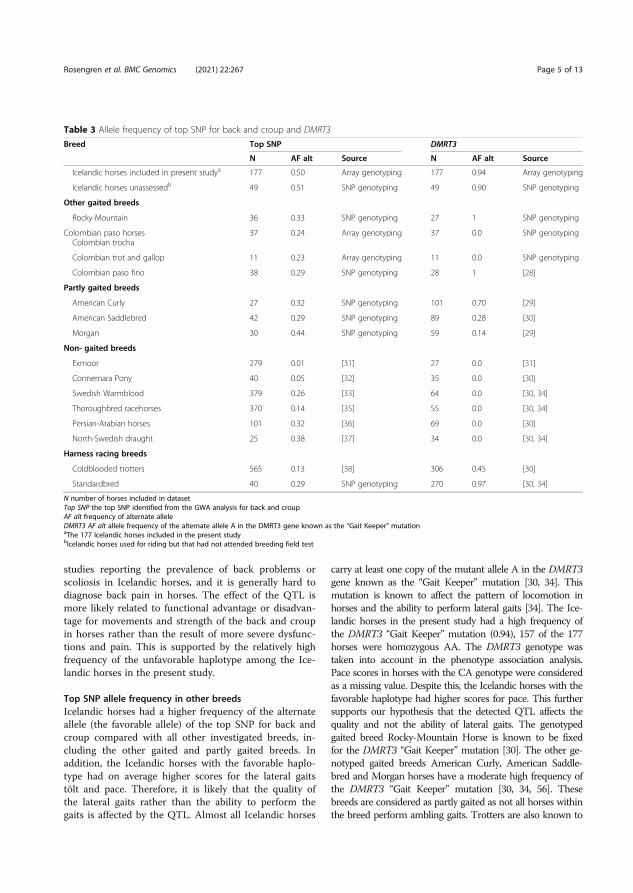
studies reporting the prevalence of back problems orscoliosis in Icelandic horses, and it is generally hard todiagnose back pain in horses. The effect of the QTL ismore likely related to functional advantage or disadvan-tage for movements and strength of the back and croupin horses rather than the result of more severe dysfunc-tions and pain. This is supported by the relatively highfrequency of the unfavorable haplotype among the Ice-landic horses in the present study.
Top SNP allele frequency in other breedsIcelandic horses had a higher frequency of the alternateallele (the favorable allele) of the top SNP for back andcroup compared with all other investigated breeds, in-cluding the other gaited and partly gaited breeds. Inaddition, the Icelandic horses with the favorable haplo-type had on average higher scores for the lateral gaitstölt and pace. Therefore, it is likely that the quality ofthe lateral gaits rather than the ability to perform thegaits is affected by the QTL. Almost all Icelandic horses
carry at least one copy of the mutant allele A in the DMRT3gene known as the “Gait Keeper” mutation [30, 34]. Thismutation is known to affect the pattern of locomotion inhorses and the ability to perform lateral gaits [34]. The Ice-landic horses in the present study had a high frequency ofthe DMRT3 “Gait Keeper” mutation (0.94), 157 of the 177horses were homozygous AA. The DMRT3 genotype wastaken into account in the phenotype association analysis.Pace scores in horses with the CA genotype were consideredas a missing value. Despite this, the Icelandic horses with thefavorable haplotype had higher scores for pace. This furthersupports our hypothesis that the detected QTL affects thequality and not the ability of lateral gaits. The genotypedgaited breed Rocky-Mountain Horse is known to be fixedfor the DMRT3 “Gait Keeper” mutation [30]. The other ge-notyped gaited breeds American Curly, American Saddle-bred and Morgan horses have a moderate high frequency ofthe DMRT3 “Gait Keeper” mutation [30, 34, 56]. Thesebreeds are considered as partly gaited as not all horses withinthe breed perform ambling gaits. Trotters are also known to
Table 3 Allele frequency of top SNP for back and croup and DMRT3
Breed Top SNP DMRT3
N AF alt Source N AF alt Source
Icelandic horses included in present studya 177 0.50 Array genotyping 177 0.94 Array genotyping
Icelandic horses unassessedb 49 0.51 SNP genotyping 49 0.90 SNP genotyping
Other gaited breeds
Rocky-Mountain 36 0.33 SNP genotyping 27 1 SNP genotyping
Colombian paso horsesColombian trocha
37 0.24 Array genotyping 37 0.0 SNP genotyping
Colombian trot and gallop 11 0.23 Array genotyping 11 0.0 SNP genotyping
Colombian paso fino 38 0.29 SNP genotyping 28 1 [28]
Partly gaited breeds
American Curly 27 0.32 SNP genotyping 101 0.70 [29]
American Saddlebred 42 0.29 SNP genotyping 89 0.28 [30]
Morgan 30 0.44 SNP genotyping 59 0.14 [29]
Non- gaited breeds
Exmoor 279 0.01 [31] 27 0.0 [31]
Connemara Pony 40 0.05 [32] 35 0.0 [30]
Swedish Warmblood 379 0.26 [33] 64 0.0 [30, 34]
Thoroughbred racehorses 370 0.14 [35] 55 0.0 [30, 34]
Persian-Arabian horses 101 0.32 [36] 69 0.0 [30]
North-Swedish draught 25 0.38 [37] 34 0.0 [30, 34]
Harness racing breeds
Coldblooded trotters 565 0.13 [38] 306 0.45 [30]
Standardbred 40 0.29 SNP genotyping 270 0.97 [30, 34]
N number of horses included in datasetTop SNP the top SNP identified from the GWA analysis for back and croupAF alt frequency of alternate alleleDMRT3 AF alt allele frequency of the alternate allele A in the DMRT3 gene known as the “Gait Keeper” mutationaThe 177 Icelandic horses included in the present studybIcelandic horses used for riding but that had not attended breeding field test
Rosengren et al. BMC Genomics (2021) 22:267 Page 5 of 13
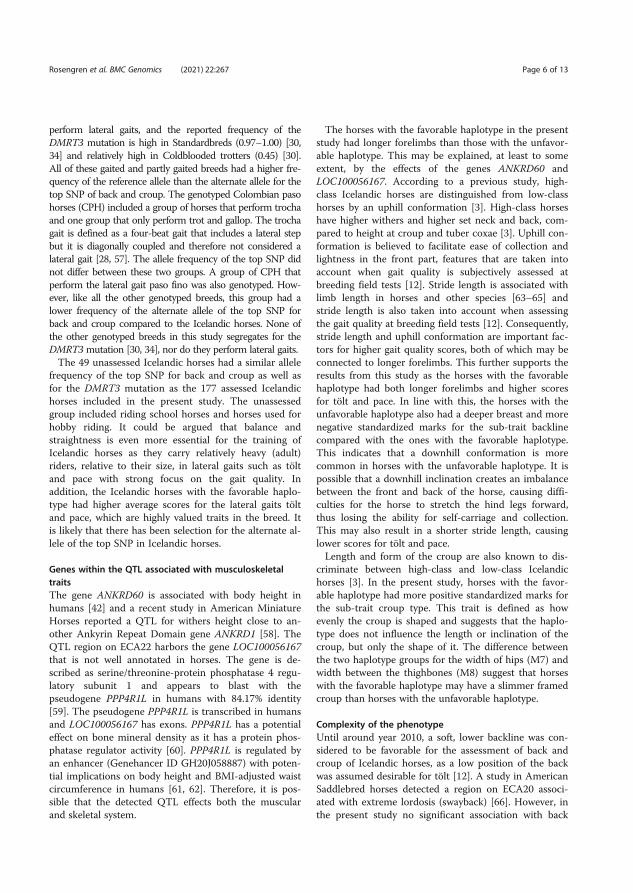
perform lateral gaits, and the reported frequency of theDMRT3 mutation is high in Standardbreds (0.97–1.00) [30,34] and relatively high in Coldblooded trotters (0.45) [30].All of these gaited and partly gaited breeds had a higher fre-quency of the reference allele than the alternate allele for thetop SNP of back and croup. The genotyped Colombian pasohorses (CPH) included a group of horses that perform trochaand one group that only perform trot and gallop. The trochagait is defined as a four-beat gait that includes a lateral stepbut it is diagonally coupled and therefore not considered alateral gait [28, 57]. The allele frequency of the top SNP didnot differ between these two groups. A group of CPH thatperform the lateral gait paso fino was also genotyped. How-ever, like all the other genotyped breeds, this group had alower frequency of the alternate allele of the top SNP forback and croup compared to the Icelandic horses. None ofthe other genotyped breeds in this study segregates for theDMRT3mutation [30, 34], nor do they perform lateral gaits.The 49 unassessed Icelandic horses had a similar allele
frequency of the top SNP for back and croup as well asfor the DMRT3 mutation as the 177 assessed Icelandichorses included in the present study. The unassessedgroup included riding school horses and horses used forhobby riding. It could be argued that balance andstraightness is even more essential for the training ofIcelandic horses as they carry relatively heavy (adult)riders, relative to their size, in lateral gaits such as töltand pace with strong focus on the gait quality. Inaddition, the Icelandic horses with the favorable haplo-type had higher average scores for the lateral gaits töltand pace, which are highly valued traits in the breed. Itis likely that there has been selection for the alternate al-lele of the top SNP in Icelandic horses.
Genes within the QTL associated with musculoskeletaltraitsThe gene ANKRD60 is associated with body height inhumans [42] and a recent study in American MiniatureHorses reported a QTL for withers height close to an-other Ankyrin Repeat Domain gene ANKRD1 [58]. TheQTL region on ECA22 harbors the gene LOC100056167that is not well annotated in horses. The gene is de-scribed as serine/threonine-protein phosphatase 4 regu-latory subunit 1 and appears to blast with thepseudogene PPP4R1L in humans with 84.17% identity[59]. The pseudogene PPP4R1L is transcribed in humansand LOC100056167 has exons. PPP4R1L has a potentialeffect on bone mineral density as it has a protein phos-phatase regulator activity [60]. PPP4R1L is regulated byan enhancer (Genehancer ID GH20J058887) with poten-tial implications on body height and BMI-adjusted waistcircumference in humans [61, 62]. Therefore, it is pos-sible that the detected QTL effects both the muscularand skeletal system.
The horses with the favorable haplotype in the presentstudy had longer forelimbs than those with the unfavor-able haplotype. This may be explained, at least to someextent, by the effects of the genes ANKRD60 andLOC100056167. According to a previous study, high-class Icelandic horses are distinguished from low-classhorses by an uphill conformation [3]. High-class horseshave higher withers and higher set neck and back, com-pared to height at croup and tuber coxae [3]. Uphill con-formation is believed to facilitate ease of collection andlightness in the front part, features that are taken intoaccount when gait quality is subjectively assessed atbreeding field tests [12]. Stride length is associated withlimb length in horses and other species [63–65] andstride length is also taken into account when assessingthe gait quality at breeding field tests [12]. Consequently,stride length and uphill conformation are important fac-tors for higher gait quality scores, both of which may beconnected to longer forelimbs. This further supports theresults from this study as the horses with the favorablehaplotype had both longer forelimbs and higher scoresfor tölt and pace. In line with this, the horses with theunfavorable haplotype also had a deeper breast and morenegative standardized marks for the sub-trait backlinecompared with the ones with the favorable haplotype.This indicates that a downhill conformation is morecommon in horses with the unfavorable haplotype. It ispossible that a downhill inclination creates an imbalancebetween the front and back of the horse, causing diffi-culties for the horse to stretch the hind legs forward,thus losing the ability for self-carriage and collection.This may also result in a shorter stride length, causinglower scores for tölt and pace.Length and form of the croup are also known to dis-
criminate between high-class and low-class Icelandichorses [3]. In the present study, horses with the favor-able haplotype had more positive standardized marks forthe sub-trait croup type. This trait is defined as howevenly the croup is shaped and suggests that the haplo-type does not influence the length or inclination of thecroup, but only the shape of it. The difference betweenthe two haplotype groups for the width of hips (M7) andwidth between the thighbones (M8) suggest that horseswith the favorable haplotype may have a slimmer framedcroup than horses with the unfavorable haplotype.
Complexity of the phenotypeUntil around year 2010, a soft, lower backline was con-sidered to be favorable for the assessment of back andcroup of Icelandic horses, as a low position of the backwas assumed desirable for tölt [12]. A study in AmericanSaddlebred horses detected a region on ECA20 associ-ated with extreme lordosis (swayback) [66]. However, inthe present study no significant association with back
Rosengren et al. BMC Genomics (2021) 22:267 Page 6 of 13
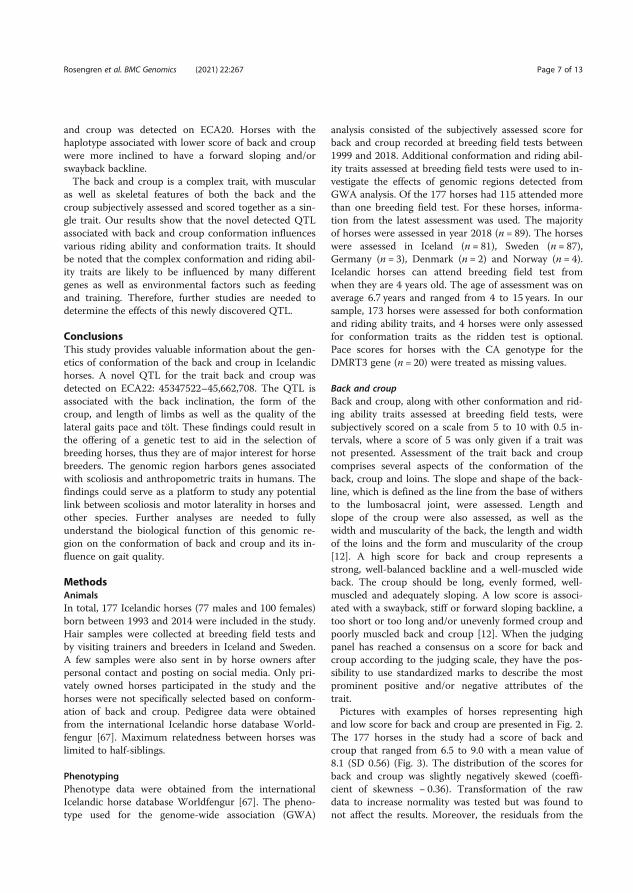
and croup was detected on ECA20. Horses with thehaplotype associated with lower score of back and croupwere more inclined to have a forward sloping and/orswayback backline.The back and croup is a complex trait, with muscular
as well as skeletal features of both the back and thecroup subjectively assessed and scored together as a sin-gle trait. Our results show that the novel detected QTLassociated with back and croup conformation influencesvarious riding ability and conformation traits. It shouldbe noted that the complex conformation and riding abil-ity traits are likely to be influenced by many differentgenes as well as environmental factors such as feedingand training. Therefore, further studies are needed todetermine the effects of this newly discovered QTL.
ConclusionsThis study provides valuable information about the gen-etics of conformation of the back and croup in Icelandichorses. A novel QTL for the trait back and croup wasdetected on ECA22: 45347522–45,662,708. The QTL isassociated with the back inclination, the form of thecroup, and length of limbs as well as the quality of thelateral gaits pace and tölt. These findings could result inthe offering of a genetic test to aid in the selection ofbreeding horses, thus they are of major interest for horsebreeders. The genomic region harbors genes associatedwith scoliosis and anthropometric traits in humans. Thefindings could serve as a platform to study any potentiallink between scoliosis and motor laterality in horses andother species. Further analyses are needed to fullyunderstand the biological function of this genomic re-gion on the conformation of back and croup and its in-fluence on gait quality.
MethodsAnimalsIn total, 177 Icelandic horses (77 males and 100 females)born between 1993 and 2014 were included in the study.Hair samples were collected at breeding field tests andby visiting trainers and breeders in Iceland and Sweden.A few samples were also sent in by horse owners afterpersonal contact and posting on social media. Only pri-vately owned horses participated in the study and thehorses were not specifically selected based on conform-ation of back and croup. Pedigree data were obtainedfrom the international Icelandic horse database World-fengur [67]. Maximum relatedness between horses waslimited to half-siblings.
PhenotypingPhenotype data were obtained from the internationalIcelandic horse database Worldfengur [67]. The pheno-type used for the genome-wide association (GWA)
analysis consisted of the subjectively assessed score forback and croup recorded at breeding field tests between1999 and 2018. Additional conformation and riding abil-ity traits assessed at breeding field tests were used to in-vestigate the effects of genomic regions detected fromGWA analysis. Of the 177 horses had 115 attended morethan one breeding field test. For these horses, informa-tion from the latest assessment was used. The majorityof horses were assessed in year 2018 (n = 89). The horseswere assessed in Iceland (n = 81), Sweden (n = 87),Germany (n = 3), Denmark (n = 2) and Norway (n = 4).Icelandic horses can attend breeding field test fromwhen they are 4 years old. The age of assessment was onaverage 6.7 years and ranged from 4 to 15 years. In oursample, 173 horses were assessed for both conformationand riding ability traits, and 4 horses were only assessedfor conformation traits as the ridden test is optional.Pace scores for horses with the CA genotype for theDMRT3 gene (n = 20) were treated as missing values.
Back and croupBack and croup, along with other conformation and rid-ing ability traits assessed at breeding field tests, weresubjectively scored on a scale from 5 to 10 with 0.5 in-tervals, where a score of 5 was only given if a trait wasnot presented. Assessment of the trait back and croupcomprises several aspects of the conformation of theback, croup and loins. The slope and shape of the back-line, which is defined as the line from the base of withersto the lumbosacral joint, were assessed. Length andslope of the croup were also assessed, as well as thewidth and muscularity of the back, the length and widthof the loins and the form and muscularity of the croup[12]. A high score for back and croup represents astrong, well-balanced backline and a well-muscled wideback. The croup should be long, evenly formed, well-muscled and adequately sloping. A low score is associ-ated with a swayback, stiff or forward sloping backline, atoo short or too long and/or unevenly formed croup andpoorly muscled back and croup [12]. When the judgingpanel has reached a consensus on a score for back andcroup according to the judging scale, they have the pos-sibility to use standardized marks to describe the mostprominent positive and/or negative attributes of thetrait.Pictures with examples of horses representing high
and low score for back and croup are presented in Fig. 2.The 177 horses in the study had a score of back andcroup that ranged from 6.5 to 9.0 with a mean value of8.1 (SD 0.56) (Fig. 3). The distribution of the scores forback and croup was slightly negatively skewed (coeffi-cient of skewness − 0.36). Transformation of the rawdata to increase normality was tested but was found tonot affect the results. Moreover, the residuals from the
Rosengren et al. BMC Genomics (2021) 22:267 Page 7 of 13
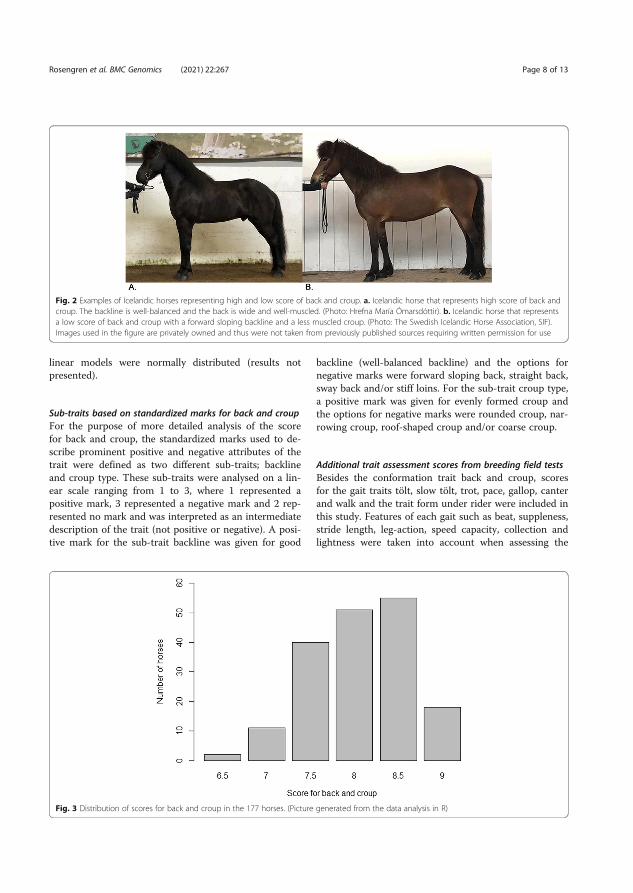
linear models were normally distributed (results notpresented).
Sub-traits based on standardized marks for back and croupFor the purpose of more detailed analysis of the scorefor back and croup, the standardized marks used to de-scribe prominent positive and negative attributes of thetrait were defined as two different sub-traits; backlineand croup type. These sub-traits were analysed on a lin-ear scale ranging from 1 to 3, where 1 represented apositive mark, 3 represented a negative mark and 2 rep-resented no mark and was interpreted as an intermediatedescription of the trait (not positive or negative). A posi-tive mark for the sub-trait backline was given for good
backline (well-balanced backline) and the options fornegative marks were forward sloping back, straight back,sway back and/or stiff loins. For the sub-trait croup type,a positive mark was given for evenly formed croup andthe options for negative marks were rounded croup, nar-rowing croup, roof-shaped croup and/or coarse croup.
Additional trait assessment scores from breeding field testsBesides the conformation trait back and croup, scoresfor the gait traits tölt, slow tölt, trot, pace, gallop, canterand walk and the trait form under rider were included inthis study. Features of each gait such as beat, suppleness,stride length, leg-action, speed capacity, collection andlightness were taken into account when assessing the
Fig. 2 Examples of Icelandic horses representing high and low score of back and croup. a. Icelandic horse that represents high score of back andcroup. The backline is well-balanced and the back is wide and well-muscled. (Photo: Hrefna María Ómarsdóttir). b. Icelandic horse that representsa low score of back and croup with a forward sloping backline and a less muscled croup. (Photo: The Swedish Icelandic Horse Association, SIF).Images used in the figure are privately owned and thus were not taken from previously published sources requiring written permission for use
Fig. 3 Distribution of scores for back and croup in the 177 horses. (Picture generated from the data analysis in R)
Rosengren et al. BMC Genomics (2021) 22:267 Page 8 of 13
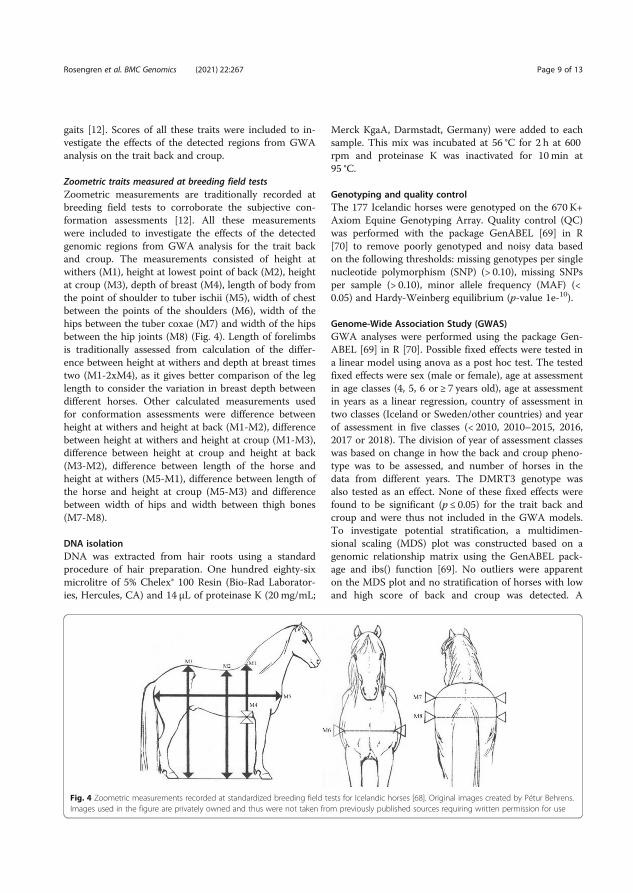
gaits [12]. Scores of all these traits were included to in-vestigate the effects of the detected regions from GWAanalysis on the trait back and croup.
Zoometric traits measured at breeding field testsZoometric measurements are traditionally recorded atbreeding field tests to corroborate the subjective con-formation assessments [12]. All these measurementswere included to investigate the effects of the detectedgenomic regions from GWA analysis for the trait backand croup. The measurements consisted of height atwithers (M1), height at lowest point of back (M2), heightat croup (M3), depth of breast (M4), length of body fromthe point of shoulder to tuber ischii (M5), width of chestbetween the points of the shoulders (M6), width of thehips between the tuber coxae (M7) and width of the hipsbetween the hip joints (M8) (Fig. 4). Length of forelimbsis traditionally assessed from calculation of the differ-ence between height at withers and depth at breast timestwo (M1-2xM4), as it gives better comparison of the leglength to consider the variation in breast depth betweendifferent horses. Other calculated measurements usedfor conformation assessments were difference betweenheight at withers and height at back (M1-M2), differencebetween height at withers and height at croup (M1-M3),difference between height at croup and height at back(M3-M2), difference between length of the horse andheight at withers (M5-M1), difference between length ofthe horse and height at croup (M5-M3) and differencebetween width of hips and width between thigh bones(M7-M8).
DNA isolationDNA was extracted from hair roots using a standardprocedure of hair preparation. One hundred eighty-sixmicrolitre of 5% Chelex® 100 Resin (Bio-Rad Laborator-ies, Hercules, CA) and 14 μL of proteinase K (20 mg/mL;
Merck KgaA, Darmstadt, Germany) were added to eachsample. This mix was incubated at 56 °C for 2 h at 600rpm and proteinase K was inactivated for 10 min at95 °C.
Genotyping and quality controlThe 177 Icelandic horses were genotyped on the 670 K+Axiom Equine Genotyping Array. Quality control (QC)was performed with the package GenABEL [69] in R[70] to remove poorly genotyped and noisy data basedon the following thresholds: missing genotypes per singlenucleotide polymorphism (SNP) (> 0.10), missing SNPsper sample (> 0.10), minor allele frequency (MAF) (<0.05) and Hardy-Weinberg equilibrium (p-value 1e-10).
Genome-Wide Association Study (GWAS)GWA analyses were performed using the package Gen-ABEL [69] in R [70]. Possible fixed effects were tested ina linear model using anova as a post hoc test. The testedfixed effects were sex (male or female), age at assessmentin age classes (4, 5, 6 or ≥ 7 years old), age at assessmentin years as a linear regression, country of assessment intwo classes (Iceland or Sweden/other countries) and yearof assessment in five classes (< 2010, 2010–2015, 2016,2017 or 2018). The division of year of assessment classeswas based on change in how the back and croup pheno-type was to be assessed, and number of horses in thedata from different years. The DMRT3 genotype wasalso tested as an effect. None of these fixed effects werefound to be significant (p ≤ 0.05) for the trait back andcroup and were thus not included in the GWA models.To investigate potential stratification, a multidimen-sional scaling (MDS) plot was constructed based on agenomic relationship matrix using the GenABEL pack-age and ibs() function [69]. No outliers were apparenton the MDS plot and no stratification of horses with lowand high score of back and croup was detected. A
Fig. 4 Zoometric measurements recorded at standardized breeding field tests for Icelandic horses [68]. Original images created by Pétur Behrens.Images used in the figure are privately owned and thus were not taken from previously published sources requiring written permission for use
Rosengren et al. BMC Genomics (2021) 22:267 Page 9 of 13
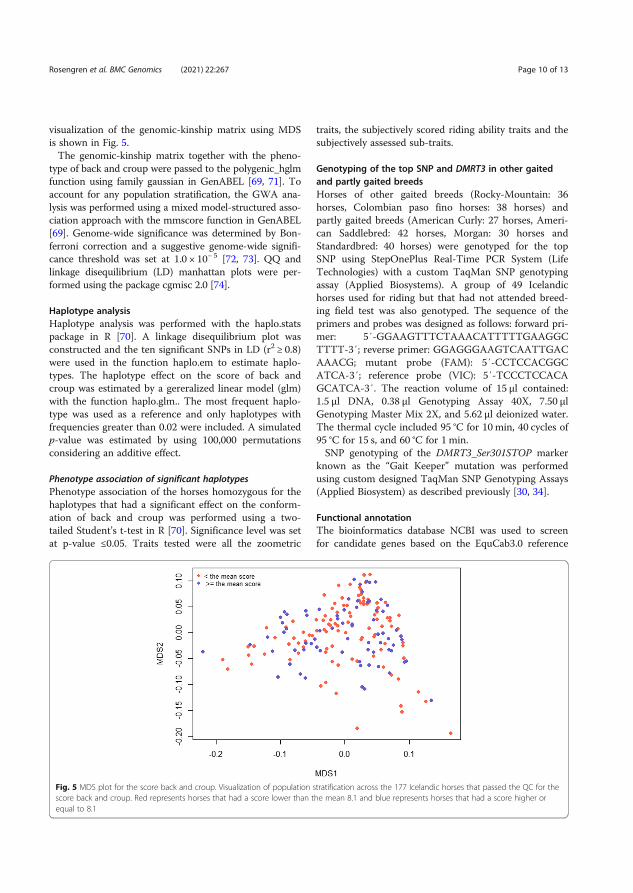
visualization of the genomic-kinship matrix using MDSis shown in Fig. 5.The genomic-kinship matrix together with the pheno-
type of back and croup were passed to the polygenic_hglmfunction using family gaussian in GenABEL [69, 71]. Toaccount for any population stratification, the GWA ana-lysis was performed using a mixed model-structured asso-ciation approach with the mmscore function in GenABEL[69]. Genome-wide significance was determined by Bon-ferroni correction and a suggestive genome-wide signifi-cance threshold was set at 1.0 × 10− 5 [72, 73]. QQ andlinkage disequilibrium (LD) manhattan plots were per-formed using the package cgmisc 2.0 [74].
Haplotype analysisHaplotype analysis was performed with the haplo.statspackage in R [70]. A linkage disequilibrium plot wasconstructed and the ten significant SNPs in LD (r2 ≥ 0.8)were used in the function haplo.em to estimate haplo-types. The haplotype effect on the score of back andcroup was estimated by a gereralized linear model (glm)with the function haplo.glm.. The most frequent haplo-type was used as a reference and only haplotypes withfrequencies greater than 0.02 were included. A simulatedp-value was estimated by using 100,000 permutationsconsidering an additive effect.
Phenotype association of significant haplotypesPhenotype association of the horses homozygous for thehaplotypes that had a significant effect on the conform-ation of back and croup was performed using a two-tailed Student’s t-test in R [70]. Significance level was setat p-value ≤0.05. Traits tested were all the zoometric
traits, the subjectively scored riding ability traits and thesubjectively assessed sub-traits.
Genotyping of the top SNP and DMRT3 in other gaitedand partly gaited breedsHorses of other gaited breeds (Rocky-Mountain: 36horses, Colombian paso fino horses: 38 horses) andpartly gaited breeds (American Curly: 27 horses, Ameri-can Saddlebred: 42 horses, Morgan: 30 horses andStandardbred: 40 horses) were genotyped for the topSNP using StepOnePlus Real-Time PCR System (LifeTechnologies) with a custom TaqMan SNP genotypingassay (Applied Biosystems). A group of 49 Icelandichorses used for riding but that had not attended breed-ing field test was also genotyped. The sequence of theprimers and probes was designed as follows: forward pri-mer: 5′-GGAAGTTTCTAAACATTTTTGAAGGCTTTT-3′; reverse primer: GGAGGGAAGTCAATTGACAAACG; mutant probe (FAM): 5′-CCTCCACGGCATCA-3′; reference probe (VIC): 5′-TCCCTCCACAGCATCA-3′. The reaction volume of 15 μl contained:1.5 μl DNA, 0.38 μl Genotyping Assay 40X, 7.50 μlGenotyping Master Mix 2X, and 5.62 μl deionized water.The thermal cycle included 95 °C for 10 min, 40 cycles of95 °C for 15 s, and 60 °C for 1 min.SNP genotyping of the DMRT3_Ser301STOP marker
known as the “Gait Keeper” mutation was performedusing custom designed TaqMan SNP Genotyping Assays(Applied Biosystem) as described previously [30, 34].
Functional annotationThe bioinformatics database NCBI was used to screenfor candidate genes based on the EquCab3.0 reference
Fig. 5 MDS plot for the score back and croup. Visualization of population stratification across the 177 Icelandic horses that passed the QC for thescore back and croup. Red represents horses that had a score lower than the mean 8.1 and blue represents horses that had a score higher orequal to 8.1
Rosengren et al. BMC Genomics (2021) 22:267 Page 10 of 13
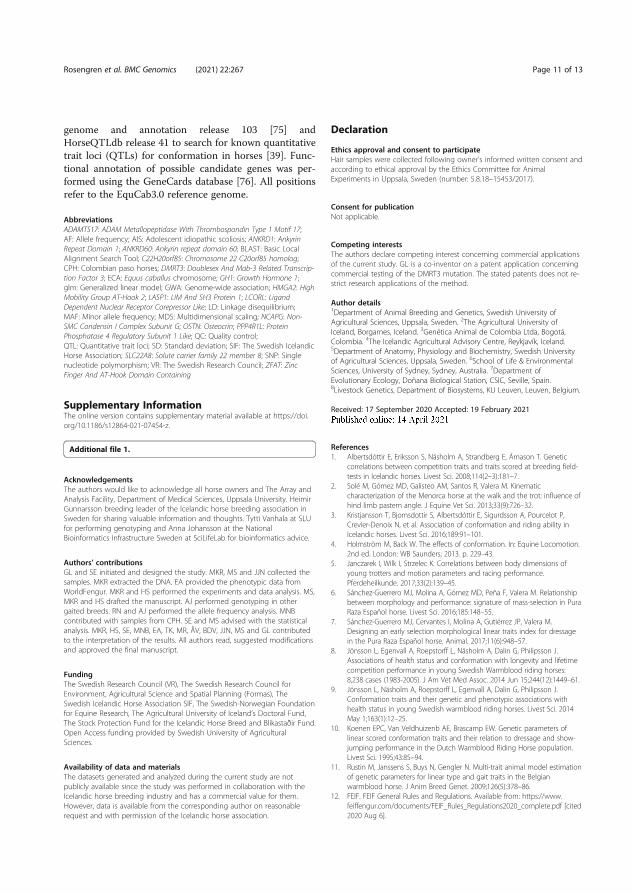
genome and annotation release 103 [75] andHorseQTLdb release 41 to search for known quantitativetrait loci (QTLs) for conformation in horses [39]. Func-tional annotation of possible candidate genes was per-formed using the GeneCards database [76]. All positionsrefer to the EquCab3.0 reference genome.
AbbreviationsADAMTS17: ADAM Metallopeptidase With Thrombospondin Type 1 Motif 17;AF: Allele frequency; AIS: Adolescent idiopathic scoliosis; ANKRD1: AnkyrinRepeat Domain 1; ANKRD60: Ankyrin repeat domain 60; BLAST: Basic LocalAlignment Search Tool; C22H20orf85: Chromosome 22 C20orf85 homolog;CPH: Colombian paso horses; DMRT3: Doublesex And Mab-3 Related Transcrip-tion Factor 3; ECA: Equus caballus chromosome; GH1: Growth Hormone 1;glm: Generalized linear model; GWA: Genome-wide association; HMGA2: HighMobility Group AT-Hook 2; LASP1: LIM And SH3 Protein 1; LCORL: LigandDependent Nuclear Receptor Corepressor Like; LD: Linkage disequilibrium;MAF: Minor allele frequency; MDS: Multidimensional scaling; NCAPG: Non-SMC Condensin I Complex Subunit G; OSTN: Osteocrin; PPP4R1L: ProteinPhosphatase 4 Regulatory Subunit 1 Like; QC: Quality control;QTL: Quantitative trait loci; SD: Standard deviation; SIF: The Swedish IcelandicHorse Association; SLC22A8: Solute carrier family 22 member 8; SNP: Singlenucleotide polymorphism; VR: The Swedish Research Council; ZFAT: ZincFinger And AT-Hook Domain Containing
Supplementary InformationThe online version contains supplementary material available at https://doi.org/10.1186/s12864-021-07454-z.
Additional file 1.
AcknowledgementsThe authors would like to acknowledge all horse owners and The Array andAnalysis Facility, Department of Medical Sciences, Uppsala University. HeimirGunnarsson breeding leader of the Icelandic horse breeding association inSweden for sharing valuable information and thoughts. Tytti Vanhala at SLUfor performing genotyping and Anna Johansson at the NationalBioinformatics Infrastructure Sweden at SciLifeLab for bioinformatics advice.
Authors’ contributionsGL and SE initiated and designed the study. MKR, MS and JJN collected thesamples. MKR extracted the DNA. EA provided the phenotypic data fromWorldFengur. MKR and HS performed the experiments and data analysis. MS,MKR and HS drafted the manuscript. AJ performed genotyping in othergaited breeds. RN and AJ performed the allele frequency analysis. MNBcontributed with samples from CPH. SE and MS advised with the statisticalanalysis. MKR, HS, SE, MNB, EA, TK, MR, ÅV, BDV, JJN, MS and GL contributedto the interpretation of the results. All authors read, suggested modificationsand approved the final manuscript.
FundingThe Swedish Research Council (VR), The Swedish Research Council forEnvironment, Agricultural Science and Spatial Planning (Formas), TheSwedish Icelandic Horse Association SIF, The Swedish-Norwegian Foundationfor Equine Research, The Agricultural University of Iceland’s Doctoral Fund,The Stock Protection Fund for the Icelandic Horse Breed and Blikastaðir Fund.Open Access funding provided by Swedish University of AgriculturalSciences.
Availability of data and materialsThe datasets generated and analyzed during the current study are notpublicly available since the study was performed in collaboration with theIcelandic horse breeding industry and has a commercial value for them.However, data is available from the corresponding author on reasonablerequest and with permission of the Icelandic horse association.
Declaration
Ethics approval and consent to participateHair samples were collected following owner’s informed written consent andaccording to ethical approval by the Ethics Committee for AnimalExperiments in Uppsala, Sweden (number: 5.8.18–15453/2017).
Consent for publicationNot applicable.
Competing interestsThe authors declare competing interest concerning commercial applicationsof the current study. GL is a co-inventor on a patent application concerningcommercial testing of the DMRT3 mutation. The stated patents does not re-strict research applications of the method.
Author details1Department of Animal Breeding and Genetics, Swedish University ofAgricultural Sciences, Uppsala, Sweden. 2The Agricultural University ofIceland, Borgarnes, Iceland. 3Genética Animal de Colombia Ltda, Bogotá,Colombia. 4The Icelandic Agricultural Advisory Centre, Reykjavík, Iceland.5Department of Anatomy, Physiology and Biochemistry, Swedish Universityof Agricultural Sciences, Uppsala, Sweden. 6School of Life & EnvironmentalSciences, University of Sydney, Sydney, Australia. 7Department ofEvolutionary Ecology, Doñana Biological Station, CSIC, Seville, Spain.8Livestock Genetics, Department of Biosystems, KU Leuven, Leuven, Belgium.
Received: 17 September 2020 Accepted: 19 February 2021
References1. Albertsdóttir E, Eriksson S, Näsholm A, Strandberg E, Árnason T. Genetic
correlations between competition traits and traits scored at breeding field-tests in Icelandic horses. Livest Sci. 2008;114(2–3):181–7.
2. Solé M, Gómez MD, Galisteo AM, Santos R, Valera M. Kinematiccharacterization of the Menorca horse at the walk and the trot: influence ofhind limb pastern angle. J Equine Vet Sci. 2013;33(9):726–32.
3. Kristjansson T, Bjornsdottir S, Albertsdóttir E, Sigurdsson A, Pourcelot P,Crevier-Denoix N, et al. Association of conformation and riding ability inIcelandic horses. Livest Sci. 2016;189:91–101.
4. Holmström M, Back W. The effects of conformation. In: Equine Locomotion.2nd ed. London: WB Saunders; 2013. p. 229–43.
5. Janczarek I, Wilk I, Strzelec K. Correlations between body dimensions ofyoung trotters and motion parameters and racing performance.Pferdeheilkunde. 2017;33(2):139–45.
6. Sánchez-Guerrero MJ, Molina A, Gómez MD, Peña F, Valera M. Relationshipbetween morphology and performance: signature of mass-selection in PuraRaza Español horse. Livest Sci. 2016;185:148–55.
7. Sánchez-Guerrero MJ, Cervantes I, Molina A, Gutiérrez JP, Valera M.Designing an early selection morphological linear traits index for dressagein the Pura Raza Español horse. Animal. 2017;11(6):948–57.
8. Jönsson L, Egenvall A, Roepstorff L, Näsholm A, Dalin G, Philipsson J.Associations of health status and conformation with longevity and lifetimecompetition performance in young Swedish Warmblood riding horses:8,238 cases (1983-2005). J Am Vet Med Assoc. 2014 Jun 15;244(12):1449–61.
9. Jönsson L, Näsholm A, Roepstorff L, Egenvall A, Dalin G, Philipsson J.Conformation traits and their genetic and phenotypic associations withhealth status in young Swedish warmblood riding horses. Livest Sci. 2014May 1;163(1):12–25.
10. Koenen EPC, Van Veldhuizenb AE, Brascamp EW. Genetic parameters oflinear scored conformation traits and their relation to dressage and show-jumping performance in the Dutch Warmblood Riding Horse population.Livest Sci. 1995;43:85–94.
11. Rustin M, Janssens S, Buys N, Gengler N. Multi-trait animal model estimationof genetic parameters for linear type and gait traits in the Belgianwarmblood horse. J Anim Breed Genet. 2009;126(5):378–86.
12. FEIF. FEIF General Rules and Regulations. Available from: https://www.feiffengur.com/documents/FEIF_Rules_Regulations2020_complete.pdf [cited2020 Aug 6].
Rosengren et al. BMC Genomics (2021) 22:267 Page 11 of 13
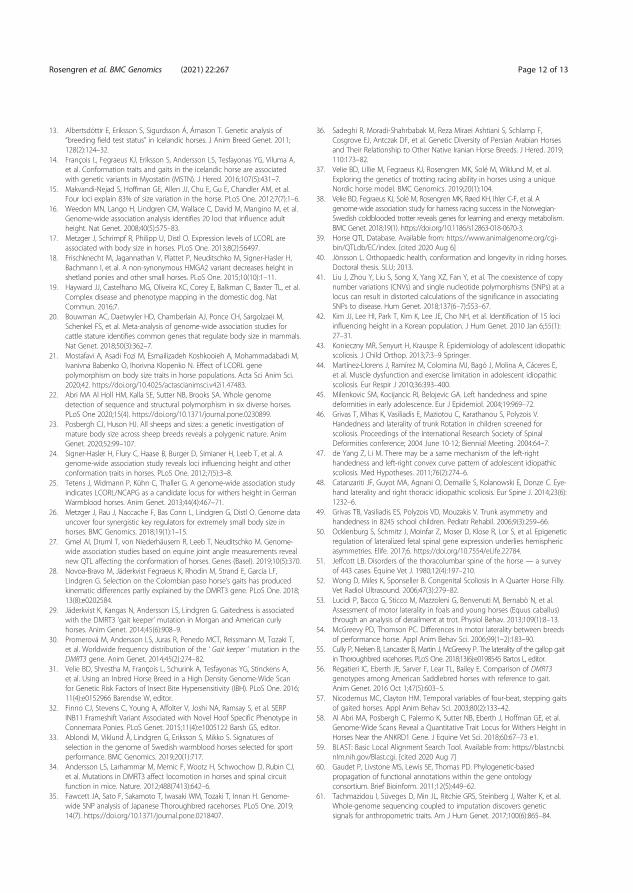
13. Albertsdóttir E, Eriksson S, Sigurdsson Á, Árnason T. Genetic analysis of“breeding field test status” in Icelandic horses. J Anim Breed Genet. 2011;128(2):124–32.
14. François L, Fegraeus KJ, Eriksson S, Andersson LS, Tesfayonas YG, Viluma A,et al. Conformation traits and gaits in the icelandic horse are associatedwith genetic variants in Myostatin (MSTN). J Hered. 2016;107(5):431–7.
15. Makvandi-Nejad S, Hoffman GE, Allen JJ, Chu E, Gu E, Chandler AM, et al.Four loci explain 83% of size variation in the horse. PLoS One. 2012;7(7):1–6.
16. Weedon MN, Lango H, Lindgren CM, Wallace C, David M, Mangino M, et al.Genome-wide association analysis identifies 20 loci that influence adultheight. Nat Genet. 2008;40(5):575–83.
17. Metzger J, Schrimpf R, Philipp U, Distl O. Expression levels of LCORL areassociated with body size in horses. PLoS One. 2013;8(2):56497.
18. Frischknecht M, Jagannathan V, Plattet P, Neuditschko M, Signer-Hasler H,Bachmann I, et al. A non-synonymous HMGA2 variant decreases height inshetland ponies and other small horses. PLoS One. 2015;10(10):1–11.
19. Hayward JJ, Castelhano MG, Oliveira KC, Corey E, Balkman C, Baxter TL, et al.Complex disease and phenotype mapping in the domestic dog. NatCommun. 2016;7.
20. Bouwman AC, Daetwyler HD, Chamberlain AJ, Ponce CH, Sargolzaei M,Schenkel FS, et al. Meta-analysis of genome-wide association studies forcattle stature identifies common genes that regulate body size in mammals.Nat Genet. 2018;50(3):362–7.
21. Mostafavi A, Asadi Fozi M, Esmailizadeh Koshkooieh A, Mohammadabadi M,Ivanivna Babenko O, Ihorivna Klopenko N. Effect of LCORL genepolymorphism on body size traits in horse populations. Acta Sci Anim Sci.2020;42. https://doi.org/10.4025/actascianimsci.v42i1.47483.
22. Abri MA Al Holl HM, Kalla SE, Sutter NB, Brooks SA. Whole genomedetection of sequence and structural polymorphism in six diverse horses.PLoS One 2020;15(4). https://doi.org/10.1371/journal.pone.0230899.
23. Posbergh CJ, Huson HJ. All sheeps and sizes: a genetic investigation ofmature body size across sheep breeds reveals a polygenic nature. AnimGenet. 2020;52:99–107.
24. Signer-Hasler H, Flury C, Haase B, Burger D, Simianer H, Leeb T, et al. Agenome-wide association study reveals loci influencing height and otherconformation traits in horses. PLoS One. 2012;7(5):3–8.
25. Tetens J, Widmann P, Kühn C, Thaller G. A genome-wide association studyindicates LCORL/NCAPG as a candidate locus for withers height in GermanWarmblood horses. Anim Genet. 2013;44(4):467–71.
26. Metzger J, Rau J, Naccache F, Bas Conn L, Lindgren G, Distl O. Genome datauncover four synergistic key regulators for extremely small body size inhorses. BMC Genomics. 2018;19(1):1–15.
27. Gmel AI, Druml T, von Niederhäusern R, Leeb T, Neuditschko M. Genome-wide association studies based on equine joint angle measurements revealnew QTL affecting the conformation of horses. Genes (Basel). 2019;10(5):370.
28. Novoa-Bravo M, Jäderkvist Fegraeus K, Rhodin M, Strand E, García LF,Lindgren G. Selection on the Colombian paso horse’s gaits has producedkinematic differences partly explained by the DMRT3 gene. PLoS One. 2018;13(8):e0202584.
29. Jäderkvist K, Kangas N, Andersson LS, Lindgren G. Gaitedness is associatedwith the DMRT3 ‘gait keeper’ mutation in Morgan and American curlyhorses. Anim Genet. 2014;45(6):908–9.
30. Promerová M, Andersson LS, Juras R, Penedo MCT, Reissmann M, Tozaki T,et al. Worldwide frequency distribution of the ‘ Gait keeper ’ mutation in theDMRT3 gene. Anim Genet. 2014;45(2):274–82.
31. Velie BD, Shrestha M, Franҫois L, Schurink A, Tesfayonas YG, Stinckens A,et al. Using an Inbred Horse Breed in a High Density Genome-Wide Scanfor Genetic Risk Factors of Insect Bite Hypersensitivity (IBH). PLoS One. 2016;11(4):e0152966 Barendse W, editor.
32. Finno CJ, Stevens C, Young A, Affolter V, Joshi NA, Ramsay S, et al. SERPINB11 Frameshift Variant Associated with Novel Hoof Specific Phenotype inConnemara Ponies. PLoS Genet. 2015;11(4):e1005122 Barsh GS, editor.
33. Ablondi M, Viklund Å, Lindgren G, Eriksson S, Mikko S. Signatures ofselection in the genome of Swedish warmblood horses selected for sportperformance. BMC Genomics. 2019;20(1):717.
34. Andersson LS, Larhammar M, Memic F, Wootz H, Schwochow D, Rubin CJ,et al. Mutations in DMRT3 affect locomotion in horses and spinal circuitfunction in mice. Nature. 2012;488(7413):642–6.
35. Fawcett JA, Sato F, Sakamoto T, Iwasaki WM, Tozaki T, Innan H. Genome-wide SNP analysis of Japanese Thoroughbred racehorses. PLoS One. 2019;14(7). https://doi.org/10.1371/journal.pone.0218407.
36. Sadeghi R, Moradi-Shahrbabak M, Reza Miraei Ashtiani S, Schlamp F,Cosgrove EJ, Antczak DF, et al. Genetic Diversity of Persian Arabian Horsesand Their Relationship to Other Native Iranian Horse Breeds. J Hered. 2019;110:173–82.
37. Velie BD, Lillie M, Fegraeus KJ, Rosengren MK, Solé M, Wiklund M, et al.Exploring the genetics of trotting racing ability in horses using a uniqueNordic horse model. BMC Genomics. 2019;20(1):104.
38. Velie BD, Fegraeus KJ, Solé M, Rosengren MK, Røed KH, Ihler C-F, et al. Agenome-wide association study for harness racing success in the Norwegian-Swedish coldblooded trotter reveals genes for learning and energy metabolism.BMC Genet. 2018;19(1). https://doi.org/10.1186/s12863-018-0670-3.
39. Horse QTL Database. Available from: https://www.animalgenome.org/cgi-bin/QTLdb/EC/index. [cited 2020 Aug 6]
40. Jönsson L. Orthopaedic health, conformation and longevity in riding horses.Doctoral thesis. SLU; 2013.
41. Liu J, Zhou Y, Liu S, Song X, Yang XZ, Fan Y, et al. The coexistence of copynumber variations (CNVs) and single nucleotide polymorphisms (SNPs) at alocus can result in distorted calculations of the significance in associatingSNPs to disease. Hum Genet. 2018;137(6–7):553–67.
42. Kim JJ, Lee HI, Park T, Kim K, Lee JE, Cho NH, et al. Identification of 15 lociinfluencing height in a Korean population. J Hum Genet. 2010 Jan 6;55(1):27–31.
43. Konieczny MR, Senyurt H, Krauspe R. Epidemiology of adolescent idiopathicscoliosis. J Child Orthop. 2013;7:3–9 Springer.
44. Martínez-Llorens J, Ramírez M, Colomina MJ, Bagó J, Molina A, Cáceres E,et al. Muscle dysfunction and exercise limitation in adolescent idiopathicscoliosis. Eur Respir J 2010;36:393–400.
45. Milenkovic SM, Kocijancic RI, Belojevic GA. Left handedness and spinedeformities in early adolescence. Eur J Epidemiol. 2004;19:969–72.
46. Grivas T, Mihas K, Vasiliadis E, Maziotou C, Karathanou S, Polyzois V.Handedness and laterality of trunk Rotation in children screened forscoliosis. Proceedings of the International Research Society of SpinalDeformities conference; 2004 June 10-12; Biennial Meeting. 2004:64–7.
47. de Yang Z, Li M. There may be a same mechanism of the left-righthandedness and left-right convex curve pattern of adolescent idiopathicscoliosis. Med Hypotheses. 2011;76(2):274–6.
48. Catanzariti JF, Guyot MA, Agnani O, Demaille S, Kolanowski E, Donze C. Eye-hand laterality and right thoracic idiopathic scoliosis. Eur Spine J. 2014;23(6):1232–6.
49. Grivas TB, Vasiliadis ES, Polyzois VD, Mouzakis V. Trunk asymmetry andhandedness in 8245 school children. Pediatr Rehabil. 2006;9(3):259–66.
50. Ocklenburg S, Schmitz J, Moinfar Z, Moser D, Klose R, Lor S, et al. Epigeneticregulation of lateralized fetal spinal gene expression underlies hemisphericasymmetries. Elife. 2017;6. https://doi.org/10.7554/eLife.22784.
51. Jeffcott LB. Disorders of the thoracolumbar spine of the horse — a surveyof 443 cases. Equine Vet J. 1980;12(4):197–210.
52. Wong D, Miles K, Sponseller B. Congenital Scoliosis In A Quarter Horse Filly.Vet Radiol Ultrasound. 2006;47(3):279–82.
53. Lucidi P, Bacco G, Sticco M, Mazzoleni G, Benvenuti M, Bernabò N, et al.Assessment of motor laterality in foals and young horses (Equus caballus)through an analysis of derailment at trot. Physiol Behav. 2013;109(1):8–13.
54. McGreevy PD, Thomson PC. Differences in motor laterality between breedsof performance horse. Appl Anim Behav Sci. 2006;99(1–2):183–90.
55. Cully P, Nielsen B, Lancaster B, Martin J, McGreevy P. The laterality of the gallop gaitin Thoroughbred racehorses. PLoS One. 2018;13(6):e0198545 Bartos L, editor.
56. Regatieri IC, Eberth JE, Sarver F, Lear TL, Bailey E. Comparison of DMRT3genotypes among American Saddlebred horses with reference to gait.Anim Genet. 2016 Oct 1;47(5):603–5.
57. Nicodemus MC, Clayton HM. Temporal variables of four-beat, stepping gaitsof gaited horses. Appl Anim Behav Sci. 2003;80(2):133–42.
58. Al Abri MA, Posbergh C, Palermo K, Sutter NB, Eberth J, Hoffman GE, et al.Genome-Wide Scans Reveal a Quantitative Trait Locus for Withers Height inHorses Near the ANKRD1 Gene. J Equine Vet Sci. 2018;60:67–73 e1.
59. BLAST: Basic Local Alignment Search Tool. Available from: https://blast.ncbi.nlm.nih.gov/Blast.cgi. [cited 2020 Aug 7]
60. Gaudet P, Livstone MS, Lewis SE, Thomas PD. Phylogenetic-basedpropagation of functional annotations within the gene ontologyconsortium. Brief Bioinform. 2011;12(5):449–62.
61. Tachmazidou I, Süveges D, Min JL, Ritchie GRS, Steinberg J, Walter K, et al.Whole-genome sequencing coupled to imputation discovers geneticsignals for anthropometric traits. Am J Hum Genet. 2017;100(6):865–84.
Rosengren et al. BMC Genomics (2021) 22:267 Page 12 of 13
62. Hnisz D, Abraham BJ, Lee TI, Lau A, Saint-André V, Sigova AA, et al. Super-enhancers in the control of cell identity and disease. Cell. 2013;155(4):934.
63. Hoyt DF, Wickler SJ, Cogger EA. Time of contact and step length: the effectof limb length, running speed, load carrying and incline. J Exp Biol. 2000;203(2):221–7.
64. Sparrow LM, Pellatt E, Yu SS, Raichlen DA, Pontzer H, Rolian C. Gait changesin a line of mice artificially selected for longer limbs. PeerJ. 2017;2017(2):e3008.
65. Pontzer H. Effective limb length and the scaling of locomotor cost interrestrial animals. J Exp Biol. 2007;210(10):1752–61.
66. Cook D, Gallagher PC, Bailey E. Genetics of swayback in AmericanSaddlebred horses. Anim Genet. 2010;41(SUPPL. 2):64–71.
67. WorldFengur The Studbook of Origin for the Icelandic horse. Available from:https://www.worldfengur.com/. [cited 2020 Aug 6]
68. The Icelandic Agricultural Advisory Centre. General Information on BreedingField Tests – Measurements (body measures). Available from: https://www.rml.is/static/files/Hrossaraekt_RML/skrokkmal.pdf. [cited 2020 Aug 6]
69. Aulchenko YS, Ripke S, Isaacs A, van Duijn CM. GenABEL: an R library forgenome-wide association analysis. Bioinformatics. 2007;23(10):1294–6.
70. R Core Team. R: a language and environment for statistical computing.Vienna: Foundation for Statistical Computing; 2015.
71. Rönnegård L, Shen X, Alam M. Hglm: a package for fitting hierarchicalgeneralized linear models. R J. 2010;2(2):20–8.
72. Lander E, Kruglyak L. Genetic dissection of complex traits : reporting linkageresults. Nat Genet. 1995;11:241–7.
73. Duggal P, Gillanders EM, Holmes TN, Bailey-Wilson JE. Establishing anadjusted p-value threshold to control the family-wide type 1 error ingenome wide association studies. BMC Genomics. 2008;9:1–8.
74. Kierczak M, Jabłońska J, Forsberg SKG, Bianchi M, Tengvall K, et al. cgmisc:enhanced genome-wide association analyses and visualization.Bioinformatics. 2015;31:3830–1.
75. National Center for Biotechnology Information. Available from: https://www.ncbi.nlm.nih.gov/. [cited 2020 Aug 6]
76. Stelzer G, Rosen R, Plaschkes I, Zimmerman S, Twik M, Fishilevich S, et al.The GeneCards suite: from gene data mining to disease genome sequenceanalyses. Current Protocols in Bioinformatics. 2016;54:1.30.1–1.30.33.Available from: https://www.genecards.org/. [cited 2020 Aug 6]
Publisher’s NoteSpringer Nature remains neutral with regard to jurisdictional claims inpublished maps and institutional affiliations.
Rosengren et al. BMC Genomics (2021) 22:267 Page 13 of 13
Acta Universitatis Agriculturae Sueciae
Doctoral Thesis No. 2022:9
The overall aims of the thesis were to identify genetic variants associated with
athletic performance and conformation traits in horses, as well as to investigate
the level of inbreeding in Coldblooded trotters. The results contribute to the
understanding of the genetics of complex traits such as athletic performance,
blood pressure regulation, inflammation, and anthropometric traits in horses. This
information may also be valuable for humans and other mammalian species.
Maria Rosengren received her doctoral education at the Department of
Animal Breeding and Genetics, SLU. She obtained her MSc in Veterinary
Medicine at SLU and MSc in Medical Research at Uppsala University.
Acta Universitatis Agriculturae Sueciae presents doctoral theses from the
Swedish University of Agricultural Sciences (SLU).
SLU generates knowledge for the sustainable use of biological natural
resources. Research, education, extension, as well as environmental monitoring
and assessment are used to achieve this goal.
Online publication of thesis summary: http://pub.epsilon.slu.se/
ISSN 1652-6880
ISBN (print version) 978-91-7760-893-6
ISBN (electronic version) 978-91-7760-894-3
Doctoral T
hesis N
o. 2022:9 • Dissecting the genetics of athletic perform
ance and… • M
aria Rosengren
Doctoral Thesis No. 2022:9Faculty of Veterinary Medicine and Animal Science
Dissecting the genetics of athleticperformance and conformation traits in
horses
Maria Rosengren


