Embed Size (px)
Citation preview
Disrupting Representational Infrastructure inConversations Across Disciplines
Rogers HallPeabody College
Vanderbilt University
Reed StevensSchool of Education
University of Washington
Tony TorralbaGraduate School of Education
University of California, Berkeley
In this article, we analyze conversations in consulting meetings where people work across disciplinesto design things. We focus on interactional processes through which people disrupt and attempt tochange representational technologies for scientific and technical classification. Our case material isdrawn from ethnographic and cognitive studies of work in field entomology and architectural design.In both cases, we find common structures of interaction when people work across disciplines. These in-clude selective use of talk, embodied action, and inscription to animate representational states thatmake up design alternatives. Participants from different disciplines animate situations in strikingly dif-ferent ways, but these differences can either go unremarked or be put into coordinated use without ex-plicit, shared understandings. Differences become remarkable either when a design proposal runscounter to deeply held disciplinary objectives or threatens to destabilize a wider network of representa-tional technologies. These kinds of disruptions, and their consequences for representational infrastruc-ture, are a central problem for research on distributed cognition.
INTRODUCTION
Working conversations between disciplinary specialists are places where differences in perspec-tive lead people to see and act on represented objects in different ways. Under what conditions doparticipants in these conversations notice and use disciplinary differences to change existing sys-tems of representation?
MIND, CULTURE, AND ACTIVITY, 9(3), 179–210Copyright © 2002, Regents of the University of California on behalf of the Laboratory of Comparative Human Cognition
Requests for reprints should be sent to Rogers Hall, Peabody College, 162 Wyatt Center, Vanderbilt University, Nash-ville, TN 37203. E-mail: [email protected]
We compare cases of meetings in which people consult across disciplines on design problems. Inthe first case, entomologists solicit advice from a statistician to develop a new device for classifying in-sects. They hope this device will help to stabilize a complex network of representational technologiesthey use to study insect behavior and taxonomy. In the second case, architects, structural engineers,and historical preservationists meet to work on a design scheme for remodeling a historic public li-brary. They (along with their clients) hope to strengthen the building so that it can be classified as safefor public use. Both cases are part of a larger, comparative ethnographic and cognitive study of howmathematics is used in design-oriented work (Hall, 1998; Hall & Stevens, 1995, 1996).
Representational change is a central problem for theories of distributed cognition. Understand-ing, skill, inference, memory, or learning are distributed in ways that allow for coordinated and ef-fective activity, and studying these activities requires that we “move the boundaries of thecognitive unit of analysis out beyond the skin of the individual person” (Hutchins, 1995, p. xiv).We need to understand the development of representational infrastructures for constructing, prop-agating, and interpreting representational states. Here we analyze what happens in interactionwhen infrastructure breaks down, is resisted by participants in activity, or is purposely changed.We call these disruptions to representational infrastructure.
Our approach to this question looks for phenomena within the details of talk-in-interaction aspeople work together (Schegloff, 1992). We also pay close attention to how talk, embodied action,and physical inscription (e.g., writing, drawing, computing) are assembled to construct, juxta-pose, and evaluate representational states (C. Goodwin, 1994; Hall, 1996; Hutchins, 1995;Stevens & Hall, 1998). Our analysis focuses specifically on interactional processes of animationthrough which participants in conversation position themselves and others with respect to relevantevents (M. Goodwin, 1990; Ochs, Jacoby, & Gonzales, 1994). Processes of animation are usedboth (a) to assemble representational states during consulting meetings and (b) to examine criti-cally these very processes of assembly (i.e., to disrupt existing infrastructure). Disrupting repre-sentational infrastructure opens up or challenges historical arrangements for making designworlds visible and sensible (Bucciarelli, 1994; Suchman, 1995). We thus look closely at how par-ticipants make historical material relevant in their interaction (Engeström, 1999a, 1999b; Hall,1999). This analysis of history made present is supported by ethnographic studies in the settingsfrom which these cases were drawn.
In the remainder of this section, we discuss assumptions that are important for our analysis.These concern the distributed and historical character of representational infrastructures that im-plement scientific or technical classification, the role that people play in making and using this in-frastructure, and the settings and conditions under which the infrastructure can be disrupted andchanged. We then present two case studies, analyzing structures of interaction when consultingwork turns to changing the way representational states are assembled. We turn finally to a com-parative analysis across these cases of interdisciplinary consulting, treated as a site for disruptingand changing representational infrastructures that support classification.
REPRESENTATIONAL INFRASTRUCTURE SUPPORTS SCIENTIFICAND TECHNICAL CLASSIFICATION
Categories and classification have been extensively studied as phenomena of individual cognition(Lakoff, 1987; Neisser, 1987; Smith & Medin, 1981). In these studies, the cultural or social basis of
180 HALL, STEVENS, TORRALBA
how people sort out objects and events in their lived worlds has usually been treated as secondary toor arising from the architecture of the individual mind (Anderson, 1990; Sperber, 1994). Our ap-proach to classification reverses this assumption, drawing from an alternative body of work in cul-tural and historical psychology (Cole, 1996), conversation analysis and ethnomethodology (C.Goodwin, 1997; Lynch, 1991; Suchman, 1987), the sociology of science and technology (Bowker& Star, 1999; Latour, 1987; Star, 1996), and theories of distributed cognition (Hutchins, 1995).Here systems of classification are socially constructed, maintained, refined or reorganized, and re-tired—practical accomplishments always distributed over technologies and people.
Within this broad area, two lines of research are important for our interest in how people dis-rupt or change representational infrastructures that support classification. The first is studies of in-formation infrastructure done by Leigh Star, Geof Bowker, and their colleagues across settings asdiverse as the history of international classification of diseases (Bowker & Star, 1994), the devel-opment of a collaboratory for biologists working on the genetics of worms (Star & Ruhleder,1996), and the development of a classification system for nursing (Bowker, Timmermans, & Star,1995). These studies document how infrastructure is historically sedimented and critical for coor-dinating work across distinct communities. Under development, infrastructures for classificationare deeply contested, because they serve different and sometimes conflicting community inter-ests. For example, new categories for classifying nurses’ work create a two-edged visibility forpractitioners, on the one hand allowing them to claim distinct medical services as the province oftheir professional work, but on the other, opening up their work to scrutiny by doctors, hospital ad-ministrators, and insurance companies. New infrastructures stabilize and become useful to the ex-tent that they provide for flexible, local use while still maintaining enough coherence to enablecoordination across local sites and different communities (Star & Griesemer, 1989). Finally, in-frastructure is difficult to study because it is embedded in stable work practices and so transparentin use, only becoming visible when work within or across communities breaks down (Star &Ruhleder, 1996).
The notion that representational infrastructure becomes visible during breakdowns has beentaken up in a second line of research on the historical and distributed nature of “cognition in thewild” (Cole, Engeström, & Vasquez, 1997; Hutchins, 1995). Engeström and his colleagues havestudied learning at work, based on the idea that “disturbances” (Engeström, Brown, Christopher,& Gregory, 1991/1997, p. 374) create a zone of proximal development for learning and organiza-tional change. In a study of sidebar conversations between a judge and lawyers trying a civil courtcase, they found that talk sometimes shifted from “authoritative silencing,” in which the judge de-cides in favor of one or the other lawyer, into forms of “cooperation” or “reflective communica-tion” about changes in court procedure. Different understandings by the judge and trial lawyersstill blocked effective organizational change, leading Engeström et al. to call disturbances to in-frastructure an “invisible battleground” (1991/1997, p. 384; Engeström, 1999b).
Hutchins (1995) also studied processes of adaptation during disruptions to representational in-frastructure, analyzing how power loss to steering and navigational instruments creates a crisis fora team piloting a U.S. Navy helicopter carrier into harbor. Piloting is a distributed cognitive task,accomplished by a team of navigators using a network of historically entrenched representationaldevices (e.g., a fathomoter, telescopic sighting devices, navigational charts showing relevant geo-graphic features, a gyrocompass, and work routines that coordinate among these). Under normalconditions, the team finds the ship’s position on the chart in an iterative “fix cycle” (pp. 26–29). Aseries of representational states can be juxtaposed to make decisions about the anticipated location
DISRUPTING INFRASTRUCTURE 181
of the ship. When this distributed network runs smoothly, the navigational system is robust: Thereare “ad hoc divisions of labor” (p. 220) in which team members complement each others’ actionswith devices, forms of “mutual monitoring” (p. 221) that provide redundant assessments of theship’s progress, and uses of public talk that support processes of evaluation and repair at a distance(e.g., announcing what a less experienced navigator ought to see over the intercom).
When power fails, this infrastructure is disrupted. Some devices become inoperable (e.g., thegyrocompass) and people on the navigation team need to reorganize their activities to meet the de-mands of a fast-moving fix cycle. Hutchins analyzes closely (pp. 321–345) how two team mem-bers reorganize the fix cycle—using different representational devices to regroup calculations andminimize effort at the chart table. Once the ship rests safe at anchor, what develops from the re-sponse to this disruption is a short-term change in the “cognitive ecology” (p. 346) of navigationaboard this ship. No explicit representation of the reorganized system is saved, the participantsmove on to other jobs, and conventional navigational practices resume once power (and layers ofinfrastructure above it) is restored.
For our analysis, Star’s work provides an account of representational infrastructure, how it in-volves historically sedimented layers of technology and human practice that become visible dur-ing disruptions, and how changes in infrastructure cut across the interests and practices ofmultiple communities. Engeström’s studies foreground disruptions (or disturbances) as a method-ological strategy, following conflicting perspectives into episodes of local interaction where peo-ple reflectively set out to change work organization. Finally, Hutchins’ work focuses directly onthe link between infrastructure and ongoing activity, opening up the local, interactional work peo-ple do as they attempt to deal with an unexpected disruption. When a stable infrastructure breaksdown unexpectedly, or when participants are actively engaged in bringing the disruption about,how do people actively redistribute cognition?
SETTINGS DIFFER IN RESOURCES AVAILABLE FOR CHANGINGREPRESENTATIONAL INFRASTRUCTURE
Ship or airline navigation are particular kinds of activity, perhaps typical of “high reliability” orga-nizations (Rochlin, La Porte, & Roberts, 1987; Roberts, 1993). Yet, across a broader collection oforganizational sites—civil courts, medical centers, scientific collaboratories, information systemdesign, field entomology, and architectural design—what kinds of resources are available forchanging representational infrastructure?
In our settings, people focus intensely on the classification of scientific or technical objects, us-ing layers of representational technology. Among the entomologists, work is dominated by theneed to construct and stabilize new technologies for classifying insects, which are used to makenovel claims about a wide variety of instances. The ontological gradient is reversed for architec-tural designers, whose work is dominated by transforming a single instance (e.g., a building) sothat it can be successfully classified by a wide variety of existing technical categories (e.g., stateand municipal codes governing seismic stability for public buildings).
In both settings, difficulties arise that lead people to challenge or attempt to reorganize technol-ogies for classification. In the case of field entomology, a consulting meeting has been called tofind a new, more powerful representational device for classifying samples of insects—the disrup-tion is already under way. In the case of architectural design, different specialists meet to find a
182 HALL, STEVENS, TORRALBA
design scheme that will preserve and strengthen a historically significant public building. As theyconsider different schemes, a conflict across disciplines leads to an extended challenge against ex-isting technical categories.
Both cases involve disruptions to infrastructure, the first a matter of displacing one device withanother, the second a matter of dissent from existing means of classification. By displacing onedevice with another, the entomologists can make their scientific claims about new or reorganizedclasses of insects stronger. By dissenting against existing means of classifying buildings, a designspecialist can argue for a remodeling scheme that better preserves a historical building. Displace-ment and dissent are both means of disrupting representational infrastructure. However, they runtime in different directions along a developmental axis for scientific and technical classification(Latour, 1987). Displacement anticipates dissent by making representational infrastructure stron-ger; dissent unravels and challenges the history of existing infrastructure, proposing alternatemeans and outcomes for classification.
MAKING A NEW DEVICE TO SORT TERMITESINTO SPECIES AND COLONIES
The BugHouse is our pseudonym for a group of entomologists working at a federal experiment sta-tion in northern California. They do a combination of basic and applied research on “the chemicalecology of forest insects” (unless otherwise noted, quoted terms are used by participants; all namesare pseudonyms). The leader of the BugHouse group, Mark, has built a research program aroundthe study of subterranean termites. These are “cryptic” species, in the sense that they are not visibleor even easily found in forested areas, yet they play a major role in forest ecosystems. For example,pine-boring beetles might kill a tree, and when the tree falls, termites and ants break up and con-sume the downed wood, eventually turning these materials back into the soil. Applied research atthe BugHouse involves finding new technologies for detecting, monitoring, and “baiting” (or poi-soning) termite colonies that have infested residential or commercial buildings.
To find and follow termites, researchers at the BugHouse superimpose two-dimensional“plots” of sampling stations over forested or residential areas, then they use wooden baits in thesestations to collect samples of foraging termites over regular intervals of time. Termite samples areclassified by species and different colonies within a species, while baits are analyzed for wood lostto termite feeding. Traditionally, entomologists have classified termite species based on morpho-logical characters, such as the length of a mature worker’s head, as well as on tests of their fightingbehavior (i.e., termites from different species, and even different colonies within a species, willfight to the death). Researchers at the BugHouse are developing new methods of “chemical taxon-omy” that make species and colony classifications by comparing chemical residues found on theexoskeletons of insects, using gas chromatography and mass spectroscopy. They call these newmeans of classification “chemical fingerprints,” and their claims for these methods, as well as newtermite species they have discovered, are controversial in the field of entomology.
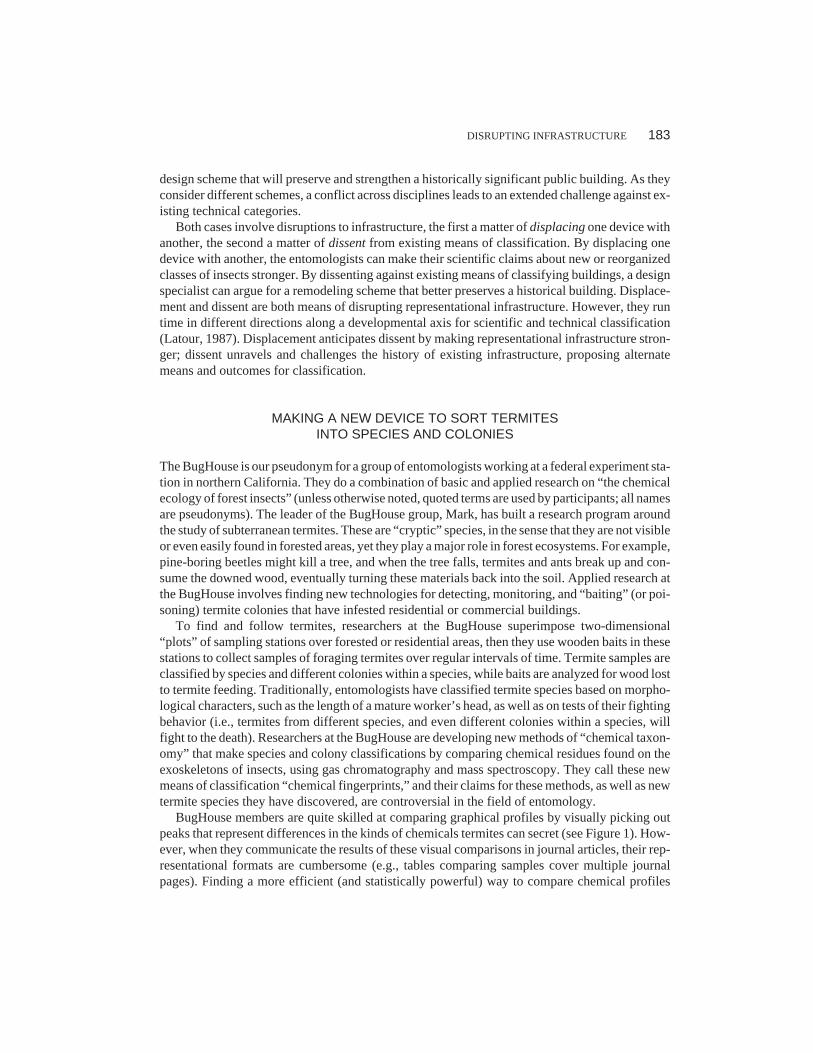
BugHouse members are quite skilled at comparing graphical profiles by visually picking outpeaks that represent differences in the kinds of chemicals termites can secret (see Figure 1). How-ever, when they communicate the results of these visual comparisons in journal articles, their rep-resentational formats are cumbersome (e.g., tables comparing samples cover multiple journalpages). Finding a more efficient (and statistically powerful) way to compare chemical profiles
DISRUPTING INFRASTRUCTURE 183
would advance the group’s efforts to stabilize their findings about termites and to make claims formethods of chemical taxonomy.
In the consulting meeting we analyze, the BugHouse team asked to meet with a statistician whoalso works in the experiment station, with the explicit purpose of replacing one technology (visualcomparison and multiple tests of significance) for implementing a classification with another. TheBugHouse members at this meeting include Mark, the group leader and a senior scientist; Gary,another senior scientist interested in evolutionary problems; and Leah, rated as a “biological tech-nician” but the group’s resident expert on chemistry (i.e., she does all their gas chromatographywork). The statistician, Browning (we use his last name, as do members of the BugHouse team),has been invited to help develop new ways to compare chemical profiles and classify termite spe-cies or colonies.
Animating the Foraging Study Inscription Device (Turn 1)
As the meeting gets started, Mark (lead entomologist) proposes they focus on problems of commu-nity ecology in the team’s study of termite foraging behavior. They have found three termite spe-cies, and he wants to use methods of chemical taxonomy to find and follow interactions betweendifferent termite colonies within these species. Mark’s extended first turn animates the locations ofsamples within a study “plot,” the activities of termites and field workers in this plot, and the sub-stantive link between fieldwork and laboratory analysis. As he puts it, species differences are “easyto find” as a “drastic qualitative change” in chemical profiles, but colony differences are more dif-ficult to classify.
184 HALL, STEVENS, TORRALBA
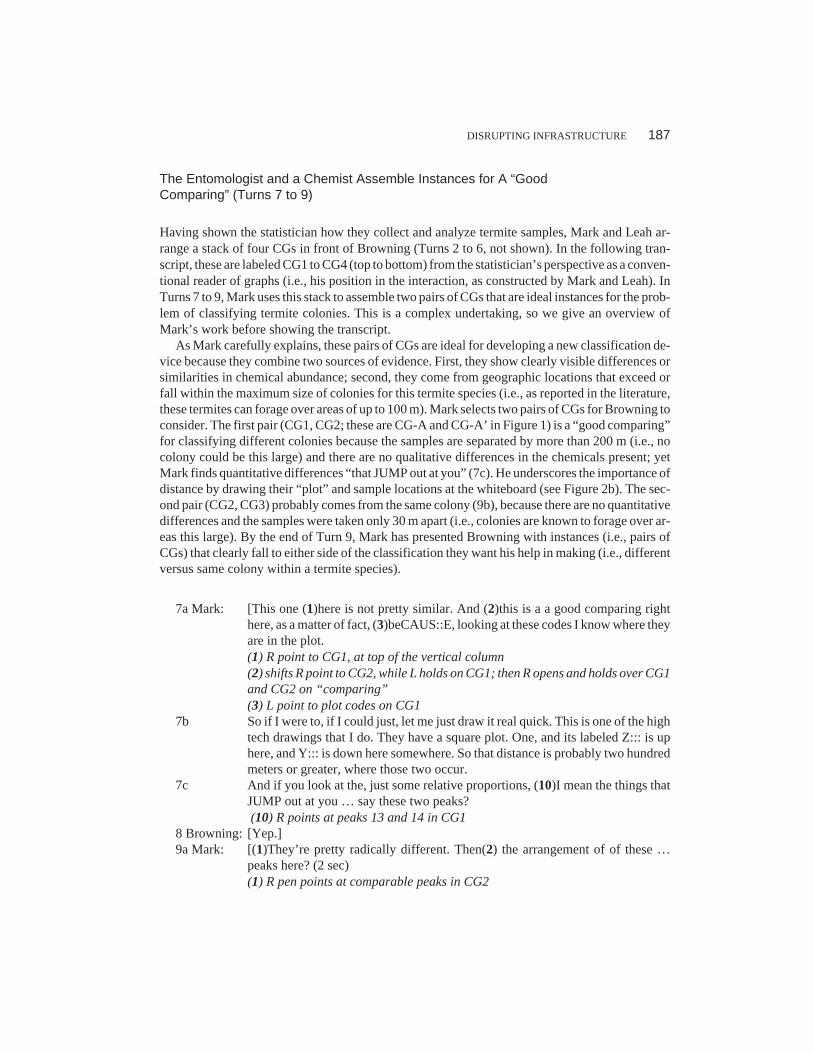
FIGURE 1 Three chromatograms (CGs) produced from a waxy residue on the exoskeletons oftermites. These graphs show the relative abundance (y-axis) of specific hydrocarbons that areidentified by their retention time (x-axis) in a gas chromatography machine. CG-A and CG-A’are from the same termite species but different colonies, because the graphs show “quantitativedifferences” in the abundance of hydrocarbons but no “qualitative difference” in which hydro-carbons are present. CG-C is from a different termite species than the others, because the graphshows “qualitative differences” in which hydrocarbons are present.
We divide Mark’s extended turn into four parts (listed 1a to 1d), each accomplishing a differentpurpose as the meeting gets started. When transcribed closely (see Appendix A for transcript con-ventions), Mark produces 10 visually prominent action sequences within this talk. To save spaceand foreground phenomena that are important for our analysis, we list only six of these below theutterance in which they appear (actions 3 through 8, numbered within the turn in bold).
1a Mark: See my my question … is around population or community ecology and not nec-essary … evolutionary relationships. Which is where this PAUP analysis thatGary talks about, uh, is involved.
1b I just want to know … (3)if we have three species, how many different COL-ONIES of each species might we have (4)in this plot, and how might they interact.(3) L hand open over table, beats/points at different locations on “three species,”then beats over these positions on “COLONIES”(4) hands bound region at center on “plot,” then fingers of each hand come to-gether and fan open on “interact”
1c Eventually we’ll want to know if, if they shift? (5) Like if this station, one day hasspecies A and the next day has species B, that should be (6) easy to find. You know(7) when, when we sample these things monthly, (8) we’ll know if we get a drasticqualitative change in the chromatogram.(5) hands form a cylinder, pushed down on table and held at “station”(6) L points to stack of 3 CGs, used earlier to show different species, includingCG-C in Figure 1(7) L circles twice, above position of cylinder formed at (5), as if pulling termitesout of the ground(8) L points to stack of CGs, same area as (6)
1d What if we get a quantitative? You know, all of a sudden it looks different. AndLeah’s about to …
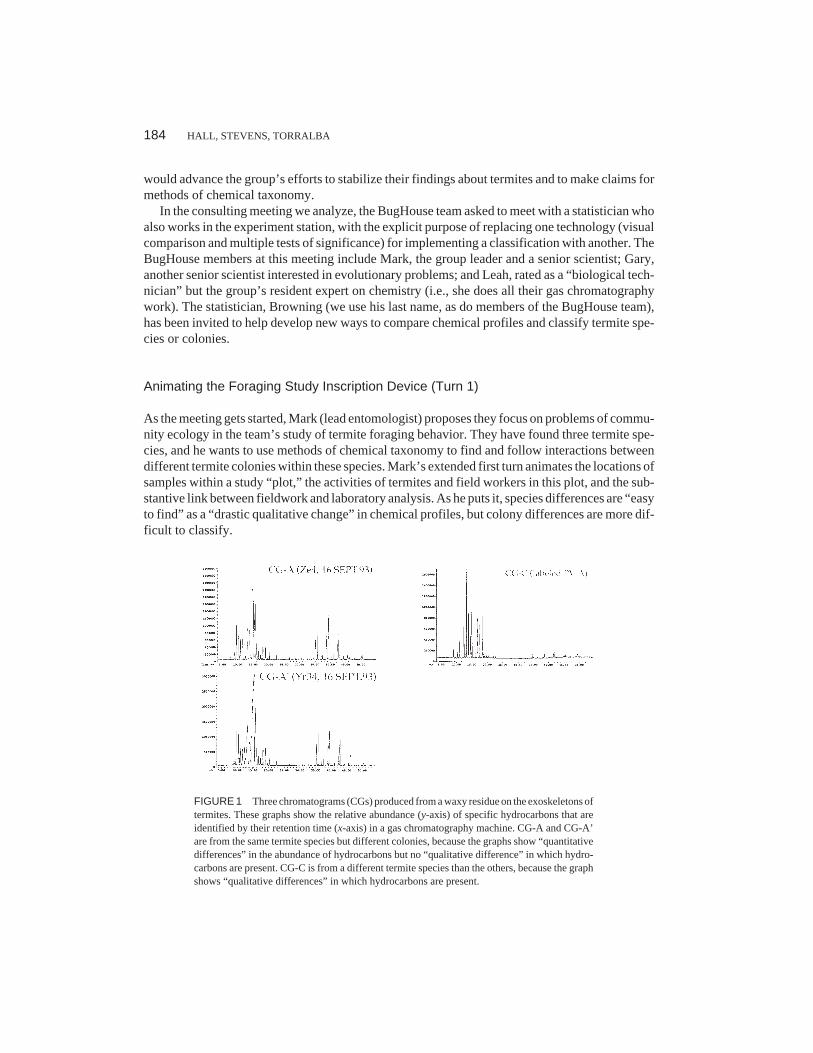
Mark’s animation makes a complex chain of inscription at the BugHouse visible to the statisti-cian and to us. In the first part (Turn 1b), Mark shows how colonies are found inside the “plots”they have constructed over the forest floor. He does this by pointing to distinct locations on the ta-ble surface between he and Browning (Turn 1b, action 3, henceforth designated 1b[3]), and allparticipants in the meeting direct their gaze to this space. Then, at 1b(4), Mark uses his hands toform a “plot,” held as a spatial enclosure over the separate locations he has just shown (see Figure2a). From the boundary of this plot, his fingers (“they”) move to the center and then fan out, as ifdepicting the interactions of individual insects. By coordinating talk with manual depiction, Markanimates important aspects of geography in their foraging study (i.e., termite samples are takenfrom widely dispersed locations in their two dimensional “plot”) as well as the activities of ter-mites within that geography (i.e., foraging interactions of individual termites/fingers).
In the second part of this animation (Turn 1c), Mark describes how they follow the movementof termites over time, and he illustrates a critical relation between field and lab activities. At 1c(5),Mark forms and places a sampling “station” inside what he earlier called a “plot.” As we show inFigure 2a, this sampling station is held fixed as he describes finding different species on differentdays. At 1c(6), Mark points to a stack of CGs that he and Leah had assembled earlier to show dif-
DISRUPTING INFRASTRUCTURE 185
ferent termite species (one of these is CG-C, in Figure 1). Across these two utterances (1c[5] and1c[6]), Mark shifts in talk and action from the field (i.e., “this station,” formed with his hands) totheir chemical analysis in the laboratory (i.e., a stack of CGs showing distinctly different chemicalprofiles). Different termite species would be “easy to find” because they show “qualitative”chemical differences in the laboratory. Mark repeats this animation of the relation between fieldand laboratory work at 1c(7) and 1c(8).
186 HALL, STEVENS, TORRALBA
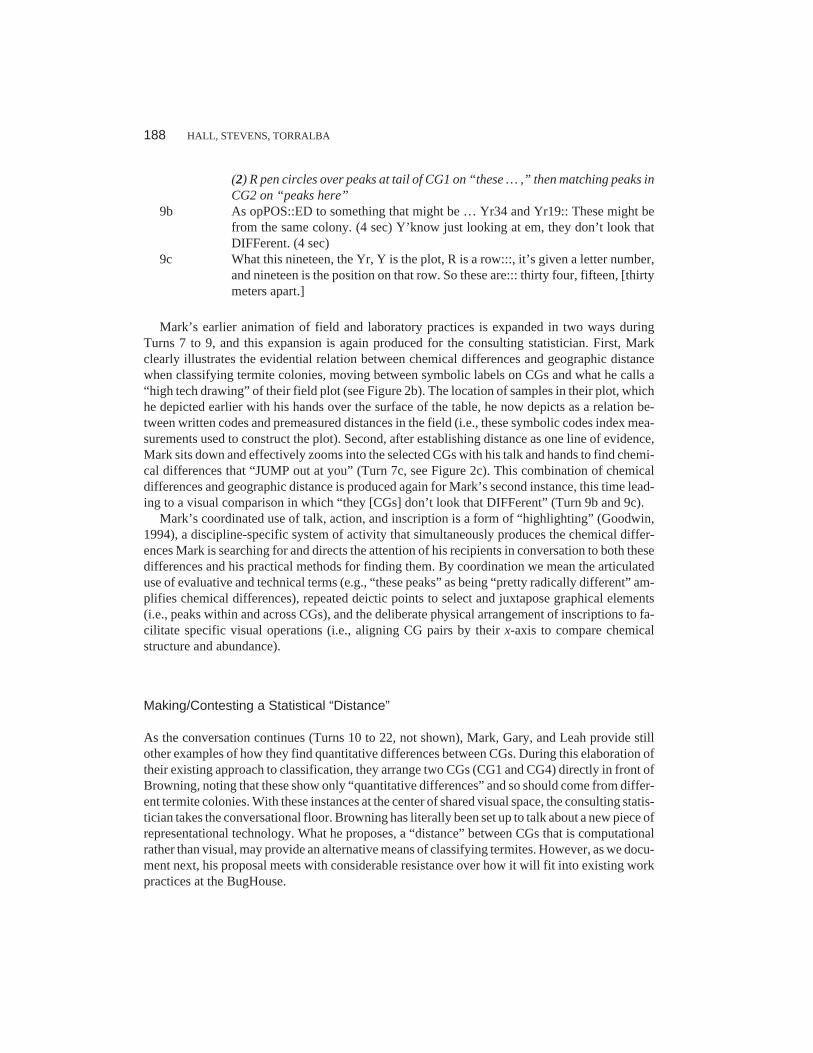
FIGURE 2 Three aspects of coordination in Mark’s animation of field and laboratory work at the BugHouse. InFigure 2a (Turn1), Mark animates a conceptual link between field and laboratory technologies for classifying spe-cies (qualitative differences) and colonies within species (quantitative differences). In Figure 2b (Turn 7), he mapssymbolic labels from CGs onto a “hi tech drawing” of the distance between samples in their field plot. In Figure 2c(Turns 7 and 9), Mark directs visual attention to the relative abundance of specific hydrocarbon peaks in two CGsselected from a stack of species A.
The Entomologist and a Chemist Assemble Instances for A “GoodComparing” (Turns 7 to 9)
Having shown the statistician how they collect and analyze termite samples, Mark and Leah ar-range a stack of four CGs in front of Browning (Turns 2 to 6, not shown). In the following tran-script, these are labeled CG1 to CG4 (top to bottom) from the statistician’s perspective as a conven-tional reader of graphs (i.e., his position in the interaction, as constructed by Mark and Leah). InTurns 7 to 9, Mark uses this stack to assemble two pairs of CGs that are ideal instances for the prob-lem of classifying termite colonies. This is a complex undertaking, so we give an overview ofMark’s work before showing the transcript.
As Mark carefully explains, these pairs of CGs are ideal for developing a new classification de-vice because they combine two sources of evidence. First, they show clearly visible differences orsimilarities in chemical abundance; second, they come from geographic locations that exceed orfall within the maximum size of colonies for this termite species (i.e., as reported in the literature,these termites can forage over areas of up to 100 m). Mark selects two pairs of CGs for Browning toconsider. The first pair (CG1, CG2; these are CG-A and CG-A’ in Figure 1) is a “good comparing”for classifying different colonies because the samples are separated by more than 200 m (i.e., nocolony could be this large) and there are no qualitative differences in the chemicals present; yetMark finds quantitative differences “that JUMP out at you” (7c). He underscores the importance ofdistance by drawing their “plot” and sample locations at the whiteboard (see Figure 2b). The sec-ond pair (CG2, CG3) probably comes from the same colony (9b), because there are no quantitativedifferences and the samples were taken only 30 m apart (i.e., colonies are known to forage over ar-eas this large). By the end of Turn 9, Mark has presented Browning with instances (i.e., pairs ofCGs) that clearly fall to either side of the classification they want his help in making (i.e., differentversus same colony within a termite species).
7a Mark: [This one (1)here is not pretty similar. And (2)this is a a good comparing righthere, as a matter of fact, (3)beCAUS::E, looking at these codes I know where theyare in the plot.(1) R point to CG1, at top of the vertical column(2) shifts R point to CG2, while L holds on CG1; then R opens and holds over CG1and CG2 on “comparing”(3) L point to plot codes on CG1
7b So if I were to, if I could just, let me just draw it real quick. This is one of the hightech drawings that I do. They have a square plot. One, and its labeled Z::: is uphere, and Y::: is down here somewhere. So that distance is probably two hundredmeters or greater, where those two occur.
7c And if you look at the, just some relative proportions, (10)I mean the things thatJUMP out at you … say these two peaks?(10) R points at peaks 13 and 14 in CG1
8 Browning: [Yep.]9a Mark: [(1)They’re pretty radically different. Then(2) the arrangement of of these …
peaks here? (2 sec)(1) R pen points at comparable peaks in CG2
DISRUPTING INFRASTRUCTURE 187
(2) R pen circles over peaks at tail of CG1 on “these … ,” then matching peaks inCG2 on “peaks here”
9b As opPOS::ED to something that might be … Yr34 and Yr19:: These might befrom the same colony. (4 sec) Y’know just looking at em, they don’t look thatDIFFerent. (4 sec)
9c What this nineteen, the Yr, Y is the plot, R is a row:::, it’s given a letter number,and nineteen is the position on that row. So these are::: thirty four, fifteen, [thirtymeters apart.]
Mark’s earlier animation of field and laboratory practices is expanded in two ways duringTurns 7 to 9, and this expansion is again produced for the consulting statistician. First, Markclearly illustrates the evidential relation between chemical differences and geographic distancewhen classifying termite colonies, moving between symbolic labels on CGs and what he calls a“high tech drawing” of their field plot (see Figure 2b). The location of samples in their plot, whichhe depicted earlier with his hands over the surface of the table, he now depicts as a relation be-tween written codes and premeasured distances in the field (i.e., these symbolic codes index mea-surements used to construct the plot). Second, after establishing distance as one line of evidence,Mark sits down and effectively zooms into the selected CGs with his talk and hands to find chemi-cal differences that “JUMP out at you” (Turn 7c, see Figure 2c). This combination of chemicaldifferences and geographic distance is produced again for Mark’s second instance, this time lead-ing to a visual comparison in which “they [CGs] don’t look that DIFFerent” (Turn 9b and 9c).
Mark’s coordinated use of talk, action, and inscription is a form of “highlighting” (Goodwin,1994), a discipline-specific system of activity that simultaneously produces the chemical differ-ences Mark is searching for and directs the attention of his recipients in conversation to both thesedifferences and his practical methods for finding them. By coordination we mean the articulateduse of evaluative and technical terms (e.g., “these peaks” as being “pretty radically different” am-plifies chemical differences), repeated deictic points to select and juxtapose graphical elements(i.e., peaks within and across CGs), and the deliberate physical arrangement of inscriptions to fa-cilitate specific visual operations (i.e., aligning CG pairs by their x-axis to compare chemicalstructure and abundance).
Making/Contesting a Statistical “Distance”
As the conversation continues (Turns 10 to 22, not shown), Mark, Gary, and Leah provide stillother examples of how they find quantitative differences between CGs. During this elaboration oftheir existing approach to classification, they arrange two CGs (CG1 and CG4) directly in front ofBrowning, noting that these show only “quantitative differences” and so should come from differ-ent termite colonies. With these instances at the center of shared visual space, the consulting statis-tician takes the conversational floor. Browning has literally been set up to talk about a new piece ofrepresentational technology. What he proposes, a “distance” between CGs that is computationalrather than visual, may provide an alternative means of classifying termites. However, as we docu-ment next, his proposal meets with considerable resistance over how it will fit into existing workpractices at the BugHouse.
188 HALL, STEVENS, TORRALBA
The statistician contrasts visual and computational means of finding differences (Turns23 to 26). Browning prefaces his contribution as the joint work of “how we go about de-fining a distance,” something that stands in contrast to what the BugHouse group currentlydoes (“You’re trying to use your eyes … ,” Turn 23, italics added). Yet when Browningmentions the “differences” that these entomologists have just been demonstrating, Markleans back in his seat and looks up at the visiting statistician. Browning begins to pause,and Mark interrupts with an emphatic contrast between “DIFFERENCES” and “distances”(Turn 24). As Mark interrupts, Browning quickly retracts his hand from the stack of CGs at25(1), then he agrees to and repeats what Mark proposes as the preferred, technical term(“differences”).
23 Browning:Ok let’s, part, part of the thing is, is how you define, again how we go about defin-ing a distance (of it). (2)You’re trying to use your eyes to, to uh, to to match thesetwo up and see where there are differences and [where there aren’t … but](2) gaze to CGs, R point traces up and down vertical on “your eyes,” then contin-ues vertical tracing across horizontal axis of CG1 and CG4
24 Mark: [(1)DIFFERENCES], [not distances, differences](1) leans back, raises head and eyebrows, gaze to Browning; Browning begins topause
25 Browning:[(1)] Y, yeh, [(2)differences](1) quickly retracts R hand, held over CGs(2) flat R hand beats over CGs
26 Mark: [Yeh]
Several things are important in this opening exchange. First, the visiting statistician contrasts whatBugHouse team members currently do with their eyes (i.e., a collective “you”) with what “we,” as par-ticipants in this consultation across disciplines, will do by means of calculation. This initial utteranceexplicitly marks changes in time (i.e., existing versus proposed activity) and in disciplinary perspec-tive (i.e., what “you” entomologists do versus what “we” will do together). Second, and in an apparentresponse to Mark’s emphatic contrast, Browning momentarily retracts his hands from a pair of CGsthat provides an instance of what Mark earlier called a “good comparing” (i.e., different colonies, samespecies). What is interrupted is not just Browning’s utterance, but also the terms he uses and the way inwhich he uses his hands to coordinate language with parts of these graphical displays. Third, whatBrowning calls “a distance” (Turn 23) and what Mark calls “distances” (Turn 24) are not equivalent,and further evidence for quite different disciplinary meanings comes over the next several turns at talk.
The statistician reformulates his proposal for a new “distance” (Turns 27 to 29a, notshown). While Browning momentarily drops “distance” in favor of “differences,” he quicklyreformulates his proposed contribution in terms of the presumed needs of the entomological re-search community. As he puts it, they are working together (“we’re trying,” italics added) to find areplicable or “more standard” way to convert multiple differences into a single number. Mark em-phatically agrees with this reformulation of what they are doing (“I’d LOVE, I’d love that”), andthe conversation continues.
DISRUPTING INFRASTRUCTURE 189
What the entomologists mean by “distances” is still out of alignment with “the distance” thatBrowning proposes they will define. “Distances” that organize the fieldwork of entomologists(Turn 24 and earlier) may turn out to be incompatible with a statistical “distance” that takes multi-ple differences into a single number.
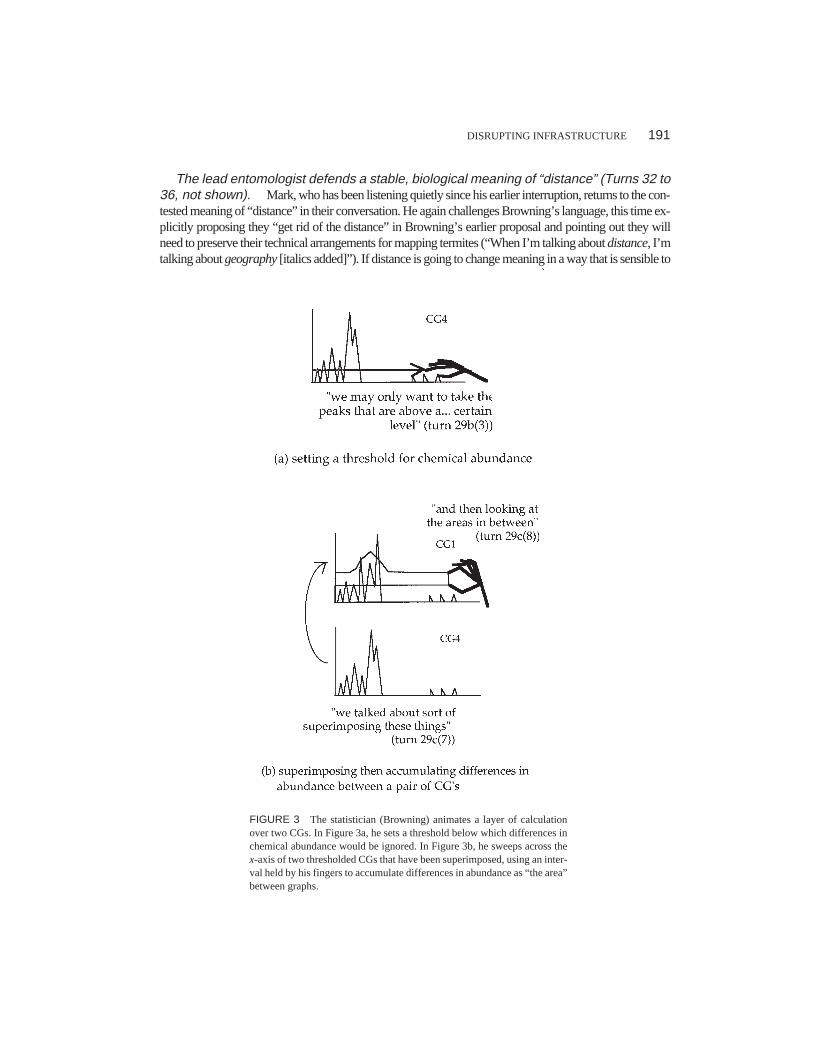
The statistician animates operations that could implement a new “distance” (Turn29b). Having regained the conversational floor, Browning next proposes a “distance” that in-volves a sequence of statistical operations. He animates these operations in layers over the sur-face of two CGs on the table surface between he and Mark. In this more detailed proposal, calcu-lating “a distance” is manually illustrated as statistical operations over entire graphical profiles.These are quite different from the peak-wise comparisons of entomologists (Turns 7 to 9).
29b Browning:Because again we may only want to take (3)the peaks that are above a … certainlevel. And that’s per:fec:tly legitimate to do. (4)That we want to get rid of thesesmaller peaks and not let them be a nuisance, at all. That it’s(5) only the higherpeaks that we wanna(6) compare the distances from.(3) R held flat, cuts horizontal through CG4, then holds as gaze rises to Mark(4) both hands point to rightmost peaks in CG4, gaze from Mark to Leah(5) R held flat, repeats horizontal cut of CG4(6) R thumb and index finger line up large peaks across CG4 and CG1
29c Uh, we talked about, (7)sort of superimposing these things before and (8)then lookingat the areas in between. Which is another way to characterize the difference. Um …(7) R index sweeps up from CG4 and traces across CG1(8) R index and thumb form an interval, which traces across CG1, then holds andbeats on “difference”
29d which means down here with the smaller peaks, it means this isn’t gonna influ-ence things very much. Which sort of says that the, um … If one has a little peakhere, but this one doesn’t have any, that’s still a little difference. Even though,qualitatively one has it and the other doesn’t.
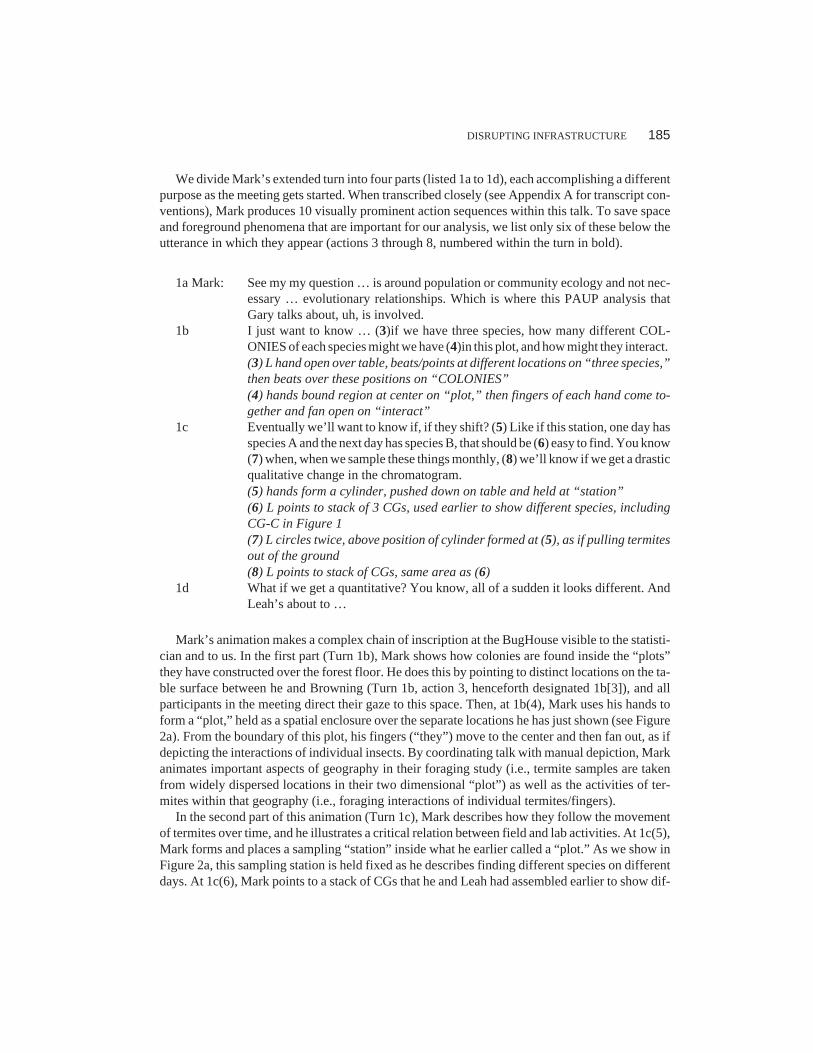
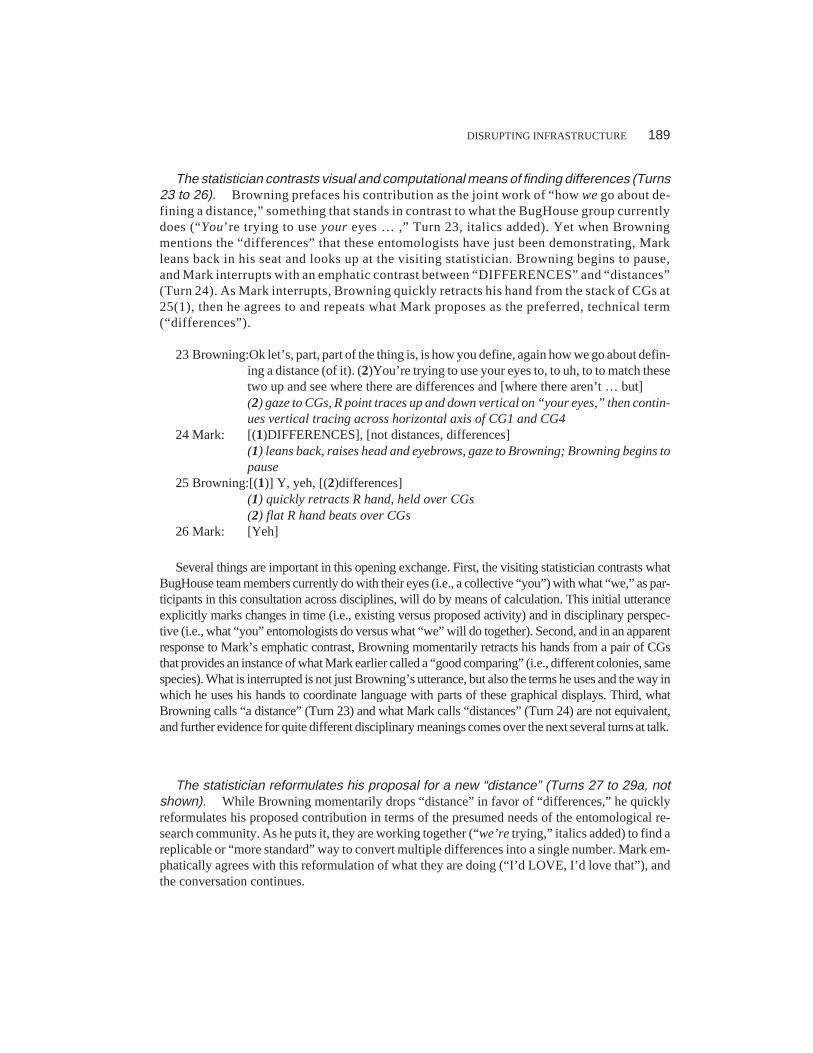
Rather than picking chemicals out of each profile for comparison, Browning’s first sugges-tion is to set a threshold on abundance (i.e., the vertical axis in each CG). Below this threshold,peaks (i.e., chemicals) that might contribute relevant biological differences would not be con-sidered at all (see Figure 3a). Rather than physically arranging CGs for visual inspection,Browning’s second suggestion is to superimpose one CG onto another and then to calculate thedifference in area between them (Turn 29c; Figure 3b). He illustrates this with a gesture (29c[8])that sweeps across the proposed superimposition, collecting differences into a single quantitywith his fingers. While the entomologists handle CGs as collections of distinct chemical struc-tures (i.e., the peak-wise comparisons animated by Mark in Turns 7 and 9), the visiting statisti-cian treats CGs as unit inputs to a complex calculation. What Mark called “distances” in hisearlier, emphatic contrast with “DIFFERENCES” (Turn 24) are clearly not what Browningmeans by “a distance” (Turn 23), “one number,” or “how you characterize the distance” (Turns27 and 29a, not shown).
190 HALL, STEVENS, TORRALBA
The lead entomologist defends a stable, biological meaning of “distance” (Turns 32 to36, not shown). Mark, who has been listening quietly since his earlier interruption, returns to the con-tested meaning of “distance” in their conversation. He again challenges Browning’s language, this time ex-plicitly proposing they “get rid of the distance” in Browning’s earlier proposal and pointing out they willneed to preserve their technical arrangements for mapping termites (“When I’m talking about distance, I’mtalking about geography [italics added]”). If distance is going to change meaning in a way that is sensible to
DISRUPTING INFRASTRUCTURE 191
FIGURE 3 The statistician (Browning) animates a layer of calculationover two CGs. In Figure 3a, he sets a threshold below which differences inchemical abundance would be ignored. In Figure 3b, he sweeps across thex-axis of two thresholded CGs that have been superimposed, using an inter-val held by his fingers to accumulate differences in abundance as “the area”between graphs.
entomologists (in and out of the BugHouse team), then the role of geography in holding together their workwill need to be carefully preserved. This time Browning interrupts, summarizing his own proposal for a“measure” that takes a pair of chromatograms as discrete inputs and produces a clearly defined output.
Aligning Old and New Technologies to Classify Differences
We chose this consulting meeting because it had been arranged to solicit advice from a statistician(Browning) about how to improve existing representational technologies for comparing chemicalprofiles. The BugHouse team hoped to find a way that was simpler and, possibly, more powerfulfor detecting biologically relevant differences between termite samples. In our analysis, the inter-action up to this point has produced three critical events:
(Turns 1 to 9) Entomologists have animated a detailed account of work practices and represen-tational technologies that span field and laboratory sites (i.e., the gridded “plot,” sampling sched-ules, geographic distance, and visual comparison of coded graphical profiles), culminating in theselection of instances that are ideal for classifying same/different termite colonies.
(Turns 23 to 29) The statistician has proposed replacing their existing visual practices with anew representational technology, animated as a series of statistical operations that take multiple,peak-wise differences into a single number or measure (a “distance”).
(Turns 24 and 32 to 36) A conflict has emerged over distinctly different work practices andmeanings associated with “distance”—what entomologists take as an independent source of evi-dence (geography) that can be combined with chemistry, the statistician treats as the outcome of acomputational process.
As the conversation continues (Turns 37 to 39, not shown), Browning consolidates aspects ofhis earlier proposals into a statistical process that takes “ALL of this information from all of thesepeaks” into a single number. This is a new, distinctly nongeographical meaning for distance. If apair of CGs are “far enough away” from each other in this new terrain, judged against a distancethat is established for “sampling error,” then they can be classified as “definitely DIFFerent …”
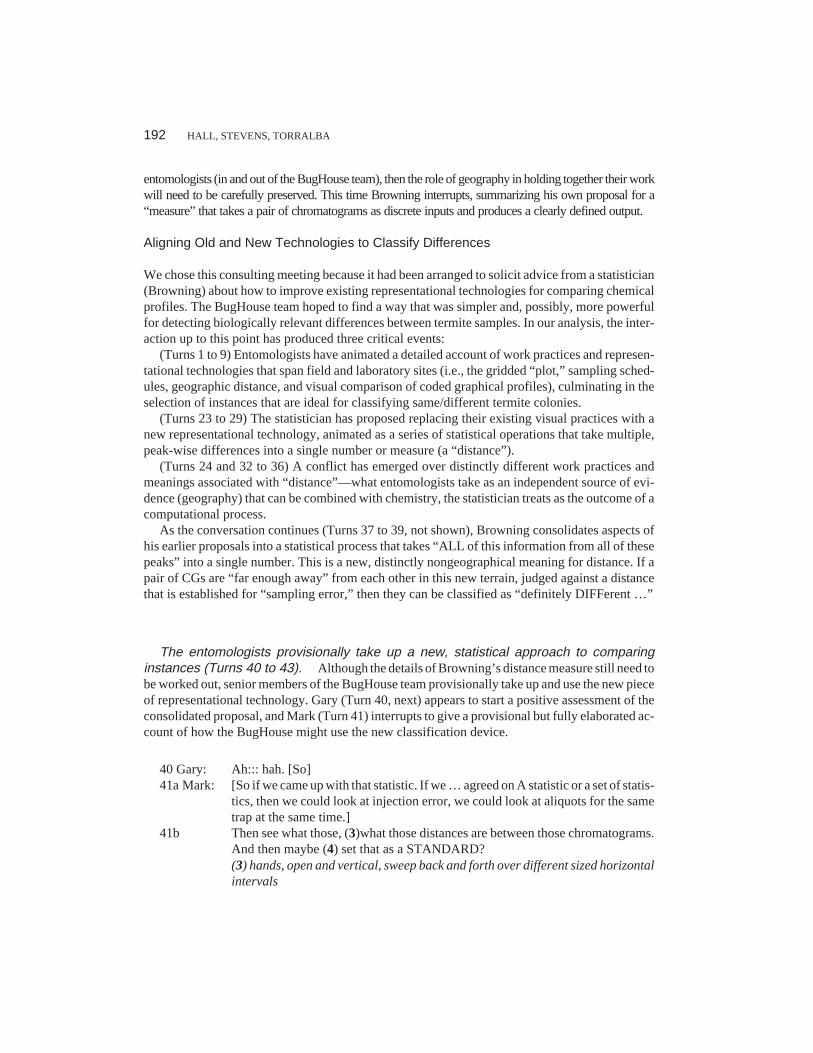
The entomologists provisionally take up a new, statistical approach to comparinginstances (Turns 40 to 43). Although the details of Browning’s distance measure still need tobe worked out, senior members of the BugHouse team provisionally take up and use the new pieceof representational technology. Gary (Turn 40, next) appears to start a positive assessment of theconsolidated proposal, and Mark (Turn 41) interrupts to give a provisional but fully elaborated ac-count of how the BugHouse might use the new classification device.
40 Gary: Ah::: hah. [So]41a Mark: [So if we came up with that statistic. If we … agreed on A statistic or a set of statis-
tics, then we could look at injection error, we could look at aliquots for the sametrap at the same time.]
41b Then see what those, (3)what those distances are between those chromatograms.And then maybe (4) set that as a STANDARD?(3) hands, open and vertical, sweep back and forth over different sized horizontalintervals
192 HALL, STEVENS, TORRALBA
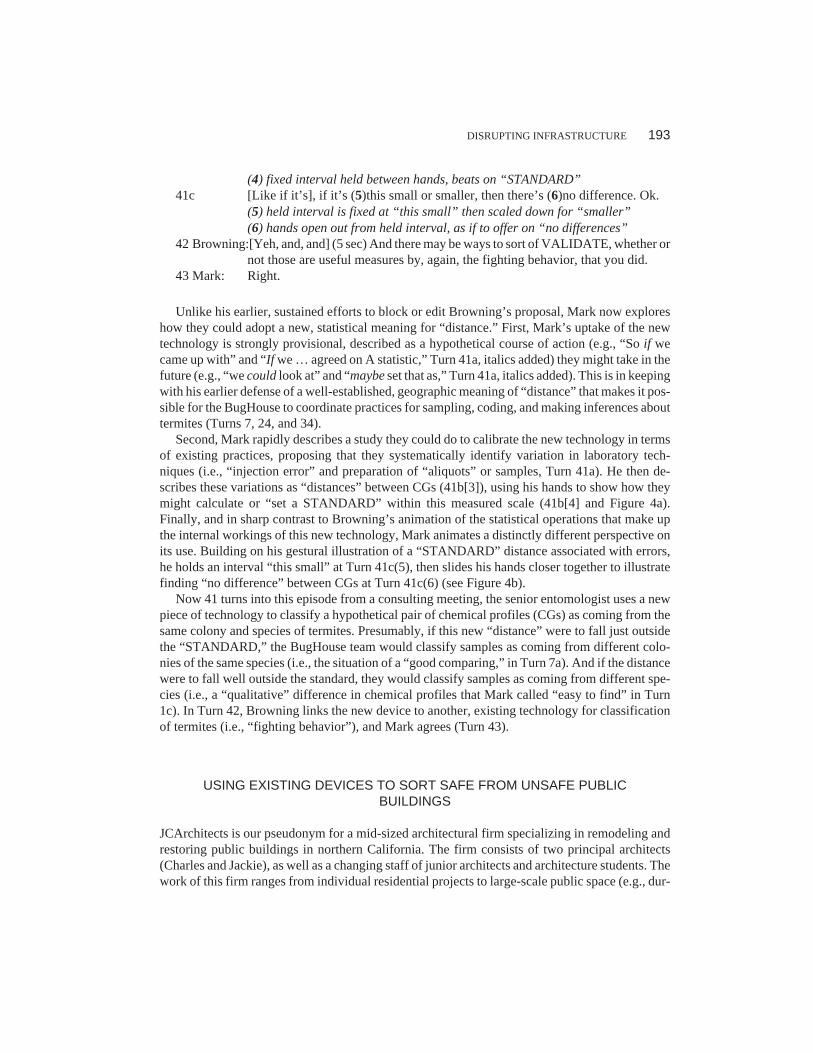
(4) fixed interval held between hands, beats on “STANDARD”41c [Like if it’s], if it’s (5)this small or smaller, then there’s (6)no difference. Ok.
(5) held interval is fixed at “this small” then scaled down for “smaller”(6) hands open out from held interval, as if to offer on “no differences”
42 Browning:[Yeh, and, and] (5 sec) And there may be ways to sort of VALIDATE, whether ornot those are useful measures by, again, the fighting behavior, that you did.
43 Mark: Right.
Unlike his earlier, sustained efforts to block or edit Browning’s proposal, Mark now exploreshow they could adopt a new, statistical meaning for “distance.” First, Mark’s uptake of the newtechnology is strongly provisional, described as a hypothetical course of action (e.g., “So if wecame up with” and “If we … agreed on A statistic,” Turn 41a, italics added) they might take in thefuture (e.g., “we could look at” and “maybe set that as,” Turn 41a, italics added). This is in keepingwith his earlier defense of a well-established, geographic meaning of “distance” that makes it pos-sible for the BugHouse to coordinate practices for sampling, coding, and making inferences abouttermites (Turns 7, 24, and 34).
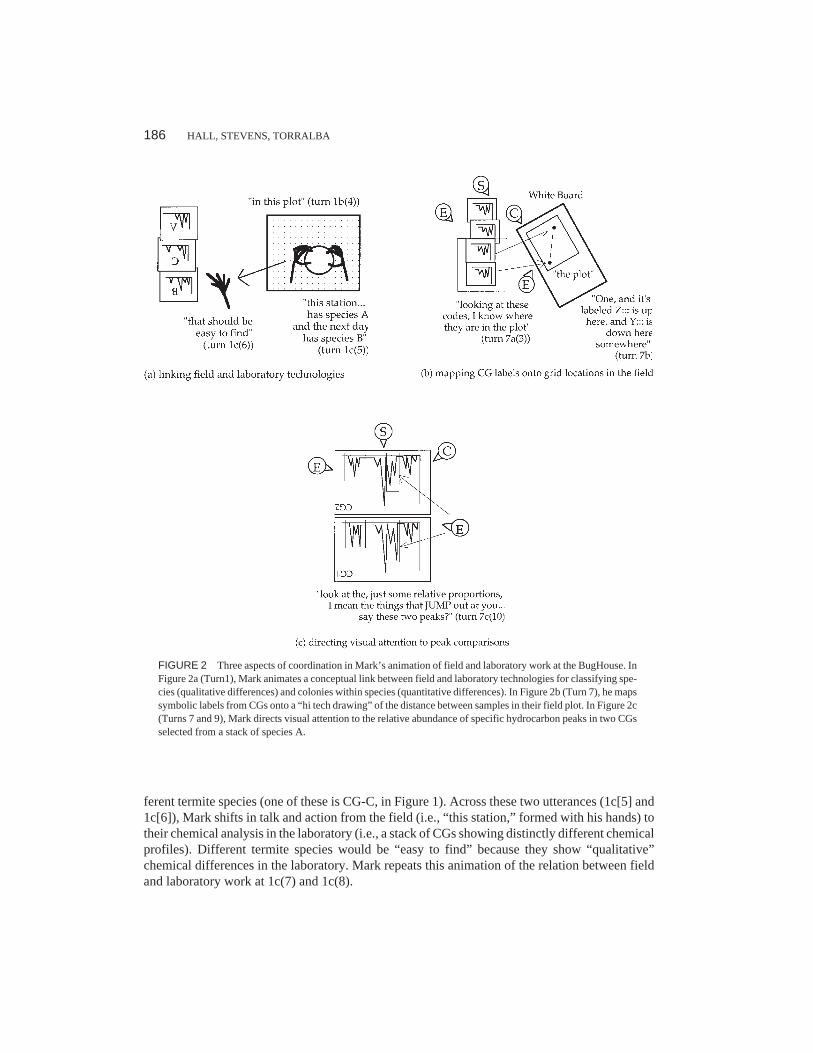
Second, Mark rapidly describes a study they could do to calibrate the new technology in termsof existing practices, proposing that they systematically identify variation in laboratory tech-niques (i.e., “injection error” and preparation of “aliquots” or samples, Turn 41a). He then de-scribes these variations as “distances” between CGs (41b[3]), using his hands to show how theymight calculate or “set a STANDARD” within this measured scale (41b[4] and Figure 4a).Finally, and in sharp contrast to Browning’s animation of the statistical operations that make upthe internal workings of this new technology, Mark animates a distinctly different perspective onits use. Building on his gestural illustration of a “STANDARD” distance associated with errors,he holds an interval “this small” at Turn 41c(5), then slides his hands closer together to illustratefinding “no difference” between CGs at Turn 41c(6) (see Figure 4b).
Now 41 turns into this episode from a consulting meeting, the senior entomologist uses a newpiece of technology to classify a hypothetical pair of chemical profiles (CGs) as coming from thesame colony and species of termites. Presumably, if this new “distance” were to fall just outsidethe “STANDARD,” the BugHouse team would classify samples as coming from different colo-nies of the same species (i.e., the situation of a “good comparing,” in Turn 7a). And if the distancewere to fall well outside the standard, they would classify samples as coming from different spe-cies (i.e., a “qualitative” difference in chemical profiles that Mark called “easy to find” in Turn1c). In Turn 42, Browning links the new device to another, existing technology for classificationof termites (i.e., “fighting behavior”), and Mark agrees (Turn 43).
USING EXISTING DEVICES TO SORT SAFE FROM UNSAFE PUBLICBUILDINGS
JCArchitects is our pseudonym for a mid-sized architectural firm specializing in remodeling andrestoring public buildings in northern California. The firm consists of two principal architects(Charles and Jackie), as well as a changing staff of junior architects and architecture students. Thework of this firm ranges from individual residential projects to large-scale public space (e.g., dur-
DISRUPTING INFRASTRUCTURE 193
ing our ethnographic study, they won a contract to design a multistructure community center for alocal city). The projects we studied most closely were efforts to remodel two public libraries(Stevens, 1999), and each required design proposals to create access for people with disabilitiesand to strengthen the buildings against earthquakes. One of these libraries (Taraval, also a pseud-onym) was located within 2 miles of a major geological fault line and constructed out of“unreinforced masonry” (URM, in this case bricks and mortar).
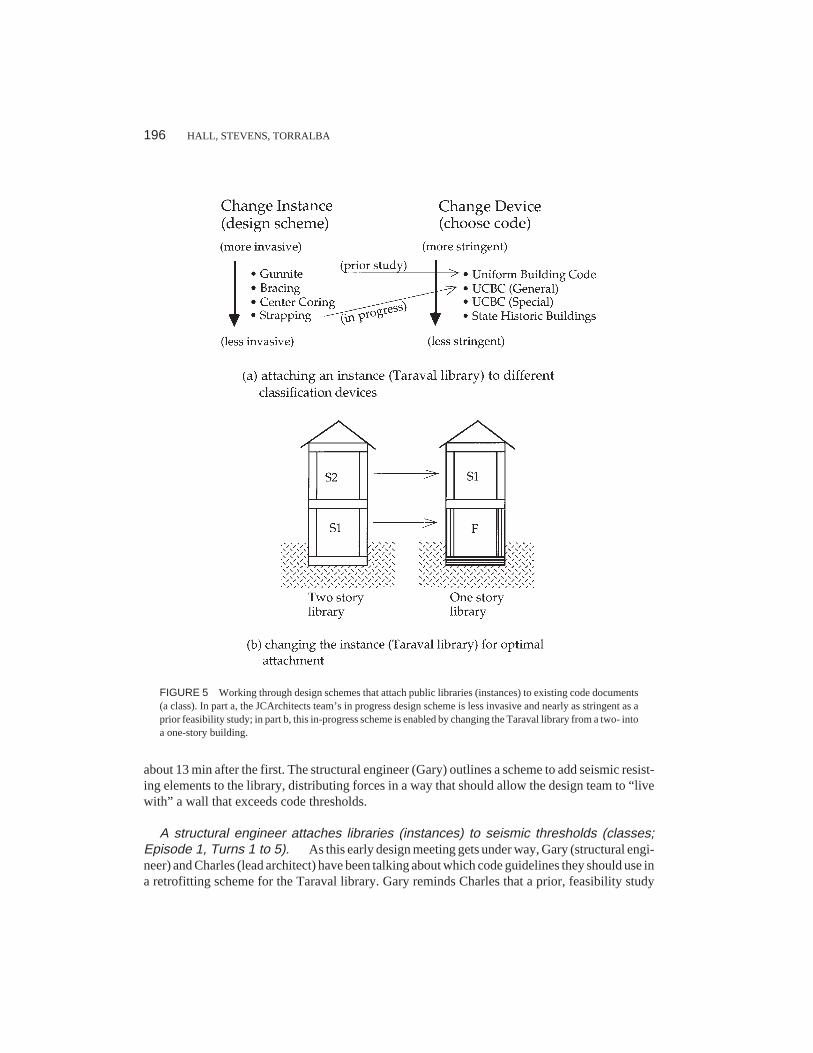
In the event of a large earthquake, which seismologists say is increasingly likely in this regionof California, URM buildings pose substantial dangers to their occupants—the libraries could col-lapse altogether, crushing or trapping library staff and patrons. As a result, state and municipalgovernments have adopted a set of ordinances that require owners either to list URM buildings aspublic hazards (e.g., both libraries we studied were listed) or to retrofit these buildings so that theymeet various structural code standards. Because these libraries were Carnegie-era buildings (i.e.,historically significant structures), multiple code standards were applicable, creating options forclassifying the buildings that ranged from very stringent (i.e., retrofitting a building to make itconform with criteria for new construction) to much less stringent (i.e., simply listing a building asa historic landmark). In direct relation to these code thresholds, the architects could choose from arange of conventional retrofitting schemes that were more or less invasive. As shown in Figure 5a,for example, meeting the Uniform Building Code for new construction (most stringent code)would require the most invasive design scheme, replacing entire walls in each library with struc-
194 HALL, STEVENS, TORRALBA
FIGURE 4 An entomologist (Mark) provisionally adopts a new meaning for “dis-tance,” animated from the perspective of a user. In Figure 4a, Mark animates a studyto construct a “STANDARD” statistical distance between samples; in Figure 4b, hedemonstrates using this standard to classify samples as showing “no difference” (i.e.,same species and colony).
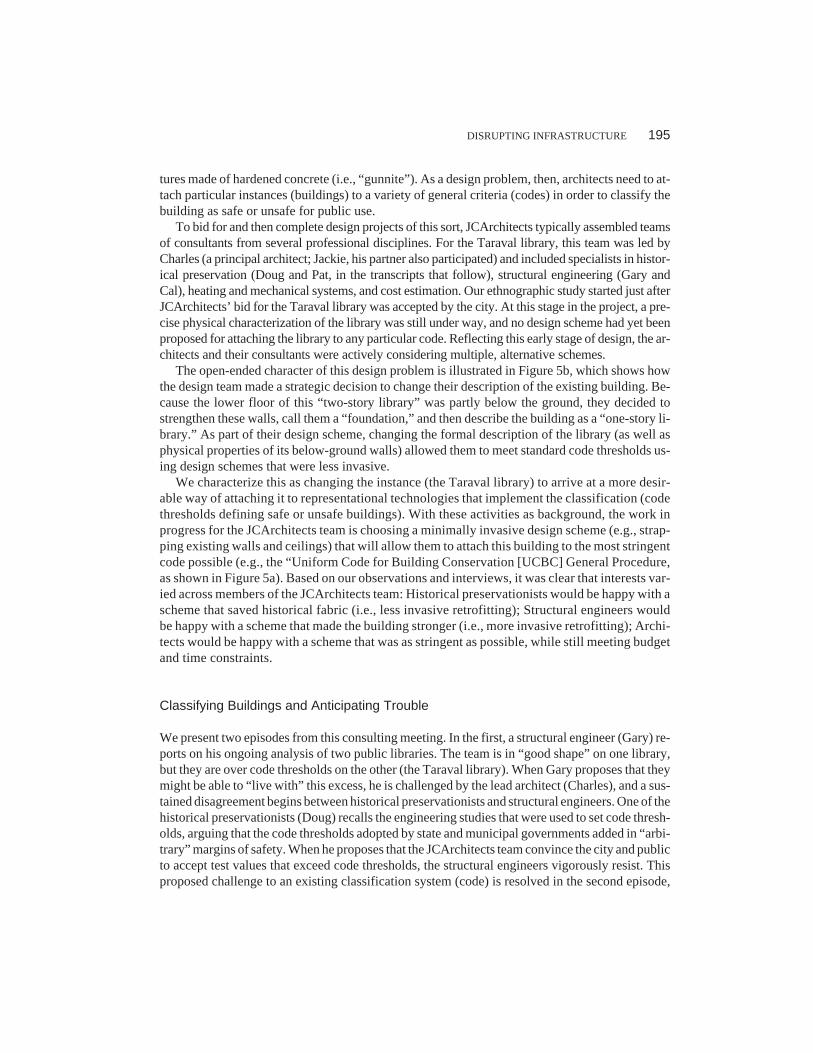
tures made of hardened concrete (i.e., “gunnite”). As a design problem, then, architects need to at-tach particular instances (buildings) to a variety of general criteria (codes) in order to classify thebuilding as safe or unsafe for public use.
To bid for and then complete design projects of this sort, JCArchitects typically assembled teamsof consultants from several professional disciplines. For the Taraval library, this team was led byCharles (a principal architect; Jackie, his partner also participated) and included specialists in histor-ical preservation (Doug and Pat, in the transcripts that follow), structural engineering (Gary andCal), heating and mechanical systems, and cost estimation. Our ethnographic study started just afterJCArchitects’ bid for the Taraval library was accepted by the city. At this stage in the project, a pre-cise physical characterization of the library was still under way, and no design scheme had yet beenproposed for attaching the library to any particular code. Reflecting this early stage of design, the ar-chitects and their consultants were actively considering multiple, alternative schemes.
The open-ended character of this design problem is illustrated in Figure 5b, which shows howthe design team made a strategic decision to change their description of the existing building. Be-cause the lower floor of this “two-story library” was partly below the ground, they decided tostrengthen these walls, call them a “foundation,” and then describe the building as a “one-story li-brary.” As part of their design scheme, changing the formal description of the library (as well asphysical properties of its below-ground walls) allowed them to meet standard code thresholds us-ing design schemes that were less invasive.
We characterize this as changing the instance (the Taraval library) to arrive at a more desir-able way of attaching it to representational technologies that implement the classification (codethresholds defining safe or unsafe buildings). With these activities as background, the work inprogress for the JCArchitects team is choosing a minimally invasive design scheme (e.g., strap-ping existing walls and ceilings) that will allow them to attach this building to the most stringentcode possible (e.g., the “Uniform Code for Building Conservation [UCBC] General Procedure,as shown in Figure 5a). Based on our observations and interviews, it was clear that interests var-ied across members of the JCArchitects team: Historical preservationists would be happy with ascheme that saved historical fabric (i.e., less invasive retrofitting); Structural engineers wouldbe happy with a scheme that made the building stronger (i.e., more invasive retrofitting); Archi-tects would be happy with a scheme that was as stringent as possible, while still meeting budgetand time constraints.
Classifying Buildings and Anticipating Trouble
We present two episodes from this consulting meeting. In the first, a structural engineer (Gary) re-ports on his ongoing analysis of two public libraries. The team is in “good shape” on one library,but they are over code thresholds on the other (the Taraval library). When Gary proposes that theymight be able to “live with” this excess, he is challenged by the lead architect (Charles), and a sus-tained disagreement begins between historical preservationists and structural engineers. One of thehistorical preservationists (Doug) recalls the engineering studies that were used to set code thresh-olds, arguing that the code thresholds adopted by state and municipal governments added in “arbi-trary” margins of safety. When he proposes that the JCArchitects team convince the city and publicto accept test values that exceed code thresholds, the structural engineers vigorously resist. Thisproposed challenge to an existing classification system (code) is resolved in the second episode,
DISRUPTING INFRASTRUCTURE 195
about 13 min after the first. The structural engineer (Gary) outlines a scheme to add seismic resist-ing elements to the library, distributing forces in a way that should allow the design team to “livewith” a wall that exceeds code thresholds.
A structural engineer attaches libraries (instances) to seismic thresholds (classes;Episode 1, Turns 1 to 5). As this early design meeting gets under way, Gary (structural engi-neer) and Charles (lead architect) have been talking about which code guidelines they should use ina retrofitting scheme for the Taraval library. Gary reminds Charles that a prior, feasibility study
196 HALL, STEVENS, TORRALBA
FIGURE 5 Working through design schemes that attach public libraries (instances) to existing code documents(a class). In part a, the JCArchitects team’s in progress design scheme is less invasive and nearly as stringent as aprior feasibility study; in part b, this in-progress scheme is enabled by changing the Taraval library from a two- intoa one-story building.
used the Uniform Building Code for new construction (UBC in Figure 5a) and as a result recom-mended using gunnite (hardened concrete) to replace some library walls. This design schemewould be maximally invasive and very costly. Charles has agreed that they should use the lessstringent UCBC code guidelines, possibly avoiding gunnite altogether. However, he also antici-pates the concerns of library patrons at an upcoming public meeting, who will want to make thebuilding safe for use by children’s programs and other public functions. As Gary takes the conver-sational floor to describe his ongoing structural analysis, this complex set of tradeoffs (i.e., histori-cal fabric, cost, strength, and public reaction) is already under discussion.
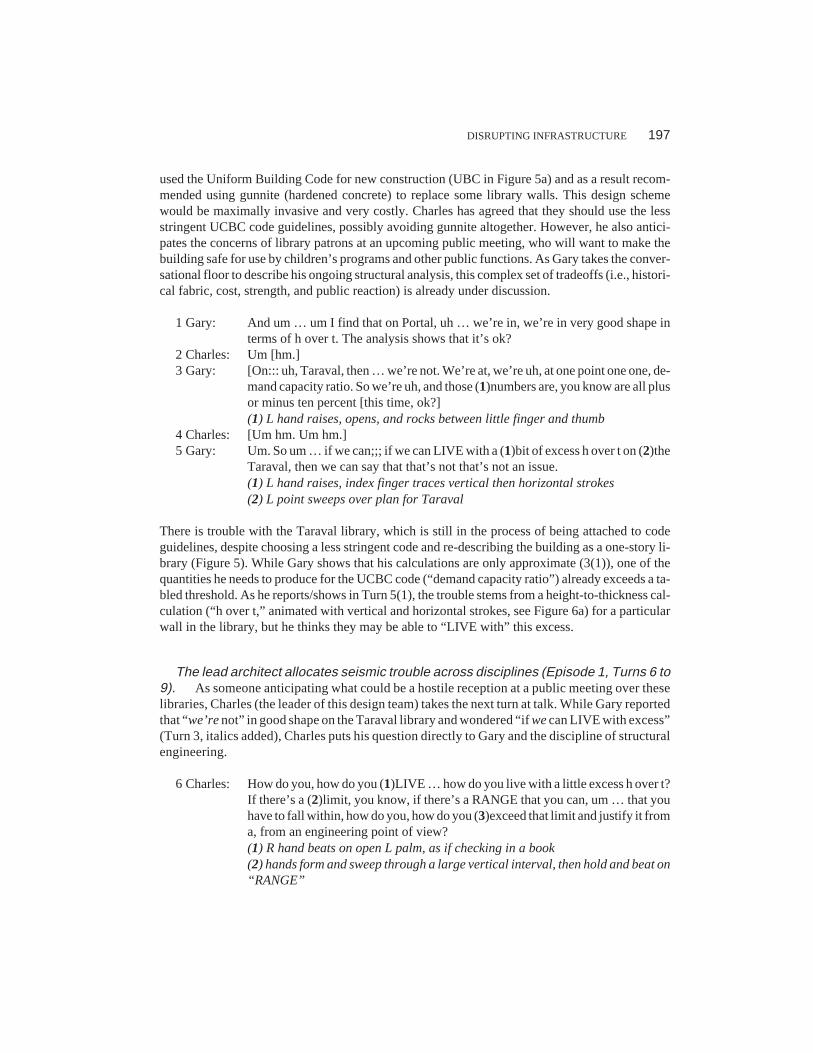
1 Gary: And um … um I find that on Portal, uh … we’re in, we’re in very good shape interms of h over t. The analysis shows that it’s ok?
2 Charles: Um [hm.]3 Gary: [On::: uh, Taraval, then … we’re not. We’re at, we’re uh, at one point one one, de-
mand capacity ratio. So we’re uh, and those (1)numbers are, you know are all plusor minus ten percent [this time, ok?](1) L hand raises, opens, and rocks between little finger and thumb
4 Charles: [Um hm. Um hm.]5 Gary: Um. So um … if we can;;; if we can LIVE with a (1)bit of excess h over t on (2)the
Taraval, then we can say that that’s not that’s not an issue.(1) L hand raises, index finger traces vertical then horizontal strokes(2) L point sweeps over plan for Taraval
There is trouble with the Taraval library, which is still in the process of being attached to codeguidelines, despite choosing a less stringent code and re-describing the building as a one-story li-brary (Figure 5). While Gary shows that his calculations are only approximate (3(1)), one of thequantities he needs to produce for the UCBC code (“demand capacity ratio”) already exceeds a ta-bled threshold. As he reports/shows in Turn 5(1), the trouble stems from a height-to-thickness cal-culation (“h over t,” animated with vertical and horizontal strokes, see Figure 6a) for a particularwall in the library, but he thinks they may be able to “LIVE with” this excess.
The lead architect allocates seismic trouble across disciplines (Episode 1, Turns 6 to9). As someone anticipating what could be a hostile reception at a public meeting over theselibraries, Charles (the leader of this design team) takes the next turn at talk. While Gary reportedthat “we’re not” in good shape on the Taraval library and wondered “if we can LIVE with excess”(Turn 3, italics added), Charles puts his question directly to Gary and the discipline of structuralengineering.
6 Charles: How do you, how do you (1)LIVE … how do you live with a little excess h over t?If there’s a (2)limit, you know, if there’s a RANGE that you can, um … that youhave to fall within, how do you, how do you (3)exceed that limit and justify it froma, from an engineering point of view?(1) R hand beats on open L palm, as if checking in a book(2) hands form and sweep through a large vertical interval, then hold and beat on“RANGE”
DISRUPTING INFRASTRUCTURE 197
(3) R hand rises above top of held interval7 Cal: Its tough, I think its tough. I think, I guess that it’s, maybe the actual idea is, that’s
what you’re saying, we have to talk with the city, I guess, right?8 Gary: Yes.9 Cal: Yeh, SOMEtimes they overlook little things. But I think this is like a high, I think
in a way, it’s kind of a high profile job? I think they want to, I think at least the citywants to go by the book. They say if you, if you [go over it then (inaudible)]
198 HALL, STEVENS, TORRALBA
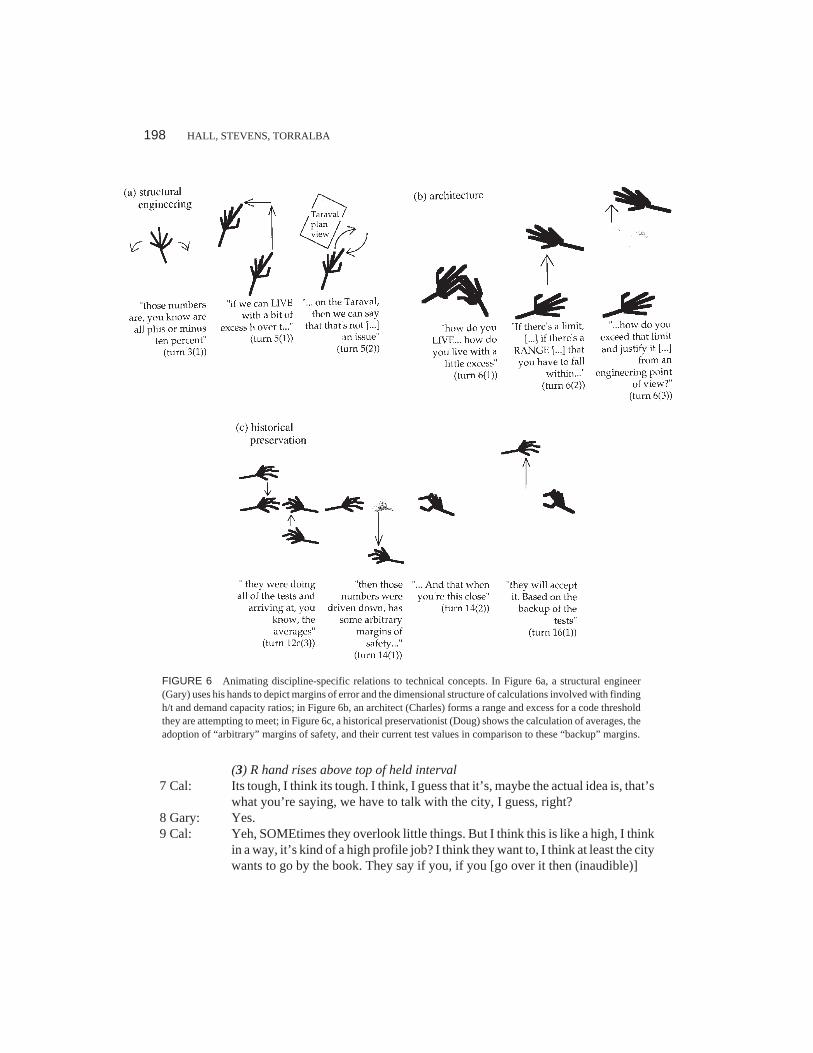
FIGURE 6 Animating discipline-specific relations to technical concepts. In Figure 6a, a structural engineer(Gary) uses his hands to depict margins of error and the dimensional structure of calculations involved with findingh/t and demand capacity ratios; in Figure 6b, an architect (Charles) forms a range and excess for a code thresholdthey are attempting to meet; in Figure 6c, a historical preservationist (Doug) shows the calculation of averages, theadoption of “arbitrary” margins of safety, and their current test values in comparison to these “backup” margins.
Trouble with the library is a moving target, both across disciplines and along different trajecto-ries into the future. First, Charles’s question allocates seismic trouble directly to “an engineeringpoint of view” (Turn 6, italics added), explicitly picking Gary and Cal out from the design team andproviding a sharp contrast with Gary’s use of a collective “we” in Turns 1, 3, and 5. Consistent withthis allocation of trouble, it is Cal, a co-owner of the structural engineering firm that employs Gary,who begins to answer Charles’s question. As Jackie (coprincipal architect) suggests later in thismeeting, these engineers are “on the line” for matters of structural integrity. Second, and also an in-tegral part of Turn 6, Charles animates a decision process that will attach the Taraval library to codedocuments (see Figure 6b). As he asks about how to “live with a little excess,” his hands form an in-terval along a vertical scale that he calls a “RANGE” (Turn 6[2]), then his right hand rises above theupper end of this interval to show a value that exceeds this “limit” (Turn 6[3]). This animation fromthe perspective of a user of structural analysis makes their current trouble with attaching the Taravallibrary to code starkly visible. Third, Cal’s answer is also a complex form of animation, starting withthe idea that they will need to “talk with the city” (Turn 7, confirmed by Gary in Turn 8) and pro-gressing into a future-time narrative in which Cal actually speaks for the city in what he projects tobe a negative assessment (i.e., “They say if you, if you go over,” Turn 9).
Challenging Code and Justifying Alternative Classifications
While the Taraval retrofitting scheme is still being developed, Cal has transported the team (figura-tively) into a direct confrontation with the city architect’s office. However, there are other designoptions to consider, and the historical preservationists “step in on” the conversation.
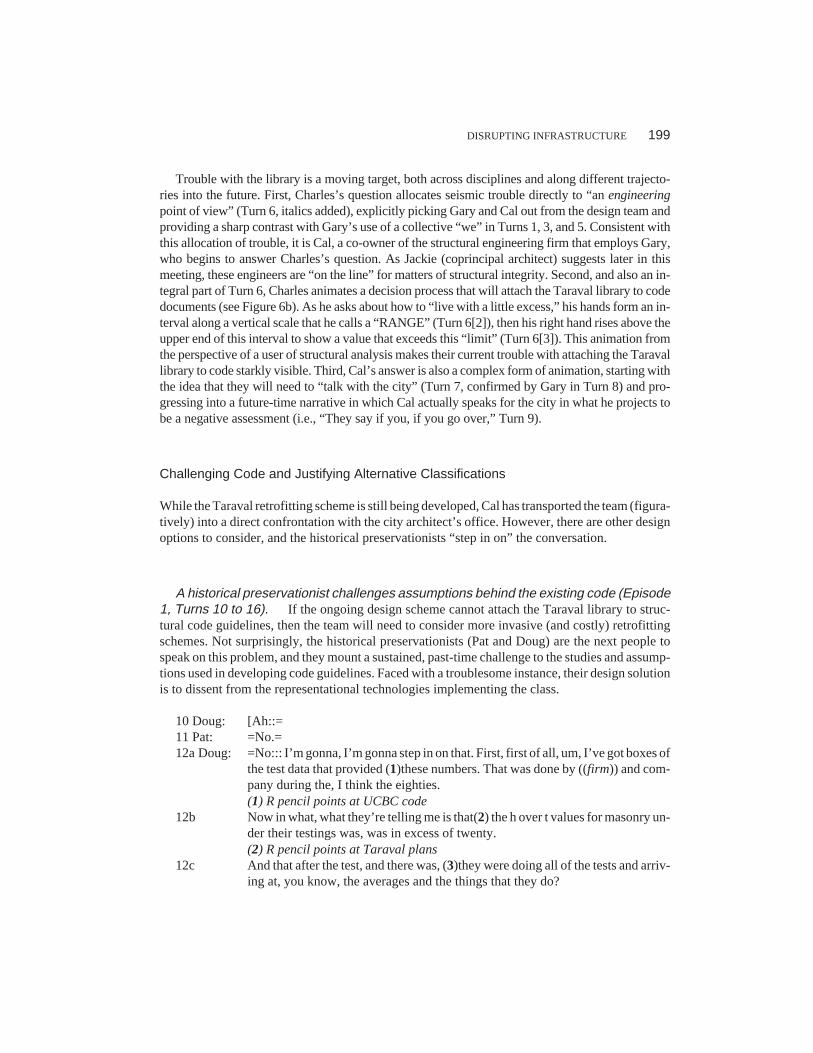
A historical preservationist challenges assumptions behind the existing code (Episode1, Turns 10 to 16). If the ongoing design scheme cannot attach the Taraval library to struc-tural code guidelines, then the team will need to consider more invasive (and costly) retrofittingschemes. Not surprisingly, the historical preservationists (Pat and Doug) are the next people tospeak on this problem, and they mount a sustained, past-time challenge to the studies and assump-tions used in developing code guidelines. Faced with a troublesome instance, their design solutionis to dissent from the representational technologies implementing the class.
10 Doug: [Ah::=11 Pat: =No.=12a Doug: =No::: I’m gonna, I’m gonna step in on that. First, first of all, um, I’ve got boxes of
the test data that provided (1)these numbers. That was done by ((firm)) and com-pany during the, I think the eighties.(1) R pencil points at UCBC code
12b Now in what, what they’re telling me is that(2) the h over t values for masonry un-der their testings was, was in excess of twenty.(2) R pencil points at Taraval plans
12c And that after the test, and there was, (3)they were doing all of the tests and arriv-ing at, you know, the averages and the things that they do?
DISRUPTING INFRASTRUCTURE 199
(3) flat hands raise and lower, then form a horizontal threshold at eye level andhold on “do”
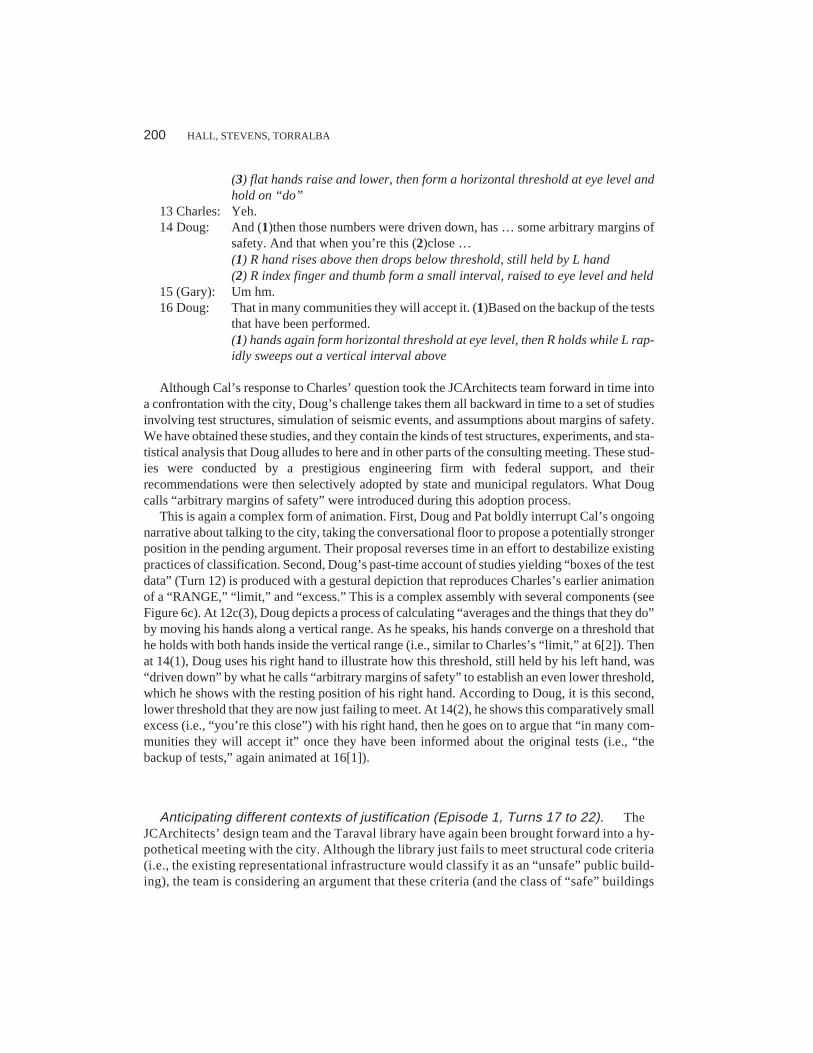
13 Charles: Yeh.14 Doug: And (1)then those numbers were driven down, has … some arbitrary margins of
safety. And that when you’re this (2)close …(1) R hand rises above then drops below threshold, still held by L hand(2) R index finger and thumb form a small interval, raised to eye level and held
15 (Gary): Um hm.16 Doug: That in many communities they will accept it. (1)Based on the backup of the tests
that have been performed.(1) hands again form horizontal threshold at eye level, then R holds while L rap-idly sweeps out a vertical interval above
Although Cal’s response to Charles’ question took the JCArchitects team forward in time intoa confrontation with the city, Doug’s challenge takes them all backward in time to a set of studiesinvolving test structures, simulation of seismic events, and assumptions about margins of safety.We have obtained these studies, and they contain the kinds of test structures, experiments, and sta-tistical analysis that Doug alludes to here and in other parts of the consulting meeting. These stud-ies were conducted by a prestigious engineering firm with federal support, and theirrecommendations were then selectively adopted by state and municipal regulators. What Dougcalls “arbitrary margins of safety” were introduced during this adoption process.
This is again a complex form of animation. First, Doug and Pat boldly interrupt Cal’s ongoingnarrative about talking to the city, taking the conversational floor to propose a potentially strongerposition in the pending argument. Their proposal reverses time in an effort to destabilize existingpractices of classification. Second, Doug’s past-time account of studies yielding “boxes of the testdata” (Turn 12) is produced with a gestural depiction that reproduces Charles’s earlier animationof a “RANGE,” “limit,” and “excess.” This is a complex assembly with several components (seeFigure 6c). At 12c(3), Doug depicts a process of calculating “averages and the things that they do”by moving his hands along a vertical range. As he speaks, his hands converge on a threshold thathe holds with both hands inside the vertical range (i.e., similar to Charles’s “limit,” at 6[2]). Thenat 14(1), Doug uses his right hand to illustrate how this threshold, still held by his left hand, was“driven down” by what he calls “arbitrary margins of safety” to establish an even lower threshold,which he shows with the resting position of his right hand. According to Doug, it is this second,lower threshold that they are now just failing to meet. At 14(2), he shows this comparatively smallexcess (i.e., “you’re this close”) with his right hand, then he goes on to argue that “in many com-munities they will accept it” once they have been informed about the original tests (i.e., “thebackup of tests,” again animated at 16[1]).
Anticipating different contexts of justification (Episode 1, Turns 17 to 22). TheJCArchitects’ design team and the Taraval library have again been brought forward into a hy-pothetical meeting with the city. Although the library just fails to meet structural code criteria(i.e., the existing representational infrastructure would classify it as an “unsafe” public build-ing), the team is considering an argument that these criteria (and the class of “safe” buildings
200 HALL, STEVENS, TORRALBA
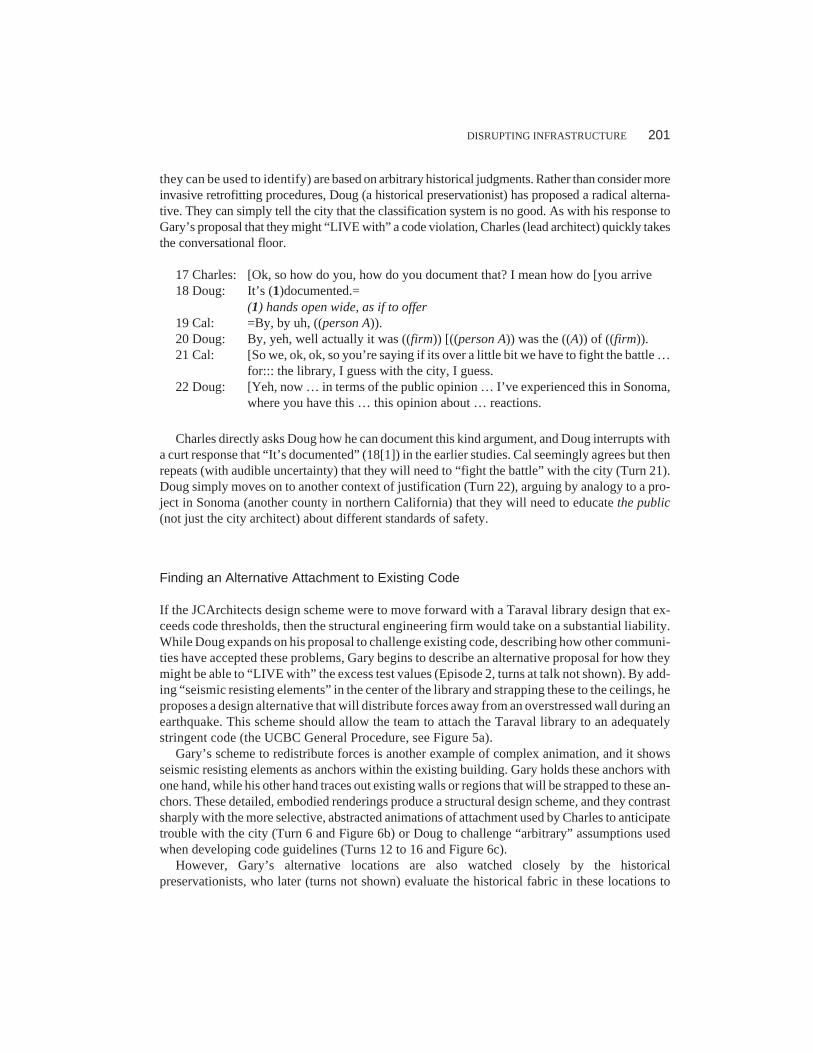
they can be used to identify) are based on arbitrary historical judgments. Rather than consider moreinvasive retrofitting procedures, Doug (a historical preservationist) has proposed a radical alterna-tive. They can simply tell the city that the classification system is no good. As with his response toGary’s proposal that they might “LIVE with” a code violation, Charles (lead architect) quickly takesthe conversational floor.
17 Charles: [Ok, so how do you, how do you document that? I mean how do [you arrive18 Doug: It’s (1)documented.=
(1) hands open wide, as if to offer19 Cal: =By, by uh, ((person A)).20 Doug: By, yeh, well actually it was ((firm)) [((person A)) was the ((A)) of ((firm)).21 Cal: [So we, ok, ok, so you’re saying if its over a little bit we have to fight the battle …
for::: the library, I guess with the city, I guess.22 Doug: [Yeh, now … in terms of the public opinion … I’ve experienced this in Sonoma,
where you have this … this opinion about … reactions.
Charles directly asks Doug how he can document this kind argument, and Doug interrupts witha curt response that “It’s documented” (18[1]) in the earlier studies. Cal seemingly agrees but thenrepeats (with audible uncertainty) that they will need to “fight the battle” with the city (Turn 21).Doug simply moves on to another context of justification (Turn 22), arguing by analogy to a pro-ject in Sonoma (another county in northern California) that they will need to educate the public(not just the city architect) about different standards of safety.
Finding an Alternative Attachment to Existing Code
If the JCArchitects design scheme were to move forward with a Taraval library design that ex-ceeds code thresholds, then the structural engineering firm would take on a substantial liability.While Doug expands on his proposal to challenge existing code, describing how other communi-ties have accepted these problems, Gary begins to describe an alternative proposal for how theymight be able to “LIVE with” the excess test values (Episode 2, turns at talk not shown). By add-ing “seismic resisting elements” in the center of the library and strapping these to the ceilings, heproposes a design alternative that will distribute forces away from an overstressed wall during anearthquake. This scheme should allow the team to attach the Taraval library to an adequatelystringent code (the UCBC General Procedure, see Figure 5a).
Gary’s scheme to redistribute forces is another example of complex animation, and it showsseismic resisting elements as anchors within the existing building. Gary holds these anchors withone hand, while his other hand traces out existing walls or regions that will be strapped to these an-chors. These detailed, embodied renderings produce a structural design scheme, and they contrastsharply with the more selective, abstracted animations of attachment used by Charles to anticipatetrouble with the city (Turn 6 and Figure 6b) or Doug to challenge “arbitrary” assumptions usedwhen developing code guidelines (Turns 12 to 16 and Figure 6c).
However, Gary’s alternative locations are also watched closely by the historicalpreservationists, who later (turns not shown) evaluate the historical fabric in these locations to
DISRUPTING INFRASTRUCTURE 201
find a spot that will minimize damage. Also important for our analysis of interaction across disci-plines, Charles writes furiously on a yellow pad (3[1]) as Gary animates his design alternative. Ina public meeting at the library several days later, Charles reproduces much of what Gary says inthis exchange, substituting less technical language but effectively replaying the same structuralproposal (Stevens, 1999).
COMPARING CASES OF DISRUPTING INFRASTRUCTURE
As we argued in the introduction, changes in representational infrastructure have been analyzed ashistorical developments within scientific or technical fields, but work remains for understandinghow these changes play out in interaction between participants from different disciplines. In ourview, this is a central research problem for studies of distributed cognition.
We described and analyzed the BugHouse episode as a case of disrupting representational in-frastructure by displacement, in the sense that entomologists meet with a statistician to develop anew technology for comparing chemical profiles. We described and analyzed the JCArchitectsepisodes as a case of disrupting representational infrastructure under dissent, in the sense that his-torical preservationists propose going against existing code guidelines that classify buildings asbeing safe for public use. In this comparative section, we address two questions across both cases:(a) What is common about the structure of interaction across these two cases of interdisciplinaryconsulting? and (b) What role do disruptions play in scientific or technical classification as an on-going historical achievement?
Our approach to the first question (structures of interaction) examines several phenomena thatare clearly illustrated in the case materials, including: (a) common interactional structures of ani-mation for assembling, juxtaposing, and evaluating representational states; (b) differences in dis-cipline-specific forms of perception and action with what otherwise might appear to be the samerepresented world; and (c) the conditions under which these differences become remarkable andlead to conflict during consulting meetings. Our approach to the second question (historicalachievement) asks how common structures of interaction might develop as conflicts are resolvedin ongoing interaction. Several alternatives are considered, leading toward a view of developmentas dynamic processes of hybridization, coordination, and selective visibility. Within this view,thin humans (Latour, 1996) become substantially thicker, and this leads to a rich set of new ques-tions about the distributed (and distributable) character of cognition in scientific and technicalwork.
Common Structures of Interaction in Consultations Across Disciplines
At the level of interactional structure, consulting meetings appear quite similar. Media in both sitesare densely heterogeneous, and problems of coordination arise both within and across disciplines.In our view, similar phenomena appear whenever people who are differently knowledgeable worktogether on projects where represented worlds are only accessible through layers of representa-tional technology (Goodwin, 1994; Hall, 1999; Hall & Stevens, 1995, 1996; Hutchins & Klausen,1996; Latour, 1987, 1996).
202 HALL, STEVENS, TORRALBA
Assembling, juxtaposing, and evaluating representational states. Both the BugHouseand JCArchitects are dense with cultural artifacts, but representational states depicting termites, col-onies, buildings, or remodeling schemes only appear when resources in the environment are selec-tively put into coordinated use (Greeno & Hall, 1997; Hall, 1996; Latour, 1987; Roth & McGinn,1998). In both cases, we find interactional processes for animating representational states in workingconversations. At the BugHouse, Mark and Leah work carefully to create an environment for a con-tribution from the consulting statistician (Figure 2). At JCArchitects, Doug’s extended challenge to“arbitrary” code thresholds takes the entire team back in time, juxtaposing large margins set in earlierresearch with an excess test value that is “this close” for the Taraval library.
Mark, Leah, and Doug assemble and explicitly contrast representational states that are impor-tant for ongoing design projects. Mark and Leah assemble two instances that fall to either side of aclassification they would like to make, and these are contrasted as different representational stateswithin their current approach to classification (i.e., different vs. same termite colony). Doug as-sembles a visual juxtaposition of two quantitative intervals, one a relatively small “excess” testvalue (i.e., their current state) and the other a comparatively large “backup” of acceptable valueshidden by arbitrary assumptions. This contrast is also projected forward as the outcome of a suc-cessful classification (i.e., the library is judged “safe,” despite excess test values).
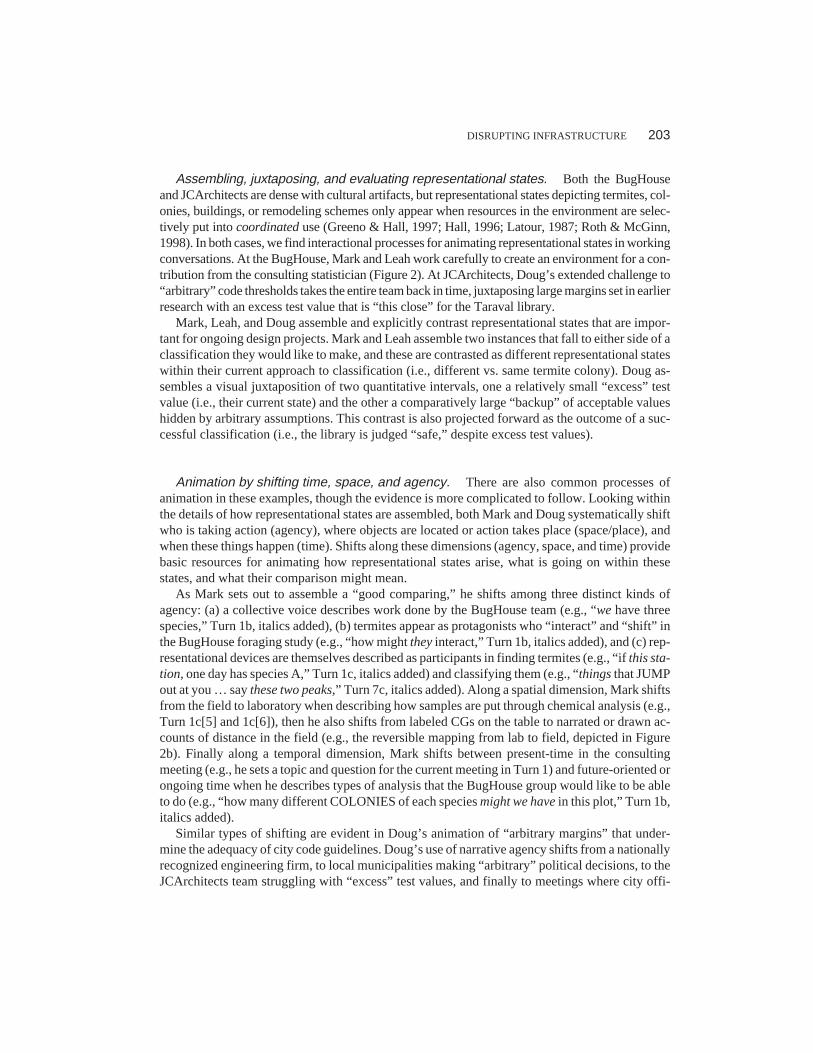
Animation by shifting time, space, and agency. There are also common processes ofanimation in these examples, though the evidence is more complicated to follow. Looking withinthe details of how representational states are assembled, both Mark and Doug systematically shiftwho is taking action (agency), where objects are located or action takes place (space/place), andwhen these things happen (time). Shifts along these dimensions (agency, space, and time) providebasic resources for animating how representational states arise, what is going on within thesestates, and what their comparison might mean.
As Mark sets out to assemble a “good comparing,” he shifts among three distinct kinds ofagency: (a) a collective voice describes work done by the BugHouse team (e.g., “we have threespecies,” Turn 1b, italics added), (b) termites appear as protagonists who “interact” and “shift” inthe BugHouse foraging study (e.g., “how might they interact,” Turn 1b, italics added), and (c) rep-resentational devices are themselves described as participants in finding termites (e.g., “if this sta-tion, one day has species A,” Turn 1c, italics added) and classifying them (e.g., “things that JUMPout at you … say these two peaks,” Turn 7c, italics added). Along a spatial dimension, Mark shiftsfrom the field to laboratory when describing how samples are put through chemical analysis (e.g.,Turn 1c[5] and 1c[6]), then he also shifts from labeled CGs on the table to narrated or drawn ac-counts of distance in the field (e.g., the reversible mapping from lab to field, depicted in Figure2b). Finally along a temporal dimension, Mark shifts between present-time in the consultingmeeting (e.g., he sets a topic and question for the current meeting in Turn 1) and future-oriented orongoing time when he describes types of analysis that the BugHouse group would like to be ableto do (e.g., “how many different COLONIES of each species might we have in this plot,” Turn 1b,italics added).
Similar types of shifting are evident in Doug’s animation of “arbitrary margins” that under-mine the adequacy of city code guidelines. Doug’s use of narrative agency shifts from a nationallyrecognized engineering firm, to local municipalities making “arbitrary” political decisions, to theJCArchitects team struggling with “excess” test values, and finally to meetings where city offi-
DISRUPTING INFRASTRUCTURE 203
cials and members of the public take action. In space, Doug’s challenge shifts from engineeringstudies in southern California, to sites in northern California where city officials adopted the re-sults of these studies, to the JCArchitects consulting meeting, and finally to the city architect’s of-fice. And in time, his challenge moves into the distant past (i.e., engineering studies, doneapproximately 15 years earlier), to a more recent past when city officials adopted code guidelines,to their present design dilemma, and finally to future-time review meetings.
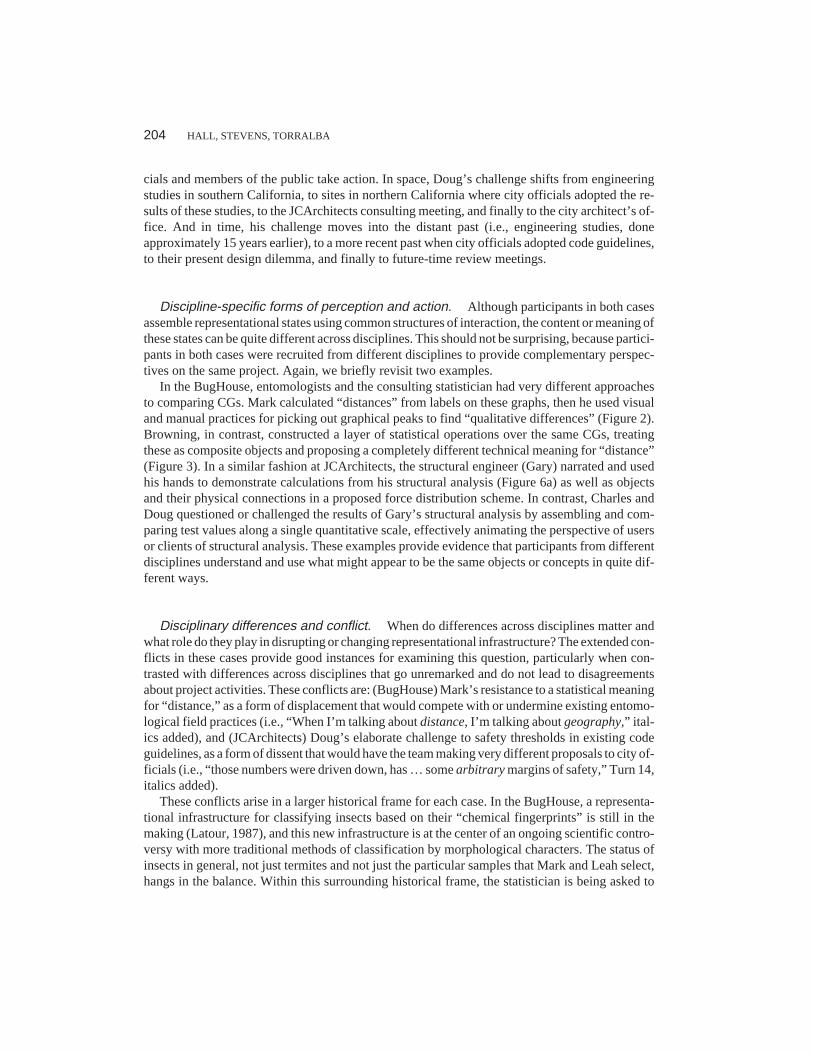
Discipline-specific forms of perception and action. Although participants in both casesassemble representational states using common structures of interaction, the content or meaning ofthese states can be quite different across disciplines. This should not be surprising, because partici-pants in both cases were recruited from different disciplines to provide complementary perspec-tives on the same project. Again, we briefly revisit two examples.
In the BugHouse, entomologists and the consulting statistician had very different approachesto comparing CGs. Mark calculated “distances” from labels on these graphs, then he used visualand manual practices for picking out graphical peaks to find “qualitative differences” (Figure 2).Browning, in contrast, constructed a layer of statistical operations over the same CGs, treatingthese as composite objects and proposing a completely different technical meaning for “distance”(Figure 3). In a similar fashion at JCArchitects, the structural engineer (Gary) narrated and usedhis hands to demonstrate calculations from his structural analysis (Figure 6a) as well as objectsand their physical connections in a proposed force distribution scheme. In contrast, Charles andDoug questioned or challenged the results of Gary’s structural analysis by assembling and com-paring test values along a single quantitative scale, effectively animating the perspective of usersor clients of structural analysis. These examples provide evidence that participants from differentdisciplines understand and use what might appear to be the same objects or concepts in quite dif-ferent ways.
Disciplinary differences and conflict. When do differences across disciplines matter andwhat role do they play in disrupting or changing representational infrastructure? The extended con-flicts in these cases provide good instances for examining this question, particularly when con-trasted with differences across disciplines that go unremarked and do not lead to disagreementsabout project activities. These conflicts are: (BugHouse) Mark’s resistance to a statistical meaningfor “distance,” as a form of displacement that would compete with or undermine existing entomo-logical field practices (i.e., “When I’m talking about distance, I’m talking about geography,” ital-ics added), and (JCArchitects) Doug’s elaborate challenge to safety thresholds in existing codeguidelines, as a form of dissent that would have the team making very different proposals to city of-ficials (i.e., “those numbers were driven down, has … some arbitrary margins of safety,” Turn 14,italics added).
These conflicts arise in a larger historical frame for each case. In the BugHouse, a representa-tional infrastructure for classifying insects based on their “chemical fingerprints” is still in themaking (Latour, 1987), and this new infrastructure is at the center of an ongoing scientific contro-versy with more traditional methods of classification by morphological characters. The status ofinsects in general, not just termites and not just the particular samples that Mark and Leah select,hangs in the balance. Within this surrounding historical frame, the statistician is being asked to
204 HALL, STEVENS, TORRALBA
help stabilize the infrastructure of chemical taxonomy. His proposal to replace relatively nonstan-dard visual comparisons with a “distance” measure becomes the occasion for a sustained conflict.This conflict, in which Mark even attempts to edit the statistician’s language, is one historical mo-ment in an ongoing process of scientific development.
At JCArchitects, a representational infrastructure for classifying public buildings already ex-ists, and the design meeting has been called to find a scheme that will attach a particular instance(the Taraval library) to this infrastructure (i.e., code guidelines for structural analysis). Just whatcounts as a “safe” building during a major earthquake is an ongoing controversy, but that contro-versy does not originate within the design firm we studied. When the structural engineers animatefuture-time trouble with the city over test values, the historical preservationists “step in” on theirproposal, animating trouble in the past-time development of code guidelines and proposing thatthey convince the city (and public) to accept minor code violations. This conflict, which we haveanalyzed as a form of dissent against the existing codes, is itself the disruption to representationalinfrastructure.
What of differences in discipline-specific perception and action that do not lead to conflicts? Forexample, Browning animates a complex layer of statistical operations over the surface of two CGs, buthis exotic treatment of CGs as composite objects is unremarkable for the entomologists. What is re-markable, and what leads to a sustained conflict, is Browning’s use of a technical term that may be in-compatible with the way the BugHouse inscription device currently operates and the way otherentomologists will read their work. If their purpose is to stabilize chemical taxonomy by introducing anew representational device, it will not do to have this new device unravel or destabilize other parts oftheir work. Likewise, in the JCArchitects case. When Gary briefly animates the dimensional featuresof his structural calculations and their approximate status (i.e., Figure 6a), none of the other specialistsremark or (in the video image) note his activity. What is remarkable is Cal’s future-time animation oftrouble with the city, which the historical preservationists contest as a given outcome for the library.To meet existing code guidelines, they will need to strengthen the library using more invasive struc-tural design schemes (Figure 5a), and this is exactly what the preservationists would like to avoid.
Conflict arises, then, not because disciplinary specialists see the same project in different waysand fail to understand each other. Instead, conflict arises when discipline-specific perception andaction from one discipline threatens to destabilize existing practices in another (i.e., statistics vs.entomology at the BugHouse) or to undermine the prevailing interests of another (i.e., structuralengineering vs. historical preservation at JCArchitects).
Infrastructure as an Ongoing Historical Achievement
One view of interdisciplinary collaboration might be that people from different disciplines makedistinct and complementary contributions, then these are somehow linked together as the projectmoves forward, and all participants need to reach the same understandings about proposed activityand its meaning. We find evidence at the level of ongoing interaction that this is not what happensin either case, or at least that what constitutes shared understanding is considerably more complex.
What develops at the level of interactional structure? In the BugHouse, Browning’s(statistician) operations on CGs (i.e., threshold, superimpose, and collect differences) are com-
DISRUPTING INFRASTRUCTURE 205
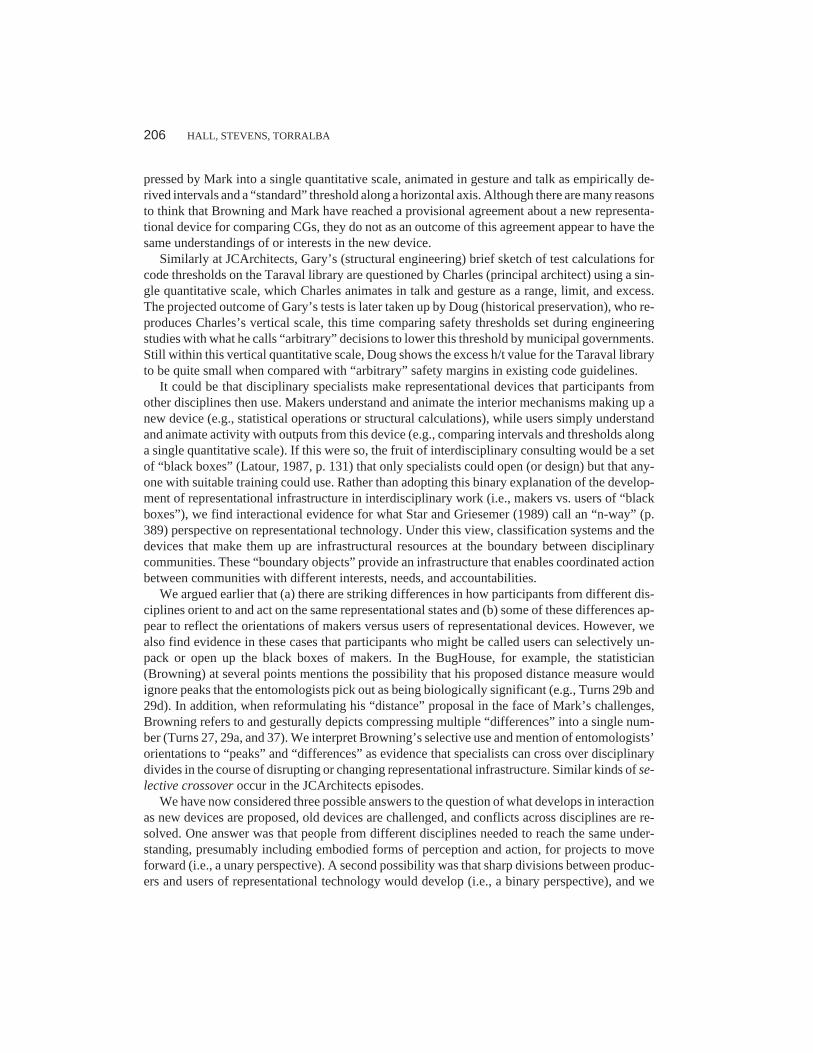
pressed by Mark into a single quantitative scale, animated in gesture and talk as empirically de-rived intervals and a “standard” threshold along a horizontal axis. Although there are many reasonsto think that Browning and Mark have reached a provisional agreement about a new representa-tional device for comparing CGs, they do not as an outcome of this agreement appear to have thesame understandings of or interests in the new device.
Similarly at JCArchitects, Gary’s (structural engineering) brief sketch of test calculations forcode thresholds on the Taraval library are questioned by Charles (principal architect) using a sin-gle quantitative scale, which Charles animates in talk and gesture as a range, limit, and excess.The projected outcome of Gary’s tests is later taken up by Doug (historical preservation), who re-produces Charles’s vertical scale, this time comparing safety thresholds set during engineeringstudies with what he calls “arbitrary” decisions to lower this threshold by municipal governments.Still within this vertical quantitative scale, Doug shows the excess h/t value for the Taraval libraryto be quite small when compared with “arbitrary” safety margins in existing code guidelines.
It could be that disciplinary specialists make representational devices that participants fromother disciplines then use. Makers understand and animate the interior mechanisms making up anew device (e.g., statistical operations or structural calculations), while users simply understandand animate activity with outputs from this device (e.g., comparing intervals and thresholds alonga single quantitative scale). If this were so, the fruit of interdisciplinary consulting would be a setof “black boxes” (Latour, 1987, p. 131) that only specialists could open (or design) but that any-one with suitable training could use. Rather than adopting this binary explanation of the develop-ment of representational infrastructure in interdisciplinary work (i.e., makers vs. users of “blackboxes”), we find interactional evidence for what Star and Griesemer (1989) call an “n-way” (p.389) perspective on representational technology. Under this view, classification systems and thedevices that make them up are infrastructural resources at the boundary between disciplinarycommunities. These “boundary objects” provide an infrastructure that enables coordinated actionbetween communities with different interests, needs, and accountabilities.
We argued earlier that (a) there are striking differences in how participants from different dis-ciplines orient to and act on the same representational states and (b) some of these differences ap-pear to reflect the orientations of makers versus users of representational devices. However, wealso find evidence in these cases that participants who might be called users can selectively un-pack or open up the black boxes of makers. In the BugHouse, for example, the statistician(Browning) at several points mentions the possibility that his proposed distance measure wouldignore peaks that the entomologists pick out as being biologically significant (e.g., Turns 29b and29d). In addition, when reformulating his “distance” proposal in the face of Mark’s challenges,Browning refers to and gesturally depicts compressing multiple “differences” into a single num-ber (Turns 27, 29a, and 37). We interpret Browning’s selective use and mention of entomologists’orientations to “peaks” and “differences” as evidence that specialists can cross over disciplinarydivides in the course of disrupting or changing representational infrastructure. Similar kinds of se-lective crossover occur in the JCArchitects episodes.
We have now considered three possible answers to the question of what develops in interactionas new devices are proposed, old devices are challenged, and conflicts across disciplines are re-solved. One answer was that people from different disciplines needed to reach the same under-standing, presumably including embodied forms of perception and action, for projects to moveforward (i.e., a unary perspective). A second possibility was that sharp divisions between produc-ers and users of representational technology would develop (i.e., a binary perspective), and we
206 HALL, STEVENS, TORRALBA
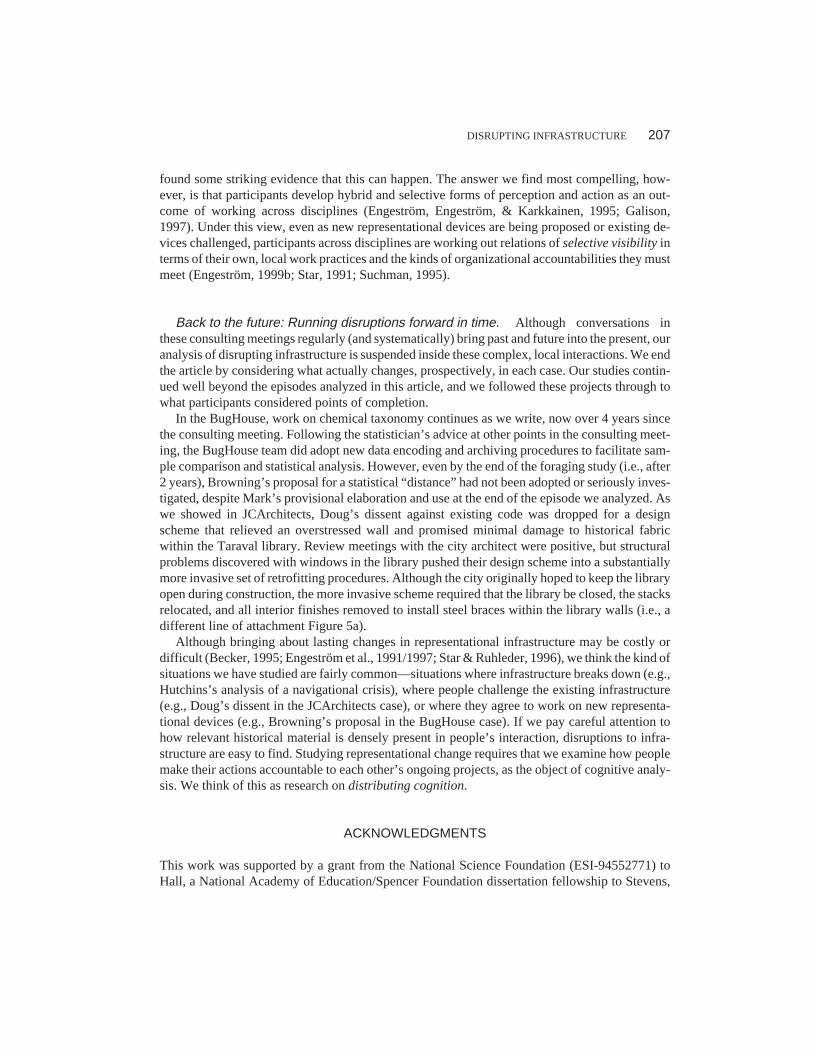
found some striking evidence that this can happen. The answer we find most compelling, how-ever, is that participants develop hybrid and selective forms of perception and action as an out-come of working across disciplines (Engeström, Engeström, & Karkkainen, 1995; Galison,1997). Under this view, even as new representational devices are being proposed or existing de-vices challenged, participants across disciplines are working out relations of selective visibility interms of their own, local work practices and the kinds of organizational accountabilities they mustmeet (Engeström, 1999b; Star, 1991; Suchman, 1995).
Back to the future: Running disruptions forward in time. Although conversations inthese consulting meetings regularly (and systematically) bring past and future into the present, ouranalysis of disrupting infrastructure is suspended inside these complex, local interactions. We endthe article by considering what actually changes, prospectively, in each case. Our studies contin-ued well beyond the episodes analyzed in this article, and we followed these projects through towhat participants considered points of completion.
In the BugHouse, work on chemical taxonomy continues as we write, now over 4 years sincethe consulting meeting. Following the statistician’s advice at other points in the consulting meet-ing, the BugHouse team did adopt new data encoding and archiving procedures to facilitate sam-ple comparison and statistical analysis. However, even by the end of the foraging study (i.e., after2 years), Browning’s proposal for a statistical “distance” had not been adopted or seriously inves-tigated, despite Mark’s provisional elaboration and use at the end of the episode we analyzed. Aswe showed in JCArchitects, Doug’s dissent against existing code was dropped for a designscheme that relieved an overstressed wall and promised minimal damage to historical fabricwithin the Taraval library. Review meetings with the city architect were positive, but structuralproblems discovered with windows in the library pushed their design scheme into a substantiallymore invasive set of retrofitting procedures. Although the city originally hoped to keep the libraryopen during construction, the more invasive scheme required that the library be closed, the stacksrelocated, and all interior finishes removed to install steel braces within the library walls (i.e., adifferent line of attachment Figure 5a).
Although bringing about lasting changes in representational infrastructure may be costly ordifficult (Becker, 1995; Engeström et al., 1991/1997; Star & Ruhleder, 1996), we think the kind ofsituations we have studied are fairly common—situations where infrastructure breaks down (e.g.,Hutchins’s analysis of a navigational crisis), where people challenge the existing infrastructure(e.g., Doug’s dissent in the JCArchitects case), or where they agree to work on new representa-tional devices (e.g., Browning’s proposal in the BugHouse case). If we pay careful attention tohow relevant historical material is densely present in people’s interaction, disruptions to infra-structure are easy to find. Studying representational change requires that we examine how peoplemake their actions accountable to each other’s ongoing projects, as the object of cognitive analy-sis. We think of this as research on distributing cognition.
ACKNOWLEDGMENTS
This work was supported by a grant from the National Science Foundation (ESI-94552771) toHall, a National Academy of Education/Spencer Foundation dissertation fellowship to Stevens,
DISRUPTING INFRASTRUCTURE 207
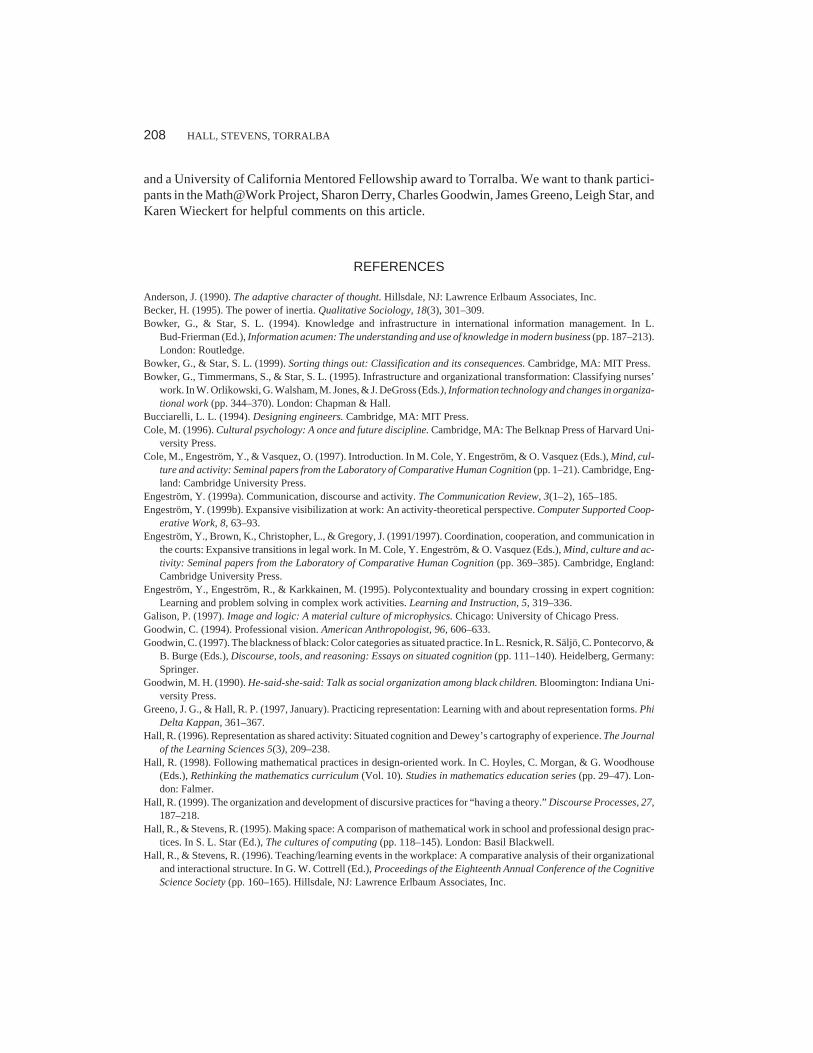
and a University of California Mentored Fellowship award to Torralba. We want to thank partici-pants in the Math@Work Project, Sharon Derry, Charles Goodwin, James Greeno, Leigh Star, andKaren Wieckert for helpful comments on this article.
REFERENCES
Anderson, J. (1990). The adaptive character of thought. Hillsdale, NJ: Lawrence Erlbaum Associates, Inc.Becker, H. (1995). The power of inertia. Qualitative Sociology, 18(3), 301–309.Bowker, G., & Star, S. L. (1994). Knowledge and infrastructure in international information management. In L.
Bud-Frierman (Ed.), Information acumen: The understanding and use of knowledge in modern business (pp. 187–213).London: Routledge.
Bowker, G., & Star, S. L. (1999). Sorting things out: Classification and its consequences. Cambridge, MA: MIT Press.Bowker, G., Timmermans, S., & Star, S. L. (1995). Infrastructure and organizational transformation: Classifying nurses’
work. In W. Orlikowski, G. Walsham, M. Jones, & J. DeGross (Eds.), Information technology and changes in organiza-tional work (pp. 344–370). London: Chapman & Hall.
Bucciarelli, L. L. (1994). Designing engineers. Cambridge, MA: MIT Press.Cole, M. (1996). Cultural psychology: A once and future discipline. Cambridge, MA: The Belknap Press of Harvard Uni-
versity Press.Cole, M., Engeström, Y., & Vasquez, O. (1997). Introduction. In M. Cole, Y. Engeström, & O. Vasquez (Eds.), Mind, cul-
ture and activity: Seminal papers from the Laboratory of Comparative Human Cognition (pp. 1–21). Cambridge, Eng-land: Cambridge University Press.
Engeström, Y. (1999a). Communication, discourse and activity. The Communication Review, 3(1–2), 165–185.Engeström, Y. (1999b). Expansive visibilization at work: An activity-theoretical perspective. Computer Supported Coop-
erative Work, 8, 63–93.Engeström, Y., Brown, K., Christopher, L., & Gregory, J. (1991/1997). Coordination, cooperation, and communication in
the courts: Expansive transitions in legal work. In M. Cole, Y. Engeström, & O. Vasquez (Eds.), Mind, culture and ac-tivity: Seminal papers from the Laboratory of Comparative Human Cognition (pp. 369–385). Cambridge, England:Cambridge University Press.
Engeström, Y., Engeström, R., & Karkkainen, M. (1995). Polycontextuality and boundary crossing in expert cognition:Learning and problem solving in complex work activities. Learning and Instruction, 5, 319–336.
Galison, P. (1997). Image and logic: A material culture of microphysics. Chicago: University of Chicago Press.Goodwin, C. (1994). Professional vision. American Anthropologist, 96, 606–633.Goodwin, C. (1997). The blackness of black: Color categories as situated practice. In L. Resnick, R. Säljö, C. Pontecorvo, &
B. Burge (Eds.), Discourse, tools, and reasoning: Essays on situated cognition (pp. 111–140). Heidelberg, Germany:Springer.
Goodwin, M. H. (1990). He-said-she-said: Talk as social organization among black children. Bloomington: Indiana Uni-versity Press.
Greeno, J. G., & Hall, R. P. (1997, January). Practicing representation: Learning with and about representation forms. PhiDelta Kappan, 361–367.
Hall, R. (1996). Representation as shared activity: Situated cognition and Dewey’s cartography of experience. The Journalof the Learning Sciences 5(3), 209–238.
Hall, R. (1998). Following mathematical practices in design-oriented work. In C. Hoyles, C. Morgan, & G. Woodhouse(Eds.), Rethinking the mathematics curriculum (Vol. 10). Studies in mathematics education series (pp. 29–47). Lon-don: Falmer.
Hall, R. (1999). The organization and development of discursive practices for “having a theory.” Discourse Processes, 27,187–218.
Hall, R., & Stevens, R. (1995). Making space: A comparison of mathematical work in school and professional design prac-tices. In S. L. Star (Ed.), The cultures of computing (pp. 118–145). London: Basil Blackwell.
Hall, R., & Stevens, R. (1996). Teaching/learning events in the workplace: A comparative analysis of their organizationaland interactional structure. In G. W. Cottrell (Ed.), Proceedings of the Eighteenth Annual Conference of the CognitiveScience Society (pp. 160–165). Hillsdale, NJ: Lawrence Erlbaum Associates, Inc.
208 HALL, STEVENS, TORRALBA
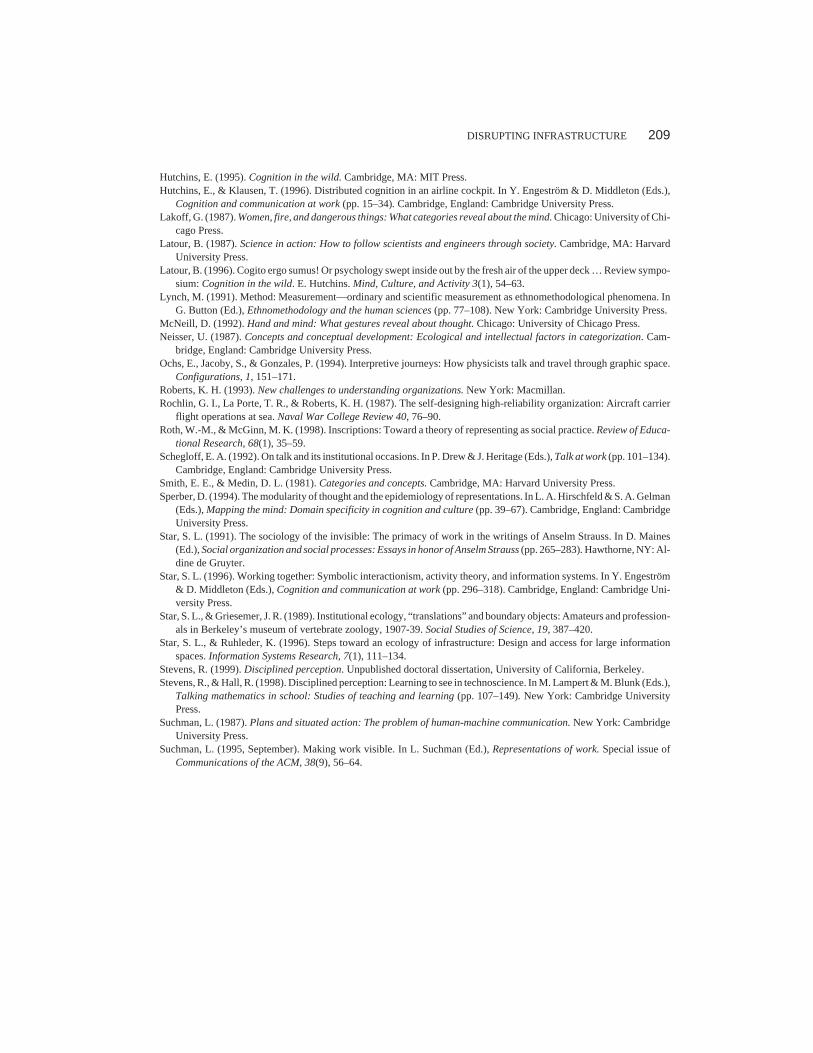
Hutchins, E. (1995). Cognition in the wild. Cambridge, MA: MIT Press.Hutchins, E., & Klausen, T. (1996). Distributed cognition in an airline cockpit. In Y. Engeström & D. Middleton (Eds.),
Cognition and communication at work (pp. 15–34). Cambridge, England: Cambridge University Press.Lakoff, G. (1987). Women, fire, and dangerous things: What categories reveal about the mind. Chicago: University of Chi-
cago Press.Latour, B. (1987). Science in action: How to follow scientists and engineers through society. Cambridge, MA: Harvard
University Press.Latour, B. (1996). Cogito ergo sumus! Or psychology swept inside out by the fresh air of the upper deck … Review sympo-
sium: Cognition in the wild. E. Hutchins. Mind, Culture, and Activity 3(1), 54–63.Lynch, M. (1991). Method: Measurement—ordinary and scientific measurement as ethnomethodological phenomena. In
G. Button (Ed.), Ethnomethodology and the human sciences (pp. 77–108). New York: Cambridge University Press.McNeill, D. (1992). Hand and mind: What gestures reveal about thought. Chicago: University of Chicago Press.Neisser, U. (1987). Concepts and conceptual development: Ecological and intellectual factors in categorization. Cam-
bridge, England: Cambridge University Press.Ochs, E., Jacoby, S., & Gonzales, P. (1994). Interpretive journeys: How physicists talk and travel through graphic space.
Configurations, 1, 151–171.Roberts, K. H. (1993). New challenges to understanding organizations. New York: Macmillan.Rochlin, G. I., La Porte, T. R., & Roberts, K. H. (1987). The self-designing high-reliability organization: Aircraft carrier
flight operations at sea. Naval War College Review 40, 76–90.Roth, W.-M., & McGinn, M. K. (1998). Inscriptions: Toward a theory of representing as social practice. Review of Educa-
tional Research, 68(1), 35–59.Schegloff, E. A. (1992). On talk and its institutional occasions. In P. Drew & J. Heritage (Eds.), Talk at work (pp. 101–134).
Cambridge, England: Cambridge University Press.Smith, E. E., & Medin, D. L. (1981). Categories and concepts. Cambridge, MA: Harvard University Press.Sperber, D. (1994). The modularity of thought and the epidemiology of representations. In L. A. Hirschfeld & S. A. Gelman
(Eds.), Mapping the mind: Domain specificity in cognition and culture (pp. 39–67). Cambridge, England: CambridgeUniversity Press.
Star, S. L. (1991). The sociology of the invisible: The primacy of work in the writings of Anselm Strauss. In D. Maines(Ed.), Social organization and social processes: Essays in honor of Anselm Strauss (pp. 265–283). Hawthorne, NY: Al-dine de Gruyter.
Star, S. L. (1996). Working together: Symbolic interactionism, activity theory, and information systems. In Y. Engeström& D. Middleton (Eds.), Cognition and communication at work (pp. 296–318). Cambridge, England: Cambridge Uni-versity Press.
Star, S. L., & Griesemer, J. R. (1989). Institutional ecology, “translations” and boundary objects: Amateurs and profession-als in Berkeley’s museum of vertebrate zoology, 1907-39. Social Studies of Science, 19, 387–420.
Star, S. L., & Ruhleder, K. (1996). Steps toward an ecology of infrastructure: Design and access for large informationspaces. Information Systems Research, 7(1), 111–134.
Stevens, R. (1999). Disciplined perception. Unpublished doctoral dissertation, University of California, Berkeley.Stevens, R., & Hall, R. (1998). Disciplined perception: Learning to see in technoscience. In M. Lampert & M. Blunk (Eds.),
Talking mathematics in school: Studies of teaching and learning (pp. 107–149). New York: Cambridge UniversityPress.
Suchman, L. (1987). Plans and situated action: The problem of human-machine communication. New York: CambridgeUniversity Press.
Suchman, L. (1995, September). Making work visible. In L. Suchman (Ed.), Representations of work. Special issue ofCommunications of the ACM, 38(9), 56–64.
DISRUPTING INFRASTRUCTURE 209
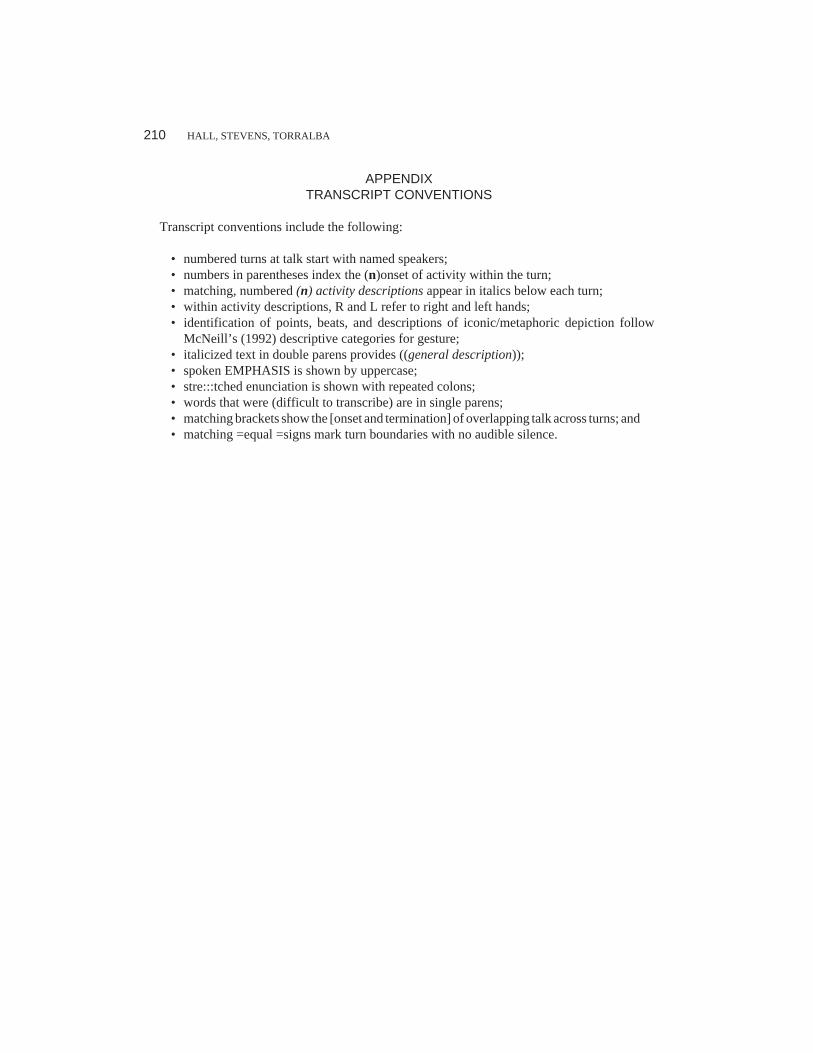
APPENDIXTRANSCRIPT CONVENTIONS
Transcript conventions include the following:
• numbered turns at talk start with named speakers;• numbers in parentheses index the (n)onset of activity within the turn;• matching, numbered (n) activity descriptions appear in italics below each turn;• within activity descriptions, R and L refer to right and left hands;• identification of points, beats, and descriptions of iconic/metaphoric depiction follow
McNeill’s (1992) descriptive categories for gesture;• italicized text in double parens provides ((general description));• spoken EMPHASIS is shown by uppercase;• stre:::tched enunciation is shown with repeated colons;• words that were (difficult to transcribe) are in single parens;• matching brackets show the [onset and termination] of overlapping talk across turns; and• matching =equal =signs mark turn boundaries with no audible silence.
210 HALL, STEVENS, TORRALBA