Embed Size (px)
Citation preview

Expert Systems with Applications 39 (2012) 4032–4043
Contents lists available at SciVerse ScienceDirect
Expert Systems with Applications
journal homepage: www.elsevier .com/locate /eswa
Display text segmentation after learning best-fitted OCR binarization parameters
Antonio Fernández-Caballero a,b,⇑, María T. López a,c, José Carlos Castillo a
a Universidad de Castilla-La Mancha, Instituto de Investigación en Informática de Albacete (I3A), 02071 Albacete, Spainb Universidad de Castilla-La Mancha, Escuela de Ingenieros Industriales de Albacete, Departamento de Sistemas Informáticos, 02071 Albacete, Spainc Universidad de Castilla-La Mancha, Escuela Superior de Ingeniería Informática, Departamento de Sistemas Informáticos, 02071 Albacete, Spain
a r t i c l e i n f o
Keywords:Optical character recognitionText segmentationBinarizationLearning
0957-4174/$ - see front matter � 2011 Elsevier Ltd. Adoi:10.1016/j.eswa.2011.09.162
⇑ Corresponding author at: Universidad de CastiInvestigación en Informática de Albacete (I3A), 02071599200; fax: +34 967 599224.
E-mail address: [email protected] (A. Fernánde
a b s t r a c t
In this paper text segmentation in generic displays is proposed through learning the best binarization val-ues for a commercial optical character recognition (OCR) system. The commercial OCR is briefly intro-duced as well as the parameters that affect the binarization for improving the classification scores. Thepurpose of this work is to provide the capability to automatically evaluate standard textual display infor-mation, so that tasks that involve visual user verification can be performed without human intervention.The problem to be solved is to recognize text characters that appear on the display, as well as the color ofthe characters’ foreground and background. The paper introduces how the thresholds are learnt through:(a) selecting lightness or hue component of a color input cell, (b) enhancing the bitmaps’ quality, and(c) calculating the segmentation threshold range for this cell. Then, starting from the threshold rangeslearnt at each display cell, the best threshold for each cell is gotten. The input and output data sets fortesting the algorithms proposed are described, as well as the analysis of the results obtained.
� 2011 Elsevier Ltd. All rights reserved.
1. Introduction
With the rapid progress of digital imaging acquisition tech-niques, text recognition becomes increasingly important. Theproblems in text recognition seem mainly to be due to segmenta-tion (Aas & Eikvil, 1996; Jain & Bhattacharjee, 1992; Montazer,Saremi, & Khatibi, 2010). The problem of text segmentation liesin effective separation into character foreground and background(e.g. Shapiro, Gluhchev, & Dimov, 2006). In this sense, most opticalcharacter recognition (OCR) methods assume that individual char-acters can be isolated.
For digital character images, traditional OCR methods do notprovide satisfactory recognition performance because it is very dif-ficult to get clear binary character images (Liu, Wang, & Dai, 2006).For example, the performance of OCR can be degraded if the char-acters in binarized images are broken or blurred. There are manyfactors that affect the performance of binarization algorithm, suchas complex signal-dependent noise (Zheng, Li, & Doermann, 2004)and variable background intensity, which are caused by non-uniform illumination, shadow, smear, smudge or low contrast(Huang, Ahmadi, & Sid-Ahmed, 2008). In recent decades, some re-search has been concentrated on character recognition, which canbe divided into two categories: extraction of the character features
ll rights reserved.
lla-La Mancha, Instituto deAlbacete, Spain. Tel.: +34 967
z-Caballero).
from the binary character image by advanced binarization (Kan-ungo, Haralick, Baird, Stuezle, & Madigan, 2000; Taylor & Dance,1998), and direct extraction of the features from the gray scaleimage (Lee & Kim, 1995; Wang & Pavlidis, 1993). Bi-thresholdingor binarization is probably the most simple but effective techniquefor text segmentation. Therefore it has been intensively used formore the last three decades. Indeed, the problem of text binariza-tion may be considered as a pre-processing step for OCR (Gupta,Jacobson, & Garcia, 2007). The binarization methods reported inthe literature can be categorized into (1) histogram-based methods(Prewitt & Mendelsohn, 1965), (2) clustering-based methods (Otsu,1979), (3) object attribute-based methods (Pikaz & Averbuch,1996), and (4) discrimination based on local pixel’s characteristics(Yan & Wu, 1994).
In the clustering-based methods, the gray-level samples areusually clustered in two parts as background and foreground.The Otsu method (Otsu, 1979) is the most referenced thresholdingmethod. In this method the weighted sum of within-class vari-ances of the foreground and background pixels are minimized toestablish an optimum threshold. This method gives satisfactory re-sults when the numbers of pixels in each class are similar. Addi-tional methods include iterative thresholding (Yanni & Horne,1994), minimum error thresholding (Cho, Haralick, & Yi, 1989; Kit-tler & Illingworth, 1986), as well as fuzzy clustering thresholding(Jawahar, Biswas, & Ray, 1997). For local pixels adaptive algo-rithms, a threshold is calculated at each pixel, which depends onsome local statistics like range, variance, or surface-fitting param-eters of the neighboring pixels. A surface fitted to the gray-level
A. Fernández-Caballero et al. / Expert Systems with Applications 39 (2012) 4032–4043 4033
landscape is used as a local threshold in Yanowitz and Bruckstein(1989), Shen and Ip (1997). Also traditional neural networks (Yan& Wu, 1994) are introduced to discriminate the pixels into back-ground and foreground, according to the characteristics aroundevery pixel. In another paper (Yan, Zhang, & Kube, 2005), a generallocally adaptive thresholding method using neighborhood process-ing is presented. The method makes use of local image statistics ofmean and variance within a variable neighborhood and twothresholds obtained from the global intensity distribution.
Recently the application of dynamic Bayesian networks (DBN)to the recognition of noisy characters has been investigated (Lik-forman-Sulem & Sigelle, 2008). Similar stochastic approaches suchas hidden Markov models (HMM) have been widely applied to textrecognition (Schenkel & Jabri, 1998). This is largely due to theirability to cope with incomplete information and non-linear distor-tions. HMM may also be used as classifiers for single characters(Park & Lee, 1998). A recent paper (Liu et al., 2006) proposes anapproach for the low resolution character recognition, which fitsthe input character for the appropriate character database accord-ing to the input image quality. It is composed of character imagequality evaluation and character recognition.
It should be mentioned that most of the algorithms are based onthe hypothesis that the foreground is much darker or clearer thanthe background, which is true in most of the cases (Antani, Crand-all, & Kasturi, 2000). Though much effort has been devoted to thebinarization, extraction of characters from noisy images is still abig challenge (Huang et al., 2008). Text segmentation methods as-sume that the gray-scale distribution is bimodal and that charac-ters a priori correspond to either the white part or the black part,but without providing a way of choosing which of the two possibil-ities applies. Great efforts are thus devoted to performing betterbinarization, combining global and local thresholding (Kamada &Fujimoto, 1999), M-estimation (Hori, 1999), or simple smoothing(Wu, Manmatha, & Riseman, 1997). However, these methods areunable to filter out background regions with similar gray-scale val-ues to the characters. If the character gray-scale value is known,text enhancement methods can help the binarization process (Sato,Kanade, Hughes, & Smith, 1998). However, without proper estima-tion of the character scale, the designed filters cannot enhancecharacter strokes with different thickness (Chen, Shearer, & Bour-lard, 2001). So, in Sato et al. (1998) a linear interpolation techniqueto magnify small text at a higher resolution is used. Text regionsare detected and localized using Smith and Kanade’s method(Smith & Kanade, 1995), and sub-pixel linear interpolation is ap-plied to obtain higher resolution images. And, in Li, Doermann,and Kia (2000), and Li and Doermann (2000) several approachesfor text enhancement have been proposed. For example, they usethe Shannon interpolation technique to enhance the image resolu-tion of video images. The image resolution is increased using anextension of the Nyquist sampling theorem and it is determinedwhether the text is normal or inverse by comparing it with a globalthreshold and background color.
When the captured images include colors, the text segmenta-tion problem increases significantly, leading sometimes to a colorreduction (Makridis, Nikolaou, & Papamarkos, 2010). In Wangand Kangas (2003), color clustering is used to separate the colorimage into homogeneous color layers. Next, for each color layer,every connected component in color layers is analyzed using blackadjacency graph (BAG), and the component-bounding box is com-puted. Then, for coarse detection of characters, an aligning-and-merging-analysis (AMA) scheme is proposed to locate all the po-tential characters using the information about the bounding boxesof connected components in all color layers. Finally, to eliminatefalse characters, a four-step identification of characters is used.Also, a binarization technique of characters in color using geneticalgorithms (GA) to search for an optimal sequence of filters
through a filter bank has been proposed (Kohmura & Wakahara,2006). The filter bank contains simple image processing filters asapplied to one of the RGB color planes and logical/arithmetic oper-ations between two color planes. Different adaptive binarizationmethods can for instance be (Yanowitz & Bruckstein, 1989); andin Trier and Taxt (1995) several methods are compared with re-spect to the obtained recognition results. The intrinsic characteris-tics of the text by using the stroke filter has also been considered(Jung, Liu, & Kim, 2008). First, the stroke filter briefly based on localregion analysis is described. Second, the determination of textcolor polarity and local region growing procedures are performedsuccessively based on the response of the stroke filter. Finally,the feedback procedure by the recognition score from an OCR mod-ule is used to improve the performance of text segmentation. InTsai and Lee (2002) the binarization of color images by using thelightness and saturation features, components of the HLS (hue–lightness–saturation) color space is proposed. The binarizationresults are shown using only lightness, only saturation, or a combi-nation of both lightness and saturation.
In this paper we propose to learn the best-fitted OCR binariza-tion parameters for a commercial OCR library. This will make thesegmentation have the highest probability of being the most cor-rect. In Section 2, a general description of the approach is provided.Sections 3 and 4 introduce some pre-processing steps needed be-fore any recognition algorithm. Then, Sections 5 and 6 introducethe method for learning the colors present in the display and thethreshold ranges per cell, which enable a good performance whenrecognizing the characters. Afterwards, the parameters learnt pre-viously are used to determine the optimal recognition values inSection 7. The data used to validate the approach, as well as the re-sults obtained, are discussed in Section 8. Lastly, in Section 9, weoffer our conclusions.
2. General description of the approach
The purpose of this work is to provide the capability to auto-matically evaluate standard display information, so that tasks thatinvolve visual user verification can be performed without humanintervention. The problem to be solved is to recognize text charac-ters that appear on the display, as well as, the color of the charac-ters’ foreground and background. Our approach, as in most otherprevious works, is based on an accurate binarization of the textcharacters. But, camera-captured images often exhibit non-uni-form brightness because it is difficult to control the imaging envi-ronment, unlike in the case of the scanner. The histogram of suchimages is generally not bi-modal and a single threshold can neveryield an accurate binary document image. As such, global binariza-tion methods are not suitable for camera images. However, mostcommercial OCRs use binarized images or gray-scale images asinput.
In applications where you also want to detect the color (charac-ter or background color), camera-captured colored images willobviously have to be converted into gray scale or directly bina-rized. In any case, the basic parameter chosen to separate the fore-ground from the background is precisely the optimal thresholdvalue, h.
Moreover, our solution establishes that the characters have tofall into a pre-defined set of cells (or bitmaps) of the display. Thedisplay is divided into a pre-defined number of rows and columns.Each cell or bitmap in the RGB (red–green–blue) color space,BRGB(i, j), contains a single character, char(i, j), where (i, j) is thecoordinate of the cell’s row and column. Also, each cell will havea height, h, and a width, w in the coordinates space [x,y], wherex 2 [1..w] and y 2 [1..h]. Thus, the objective is to accurately recog-nize the ASCII values of each character, char(i, j), contained in its
4034 A. Fernández-Caballero et al. / Expert Systems with Applications 39 (2012) 4032–4043
corresponding bitmap, BRGB(i, j). To obtain the character code, thesolution proposed entails performing two phases. Training is pro-posed for the first phase in order to obtain an optimal threshold,hopt(i, j), for every input image cell. This optimal threshold will pro-vide the best accuracy rate in commercial OCR module recognition.The second phase, so-called detection phase, uses the results fromthe previous phase, training phase, to obtain the character value.
Finally, please notice that the commercial OCR recognitionmodule used in this work is the OCR provided by the Matrox com-pany through the Matrox Imaging Library (MIL). The MIL OpticalCharacter Recognition module reads and verifies mechanicallygenerated character strings in 8-bit gray scale images, and providesresults such as quality scores and validity flags. Functions are avail-able to create, save, restore, modify, and inquire about fonts. Themodule also allows you to calibrate fonts, define search con-straints, and read/verify character strings in the target image. Thefont information can be saved in a MIL-compatible (.mfo) font fileformat that can be used with other Matrox Imaging software prod-ucts. The functions from the MIL library used are MocrReadString,which reads an unknown string from the specified target imageusing the specified OCR font context, and function MocrGetResult,which gets the specified type of result(s) from an OCR result buffer.
void MocrReadString (
MIL_ID ImageBufId,
MIL_ID FontId,
MIL_ID OcrResultId
)
where ImageBufId specifies the identifier of the image which con-tains the string to be read, FontId specifies the identifier of theOCR font context to be used to read the string from the target image,and OcrResultId specifies the OCR result buffer in which to place re-sults of the read operation. All existing font controls and constraintsare taken into account, and results are stored in the specified resultbuffer.
void MocrGetResult (
MIL_ID OcrResultId,
double ResultType,
void ⁄ResultPtr)
where OcrResultId specifies the identifier of the OCR result bufferfrom which to retrieve results, ResultType specifies the type of
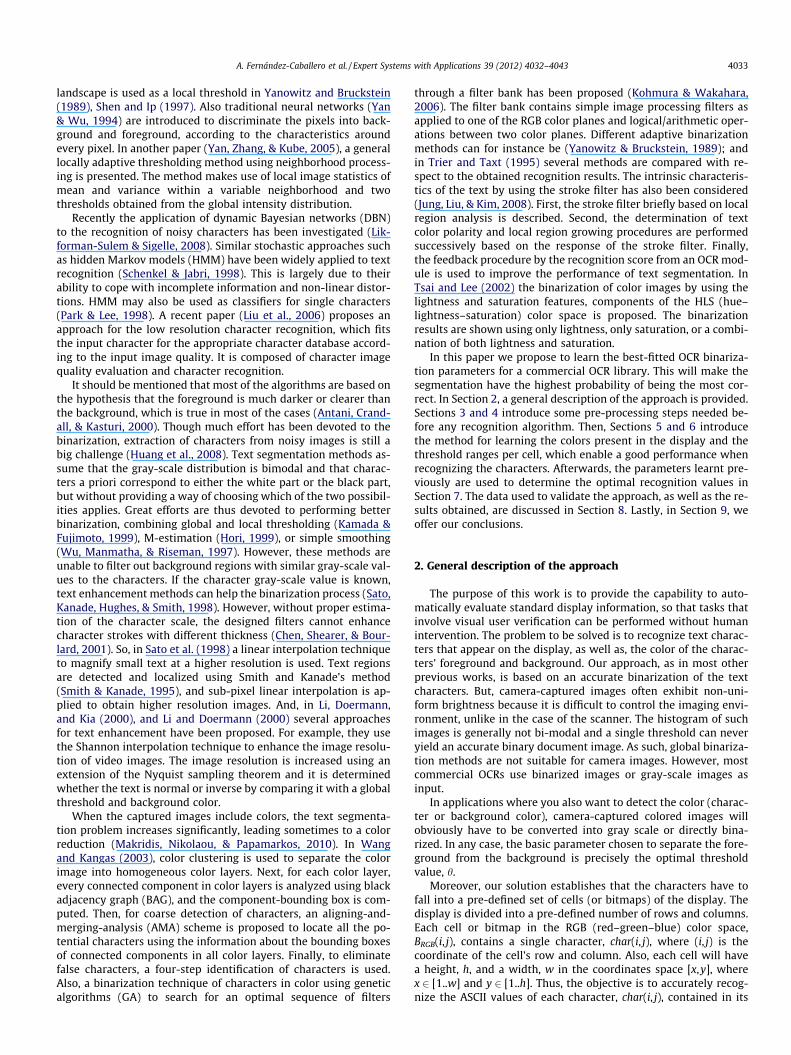
Fig. 1. (a) Optimal dots grid
result(s) to be retrieved, and ResultPtr specifies the address in whichto write the results. Now, the following values are available to re-trieve results from a read or a verify operation:
� M_TEXT: Retrieves the entire text. This includes all availablestrings, their separators, and the terminating character.� M_TEXT_LENGTH: Retrieves the total number of characters in
the entire text.� M_TEXT_SCORE: Retrieves the match score for the entire text as
determined during the read/verify operation.� M_THRESHOLD: Retrieves the value used to binarize the target
image.
We are specifically concerned with the read character and scorefor the output results, since in this proposal, we well read the dis-play characters one by one.
3. Image calibration
As told before, one of the greatest difficulties for an optimal seg-mentation in fixed positions of a textual display is the calculationof the exact starting and ending positions of each bitmap in thecoordinate system of the display. This it is an exciting challenge,as important screen deformations appear due to the camera lensused for the display acquisition process. These deformations con-sist of a ‘‘ballooning’’ of the image, trimmed in the point to whichthe camera focuses. For this reason, it is essential to initially per-form a calibration of the image. Let us remind, once again, thatthe segmentation in this type of displays is essentially based inan efficient bitmaps localization. It is absolutely mandatory to scanany captured image with no swelling up, row by row, or column bycolumn, to obtain the precise position of each bitmap (BRGB(i, j)). Onthe contrary, pixels of a given row or column might belong to anadjacent bitmap.
In order to solve this problem, a ‘‘dots grid’’, Gdots, is used as apattern (see Fig. 1a). Each grid dot corresponds to the central pixelof a bitmap (or cell) BRGB(i, j) of the display. Once the grid pointshave been captured by the camera, the image ballooning and eachdot deviation with respect to the others may be studied (seeFig. 1b).
Thanks to this information, and by applying the piecewise linearinterpolation calibration method (Faugeras, 1993; Tsai, 1987), anyinput image, I, is ‘‘de-ballooned’’. Thus, this swelling up is elimi-nated, providing a resulting new image IP. The centers of the dotsare used to perform the calculations necessary to regenerate the
. (b) Captured dots grid.

Fig. 2. (a) Optimal bitmaps grid. (b) Captured bitmaps grid.
Fig. 3. (a) Binarized bitmaps grid. (b) Binarized and calibrated bitmaps grid.
A. Fernández-Caballero et al. / Expert Systems with Applications 39 (2012) 4032–4043 4035
original rectangular form of the input image. In addition, the aver-age, Gdots, of a certain number of captured dots grids is used as in-put to the calibration method to augment the precision of theprocess.
4. Bitmap localization
After calibration, the algorithms for bitmap localization arestarted. This phase is in charge of obtaining the most accuratelocalization of all bitmaps present in the calibrated image IP. Inother words, the algorithm obtains, for each bitmap BRGB(i, j) its ini-tial and final pixels’ exact positions. From the previous positions,also the bitmap’s height, h, and width, w are calculated.
For performing the precise bitmap localization, another tem-plate (or pattern) is built up. This template consists of a ‘‘bitmapsgrid’’ (see Fig. 2a), that is to say, a grid establishing the limits(borders) of each bitmap. The process consists in capturing this‘‘bitmaps grid’’, Gcells, which, obviously, also appears convex aftercamera capture (see Fig. 2b). Again, a mean template image, Gcells,is formed by merging a determined number of bitmaps grids cap-tures. This process is driven to reduce noise that appears whenusing a single capture.
On the resulting average image, Gcells, a series of image enhance-ment techniques are applied. In first place, a binarization takes
place to clearly separate the background from the foreground(see Fig. 3a). The binarization is performed as shown in formula (1).
BGcells ¼0; if Gcells 6 135255; otherwise
(ð1Þ
Next, the calibration algorithm is applied to the bitmaps grid (seeFig. 3b), similarly to the calibration performed on the dots grid, inorder to correct the distortion caused by the camera lens.
Once the template has been calibrated, it is now the time to per-form little refinements on the bitmaps. For this purpose, an objectsearch algorithm is used in the captured image. It is necessary toeliminate possible spots that do not represent bitmap zones. Forthis, a filter to eliminate too small or too big ‘‘objects’’ is applied.Then, the generated ‘‘objects’’ are analyzed. It is verified that thetotal number of ‘‘objects’’ corresponds with the total number ofbitmaps in the display (that is to say, in the template). If this isthe case, the resulting ‘‘objects’’ are sorted from left to right andfrom top to bottom.
While the position of the camera or the display type do notchange during the segmentation process, the calibration and local-ization remain for all the searches in bitmaps. Nonetheless, someproblems may arise during these phases. For instance, the cameramay not be correctly adjusted. In this case, the processing of thecells fails irremediably. Some cells may appear united due to a
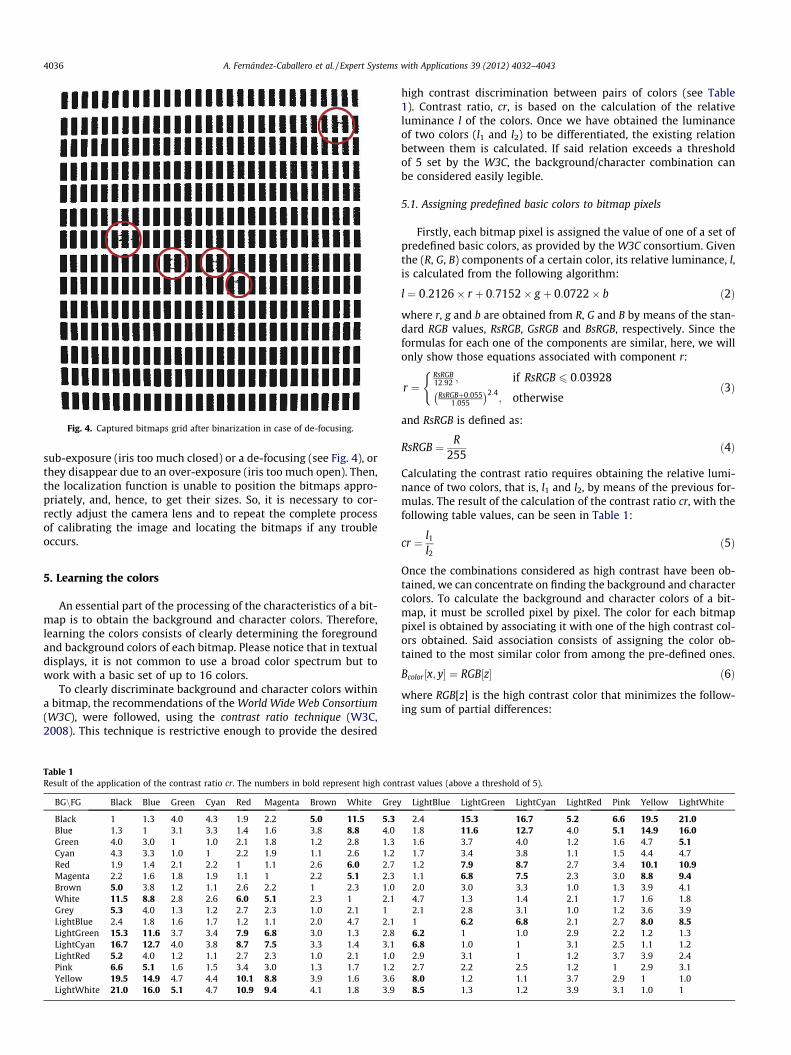
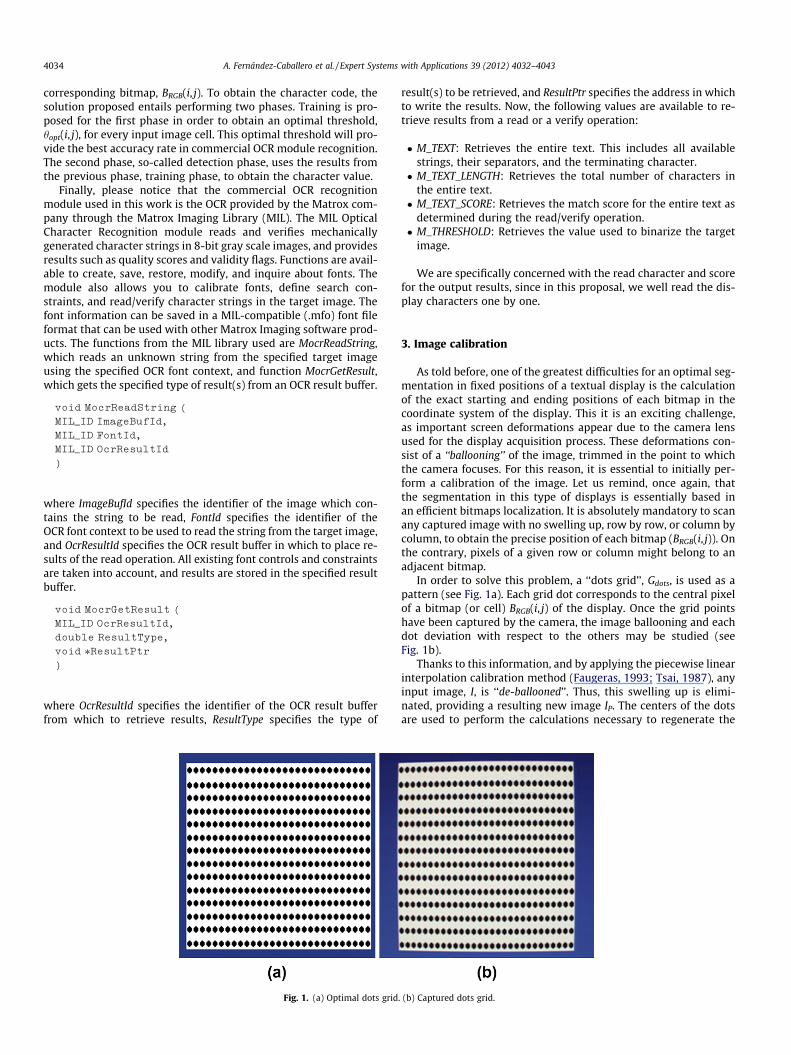
Fig. 4. Captured bitmaps grid after binarization in case of de-focusing.
4036 A. Fernández-Caballero et al. / Expert Systems with Applications 39 (2012) 4032–4043
sub-exposure (iris too much closed) or a de-focusing (see Fig. 4), orthey disappear due to an over-exposure (iris too much open). Then,the localization function is unable to position the bitmaps appro-priately, and, hence, to get their sizes. So, it is necessary to cor-rectly adjust the camera lens and to repeat the complete processof calibrating the image and locating the bitmaps if any troubleoccurs.
5. Learning the colors
An essential part of the processing of the characteristics of a bit-map is to obtain the background and character colors. Therefore,learning the colors consists of clearly determining the foregroundand background colors of each bitmap. Please notice that in textualdisplays, it is not common to use a broad color spectrum but towork with a basic set of up to 16 colors.
To clearly discriminate background and character colors withina bitmap, the recommendations of the World Wide Web Consortium(W3C), were followed, using the contrast ratio technique (W3C,2008). This technique is restrictive enough to provide the desired
Table 1Result of the application of the contrast ratio cr. The numbers in bold represent high cont
BGnFG Black Blue Green Cyan Red Magenta Brown White Grey
Black 1 1.3 4.0 4.3 1.9 2.2 5.0 11.5 5.3Blue 1.3 1 3.1 3.3 1.4 1.6 3.8 8.8 4.0Green 4.0 3.0 1 1.0 2.1 1.8 1.2 2.8 1.3Cyan 4.3 3.3 1.0 1 2.2 1.9 1.1 2.6 1.2Red 1.9 1.4 2.1 2.2 1 1.1 2.6 6.0 2.7Magenta 2.2 1.6 1.8 1.9 1.1 1 2.2 5.1 2.3Brown 5.0 3.8 1.2 1.1 2.6 2.2 1 2.3 1.0White 11.5 8.8 2.8 2.6 6.0 5.1 2.3 1 2.1Grey 5.3 4.0 1.3 1.2 2.7 2.3 1.0 2.1 1LightBlue 2.4 1.8 1.6 1.7 1.2 1.1 2.0 4.7 2.1LightGreen 15.3 11.6 3.7 3.4 7.9 6.8 3.0 1.3 2.8LightCyan 16.7 12.7 4.0 3.8 8.7 7.5 3.3 1.4 3.1LightRed 5.2 4.0 1.2 1.1 2.7 2.3 1.0 2.1 1.0Pink 6.6 5.1 1.6 1.5 3.4 3.0 1.3 1.7 1.2Yellow 19.5 14.9 4.7 4.4 10.1 8.8 3.9 1.6 3.6LightWhite 21.0 16.0 5.1 4.7 10.9 9.4 4.1 1.8 3.9
high contrast discrimination between pairs of colors (see Table1). Contrast ratio, cr, is based on the calculation of the relativeluminance l of the colors. Once we have obtained the luminanceof two colors (l1 and l2) to be differentiated, the existing relationbetween them is calculated. If said relation exceeds a thresholdof 5 set by the W3C, the background/character combination canbe considered easily legible.
5.1. Assigning predefined basic colors to bitmap pixels
Firstly, each bitmap pixel is assigned the value of one of a set ofpredefined basic colors, as provided by the W3C consortium. Giventhe (R, G, B) components of a certain color, its relative luminance, l,is calculated from the following algorithm:
l ¼ 0:2126� r þ 0:7152� g þ 0:0722� b ð2Þ
where r, g and b are obtained from R, G and B by means of the stan-dard RGB values, RsRGB, GsRGB and BsRGB, respectively. Since theformulas for each one of the components are similar, here, we willonly show those equations associated with component r:
r ¼RsRGB12:92 ; if RsRGB 6 0:03928
RsRGBþ0:0551:055
� �2:4; otherwise
(ð3Þ
and RsRGB is defined as:
RsRGB ¼ R255
ð4Þ
Calculating the contrast ratio requires obtaining the relative lumi-nance of two colors, that is, l1 and l2, by means of the previous for-mulas. The result of the calculation of the contrast ratio cr, with thefollowing table values, can be seen in Table 1:
cr ¼ l1
l2ð5Þ
Once the combinations considered as high contrast have been ob-tained, we can concentrate on finding the background and charactercolors. To calculate the background and character colors of a bit-map, it must be scrolled pixel by pixel. The color for each bitmappixel is obtained by associating it with one of the high contrast col-ors obtained. Said association consists of assigning the color ob-tained to the most similar color from among the pre-defined ones.
Bcolor ½x; y� ¼ RGB½z� ð6Þ
where RGB[z] is the high contrast color that minimizes the follow-ing sum of partial differences:
rast values (above a threshold of 5).
LightBlue LightGreen LightCyan LightRed Pink Yellow LightWhite
2.4 15.3 16.7 5.2 6.6 19.5 21.01.8 11.6 12.7 4.0 5.1 14.9 16.01.6 3.7 4.0 1.2 1.6 4.7 5.11.7 3.4 3.8 1.1 1.5 4.4 4.71.2 7.9 8.7 2.7 3.4 10.1 10.91.1 6.8 7.5 2.3 3.0 8.8 9.42.0 3.0 3.3 1.0 1.3 3.9 4.14.7 1.3 1.4 2.1 1.7 1.6 1.82.1 2.8 3.1 1.0 1.2 3.6 3.91 6.2 6.8 2.1 2.7 8.0 8.56.2 1 1.0 2.9 2.2 1.2 1.36.8 1.0 1 3.1 2.5 1.1 1.22.9 3.1 1 1.2 3.7 3.9 2.42.7 2.2 2.5 1.2 1 2.9 3.18.0 1.2 1.1 3.7 2.9 1 1.08.5 1.3 1.2 3.9 3.1 1.0 1
Color Bitmap (RGB)
Selecting lightness or hue component
Selected Bitmap
Thresholding
Binary Bitmap
Commercial OCR
{ Score , Char }
Filter
Enhancing the bitmaps
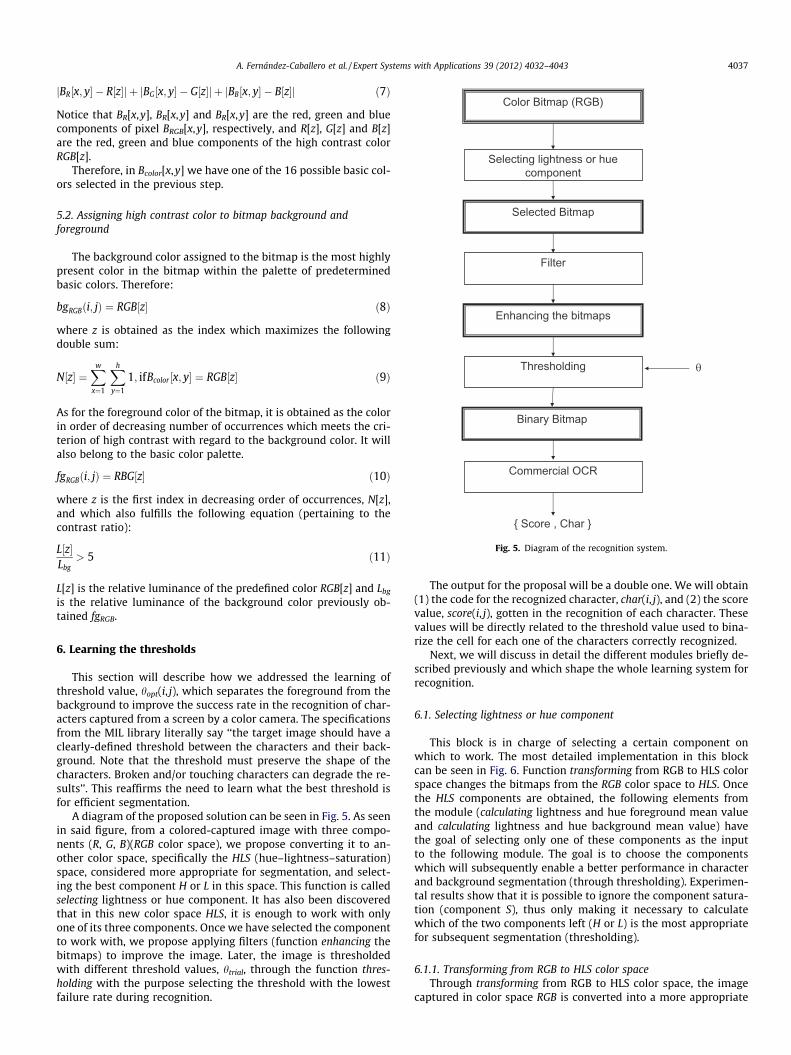
Fig. 5. Diagram of the recognition system.
A. Fernández-Caballero et al. / Expert Systems with Applications 39 (2012) 4032–4043 4037
jBR½x; y� � R½z�j þ jBG½x; y� � G½z�j þ jBB½x; y� � B½z�j ð7Þ
Notice that BR[x,y], BR[x,y] and BR[x,y] are the red, green and bluecomponents of pixel BRGB[x,y], respectively, and R[z], G[z] and B[z]are the red, green and blue components of the high contrast colorRGB[z].
Therefore, in Bcolor[x,y] we have one of the 16 possible basic col-ors selected in the previous step.
5.2. Assigning high contrast color to bitmap background andforeground
The background color assigned to the bitmap is the most highlypresent color in the bitmap within the palette of predeterminedbasic colors. Therefore:
bgRGBði; jÞ ¼ RGB½z� ð8Þ
where z is obtained as the index which maximizes the followingdouble sum:
N½z� ¼Xw
x¼1
Xh
y¼1
1; ifBcolor ½x; y� ¼ RGB½z� ð9Þ
As for the foreground color of the bitmap, it is obtained as the colorin order of decreasing number of occurrences which meets the cri-terion of high contrast with regard to the background color. It willalso belong to the basic color palette.
fgRGBði; jÞ ¼ RBG½z� ð10Þ
where z is the first index in decreasing order of occurrences, N[z],and which also fulfills the following equation (pertaining to thecontrast ratio):
L½z�Lbg
> 5 ð11Þ
L[z] is the relative luminance of the predefined color RGB[z] and Lbg
is the relative luminance of the background color previously ob-tained fgRGB.
6. Learning the thresholds
This section will describe how we addressed the learning ofthreshold value, hopt(i, j), which separates the foreground from thebackground to improve the success rate in the recognition of char-acters captured from a screen by a color camera. The specificationsfrom the MIL library literally say ‘‘the target image should have aclearly-defined threshold between the characters and their back-ground. Note that the threshold must preserve the shape of thecharacters. Broken and/or touching characters can degrade the re-sults’’. This reaffirms the need to learn what the best threshold isfor efficient segmentation.
A diagram of the proposed solution can be seen in Fig. 5. As seenin said figure, from a colored-captured image with three compo-nents (R, G, B)(RGB color space), we propose converting it to an-other color space, specifically the HLS (hue–lightness–saturation)space, considered more appropriate for segmentation, and select-ing the best component H or L in this space. This function is calledselecting lightness or hue component. It has also been discoveredthat in this new color space HLS, it is enough to work with onlyone of its three components. Once we have selected the componentto work with, we propose applying filters (function enhancing thebitmaps) to improve the image. Later, the image is thresholdedwith different threshold values, htrial, through the function thres-holding with the purpose selecting the threshold with the lowestfailure rate during recognition.
The output for the proposal will be a double one. We will obtain(1) the code for the recognized character, char(i, j), and (2) the scorevalue, score(i, j), gotten in the recognition of each character. Thesevalues will be directly related to the threshold value used to bina-rize the cell for each one of the characters correctly recognized.
Next, we will discuss in detail the different modules briefly de-scribed previously and which shape the whole learning system forrecognition.
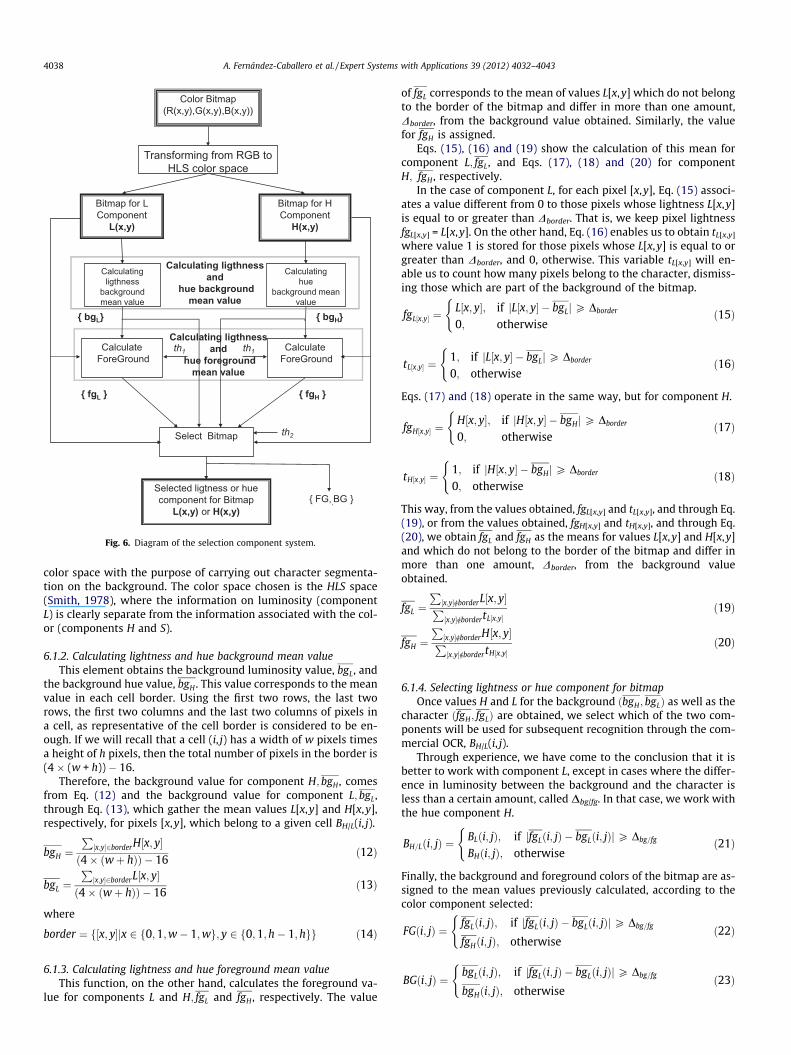
6.1. Selecting lightness or hue component
This block is in charge of selecting a certain component onwhich to work. The most detailed implementation in this blockcan be seen in Fig. 6. Function transforming from RGB to HLS colorspace changes the bitmaps from the RGB color space to HLS. Oncethe HLS components are obtained, the following elements fromthe module (calculating lightness and hue foreground mean valueand calculating lightness and hue background mean value) havethe goal of selecting only one of these components as the inputto the following module. The goal is to choose the componentswhich will subsequently enable a better performance in characterand background segmentation (through thresholding). Experimen-tal results show that it is possible to ignore the component satura-tion (component S), thus only making it necessary to calculatewhich of the two components left (H or L) is the most appropriatefor subsequent segmentation (thresholding).
6.1.1. Transforming from RGB to HLS color spaceThrough transforming from RGB to HLS color space, the image
captured in color space RGB is converted into a more appropriate
Calculating ligthness and
hue background mean value
Color Bitmap (R(x,y),G(x,y),B(x,y))
Bitmap for H Component
H(x,y)
Bitmap for L Component
L(x,y)
Transforming from RGB to HLS color space
Select Bitmap
Selected ligtness or hue component for Bitmap
L(x,y) or H(x,y)
Calculatingligthness
background mean value
CalculateForeGround
Calculatinghue
background mean value
CalculateForeGround
{ bgH}
{ fgL }
{ bgL}
{ fgH }
th1 th1
th2
{ FG,,BG }
Calculating ligthness and
hue foreground mean value
Fig. 6. Diagram of the selection component system.
4038 A. Fernández-Caballero et al. / Expert Systems with Applications 39 (2012) 4032–4043
color space with the purpose of carrying out character segmenta-tion on the background. The color space chosen is the HLS space(Smith, 1978), where the information on luminosity (componentL) is clearly separate from the information associated with the col-or (components H and S).
6.1.2. Calculating lightness and hue background mean valueThis element obtains the background luminosity value, bgL, and
the background hue value, bgH . This value corresponds to the meanvalue in each cell border. Using the first two rows, the last tworows, the first two columns and the last two columns of pixels ina cell, as representative of the cell border is considered to be en-ough. If we will recall that a cell (i, j) has a width of w pixels timesa height of h pixels, then the total number of pixels in the border is(4 � (w + h)) � 16.
Therefore, the background value for component H; bgH , comesfrom Eq. (12) and the background value for component L; bgL,through Eq. (13), which gather the mean values L[x,y] and H[x,y],respectively, for pixels [x,y], which belong to a given cell BH/L(i, j).
bgH ¼P½x;y�2borderH½x; y�
ð4� ðwþ hÞÞ � 16ð12Þ
bgL ¼P½x;y�2borderL½x; y�
ð4� ðwþ hÞÞ � 16ð13Þ
where
border ¼ f½x; y�jx 2 f0;1;w� 1;wg; y 2 f0;1;h� 1; hgg ð14Þ
6.1.3. Calculating lightness and hue foreground mean valueThis function, on the other hand, calculates the foreground va-
lue for components L and H; fgL and fgH , respectively. The value
of fgL corresponds to the mean of values L[x,y] which do not belongto the border of the bitmap and differ in more than one amount,Dborder, from the background value obtained. Similarly, the valuefor fgH is assigned.
Eqs. (15), (16) and (19) show the calculation of this mean forcomponent L; fgL, and Eqs. (17), (18) and (20) for componentH; fgH , respectively.
In the case of component L, for each pixel [x,y], Eq. (15) associ-ates a value different from 0 to those pixels whose lightness L[x,y]is equal to or greater than Dborder. That is, we keep pixel lightnessfgL[x,y] = L[x,y]. On the other hand, Eq. (16) enables us to obtain tL[x,y]
where value 1 is stored for those pixels whose L[x,y] is equal to orgreater than Dborder, and 0, otherwise. This variable tL[x,y] will en-able us to count how many pixels belong to the character, dismiss-ing those which are part of the background of the bitmap.
fgL½x;y� ¼L½x; y�; if jL½x; y� � bgLjP Dborder
0; otherwise
(ð15Þ
tL½x;y� ¼1; if jL½x; y� � bgLjP Dborder
0; otherwise
(ð16Þ
Eqs. (17) and (18) operate in the same way, but for component H.
fgH½x;y� ¼H½x; y�; if jH½x; y� � bgHjP Dborder
0; otherwise
(ð17Þ
tH½x;y� ¼1; if jH½x; y� � bgHjP Dborder
0; otherwise
(ð18Þ
This way, from the values obtained, fgL[x,y] and tL[x,y], and through Eq.(19), or from the values obtained, fgH[x,y] and tH[x,y], and through Eq.(20), we obtain fgL and fgH as the means for values L[x,y] and H[x,y]and which do not belong to the border of the bitmap and differ inmore than one amount, Dborder, from the background valueobtained.
fgL ¼P½x;y�RborderL½x; y�P½x;y�RbordertL½x;y�
ð19Þ
fgH ¼P½x;y�RborderH½x; y�P½x;y�RbordertH½x;y�
ð20Þ
6.1.4. Selecting lightness or hue component for bitmapOnce values H and L for the background ðbgH; bgLÞ as well as the
character ðfgH; fgLÞ are obtained, we select which of the two com-ponents will be used for subsequent recognition through the com-mercial OCR, BH/L(i, j).
Through experience, we have come to the conclusion that it isbetter to work with component L, except in cases where the differ-ence in luminosity between the background and the character isless than a certain amount, called Dbg/fg. In that case, we work withthe hue component H.
BH=Lði; jÞ ¼BLði; jÞ; if jfgLði; jÞ � bgLði; jÞjP Dbg=fg
BHði; jÞ; otherwise
(ð21Þ
Finally, the background and foreground colors of the bitmap are as-signed to the mean values previously calculated, according to thecolor component selected:
FGði; jÞ ¼fgLði; jÞ; if jfgLði; jÞ � bgLði; jÞjP Dbg=fg
fgHði; jÞ; otherwise
(ð22Þ
BGði; jÞ ¼bgLði; jÞ; if jfgLði; jÞ � bgLði; jÞjP Dbg=fg
bgHði; jÞ; otherwise
(ð23Þ

(a)
trial
GBGF inittrial
(b)
trial
GFGB init
trial
Fig. 7. Diagram of both binarization scenarios. (a) The background value is greaterthan the character value. (b) The character value is greater than the backgroundvalue.
A. Fernández-Caballero et al. / Expert Systems with Applications 39 (2012) 4032–4043 4039
6.2. Enhancing the bitmaps
In this part of the process, different types of filters are applied toeach bitmap BH/L(i, j). The goal of this successive filtering is to im-prove the bitmap so it can be analyzed in the most optimal waypossible by module OCR. Next, we show the different processescarried out on each bitmap in the order applied.
First, a 5 � 5 ‘‘enhancement’’ mask is applied to each bitmap, BH/
L,as shown in Eq. (24), to obtain the background characters, Bf, in amore distinguishable manner.
Bf ½x; y� ¼ BH=L½x; y� �
1 �2 3 �2 1�2 3 5 3 �23 5 9 5 3�2 3 5 3 �21 �2 3 �2 1
������������
������������ð24Þ
Next, a 2 � 2 erosion filter, as shown in Eq. (25) is applied, to limitthe thickness of the character. The previously applied 5 � 5enhancement filter unfortunately introduces an undesired effectof blurring the character borders. This effect is now corrected bymeans of the erosion filter, obtaining a better defined shape.
Be½x; y� ¼ min½x0 ;y0 �2½0::1;0::1�
Bf ðxþ x0; yþ y0Þ ð25Þ
70
80
60
70
50
30
40
inim
um
20
30mi
10
0
Code Character
1 16 31 46 61 76 91 106 121
Fig. 8. Variation of dhitmin , depending on the character, for position (1,1).
6.3. Thresholding
Once the component (L or H) we are going to work with is se-lected, and once the quality of the bitmap BH/L(i, j) is improved,the next milestone is to select the optimal threshold to distinguishbetween the background and the character. To do so, an initialthreshold, hinit, is established in the first place. The initial binariza-tion threshold corresponds to the mean between the foreground FGvalue obtained and the background BG, as shown in Eq. (26).
hinit ¼FGþ BG
2ð26Þ
Due to the problems derived from the noise always present inimages, this threshold value is not always the most appropriate.The threshold value depends on the position of the character onthe screen, as well as the morphology of the character. In fact, thethreshold depends on the position of the character on the screen,since the conditions for luminosity do not have to be homogeneousin the whole screen. Likewise, experimental results show that largeror more closed characters need a different threshold value fromsmaller characters.
Therefore, we propose increasing to or decreasing from the va-lue of hinit an amount Dh a number of times between jmin and jmax.Whether to increase or decrease from the value of hinit depends onthe relation between background color and foreground color, asshown in Eq. (27).
htrial ¼hinit � j� Dh; if FG < BG
hinit þ j� Dh; otherwise
�ð27Þ
where j 2 [jmin..jmax].The commercial OCR used for recognition uses as input the
binarized bitmap Bb(i, j) with a black character and a white back-ground. If FG < BG, the binarization given by Eq. (28) will be ap-plied, and if FG P BG, the binarization given by formula (29) willbe applied.
Bbði; jÞ ¼0; if Beði; jÞ 6 htrial
255; otherwise
�ð28Þ
Bbði; jÞ ¼0; if Beði; jÞP htrial
255; otherwise
�ð29Þ
Defining htrial = j � Dh, Fig. 7 shows, schematically, the two differ-ent binarizations depending on the values obtained for FG and BG.Fig. 7(a) represents the binarization when the background value,BG, is greater than the character value, FG. In this case, the thickestpart of the segment, ½FG$ htrial�, represents the value range (lumi-nosity or hue) which will be associated with the character afterbinarization. Fig. 7(a) represents binarization when the backgroundvalue, BG, is lower than the character value, FG. In this case, thethickest part of the segment, [htrial M htrialFG], represents the valuerange associated with the character after binarization. Notice thatin both cases, dtrial is the displacement for value hinit previously cal-culated through Eq. 26.
Let variables dhitmin and dhit
max be two values associated with thoseminimum and maximum thresholds that yield accurate recogni-tion. We have:
dhitmin ¼ jhit
min � Dh ð30Þdhit
max ¼ jhitmax � Dh ð31Þ
For each character and for each possible bitmap position in the dis-play, the values of these variables dhit
min and dhitmax are stored in a
matrix.Fig. 8 shows the variation of dhit
min for position (1,1) for the differ-ent ASCII codes of the character used for training the recognitionsystem. The graph shows that although there are some values fordhit
min ¼ 0, most of them need values greater than dhitmin to yield
accurate hits. Also notice that the maximum value of dhitmin is 40.
4040 A. Fernández-Caballero et al. / Expert Systems with Applications 39 (2012) 4032–4043
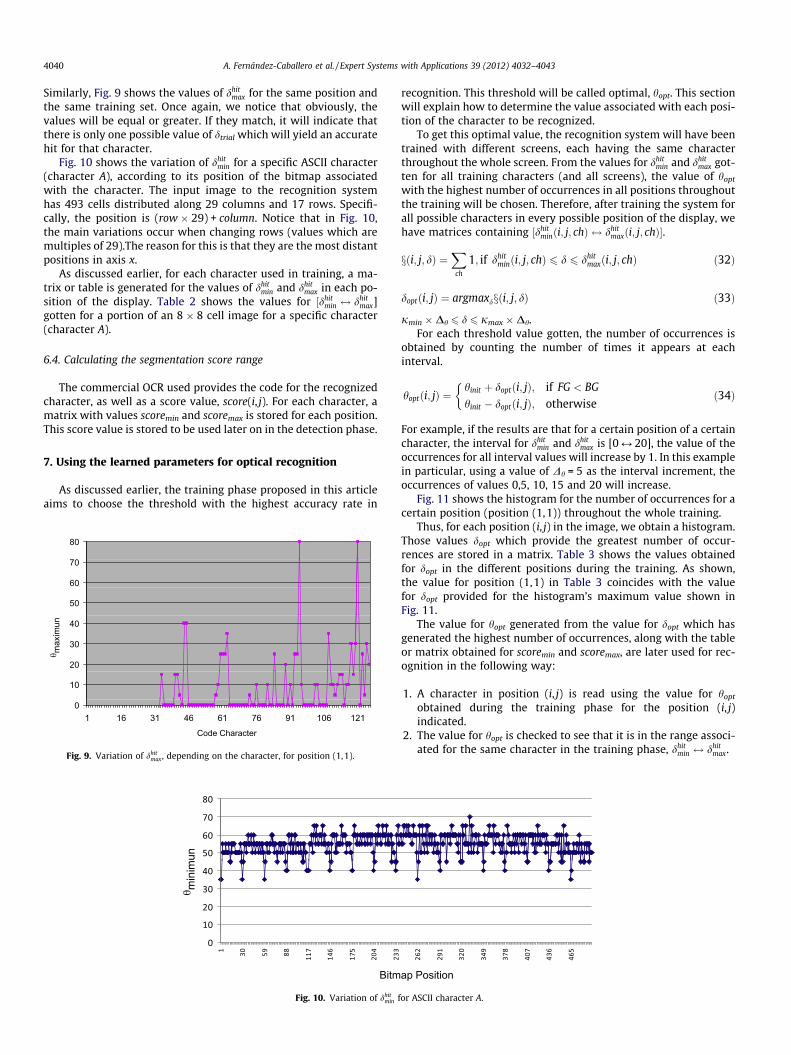
Similarly, Fig. 9 shows the values of dhitmax for the same position and
the same training set. Once again, we notice that obviously, thevalues will be equal or greater. If they match, it will indicate thatthere is only one possible value of dtrial which will yield an accuratehit for that character.
Fig. 10 shows the variation of dhitmin for a specific ASCII character
(character A), according to its position of the bitmap associatedwith the character. The input image to the recognition systemhas 493 cells distributed along 29 columns and 17 rows. Specifi-cally, the position is (row � 29) + column. Notice that in Fig. 10,the main variations occur when changing rows (values which aremultiples of 29).The reason for this is that they are the most distantpositions in axis x.
As discussed earlier, for each character used in training, a ma-trix or table is generated for the values of dhit
min and dhitmax in each po-
sition of the display. Table 2 shows the values for ½dhitmin $ dhit
max]gotten for a portion of an 8 � 8 cell image for a specific character(character A).
6.4. Calculating the segmentation score range
The commercial OCR used provides the code for the recognizedcharacter, as well as a score value, score(i, j). For each character, amatrix with values scoremin and scoremax is stored for each position.This score value is stored to be used later on in the detection phase.
7. Using the learned parameters for optical recognition
As discussed earlier, the training phase proposed in this articleaims to choose the threshold with the highest accuracy rate in
80
60
70
50
axim
un
30
40
ma
20
30
10
01 16 31 46 61 76 91 106 121
Code Character
Fig. 9. Variation of dhitmax , depending on the character, for position (1,1).
Fig. 10. Variation of dhitmin f
recognition. This threshold will be called optimal, hopt. This sectionwill explain how to determine the value associated with each posi-tion of the character to be recognized.
To get this optimal value, the recognition system will have beentrained with different screens, each having the same characterthroughout the whole screen. From the values for dhit
min and dhitmax got-
ten for all training characters (and all screens), the value of hopt
with the highest number of occurrences in all positions throughoutthe training will be chosen. Therefore, after training the system forall possible characters in every possible position of the display, wehave matrices containing ½dhit
minði; j; chÞ $ dhitmaxði; j; chÞ�.
xði; j; dÞ ¼X
ch
1; if dhitminði; j; chÞ 6 d 6 dhit
maxði; j; chÞ ð32Þ
doptði; jÞ ¼ argmaxdxði; j; dÞ ð33Þ
jmin � Dh 6 d 6 jmax � Dh.For each threshold value gotten, the number of occurrences is
obtained by counting the number of times it appears at eachinterval.
hoptði; jÞ ¼hinit þ doptði; jÞ; if FG < BG
hinit � doptði; jÞ; otherwise
�ð34Þ
For example, if the results are that for a certain position of a certaincharacter, the interval for dhit
min and dhitmax is [0 M 20], the value of the
occurrences for all interval values will increase by 1. In this examplein particular, using a value of Dh = 5 as the interval increment, theoccurrences of values 0,5, 10, 15 and 20 will increase.
Fig. 11 shows the histogram for the number of occurrences for acertain position (position (1,1)) throughout the whole training.
Thus, for each position (i, j) in the image, we obtain a histogram.Those values dopt which provide the greatest number of occur-rences are stored in a matrix. Table 3 shows the values obtainedfor dopt in the different positions during the training. As shown,the value for position (1,1) in Table 3 coincides with the valuefor dopt provided for the histogram’s maximum value shown inFig. 11.
The value for hopt generated from the value for dopt which hasgenerated the highest number of occurrences, along with the tableor matrix obtained for scoremin and scoremax, are later used for rec-ognition in the following way:
1. A character in position (i, j) is read using the value for hopt
obtained during the training phase for the position (i, j)indicated.
2. The value for hopt is checked to see that it is in the range associ-ated for the same character in the training phase, dhit
min $ dhitmax.
or ASCII character A.

Table 2Table of values dhit
min and dhitmax for a sub-image of size 8 � 8.
[0 M 60] [0 M 45] [0 M 10] [0 M 45] [0 M 50] [0 M 50] [0 M 15] [0 M 10][0 M 30] [0 M 50] [0 M 15] [5 M 15] [0 M 30] [0 M 55] [0 M 15] [0 M 55][0 M 65] [0 M 65] [0 M 30] [0 M 0] [0 M 60] [0 M 30] [0 M 35] [20 M 20][0 M 60] [0 M 30] [0 M 20] [30 M 30] [0 M 30] [0 M 55] [0 M 65] [20 M 65][0 M 50] [0 M 55] [0 M 65] [0 M 0] [0 M 70] [0 M 80] [0 M 0] [30 M 70][0 M 70] [0 M 25] [5 M 15] [10 M 35] [15 M 55] [0 M 25] [50 M 60] [25 M 30][0 M 60] [10 M 45] [35 M 40] [20 M 20] [20 M 35] [15 M 15] [35 M 60] [0 M 45][10 M 60] [25 M 60] [25 M 65] [10 M 35] [15 M 70] [15 M 75] [20 M 50] [0 M 45]
Fig. 11. Histogram for threshold occurrences for position (1,1) throughout the whole training.
Table 4Hit percentage for all ASCII characters.
Charcode
%Hits
Charcode
%Hits
Charcode
%Hits
Charcode
%Hits
33 10 57 94 81 35 105 9934 100 58 100 82 77 106 8135 100 59 100 83 100 107 10036 100 60 100 84 71 108 8637 95 61 100 85 52 109 8738 84 62 100 86 99 110 9939 100 63 13 87 99 111 8340 100 64 67 88 100 112 10041 100 65 94 89 100 113 10042 100 66 86 90 78 114 10043 100 67 53 91 77 115 8444 89 68 67 92 100 116 10045 100 69 40 93 60 117 8746 100 70 73 94 99 118 10047 100 71 71 95 81 119 9248 92 72 98 96 100 120 9949 100 73 68 97 90 121 9950 73 74 69 98 86 122 8951 95 75 99 99 88 123 10052 100 76 66 100 88 124 10053 76 77 98 101 83 125 9454 83 78 95 102 98 126 9755 83 79 30 103 9456 52 80 78 104 100
Table 3Values obtained for dopt during training.
35 35 55 50 50 50 50 55 50 50 50 55 45 45 55 50 55 55 55 50 50 50 50 50 5050 55 50 45
35 45 55 55 55 50 55 60 55 55 55 60 55 50 55 60 55 50 55 55 55 50 55 55 5055 50 55 50
35 45 55 55 55 50 50 55 55 60 55 60 55 50 55 55 50 45 50 55 55 50 55 55 5055 55 55 45
40 40 50 60 60 55 50 60 50 55 50 60 60 50 55 55 55 50 50 55 50 45 55 45 5550 50 40 40
40 40 55 55 55 60 50 60 65 60 55 65 60 55 55 60 60 60 55 65 55 55 60 55 5050 55 55 50
40 45 55 60 60 60 60 50 60 50 55 55 55 55 55 65 55 60 60 60 60 50 55 55 5555 55 50 50
40 40 60 65 60 60 55 60 55 55 55 60 60 55 60 60 60 55 55 60 60 55 60 60 6055 60 60 50
40 45 60 60 55 60 65 60 60 55 55 60 65 60 60 60 55 65 55 60 55 55 60 60 4555 50 50 45
40 45 60 65 55 55 60 60 55 55 60 65 65 60 60 65 60 65 60 60 60 55 55 65 6060 60 60 50
35 45 60 65 50 50 65 60 55 50 60 65 55 50 65 55 60 60 55 60 60 50 55 60 5550 50 55 50
45 40 60 60 55 55 60 60 60 45 60 60 60 60 55 60 65 60 60 60 60 60 60 55 5550 60 60 45
45 45 65 60 55 55 65 55 55 55 50 70 55 50 65 60 50 55 60 60 60 50 55 60 5555 55 55 55
40 45 60 55 55 55 60 60 65 60 60 60 60 50 65 60 55 60 60 60 60 55 55 50 5550 55 60 45
40 50 50 65 60 55 55 55 50 55 55 60 55 50 60 55 60 60 50 60 60 60 55 60 6050 55 60 50
45 45 60 60 60 60 60 60 55 60 50 60 50 55 65 60 55 60 55 55 60 60 60 60 5550 60 55 55
40 45 45 55 55 55 55 55 55 55 60 60 55 50 60 50 45 60 45 50 65 50 50 60 5550 55 50 50
35 40 50 50 55 50 50 50 55 55 50 60 55 45 55 50 50 45 45 55 55 50 55 55 4555 50 50 50
A. Fernández-Caballero et al. / Expert Systems with Applications 39 (2012) 4032–4043 4041
3. If it is within that range and has a score scoreread between theminimum score scoremin and the maximum score scoremax forthat character, it is considered accurate. Otherwise, the OCRreading will be done again, but using a threshold within therange associated for the character read.
4042 A. Fernández-Caballero et al. / Expert Systems with Applications 39 (2012) 4032–4043
8. Data and results
This section shows the results obtained for recognition. To obtainthese results, the values have been set as follows: jmin = 0, jmax = 16and Dh = 5. Dborder = 60 and Dbg/fg = 3, for luminosity, Dbg/fg = 40, forhue.
The tests performed have demonstrated the capabilities of thesystem in relation to the optical character recognition task. In orderto get the necessary displays for performing the tests, a simulator hasbeen developed. The simulator is generic, enabling to configure thecharacteristics of any kind of display, CRT, LCD, and TFT-LCD. Dueto the generality of the simulator, the size of a simulated display(rows and columns) may be easily modified for generating a widerange of displays.
In this article we offer the results of testing the character seg-mentation on a complete set of ASCII characters (from charactercode 33–126). The mean results of the recognition may be ob-served on Table 4, where the mean hit percentage overcomes an86%, throwing a hit of 100% for 32 different characters, and a hitgreater than an 80% for 71 different characters. There are onlytwo characters offering a very poor hit percentage, namely, ASCIIcharacters 33 and 66, corresponding to ? and ! symbols, respec-tively. This is a problem of the commercial OCR, as the library han-dles very badly the characters that present unconnected elements(formed by more than one shape).
9. Conclusions
In this paper text segmentation in generic displays has beenproposed. For this purpose, the best binarization values for a com-mercial OCR system are learnt. The aim of this work is to providethe capability to automatically evaluate standard textual displayinformation, so that tasks that involve visual user verification canbe performed without human intervention.
The proposed system for generic displays includes some of theusual text recognition steps, namely localization, extraction andenhancement, and optical character recognition. In textual dis-plays the characters use to be placed at fixed positions. Therefore,our solution establishes a set of bitmaps in the display, in accor-dance with the number of rows and columns that the display isable to generate. The proposal has been tested on a multi-displaysimulator and a commercial OCR system, throwing good initialresults.
Acknowledgements
This work was partially supported by Spanish Ministerio deCiencia e Innovación TIN2010-20845-C03-01 grant.
References
Aas, K., & Eikvil, L. (1996). Text page recognition using grey-level features andhidden Markov models. Pattern Recognition, 29(6), 977–985.
Antani, S., Crandall, D., & Kasturi, R. (2000). Robust extraction of text in video. InProceedings of the 15th international conference on pattern recognition (Vol. 1, pp.831–834).
Shen, D., & Ip, H. H. S. (1997). A Hopfield neural network for adaptive imagesegmentation: An active surface paradigm. Pattern Recognition Letters, 18,37–48.
Chen, D., Shearer, K., & Bourlard, H. (2001). Text enhancement with asymmetricfilter for video OCR. In Proceedings of the 11th international conference on imageanalysis and processing (pp. 192–198).
Cho, S., Haralick, R., & Yi, S. (1989). Improvement of Kittler and Illingworths’sminimum error thresholding. Pattern Recognition, 22, 609–617.
Faugeras, O. (1993). Three-dimensional computer vision: A geometric viewpoint. TheMIT Press.
Gupta, M. R., Jacobson, N. P., & Garcia, E. K. (2007). OCR binarization and image pre-processing for searching historical documents. Pattern Recognition, 40, 389–397.
Hori, O. (1999). A video text extraction method for character recognition. InProceedings of the international conference on document analysis and recognition(pp. 25–28).
Huang, S., Ahmadi, M., & Sid-Ahmed, M. A. (2008). A hidden Markov model-basedcharacter extraction method. Pattern Recognition, 41, 2890–2900.
Jain, A. K., & Bhattacharjee, S. (1992). Text segmentation using gabor filters forautomatic document processing. Machine Vision and Applications, 5, 169–184.
Jawahar, C. V., Biswas, P. K., & Ray, A. K. (1997). Investigations on fuzzy thresholdingbased on fuzzy clustering. Pattern Recognition, 30, 1605–1613.
Jung, C., Liu, Q., & Kim, J. (2008). A new approach for text segmentation using astroke filter. Signal Processing, 88, 1907–1916.
Kamada, H., & Fujimoto, K. (1999). High-speed, high-accuracy binarizationmethod for recognizing text in images of low spatial resolutions. InProceedings of the international conference on document analysis and recognition(pp. 139–142).
Kanungo, T., Haralick, R. M., Baird, H. S., Stuezle, W., & Madigan, D. (2000). Astatistical, nonparametric methodology for document degradation modelvalidation. IEEE Transactions on Pattern Analysis and Machine Intelligence,22(11), 1209–1223.
Kittler, J., & Illingworth, J. (1986). Minimum error thresholding. Pattern Recognition,19, 41–47.
Kohmura, H., & Wakahara, T. (2006). Determining optimal filters for binarization ofdegraded characters in color using genetic algorithms. In Proceedings of the 18thinternational conference on pattern recognition, ICPR 2006 (Vol. 3, pp. 661–664).
Lee, S.-W., & Kim, Y.-J. (1995). Direct extraction of topographic features for grayscale character recognition. IEEE Transactions on Pattern Analysis and MachineIntelligence, 17(7), 724–729.
Li, H., Doermann, D., & Kia, O. (2000). Automatic text detection and tracking indigital video. IEEE Transactions on Image Processing, 9, 147–156.
Li, H., & Doermann, D. (2000). A video text detection system based on automatedtraining. In Proceedings of the IEEE international conference on pattern recognition(pp. 223–226).
Likforman-Sulem, L., & Sigelle, M. (2008). Recognition of degraded characters usingdynamic Bayesian networks. Pattern Recognition, 41, 3092–3103.
Liu, C., Wang, C., & Dai, R. (2006). Low resolution character recognition by imagequality evaluation. In Proceedings of the 18th international conference on patternrecognition (Vol. 1, pp. 864–867).
Makridis, M., Nikolaou, N., & Papamarkos, N. (2010). An adaptive technique forglobal and local skew correction in color documents. Expert Systems withApplications, 37, 6832–6843.
Montazer, G. A., Saremi, H. Q., & Khatibi, V. (2010). A neuro-fuzzy inference enginefor Farsi numeral characters recognition. Expert Systems with Applications, 37,6327–6337.
Otsu, N. (1979). A threshold selection method from gray-level histogram. IEEETransactions on Systems, Man, and Cybernetics, 9, 62–66.
Park, H. S., & Lee, S. (1998). Off-line recognition of large-set handwritten characterswith multiple hidden Markov models. Pattern Recognition, 31, 1849–1864.
Pikaz, A., & Averbuch, A. (1996). Digital image thresholding based on topologicalstable state. Pattern Recognition, 29, 829–843.
Prewitt, J. M. S., & Mendelsohn, M. L. (1965). The analysis of cell images. Annals ofthe New York Academy of Sciences, 128(3), 1035–1053.
Sato, T., Kanade, T., Hughes, E. K., & Smith, M. A. (1998). Video OCR for digital newsarchives. In Proceedings of the IEEE workshop on content based access of image andvideo databases (pp. 52–60).
Schenkel, M., & Jabri, M. (1998). Low resolution degraded document recognitionusing neural networks and hidden Markov models. Pattern Recognition Letters,19, 365–371.
Shapiro, V., Gluhchev, G., & Dimov, D. (2006). Towards a multinational car licenseplate recognition system. Machine Vision and Applications, 17, 173–183.
Smith, M. A., & Kanade, T. (1995). Video skimming for quick browsing based on audioand image characterization. Technical report CMU-CS-95-186, Computer ScienceDepartment, Carnegie Mellon University.
Tsai, R. Y. (1987). A versatile camera calibration technique for high accuracy 3-dmaching vision metrology using off-the-shelf TV cameras and lenses. IEEEJournal of Robotics & Automation, 3, 323–344.
Tsai, C. M., & Lee, H. J. (2002). Binarization of color document images via luminanceand saturation color features. IEEE Transactions on Image Processing, 11(4),434–451.
Taylor, M. J., & Dance, C. R. (1998). Enhancement of document images from cameras.In Proceedings of SPIE, document recognition V (pp. 230–241).
Trier, O. D., & Taxt, T. (1995). Evaluation of binarization methods for documentimages. IEEE Transactions on Pattern Analysis and Machine Intelligence, 17,312–315.
Smith, A. R. (1978). Color gamut transform pairs. Computer Graphics, 12(3), 12–19.Wang, K., & Kangas, J. A. (2003). Character location in scene images from digital
camera. Pattern Recognition, 36, 2287–2299.Wang, L., & Pavlidis, T. (1993). Direct gray-scale extraction of features for character
recognition. IEEE Transactions on Pattern Analysis and Machine Intelligence,15(10), 1053–1066.
<http://www.w3.org/TR/2008/REC-WCAG20-20081211/>.Wu, V., Manmatha, R., & Riseman, E. M. (1997). Finding text in images. In
Proceedings of ACM international conference on digital libraries (pp. 23–26).Yan, F., Zhang, H., & Kube, C. R. (2005). A multistage adaptive thresholding method.
Pattern Recognition Letters, 26, 1183–1191.Yan, H., & Wu, J. (1994). Character and line extraction from color map images using
a multi-layer neural network. Pattern Recognition Letters, 15, 97–103.

A. Fernández-Caballero et al. / Expert Systems with Applications 39 (2012) 4032–4043 4043
Yanni, M. K. & Horne, E. (1994). A new approach to dynamic thresholding. InProceedings of the seventh European signal processing conference, EUSIPCO-94(Vol. 1, pp. 34–44).
Yanowitz, S. D., & Bruckstein, A. M. (1989). A new method for image segmentation.Computer Vision, Graphics, and Image Processing, 46(1), 82–95.
Zheng, Y., Li, H., & Doermann, D. (2004). Machine printed text and handwritingidentification in noisy document images. IEEE Transactions on Pattern Analysisand Machine Intelligence, 26(3), 337–353.


