Embed Size (px)
Citation preview
Dismissed! A Detailed Exploration of How Mobile PhoneUsers Handle Push Notifications
Martin PielotTelefonica ResearchBarcelona, Spain
Amalia VradiUniversity of MacedoniaThessaloniki, Greece
Souneil ParkTelefonica ResearchBarcelona, Spain
ABSTRACTWe analyzed 794,525 notifications from 278 mobile phoneusers and how they were handled. Our study advances prioranalyses in two ways: first, we systematically split notifi-cations into five categories, including a novel separation ofmessages into individual- and group messages. Second, weconduct a comprehensive analysis of the behaviors involved inattending the notifications. Our participants received a mediannumber of 56 notifications per day, which does not indicatethat the number of notifications has increased over the pastyears. We further show that messaging apps create most of thenotifications, and that other types of notifications rarely lead toa conversion (rates between ca. 15 and 25%). A surprisinglylarge fraction of notifications is received while the phone isunlocked or the corresponding app is in foreground, hinting atpossibility to optimize for this scenario. Finally, we show thatthe main difference in handling notifications is how long usersleave them unattended if they will ultimately not consumethem.
ACM Classification KeywordsH.5.m. Information Interfaces and Presentation (e.g. HCI):Miscellaneous
Author KeywordsNotifications; Attendance; Interruptibility; Mobile Devices
INTRODUCTIONIn 2018, mobile phone notifications are no longer just SMSalerts. They announce all kinds of new content and havebecome integral means for apps and services to proactivelyengage with their users. However, notifications alerts aredesigned to grab a user’s attention regardless of the concurrentactivity, which not only has effects on task performance in thework context [1, 4, 7, 15, 17, 20, 28, 30], but also negativeimpact on our well-being [18].
When studying the effect of notifications, and how to mitigatethese, it is important to have an understanding what types
Permission to make digital or hard copies of all or part of this work for personal orclassroom use is granted without fee provided that copies are not made or distributedfor profit or commercial advantage and that copies bear this notice and the full citationon the first page. Copyrights for components of this work owned by others than ACMmust be honored. Abstracting with credit is permitted. To copy otherwise, or republish,to post on servers or to redistribute to lists, requires prior specific permission and/or afee. Request permissions from [email protected].
MobileHCI’18, Sep 03–06, 2018, Barcelona, Spain© 2018 ACM. ISBN 978-1-4503-5898-9/18/09. . . $15.00
DOI: https://doi.org/10.1145/3229434.3229445
of notifications are most common, and how mobile phoneusers typically handle them. A few studies [12, 19, 25, 29]started to shed light on this. For example, in 2013, Pielot etal. [25] found that their 15 participants received an average of63 notifications per day, and largely triaged them within a fewminutes.
However, previous reports suffer from potentially inaccuratemeasuring methods: they either rely on self-reports or they usea measurement API1 that does not distinguish between an ac-tual notification alert or a notification used to display progress(e.g. “download 63% complete”), hence requiring heuristics toclean the data. Further, previous work on actual notificationsdid not explore in detail the stages in which notifications wereattended, such as seeing, triaging, consuming, or dismissingthem.
To fill this gap, we analyze a dataset from 278 mobile phoneusers, who ran a dedicated data-collection application on theirmobile phones for an average of 4 weeks during the summerof 2016. The participants were recruited through a specializedagency to reflect the gender and age distribution of the West-ern European country (Spain) where the study took place2.The application logged notification activity through the No-tificationListenerService API, which was first released withAndroid OS 4.3 on July 24, 2013 and not widely available inprevious studies. This API has two distinct advantages: it al-lows to log when notifications are removed, which gives betterinsights into how notifications are handled, and it allows todistinguish between actual notification alerts and notificationevents that are “mis-used” to continuously display informationin the notification bar. The main contributions are:
• updated statistics on the number of notifications that peo-ple receive per day from 5 different categories (messaging,group messaging, email, social, non-social) – being thefirst ever investigation considering group messages as aseparate entity and using of a novel API for more accuratemeasurement;
• a detailed exploration into how notifications are handled,investigating 4 different types of attendance (seen, checked,consumed, removed); and
• the data and the code, appended to this paper, through whichwe arrived to these insights.
1Android’s AccessibilityService2In Spain, Android OS has a penetration of about 90%
Notifications and Attention MobileHCI'18, September 3-6, Barcelona, Spain
3:1
RELATED WORKIqbal and Bailey [16] define notification as a visual, auditory,or tactile alert designed to attract attention. In everyday lan-guage, the word notification may be used to describe the alertas well as a visual representation that is typically found in apop-up or a notification center. In this paper, we will use theword notification to refer to the actual alert.
What Notifications Do Mobile Phone Users Receive?In a survey from 2014 [12], the majority of respondents con-sidered themselves to typically receive 20-50 or 50-100 no-tifications per day. In an in-situ log study on mobile phonenotifications [25], participants (information workers from sev-eral Western European countries) received a medium numberof 63.5 of notifications per day. Sahami et al. [29] reportthat the 10 most-popular apps generated a mean number of44.9 notifications per user and day. In a study on smartphoneoveruse, Lee et al. [19] reported that their participants (Koreancolleague students) received an average of 400 notifications,mostly from the KakaoTalk messenger. All of these studiestook place in 2013. They reveal that people back then alreadydealt with dozens of notification alerts every day. On mobilephones, the largest chunk of notifications originate from mes-saging applications [19, 25, 29], such as SMS, WhatsApp, orFacebook Messenger.
Attending to Notifications - DefinitionNotifications are designed to attract attention. They there-fore implicitly accept the possibility of interrupting the userduring other activities. Depending on the nature of concur-rent activities, users may have different attitudes towards suchinterruptions, and they may be affected differently by them.
Early work by Horvitz and Apacible [13] quantified interrupt-ibility by the amount of money that people would be willingto pay to avoid a disruption in a given context. Fogarty etal. [11] defined interruptibility (in the context of office work-ers) in terms of social conventions, i.e., whether it would beappropriate for one person to interrupt another.
In the context of mobile phones, Fischer et al. [10] distin-guished between interruptibility as “more interesting from atechnical systems-oriented perspective, e.g. as a trigger to anaction”, and receptivity as also considering the (emotional)experience of the interruption. In their follow-up work [9], Fis-cher et al. further define opportune moments for interruptiondelivery as moments that “minimise the detrimental effectsof interruptions”. Pejovic and Musolesi [24] build an inter-ruptibility model that predicts if a recipient will react to aninterruption by a notification within a given time interval, andthe extent to which the recipient would agree to the statement“Is this a good moment to interrupt?”.
However, in many contexts, it may not be sufficient to onlyconsider whether the user reacts to a notification, but also how.For example, notifications from messaging applications, suchas “okay! see you at 6pm”, do not necessarily require a reactionin form of launching the messaging app and writing a response.Pielot et al. [26, 25] therefore introduced the step of attendinga notification, which is defined as an action that allows totriage a notification and to decide on the appropriate reaction.
Once a notification has been triaged, “potential social pressure,e.g., the need to respond fast, begins to manifest. Further, ifthe message is unimportant or not urgent, the message can bediscarded here” [26].
Clark [6] (according to [21]) suggested that a user can respondto an interruption in four possible ways: 1. handle it immedi-ately; 2. acknowledge it and agree to handle it later; 3. declineit (explicitly refusing to handle it); or 4. withdraw it (implicitlyrefusing to handle it). Mehrotra et al. [22] divide responsesto notifications into two different stages: seen time and deci-sion time. Seen time refers to the time until the user unlocksthe screen after having received a notification. Decision timerefers to the time until the notification is either clicked ordismissed. Turner et al. [31] identified four stages of respon-siveness in the context of a study where a task-reminder appfrequently created notifications to ask user to check off a to-dolist item: (1) Unreachable: the user did not react to the arrivalof the notification, either because they were not interruptedor did not want to triage any notification; (2) Reachable: theuser interacted with the device (e.g. turned the screen on)to – presumably – triage the notification, but may not haveproceeded further; (3) Engage-able: the user was reachableand proceeded to access the notification list (which may re-quire them to unlock the device), but may dismiss it or notproceed further; and (4) Receptive: the user was engage-ableand proceeded to tap on and consume the notification, openingthe application.
Attending to Notifications - Previous FindingsSahami et al. [29] report from their large-scale study thatif a user clicked on a notification in the notification center,this happened within a median time interval of 30 seconds.Unfortunately, the work does not disclose information aboutnotifications that were dismissed. Mehrotra et al. [21] reportthat their 20 participants clicked on 60% of the notificationswithin 10 minutes. However, Mehrotra et al. did not explorethe time-until-click by notification category.
Previous work further shows that how fast people handle noti-fications depends on the type of the notification. Pielot et al.[25] report that message notifications were attended signifi-cantly faster than email notifications. On average, notificationsfrom messengers are attended within minutes [2, 8, 12, 26,29], and people maintain this levels of attentiveness for largeparts of their wake time [8]. The reason that notificationsfrom messengers are attended quicker can be explained by theinsight that, “people are assumed to be constantly co-present,and thus, constantly available for conversation” [3].
GOALS OF THIS RESEARCHThe goal of this research is to fill a number of gaps in existingresearch. First, while plenty of research investigates notifica-tions and interruptibility, only a handful of works exploredwhich notifications mobile phone users actually receive on adaily bases.
Second, we presume that an increasing number of companieshave started the use of push notifications to engage their user
Notifications and Attention MobileHCI'18, September 3-6, Barcelona, Spain
3:2
base3. The preface of a recent symposium of Ambient Notifi-cation Environments suggests that “Direct notifications are onthe exponential rise” [5]. Thus, one open question is to whatextent the volume of notifications that people deal with on adaily basis has increased and shifted.
Third, while previous work has shown that most notificationsoriginate from messaging apps, no publication has yet ex-plored the difference between individual- and group messages,and how they are handled.
Forth, previous work usually only explored one type of notifi-cation attendance – usually clicking them. What is missing isa more detailed exploration into how notifications are handledin detail and across platforms.
Fifth, previous work had to rely on biased means to collectthat information: self reports or Android’s AccessibilityService.While the AccessibilityService allows to intercept a NOTIFI-CATION_CHANGED event, the meaning of this event canbe ambiguous. For example, when Google Play updated anapp, the AccessibilityService would report one NOTIFICA-TION_CHANGED events for each percent in the downloadprocess (1%, 2%, 3%, ...). Thus, this method has to rely heav-ily on manual filtering, with the risk of considering events asnotifications that are not perceptible alerts.
This also allows to address the challenge of apps and servicessending notifications across platforms. For example, a newemail may trigger a mobile phone notification, but may behandled on a different device. In some cases, such as Gmail,handling the notification on another device triggers the notifi-cation to be removed from the mobile phone. The events canonly be reliably recognized by using the NotificationListen-erService, which was only introduced in Android 4.3, and thatwas not available in all previous studies. Without consideringsuch removed events, an analysis might consider a notificationas unattended whereas in reality it was attended on a differentdevice.
METHODOLOGYThe dataset was collected in a study which took place in sum-mer 2016. Participants were recruited via a specialized agency.We requested a sample that matches the gender and age dis-tribution of smartphone users in Spain. The only restrictionwas that people were required to own an Android phone. An-droid phones account for the large majority (∼ 90%) of thesmartphones in Spain.
Data CollectionParticipants were required to install a dedicated study appli-cation onto their mobile phones. This app was used to collectthe data that we analyze in this study. For this analysis, we fo-cus on notification-posted and -removed events, screen events(off, on, unlocks), app launches, and access of the notificationdrawer.
3https://techcrunch.com/2015/04/21/notifications-are-the-next-platform/
To capture these events, we asked the participants to grant twospecial permissions: access to accessibility events and notifica-tion events. Events from Android’s AccessibilityService allowto track app launches and access of the notification drawer .Access to Android’s NotificationListenerService allows to sub-scribe to notification-posted and notification-removed events.Screen events (off, on, unlock) where tracked by subscribingto system-wide broadcasts.
To get access to these accessibility- and notification events,users have to visit a dedicated view in the settings and manu-ally grant access for the requesting application. Since accessi-bility and notification events can contain potentially sensitiveinformation, the informed consent contained a section specifi-cally dedicated to those events. During the setup process, theapplication itself explained the participants how to grant thesetwo special permissions and automatically sent them to thecorrect settings view.
ProcedureThe study took place from April to July 2016 in Spain. Peo-ple with interest in joining the study were first directed tothe informed consent, which had been approved by the le-gal department of our institution. The consent form listedall data to be collected in the study and gave details aboutpotential personally-identifiable information. The participantsthen were taken to an installation guide that explained howto install the mobile application. We ran informal usabilitytests to ensure that the installation process was fast and easy tounderstand. The data collection commenced once the app wasinstalled, set-up properly, and once the participants confirmedtheir agreement with the informed consent from within theapp. To protect the identify of the participants, all data wasstored in a pseudonymized way.
ParticipantsParticipants were recruited via a specialized recruitmentagency, that we tasked to provide a representative samplein terms of demographics of (Android) smart phone users inSpain. Over 500 people joined the study. For this research, weconsider data from 278 participants who contributed data forat least 10 days and who had a phone with a minimum Androidversion of 4.3 (Jelly Bean), which is necessary, because theNotificationListener API was introduced with this update. Thecompensation was 10 EUR.
The ages of the 278 participant ranged from 18 to 66 years (M= 37.71, SD = 11.07). 146 (52.52%) participants were female,132 (47.48%) were male. The mean number of participationdays was 26.59 (Mdn = 26.5, SD = 9.57).
DATA PROCESSING
Filtering Notification-Posted Event BurstsTo ensure that we only analyze notifications events that areperceived as notification alerts by the users, we had to filter thedata set. The reason is that notification-posted events reportedby Android’s NotificationListenerService do not necessarilyequate to a perceptible notification alert according to the def-inition of Iqbal and Bailey [17]. Sometimes, the operatingsystem creates several notification-posted events in order to
Notifications and Attention MobileHCI'18, September 3-6, Barcelona, Spain
3:3
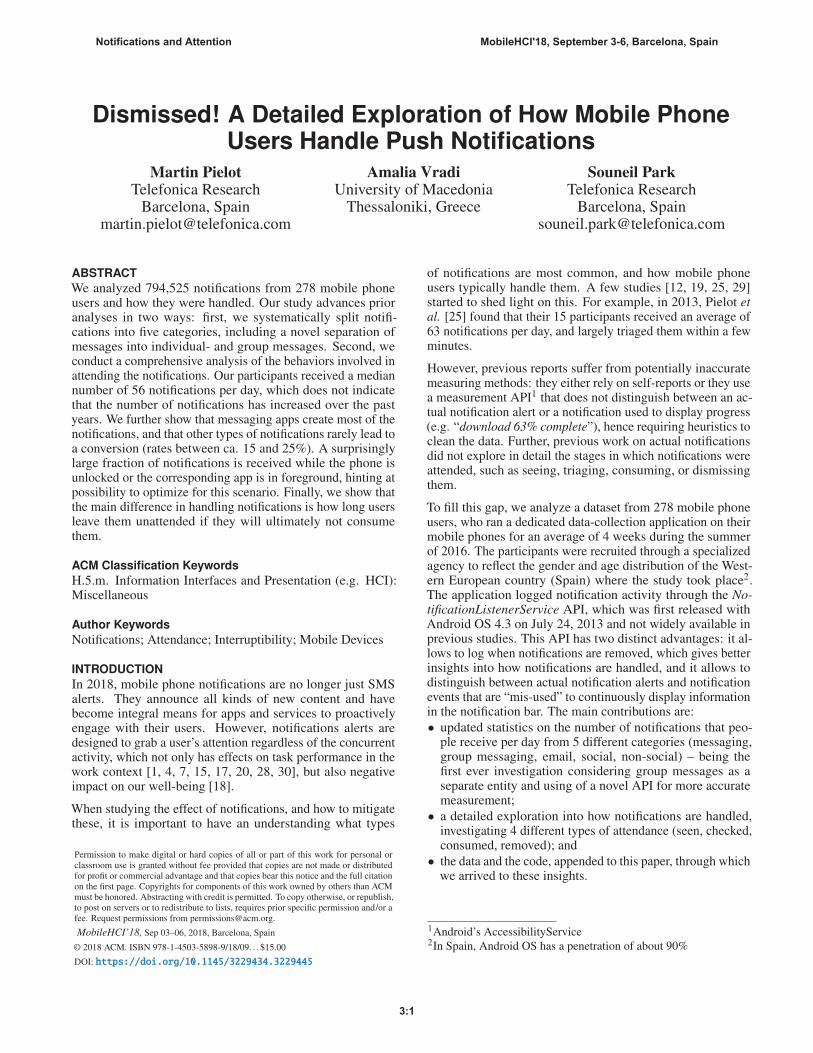
construct a compound notification, while at the same time,the user only perceives one alert. For example, if there is anunhandled WhatsApp message, and another message fromthe same contact arrives, the OS will internally generate oneposted event for the new message and a second posted eventthat groups those two unread messages into a box with the title“two unread messages”.
Notification Bubble
Notification Alert
Notification-PostedEvent
Notification Bubble
Figure 1: Notifications on iOS.
Group messages can even lead to a whole series of eventsfor what the user perceives as a single notification alert. Forexample, if – as illustrated in Figure 1 – Person C just senta WhatsApp message to Group Y, there is already one un-read message from Person A in Group X, and another unreadmessages from Person B in Group Y, the operating systemmay generate 4 notification-posted events: one to create a new“box” to encompass unread messages from both groups (usu-ally entitled “WhatsApp”), two more events to re-visualize theold notifications from Persons A and B, and a final notification-posted event to add the new notification from Person C. Wewill refer to this series of notification-posted events as bursts.
To filter out these bursts, we apply the following cleaning steps:First, we remove all notifications with the title “two unreadmessages”, including all respective translations that we foundin our data set. Second, we mark notification-posted eventsthat occur within the same second as bursts. We empiricallydetermined that the last posted event usually contains thenotification alert that the user perceived. Thus, we removedall but the last posted events from each burst.
The resulting dataset contains 794,525 notifications.
Notification CategoriesSome previous works investigated interruptibility without con-sidering the type of the notification. However, Pielot et al.[25] found that people react quite differently to different typesof notifications. Thus, we split notifications into several cate-gories, which we explain in the following (Table 1 lists the 5most-frequent apps for each of the categories):
• Messaging denotes the category of notification from mes-sengers, i.e., communication app that allow to send (short)messages to contacts. WhatsApp is the most common mes-senger in our data set. The rationale of this category is that
(1) messages are the most frequent notifications [29, 25],(2) they are usually targeted directly at the receiver and thususually highly relevant, and (3) that one-to-one messagingis associated with the highest pressure to respond in a timelyfashion.
• Group Messaging denotes notifications from a messengerwhich was sent to a group of users. An example is a What-sApp message received to a group. The rationale is that theuser is no longer the prime recipient of the message. Thus,we hypothesize that the social dynamics of group messagingare different than those of individual messaging.
• Email denotes the category of notifications from email apps.The most prominent source of email notifications is An-droid’s built-in email client. While emails, too, are textsent to one or several recipients, the cultural norms aroundemails differ dramatically from messaging. Emails are notalways relevant for the recipient, and email senders rarelyexpect responses within minutes, as compared to messag-ing.
• Social denotes the category of notifications from socialnetworks. The most prominent source of social notificationsare Twitter, Instagram, and Facebook. The reason to createthe category is to cluster notifications that are created byhuman activity, such as Likes or Retweets, but do not requirea reaction by the user.
• Non-Social denotes the category of notifications from appsthat do not facilitate the interaction between people, suchas Dropbox or security apps.
The rationale for creating our own set of categories insteadof using Google Play’s categories was that the majority ofthe notifications in our dataset would be grouped into thecommunication category, which we consider too broad for ourstudy.
Assignment to CategoriesWe received notifications from 796 different applications. Toassign each app to one of the categories described above, weapplied the following steps:
(1) create a set of all apps observed in the data set (uniquelyidentified by the application package); (2) for each app, tryto obtain the category assigned by Google’s Play Store;4 (3)count the number of occurrences of each app – uniquely iden-tified by the Java package name; and (4) from most to leastfrequently-observed app: assign a mapping from the PlayStore category to our own category taxonomy (e.g. Entertain-ment –> NonSocial) and if that is not feasible, manually assigna category to the unique identifier (e.g. com.facebook.orca –>Messenger, com.facebook.katana –> Social).
We repeated these steps until 99.7% of the apps had a categoryassigned. The remaining apps were removed from the analysis.
4Not all apps on a phone are available on Google Play. For thoseapps, it is not possible to retrieve a category from Google Play
(a) Messaging
App Package Name # % (All) % (Msg)com.whatsapp 312239 39.3 89.5com.facebook.orca 9710 1.2 2.8org.telegram.messenger 8697 1 2.5com.android.mms 5266 0.6 1com.google.android.talk 3165 0.3 0.3
(b) Email
App Package Name # % (All) % (Eml)com.google.android.gm 40209 5 43.1com.android.email 26433 3.3 28.3com.microsoft.office.outlook 8544 1 9.2com.samsung.android.email.provider 3720 0.4 4com.yahoo.mobile.client.android.mail 3501 0.4 3.7
(c) Social
App Package Name # % (All) % (Scl)com.twitter.android 20014 2.5 39.8com.facebook.katana 16858 2 33.6com.instagram.android 8646 1 17.2com.facebook.lite 1755 0.2 3.5com.pinterest 776 0.1 1.5
(d) Non-Social
App Package Name # % (All) % (NScl)com.cleanmaster.mguard 2803 0.4 4.9com.dropbox.android 2592 0.3 4.5com.cleanmaster.security 2266 0.3 4com.google.android.youtube 1569 0.2 2.7com.antivirus 1548 0.2 2.7
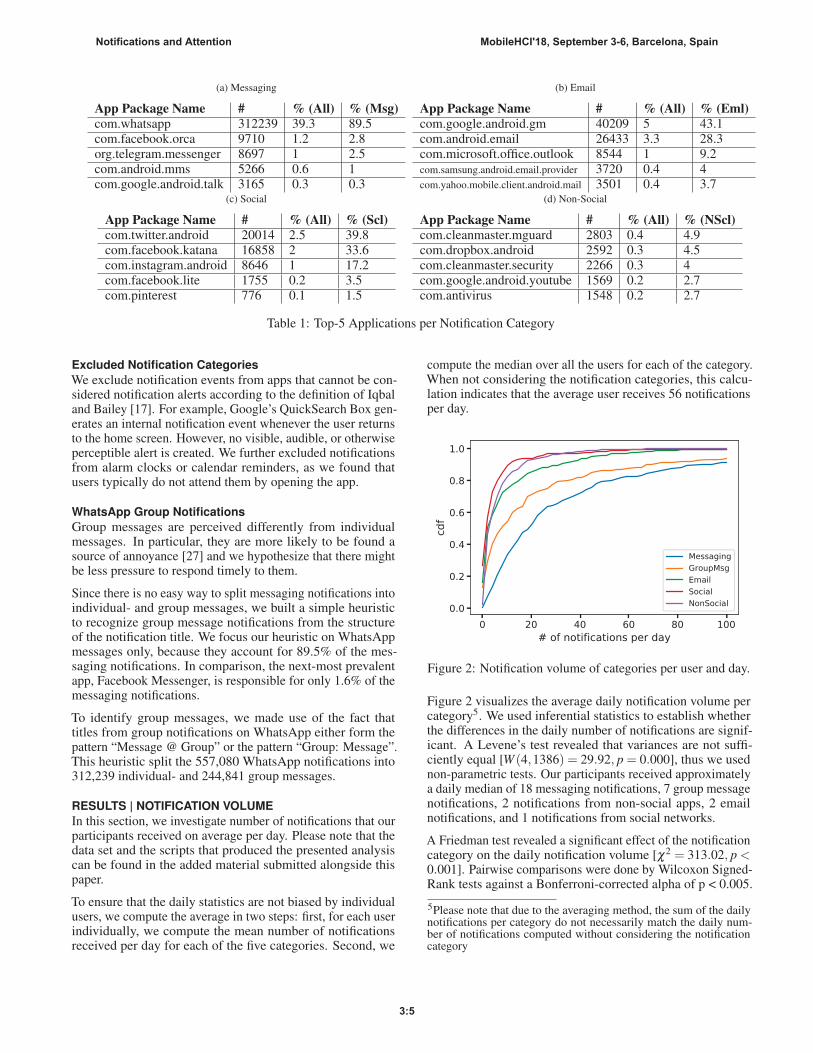
Table 1: Top-5 Applications per Notification Category
Excluded Notification CategoriesWe exclude notification events from apps that cannot be con-sidered notification alerts according to the definition of Iqbaland Bailey [17]. For example, Google’s QuickSearch Box gen-erates an internal notification event whenever the user returnsto the home screen. However, no visible, audible, or otherwiseperceptible alert is created. We further excluded notificationsfrom alarm clocks or calendar reminders, as we found thatusers typically do not attend them by opening the app.
WhatsApp Group NotificationsGroup messages are perceived differently from individualmessages. In particular, they are more likely to be found asource of annoyance [27] and we hypothesize that there mightbe less pressure to respond timely to them.
Since there is no easy way to split messaging notifications intoindividual- and group messages, we built a simple heuristicto recognize group message notifications from the structureof the notification title. We focus our heuristic on WhatsAppmessages only, because they account for 89.5% of the mes-saging notifications. In comparison, the next-most prevalentapp, Facebook Messenger, is responsible for only 1.6% of themessaging notifications.
To identify group messages, we made use of the fact thattitles from group notifications on WhatsApp either form thepattern “Message @ Group” or the pattern “Group: Message”.This heuristic split the 557,080 WhatsApp notifications into312,239 individual- and 244,841 group messages.
RESULTS | NOTIFICATION VOLUMEIn this section, we investigate number of notifications that ourparticipants received on average per day. Please note that thedata set and the scripts that produced the presented analysiscan be found in the added material submitted alongside thispaper.
To ensure that the daily statistics are not biased by individualusers, we compute the average in two steps: first, for each userindividually, we compute the mean number of notificationsreceived per day for each of the five categories. Second, we
compute the median over all the users for each of the category.When not considering the notification categories, this calcu-lation indicates that the average user receives 56 notificationsper day.
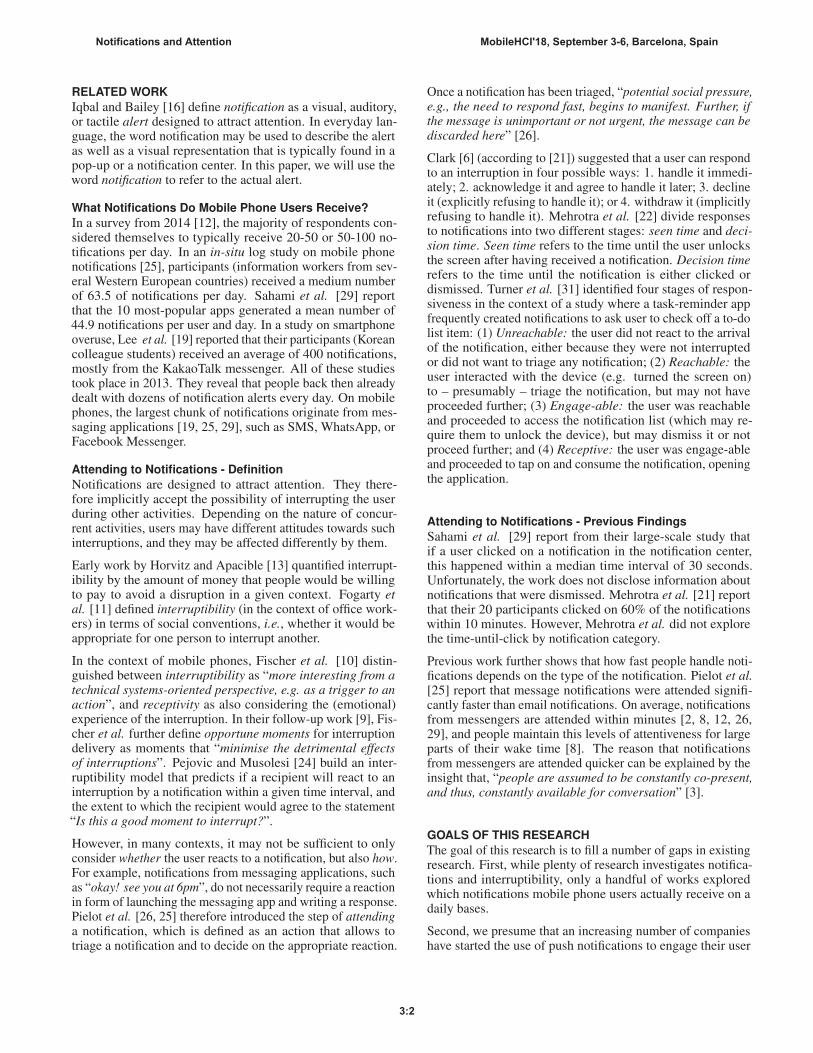
Figure 2: Notification volume of categories per user and day.
Figure 2 visualizes the average daily notification volume percategory5. We used inferential statistics to establish whetherthe differences in the daily number of notifications are signif-icant. A Levene’s test revealed that variances are not suffi-ciently equal [W (4,1386) = 29.92, p = 0.000], thus we usednon-parametric tests. Our participants received approximatelya daily median of 18 messaging notifications, 7 group messagenotifications, 2 notifications from non-social apps, 2 emailnotifications, and 1 notifications from social networks.
A Friedman test revealed a significant effect of the notificationcategory on the daily notification volume [χ2 = 313.02, p <0.001]. Pairwise comparisons were done by Wilcoxon Signed-Rank tests against a Bonferroni-corrected alpha of p < 0.005.
5Please note that due to the averaging method, the sum of the dailynotifications per category do not necessarily match the daily num-ber of notifications computed without considering the notificationcategory
Notifications and Attention MobileHCI'18, September 3-6, Barcelona, Spain
3:5
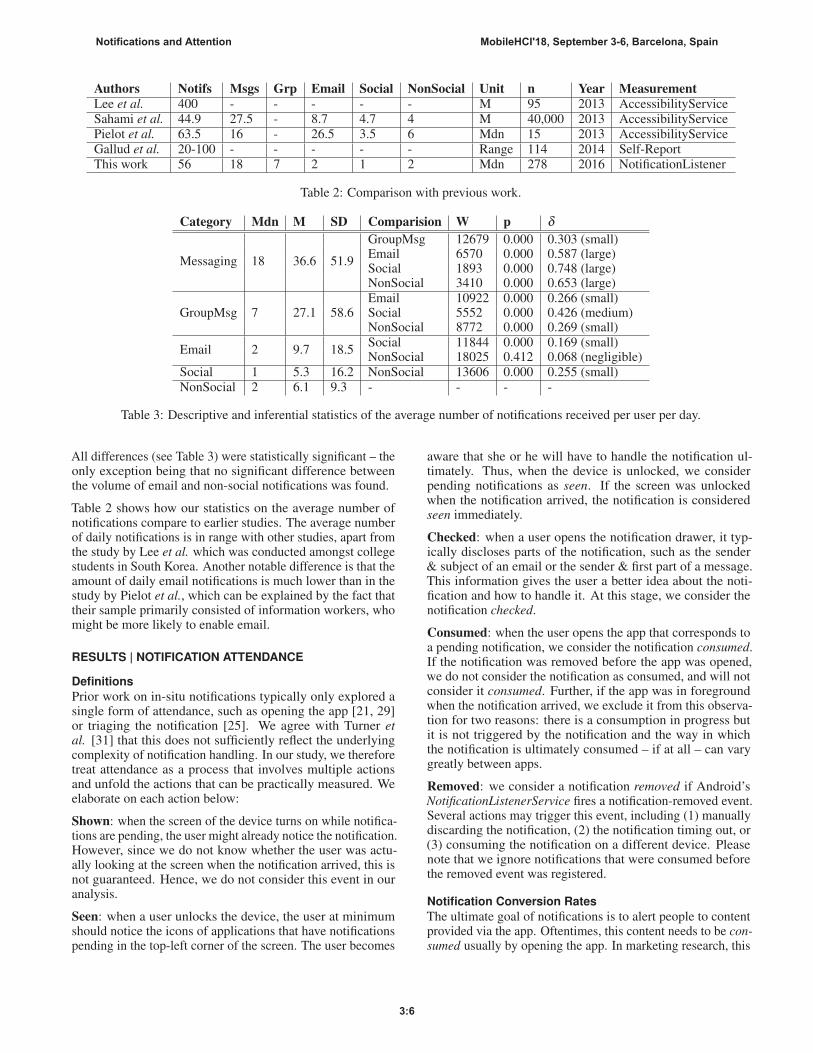
Authors Notifs Msgs Grp Email Social NonSocial Unit n Year MeasurementLee et al. 400 - - - - - M 95 2013 AccessibilityServiceSahami et al. 44.9 27.5 - 8.7 4.7 4 M 40,000 2013 AccessibilityServicePielot et al. 63.5 16 - 26.5 3.5 6 Mdn 15 2013 AccessibilityServiceGallud et al. 20-100 - - - - - Range 114 2014 Self-ReportThis work 56 18 7 2 1 2 Mdn 278 2016 NotificationListener
Table 2: Comparison with previous work.
Category Mdn M SD Comparision W p δ
Messaging 18 36.6 51.9
GroupMsg 12679 0.000 0.303 (small)Email 6570 0.000 0.587 (large)Social 1893 0.000 0.748 (large)NonSocial 3410 0.000 0.653 (large)
GroupMsg 7 27.1 58.6Email 10922 0.000 0.266 (small)Social 5552 0.000 0.426 (medium)NonSocial 8772 0.000 0.269 (small)
Email 2 9.7 18.5Social 11844 0.000 0.169 (small)NonSocial 18025 0.412 0.068 (negligible)
Social 1 5.3 16.2 NonSocial 13606 0.000 0.255 (small)NonSocial 2 6.1 9.3 - - - -
Table 3: Descriptive and inferential statistics of the average number of notifications received per user per day.
All differences (see Table 3) were statistically significant – theonly exception being that no significant difference betweenthe volume of email and non-social notifications was found.
Table 2 shows how our statistics on the average number ofnotifications compare to earlier studies. The average numberof daily notifications is in range with other studies, apart fromthe study by Lee et al. which was conducted amongst collegestudents in South Korea. Another notable difference is that theamount of daily email notifications is much lower than in thestudy by Pielot et al., which can be explained by the fact thattheir sample primarily consisted of information workers, whomight be more likely to enable email.
RESULTS | NOTIFICATION ATTENDANCE
DefinitionsPrior work on in-situ notifications typically only explored asingle form of attendance, such as opening the app [21, 29]or triaging the notification [25]. We agree with Turner etal. [31] that this does not sufficiently reflect the underlyingcomplexity of notification handling. In our study, we thereforetreat attendance as a process that involves multiple actionsand unfold the actions that can be practically measured. Weelaborate on each action below:
Shown: when the screen of the device turns on while notifica-tions are pending, the user might already notice the notification.However, since we do not know whether the user was actu-ally looking at the screen when the notification arrived, this isnot guaranteed. Hence, we do not consider this event in ouranalysis.
Seen: when a user unlocks the device, the user at minimumshould notice the icons of applications that have notificationspending in the top-left corner of the screen. The user becomes
aware that she or he will have to handle the notification ul-timately. Thus, when the device is unlocked, we considerpending notifications as seen. If the screen was unlockedwhen the notification arrived, the notification is consideredseen immediately.
Checked: when a user opens the notification drawer, it typ-ically discloses parts of the notification, such as the sender& subject of an email or the sender & first part of a message.This information gives the user a better idea about the noti-fication and how to handle it. At this stage, we consider thenotification checked.
Consumed: when the user opens the app that corresponds toa pending notification, we consider the notification consumed.If the notification was removed before the app was opened,we do not consider the notification as consumed, and will notconsider it consumed. Further, if the app was in foregroundwhen the notification arrived, we exclude it from this observa-tion for two reasons: there is a consumption in progress butit is not triggered by the notification and the way in whichthe notification is ultimately consumed – if at all – can varygreatly between apps.
Removed: we consider a notification removed if Android’sNotificationListenerService fires a notification-removed event.Several actions may trigger this event, including (1) manuallydiscarding the notification, (2) the notification timing out, or(3) consuming the notification on a different device. Pleasenote that we ignore notifications that were consumed beforethe removed event was registered.
Notification Conversion RatesThe ultimate goal of notifications is to alert people to contentprovided via the app. Oftentimes, this content needs to be con-sumed usually by opening the app. In marketing research, this
Notifications and Attention MobileHCI'18, September 3-6, Barcelona, Spain
3:6

is often referred to as conversion. It is important to understandthe conversion rate, i.e., which fraction of notifications lead toa conversion, as it tells something about the relevance of thenotification and whether it should have been sent in the firstplace. Please note that we consider a notification consumed ifthe app is opened before the notification is removed.
Table 4 shows the conversion rates per notification category.About two-third of the messaging-related notifications leadto conversions, whereas the conversion rates for the othercategories are notably lower. In particular, only a bit morethan 15% of Email and NonSocial notifications led to openingthe app. This is an important indication for the importance andrelevance of message notifications compared to notificationsfrom other types of apps.
Category Conversion RateMessaging 63.67%Group Messaging 65.81%Email 15.47%Social 26.55%NonSocial 16.19%
Table 4: Conversion Rates per Notification Category.
Immediate AttendanceTable 5 shows of notifications that were immediately seen,checked, or consumed according to our definition. For exam-ple, notification are considered immediately seen if the screenis unlocked. 20 to 35% of the notifications were receivedwhile the phone was already unlocked (‘seen’). Only veryfew notifications (0.1% to 0.3%) arrived while the notificationdrawer was in foreground. We presume that the notificationdrawer is hardly opened so the likelihood of a notificationarriving while it is open is very low. Finally, between 4.2%and 23% of the notifications arrived while the correspondingapp was in foreground. The number is particularly high forindividual- and group message, which intuitively makes senseas this might happen during chats.
Category Seen Checked ConsumedMessaging 32.7% 0.3% 23%GroupMsg 26.9% 0.2% 21%Email 20.7% 0.10% 4.2%Social 32.6% 0.1% 10.5%NonSocial 35.6% 0.3% 8.5%
Table 5: % of immediately-attended notifications
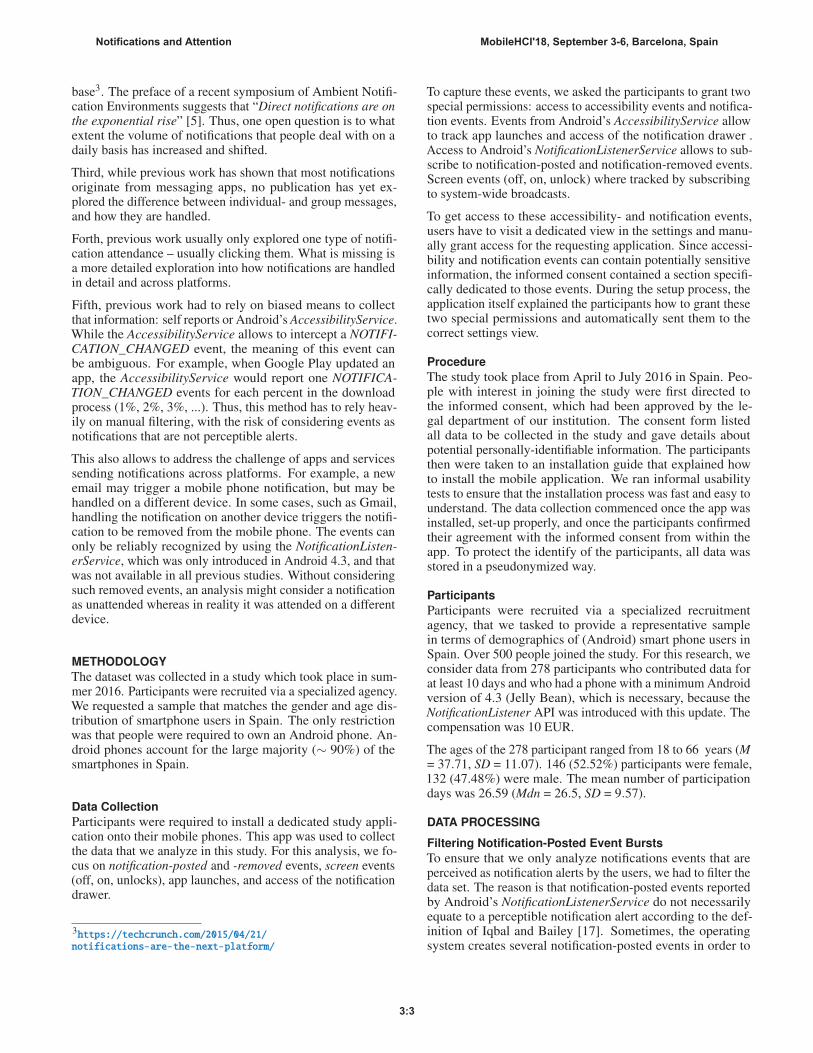
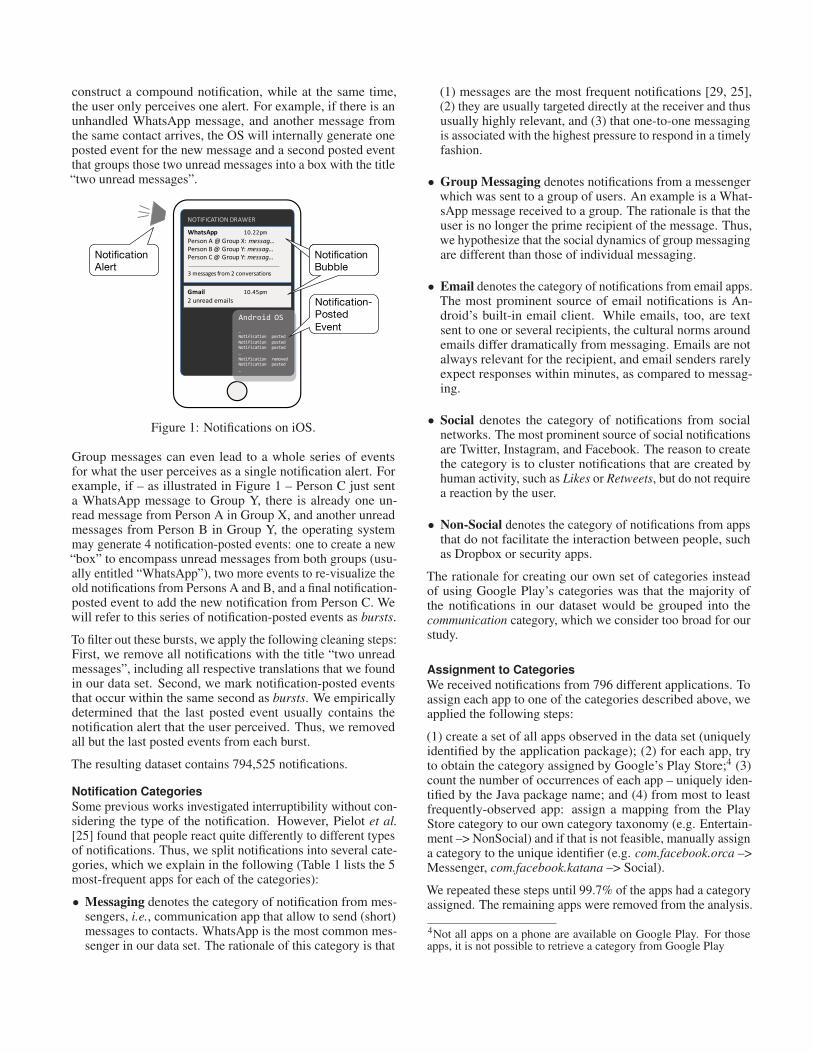
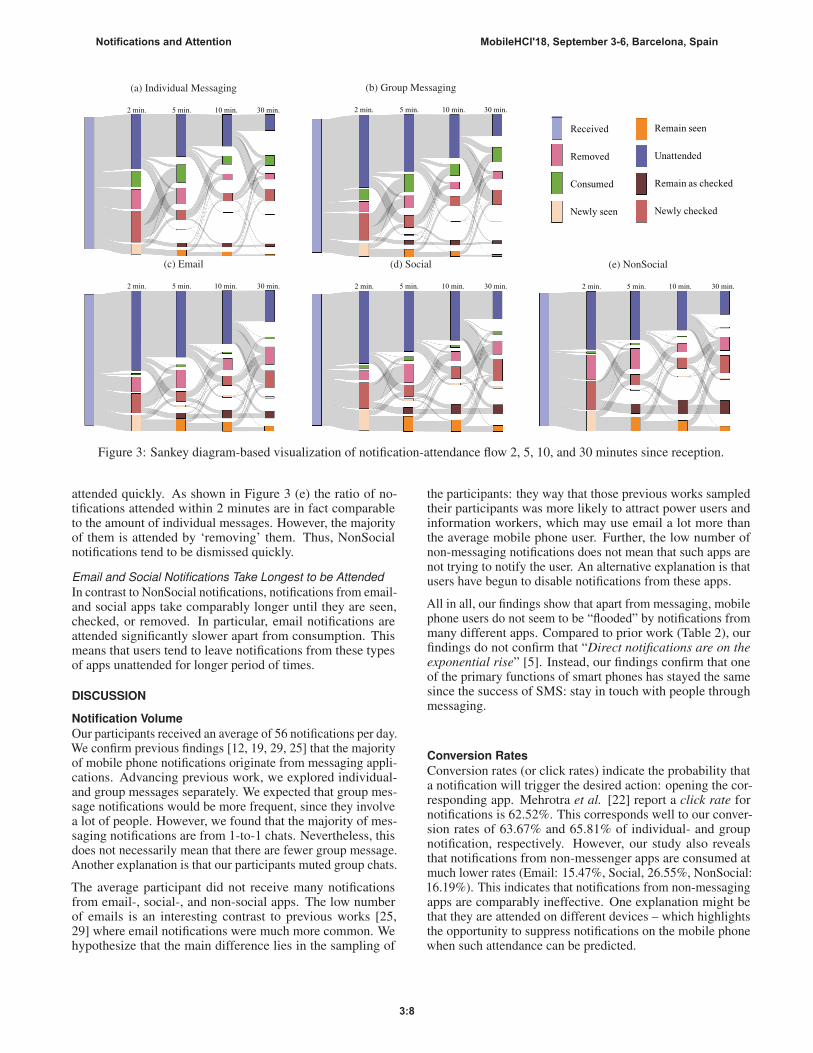
Notification Attendance FlowFigure 3 visualizes the attendance to the notifications of dif-ferent categories through Sankey diagrams. Please note thatwe only consider notifications that were not immediately seen,checked, or consumed. The rationale is that we are interestedin how notifications grab the user’s attention while the user isfocused on other things.
We chose Sankey diagrams in order to provide a holistic viewof the attendance processes. Attendances can be viewed as
the transition of the notifications’ state between above’s defini-tions. Sankey diagrams intuitively represent the different typesof state transitions and their prevalence. The Sankey diagramsof Figure 3 aggregates notification states at four points in time:2, 5, 10, 30 minutes since the arrival. Since previous work[25, 29] agrees that notification attendance follows a long-taildistribution, we put higher resolution on the early stage of thenotifications. The complete measurements we made through-out the full lifespan of the notifications can be found from thesubmitted data set.
Alongside the flow analysis, we investigate whether the over-all attendance times differ significantly. Since the attendancetime scores follow a heavy-tail distribution, we used non-parametric statistics to check for significant differences: weused a Kruskal-Wallis followed by Bonferoni-corrected, pair-wise Mann-Whitney U Tests. The full results of the analysisare part of the appendix. In this paper, we only talk about dif-ferences that are significant and have a non-negligible effectsize (quantified by Cliff’s Delta).
Messages are Attended FastestThe attendance-flow analysis (Fig. 3) shows that a largerportion of the individual messages are attended, i.e., either‘Consumed’, ‘Removed’, ‘Checked’, or ‘Seen’, more quicklythan the notifications of other categories: in Figure 3 (a), theflows to the state ‘Unattended’ are much thinner than the sameflows in other diagrams. The statistical analysis confirms thatmessages are always amongst the fastest group to be attended.
Group Message are Attended Slower than Individual Mes-
sagesA related observation is the difference of group messagesfrom individual messages: group messages tend to remainunattended in contrast to individual messages although theycome from the same application. The statistical analysis con-firms that group messages are seen, checked, and consumedsignificantly later than individual messages.
Messages Have Highest Consumption RateThe flow diagrams confirm that messages, regardless of in-dividual or group, are more frequently attended by openingthe application (they are ‘consumed’) than the other threecategories of notifications. The thin flows of the other threecategories leading to the state ‘consumed’ in the diagramsreveal that the notifications rarely attract the users to open theapp shortly after it was posted.
Few Differences in Time Until Checked or ConsumedSurprisingly, we did not find significant differences betweenhow fast notifications are checked or consumed (if they are con-sumed). The only exceptions are that (1) emails were checkedless quickly than notifications from all other categories, and(2) group messages were checked slower than message- andnon-social notifications.
NonSocial Notifications are Quickly DismissedWhile Email, Social, and NonSocial notifications are similarin terms of consumption rates, NonSocial notifications standout from the other two categories in terms of attendance times.Interestingly, a greater portion of NonSocial notifications are
Notifications and Attention MobileHCI'18, September 3-6, Barcelona, Spain
3:7
(a) Individual Messaging
5 min.2 min. 10 min. 30 min.
(b) Group Messaging
5 min.2 min. 10 min. 30 min.
Received
Removed
Consumed
Newly seen
Remain seen
Unattended
Remain as checked
Newly checked
(c) Email
5 min.2 min. 10 min. 30 min.
(d) Social
5 min.2 min. 10 min. 30 min.
(e) NonSocial
5 min.2 min. 10 min. 30 min.
Figure 3: Sankey diagram-based visualization of notification-attendance flow 2, 5, 10, and 30 minutes since reception.
attended quickly. As shown in Figure 3 (e) the ratio of no-tifications attended within 2 minutes are in fact comparableto the amount of individual messages. However, the majorityof them is attended by ‘removing’ them. Thus, NonSocialnotifications tend to be dismissed quickly.
Email and Social Notifications Take Longest to be AttendedIn contrast to NonSocial notifications, notifications from email-and social apps take comparably longer until they are seen,checked, or removed. In particular, email notifications areattended significantly slower apart from consumption. Thismeans that users tend to leave notifications from these typesof apps unattended for longer period of times.
DISCUSSION
Notification VolumeOur participants received an average of 56 notifications per day.We confirm previous findings [12, 19, 29, 25] that the majorityof mobile phone notifications originate from messaging appli-cations. Advancing previous work, we explored individual-and group messages separately. We expected that group mes-sage notifications would be more frequent, since they involvea lot of people. However, we found that the majority of mes-saging notifications are from 1-to-1 chats. Nevertheless, thisdoes not necessarily mean that there are fewer group message.Another explanation is that our participants muted group chats.
The average participant did not receive many notificationsfrom email-, social-, and non-social apps. The low numberof emails is an interesting contrast to previous works [25,29] where email notifications were much more common. Wehypothesize that the main difference lies in the sampling of
the participants: they way that those previous works sampledtheir participants was more likely to attract power users andinformation workers, which may use email a lot more thanthe average mobile phone user. Further, the low number ofnon-messaging notifications does not mean that such apps arenot trying to notify the user. An alternative explanation is thatusers have begun to disable notifications from these apps.
All in all, our findings show that apart from messaging, mobilephone users do not seem to be “flooded” by notifications frommany different apps. Compared to prior work (Table 2), ourfindings do not confirm that “Direct notifications are on theexponential rise” [5]. Instead, our findings confirm that oneof the primary functions of smart phones has stayed the samesince the success of SMS: stay in touch with people throughmessaging.
Conversion RatesConversion rates (or click rates) indicate the probability thata notification will trigger the desired action: opening the cor-responding app. Mehrotra et al. [22] report a click rate fornotifications is 62.52%. This corresponds well to our conver-sion rates of 63.67% and 65.81% of individual- and groupnotification, respectively. However, our study also revealsthat notifications from non-messenger apps are consumed atmuch lower rates (Email: 15.47%, Social, 26.55%, NonSocial:16.19%). This indicates that notifications from non-messagingapps are comparably ineffective. One explanation might bethat they are attended on different devices – which highlightsthe opportunity to suppress notifications on the mobile phonewhen such attendance can be predicted.
Notifications and Attention MobileHCI'18, September 3-6, Barcelona, Spain
3:8

Further, it might be considered surprising that even the conver-sion rates of messaging notifications are clearly below 100%,as the majority of messages should receive a response. Wehypothesize two explanations: some messages do not requirea response (e.g. “ok!”) and can therefore be dismissed with-out issues. Further, we might be seeing that responses aremade not from within the app, but for example, interactivenotifications or web interfaces.
Immediate AttendanceWhile notifications are designed to draw attention to contentoutside of the user’s focus, it still happens that notificationsare fired while the user is already using the phone or the corre-sponding app. We found that 21-23% of the message notifi-cations are received while the phone is already in foreground.These numbers make sense as messaging sometimes happensas chat. That is, users do not turn off the phone between turnsby wait with the chat window opened.
We further found that between 20 and 35% of the notificationsarrive while the phone is unlocked. These numbers show thepotential of mitigating disruptions by improving the timingwhen the phone is already in use. For example, the phonecould wait with posting the notification until the user is de-tected to be at a breakpoint between two tasks (e.g. closingthe current app) [14, 23].
Notification AttendancePrevious work that explored how notifications of differentcategory were handled found that message notifications aretriaged [25] and clicked [29] fastest. Our results confirm thatnotification from messaging apps are on average amongstthose to be seen, checked, consumed, and removed fastest.However, thanks to the fact that we explored different types ofattendance separately, we found message notifications do notstand out in all types of attendance.
Regarding the time until a notification is checked, we did notfind significant difference between the categories. Only emailnotifications were checked significantly later than the othernotifications.
Similarly, if our participants decided to consume the notifica-tion, there were no significant differences in the time until theconsumption. Only two small effects in the pair-wise com-parison hint that group messages might be consumed slowerthan the other types of notifications. This indicates that if thedecision was made to consume a notification, the type of thenotification is not the deciding factor to determine the timeuntil it is consumed. We hypothesize that instead, externalfactors are what predict when a notification can finally beconsumed.
The main differences between how notifications from differentcategories are handled are the time until they are seen andremoved. Notifications from messengers and non-social appswere seen fastest, notifications from email apps slowest. Thedifference in the seen time shows that our participants eitherdid not have audible email notifications, or the alert did notprompt them to check the phone.
Similarly, we find significant differences in the time until noti-fications were removed if our participants decided to removethem. Notifications from non-messaging apps were removedsignificantly later than those of messaging apps. This indicatesthat participants take more time to arrive to the decision todismiss a non-messaging notification. We hypothesize thatthere are two factors: there is less social pressure to respondimmediately, and dismissing a notification is the harder choiceto make, because it ultimately means to accept the possibilityof missing out on something.
CONCLUSIONSWe analyzed 794,525 notifications from 278 mobile phoneusers and how these notifications were handled. We did notfind that the daily volume of notification has risen comparedto past studies. Individual and group message notificationsremain the most important notifications. Other types of notifi-cations were largely ineffective, get removed quickly, or areleft pending for a long time.
Research on mitigating the disruptiveness of notificationsshould therefore focus on notifications from messaging ap-plications. Further, while notifications are designed to grabattention while the user is busy with other things, we found thata significant portion of notifications arrives while the phone isalready unlocked, indicating that it makes sense to specificallytarget this scenario, e.g., by delaying them to breakpoints inthe interaction. Finally, as non-messaging notification werelargely ineffective, we need to investigate how to make themmore useful and relevant for users again.
REFERENCES1. Piotr D. Adamczyk and Brian P. Bailey. 2004. If NotNow, when?: The Effects of Interruption at DifferentMoments Within Task Execution. In Proceedings of theSIGCHI Conference on Human Factors in ComputingSystems (CHI ’04). ACM, New York, NY, USA, 271–278.DOI:http://dx.doi.org/10.1145/985692.985727
2. Agathe Battestini, Vidya Setlur, and Timothy Sohn. 2010.A Large Scale Study of Text-messaging Use. InProceedings of the 12th International Conference onHuman Computer Interaction with Mobile Devices andServices (MobileHCI ’10). ACM, New York, NY, USA,229–238. DOI:http://dx.doi.org/10.1145/1851600.1851638
3. Jeremy Birnholtz, Jeff Hancock, Madeline Smith, andLindsay Reynolds. 2012. Understanding unavailability ina world of constant connection. interactions 19, 5 (2012),32–35. DOI:http://dx.doi.org/10.1145/2334184.2334193
4. Jelmer P. Borst, Niels A. Taatgen, and Hedderik van Rijn.2015. What Makes Interruptions Disruptive?: AProcess-Model Account of the Effects of the ProblemState Bottleneck on Task Interruption and Resumption. InProceedings of the 33rd Annual ACM Conference onHuman Factors in Computing Systems (CHI ’15). ACM,New York, NY, USA, 2971–2980. DOI:http://dx.doi.org/10.1145/2702123.2702156
Notifications and Attention MobileHCI'18, September 3-6, Barcelona, Spain
3:9
5. Lewis Chuang, Sven Gehring, Judy Kay, and AlbrechtSchmidt (Eds.). 2017. Ambient NotificationEnvironments.
6. Herbert H. Clark. 1999. Using Language. Journal ofLinguistics 35, 01 (March 1999).
7. Mary Czerwinski, Eric Horvitz, and Susan Wilhite. 2004.A Diary Study of Task Switching and Interruptions. InProceedings of the SIGCHI Conference on HumanFactors in Computing Systems (CHI ’04). ACM, NewYork, NY, USA, 175–182. DOI:http://dx.doi.org/10.1145/985692.985715
8. Tilman Dingler and Martin Pielot. 2015. I’ll Be There forYou: Quantifying Attentiveness Towards MobileMessaging. In Proceedings of the 17th InternationalConference on Human-Computer Interaction with MobileDevices and Services (MobileHCI ’15). ACM, New York,NY, USA, 1–5. DOI:http://dx.doi.org/10.1145/2785830.2785840
9. Joel E. Fischer, Chris Greenhalgh, and Steve Benford.2011. Investigating Episodes of Mobile Phone ActivityAs Indicators of Opportune Moments to DeliverNotifications. In Proceedings of the 13th InternationalConference on Human Computer Interaction with MobileDevices and Services (MobileHCI ’11). ACM, New York,NY, USA, 181–190. DOI:http://dx.doi.org/10.1145/2037373.2037402
10. Joel E. Fischer, Nick Yee, Victoria Bellotti, Nathan Good,Steve Benford, and Chris Greenhalgh. 2010. Effects ofContent and Time of Delivery on Receptivity to MobileInterruptions. In Proceedings of the 12th InternationalConference on Human Computer Interaction with MobileDevices and Services (MobileHCI ’10). ACM, New York,NY, USA, 103–112. DOI:http://dx.doi.org/10.1145/1851600.1851620
11. James Fogarty, Scott E. Hudson, Christopher G. Atkeson,Daniel Avrahami, Jodi Forlizzi, Sara Kiesler, Johnny C.Lee, and Jie Yang. 2005. Predicting humaninterruptibility with sensors. ACM Trans. Comput.-Hum.Interact. 12, 1 (Mar 2005), 119–146. DOI:http://dx.doi.org/10.1145/1057237.1057243
12. Jose A. Gallud and Ricardo Tesoriero. 2015. SmartphoneNotifications: A Study on the Sound to SoundlessTendency. In Proceedings of the 17th InternationalConference on Human-Computer Interaction with MobileDevices and Services Adjunct (MobileHCI ’15). ACM,New York, NY, USA, 819–824. DOI:http://dx.doi.org/10.1145/2786567.2793706
13. Eric Horvitz and Johnson Apacible. 2003. Learning andReasoning about Interruption. In Proc. ICMI ’03.
14. Eric Horvitz, Johnson Apacible, and Muru Subramani.2005. Balancing awareness and interruption:investigation of notification deferral policies. In Proc.UM ’05. Springer-Verlag, 5. DOI:http://dx.doi.org/10.1007/11527886_59
15. Shamsi T. Iqbal and Brian P. Bailey. 2008. Effects ofIntelligent Notification Management on Users and TheirTasks. In Proceedings of the SIGCHI Conference onHuman Factors in Computing Systems (CHI ’08). ACM,New York, NY, USA, 93–102. DOI:http://dx.doi.org/10.1145/1357054.1357070
16. Shamsi T. Iqbal and Brian P. Bailey. 2010. Oasis: Aframework for linking notification delivery to theperceptual structure of goal-directed tasks. ACM Trans.Comput.-Hum. Interact. 17, 4, Article 15 (Dec 2010), 28pages. DOI:http://dx.doi.org/10.1145/1879831.1879833
17. Shamsi T. Iqbal and Eric Horvitz. 2010. Notifications andAwareness: A Field Study of Alert Usage andPreferences. In Proceedings of the 2010 ACM Conferenceon Computer Supported Cooperative Work (CSCW ’10).ACM, New York, NY, USA, 27–30. DOI:http://dx.doi.org/10.1145/1718918.1718926
18. Kostadin Kushlev, Jason Proulx, and Elizabeth W. Dunn.2016. "Silence Your Phones": Smartphone NotificationsIncrease Inattention and Hyperactivity Symptoms. InProceedings of the 2016 CHI Conference on HumanFactors in Computing Systems (CHI ’16). ACM, NewYork, NY, USA, 1011–1020. DOI:http://dx.doi.org/10.1145/2858036.2858359
19. Uichin Lee, Joonwon Lee, Minsam Ko, Changhun Lee,Yuhwan Kim, Subin Yang, Koji Yatani, Gahgene Gweon,Kyong-Mee Chung, and Junehwa Song. 2014. Hooked onSmartphones: An Exploratory Study on SmartphoneOveruse Among College Students. In Proceedings of theSIGCHI Conference on Human Factors in ComputingSystems (CHI ’14). ACM, New York, NY, USA,2327–2336. DOI:http://dx.doi.org/10.1145/2556288.2557366
20. Gloria Mark, Stephen Voida, and Armand Cardello. 2012."A Pace Not Dictated by Electrons": An Empirical Studyof Work Without Email. In Proceedings of the SIGCHIConference on Human Factors in Computing Systems(CHI ’12). ACM, New York, NY, USA, 555–564. DOI:http://dx.doi.org/10.1145/2207676.2207754
21. Abhinav Mehrotra, Mirco Musolesi, Robert Hendley, andVeljko Pejovic. 2015. Designing Content-drivenIntelligent Notification Mechanisms for MobileApplications. In Proceedings of the 2015 ACMInternational Joint Conference on Pervasive andUbiquitous Computing (UbiComp ’15). ACM, New York,NY, USA, 813–824. DOI:http://dx.doi.org/10.1145/2750858.2807544
22. Abhinav Mehrotra, Veljko Pejovic, Jo Vermeulen, RobertHendley, and Mirco Musolesi. 2016. My Phone and Me:Understanding People’s Receptivity to MobileNotifications. In Proceedings of the 2016 CHIConference on Human Factors in Computing Systems(CHI ’16). ACM, New York, NY, USA, 1021–1032. DOI:http://dx.doi.org/10.1145/2858036.2858566
Notifications and Attention MobileHCI'18, September 3-6, Barcelona, Spain
3:10
23. Tadashi Okoshi, Kota Tsubouchi, Masaya Taji, TakanoriIchikawa, and Hideyuki Tokuda. 2017. Attention andEngagement-Awareness in the Wild: A Large-ScaleStudy with Adaptive Notifications. In IEEE InternationalConference on Pervasive Computing andCommunications.
24. Veljko Pejovic and Mirco Musolesi. 2014. InterruptMe:Designing Intelligent Prompting Mechanisms forPervasive Applications. In Proceedings of the 2014 ACMInternational Joint Conference on Pervasive andUbiquitous Computing (UbiComp ’14). ACM, New York,NY, USA, 897–908. DOI:http://dx.doi.org/10.1145/2632048.2632062
25. Martin Pielot, Karen Church, and Rodrigo de Oliveira.2014a. An In-situ Study of Mobile Phone Notifications.In Proceedings of the 16th International Conference onHuman-computer Interaction with Mobile Devices &Services (MobileHCI ’14). ACM, New York, NY, USA,233–242. DOI:http://dx.doi.org/10.1145/2628363.2628364
26. Martin Pielot, Rodrigo de Oliveira, Haewoon Kwak, andNuria Oliver. 2014b. Didn’t You See My Message?:Predicting Attentiveness to Mobile Instant Messages. InProceedings of the 32Nd Annual ACM Conference onHuman Factors in Computing Systems (CHI ’14). ACM,New York, NY, USA, 3319–3328. DOI:http://dx.doi.org/10.1145/2556288.2556973
27. Martin Pielot and Luz Rello. 2017. Productive, Anxious,Lonely: 24 Hours Without Push Notifications. In
Proceedings of the 19th International Conference onHuman-Computer Interaction with Mobile Devices andServices (MobileHCI ’17). ACM, New York, NY, USA,Article 11, 11 pages. DOI:http://dx.doi.org/10.1145/3098279.3098526
28. Julie Rennecker and Lindsey Godwin. 2005. Delays andInterruptions: A Self-perpetuating Paradox ofCommunication Technology Use. Inf. Organ. 15, 3 (July2005), 247–266. DOI:http://dx.doi.org/10.1016/j.infoandorg.2005.02.004
29. Alireza Sahami Shirazi, Niels Henze, Tilman Dingler,Martin Pielot, Dominik Weber, and Albrecht Schmidt.2014. Large-scale Assessment of Mobile Notifications. InProceedings of the SIGCHI Conference on HumanFactors in Computing Systems (CHI ’14). ACM, NewYork, NY, USA, 3055–3064. DOI:http://dx.doi.org/10.1145/2556288.2557189
30. Cary Stothart, Ainsley Mitchum, and Courtney Yehnert.2015. The attentional cost of receiving a cell phonenotification. Journal of experimental psychology: humanperception and performance 41, 4 (2015), 893.http://dx.doi.org/10.1037/xhp0000100
31. Liam D. Turner, Stuart M. Allen, and Roger M. Whitaker.2017. Reachable but not Receptive: EnhancingSmartphone Interruptibility Prediction by Modelling theExtent of User Engagement with Notifications. Pervasiveand Mobile Computing (2017). DOI:http://dx.doi.org/10.1016/j.pmcj.2017.01.011 acceptedJan 31, 2017.
Notifications and Attention MobileHCI'18, September 3-6, Barcelona, Spain
3:11


