Embed Size (px)
Citation preview

Edith Cowan University Edith Cowan University
Research Online Research Online
Research outputs 2014 to 2021
2021
Discovering optimal strategy in tactical combat scenarios through Discovering optimal strategy in tactical combat scenarios through
the evolution of behaviour trees the evolution of behaviour trees
Martin Masek Edith Cowan University
Chiou Peng Lam Edith Cowan University
Luke Kelly Edith Cowan University
Martin Wong
Follow this and additional works at: https://ro.ecu.edu.au/ecuworkspost2013
Part of the Physical Sciences and Mathematics Commons
10.1007/s10479-021-04225-7 Masek, M., Lam, C. P., Kelly, L., & Wong, M. (2021). Discovering optimal strategy in tactical combat scenarios through the evolution of behaviour trees. Annals of Operations Research. Advance online publication. https://doi.org/10.1007/s10479-021-04225-7 This Journal Article is posted at Research Online. https://ro.ecu.edu.au/ecuworkspost2013/10979

Vol.:(0123456789)
Annals of Operations Researchhttps://doi.org/10.1007/s10479-021-04225-7
1 3
ORIGINAL RESEARCH
Discovering optimal strategy in tactical combat scenarios through the evolution of behaviour trees
Martin Masek1 · Chiou Peng Lam1 · Luke Kelly1 · Martin Wong2
Accepted: 30 July 2021 © The Author(s) 2021
AbstractIn this paper we address the problem of automatically discovering optimal tactics in a com-bat scenario in which two opposing sides control a number of fighting units. Our approach is based on the evolution of behaviour trees, combined with simulation-based evaluation of solutions to drive the evolution. Our behaviour trees use a small set of possible actions that can be assigned to a combat unit, along with standard behaviour tree constructs and a novel approach for selecting which action from the tree is performed. A set of test scenarios was designed for which an optimal strategy is known from the literature. These scenarios were used to explore and evaluate our approach. The results indicate that it is possible, from the small set of possible unit actions, for a complex strategy to emerge through evolution. Combat units with different capabilities were observed exhibiting coordinated team work and exploiting aspects of the environment.
Keywords Wargames · Evolution of behaviour trees · Genetic programming
1 Introduction
In deciding which strategy to employ in a combat situation, the capabilities of the opposing sides and features of the combat environment must be considered. Even though a side may be outmatched in some respects, there may exist a set of tactics that could negate the ene-my’s strengths and expose its weakness. The search for suitable strategies that may be used in future warfare scenarios can be undertaken through the process of wargaming, where a simulation is used instead of real combat.
In wargames that use computer-based simulation, the fidelity of the simulation is impor-tant in terms of its usefulness in discovering strategy that could be mapped to a real-world scenario. When considering the behaviour of computer-controlled entities, such as different combat units, they need to have the capability of behaving competitively, by employing their own set of tactics that is appropriate to the environment and their capabilities.
* Martin Masek [email protected]
1 School of Science, Edith Cowan University, Perth, WA, Australia2 Defence Science and Technology Group, Edinburgh, Australia

Annals of Operations Research
1 3
The development of realistic automated entities to take part in wargames is challenging because of their complexity, in terms of having to operate in an environment with a large state space, with uncertainty due to a limited visibility of the opponents manoeuvres and capabilities. The rise of such agents in a variety of games played against humans offers a possible solution. In particular, real-time strategy (RTS) games are a platform in which the coordination of heterogeneous combat units to defeat an opponent is a prominent feature.
A number of techniques have been applied to build artificial intelligence (AI) players for RTS games. For example, AI trained using multi-agent Reinforcement Learning (RL) has been developed for the game Starcraft and has been ranked as better than 99.8% of ranked human players (Vinyals et al., 2019). Earlier examples, documented in the review by Robertson and Watson (2014), include other approaches based on RL, in addition to Monte Carlo Tree Search and Case-Based planning techniques. The application of evolu-tionary algorithms to the challenge of creating automated opponents for RTS games has also shown some promise. Evolutionary algorithms are in the family of metaheuristic tech-niques that has seen wide use in operations research (Gupta et al., 2021; Osman & Laporte, 1996). Recently, their use combined with simulation-based evaluation, termed simheuris-tics, has seen an increase of activity (Juan et al., 2015, 2021; Lam et al, 2019).
Our evolutionary approach offers the potential benefit of explainability over the current state of the art approaches, not so much due to the evolution, but due to the behaviour tree construct that is evolved. Typically, RL-based approached result in a neural network type controller, where the ‘strategy’ enacted is encoded as a large volume of numbers that act as weights inside the neural network. It is virtually impossible for a human to discern the behaviour resulting from these weights, hence a neural network is typically seen as a black-box approach, offering an output in response to an input without offering a rationale for that output. Strategies discovered through Monte Carlo based techniques are also difficult for a human to understand, as that technique relies on mass-scale simulation, typically against a random opponent and using statistical properties of winning to determine the next action, rather than trying to capture the logic for those actions. Behaviour trees on the other hand, are a structure that was originally designed for human readability, as they were intended for game designers to encode the behavioural logic for computer games (Isla, 2005). Thus, for a chosen behaviour of a particular unit, it is possible to trace back manually through the behaviour tree and identify the decisions that were made in order to choose that behaviour.
In this paper, which is an extended version of the work presented in Masek et al. (2019), our approach for optimal behaviour discovery is presented. The key to our approach is the composition of a small set of possible actions into a behaviour tree structure that can func-tion as a controller for the Blue Team entities in a wargame simulation. Rather than use an explicit set of rules to compose the possible actions into a high level behaviour, we allow this high level behaviour to emerge through the process of evolution, driven by simulation-based evaluation. Building on from our initial work in Masek et al. (2019), in this paper we provide detailed insights into aspects of the approach, and perform a thorough evaluation. In particular, a novel means of using the tree in the agent model to determine the action taken is introduced in Sect. 3.2. This approach, which allows for the evolution of timing into the behaviour tree, was able to evolve tactics that realise complex collaborative agent behaviour from a small set of coarse primitive actions.
In order to systematically evaluate our approach, a set of test scenarios was needed where the ‘optimal’ strategy was known. Full-scale realistic scenarios are not suitable for this purpose, as their complexity often means that multiple strategies can be employed and it is uncertain which one is the best. Our design of a set of small-scale scenarios was guided by the work of Hullett and Whitehead (2010), who documented a set of game level

Annals of Operations Research
1 3
design patterns for first person shooter computer games. Results using the design patterns of an open area and a choke point presented in Masek et al. (2019) are expanded upon here. Additionally, in this paper we introduce a scenario based on the stronghold design pattern and use it to explore differing tactics that arise when the Blue Team has partial visibility as opposed to full visibility of the scenario. Two, more complex, scenarios are also evalu-ated, Urban Warfare, which was also presented in Masek et al. (2019), and a larger sce-nario, Land Warfare, which is introduced here. In addition to the expanded set of scenarios, we also compare our approach to a set of existing techniques and analyse our approach in terms of computational resources required.
The rest of this paper is organised as follows: In Sect. 2 we provide a background to the use of evolution for strategy discovery in wargame-like scenarios, including strategy games. Section 3 contains a description of our approach of using genetic programming to evolve behaviour trees that are evaluated through an agent-based simulation. Section 4 contains a description of the experiments and results, followed by the conclusion in Sect. 5.
2 Background
Evolutionary algorithms are population-based search and optimisation algorithms, using a set of solutions that evolve over a number of generations. They can scale to large, complex search spaces and can cope with discontinuities and local optima in the fitness landscape. This gives evolutionary algorithms an advantage in warfare scenarios where a number of different strategies can lead to success, but the success of a strategy will change based on the opponent. In particular, there is an element of intransitivity in the ranking of strate-gies preventing a simple linear ranking. As an example of this intransitivity, Ontanón et al. (2013) report that for a 2011 Starcraft AI competition out of the top three bots, Skynet, UAlbertaBot and AIUR, Skynet was superior to UAlbertaBot, UAlbertaBot was superior to AIUR, and AIUR was superior to Skynet. The complexity of warfare scenarios pre-sents difficulty in finding an objective measure of fitness for a solution, and in that respect simulation-based evaluation is typically favoured. It must be acknowledged though that this shifts the burden from having to determine an objective fitness measure into having to decide which aspects of warfare are simulated and the fidelity of this simulation, and the problems of dealing with uncertainty persist.
Behaviour trees are data structures where nodes of the tree represent condition checks and actions of an in-game entity (typically agent-based). They are widely used in the crea-tion of hand-coded game AI. Complex behaviours can be built by arranging simple control flow and action nodes in a tree structure, which is traversed depth first to determine which actions to execute. The behaviour tree provides flexibility as it lends itself to a hierarchi-cal structure, where behaviour trees corresponding to simple behaviours can be used as sub-trees in a larger behaviour tree that implements a more comprehensive higher level behaviour.
The transparent nature of behaviour trees, in that the decision points leading to executed actions are distinctly identifiable in the tree, lend them to applications in behaviour model-ling for wargaming and RTS games. For example, the Norwegian army is using behaviour trees that have been manually derived to model behaviour for combat units (Evensen et al., 2018). In other work, behaviour trees have also been constructed automatically by analys-ing examples of RTS gameplay (Robertson & Watson, 2015).

Annals of Operations Research
1 3
There is limited existing work on the use of evolutionary algorithms to produce behav-iour trees. Perez et al. (2011) applied grammatical evolution of behaviour trees for a 2D platform game using the Mario AI Benchmark environment (Togelius et al., 2009) produc-ing behaviour tree controllers for the central character, Mario. They used a constrained tree structure composed of behaviour blocks and remarked that behaviour trees are a good solu-tion for combining a variety of different behaviours (e.g. reacting to enemies and pathfind-ing). A less constrained application, and one more relevant to combat, Berthling-Hansen et al. (2018) used the multi-objective NSGA-II algorithm (Deb et al., 2000), with changes to allow for genetic programming of behaviour trees. They were able to evolve follower behaviour for a simulated soldier in a 3D environment based on the primitive behaviours of checking distance to a target and moving towards it.
There also exist other approaches where behaviour trees are evolved specific to lower level goals and are then used within a higher level controller to generate a larger behaviour tree that represents a more complex behaviour. An example is the work of Lim et al. (2010) applied to the commercial game DEFCON. In their work, evolution was used to separately create a number of behaviour trees, one for each task in the game. These trees were then used in a manually designed game playing agent. Similarly, Hoff and Christensen (2016) used genetic programming to generate behaviour trees for individual aspects of the game Zero-K, which they then combined together to produce a player agent.
As can be seen from the above discussion of related work, behaviour trees have only played a limited role in an AI solution, either having to be specified manually by a human expert, or automated but only serving as a ‘partial’ solution that then relies on other tech-niques to build up a complete AI solution. Our approach aims to reach further, to produce a complete AI approach for addressing tactical combat scenarios through behaviour trees evolved so as to determine the appropriate actions for a set of diverse units from the begin-ning of the scenario till its end.
3 The approach
The components and steps of our approach are presented in Fig. 1. Input consists of a set of condition and action node types that can be evolved into a behaviour tree, a fitness func-tion, and a scenario in which solutions will be simulated. The behaviour trees and fitness function are used for transforming the simulation-based outcomes into a single measure of fitness.
The evolution component of the approach starts by generating an initial population and iterating between evaluation and production of the next generation. Evaluation is per-formed by sending each individual of the population, in turn, to the evaluator. The evalua-tor instantiates the scenario and uses the individual as the behaviour tree controller for the Blue Team entities. Once a scenario is complete, measures of effectiveness, such as units remaining and their status, are sent back to calculate fitness using the fitness function.
Production of the next generation is through the use of a selection scheme to choose candidates from the previous generation. Each candidate may go into the population of the next generation unchanged, or based on a probability, undergo the genetic operators of mutation or crossover. The specific details of the operators used in our experiments will be discussed in the next section.
As the evolutionary process is an iterative search it may continue for an indeterminate number of generations (though a stopping criteria may be imposed). At each generation,

Annals of Operations Research
1 3
output is produced in the form of a candidate set of solutions (the current population) whose behaviour can be manually examined. Typically this examination is performed on the individual with the highest fitness.
3.1 Evaluator
The evaluator chosen for this project was MicroRTS (Ontañón, 2013). MicroRTS is a sim-ple real time strategy game initially designed for testing theoretical ideas in relation to AI research. MicroRTS is played on a game board divided into a grid of square tiles. Tiles are either accessible or inaccessible. A game takes place over a set number of time units (we have used 3000 and 5000 in our experiments). These time units are abstract and do not cor-respond to real time. The game time can be slowed down so that a human can participate or visualise a game, but for use in AI training MicroRTS can run games as fast as the process-ing hardware allows.
We have used four of the unit types available within MicroRTS, and their capabilities are summarised in Table 1. Each unit type has a certain number of Hit Points, an integer value corresponding to the amount of damage the unit can receive before being destroyed. The Base Unit is immobile and lacks any attack capability. We have used the Base in our experiments as a point for other units to attack or defend.
Fig. 1 (Reproduced from Masek et al., 2019): An overview of the approach. Provided with the input of the Behaviour Tree primitive node set, fitness function and scenario. The evolutionary algorithm (1) creates an initial population and then iterates between (2) evaluating the current population and (3) producing the next generation. Evaluation is performed by a simulation engine, in our case MicroRTS. At each generation, the fittest individual serves as a candidate solution

Annals of Operations Research
1 3
We have used three mobile combat unit types: Light (as a proxy for infantry), Heavy (proxy for armor) and Ranged (proxy for artillery). These units can move from one tile to the next in a 4-connected fashion (i.e. vertically or diagonally). The Heavy Unit is the slowest, taking 12 time units to move between tiles, with the Light Unit the fastest at 8 time units per move. The Heavy and Light have an attack range of 1, meaning they can only attack units in adjacent (4-connected) tiles. The Ranged unit has an attack range of 3 tiles, and has the ability to attack diagonally. The time needed to perform an attack is the same for each unit type, at 5 time units. The amount of damage inflicted by a successful attack is between 1 and 4 hit points, depending on unit type.
In our experiments we did not make use of MicroRTS units that can produce other units or gather resources (common gameplay mechanics found in RTS games) so as to constrain the problem space to one closely related to military wargaming.
3.2 Agent behaviour tree model
For the Blue Team, we utilise a behaviour tree controller for each agent, and this controller is evolved in our approach. Behaviour trees are modular, goal orientated models, which are hierarchical in nature. Each subtree typically represents a solution to a smaller goal, requir-ing simple behaviour (for example, ‘move towards the nearest enemy’, or ‘move towards the nearest ally’), and these subtrees when coupled together have the ability to produce a more complex behaviour to achieve a higher level goal (for example, ‘escort an ally whilst drawing fire away from them’.
A behaviour tree is constructed from a set of nodes. The primitive set of behaviour tree nodes that we have used in our experiments is listed in Table 2. As a behaviour tree is tra-versed, each node performs its intended activity and returns to the parent node with one of three states, ‘success’, ‘failure’, or ‘running’. The terminal (or leaf) nodes correspond to the input set of condition and action nodes and are specific to the domain (ie. in a combat domain, the actions will typically be either offensive or defensive). The non-terminal nodes in a behaviour tree act to provide a logical structure for the terminal nodes and are generic.
Table 1 MicroRTS units used in our experiments
Unit type Attributes Commands Observability
Light unit Hit Points: 4Attack Range: 1 tileMove Time: 8 time units per tileAttack Time: 5 time units per attackDamage: 2 hit points
MoveAttackWait
Partial Sight Radius: 2Full Sight Radius: Whole board
Heavy unit Hit Points: 4Attack Range: 1 tile.Move Time: 12 time units per tile.Attack Time: 5 time units per attack.Damage: 4 hit points
MoveAttackWait
Partial Sight Radius: 2Full Sight Radius: Whole board
Ranged unit Hit Points: 1Attack Range: 3 tilesMove Time: 10 time units per tile.Attack Time: 5 time units per attack.Damage: 1 hit point
MoveAttackWait
Partial Sight Radius: 3Full Sight Radius: Whole board
Base unit Hit Points: 10 Partial Sight Radius: 5Full Sight Radius: Whole board

Annals of Operations Research
1 3
We use two standard non-terminal nodes, the selector node, which attempts to execute each of its child nodes in order, until one succeeds, or until they are all visited, and the sequence node, which attempts to execute all children in order until one fails or all are visited. For our non-terminal nodes, we constrained the ‘arity’, the number of children between 1 and 4 inclusive.
In implementing our behaviour tree model we experimented with three different ways of traversing (ticking) the behaviour tree in order to determine the action a unit is ordered to perform. The first is a conventional approach, and the two others are novel, specifically for-mulated to encourage more complex emergent behaviour from the evolved behaviour tree.
1. Conventional approach If an action node corresponds to an activity that cannot be completed immediately, it returns the state ‘running’ (e.g. The action of moving a unit to a particular position, which cannot be done instantaneously). Actions that can be com-pleted immediately (e.g. checking for enemy bases, or a move command where the unit has either successfully reached the target destination or the destination is unreachable) return either ‘success’ or ‘failure’. To determine which action a unit will be ordered to perform, the tree is ticked from the root node until a node returns the ‘running’ state, with the agent then being tasked with completing that action.
2. Pause node approach Differs from the conventional approach in that nodes only return either ‘success’ or ‘failure’, without the use of the ‘running’ state. In this approach, actions that cannot be accomplished instantaneously, but are possible, return ‘success’. This would mean, in a conventionally ticked behaviour tree, that traversal of the tree would continue and if another subsequent action node was encountered, that action would override previous actions. To introduce an evolvable means of stopping the behaviour tree execution so as to result with a particular action, a ‘pause’ construct was introduced. When encountered, this ‘pause’ node causes the tree traversal to stop, with the agent given the command to perform the last ticked action. The next time that the
Table 2 Primitive set used to build behaviour trees in our experiments (reproduced from Masek et al., 2019)
Terminal nodes Description
AttackClosestEnemy A command is issued for the agent to attack the closest enemy fighting unit. If there are no enemies, this node returns a failure
If there are enemies, this node returns a successAttackClosestBase A command is issued for the agent to attack the closest enemy Base unit
If there are no bases, this node returns a failure. If there are bases, this node returns a success
MoveToClosestAllies A command is issued for the agent to move towards the closest allied unitIf there are no allies, this node returns a failure. If the command to move towards
the closest ally was executed, this node returns a successIdle A 10 frame wait command is issued to the agent. This node always returns trueCheckForEnemies Returns true if enemy fighting units are present on the map, otherwise returns falseCheckForAllies Returns true if an ally is within a distance of 2 units, otherwise returns falseCheckForBases Returns true if an enemy base is present on the map, otherwise returns false
Non-terminal nodes (Arity of 1–4) Description
Selector Executes child nodes in order until one succeedsSequence Executes child nodes in order until one fails or all are visited

Annals of Operations Research
1 3
behaviour tree is queried, execution begins from the previous ‘pause’ node, rather than from the root.
3. Per node approach In this approach, each time the behaviour tree is queried, a single node is ticked, with subsequent queries of the tree ticking subsequent nodes. In this approach, rather than an explicit pause node, the pause is done for every node. This approach, through evolution, encourages behaviour that needs to occur earlier in the scenario to be present closer to the top of the behaviour tree.
In each case, the time interval between when the behaviour tree is queried to determine the next action was 10 game time units (where a scenario was typically run for a duration of 3000 game time units).
A set of experiments was run to determine which approach to ticking the behaviour tree produced suitable results through evolution. Experiments were conducted in the Plain Ter-rain scenario, this scenario will be described in more detail in Sect. 4.1.1. Twelve experi-mental runs of evolution were conducted with each tree ticking approach. Each experimen-tal run consisted of running the evolutionary process for 20,000 generations, with each run having a different setting for the probability of mutation and crossover. Mutation probabil-ity was set to one of: [0.2, 0.4, 0.6, 0.8] and crossover probability to one of: [0.4, 0.6, 0.8]. For each experimental run, the best solution in the final generation, and also the best and average fitness across the generations were examined to determine a suitable tree ticking scheme.
In examining the solutions resulting from the experimental runs, the Conventional Approach failed to generate a winning set of tactics through evolution. In all twelve of the Conventional Approach experimental runs, the fittest solution at the end of the evolution-ary process resulted in a defeat (loss of all Blue Units and Base). Both the Pause Node and Per Node approaches resulted in collaborative behaviour in the Blue Team, leading to success. In the Pause Node approach, eight out of the twelve experiments resulted in the fittest solution from the last generation winning (no Red Units or Bases remaining), with the remaining four losing. For the Per Node approach, eight experiments resulted in a win-ning solution in the final generation, four resulted in a draw (both red and Blue Units were remaining) and there were no losses.
The progress of the evolution for these comparison experiments is shown in Fig. 2. This figure shows the average of the best solutions in each generation for each of the three approaches. This shows the clear dominance of the Per Node approach in evolving a solu-tion with higher fitness sooner, thus this approach has been utilised in the subsequent experiments that are reported in this paper.
For units on the Red Team, standard controllers from the MicroRTS environment were utilised. For all scenarios, except our largest one, Land Warfare, we used an AI, called ‘rush’, where each unit attacks the closest accessible Blue Team unit. For the Land Warfare scenario, which features a much larger terrain with several unit groups, we chose a ‘defend’ type AI which stays in its defined place until enemy units come within a certain range. The scenarios themselves are described in detail in Sect. 3.3.4.
3.3 Evolutionary approach
In our approach we utilised genetic programming, an evolutionary algorithm first pro-posed by Koza (1992). In genetic programming, individuals take the form of trees, with the standard genetic operators such as crossover and mutation adapted into versions

Annals of Operations Research
1 3
that work specifically with tree structures. This makes genetic programming a suitable approach for behaviour tree evolution, using the primitive node set, and evolving tree structures using it. The specific operators and settings used in our implementation are discussed.
3.3.1 Population initialisation
The initial population is randomly generated using two methods, grow and full, with each method used to create half of the population. This method, known commonly as ‘ramped half and half’ (Koza, 1992), is widely used as it creates an initial population with greater diversity than if just the grow or full method were used exclusively. Each method produces trees of a specified maximum depth using two steps: 1. Growing the tree using non-terminal nodes until depth reaches one level less than the intended tree depth, and 2. Add a layer of terminal nodes. The grow method constructs the tree ran-domly from the root, adding non-terminal nodes until one reaches the intended tree depth – 1, whilst the full method ensures all branches have non-terminal nodes up to the intended depth – 1. An example showing these two steps for the grow and full method to generate trees at depth of 4 and node arity 2 is shown in Fig. 3. For our experi-ments we used a minimum and maximum tree depth of two and six respectively, with arity of nodes (number of children) between 1 and 4. These numbers were determined empirically for our scenarios, with a trade-off existing as the greater the maximum depth and/or arity, the greater the number of possible node and branch combinations possible, which could result in more complex behaviour. On the other hand this implies an increase in the search space which would necessitate either a larger population size, more generations, or both to allow the algorithm to find an optimal solution.
14
19
24
29
34
39
157
311
4517
1722
8928
6134
3340
0545
7751
4957
2162
9368
6574
3780
0985
8191
5397
2510
297
1086
911
441
1201
312
585
1315
713
729
1430
114
873
1544
516
017
1658
917
161
1773
318
305
1887
719
449
Fitn
ess
Genera�on
Comparison of Ticking Schemes Average Best Fitness per Genera�on
Per node Pause Conven�onal
Fig. 2 A plot of the average best fitness in each generation for the three tree query approaches. Each point is the average of 12 fitness values, corresponding to the fittest individuals in each experiment for a particular generation

Annals of Operations Research
1 3
3.3.2 Fitness function
The fitness function is an important element, as it defines the ‘optimum’. Our fitness func-tion. shown as Eq. 1, consists of taking the difference between the Blue Team hit points (blueHP) and Red Team hit points (redHP) at the completion of simulation of a scenario. To keep the fitness as a positive number, we add the constant maxHP, which are the hit points of the team that starts with the largest number of hit points. The hit points of a team are calculated by summing the hit points of each unit on that team. Each unit in MicroRTS starts with a set number of hit points, based on unit type (Table 1). Damage during the sce-nario is modelled as a loss of hit points, where zero hit points results in the unit removed from the scenario.
A good solution under this fitness function corresponds to a high fitness value, min-imising blue losses (ie. maximising blueHP) and maximising red losses (ie. minimising redHP). Gajurel et al. (2018), used a similar fitness function, calculating the difference in Red Team hit points between the start and end of the game (ie. amount of damage that red sustains) plus the total Blue Team hit points as a measure of fitness. Depending on the sce-nario, other fitness functions may be more appropriate. For example, if the objective is to eliminate a target ‘at all cost’, or to do it whilst minimising time taken, these objectives can be factored into a fitness equation.
3.3.3 Selection scheme
Selecting individuals from the current generation for inclusion in the next generation is based on the fitness measure. We used the Stochastic Universal Sampling (SUS) selection scheme (Baker, 1987). The SUS scheme works in such a way that all individuals regardless of fitness have a chance to be selected into the subsequent generation, with higher fitness
(1)Fitness = blueHP − redHP + maxHP
Fig. 3 Example of tree growth using the Grow and Full methods. Here the desired depth of the tree is 4 and the arity of each node is 2

Annals of Operations Research
1 3
individuals having a greater chance, however SUS is also designed so that the fittest solu-tions cannot be chosen exclusively without less fit solutions also being represented. It is important for low fitness solution to have a chance of being selected, especially early on in the process of evolution, to give the process time to explore the search space, rather than converging early which risks converging to a local optimum that happens to be near an individual in the initial population, where a better optimum might exist in an unexplored part of the search space. SUS is a standard selection scheme in evolutionary computation in general, and not particular to genetic programming.
3.3.4 Mutation scheme
Once an individual is selected for the next generation it has a chance, based on the muta-tion probability, to undergo mutation which applies a change to the individual so as to explore the solution space. Since our individuals are represented as trees, a mutation scheme especially designed for this type of representation needed to be chosen in order for the resulting mutated trees to remain valid. We have used Subtree mutation, a standard tree mutation operator, where a random node on the existing tree is chosen and the subtree of that node is replaced with a randomly generated subtree. The new sub-tree was generated using the grow method, with the same constraints on minimum and maximum depth for the complete tree as discussed in the initialisation section. This has the effect of replacing a tree branch with a new random sub-tree, or if applied to the root note the entire tree will be a new individual.
3.3.5 Crossover scheme
Crossover, which aims to exploit aspects of existing solutions by exchanging parts of two individuals, is applied, with each individual introduced into the new population having a probability of undergoing crossover. We used single point subtree crossover, a standard crossover scheme for tree structures, where two individuals are first chosen using SUS. A random point is then chosen on each individual tree and the two sub-trees from those nodes are swapped over. This has the effect of exchanging branches between the trees so that different existing behaviours can be mixed between trees, giving good ‘partial’ solu-tions a chance to be combined. In the extreme case, where crossover occurs at the root of individual A and a branch from individual B, the branch will become a new tree of its own, replacing A, while the entire tree of A takes the place of the branch on B.
4 Experiments and results
This section provides a description of the experiments that were undertaken to evaluate the approach and the results produced. Firstly, a set of scenarios are introduced. These sce-narios were developed to feature terrain layout where a known ‘optimum’ strategy exists. A summary is then provided of the evolved strategies for each scenario, followed by an analysis of win/loss rates for solutions evolved over a number of runs of each experiment. We then compare the effectiveness of the evolved behaviour tree agents against the effec-tiveness of existing ‘state of the art’ agents when placed in the same scenario. This section is concluded with a discussion of computational requirements and scalability.

Annals of Operations Research
1 3
4.1 Scenarios
The scenarios in the project have been developed to model existing, isolated battle sce-narios, inspired by the work of Hullett and Whitehead (2010), who identified a number of ‘design patterns’ in first person shooter levels, along with the tactics that should be employed in order to maximise chances of success. The purpose of using these scenar-ios is to assess whether the optimal behaviour recommended for such scenarios can be evolved into the behaviour tree. Three basic scenarios, Plain Terrain, Choke Point and Stronghold each contain one design pattern in a 24 × 24 grid, with two larger scenarios, Urban Warfare (32 × 32 grid) and Land Warfare (64 × 64 grid) contain multiple design patterns in the one scenario. Increasing the grid size allows for larger, more complex, scenarios to be modelled, but increases the simulation time needed in order to allow extra time for units to traverse the larger terrain. The scenarios will now be detailed.
4.1.1 Plain terrain
The Plain Terrain scenario is based on the arena design pattern (Hullett & Whitehead, 2010), which features a wide open area with minimal cover. The scenario is shown in Fig. 4. The Blue Team features a single Ranged and a single Heavy Unit, with the Red Team featuring five Light Units. Each side has a Base (in opposite corners of the map). The capabilities of the two sides are summarised in Table 3.
According to Hullett and Whitehead (2010), the optimum strategy in such a scenario where the blue side is ‘numerically inferior’ is to “move deliberately and make use of cover”. Since the only cover provided in this scenario are the units themselves, the movement of the Blue Units needs to be heavily coordinated.
Fig. 4 Plain Terrain scenario

Annals of Operations Research
1 3
4.1.2 Choke point
The Choke Point scenario, based on the choke point design pattern (Hullett & White-head, 2010), is shown in Fig. 5. This scenario uses a section of non-traversable terrain (coloured in green) to separate the grid into two areas with a narrow path (the choke point) between them. Whilst being non-traversable the terrain does not block visibility, nor the capability to shoot over it (assuming the target is within shooting range). The capabilities of the Blue and Red Teams in this scenario are listed in Table 4. In this situ-ation, when blue is outnumbered by Red, the optimal strategy, as indicated in Hullett and Whitehead (2010), is for Blue to use the narrow choke point to reduce the power of
Table 3 Blue and Red capabilities in the Plain Terrain scenario
Plain terrain (grid size 24 × 24) Blue Red
No. base (HP = 10) 1 1No. light (HP = 4, Damage = 2) 0 5No. heavy (HP = 4, Damage = 4) 1 0No. ranged (HP = 1, Damage = 1) 1 0Total fighting units 2 5Total HP 15 30Attack strength (sum of damage given) 5 10
Fig. 5 Choke Point scenario
Table 4 Blue and Red capabilities in the Choke Point scenario
Choke point (grid size 24 × 24) Blue Red
No. base (HP = 10) 1 1No. light (HP = 4, Damage = 2) 0 5No. heavy (HP = 4, Damage = 4) 1 0No. ranged (HP = 1, Damage = 1) 1 0Total fighting units 2 5Total HP 15 30Attack strength (sum of damage given) 5 10

Annals of Operations Research
1 3
the larger Red Team. Due to the narrow path and the surrounding terrain, the size of the team that red is able to mount against blue is constrained.
4.1.3 Stronghold
The Stronghold design pattern (Hullett & Whitehead, 2010) is designed as a location that is easily defended. It is a special case of the arena design pattern, with a limited number entrances which may be choke points. This set of two scenarios (differing by the size of the choke point entrances), depicted in Fig. 6, features a Blue Base in the centre, protected by two Heavy and two Ranged units. The central area acts as a stronghold, surrounded by impassable terrain, apart from two entrance points near opposite corners of the map. To reach the stronghold, the red attackers must traverse a narrow, winding path (choke point). The path also follows the gallery design pattern (Hullett & White-head, 2010), allowing the blue Ranged units to engage Red Units passing through.
The Red Team consists of 14 Heavy Units. As Heavy Units have an attack range of 1, they cannot fire over the narrow path’s wall, however are susceptible to fire from blue Ranged units (if they are close enough). The capabilities of the two sides are summa-rised in Table 5.
This scenario explores the behaviour that emerges for the blue side in a stronghold environment with ambush possibilities for both blue and red.
Blue could let itself be distracted by attackers coming from one entry point, leaving the Base vulnerable to ambush from the other entry point.Blue could ambush Red Units as they pass through the path leading to the stronghold, targeting those using Ranged Blue Units.
Fig. 6 Stronghold scenario

Annals of Operations Research
1 3
This stronghold scenario also has been used to compare full visibility for blue versus partial visibility for blue, with the sight radius of units indicated in (Table 5).
4.1.4 Urban warfare
The Urban Warfare scenario (Fig. 7) is a larger scenario which features multiple design pattern elements, including multiple choke points. Whereas the previous scenarios fea-ture just a single design pattern each, in order to evaluate whether the known optimal behaviour can be discovered, the goal of this scenario is to provide a more holistic test of our approach in a setting where multiple ‘optimal’ strategies can be employed. The capabilities of the two sides are shown in Table 6. The blue units are placed at the bot-tom of the map. The scenario includes a large Red Base in the top right-hand corner, providing a large incentive if destroyed. A number of red combat units are placed in the bottom right-hand corner. As these Red Units employ the ‘rush’ controller, they will make their way through the map, engaging with the blue units at some point during the scenario. The shortest path to the large Red Base is defended by red Ranged units behind the cover of impassable terrain, making these ‘snipers’ invulnerable to all but the blue Ranged units, though blue only has two of these units. An alternate, safer, path to the large Red Base exists on the left-hand side of the map, an example of the Flanking Route design pattern from Hullett and Whitehead (2010).
4.1.5 Land warfare
Like the previously described Urban Warfare scenario, the Land Warfare scenario, depicted in Fig. 8, is another larger scenario used to more comprehensively evaluate the approach. The scenario features a river system with three crossing points / bridges and several Red Bases and unit groups. A defence oriented AI is used for the Red Units, which remain at their position until a Blue Unit is within a certain distance. Because of the large map size, the maximum number of time units per simulation has been increased to 5000 (from 3000 as in the other experiments). Capabilities or blue and red are summarised in Table 7.
Interesting features include choice of river crossing (choke points). Two protected red snipers (Ranged units protected by terrain) at one river crossing along with larger heterogeneous teams for both blue and red.
Table 5 Blue and Red capabilities in the stronghold scenario
Stronghold (grid size 24 × 24) Blue Red
No. base (HP = 10) 1 0No. light (HP = 4, Damage = 2) 0 0No. heavy (HP = 4, Damage = 4) 2 (sight radius 2) 14No. ranged (HP = 1, Damage = 1) 2 (sight radius 3) 0Total fighting units 4 14Total HP 20 56Attack strength (sum of damage given) 10 56

Annals of Operations Research
1 3
4.2 Experiments
For each scenario, multiple evolution runs were undertaken, from an initial population of 100 solutions, which was obtained by random initialisation. Experiments were performed
Fig. 7 Urban Warfare scenario, shown un-annotated (top) for clarity, and with annotation (bottom) to indi-cate role of unit placement and environment

Annals of Operations Research
1 3
with varying mutation and crossover probabilities. Mutation probability was set to one of: [0.2, 0.4, 0.6, 0.8] and crossover probability to one of: [0.4, 0.6, 0.8]. This resulted in twelve combinations of settings, or twelve experimental runs of evolution for each sce-nario. For the Land Warfare scenario only six of these were completed due to computation time requirements. In each run, evolution occurred for 20,000 generations in the case of all scenarios except Urban and Land Warfare, where it was reduced to 10,000 generations to decrease computation requirements. The Per Node tree traversal scheme was used. The fit-test solution found in each run was subsequently examined to analyse the behaviour exhib-ited by the Blue Team agents.
Table 6 Blue and Red capabilities in the Urban Warfare scenario
Urban warfare (grid size 32 × 32) Blue Red
No. base (HP = 10) 0 5No. light (HP = 4, Damage = 2) 6 2No. heavy (HP = 4, Damage = 4) 10 21No. ranged (HP = 1, Damage = 1) 4 18Total fighting units 20 41Total HP 68 160Attack strength (sum of damage given) 56 106
Fig. 8 Land Warfare scenario. Here impassable terrain (green) has been used to depict a river, with crossing points indicated

Annals of Operations Research
1 3
The tactics employed by the Red Team were static in each scenario. For the Plain Ter-rain, Choke Point, Stronghold and Urban Warfare scenarios, the Red Team utilised a ‘rush’ type controller, where each Red Unit was instructed to attack the nearest Blue Unit. For the Land Warfare scenario, the Red Team used a ‘defence’ controller, where Red Units remained at their initial position until a Blue Unit came withing range, upon which the Red Unit would attack the Blue Unit.
4.3 Plain terrain scenario
The Plain Terrain scenario offers no accessibility obstructions for the agents on the map. The open space can put the Blue Team at a tactical disadvantage by potentially allow-ing the larger Red Team to surround the smaller Blue Team. In all of the fittest solutions from each experiment, one example shown in Fig. 9a–d, the Blue Team Units start by
Table 7 Blue and Red capabilities in the Land Warfare scenario
Land warfare (grid size 64 × 64) Blue Red – defensive AI
No. base (HP = 10) 0 12No. light (HP = 4, Damage = 2) 10 15No. heavy (HP = 4, Damage = 4) 10 25No. ranged (HP = 1, Damage = 1) 10 12Total fighting units 30 52Total HP 90 292Attack strength (sum of damage given) 70 142
Fig. 9 Progress of one strategy through the Plain Terrain sce-nario, with the initial positioning shown in (a), the Blue Team manoeuvre around the Red Units and proceeds to destroy the Red Base (b), after which the Blue Heavy provides cover for the Blue Ranged as it destroys the Red Units (c and d)

Annals of Operations Research
1 3
manoeuvring around the Red Units. This is accomplished by the Blue Team initial moving to the right, whereas the Red Team start moving to the left. This is somewhat an artefact of the movement scheme, as units move in a 4-connected fashion and are unable to move diagonally. After avoiding the Red Team, the Blue Units move to destroy the Red Base. The Blue Ranged unit then stays close to the wall, preventing it from being surrounded. The Blue Heavy Unit positions between the Blue Ranged and the Red Units, seen in. The Blue Ranged Unit attacks the Red Units from behind the cover that the Blue Heavy pro-vides, eliminating the Red Team. Whilst the Blue Heavy protects the Blue Ranged, it con-stantly moves back and forth to prevent being targeted by the adjacent Red Units.
The Plain Terrain set of experiments found the pairing of the Heavy Unit, with the Ranged Unit to be an effective team composition if the units work together. In the initial generations, the two Blue Units tended to act independently and were quickly eliminated. Solutions where the two Blue Units travelled in proximity, with the shielding of the Red Ranged attacker by the Blue Heavy Unit proved superior. This behaviour corresponds to the ‘ideal’ behaviour that is advised for the open area design pattern (Hullett & Whitehead, 2010), where close cooperation and use of cover is recommended when outnumbered, which was the case for blue against the Red Units that were rushing to attack.
The approach was successful in finding a solution to the Plain Terrain scenario in most of the evolution runs. Of the twelve runs of the experiment, eight resulted in the entire Red Team being eliminated, and four resulted in a situation where each team had surviving units at the end of the simulation time.
4.4 Choke point
From the Choke Point scenario experiments, a typical evolved behaviour for Blue was for the Heavy Unit to enter the choke point, blocking any advancing Red Team units, shown in Fig. 10a. This action protects the blue Ranged Unit and allows it to target Red Units that come within range, seen in Fig. 10b. The Heavy unit then emerges from the choke point, using either the left wall or the inaccessible terrain to prevent itself being surrounded, seen in Fig. 10c. The Blue Heavy Unit then proceeds, similar to the behaviour seen in the plain terrain, to move and distract the Red Team, whilst shielding the blue Ranged Unit. After the elimination of the Red Team fighting units, the Blue Units move to destroy the Red Base. Other tactics that emerged in this scenario was for the Blue Ranged Unit to attack over the impassable wall, seen in Fig. 10d or for the Blue Units to engage the Red Units on their side of the choke point.
Similarly as was found in the Plain Terrain scenario, in the first generations, before a strong solution could be evolved, the Blue Units acted without showing any coordination and were quickly defeated. Of the sixteen experiments, fifteen resulted in a win for the Blue Team, including experiments where blue remained unharmed and one resulted in a loss.
4.5 Stronghold—partial visibility
The Stronghold scenario variant with partial visibility reduces the Blue Team’s units abil-ity to see the red units on the map. Heavy units have a sight radius of two units and Ranged Units a sight radius of three tiles.
The dominant tactic that was evolved in these experiments consisted of the Blue Units staying in a tight formation, remaining close to the Base, seen in Fig. 11a, and only

Annals of Operations Research
1 3
engaging the Red Units when they are nearby. The Blue Units engage as a team, with the Ranged Units doing the majority of the damage, example shown in Fig. 11b.
This experiment further demonstrated the capable team composition of the Heavy and Ranged Units. The Heavy Units distracted the Red Team and protected the blue Ranged Units. Due to the high frequency of red attackers in this scenario, one of the blue Heavy and blue Ranged were eliminated early in most cases. The remaining blue Heavy and Ranged were still able to eliminate the majority of the Red Team and survive. These find-ings further strengthen the notion that the pairing of a Heavy and Ranged Unit is an advan-tageous combination when faced against a an opposing team that is greater in strength and numbers and employs a simple ‘rush’ behaviour.
The approach was successful in finding a solution to the stronghold scenario with partial visibility. All experiments resulted in a win for the Blue Team.
Fig. 10 Blue Team tactics evolved in the Choke Point scenario, including (a) the Blue Heavy first block-ing the chokepoint entrance, followed by (b) the Blue Ranged attacking over the Blue Heavy. Other tactics seen included (c) the Blue Heavy using the left boundary or impassable terrain for protection, and (d) Blue Ranged shooting over impassable terrain

Annals of Operations Research
1 3
4.6 Stronghold—full visibility
The Stronghold scenario with full visibility consists of the same scenario as for partial visibility, but the Blue Units have full vision (as with all other scenarios that were experi-mented with). The dominant tactic involves the Blue Units staying in a tight formation and aggressively attacking the Red Units, an example shown in Fig. 12a. The Blue Units engage as a team, with the Ranged Units doing the majority of the damage.
Fig. 11 Blue tactics evolved in the Stronghold scenario with limited visibility, including (a) Blue units remaining near the blue base and (b) the Blue Ranged and Heavy units working together
Fig. 12 Tactics evolved for the Blue Team in the Stronghold scenario with full visibility. Example of Red units being engaged by a grouping of Blue Units shown in (a), and Blue Ranged using the terrain to their advantage by firing over it whilst safe from attack in (b)

Annals of Operations Research
1 3
This experiment showed less of the previously dominant tactic where the Heavy’s protected the Ranged Units and demonstrated that the Blue Units aggressively attacked the red team. This was done before the Red team could group up and outnumber the Blue team. The Ranged Units also took advantage of their ability to attack over impass-able terrain where they were safe from the enemy, seen in Fig. 12b. These experiments saw the Blue Units using the terrain to their advantage to defeat a larger opposing team.
The algorithm was successful in finding a solution to the Stronghold scenario. All experiment runs resulted in a win for the Blue Team.
4.7 Urban warfare
In the Urban Warfare scenario, the prevalent tactic that evolved in experiments involves the Blue Units initially staying in a tight formation at the start of the sniper path, but out of range of the snipers, waiting for the mobile red units to attack them, seen in Fig. 13a. Once most of the red attackers are eliminated (Fig. 13b), some of the Blue Units take the safe path, avoiding the snipers and destroying the Red Bases, seen in Fig. 13c, d. Once the Red Bases are destroyed, blue makes no further attempt to target the snipers.
In this experiment the evolved behaviour was to avoid engaging with the snipers, as the blue Ranged Units, the only units that could target these snipers, were outnumbered. The behaviour where blue Ranged Units use their attack range and fire over the impass-able terrain was also observed, seen in Fig. 13a.
The algorithm was successful in finding a solution to the urban warfare scenario. In all twelve runs of the experiment, the best solution at the end of evolution resulted in the red units being destroyed, apart from the snipers which were avoided.
4.8 Land warfare
The Land Warfare scenario features a large map with a river system, modelled as impassable terrain (in green) and three points that offer the ability to cross. The dom-inant tactic involves the Blue Team splitting into a smaller group to defend from an initial attack from Red Units that start near the middle of the map, while the more sub-stantial blue team crosses the bridge to the right and work their way up to the top of the map. A small group of Ranged Units utilise the river for protection and attack a size-able red team from safety. The blue units regroup into one team and then eliminate the remaining Red Team and Bases.
This experiment presented a situation where some Blue Units were unable to pass a bridge without being eliminated by red Ranged Units. The Blue Units were unable to engage the red Ranged Units, so they sat idle outside of the red attacking range and waited for a group of blue Ranged Units to clear the bridge and make it safe to pass, seen in Fig. 14a. Some of the blue Ranged Units also utilised the terrain to their advantage by attacking over the river, seen in Fig. 14b. This experiment further demonstrated the utility of the Ranged Units and their ability to attack from a safe position. The approach was successful in finding a solution to the scenario. Out of the six experiments, two resulted in a win for the Blue Team, one resulted in a draw and three resulted in a loss.

Annals of Operations Research
1 3
4.9 Win/loss rates
A particular run of MicroRTS can result in one of three outcomes, win, draw or loss. Each outcome is defined from the perspective of the Blue Team as:
– Win
o The accessible red units who can attack and be attacked by all Blue Unit types, have been eliminated
o All Red Bases have been destroyedo There is at least one surviving Blue Unit
Fig. 13 Tactics evolved for the Urban Warfare scenario. (a) At the start, Blue Units remain in place, wait-ing for Red Units to come to them, (b) the Blue Team successfully defeats the first wave of red, (c) a single Blue Unit takes the safe path to destroy the Bases, and (d) the single Blue Unit destroys the remaining Bases, the other units remain idle

Annals of Operations Research
1 3
– Draw:
o The simulation ends with both the blue and Red Team surviving with accessible units or Bases
– Loss:
o The accessible blue units have been eliminatedo All Blue Bases have been destroyedo There is at least one surviving Red Unit
The outcomes for the solution with the highest fitness in each of the experiment runs are summarised in Table 8. This shows the number of evolutionary runs made for each experi-ment and how many of them resulted in the fittest solution winning, drawing or losing together with a calculated winning percentage. Note that here we class the Urban Warfare experiments as having a 100% win rate. Though red units remained at the end of all runs in this scenario, they consisted of the snipers that were in a location not accessible to the Heavy and Light Units.
Fig. 14 Tactics evolved in the Land Warfare scenario. (a) A small group of Blue units waiting idle for the red snipers (ranged units surrounded by impassable terrain at the crossing point) to be eliminated so they can safely cross the bridge. (b) Blue Ranged attacking over the river
Table 8 Outcomes of the best evolved blue for the set of experiment runs
Outcome of best evolved blue
Experimental scenario No Runs Win Draw Lose Win %
Plain terrain 12 8 4 0 66.7Choke point 16 15 0 1 93.75Stronghold 12 12 0 0 100Urban warfare 12 12 0 0 100Land warfare 6 2 1 3 50

Annals of Operations Research
1 3
4.10 Comparison to other approaches
To provide a point of comparison to the evolved behaviour tree blue team agents, the same scenarios were simulated using a number of alternative approaches to control the blue team. The approaches compared are summarised in Table 9.
The performance of each blue team controller on the scenarios is shown in the graphs of Figs. 15, 16, 17, 18 and 19. In each graph, the x-axis shows the amount of time through a run of the scenario simulation and the y-axis shows the corresponding fitness value. Fitness at a time step t is measured as the total blue team hit points at t, minus the total red team hit points at t, plus the total red team hit points at time step 0 (as the red team in each scenario starts with more hit points than the blue team the addition is performed to prevent fitness going below 0). From its initial value (equal to the blue team hit points at the start of the scenario), fitness goes up when the red team loses more hit points than the blue team and fitness goes down if the blue team loses more hit points than the red team in that time step.
As can be seen from the graphs, our evolved behaviour tree approach outperforms the others on all except the Urban Combat scenario, where the Naïve MCTS controller achieves the same outcome in terms of fitness and does so much earlier. As expected, the Custom Rush agent is typically the worst performer, as it attempts the same strategy that the red team is using, though it is vastly outnumbered and outmatched by the red team.
Interestingly, the other approaches fair much worse in the ‘sparse’ scenarios (plain ter-rain, choke point, land warfare) than they do in more complex environments (stronghold and urban warfare). Generally, the sparser the terrain, the more important it is that the blue team units work in a highly coordinated manner in order to defeat the much stronger oppo-sition team. This is because there is insufficient terrain to use as cover, so the units need to use each other for that purpose. For example, in our approach on the Plain Terrain sce-nario, a heavy blue unit could shield a blue ranged unit from attack, whilst moving in a pattern to prevent being targeted by red units. This type of behaviour can be evolved into the behaviour tree as a result of the ‘per node’ ticking approach that we chose, as was dis-cussed in Sect. 3.2. This could highlight the weakness in the other approaches, of not being able to discover such complex team behaviour using the simple set of primitive actions that are available in the game.
The ability to discover strategies that feature coordinated team work between blue units could also be the reason by our approach does better in the more complex environments. Although the other approaches do better here than in the sparse environments, the team-work aspect provides an extra edge in terms of overcoming the much stronger opposition force.
Though this comparison shows our approach outperforming the use of the comparison agents, it needs to be acknowledged that this comparison is not completely fair, in that the behaviour tree used by our agent has been specifically evolved for that scenario, whereas the other agents, whilst still having the ability to explore and learn from the scenarios they are placed in have been built with a more diverse range of scenarios in mind.
4.11 Scalability and computational resources required
The experiments were run across three types of computer:
– A 64-bit windows 7 laptop, i7-6820HQ CPU @2.70 GHz with 16.0 GB of RAM

Annals of Operations Research
1 3
Tabl
e 9
Blu
e te
am a
gent
s tha
t wer
e ru
n in
the
scen
ario
s to
prov
ide
com
paris
on
Blu
e te
am c
ontro
ller n
ame
App
roac
h us
edD
etai
ls
Cus
tom
Rus
hRu
shSa
me
as th
e ‘R
ush’
Red
Tea
m c
ontro
ller –
eac
h bl
ue u
nit a
ttack
s the
nea
rest
red
team
uni
tC
oacA
IW
inne
r of t
he 2
020
Mic
roRT
S A
I com
petit
ion
clas
sic
(ful
ly o
bser
vabl
e) tr
acks
. Ava
ilabl
e fro
m: h
ttps:
// lev
. pm
/ pos
ts/ 2
020-
09- 2
9- w
inni
ng- 2
020-
mic
ro rts
- com
pe tit
ion/
Portf
olio
Portf
olio
of S
trate
gies
Cho
oses
the
best
strat
egy
from
a p
ortfo
lio o
f har
d-co
ded
strat
egie
s. A
vaila
ble
with
Mic
roRT
S (O
ntañ
ón,
2013
)SC
VPo
rtfol
io o
f Stra
tegi
esU
ses v
otin
g to
com
bine
a se
t of s
tatic
beh
avio
urs i
nto
a str
ateg
y. A
vaila
ble
from
: http
s:// g
ithub
. com
/ rube
n so
lv/ S
CV
/ wik
iN
aïve
MC
TSM
onte
Car
lo T
ree
Sear
chO
ne o
f the
bas
elin
e ag
ents
use
d in
the
2020
Mic
roRT
S A
I com
petit
ion
– pl
aced
9th
and
7th
in th
e tw
o cl
assi
c tra
cks a
nd 5
th in
bot
h of
the
parti
al o
bser
vabi
lity
track
s. A
vaila
ble
with
Mic
roRT
S (O
ntañ
ón,
2013
)U
TC
Mon
te C
arlo
Tre
e Se
arch
Mon
te C
arlo
Tre
e Se
arch
usi
ng th
e U
pper
Con
fiden
ce b
ound
for T
rees
(UC
T) a
lgor
ithm
(Koc
sis &
Sze
-pe
svár
i, 20
06).
Ava
ilabl
e w
ith M
icro
RTS
(Ont
añón
, 201
3)U
TC U
nit A
ctio
nsM
onte
Car
lo T
ree
Sear
chA
noth
er fo
rm o
f UTC
Mon
te C
arlo
Tre
e Se
arch
. Ava
ilabl
e w
ith M
icro
RTS
(Ont
añón
, 201
3)B
T C
ontro
ller (
ours
)Ev
olve
d B
ehav
iour
Tre
eB
ehav
iour
tree
evo
lved
for e
ach
scen
ario
usi
ng o
ur a
ppro
ach

Annals of Operations Research
1 3
0
5
10
15
20
25
30
35
40
45
501 14 27 40 53 66 79 92 105
118
131
144
157
170
183
196
209
222
235
248
261
274
287
300
313
326
339
352
365
378
391
404
417
430
443
Fitn
ess
Time Step
Plain Terrain
Custom Rush CoacAI SCV
NaiveMCTS Por�olio BTController (ours)
UTC UTCUnitAc�ons
Fig. 15 Plot of fitness for each blue team controller evaluated, over a simulation of the Plain Terrain sce-nario – with fitness at each time step as blue team hit points at that timestep, minus red team hit points at that timestep plus red team hit points at time step 0
Fig. 16 Plot of fitness for each blue team controller evaluated, over a simulation of the Choke Point sce-nario

Annals of Operations Research
1 3
0
10
20
30
40
50
60
70
801 46 91 136
181
226
271
316
361
406
451
496
541
586
631
676
721
766
811
856
901
946
991
1036
1081
1126
1171
1216
1261
1306
1351
1396
1441
1486
1531
Fitn
ess
Time Step
Stronghold
Custom Rush CoacAI SCV
NaiveMCTS Por�olio BTController (ours)
UTC UTCUnitAc�ons
Fig. 17 Plot of fitness for each blue team controller evaluated, over a simulation of the Stronghold scenario
0
20
40
60
80
100
120
140
160
180
1 87 173
259
345
431
517
603
689
775
861
947
1033
1119
1205
1291
1377
1463
1549
1635
1721
1807
1893
1979
2065
2151
2237
2323
2409
2495
2581
2667
2753
2839
2925
Fitn
ess
Time Step
Urban Warfare
Custom Rush CoacAI SCV
NaiveMCTS Por�olio BTController (ours)
UTC UTCUnitAc�ons
Fig. 18 Plot of fitness for each blue team controller evaluated, over a simulation of the Urban Warfare sce-nario

Annals of Operations Research
1 3
– A 64-bit windows 8 laptop, i7-4700HQ CPU @2.40 GHz with 16.0 GB of RAM– A 64-bit windows 10 laptop, i7-7820HQ CPU @2.90 GHz with 32.0 GB of RAM
Each run of an experiment used a population size of 100 individuals, which equates to 100 evaluations (games in MicroRTS) per generation. Through load testing of the machines used for the runs we determined that five simultaneous evolutionary runs can be done on one machine (with 16 GB RAM) without a degradation in performance. Beyond five simultaneous runs, the capacity of physical RAM is exceeded, causing a slowdown in performance due to paging of memory from the hard disk.
During each experiment, the time taken varied widely, with the amount of variance dependent on the complexity of the experiment. The major bottleneck of the evolution-ary process is the evaluation runs. The variation in run times was due to the variety in the solutions being evaluated. An evaluation was terminated when one side won, or when the number of time units of the game exceeded 3000 (except for Land Warfare where 5000 war used). Examples of how individual solutions can hold up execution include strategies that do not actively engage the enemy, or engage the enemy in locations that involve significant time spent on traveling to the location. This increases simulation time as the red units have to travel to where the blue units. Some cases were also observed where the Blue Team eliminated the red fighting units but had not learnt to subsequently target the Red Bases. Over the generations until the Base targeting behaviour was learnt, the experiment slowed down significantly as most solutions took the maximum simulation time as blue units were idling with Red Bases still present.
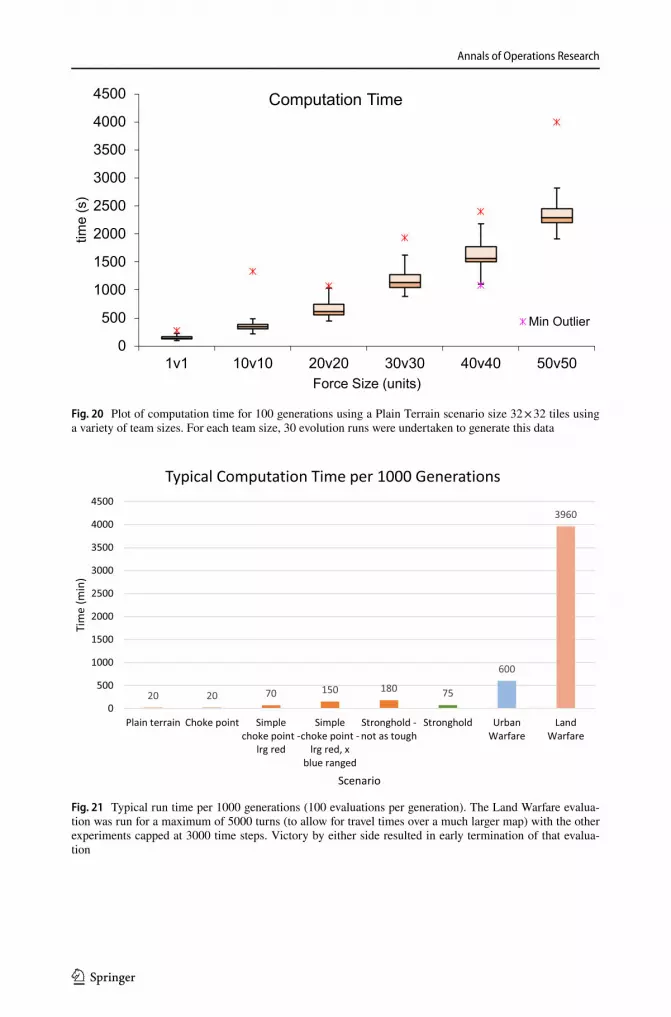
One factor that influences evaluation time is the number of units present. Figure 20 shows the computation time for a variety of team sizes (from 1vs 1 to 50v50) as a plot. Each box and whiskers set summarises 30 runs of that particular team size. All runs
Fig. 19 Plot of fitness for each blue team controller evaluated, over a simulation of the Land Warfare sce-nario
Annals of Operations Research
1 3
Fig. 20 Plot of computation time for 100 generations using a Plain Terrain scenario size 32 × 32 tiles using a variety of team sizes. For each team size, 30 evolution runs were undertaken to generate this data
Fig. 21 Typical run time per 1000 generations (100 evaluations per generation). The Land Warfare evalua-tion was run for a maximum of 5000 turns (to allow for travel times over a much larger map) with the other experiments capped at 3000 time steps. Victory by either side resulted in early termination of that evalua-tion

Annals of Operations Research
1 3
were performed using a plain terrain scenario of size 32 × 32, population size of 100 for a total of 100 generations (producing 10,000 Micro RTS runs) with both mutation and crossover rates set to 0.6. Each run for a particular team size differed by the random number seed, resulting in a different initial population.
The typical time to complete 1000 generations of an evolution run (with 100 indi-viduals in the population) is given in Fig. 21 for the scenarios. The land warfare runs were by far the slowest, due to a much larger terrain, greater number entities, and also a longer maximum simulation time per game, so as to allow for the travel time units need to traverse the larger terrain between the objectives (Red Bases) placed on it.
The experiments in this project were run for a maximum of 20,000 generations with a population size of 100, equating to two million MicroRTS games. The typical length in hours to complete a scenario is listed in Table 10.
A key factor to consider when increasing the complexity of the scenario, besides the increase in evaluation time for a particular solution, is the increased complexity of the search space that this entails. Practically, this has an impact on the number of genera-tions (assuming a fixed population size) needed to adequately explore the search space in order to find optimal solutions, and also on the number of runs needed, as each run may converge to a different optimal solution. Consider the fitness plots shown in Fig. 22 for three runs of the land warfare experiment. The maximum possible fitness for this scenario is 382 (all Red Units eliminated with no Blue Units damaged). The blue line shows the fitness of the best individual in each generation, whilst the red line shows the average fitness of each generation. The average fitness fluctuates and does not con-verge to the best due to the effect of mutation altering individuals as part of the search process. Looking at the best fitness, it does not achieve the theoretical maximum in any of the three runs with (a) and (b) indicating that the fitness is trending in an upward direction and has not plateaued by generation 10,000, indicating that running the algo-rithm beyond 10,000 generations may be worthwhile. The graph in (c) was purposefully chosen here to give an example of a run where a good optimal solution is not found. If only looking at (c) in isolation, the conclusion may be reached that no better solution than the one found early on in the evolution exists. This underscores the importance of multiple experiment runs for each scenario and continuing the evolution to explore for even better solutions.
The above can be compared to the much simpler Plain Terrain scenario. Here 12 runs of the experiment were run (differing by mutation and crossover probabilities) for 20,000 generations. Of the 12, three achieved the maximum possible fitness of 45, two a fitness of 43, two a fitness of 41 and five a fitness of 40. Of the 12 runs, eight achieved their maximum fitness in under 10,000 generations, including two of the three runs that achieved a fitness of 45.
Table 10 Typical experiment completion time
Scenario Time (h)
Plain terrain 7Choke point 7Stronghold 25Urban warfare 200 (8.3 days)Land warfare 1320 (55 days)

Annals of Operations Research
1 3
Fig. 22 Fitness plots for three separate runs (a, b and c) of the Land Warfare scenario evolutionary pro-cess. Average and Best fitness are shown for each generation. The figure illustrates that a single run may not result in finding the optimal fitness, necessitating multiple runs. In (a) a high fitness is achieved early, whereas (b) shows a run where fitness steadily increases across the run, while a fitness at a level found in (a) and (b) is not found at all in (c)

Annals of Operations Research
1 3
5 Limitations and future work
Whilst we have demonstrated our approach can address a variety of scenarios to yield com-petitive results in regards to the demonstrated blue team strategy, there is scope for further investigation into various aspects on the path to a complete solution to discovering optimal strategies in realistic wargaming scenarios. In this section we discuss some of the limita-tions of the work and identify future work that can be undertaken to resolve these.
One limitation is that our evaluation has focused on static scenarios, with a simplified non-changing terrain, with the red team employing simple reactive behaviour, with limited variability. This was a simplification made in order to cut the run time of the simulation so that we could focus on demonstrating our approach without the burden of optimisation and scaling. To compensate for the simplicity of the red team tactics, we chose to give the red team much higher strength than the blue team (in terms of number of units, total hit point and total attack strength). Future work could focus on increasing the fidelity of the simula-tion and the sophistication of the red team AI, which will invariably lead to the issue of optimisation, which is discussed next.
The computational time issues can be somewhat addressed due to the scalable nature of evolutionary approaches. In addition to multiple simultaneous scenario runs, the evalu-ation of a generation can also be parallelised. Though we have not done so in this project, each run of MicroRTS to evaluate an individual is independent of the other runs, thus a multiprocessor environment can be employed, where the 100 (or however many) individu-als in a population are evaluated simultaneously on 100 processors during the time it would normally take for one evaluation, plus communication overhead.
Another factor that can mitigate lengthy evolution time for new scenarios is the use of an initial population that is not completely random. In addition to some random individu-als, strong individuals evolved against other scenarios, or in fact human-developed solu-tions, can be injected into the starting population. If these turn out to be promising in the new scenario they will be selected for subsequent generations and through the process of crossover, aspects of these strong solutions can make their way into other individuals. Through the process of mutation, the individuals themselves can be adapted to the scenario that is being evolved for.
Besides purely computational cost considerations, an important avenue for further work is to investigate the relationship between aspects of the simulation and actual warfare to determine what the simulation needs to model and to what fidelity. Whilst there are seem-ingly many similarities between RTS games and actual warfare scenarios, the broad success of developing automated players for RTS games does not necessarily translate to actual scenarios. Broadly, the major difference is that an AI player for a game can be developed and tested specifically for that game, whereas a combat AI that has been developed using a simulation as a proxy for real combat will not necessarily work in the actual environment.
Examining and including uncertainty is a particular aspect for consideration in future work. In strategic planning, uncertainty can be categorised into four levels (Courtney et al., 1997), including: Level 1—‘A clear enough future’, Level 2—‘Alternate futures’, Level 3—‘A range of futures’ and 3—‘True ambiguity’. Defence planning typically focuses on Level 2, evaluating capability against a discrete set of possible future scenarios, such as the Australian Capability Context Scenarios (ACCS). Modelling and simulation has also been attempted to reach Level 3, for example Bowden et al. (2015) suggest starting with the ACCS scenarios to map the space of possible futures in which a given set of capabilities can achieve success withing a set level of risk. In a simulation-based context this type of

Annals of Operations Research
1 3
continuous uncertainty can be modelled by the variables in the scenario having a range of values, with a given blue team strategy evaluated based on its robustness. These variables could encompass variability in red team tactics, the blue team level of situational aware-ness, and variability in the environment (e.g. different weather conditions) among others.
6 Conclusion
In this paper, the evolution of behaviour trees for the discovery of optimal combat behav-iour has been explored. The approach explored uses genetic programming which allows behaviour trees to evolve from a set of provided condition and action nodes. Behaviour trees from one generation were then used as agent controllers in a multi-agent simulation to evaluate them, with the fitness used to select the next generation, subject to the evolution-ary operators of mutation and crossover. Through a set of scenarios devised, we have dem-onstrated that complex behaviour can emerge from a small set of primitive actions.
The approach was successfully demonstrated through a set of experiments to evolve a Blue Team against a static reactive AI Red Team opponent. The resulting evolved Blue Team behaviour in the test scenarios could exploit the properties of the scenario, employ tactics that are known to be optima, and lead to victory. In particular:
• Units learn to work together in synchronisation—e.g. a combination of Heavy (armor) and Ranged (artillery) units.
• Units in a relatively weak blue side learned to exploit a choke point in the terrain to defeat a larger Red Team employing a rush behaviour tactic.
• Blue units learn to protect a Base situated in a stronghold surrounded by a red side by surrounding their Base and firing over the terrain to avoid direct engagement.
• Units learn to avoid dangerous sections of terrain, such as those protected by enemy snipers.
• Units learn to avoid contact until necessary utilising various strategies—for example, enveloping a bridge protected by snipers from both sides to maximise chance of elimi-nating them.
The advantages of using evolution is the ability to search a large space with local optima, and through a number of runs find solutions that are promising. The disadvan-tage is the high computation time when simulation-based evaluation is involved. This can be mitigated through the exploitation of the parallelism of the problem, where candidate solutions can be evaluated independently and through techniques such as initial population seeding.
Acknowledgements This research is supported by the Defence Science and Technology Group, Australia under the Modelling Complex Warfighting Strategic Research Investment. We would like to thank Matthew Burr who worked on the implementation of the approach.
Author’s contributions All authors contributed to the study conception and design. Material preparation, data collection and analysis were performed by Luke Kelly, Martin Masek and Chiou Peng Lam. The first draft of the manuscript was written by Martin Masek and all authors commented on previous versions of the manuscript. All authors read and approved the final manuscript.
Funding This research was funded by the Defence Science and Technology Group, Australia under the Modelling Complex Warfighting Strategic Research Investment.

Annals of Operations Research
1 3
Availability of data and material The datasets generated during and/or analysed during the current study are not publicly available.
Code availability The code generated during the current study is not publicly available.
Declarations
Conflict of interest The authors have no conflict of interest / competing interests to report.
Ethics approval The project does not include human or animal participants—it was approved through the Edith Cowan University Ethics Declaration Process.
Consent to participate Not Applicable—no human or animal participants were used in this work.
Consent for publication Not Applicable—no human or animal participants were used in this work.
Open Access This article is licensed under a Creative Commons Attribution 4.0 International License, which permits use, sharing, adaptation, distribution and reproduction in any medium or format, as long as you give appropriate credit to the original author(s) and the source, provide a link to the Creative Com-mons licence, and indicate if changes were made. The images or other third party material in this article are included in the article’s Creative Commons licence, unless indicated otherwise in a credit line to the material. If material is not included in the article’s Creative Commons licence and your intended use is not permitted by statutory regulation or exceeds the permitted use, you will need to obtain permission directly from the copyright holder. To view a copy of this licence, visit http:// creat iveco mmons. org/ licen ses/ by/4. 0/.
References
Baker, J. E. (1987). Reducing bias and inefficiency in the selection algorithm. In Proceedings of the second international conference on genetic algorithms (Vol. 206, pp. 14–21).
Berthling-Hansen, G., Morch, E., Løvlid, R. A., & Gundersen, O. E. (2018). Automating behaviour tree generation for simulating troop movements (poster). In 2018 IEEE conference on cognitive and com-putational aspects of situation management (CogSIMA) (pp. 147–153). IEEE. https:// doi. org/ 10. 1109/ COGSI MA. 2018. 84239 78.
Bowden, F. D., Pincombe, B. M., & Williams, P. B. (2015). Feasible scenario spaces: A new way of measur-ing capability impacts. MODSIM2015, 836–842.
Courtney, H., Kirkland, J., & Viguerie, P. (1997). Strategy under uncertainty. Harvard Business Review, 75(6), 67–79.
Deb, K., Agrawal, S., Pratap, A., & Meyarivan, T. (2000). A fast elitist non-dominated sorting genetic algo-rithm for multi-objective optimization: NSGA-II. In International conference on parallel problem solving from nature (pp. 849–858). Springer, Berlin, Heidelberg.
Evensen, P., Stien, H., & Helge Bentsen, D. (2018). Modeling battle drills for computer-generated forces using behavior trees. In Interservice/industry training, simulation, and education conference (I/ITSEC), Orlando, Florida, November 2018.
Gajurel, A., Louis, S. J., Méndez, D. J., & Liu, S. (2018). Neuroevolution for RTS micro. In 2018 IEEE con-ference on computational intelligence and games (CIG) (pp. 1–8). IEEE.
Gupta, S., Modgil, S., Bhattacharyya, S., & Bose, I. (2021). Artificial intelligence for decision support sys-tems in the field of operations research: Review and future scope of research. Annals of Operations Research. https:// doi. org/ 10. 1007/ s10479- 020- 03856-6
Hoff, J. W., & Christensen, H. J. (2016). Evolving Behaviour Trees:-Automatic Generation of AI Opponents for Real-Time Strategy Games (Master’s thesis, NTNU).
Hullett, K., & Whitehead, J. (2010). Design patterns in FPS levels. In Proceedings of the fifth international conference on the foundations of digital games (pp. 78–85). ACM.
Isla, D. (2005). Handling complexity in the Halo 2 AI, In Game developer conference 2005, international game developers association, San Francisco.

Annals of Operations Research
1 3
Juan, A. A., Faulin, J., Grasman, S. E., Rabe, M., & Figueira, G. (2015). A review of simheuristics: Extend-ing metaheuristics to deal with stochastic combinatorial optimization problems. Operations Research Perspectives, 2, 62–72.
Juan, A. A., Keenan, P., Martí, R., McGarraghy, S., Panadero, J., Carroll, P., & Oliva, D. (2021). A review of the role of heuristics in stochastic optimisation: From metaheuristics to learnheuristics. Annals of Operations Research. https:// doi. org/ 10. 1007/ s10479- 021- 04142-9
Kocsis, L., & Szepesvári, C. (2006). Bandit based monte-carlo planning. In European conference on machine learning (pp. 282–293). Springer, Berlin, Heidelberg.
Koza, J. (1992). Genetic programming: On the programming of computers by means of natural selection. MIT Press.
Lam, C. P., Masek, M., Kelly, L., Papasimeon, M., & Benke, L. (2019). A simheuristic approach for evolv-ing agent behaviour in the exploration for novel combat tactics. Operations Research Perspectives, 6, 100123.
Lim, C. U., Baumgarten, R., & Colton, S. (2010). Evolving behaviour trees for the commercial game DEFCON. In European conference on the applications of evolutionary computation (pp. 100–110). Springer, Berlin, Heidelberg. https:// doi. org/ 10. 1007/ 978-3- 642- 12239-2_ 11
Masek, M., Lam, C. P., Kelly, L. & Wong, M. (2019). Evolving behaviour trees for automated discovery of novel combat strategy in real-time strategy wargames. In S. Elsawah (Ed.), MODSIM2019, 23rd inter-national congress on modelling and simulation. Modelling and Simulation Society of Australia and New Zealand, December 2019, pp. 277–283.
Ontañón, S. (2013). The combinatorial multi-armed bandit problem and its application to real-time strategy games. AIIDE, 2013, 58–64.
Ontanón, S., Synnaeve, G., Uriarte, A., Richoux, F., Churchill, D., & Preuss, M. (2013). A survey of real-time strategy game AI research and competition in starcraft. IEEE Transactions on Computational Intelligence and AI in Games, 5(4), 293–311. https:// doi. org/ 10. 1109/ TCIAIG. 2013. 22862 95
Osman, I. H., & Laporte, G. (1996). Metaheuristics: A bibliography. Annals of Operations Research, 63, 511–623. https:// doi. org/ 10. 1007/ BF021 25421
Perez, D., Nicolau, M., O’Neill, M., & Brabazon, A. (2011). Reactiveness and navigation in computer games: Different needs, different approaches. In Paper presented at the 2011 IEEE conference on com-putational intelligence and games (CIG’11), Seoul, South Korea, August 31st-September 3rd 2011. (pp. 273–280) IEEE. https:// doi. org/ 10. 1109/ CIG. 2011. 60320 17
Robertson, G., & Watson, I. (2014). A review of real-time strategy game AI. AI Magazine, 35(4), 75–104. https:// doi. org/ 10. 1609/ aimag. v35i4. 2478
Robertson, G., & Watson, I. (2015). Building behavior trees from observations in real-time strategy games. In 2015 International symposium on innovations in intelligent systems and applications (INISTA) https:// doi. org/ 10. 1109/ INISTA. 2015. 72767 74
Togelius, J., Karakovskiy, S., Koutník, J., & Schmidhuber, J. (2009). Super mario evolution. In 2009 IEEE symposium on computational intelligence and games (pp. 156–161). IEEE.
Vinyals, O., Babuschkin, I., Czarnecki, W. M., Mathieu, M., Dudzik, A., Chung, J., Choi, D. H., Powell, R., Ewalds, T., Georgiev, P., Junhyuk, O., Horgan, D., Kroiss, M., Danihelka, I., Huang, A., Sifre, L., Cai, T., Agapiou, J. P., Jaderberg, M., … Silver, D. (2019). Grandmaster level in StarCraft II using multi-agent reinforcement learning. Nature, 575(7782), 350–354. https:// doi. org/ 10. 1038/ s41586- 019- 1724-z
Publisher’s Note Springer Nature remains neutral with regard to jurisdictional claims in published maps and institutional affiliations.