Embed Size (px)
Citation preview
First Monday, Volume 17, Number 3 - 5 March 2012
Recent improvements in effectiveness and accuracy of the emerging field of automated deceptiondetection and the associated potential of language technologies have triggered increased interest inmass media and general public. Computational tools capable of alerting users to potentially deceptivecontent in computer–mediated messages are invaluable for supporting undisrupted, computer–mediated communication and information practices, credibility assessment and decision–making. Thegoal of this ongoing research is to inform creation of such automated capabilities. In this study we elicita sample of 90 computer–mediated personal stories with varying levels of deception. Each story has 10associated human deception level judgments, confidence scores, and explanations. In total, 990 uniquerespondents participated in the study. Three approaches are taken to the data analysis of the sample:human judges, linguistic detection cues, and machine learning. Comparable to previous researchresults, human judgments achieve 50–63 percent success rates, depending on what is considereddeceptive. Actual deception levels negatively correlate with their confident judgment as being deceptive(r = -0.35, df = 88, ρ = 0.008). The highest-performing machine learning algorithms reach 65 percentaccuracy. Linguistic cues are extracted, calculated, and modeled with logistic regression, but are foundnot to be significant predictors of deception level, confidence score, or an authors’ ability to fool areader. We address the associated challenges with error analysis. The respondents’ stories andexplanations are manually content–analyzed and result in a faceted deception classification (theme,centrality, realism, essence, self–distancing) and a stated perceived cue typology. Deception detectionremains novel, challenging, and important in natural language processing, machine learning, and thebroader library information science and technology community.
Contents
IntroductionStudy objectivesBackgroundData collection methodsData analysis methodsResultsDiscussionConclusions and future work
A half truth is a whole lie.Yiddish proverb
The trouble with lying and deceiving isthat their efficiency depends entirely
upon a clear notion of the truth that theliar and deceiver wishes to hide.
Hannah Arendt (1906–1975)
Introduction
Recently mass media has shown acute interest to the topic of discerning truth from deception incomputerized ways. This interest may be explained by recent advances in the research and
Rubin http://firstmonday.org/ojs/index.php/fm/rt/printerFriendly/3933/3170
1 of 21 11/20/2013 8:55 AM
development of automated deception detection with natural language processing (NLP) and machinelearning techniques. In a recent CBC interview, a computer science student from MIT’s Media Labdeclared his intention to develop “a kind of spell checker for facts”, called “Truth Goggles”. They areimagined to be an automated version of Truth–O–Meter (politifact.com) which is a fact–checking toolpowered by the research of many journalists cross–referencing statements made by high–profilepoliticians, statesmen, celebrities (CBC, 2011). A recent article in the New York Times Business Daysection highlights research of several prominent figures in the computational speech community [1](Julia Hirschberg, Columbia University; Dan Jurafsky and David Larcker, Stanford; Shrikanth Narayanan,University of Southern California; Eileen Fitzpatrick, Montclair State University) who are “pars[ing]people’s speech for patterns that gauge whether they are being honest” and “training computers torecognize hallmarks of what they call emotional speech — talk that reflects deception, anger,friendliness and even flirtation” (Eisenberg, 2011). The envisioned potential outcomes of these cuttingedge computational abilities are suggested:
“Programs that succeed at spotting these submergedemotions may someday have many practical uses: softwarethat suggests when chief executives at public conferencesmay be straying from the truth; programs at call centers thatalert operators to irate customers on the line; or software atcomputerized matchmaking services that adds descriptiveslike ‘friendly’ to usual ones like ‘single’ and ‘female’.”
With the increasing use of computer–mediated communication (CMC) in all aspects of modern life,deception detection in CMC has emerged as an important issue in everyday communications, and is nowof interest within the broad library and information science field. Deception is potentially disruptive ineveryday communication, information seeking, and decision–making. Rubin (2010) positions the studyof deception in library and information science and technology (LIS&T) alongside its positively–chargedcounterparts — trust, credibility, certainty, and authority, and affirms automated deception detection asa recently attainable contribution from natural language processing (NLP) and machine learning.Deception is defined in CMC as “a message knowingly and intentionally transmitted by a sender tofoster a false belief or conclusion by the perceiver” (Rubin [2010]; synthesized from Buller andBurgoon, 1996; Zhou, et al., 2004). Rubin (2010) argues that although largely socially condemned,deception is widespread and often undetected, especially in electronic environments where credibilityassessments are difficult due to absence of many traditional cues such as verifiable credentials orface–to–face contact. The need arises for decision support tools capable of alerting users to potentiallydeceptive content:
Tools to detect deceit from language use. pose a promisingavenue for increasing the ability to distinguish truthfultransmissions, transcripts, intercepted messages, informantreports and the like from deceptive ones. [2]
Human language technologies (used here synonymously with NLP) are said to be “dramaticallyimproving in their effectiveness and accuracy, which is accompanied by a significant expansion of theHLT community itself” (Wyner and Branting, 2011). A new specialized workshop is put forward as a partof the 2012 Conference of the European chapter of the Association for Computational Linguistics calling,with great optimism, upon new methods in the area, and announcing “a relatively new area of appliedcomputational linguistics that has broad applications in business fraud and online misrepresentation, aswell police and security work” (European chapter of the Association for Computational Linguistics[EACL], 2012).
To inform the creation of such emerging deception detection tools, our current study uses a trainingdataset and a variety of analytic techniques and metrics to investigate predictors of deception, asexpressed in subjective participant explanations and, more importantly, in the objective content of thetexts. We draw on our expertise in the related area of subjectivity and sentiment analysis or opinionmining (see Pang and Lee [2008] for an overview). In particular, the first author’s previous experienceis in emotion identification (Rubin, et al., 2004), analysis of statement certainty levels (absolute, high,moderate, low or uncertain) (Rubin, 2007; 2010a), weblog credibility assessment (Rubin and Liddy,2006), identification of trust and distrust (Rubin, 2009), and selective manual blog mining ofserendipitous accounts (Rubin, et al., 2011). Our previous studies model and acquire “reliable cues forrecognizing complex phenomena which are, at least partly, expressed through language” in order toimprove access to information by developing methods for applications that can approach human–likeunderstanding of texts through NLP (Language & Information Technology Research Lab, 2012).
The remainder of this paper is structured as follows. First, we outline the study goals within text-basedCMC environments and provide a literature overview focusing on both human and automated abilities todiscern truths from lies [3]. Then, we describe our dataset elicitation procedures, introduce theexperiments with the use of human judgments as a benchmark, and overview our methods, techniques,and measures. We conclude with error analysis that allows us to create the deception classification. Wereflect upon encountered challenges, provide alternative paths towards solving the problem ofautomated deception detection. We start with a set of research objectives.
Rubin http://firstmonday.org/ojs/index.php/fm/rt/printerFriendly/3933/3170
2 of 21 11/20/2013 8:55 AM
Study objectives
In order to be able to discern deceptive messages from truthful ones automatically, we require a) anelicitation technique for obtaining samples of both deceptive and truthful messages in CMC; b) “goldstandard” results for comparisons of best human efforts to automated attempts for the sample dataset;c) analytical methods (including detection cues) capable of discerning one type of messages fromanother; and, d) although outside of the scope of this article, algorithms re–creating analytical methodsand developed language models. Using these steps in the research process as a guideline, we aim toanswer the following research questions that enable successful development of techniques for deceptiondetection:
1. Does eliciting data in CMC impact the results of deceptiondetection (by humans or algorithmically)?
2a. How well do human judges perform their task of lie–truthdiscrimination in CMC?2b. Given two conditions for the task of discernment — a setof truthful and a set of deceptive messages, which ones arehuman judges better at identifying (with the least amount offalse positive and false negatives)?
3. How do two automated types techniques (machine learningalgorithms and linguistic feature extraction) compare amongthemselves, and to the human “gold standard”?
4. And, how feasible is the automation of the discovereddifferences?
In this study we reflect on each necessary step, as we create the sample dataset, and subject it tocomparative analysis automatically and with human judges, highlighting practical and conceptualdifficulties. The following section provides background on the topic. We review select relevant studies:summarizing the current theory on human abilities to discriminate truths from deception, the recentachievements in automated deception detection, and setting new conceptual points of interest forempirical explorations and automation efforts.
Background
Lie–truth discrimination by human judges
When deceptive behaviors (both verbal and non-verbal) are studies in the fields of interpersonalpsychology and communication, respondents are typically asked to distinguish deceptive statementsfrom truthful ones, in a so–called “lie–truth discrimination task”. The outcome the research hasrepeatedly shown is that people are generally not very good at distinguishing between truthful anddeceptive statements (Vrij, 2000). On average, when scored for accuracy, people succeed only abouthalf of the time (Frank, et al., 2004). In a meta“analytical review of over 100 experiments with over1,000 participants, DePaulo, et al. (1997) determined an unimpressive mean accuracy rate of 54percent, slightly above chance. In this study, we replicate an overall accuracy since human judges serveas a “gold standard” or a benchmark for comparison in the overall task and comparing the rate of “falsepositive” answer: are respondents more likely to err when stories are truly truthful, or when they arereally deceptive.
People may not be that successful in distinguishing lies, nonetheless, present studies that examinecommunicative behaviors suggest that liars may communicate in qualitatively different ways fromtruth–tellers. In other words, the current theory specifies that there may be stable differences inbehaviors of liars versus truth tellers, and that the differences should be especially evident in the verbalaspects of behavior (Ali and Levine, 2008). Of the three broad categories of perceivable differences —verbal, auditory and visual cues — the visual cues are least reliable (potentially due to distractions andmisinterpretations) (Wiseman, 1995). “[L]iars can be reliably identified by their words — not by whatthey say but by how they say it” (Newman, et al., 2003). In text–based CMC environments, verbal cuesmight be the only kind of cues available to human judges, and after all, those who intend to deceivehave to accomplish their task of through language.
The reasons for systematic differences between truthful messages and deceptive messages have beenaccounted by the widely accepted four–factor theory of deception (Zuckerman, et al., 1981):
Rubin http://firstmonday.org/ojs/index.php/fm/rt/printerFriendly/3933/3170
3 of 21 11/20/2013 8:55 AM
... relative to a truthful baseline, deception is characterized bygreater arousal, increased emotionality (e.g., guilt, fear ofdetection), increased cognitive effort, and increased effort atbehavioral control. Because message veracity affects theseinternal psychological states, and because each of thesestates is behaviorally “leaked,” observable behavioraldifferences are expected. Further, statement validity analysis(see Köhnken, 2004; Vrij, 2000) and reality monitoring (seeSporer, 2004; Vrij, 2000) approaches presume that truthfuland deceptive accounts will systematically differ because ofdifferences between true memories and fabricated stories. Forexample, the language used to describe an authentic memoryshould be higher in imagery, emotional connotation, andcontextual information than that describing an imaginedevent. [4]
The efforts are focused on finding cues that are unconsciously revealed during communication, the kindsof cues that might “leak” the deceptive character of messages.
The idea that “statements that are the product of experiencewill contain characteristics that are generally absent fromstatements that are the product of imagination” is historicallyknown as Undeutsch Hypothesis ((Undeutsch, 1967) as citedin Fornaciari and Poesio (2011). [5]
Linguistic predictors of deceptive messages
There is a substantial body of research that seeks to compile, test, and cluster predictive cues fordeceptive messages. There is no general agreement on an overall reliable set of predictors. Burgoon, etal. (2003) state:
Decades of research have confirmed that there are fewindicators of deceit that remain invariant across genres ofcommunication, situations, communicators, cultures, andother features of communication contexts. [5]
Ali and Levin (2008) echo this concern:
Thus, the published research on verbal clues to deceptionreports numerous statistically significant differences, but thefindings do not seem to replicate across studies. To the extentthat systematic linguistic–based deception cues exist,evidence for their existence seems clouded by the presence ofsituational moderators. [6]
Situational contexts for baseline truthful texts are often drastically different, complicating directcomparisons. For instance, in an analysis of synchronous text–based communication, deceiversproduced more total words, more sense–based words (e.g., seeing, touching), and used fewerself–oriented but more other–oriented pronouns when lying than when telling the truth (Hancock, et al.,2008). Compared to truth–tellers, liars showed lower cognitive complexity, used fewer self–referencesand other references, and used more negative emotion words (Newman, et al., 2003). In the analysis ofconference calls in a financial area, Larcker and Zakolyukina (2010) found deceptive statements to havemore general knowledge references and extreme positive emotions, and also fewer self–references,extreme negative emotions, as well as certainty and hesitation words. In an interrogation context,Porter and Yuille (1996) found three significantly reliable, verbal indicators of deception (out of the 18verbal cues derived from Statement Validity Analysis techniques used in law enforcement for credibilityassessments): amount of detail reported, coherence, and admissions of lack of memory. In their mocktheft experiment study, Burgoon and colleagues (2003) did not show statistically significant differencesbetween deceptive and truthful texts, but they were able to identify a trend from profile plots:
... deceivers’ messages were briefer (i.e., lower on quantity oflanguage), were less complex in their choice of vocabularyand sentence structure, and lack specificity or expressivenessin their text–based chats. This is consistent with profilesfound in non–verbal deception research showing deceiverstend to adopt, at least initially, a fairly inexpressive, rigidcommunication style with “flat” affect. It appears that theirlinguistic behavior follows suit and also demonstrates theirinability to create messages rich with the details andcomplexities that characterize truthful discourse. Over time,deceivers may alter these patterns, more closelyapproximating normal speech in many respects. But it is
Rubin http://firstmonday.org/ojs/index.php/fm/rt/printerFriendly/3933/3170
4 of 21 11/20/2013 8:55 AM
possible that language choice and complexity may fail toshow changes because deceivers are not accessing realmemories and real details, and thus will not have the sameresources in memory upon which to draw. [7]
With more evidence for statistically reliable combinations of individual verbal cues as indicators underappropriate conditions, human abilities to flag deceptive messages can at least be complemented, if notenhanced, by automated tools based on natural language processing and probabilistic techniques. Themost valued cues are those that are the least context–sensitive, and can be subjected to statisticalanalyses for probabilistic estimates of deception, and hence, most amenable to automation.
Limitations of current automated deception detection
In the last decade that several studies have undertaken the task of automatically identifying linguisticcues, other studies utilize pre–existing predictors of deception for a binary truth–lie text categorizationtask as another way of automated deception detection. The task is considered to be challenging(DePaulo, et al., 1997). It turns out that combining cues may have good predictive abilities in specifiedcontexts (Vrij, 2000). Zhou, et al. (2004) used nine clusters of 27 linguistic cues such as diversity,complexity, specificity, and non-immediacy. When implemented in decision support tools, threestandard classification algorithms (neural nets, decision trees, and logistic regression) achieved 74percent accuracy (Fuller, et al., 2009). Another approach adapted an existing psycholinguistic lexicon,reaching an average 70 percent classifier accuracy (Mihalcea and Strapparava, 2009).
Achieving decent predictive ability comes at a price of non–generalizability. When creating a testdataset by eliciting truthful and deceptive messages from study participants, researchers need tospecify the context, the topic, the message format and length, restricting experiments to fairly rigid‘incubator environments’. For instance, Mihalcea and Strapparava (2009) who specified the context of adebate in which opinions are argued, chose three popular topics, such as the pro–life versuspro–abortion argument, and asked the participants to argue for their true point of view as well as theopposing one. The latter would inevitably be deceptive since it would not match their true beliefs. In ourcurrent study, we leave the context and topic of the elicited personal stories intentionally open–ended,simply asking participants for a story rich in details and specifying a suggested length.
Previously discussed studies flag the presence of general deceptiveness within a message. One study isunique in the sense of adding a finer level of granularity — which propositions may be deceptive. Usinga corpus of criminal statements, police interrogations and legal testimonies, Bachenko, et al. (2008)manually annotated each proposition in text for its truth or falsity. Their classification and regressiontree–based automatic tagger performed well on test data (average 68.6 percent recall and 85.3 percentprecision) when compared to the performance of human taggers on the same subset. We see a greatpotential at distinguishing deception within finer discourse levels, such as individual sentences, partialstatements, or phrases, and calls for further research in this direction. For instance, an e–mailsolicitation from a company representative may be truthful about the company name and location aswell as the fact of a promotional sale, but may conceal or obscure the sale conditions or return policies.Our study re–defines the task of deception detection at a within–message level with the goal ofidentifying what message segments might exactly be deceptive, and in what respect.
Another finer level of granularity in deception detection analysis may come from the gradations of truthsand lies. In the context of credibility assessments in law enforcement, participants were asked to use anon–binary distinction by providing either a truthful alibi, a partially deceptive account, a completelyfalse alibi, or a truthful confession regarding theft (Porter and Yuille, 1996). There are currently noautomatic deception detection studies, to the best of our knowledge, addressing the possibility ofdistinguishing discrete, non–binary degrees of truth. Neither do the above discussed automaticdetection studies attempt to decipher the nature of deceptive content in texts.
To summarize, the above automated approaches show promise in distinguishing deception, even atsomewhat better rates than humans. In this study we further explore the phenomenon of qualitativedifferences between deceptive and truthful messages, their perception by human judges and linguisticcue predictive abilities under an unspecified context or message topic in CMC environments.Acknowledging the extreme difficulty in the binary prediction task, our study raises the issues ofnon–binary deception categorization and scales, as well as the categorization of types of deceptioncontent. Such questions pose further challenges in the field of automated deception detection, and weattempt to explore various degrees of deception on the truth–deception continuum, and increase ourunderstanding of the phenomenon by categorizing dimensions of context–based variability withinmessages.
Data collection methods
Deceptive story elicitations (Phase 1)
Rubin http://firstmonday.org/ojs/index.php/fm/rt/printerFriendly/3933/3170
5 of 21 11/20/2013 8:55 AM
In Phase 1 of this study, we elicited personal stories using Amazon’s online survey service, MechanicalTurk (www.mturk.com). The data collection instrument requested each respondent to write a richunique short story which may be completely truthful, or contain some degree of deception. Eachcontributing respondents rated his or her message with a deception level using a Likhert scale of 1(completely truthful) through 7 (completely deceptive). Examples below illustrate the two extremes:
Example 1 (self–rank 1 = completely truthful): “Once Iaccidentally ate my own tooth. I had a leftover baby tooththat hadn’t come out when the adult one grew in — it just gotpushed to the inside — and it had been wearing away in mymouth for a while. One day when I was eating some chickennuggets, I bit down on something hard. I thought it was acrunchy bit of chicken breading, so I chewed it up. A minutelater I tasted blood, and realized my gum was bleeding. Igasped and said, “I think I just ate my tooth!” My family, whoI was sitting with, were aghast and disgusted. But I was gladthat I wouldn’t have to have the tooth pulled out by adentist.”
The contributor comments: “It was all true, but it is the mostbizarre story I can think of from my life, so I thought it wouldbe a fun one to share.” (1NU1Y5QJR ...)
Example 2 (self–rank 7 = completely deceptive): “TodayI almost got in a wreck on the highway. A guy in a big jackedup pickup truck was driving stupidly fast, weaving in and outof traffic and being totally. I could see in my mirror that waswaving his hands around and flipping people off, so I tried toget out of his way as fast as I could. But someone elsechanged lanes right at that moment so I couldn’t get over, sothe truck guy zoomed up and tailgated me, then roared pastme on the right. Then he cut back over right in front of me,but there wasn’t actually enough room for him to do it, so Ihad to slam on brakes to keep him from tearing my frontbumper off! I’m still kind of shaking a little just thinkingabout it.”
The contributor explains: “The whole thing was made up,though plausible based on my highway driving experiences.”(16KB1K2WOC ...) [8]
The seven–point scale establishes gradations within the truth–deception continuum, without imposingany specific values to participants’ self–ratings for the categories in between the two extremes. What isa half truth to some is a whole lie to others, as the Yiddish proverb suggests.
Deception detection task (Phase 2)
In Phase 2, another Mechanical Turk task was set up for a different group of participants to read one ofthe stories (produced in Phase 1) and decide whether the story was truthful or deceptive. Participatingperceivers (i.e., judges) were requested to elaborate on their judgments and explain what they believedto be deceptive in the story. This explanatory content serves as the basis for a perceived cue typology.Regardless of perceiver’s accuracy in discriminating lies from truths, each sender’s message isassociated with perceivers’ confidence levels in their assessments, which is thought to reflect cognitiveelements of deception cues. Respondents provided a confidence score each for their own judgment:from uncertainty to certainty. In total, 900 unique respondents participated in Phase 2, 10 perceiversper each story.
Data analysis methods
Scales and thresholds
We used three different scales: 7–point, 5–point, and binary. Respondents writing the stories (thesenders) used a 7–point scale to describe where each story fits on the linear truth–deceptioncontinuum. There was no definitive mapping of the shades of truth, deception, or half–truth in theopen–ended task: we allowed for respondents to provide their best fit to the scale with minimal labelingon the extremes. This fits with our explorative goals of highlighting practical and conceptual difficultiesin non–binary distinctions.
Rubin http://firstmonday.org/ojs/index.php/fm/rt/printerFriendly/3933/3170
6 of 21 11/20/2013 8:55 AM
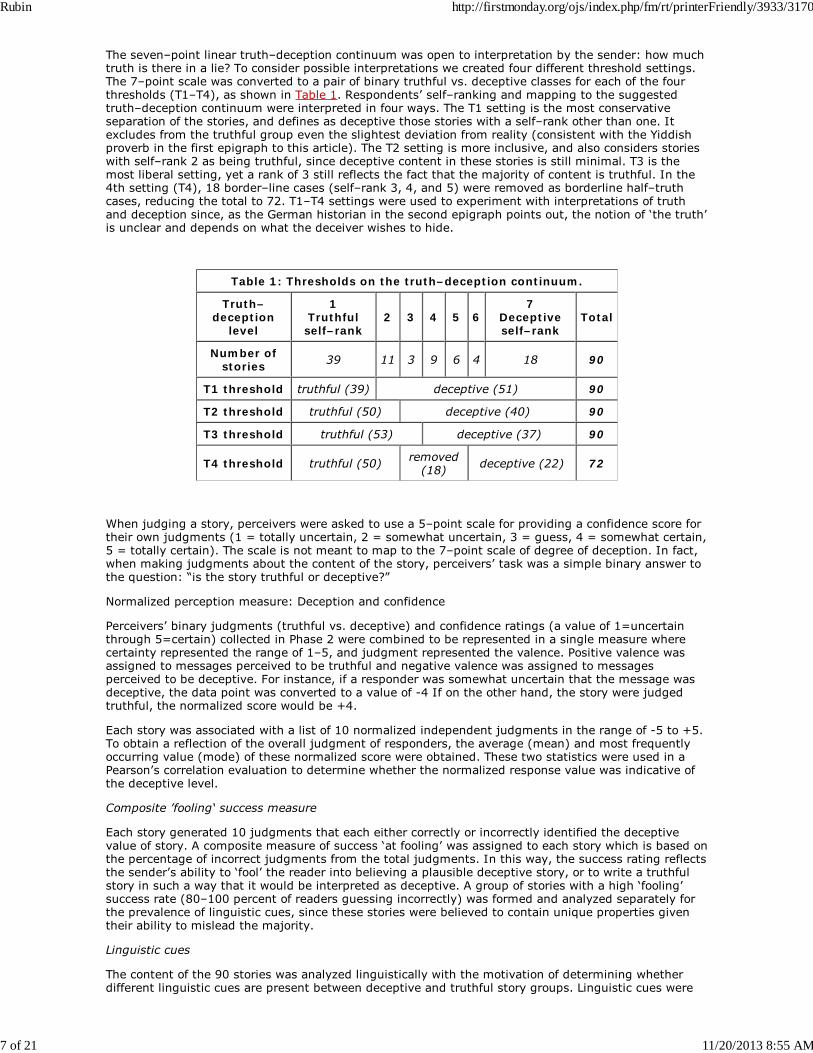
The seven–point linear truth–deception continuum was open to interpretation by the sender: how muchtruth is there in a lie? To consider possible interpretations we created four different threshold settings.The 7–point scale was converted to a pair of binary truthful vs. deceptive classes for each of the fourthresholds (T1–T4), as shown in Table 1. Respondents’ self–ranking and mapping to the suggestedtruth–deception continuum were interpreted in four ways. The T1 setting is the most conservativeseparation of the stories, and defines as deceptive those stories with a self–rank other than one. Itexcludes from the truthful group even the slightest deviation from reality (consistent with the Yiddishproverb in the first epigraph to this article). The T2 setting is more inclusive, and also considers storieswith self–rank 2 as being truthful, since deceptive content in these stories is still minimal. T3 is themost liberal setting, yet a rank of 3 still reflects the fact that the majority of content is truthful. In the4th setting (T4), 18 border–line cases (self–rank 3, 4, and 5) were removed as borderline half–truthcases, reducing the total to 72. T1–T4 settings were used to experiment with interpretations of truthand deception since, as the German historian in the second epigraph points out, the notion of ‘the truth’is unclear and depends on what the deceiver wishes to hide.
Table 1: Thresholds on the truth–deception continuum.
Truth–deception
level
1Truthfulself–rank
2 3 4 5 67
Deceptiveself–rank
Total
Number ofstories 39 11 3 9 6 4 18 90
T1 threshold truthful (39) deceptive (51) 90
T2 threshold truthful (50) deceptive (40) 90
T3 threshold truthful (53) deceptive (37) 90
T4 threshold truthful (50) removed(18) deceptive (22) 72
When judging a story, perceivers were asked to use a 5–point scale for providing a confidence score fortheir own judgments (1 = totally uncertain, 2 = somewhat uncertain, 3 = guess, 4 = somewhat certain,5 = totally certain). The scale is not meant to map to the 7–point scale of degree of deception. In fact,when making judgments about the content of the story, perceivers’ task was a simple binary answer tothe question: “is the story truthful or deceptive?”
Normalized perception measure: Deception and confidence
Perceivers’ binary judgments (truthful vs. deceptive) and confidence ratings (a value of 1=uncertainthrough 5=certain) collected in Phase 2 were combined to be represented in a single measure wherecertainty represented the range of 1–5, and judgment represented the valence. Positive valence wasassigned to messages perceived to be truthful and negative valence was assigned to messagesperceived to be deceptive. For instance, if a responder was somewhat uncertain that the message wasdeceptive, the data point was converted to a value of -4 If on the other hand, the story were judgedtruthful, the normalized score would be +4.
Each story was associated with a list of 10 normalized independent judgments in the range of -5 to +5.To obtain a reflection of the overall judgment of responders, the average (mean) and most frequentlyoccurring value (mode) of these normalized score were obtained. These two statistics were used in aPearson’s correlation evaluation to determine whether the normalized response value was indicative ofthe deceptive level.
Composite ’fooling‘ success measure
Each story generated 10 judgments that each either correctly or incorrectly identified the deceptivevalue of story. A composite measure of success ‘at fooling’ was assigned to each story which is based onthe percentage of incorrect judgments from the total judgments. In this way, the success rating reflectsthe sender’s ability to ‘fool’ the reader into believing a plausible deceptive story, or to write a truthfulstory in such a way that it would be interpreted as deceptive. A group of stories with a high ‘fooling’success rate (80–100 percent of readers guessing incorrectly) was formed and analyzed separately forthe prevalence of linguistic cues, since these stories were believed to contain unique properties giventheir ability to mislead the majority.
Linguistic cues
The content of the 90 stories was analyzed linguistically with the motivation of determining whetherdifferent linguistic cues are present between deceptive and truthful story groups. Linguistic cues were
Rubin http://firstmonday.org/ojs/index.php/fm/rt/printerFriendly/3933/3170
7 of 21 11/20/2013 8:55 AM
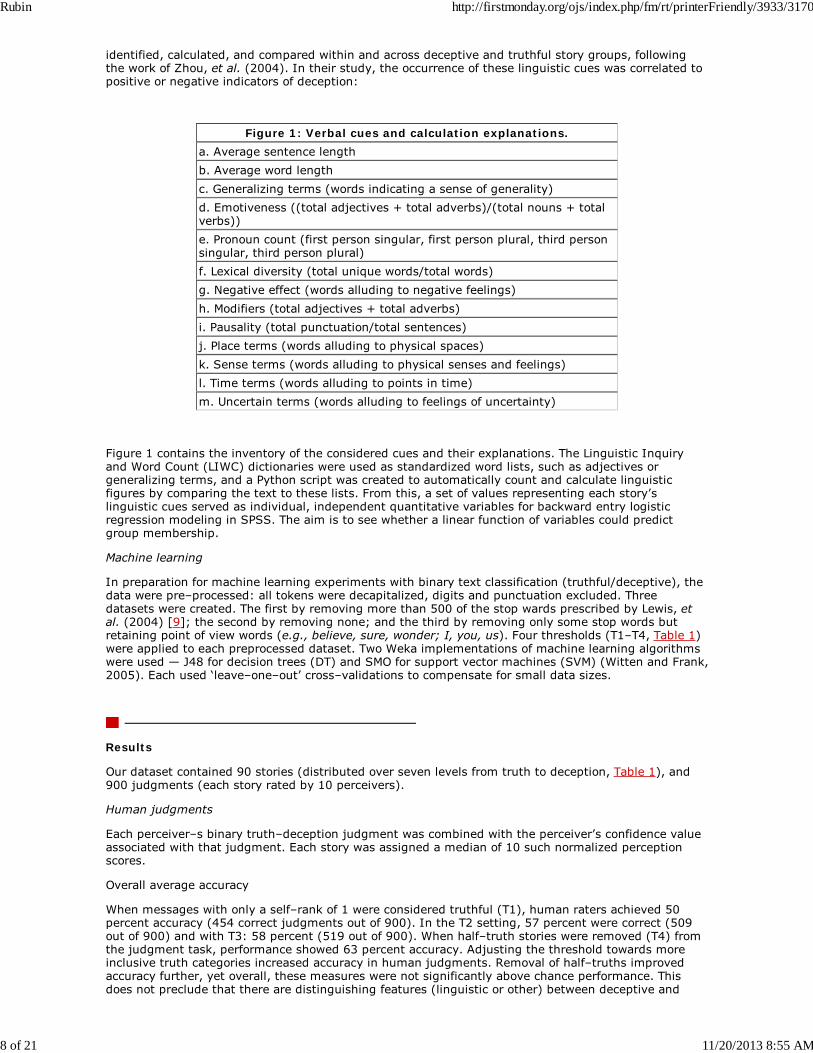
identified, calculated, and compared within and across deceptive and truthful story groups, followingthe work of Zhou, et al. (2004). In their study, the occurrence of these linguistic cues was correlated topositive or negative indicators of deception:
Figure 1: Verbal cues and calculation explanations.a. Average sentence lengthb. Average word lengthc. Generalizing terms (words indicating a sense of generality)d. Emotiveness ((total adjectives + total adverbs)/(total nouns + totalverbs))e. Pronoun count (first person singular, first person plural, third personsingular, third person plural)f. Lexical diversity (total unique words/total words)g. Negative effect (words alluding to negative feelings)h. Modifiers (total adjectives + total adverbs)i. Pausality (total punctuation/total sentences)j. Place terms (words alluding to physical spaces)k. Sense terms (words alluding to physical senses and feelings)l. Time terms (words alluding to points in time)m. Uncertain terms (words alluding to feelings of uncertainty)
Figure 1 contains the inventory of the considered cues and their explanations. The Linguistic Inquiryand Word Count (LIWC) dictionaries were used as standardized word lists, such as adjectives orgeneralizing terms, and a Python script was created to automatically count and calculate linguisticfigures by comparing the text to these lists. From this, a set of values representing each story’slinguistic cues served as individual, independent quantitative variables for backward entry logisticregression modeling in SPSS. The aim is to see whether a linear function of variables could predictgroup membership.
Machine learning
In preparation for machine learning experiments with binary text classification (truthful/deceptive), thedata were pre–processed: all tokens were decapitalized, digits and punctuation excluded. Threedatasets were created. The first by removing more than 500 of the stop wards prescribed by Lewis, etal. (2004) [9]; the second by removing none; and the third by removing only some stop words butretaining point of view words (e.g., believe, sure, wonder; I, you, us). Four thresholds (T1–T4, Table 1)were applied to each preprocessed dataset. Two Weka implementations of machine learning algorithmswere used — J48 for decision trees (DT) and SMO for support vector machines (SVM) (Witten and Frank,2005). Each used ‘leave–one–out’ cross–validations to compensate for small data sizes.
Results
Our dataset contained 90 stories (distributed over seven levels from truth to deception, Table 1), and900 judgments (each story rated by 10 perceivers).
Human judgments
Each perceiver–s binary truth–deception judgment was combined with the perceiver’s confidence valueassociated with that judgment. Each story was assigned a median of 10 such normalized perceptionscores.
Overall average accuracy
When messages with only a self–rank of 1 were considered truthful (T1), human raters achieved 50percent accuracy (454 correct judgments out of 900). In the T2 setting, 57 percent were correct (509out of 900) and with T3: 58 percent (519 out of 900). When half–truth stories were removed (T4) fromthe judgment task, performance showed 63 percent accuracy. Adjusting the threshold towards moreinclusive truth categories increased accuracy in human judgments. Removal of half–truths improvedaccuracy further, yet overall, these measures were not significantly above chance performance. Thisdoes not preclude that there are distinguishing features (linguistic or other) between deceptive and
Rubin http://firstmonday.org/ojs/index.php/fm/rt/printerFriendly/3933/3170
8 of 21 11/20/2013 8:55 AM
truthful stories; however, whatever factors may exist were not consciously perceived in the judgmenttask.
Comparison of accuracies by type of messages being judged
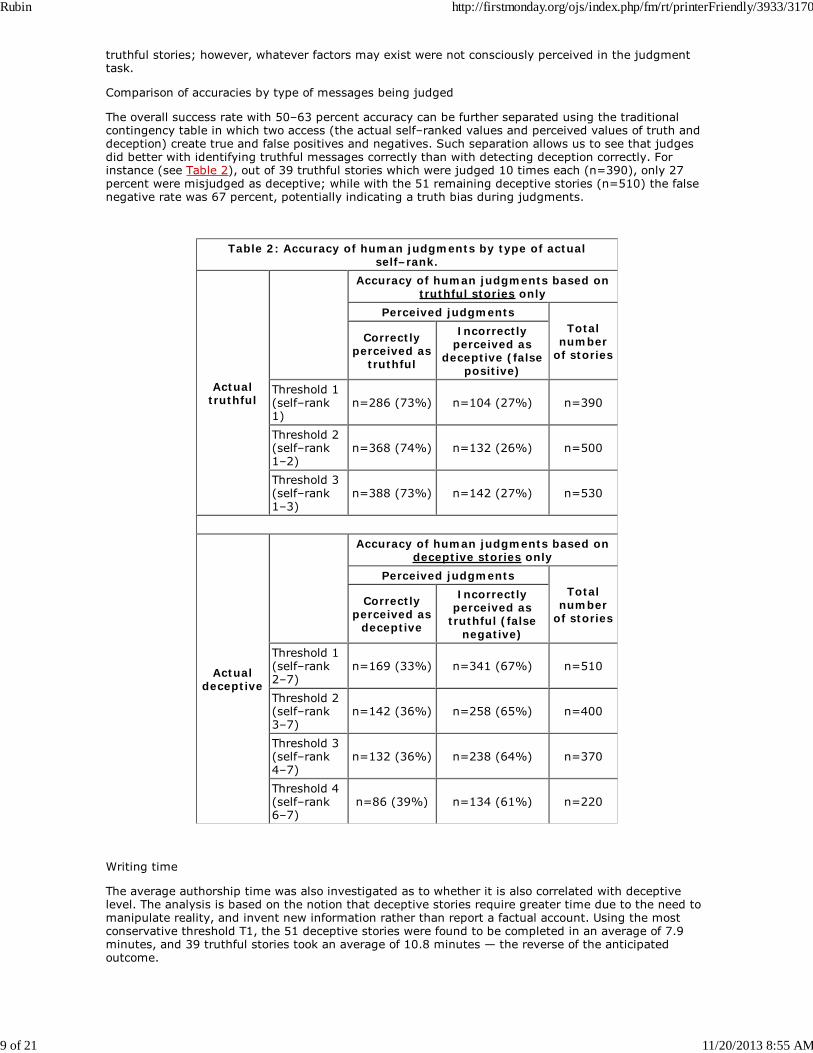
The overall success rate with 50–63 percent accuracy can be further separated using the traditionalcontingency table in which two access (the actual self–ranked values and perceived values of truth anddeception) create true and false positives and negatives. Such separation allows us to see that judgesdid better with identifying truthful messages correctly than with detecting deception correctly. Forinstance (see Table 2), out of 39 truthful stories which were judged 10 times each (n=390), only 27percent were misjudged as deceptive; while with the 51 remaining deceptive stories (n=510) the falsenegative rate was 67 percent, potentially indicating a truth bias during judgments.
Table 2: Accuracy of human judgments by type of actualself–rank.
Actualtruthful
Accuracy of human judgments based ontruthful stories only
Perceived judgmentsTotal
numberof stories
Correctlyperceived as
truthful
Incorrectlyperceived as
deceptive (falsepositive)
Threshold 1(self–rank1)
n=286 (73%) n=104 (27%) n=390
Threshold 2(self–rank1–2)
n=368 (74%) n=132 (26%) n=500
Threshold 3(self–rank1–3)
n=388 (73%) n=142 (27%) n=530
Actualdeceptive
Accuracy of human judgments based ondeceptive stories only
Perceived judgmentsTotal
numberof stories
Correctlyperceived as
deceptive
Incorrectlyperceived as
truthful (falsenegative)
Threshold 1(self–rank2–7)
n=169 (33%) n=341 (67%) n=510
Threshold 2(self–rank3–7)
n=142 (36%) n=258 (65%) n=400
Threshold 3(self–rank4–7)
n=132 (36%) n=238 (64%) n=370
Threshold 4(self–rank6–7)
n=86 (39%) n=134 (61%) n=220
Writing time
The average authorship time was also investigated as to whether it is also correlated with deceptivelevel. The analysis is based on the notion that deceptive stories require greater time due to the need tomanipulate reality, and invent new information rather than report a factual account. Using the mostconservative threshold T1, the 51 deceptive stories were found to be completed in an average of 7.9minutes, and 39 truthful stories took an average of 10.8 minutes — the reverse of the anticipatedoutcome.
Rubin http://firstmonday.org/ojs/index.php/fm/rt/printerFriendly/3933/3170
9 of 21 11/20/2013 8:55 AM
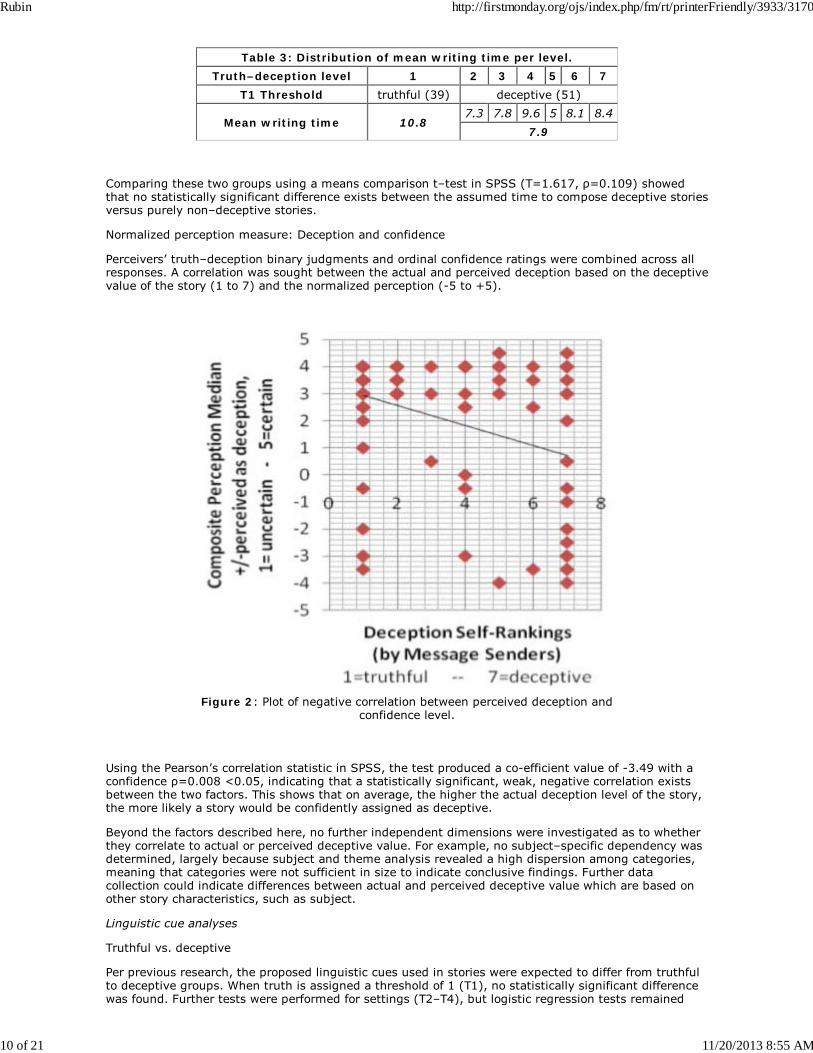
Table 3: Distribution of mean writing time per level.Truth–deception level 1 2 3 4 5 6 7
T1 Threshold truthful (39) deceptive (51)
Mean writing time 10.87.3 7.8 9.6 5 8.1 8.4
7.9
Comparing these two groups using a means comparison t–test in SPSS (T=1.617, ρ=0.109) showedthat no statistically significant difference exists between the assumed time to compose deceptive storiesversus purely non–deceptive stories.
Normalized perception measure: Deception and confidence
Perceivers’ truth–deception binary judgments and ordinal confidence ratings were combined across allresponses. A correlation was sought between the actual and perceived deception based on the deceptivevalue of the story (1 to 7) and the normalized perception (-5 to +5).
Figure 2: Plot of negative correlation between perceived deception andconfidence level.
Using the Pearson’s correlation statistic in SPSS, the test produced a co-efficient value of -3.49 with aconfidence ρ=0.008 <0.05, indicating that a statistically significant, weak, negative correlation existsbetween the two factors. This shows that on average, the higher the actual deception level of the story,the more likely a story would be confidently assigned as deceptive.
Beyond the factors described here, no further independent dimensions were investigated as to whetherthey correlate to actual or perceived deceptive value. For example, no subject–specific dependency wasdetermined, largely because subject and theme analysis revealed a high dispersion among categories,meaning that categories were not sufficient in size to indicate conclusive findings. Further datacollection could indicate differences between actual and perceived deceptive value which are based onother story characteristics, such as subject.
Linguistic cue analyses
Truthful vs. deceptive
Per previous research, the proposed linguistic cues used in stories were expected to differ from truthfulto deceptive groups. When truth is assigned a threshold of 1 (T1), no statistically significant differencewas found. Further tests were performed for settings (T2–T4), but logistic regression tests remained
Rubin http://firstmonday.org/ojs/index.php/fm/rt/printerFriendly/3933/3170
10 of 21 11/20/2013 8:55 AM
inconclusive when analyzed according to the 13 cue values (a–m, Figure 1). This indicates that ourdataset is linguistically homogenous. Confounding factors such as sampling methods or task definitionmay account for the difficulty in establishing this differential between groups, since previous work asshown some degrees of correlation between deception and one or a combination of the 13 linguisticcues.
Success ‘at fooling’
The sender’s ability to fool the perceiver into believing a deceptive story, or to write unbelievabletruthful story was analyzed in two groups. The first is those ‘high–success’ stories (80–100 percentperceivers judging incorrectly) and the second is the remaining stories, which had less than 80 percentguessing incorrectly. Contrary to our expectations, the results of this analysis show that there were noidentifiable linguistic distinctions. Logistic regression failed to determine statistically significant verbalpredictors with the composite measure of the success ‘at fooling’.
Confidence rate
Of the 900 responses, 617 produced confidence ratings of either four or five, indicating that perceiverstend to place high certainty in their own judgments. In fact, all 90 stories generated at least one highconfidence response regardless of whether the stories were deceptive or truthful. To test whether thereis a relationship between the linguistic cues used in the story, and the prevalence of high–confidenceresponses, a group of 26 stories was formed consisting of those with eight or more responses with aconfidence rating of four or five. As with ‘fooling’ success rate, logistic regression models wereunsuccessful at identifying linguistic predictors for high confidence response stories when compared tothe remaining 64 stories.
Machine learning experiments
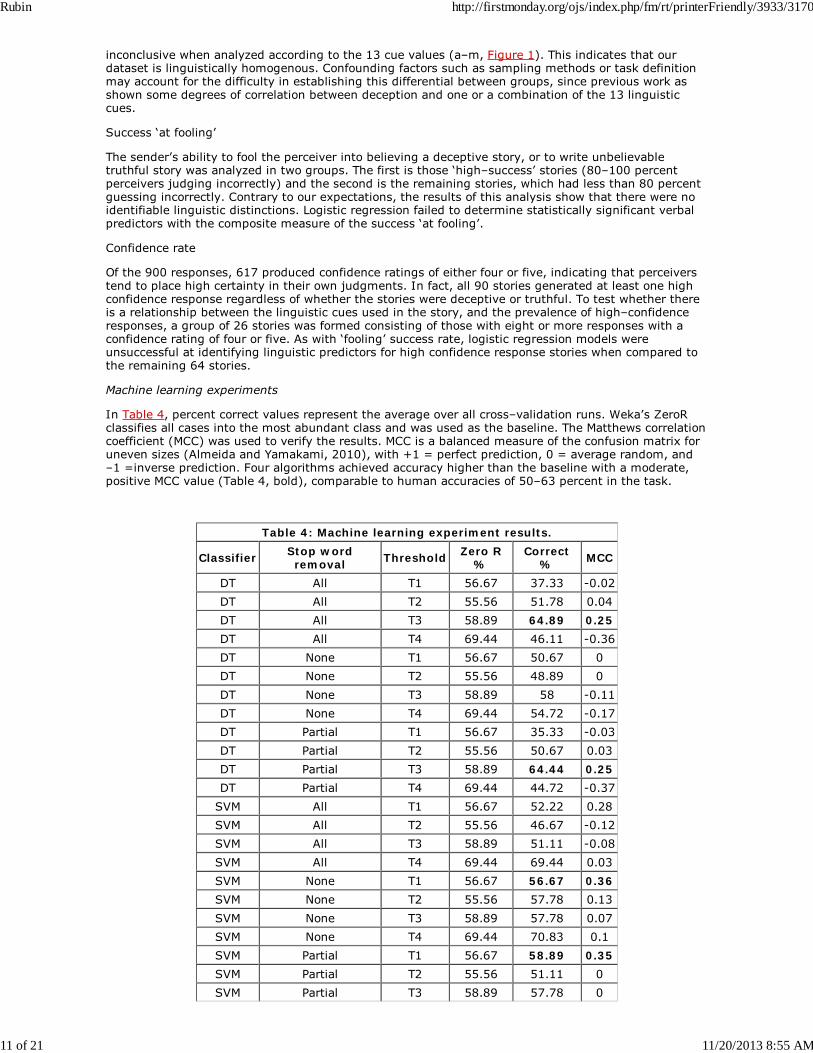
In Table 4, percent correct values represent the average over all cross–validation runs. Weka’s ZeroRclassifies all cases into the most abundant class and was used as the baseline. The Matthews correlationcoefficient (MCC) was used to verify the results. MCC is a balanced measure of the confusion matrix foruneven sizes (Almeida and Yamakami, 2010), with +1 = perfect prediction, 0 = average random, and–1 =inverse prediction. Four algorithms achieved accuracy higher than the baseline with a moderate,positive MCC value (Table 4, bold), comparable to human accuracies of 50–63 percent in the task.
Table 4: Machine learning experiment results.
Classifier Stop wordremoval Threshold Zero R
%Correct
% MCC
DT All T1 56.67 37.33 -0.02DT All T2 55.56 51.78 0.04DT All T3 58.89 64.89 0.25DT All T4 69.44 46.11 -0.36DT None T1 56.67 50.67 0DT None T2 55.56 48.89 0DT None T3 58.89 58 -0.11DT None T4 69.44 54.72 -0.17DT Partial T1 56.67 35.33 -0.03DT Partial T2 55.56 50.67 0.03DT Partial T3 58.89 64.44 0.25DT Partial T4 69.44 44.72 -0.37
SVM All T1 56.67 52.22 0.28SVM All T2 55.56 46.67 -0.12SVM All T3 58.89 51.11 -0.08SVM All T4 69.44 69.44 0.03SVM None T1 56.67 56.67 0.36SVM None T2 55.56 57.78 0.13SVM None T3 58.89 57.78 0.07SVM None T4 69.44 70.83 0.1SVM Partial T1 56.67 58.89 0.35SVM Partial T2 55.56 51.11 0SVM Partial T3 58.89 57.78 0
Rubin http://firstmonday.org/ojs/index.php/fm/rt/printerFriendly/3933/3170
11 of 21 11/20/2013 8:55 AM
SVM Partial T4 69.44 68.06 0.06
Content analysis results
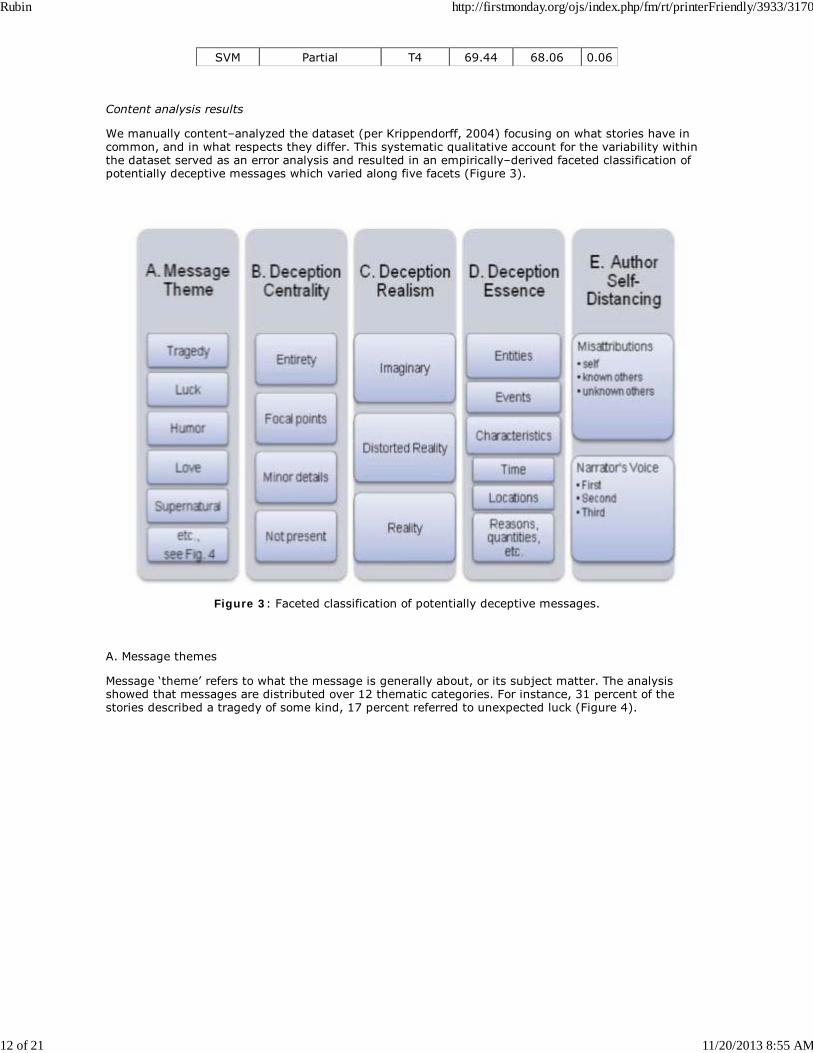
We manually content–analyzed the dataset (per Krippendorff, 2004) focusing on what stories have incommon, and in what respects they differ. This systematic qualitative account for the variability withinthe dataset served as an error analysis and resulted in an empirically–derived faceted classification ofpotentially deceptive messages which varied along five facets (Figure 3).
Figure 3: Faceted classification of potentially deceptive messages.
A. Message themes
Message ‘theme’ refers to what the message is generally about, or its subject matter. The analysisshowed that messages are distributed over 12 thematic categories. For instance, 31 percent of thestories described a tragedy of some kind, 17 percent referred to unexpected luck (Figure 4).
Rubin http://firstmonday.org/ojs/index.php/fm/rt/printerFriendly/3933/3170
12 of 21 11/20/2013 8:55 AM
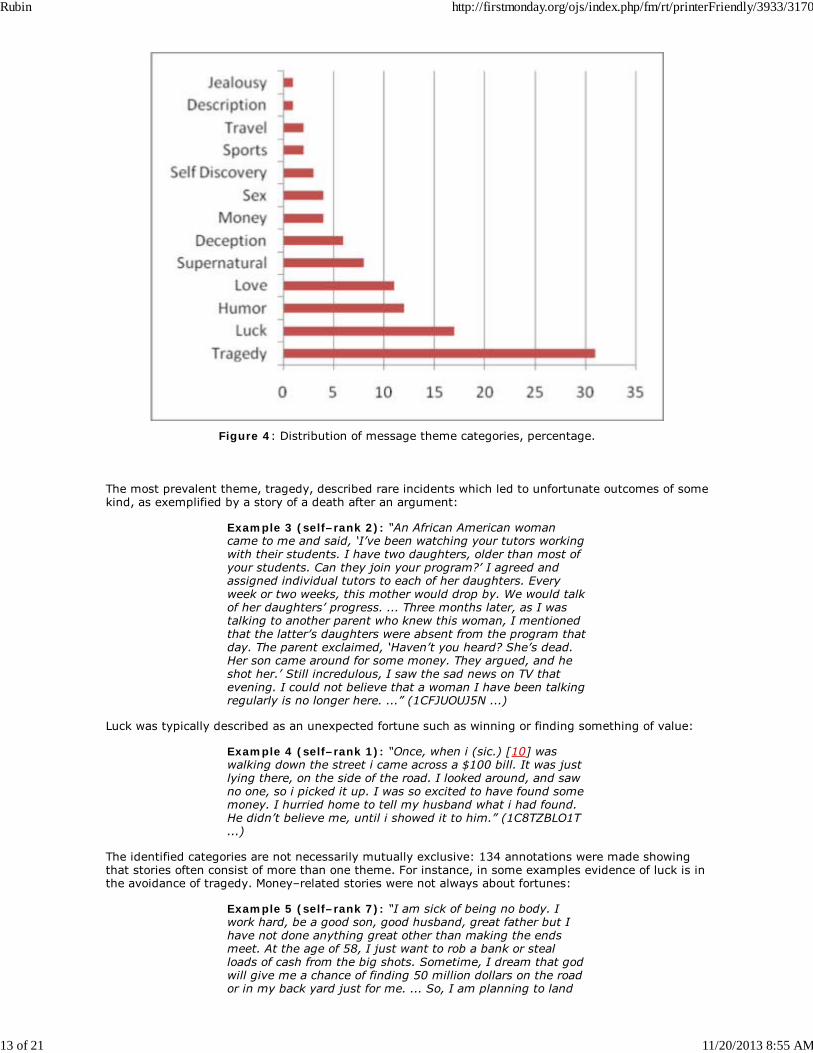
Figure 4: Distribution of message theme categories, percentage.
The most prevalent theme, tragedy, described rare incidents which led to unfortunate outcomes of somekind, as exemplified by a story of a death after an argument:
Example 3 (self–rank 2): “An African American womancame to me and said, ‘I’ve been watching your tutors workingwith their students. I have two daughters, older than most ofyour students. Can they join your program?’ I agreed andassigned individual tutors to each of her daughters. Everyweek or two weeks, this mother would drop by. We would talkof her daughters’ progress. ... Three months later, as I wastalking to another parent who knew this woman, I mentionedthat the latter’s daughters were absent from the program thatday. The parent exclaimed, ‘Haven’t you heard? She’s dead.Her son came around for some money. They argued, and heshot her.’ Still incredulous, I saw the sad news on TV thatevening. I could not believe that a woman I have been talkingregularly is no longer here. ...” (1CFJUOUJ5N ...)
Luck was typically described as an unexpected fortune such as winning or finding something of value:
Example 4 (self–rank 1): “Once, when i (sic.) [10] waswalking down the street i came across a $100 bill. It was justlying there, on the side of the road. I looked around, and sawno one, so i picked it up. I was so excited to have found somemoney. I hurried home to tell my husband what i had found.He didn’t believe me, until i showed it to him.” (1C8TZBLO1T...)
The identified categories are not necessarily mutually exclusive: 134 annotations were made showingthat stories often consist of more than one theme. For instance, in some examples evidence of luck is inthe avoidance of tragedy. Money–related stories were not always about fortunes:
Example 5 (self–rank 7): “I am sick of being no body. Iwork hard, be a good son, good husband, great father but Ihave not done anything great other than making the endsmeet. At the age of 58, I just want to rob a bank or stealloads of cash from the big shots. Sometime, I dream that godwill give me a chance of finding 50 million dollars on the roador in my back yard just for me. ... So, I am planning to land
Rubin http://firstmonday.org/ojs/index.php/fm/rt/printerFriendly/3933/3170
13 of 21 11/20/2013 8:55 AM
on one of the millionaire’s building from a chopper and stealthe money. No traces are behind and this will become achallenge to the police. At the end, I feel sorry for what I havedone and use the money for a good cause and give charity.”(1Z4GT47GVP ...)
Supernatural themes included incidents of hearing voices or of alien abductions. The deception themedescribed those stories where the author is said to experience lying or being lied to. The rest of the lesspopulous theme categories are named according to their subject matter: humor, sex, sports, orjealousy. Description was a distinct category since it did not offer a plot but rather described thecharacteristics of a setting or situation:
Example 6 (self–rank 1): “... The place is ancient, hasweathered many a hurricane, and has settled so much thatsome of the doors are now cut into trapezoids rather thanrectangles. The room I like the most is a long skinny oneupstairs that I think used to be a closet. ... The commonkitchen is full of roaches ... and the common bathrooms arenot air conditioned at all. ...” (1MFHWXB9ED)
There were six cases of deception message themes (Figure 4) within truthful stories. Speaking truthfullyabout lying seems to create some confusion among human perceivers and add complexity to detectionautomation. Judges resort to guessing, as in the following example, which was judged on average as“I’m guessing it is truthful” 10 human judges (i.e., normalized perception score of “+3”).
Example 7: “So the other day I’m sitting at home, and I geta call from a carpet cleaner service that’s offering deals oncarpet cleaning. I don’t need my carpets cleaned, but I decideto yank their chain a little bit. I ask the guy ‘Can you get outblood?’ He says ‘Is it just a little bit?’ and I tell him ‘Oh no, itsquite a bit. Like someone bleed to death. Oh, and if you cleanit up, I’ll pay you double, but you have to promise not to callthe police.’ He hung up. Bastard.”
The contributor explains: “It’s a true story. I tried to make acarpet cleaner company believe I killed someone and wantedthem to clean up the blood and they probably didn’t buy it.”(1X5WSQPFM8 ...)
This is a complex case in which the judges task may have an increased cognitive load due to the nestedquestion — is he lying about lying? Linguistic cues may be misleading in analysis since the directquotes are used to in the story to render truthfully how the participant tried to convince create a falsebelief in the carpet cleaner’s mind.
In sum, the identified message themes orient the reader to a topic and provide a thematic landscape forour dataset. Compared to Rubin’s (2010b) domains identified in blogs, themes are narrower and mostlyfall within Personal Relations or Finances & Insurance domains. They span across everyday and seriouslies, as in DePaulo (1994). Message theme variability poses distinct problem for both automation andhuman discernment.
The next four Facets (B–E, Figure 3) address properties of deception within messages, taking intoaccount the variable interpretation of truth (T1–T4, Table 1). Facets B–E arise from the content analysisof the messages, senders’ accompanying explanations, and perceivers’ reflections.
B. Deception centrality
Deception centrality refers to what proportion of the story is deceptive, and how significant thedeceptive part is. Messages vary from being entirely deceptive, to being deceptive in its focal point or ina minor detail (Figure 3, B). Of the 90 messages, only 18 messages were confirmed by senders as beingdeceptive in their entirety. In the following example the sender claims all but minor details to be true:
Example 8: “I’ve only bought dark lipstick, two tubes of it,and not from the beauty store.” (12NG4N9H36 ...)
C. Deception realism
Deception realism refers to how much reality is mixed in with the lie. A message can be basedpredominantly on reality with a minor deviation, or can be based on a completely imaginary worldFigure 3, C). Out of 90, 41 senders claimed in their verbal explanations that their messages werenothing but the truth. The entirely deceptive stories (self–ranked 7) were often fiction–like:
Rubin http://firstmonday.org/ojs/index.php/fm/rt/printerFriendly/3933/3170
14 of 21 11/20/2013 8:55 AM
Example 9 (self–rank 7): “about a week ago i ran into thisguy — he was good looking. He also was a fast talker. I toldhim to leave me alone because I was married but, he said hedid not care. Well the man ended up following me home. I ranin the house and told my husband I was being stalked. Hethen proceeded to call 911. 911 then told him an officerwould respond. The guy was so nuts he came up and knockedon my door. My husband answered and then there was analtercation they began fist fighting. Needless to say the policeshowed up and took them both to jail.” The contributorexplains: “... just something i made up off the top of myhead.” (ID=1LFVZ5N9IL ...)
The remaining categories were based on some degree of distortion from the reality.
D. Deception essence
Deception essence refers specifically to what the deception is about, its nature (Figure 3, D), not to beconfused with message theme or topicality. When explaining his truthful message, one of the sendersfelt compelled to clarify that his story was true in many respects, verbalizing how he could have lied, inprinciple, about the person or events:
Example 10: “Nothing was deceptive. The roommate’s namewas John. All the other events did happen.” (1ZO1SPGVAZ...)
Similar testimonies lead us to believe that message senders are obviously aware of the underlyingpossibilities. We subdivided these types of deception essence into events, entities (a collective term forpeople, organizations, and objects), and their characteristics (referring to qualifiers of both, events andentities). The rest of the essence categories (time, location, reason, degree, amount, etc., Figure 3, D.)conceptually align with content questions such as when, where, why, how much, etc.
We hypothesize that certain combinations of centrality (focal point), realism (reality–based), andessence (events), are more re–current than isolated uses of deception topics, and thus deserve specialconsideration in deception detection efforts. This is subject to future testing and targeted elicitations.The deceptive piece below describes how distortions of reality are details of events which are,nevertheless, focal to the message:
Example 11 (self–rank 5): “i moved to canada when i was23 years old. i went to study at a local canadian university formy bachelor’s degree. on this trip i met a guy i fell in lovewith. after i had to return to my home country in europe ourcontact broke. i still consider him the biggest love of my life. iam 30 yrs old now.” The contributor explains: “i went tocanada when i was 24, i went to work, not to study. i didn’tfall in love with anyone and i didn’t break contact with anyoneafter return.” (1EYU7H6RY6 ...)
Similarly, the sender who wrote Example 2 reveals the reality–based distortion (Facet C) of the event asthe focal point (Facet B):
Example 12: “I didn’t have an accident on the way home.”(1UWFAQB2PS ...)
Thus, each deception essence (event, entity, characteristics, etc.) may vary by the orthogonal deceptionfacets, either in its centrality to the message (such as focal point or minor detail) or in its degree ofrealism. In the case below, focal events are true but the entity (the man) is imaginary:
Example 13: “This type of event has actually happened, butthe specific story of the man from the midwest wassomething I made up.” (1XIQHS0LU6 ...)
E. Self–distancing degree
The distance between the message sender and plot characters transpired as variable dimension acrossstories, created by misattributions (revealed by liars afterwards) and by narrator’s perspective (revealedby writing stories from the first or third person). Misattributions were three–fold. Authors’self–involvement was often misattributed (34 percent), where the events did happen but not to thesender. Events are also often misattributed to known entities (e.g., friends, co–workers; 36 percent) orto unknown ones (30 percent) as follows:
Example 14: “The story behind the song is true (according toRod), but it was not MY aunt Maggie. I don’t have an aunt
Rubin http://firstmonday.org/ojs/index.php/fm/rt/printerFriendly/3933/3170
15 of 21 11/20/2013 8:55 AM
Maggie.” (1LVQDBTE57 ...)
Narrator’s voice was also distinguished into three categories in our dataset: first person (88 percent),second (eight percent), and third (one percent), the latter two signifying distancing from the message.
Stated perceived deception detection cues
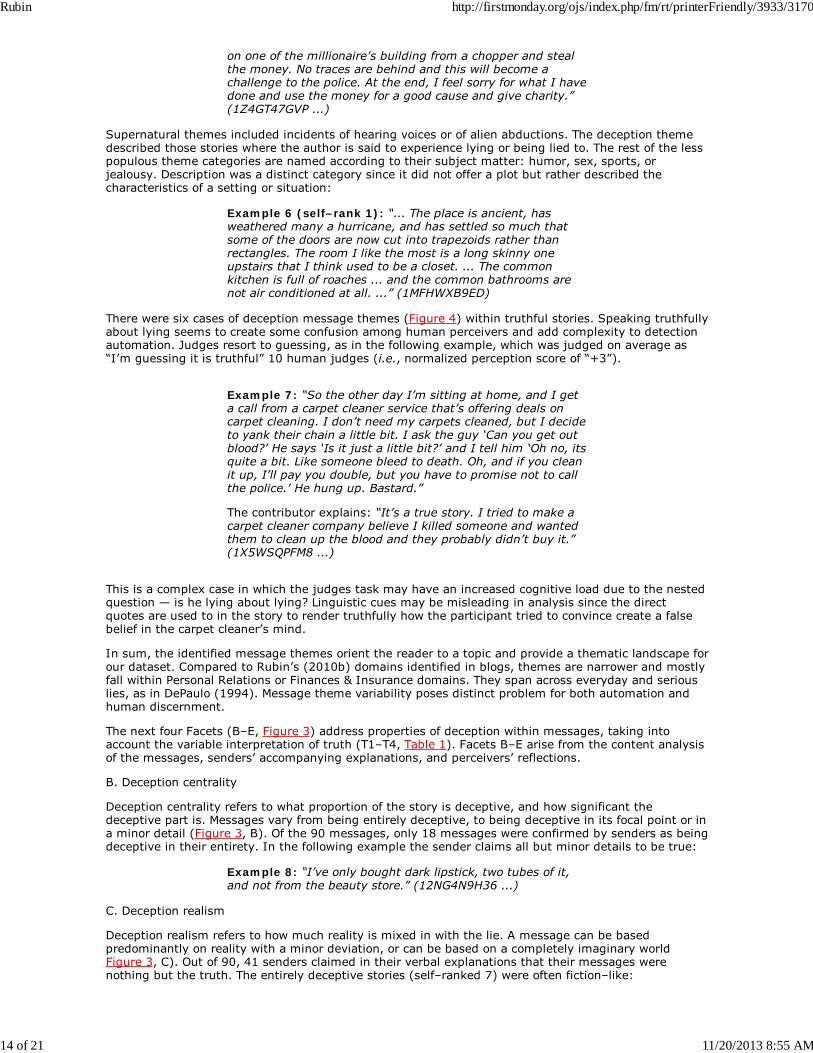
Out of 900 judgements, 275 generated verbal explanations describing cues by which perceivers saidthey judged deception. The cues fell into four categories of this data–driven, perceived cue typology:world knowledge, logical contradiction, linguistic evidence and intuitive sense.
Figure 5: Stated perceived deception detection cues.
Of the 275 stated perceived cues, half (Figure 5) belonged to perceivers’ world knowledge, includingpersonal experiences:
Example 15: “plastic surgery does not involve covering someone from head to toe with a plastic sheet, with a hole cut outaround my eye.” (15I8RA20KV ...)
Twenty–nine percent of explanations pointed to a logical contradiction:
Example 16: “Why would someone steal a cellphone and theelderly woman had a cane and was stooping so presumably itwould be hard for her to snag a phone unless the cane andthe stoop were an act as well.” (1CXLIK31TX ...)
Sixteen percent vaguely referenced linguistic evidence, for instance, in regards to a story about cricket:
Example 17: “Some of the grammar and terminology doesnot make sense.” (1KRHRTLZ9R ...)
Five percent openly stated a decision based on intuition, relying on hunches, or impressions outside ofempirical evidence. The perceivers tended not to be very descriptive in unpacking their reasons aroundtheir sense of deception:
Example 18: “It may be a joke. Doesn’t seem to be a truestory” (1BC2H6DL3L ...); or Example 19: “It just doesn’tseem very believable.” (12LMYHR57T ...)
Discussion
Rubin http://firstmonday.org/ojs/index.php/fm/rt/printerFriendly/3933/3170
16 of 21 11/20/2013 8:55 AM
With the elicitation methods and experiment set–up detailed above, human judges achieved on averageoverall 50–63 percent success rates, depending on what is considered deceptive on the truth–deceptioncontinuum. Judgments of deceptive stories produced more false negative results that judgments oftruthful stories, potentially indicating the judges’ truth bias in performing the task.
One significant finding is that actual self–ranked deception levels negatively correlate with theirconfident judgment as being deceptive (r = -0.35, df = 88, ρ = 0.008). In other words, the higher theactual deception level of the story, the more likely a story would be confidently assigned as deceptive.This finding is consistent with the Undeutsch Hypothesis and current theory on qualitative differences indeceptive texts. In addition, it emphasizes the value of human judges’ confidence level in relation tothe degree of deceptiveness as self–declared by liars. Such combination makes the trend obvious,implying that even though humans are not as good at detecting overall deception; its extreme degreesare more transparent and thus obvious to judges. It would then make sense to focus further research ondefining each category on the truth–deception continuum, and consequently eliciting more refined data.What would most people consider a half–truth as opposed to an absolute lie?
The highest–performing machine learning algorithms in our experiments reached 65 percent accuracy,but linguistic cues as tested with degrees of deceptiveness, were not found not to be significantpredictors of deception level, confidence score, or an authors’ ability to fool a reader. This supports theidea that further methods are needed to combine isolated predictors into more complex constructs.
Areas for improvement
We further reflect on conceptual and methodological challenges in elicitation and analytical methods,and identify potential areas of improvements.
The first challenge arises from interpretations of what constitutes deception. Half–truths and half–liesinevitably interfere with binary classification by humans. In general, humans performed better whenthere were fewer ambiguous cases (e.g., T4). It would be beneficial if people could defer to a machine–learning prediction in cases where they lack confidence, thus future research is needed on finding areasin which computational techniques supersede human judgments that lack confidence.
Second, our data elicitation task was open-ended, allowing writers to make choices and us to chartertheir preferences and existing case scenarios. This approach served an excellent purpose for surveyingpotential context and classifying deception facets (such as theme, centrality, realism, essence,self–distancing). The heterogeneous data, however, lessened linguistic predictive power. Previouscomputational attempts succeeded with well–defined tasks for eliciting deception about, for example,an opinion entirely contrary to one’s belief (Mihalcea and Strapparava, 2009) or the most significantperson in one’s life (Hancock, et al., 2008). In addition, since qualitative types of deception do noteasily translate to linear deception level scales, we propose further research focuses on the followingcategories: events, entities or characteristics as a focal point of the story.
Third, respondents’ awareness of the study goals may have prompted them to apply extra effort in‘fooling’ perceivers with truthful yet unbelievable or bizarre stories. This may have morphed the originalintent of elicitations to an even broader, yet realistic, task.
Two other broader challenges are associated with the experimental design. The relative unimportance oflinguistic cues (16 percent) is evident from our proposed cue typology. Contrary to the majority ofcurrent computational efforts at the lexico–semantic level (e.g., LWIC-based), this finding resonateswith concerns previously expressed in psychology in regards to how people detect deception in real life(Park, et al., 2002). Based on their survey, Park and colleagues found that only two percent of the liesare caught in real–time and are never purely on the basis of verbal and non–verbal behavior of thesender.
“Most lies were detected well after the fact, using informationfrom third parties and physical evidence to catch liars. Someliars later confessed or let the truth slip out. Sometimes thelie was simply inconsistent with prior knowledge. None ofthese common discovery methods are available to judges intypical deception detection experiments. Perhaps people arenot very accurate in deception experiments becausedeception detection experiments incorrectly presume thatdeception is detected based on real–time leakage, sinceexperiments fail to accurately capture the ecology andprocess of deception detection.” (Levine, et al., 2011)
On the other hand, if verbal cues are still detected objectively — based on data at hand and in real–timewith some predictive power — automatic technique would have an upper hand over human efforts,ultimately proving invaluable, especially in CMC environments.
Finally, we offer an insight from the language pragmatics perspective. Human communication, includingCMC, involves complex social phenomenon consisting of an interplay of language, shared frames ofreference, and culturally specific contextual knowledge in order to convey meanings between the sender
Rubin http://firstmonday.org/ojs/index.php/fm/rt/printerFriendly/3933/3170
17 of 21 11/20/2013 8:55 AM
and receiver. A thorough understanding of deception, therefore, must account for the pragmatic use oflanguage. Deception involves communicative action oriented toward reaching understanding, and insuch action, the sender and perceiver must share particular conventions, expectations orpresuppositions about the communicative exchange, namely that the sender’s “utterances arejustifiable in relation to interpersonally accepted roles and norms” (Mitchell, 1996). As a result,deception paradoxically requires “a shared system of interpretation and meaning”. Mahon (2008)identifies the “addressee condition”, which is that when lying it is not merely the case that the personwho makes the untruthful statement intends that some other person believe that untruthful statementto be true, but that the person intends that the perceiver believe that untruthful statement to be true.Without this relationship, the author is not subject to the cognitive demands associated with deceptionin more intimate scenarios. In our experiments, each sender wrote an unverifiable story for ananonymous recipient, with possibly inaccurate expectations about how the message would be received;each responder relied on an imaginary author and a subjective schema of the events being described.Such elicitation conditions reduce the possibility of shared linguistic conventions and contextualknowledge that deception demands, and may undermine the ability of the data to meet therequirements of deception, or at least separate truth in a significant sense from deception as it occurs ina real–world communication scenario.
Conclusions and future work
Deception detection is a challenging task. With pervasive use of text–based computer–mediatedcommunication, automated deception detection continues to increase in importance in natural languageprocessing, machine–learning communities and broader library and information science and technology.Tools with detection capability can support undisrupted communication and information practices,credibility assessments, and decision–making. Our study shows typical success rates by humans(50–63 percent) and machine–learning algorithms (65 percent). We established that the higher theactual deception level of the story, the more likely a story would be confidently assigned as deceptive,and have seen a distinct truth bias in human judgments. However, we were unable to find significantlinguistic predictors of deception in our sample, explained, in part, by the challenges encountered. Wereflect upon reasons, and offer a systematic content analysis of elicited stories and surrounding senders’and perceivers’ explanations. Such error analysis resulted in a proposed facetted classification ofvariance within deception by five facets: theme, centrality, realism, essence and self–distancing. Ournext step is to devise ways of exerting greater control over variability, increase and even out samplesizes, and improve measurement scales. We are considering changes to our experimental design andthe elicitation task in view of encountered challenges, discussed at length in this paper.
About the authors
Victoria L. Rubin is the Principal Investigator of the Language and Information Technologies ResearchLab and an Assistant Professor at the Faculty of Information and Media Studies at the University ofWestern Ontario, London, Canada. She received her Ph.D. in Information Science and Technology in2006, her M.A. in Linguistics in 1997 from Syracuse University, N.Y., and a B.A. English, French, andInterpretation from Kharkiv National University, Ukraine in 1993. Dr. Rubin research interests are ininformation organization and information technology. She specializes in information retrieval and naturallanguage processing techniques that enable analyses of texts to identify, extract, and organizestructured knowledge. Victoria Rubin is the corresponding author and can be contacted at: vrubin [at]uwo [dot] ca
Niall Conroy is a doctoral student in LIS at the Faculty of Information and Media Studies at theUniversity of Western Ontario, London, Canada. He has received B.Sc. in Computer Science and anM.LIS, and has a background in software engineering and information management. His currentresearch interests include intelligent music information retrieval systems, collaborative filtering andmultimedia data mining techniques, and online communities.
Acknowledgments
This research is funded by the New Research and Scholarly Initiative Award (10–303), entitled TowardsAutomated Deception Detection: An Ontology of Verbal Deception Cues for Computer–MediatedCommunication from the Academic Development Fund at the University of Western Ontario. Specialthanks to Jacqueline Burkell for her methodological insights, to Martha Stortz for her efforts in datacoding and classification, and to Jeff Taylor for running the WEKA experiments.
Notes
Rubin http://firstmonday.org/ojs/index.php/fm/rt/printerFriendly/3933/3170
18 of 21 11/20/2013 8:55 AM
1. The work of our colleagues in speech community is not reviewed here due to our primary interest intexts and verbal (not auditory) cue found in CMC messages.
2. Burgoon, et al., 2003, p. 91.
3. The terms “lying” and “deceiving” are used interchangeable in this article, though we are aware ofthe fact that deception can be accomplished in various ways (such as equivocating, misrepresentingand evading), and “lying” as “prevaricating” is a distinctly narrower term (see Rubin [2010] for thediscussion of various kinds of deception).
4. Ali and Levine, 2008, p. 83.
5. Burgoon, et al., 2003, p. 91.
6. Ali and Levin, 2008, p. 84.
7. Burgoon, et al., 2003, p. 96.
8. Identification numbers are listed for all examples matching database entries for further inquiries.
9. The list is available at http://jmlr.csail.mit.edu/papers/volume5/lewis 04a/a11-smart-stop-list/english.stop.
10. The participants’ spelling and capitalization are left uncorrected to preserve their authentic CMCwriting style and habits.
References
M. Ali and T. Levine, 2008. “The language of truthful and deceptive denials and confessions,"Communication Reports, volume 21, number 2, pp. 82–91.
T. Almeida and A. Yamakami, 2010. “Content–based spam filtering,” Proceedings of the 2010International Joint Conference on Neural Networks (IJCNN), pp. 1–7.
J. Bachenko, E. Fitzpatrick and M. Schonwetter, 2008. “Verification and implementation oflanguage–based deception indicators in civil and criminal narratives,” Proceedings of the 22ndInternational Conference on Computational Linguistics, pp. 41–48, and at http://www.aclweb.org/anthology/C08-1006, accessed 3 March 2012.
D. Buller and J. Burgoon, 1996. “Interpersonal deception theory,” Communication Theory, volume 6,number 3, pp. 203–242.
J. Burgoon, J. Blair, T. Qin and J. Nunamaker, 2003. “Detecting deception through linguistic analysis,”ISI ’03: Proceedings of the 1st NSF/NIJ conference on Intelligence and Security Informatics, LectureNotes in Computer Science, volume 2665, pp. 91–101.
CBC, 2011. “Truth Goggles interview,” CBC Radio (25 November), at http://www.cbc.ca/day6/blog/2011/11/25/interview-truth-goggles/, accessed 3 March 2012.
B. DePaulo, 1994. “Spotting lies: Can humans learn to do better?” Current Directions in PsychologicalScience, volume 3, number, pp. 83–86.
B. DePaulo, K. Charlton, H. Cooper, J. Lindsay and L. Muhlenbruck, 1997. “The accuracy–confidencecorrelation in the detection of deception,” Personality and Social Psychology Review, volume 1, number4, pp. 346–357.
A. Eisenberg, 2011. “Software that listens for lies,” New York Times (3 December), athttp://www.nytimes.com/2011/12/04/business/lie-detection-software-parses-the-human-voice.html,accessed 3 March 2012.
European chapter of the Association for Computational Linguistics [EACL], 2012. “Call for papers: EACL2012 Workshop on Computational Approaches to Deception Detection,” athttp://www.chss.montclair.edu/linguistics/DeceptionDetection.html, accessed 20 January 2012.
T. Fornaciari and M. Poesio, 2011. “Lexical vs. surface features in deceptive language analysis,”Proceedings of the ICAIL 2011 Workshop: Applying Human Language Technology to the Law, pp. 2–8,at http://wyner.info/research/Papers/AHLTL2011Papers.pdf, accessed 3 March 2012.
M. Frank, T. Feeley, N. Paolantinio and T. Servoss, 2004. “Individual and small group accuracy injudging truthful and deceptive communication,” Group Decision and Negotiation, volume 13, number 1,pp. 45–59.
C. Fuller, D. Biros and R. Wilson, 2009. “Decision support for determining veracity via linguistic–based
Rubin http://firstmonday.org/ojs/index.php/fm/rt/printerFriendly/3933/3170
19 of 21 11/20/2013 8:55 AM
cues,” Decision Support Systems, volume 46, number 3, pp. 695–703.
J. Hancock, L. Curry, S. Goorha and M. Woodworth, 2008. “On lying and being lied to: A linguisticanalysis of deception in computer–mediated communication,” Discourse Processes, volume 45, number1, pp. 1–23.
G. Köhnken, 2004. “Statement validity analysis and the detection of the truth,” In: P. Granhag and L.Strömwall (editors). The detection of deception in forensic contexts. Cambridge: Cambridge UniversityPress, pp. 41–63.
K. Krippendorff, 2004. Content analysis: An introduction to its methodology. Second edition. BeverlyHills, Calif.: Sage.
Language & Information Technology Research Lab, 2012. “Mission statement,” at http://publish.uwo.ca/~vrubin/lab/index.html, accessed 21 January 2012.
D. Larcker and A. Zakolyukina, 2010. “Detecting deceptive discussions in conference calls,” StanfordUniversity Rock Center for Corporate Governance Working Paper Series, number 83 and Stanford GSBResearch Paper, number 2060.
T. Levine, S. Mccornack and H. Park, 2011. “Deception research at Michigan State University,” athttps://www.msu.edu/~levinet/deception.htm, accessed 28 May 2011.
D. Lewis, Y. Yang, T. Rose and F. Li, 2004. “RCV1: A new benchmark collection for text categorizationresearch,” Journal of Machine Learning Research, volume 5, pp. 361–397.
J. Mahon, 2008. “The definition of lying and deception,” Stanford Encyclopedia of Philosophy, athttp://plato.stanford.edu/entries/lying-definition/, accessed 3 March 2012.
R. Mihalcea and C. Strapparava, 2009. “The lie detector: Explorations in the automatic recognition ofdeceptive language,” Proceedings of the ACL–IJCNLP 2009 Conference Short Papers, pp. 309–312.
R. Mitchell, 1996. “The psychology of human deception,” Social Research, volume 63, number 3, pp.819–861.
M. Newman, J. Pennebaker, D. Berry and J. Richards, 2003. “Lying words: Predicting deception fromlinguistic styles,” Personality and Social Psychology Bulletin, volume 29, number 5, pp. 665–675.
B. Pang and L. Lee, 2008. “Opinion mining and sentiment analysis,” Foundations and Trends inInformation Retrieval, volume 2, numbers 1–2, pp. 1–135.
H. Park, T. Levine, S. Mccornack, K. Morrison and M. Ferrara, 2002. “How people really detect lies,”Communication Monographs, volume 69, number 2, pp. 144–157.
S. Porter and J. Yuille, 1996. “The language of deceit: An investigation of the verbal clues to deceptionin the interrogation context,” Law and Human Behavior, volume 20, number 4, pp. 443–458.
V. Rubin, 2010a. “Epistemic modality: From uncertainty to certainty in the context of informationseeking as interactions with texts,” Information Processing & Management, volume 46, number 5, pp.533–540.
V. Rubin, 2010b. “On deception and deception detection: Content analysis of computer–mediatedstated beliefs,” Proceedings of the American Society for Information Science and Technology, volume47, number 1, pp. 1–10.
V. Rubin, 2009. “Trust incident account model: Preliminary indicators for trust rhetoric and trust ordistrust in blogs,” Proceedings of the Third International Association for the Advancement of ArtificialIntelligence Conference on Weblogs and Social Media, pp. 300–303, and at http://www.icwsm.org/2009/, accessed 3 March 2012.
V. Rubin, 2007. “Stating with certainty or stating with doubt: Intercoder reliability results for manualannotation of epistemically modalized statements,” Human Language Technologies 2007: TheConference of the North American Chapter of the Association for Computational Linguistics; CompanionVolume, Short Papers, pp. 141–144.
V. Rubin and E. Liddy, 2006. “Assessing credibility of Weblogs,” AAAI Symposium on ComputationalApproaches to Analyzing Weblogs, at http://aaaipress.org/Papers/Symposia/Spring/2006/SS-06-03/SS06-03-038.pdf, accessed 3 March 2012.
V. Rubin, J. Burkell and A. Quan–Haase, 2011. “Facets of serendipity in everyday chance encounters: Agrounded theory approach to blog analysis,” Information Research, volume 16, number 3, athttp://informationr.net/ir/16-3/paper488.html, accessed 3 March 2012.
V. Rubin, J. Stanton and E. Liddy, 2004. “Discerning emotions in texts,” AAAI Symposium on ExploringAttitude and Affect in Text, at http://www.aaai.org/Library/Symposia/Spring/ss04-07.php, accessed 3
Rubin http://firstmonday.org/ojs/index.php/fm/rt/printerFriendly/3933/3170
20 of 21 11/20/2013 8:55 AM
March 2012.
S. Sporer, 2004. “Reality monitoring and detection of deception,” In: P. Granhag and L. Strömwall(editors). The detection of deception in forensic contexts. Cambridge: Cambridge University Press, pp.64–102.
U. Undeutsch, 1967. “Beurteilung der glaubhaftigkeit von aussagen [Veracity assessment ofstatements],“ In: In U. Undeutsch (editor). Handbuch der Psychologie, volume 11: ForensischePsychologie. Göttingen: Hogrefe.
A. Vrij, 2000. Detecting lies and deceit: The psychology of lying and the implications for professionalpractice. New York: Wiley.
R. Wiseman, 1995. “The megalab truth test,” Nature, volume 373, number 391, p. 391, and athttp://www.nature.com/nature/journal/v373/n6513/abs/373391a0.html, accessed 3 March 2012.
I. Witten and E. Frank, 2005. Data mining: Practical machine learning tools and techniques. Secondedition. Boston: Morgan Kaufman.
A. Wyner and K. Branting, “Preface,” Proceedings of the ICAIL 2011 Workshop: Applying HumanLanguage Technology to the Law, p. ii, and at http://wyner.info/research/Papers/AHLTL2011Papers.pdf,accessed 20 January 2012.
L. Zhou, J. Burgoon, J. Nunamaker and D. Twitchell, 2004. “Automating linguistics–based cues fordetecting deception in text–based asynchronous computer–mediated communications,” Group Decisionand Negotiation, volume 13, number 1, pp. 81–106.
M. Zuckerman, B. DePaulo and R. Rosenthal, 1981. “Verbal and nonverbal communication of deception,”Advances in Experimental Social Psychology, volume 14, pp. 1–59.
Editorial history
Received 25 January 2012; accepted 2 March 2012.
Copyright © 2012, First Monday.Copyright © 2012, Victoria L. Rubin and Niall Conroy.
Discerning truth from deception: Human judgments and automation effortsby Victoria L. Rubin and Niall ConroyFirst Monday, Volume 17, Number 3 - 5 March 2012http://firstmonday.org/ojs/index.php/fm/rt/printerFriendly/3933/3170doi:10.5210/fm.v17i3.3933
Rubin http://firstmonday.org/ojs/index.php/fm/rt/printerFriendly/3933/3170
21 of 21 11/20/2013 8:55 AM


