Embed Size (px)
Citation preview
arX
iv:1
210.
6268
v1 [
astr
o-ph
.SR
] 2
3 O
ct 2
012
Mon. Not. R. Astron. Soc. 000, 1–31 (2012) Printed 8 January 2014 (MN LATEX style file v2.2)
Disc Clearing of Young Stellar Objects: Evidence for Fast
Inside-out Dispersal
C. M. Koepferl1∗, B. Ercolano1,2, J. Dale1,2, P. S. Teixeira3,4, T. Ratzka1, L. Spezzi51Universitatssternwarte Munchen, Ludwig-Maximilians-Universitat, Scheinerstr. 1, 81679 Munchen, Germany2Exzellenzcluster Universe, Boltzmannstr. 2, 85748 Garching bei Munchen, Germany3Institut fur Astrophysik, Universitat Wien, Turkenschanzstr. 17, 1180 Wien, Austria4Laboratorio Associado Instituto D. Luiz-SIM, Universidade de Lisboa, Campo Grande, 1749-016, Lisboa, Portugal5ESO Headquarters, Karl-Schwarzschild-Str. 2, 85748 Garching bei Munchen, Germany
ABSTRACT
The time-scale over which and the modality by which young stellar objects (YSOs)disperse their circumstellar discs dramatically influences the eventual formation andevolution of planetary systems. By means of extensive radiative transfer (RT) mod-elling, we have developed a new set of diagnostic diagrams in the infrared colour-colourplane (K - [24] vs. K - [8]), to aid with the classification of the evolutionary stage ofYSOs from photometric observations. Our diagrams allow the differentiation of sourceswith unevolved (primordial) discs from those evolving according to different clearingscenarios (e.g. homologous depletion vs. inside-out dispersal), as well as from sourcesthat have already lost their disc. Classification of over 1500 sources in 15 nearby star-forming regions reveals that approximately 39% of the sources lie in the primordialdisc region, whereas between 31% and 32% disperse from the inside-out and up to22% of the sources have already lost their disc. Less than 2% of the objects in oursample lie in the homogeneous draining regime. Time-scales for the transition phaseare estimated to be typically a few 105 years independent of stellar mass. Therefore,regardless of spectral type, we conclude that currently available infrared photometricsurveys point to fast (of order 10% of the global disc lifetime) inside-out clearing asthe preferred mode of disc dispersal.
Key words: protoplanetary discs - radiative transfer - disc evolution - homogeneousdraining - accretion - accretion discs - circumstellar matter - planetary systems - stars- pre main-sequence
1 INTRODUCTION
Protoplanetary discs are an unavoidable consequence of thestar formation process and harbour the material from whichplanets may form. For this reason, it is essential to under-stand their properties, evolution and final dispersal. For arecent review on protoplanetary discs and their evolutionsee Williams & Cieza (2011).
The detection and characterisation of circumstellardiscs was a primary goal of the ’Spitzer Space Telecope’(Werner et al. 2004) and successfully featured in the LegacyProgramme ’From Molecular Cores to Planet-Forming Dust’(c2d; Evans et al. (2009)). Allen et al. (2004) compared thepredicted colours of young stellar objects with the photomet-ric data obtained with the ’Infrared Array Camera’ (IRAC;Fazio et al. (2004)). Transitional discs in different youngclusters and associations were identified and classified by
Muzerolle et al. (2010) by using IRAC data and the 24µm-fluxes obtained with MIPS (Rieke et al. 2004). Furlan et al.(2009)investigated the disc evolution in the three promi-nent star-forming regions Taurus, Ophiuchus, and Cha Iand found similar transitional disc fractions in all three re-gions. This study is based on spectroscopic data taken withthe ’Spitzer Infrared Spectrograph’ (Houck et al. 2004). Aspectroscopic study of the young stellar objects in Taurushas been published by Furlan et al. (2011). The mid-infraredvariability of (pre-)transitional disks was investigated withSpitzer (e.g. Espaillat et al. (2011)).
The interpretation of infrared colours in relation tothe evolutionary state of a disc is, however, far from beingtrivial. This is particularly true with regards to the clas-sification of transition discs, the latter being intended asobjects caught in the act of dispersal, i. e. going from disc-bearing to disc-less stars. The modality and time-scales ofdisc dispersal are especially relevant to the planet forma-tion process. In particular, inside-out dispersal from internal
2 Koepferl et al. 2012
photoevaporation (e.g. Clarke et al. (2001); Alexander et al.(2006a,b); Owen et al. (2010, 2011a,b, 2012); Gorti et al.(2009)) could also provide a mechanism to stop migrationand effectively ’park’ planets at a particular location in adisc (e.g. Alexander & Armitage (2009)).
The evolution of the dust component in a discis mirrored by the evolution of colours in the in-frared plane. By means of radiative transfer modelling,Ercolano, Clarke, & Hall (2011, henceforth ECH11) identi-fied the regions in the K - [8] vs. K - [24] plane where pri-mordial discs, discs with inner-holes (i. e. presumably beingdispersed from the inside-out) and discs which lose masshomogeneously at all radii, are expected to be found. Theirstudy, which was limited to M-stars, showed that in the caseof the cluster IC348, most discs disperse from the inside-outand undergo the transition on a short time-scale, as pre-dicted by standard photoionisation models.
These conclusions are in contrast with the conclusions ofCurrie & Kenyon (2009), who claimed instead a large num-ber of ’homogeneously depleting’ discs, for the same cluster.Such discrepancies highlight the need for detailed modellingin the interpretation of IR colours of discs.
The study of ECH11 was restricted to M-stars in onlyone cluster, which prevented the authors from being able tomake a more general statement with regards to disc disper-sal.
In this study we significantly improve on the work ofECH11 by performing further RT calculation to evaluateevolutionary tracks in the IR colour plane for stars of differ-ent spectral types. We then apply our results to the photo-metric data of 15 nearby star-forming regions, that we col-lected from the literature, in order to address the questionof what is the preferred mode of disc dispersal.
In Section 2 we describe our methods and the resultsfrom our radiative transfer calculations and present new evo-lutionary diagnostic diagrams. In Section 3 the collected ob-servational data are briefly described and analysed using thediagrams presented in the previous section. A short sum-mary and conclusions are given in Section 4.
2 THEORETICAL INVESTIGATION
Emission in a given wavelength band is produced by dustgrains of given temperatures and sizes. The temperature ofgrains in a disc for a given central star temperature is de-termined roughly by the grain location within the disc andby the intervening material. Changes in the distribution ofmaterial within a disc are therefore reflected in its emer-gent continuous spectral energy distribution (SED). On thisbasis, the evolution of infrared colours of an object can beused to trace the evolution of its dust density distribution.We extended the work of ECH11 and calculate theoreticalevolutionary tracks in the K - [8] vs. K - [24] plane by meansof radiative transfer calculations for discs of different geom-etry and different evolutionary stage surrounding stars ofdifferent spectral types.
2.1 Modes of Disc Dispersal
We consider three modes of disc dispersal: (i) homoge-neous draining (HD), (ii) inside-out clearing (IOC) and (iii)
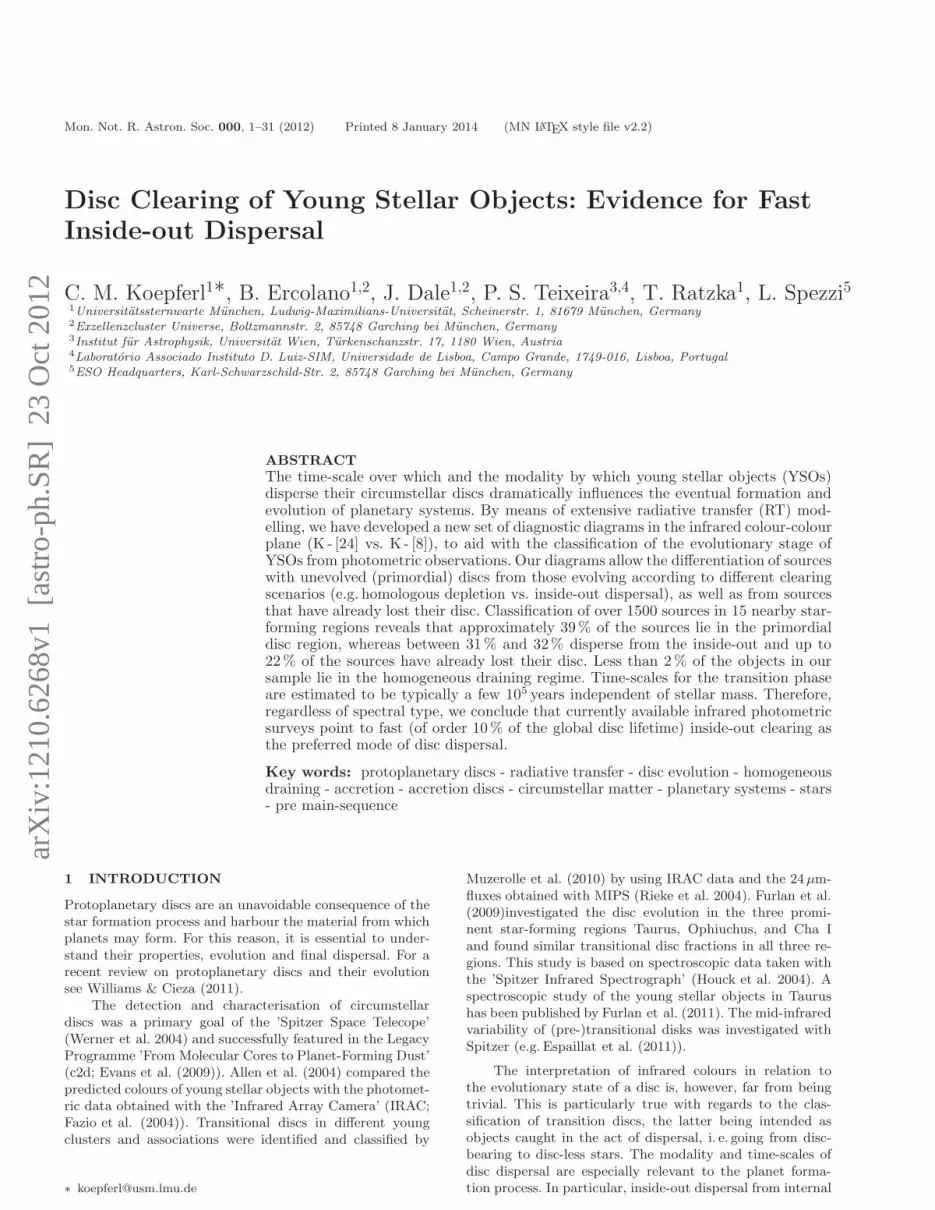
Figure 1. Expected tracks of discs depleting via the three dif-ferent modes of disc dispersal explained in Section 2.1. The OICtrack is marked with a question-mark, since it has been drawn ac-cording to the expectations from the simple thought experiment
described in Section 2.1. But as will be discussed in Section 2.3.1,the real tracks behave somewhat differently.
outside-in clearing (OIC). The expected tracks in the in-frared two-colour plane are sketched in Figure 1.
2.1.1 Homogeneous draining
HD refers to a disc whose surface density decreases homo-geneously at all radii as a function of time, such that thesurface density distribution Σ(t) is self-similar at all times.Such a mode of dispersal would be expected if viscous drain-ing were to act alone, undisturbed until all of the disc mate-rial is accreted onto the central object. In this case the totalmass of the disc evolves roughly as Mdisc ∝ Σ(t) ∝ t−1.5
(Hartmann et al. 1998). In this scenario one would expectdiscs to evolve diagonally on the K - [8] vs. K - [24] plane(see Figure 1) as both the 8µm and the 24µm band fluxesdecrease roughly at the same rate as material is removedhomogeneously at all radii.
2.1.2 Inside-out clearing
IOC refers to discs that disperse via the formation of aninner-hole (classical transition discs), which becomes largerand larger until all material is removed. There is currentlya healthy debate in the literature with regards to possi-ble mechanisms that may be responsible for the formationof discs with inner-holes, of which a large variety is ob-served. Some of these mechanisms include photoevapora-tion by the central object (e.g. Alexander et al. (2006a,b);Owen et al. (2010, 2011a)), planet formation (e.g. Zhu et al.(2011)), grain growth (e.g.Dullemond & Dominik (2005)),close-binary effects (e.g. Ireland & Kraus (2008)) and exter-nal photoevaporation by nearby high-mass stars (e.g. Scally& Clarke 2001). The picture that seems to be currentlyemerging is that of multiple populations of inner-hole ob-jects, some of which may or may not represent objects intransition (e.g. Owen et al. (2012); Owen & Clarke (2012)).It is beyond the scope of this work to explore these differ-ent possibilities; here we will limit ourselves to calculatingSEDs of discs, which, by whatever mechanism, develop in-creasingly larger inner-holes. The IOC tracks are expectedto proceed in a left-facing ’L’-shape (see Figure 1) as thewarmer material in the inner disc is removed first, causing a
Disc Clearing of Young Stellar Objects 3
Table 1. Spectral type intervals and stellar properties.
index SpT T⋆[K] R⋆[R⊙] M⋆[M⊙]
3013427 K4 4590 1.35 1.213014686 K8.5 4060 3.73 0.753002746 M4.5 3305 0.844 0.2283014449 M8 2805 1.8 0.1
drop in the 8µm flux, and the cooler material, responsiblefor most of the 24µm emission, is removed afterwards.
2.1.3 Outside-in clearing
OIC refers to discs that are eroded from the outside-in bya companion star (e.g. Bouwman et al. (2006); Monin et al.(2007); Cieza et al. (2009)) or by radiation from exter-nal sources. External photo-evaporation is for example ob-served in the case of proplyds in the Orion Nebular Clus-ter (e.g. Ricci et al. (2008); McCaughrean & O’Dell (1996);Scally & Clarke (2001)). Whether the entire mass of a disccan be dispersed via this mechanism remains, however, veryuncertain. It is also uncertain what percentage of discs inOB associations and clusters are exposed to strong enoughradiation from nearby massive stars for this process to besignificant. In any case, it is an interesting exercise here toexplore the evolutionary tracks for such a population on theinfrared colour-colour plane. One would naively expect anupside-down ’L’-shape this time, almost a mirror-image ofthe IOC tracks (see Figure 1), as the 24µm flux should dropbefore the 8µm flux. This is, however, not necessarily thecase, as will be discussed in Section 2.3.1.
2.2 Numerical Set-up
We use the 2-dimensional Monte Carlo dust radiative trans-fer code of Whitney et al. (2003a,b), which is routinelyapplied to the modelling of the SEDs of protoplanetarydiscs (e. g. Robitaille et al. (2006, 2007), ECH11). We de-rive evolutionary tracks for stars of spectral types K4,K8.5, M4.5 and M8, using the stellar atmosphere models(Castelli & Kurucz (2004); Brott & Hauschildt (2005)) fromthe library used by Robitaille et al. (2006) and available on-line at http://caravan.astro.wisc.edu/protostars/. Ta-ble 1 summarises the stellar parameters and provides indicesfor the atmosphere files used. Table 2 lists the other inputparameters used in the 1287 radiative transfer models. Adetailed description of the geometrical set-up and the inputparameters is given in Robitaille et al. (2006).
We follow ECH11 and consider several disc geometriesexploring first the evolution of razor-thin discs for differentdispersal modes and then extend our study to discs of finitethickness (Table 3).
2.3 Results
2.3.1 Razor-thin discs
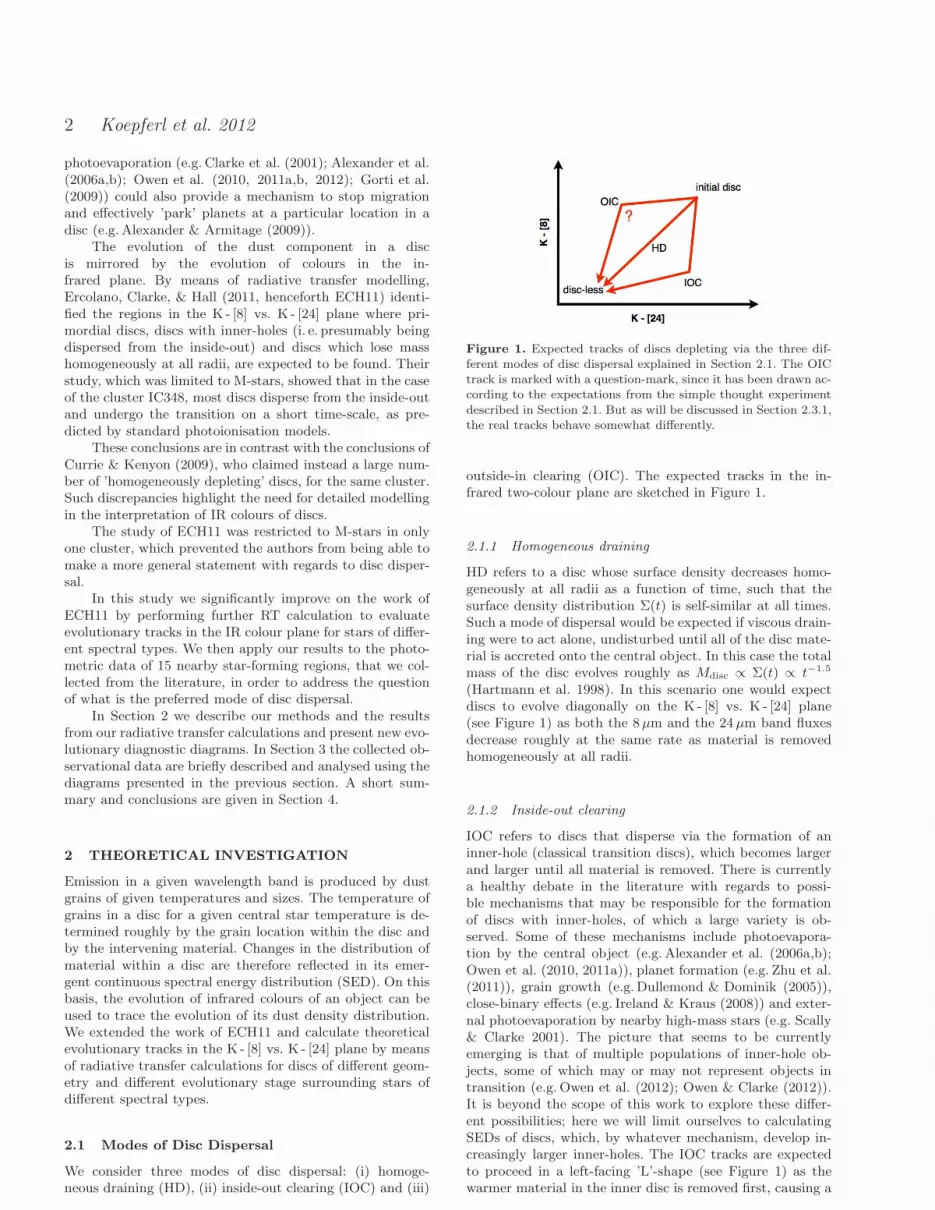
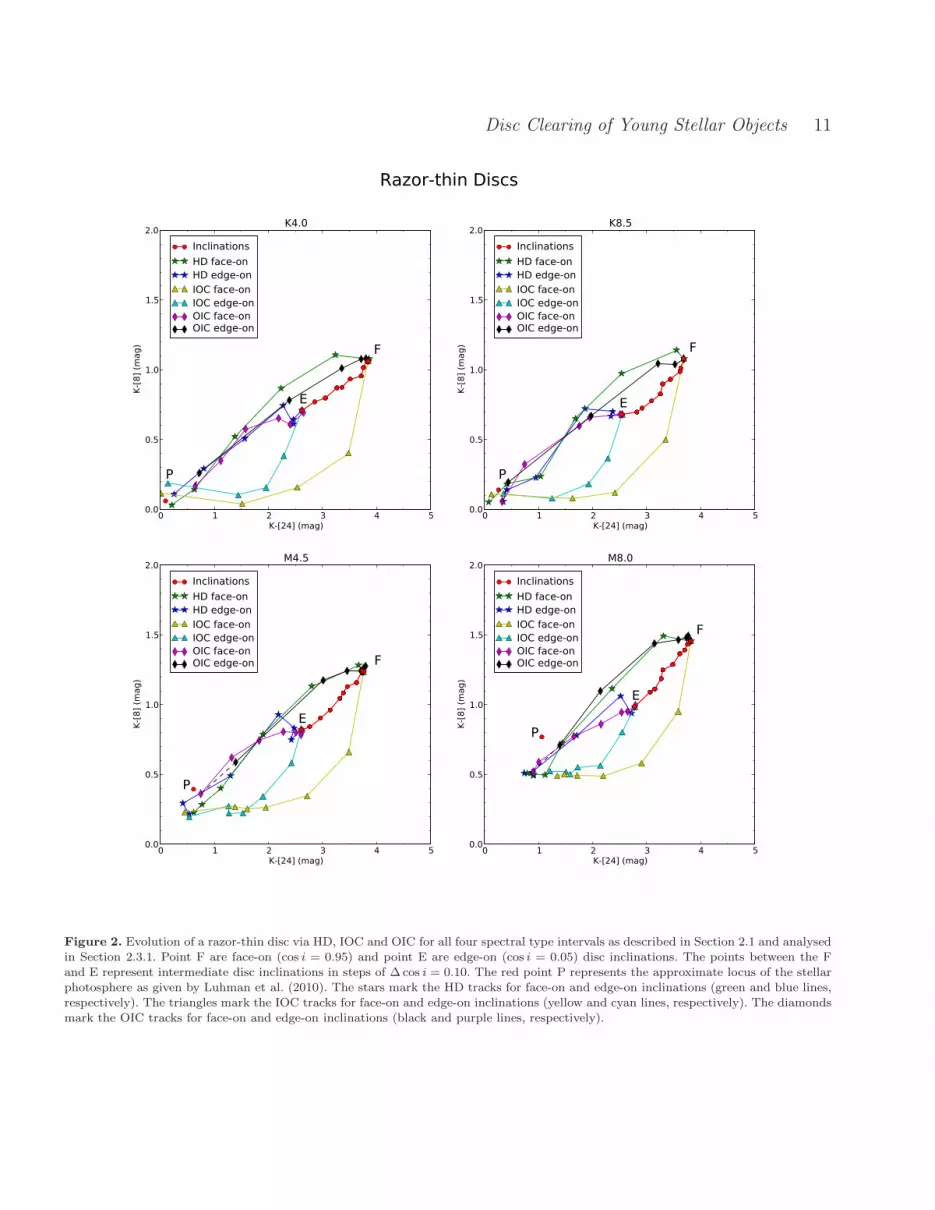
Figure 2 summarises the tracks for razor-thin discs in thefour spectral type intervals considered here. Point F are face-on (cos i = 0.95) and point E are edge-on (cos i = 0.05) disc
Table 2. Input parameter ranges used in our simulations(see also Whitney et al. (2003a,b) and Robitaille et al. (2006)for a detailed description).
parameter range sequence
Mdisc 10−2 M⋆ initial, IOC, OICMdisc (10−2 − 10−8)M⋆ HDrdisc(max) 100AU initial, IOC, HDrdisc(max) (0.02 − 100)AU OICrdisc(min) 1Rsub
a initial, OIC, HD
rdisc(min) 1− 30Rsub IOC b
rdisc(min) 1− 5000Rsub IOC c
HDd 0.0001 - 1.0 initial, IOC, OIC, HD
Ae 2.0− 2.25 initial, IOC, OIC, HD
Bf 1.0− 1.25 initial, IOC, OIC, HDαdisc
g 10−10 initial, IOC, OIC, HD
Mass infall rateh 10−15M⊙/yr initial, IOC, OIC, HDAperture 100000AU initial, IOC, OIC, HD
a sublimation radiusb razor-thinc finite thicknessd disc scale-height, see also Table 3e disc density exponent (∼ r−α)f disc scale height exponent (∼ rβ); see also Table 3g effectively no viscous heatingh effectively no envelope
inclinations. The points between the F and E represent in-termediate disc inclinations in steps of ∆ cos i = 0.10. PointP shows the approximate location of disc-less objects. Thestars mark the HD tracks for face-on and edge-on inclina-tions (green and blue lines, respectively). The triangles markthe IOC tracks for face-on and edge-on inclinations (yellowand cyan lines, respectively). The diamonds mark the OICtracks for face-on and edge-on inclinations (black and purplelines, respectively).
As expected (discussed in Section 2.1.1 and sketched inFigure 1), the HD tracks follow a diagonal trajectory frompoints F and E to P, while the IOC tracks show the typi-cal left-facing ’L’-shape also reported by ECH11 for M-starmodels. The OIC tracks in Figure 2, however, do not showthe upside-down ’L’-shape suggested by our simple-mindedthought experiment (see Section 2.1.3). This is because the24µm emission is not dominated by material at large radiiin the disc, but contains a significant contribution from ma-terial in the inner disc that is located deeper inside and ishence cooler.
2.3.2 Discs with finite-thickness
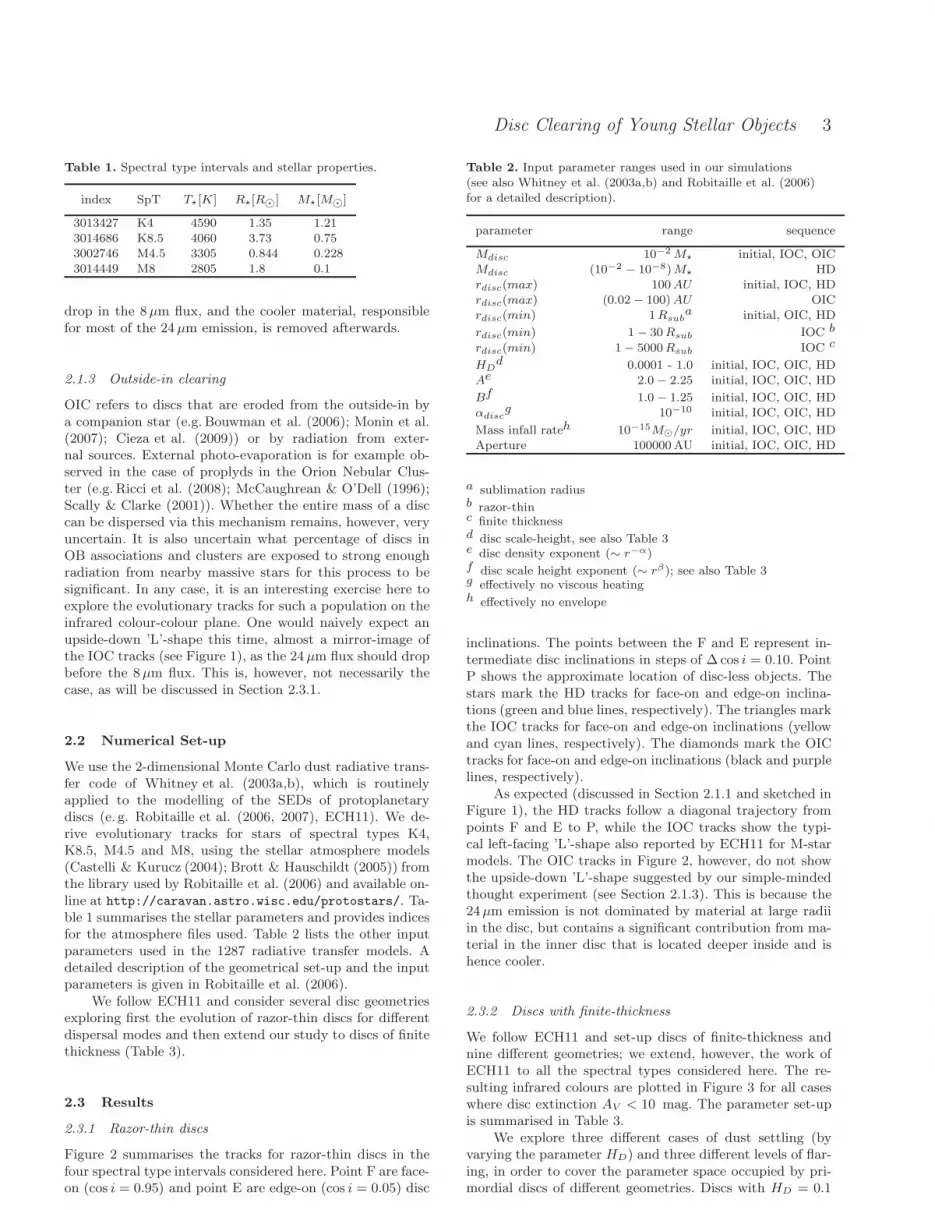
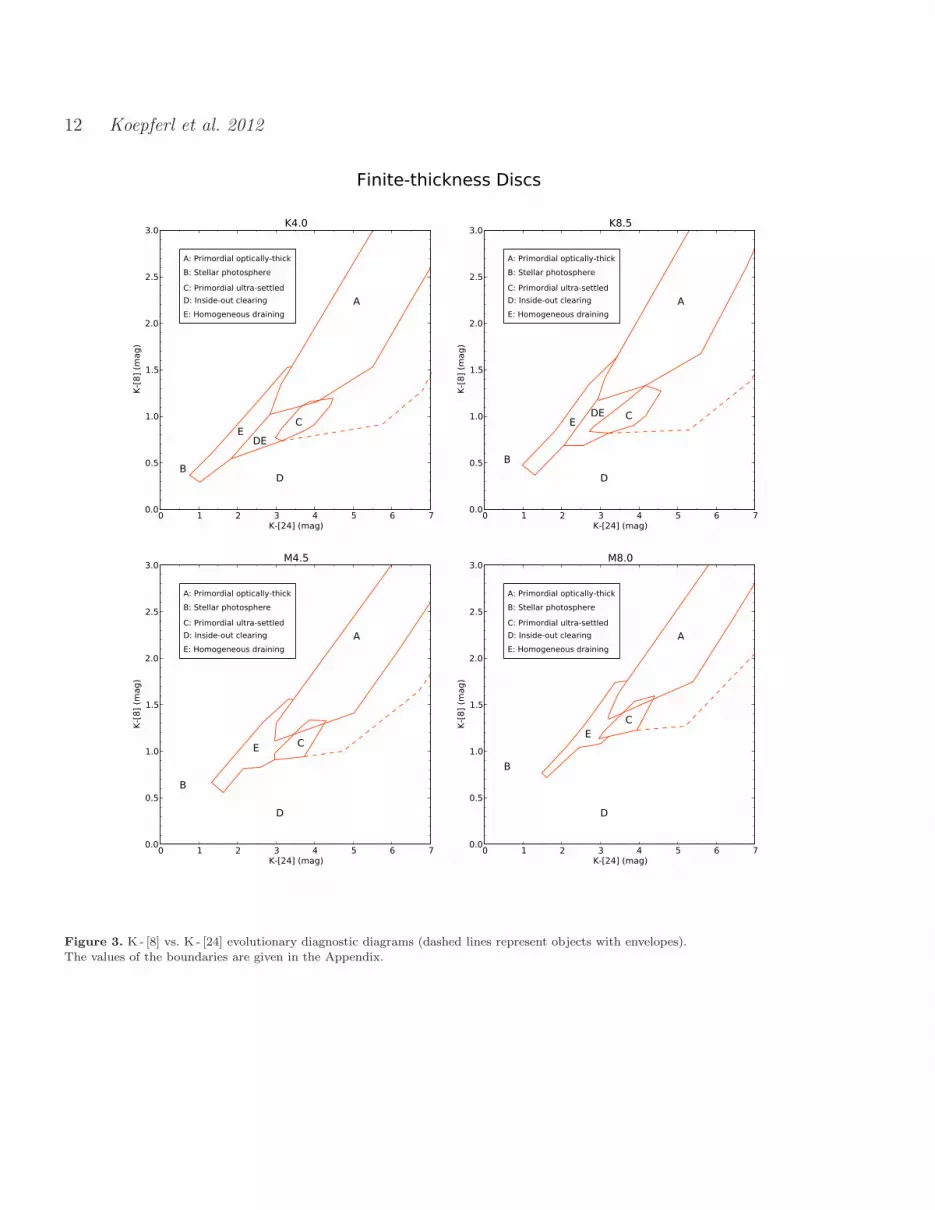
We follow ECH11 and set-up discs of finite-thickness andnine different geometries; we extend, however, the work ofECH11 to all the spectral types considered here. The re-sulting infrared colours are plotted in Figure 3 for all caseswhere disc extinction AV < 10 mag. The parameter set-upis summarised in Table 3.
We explore three different cases of dust settling (byvarying the parameter HD) and three different levels of flar-ing, in order to cover the parameter space occupied by pri-mordial discs of different geometries. Discs with HD = 0.1
4 Koepferl et al. 2012
Table 3. Modelling parameters of primordial discs.
flaring mixing
disc kind B a b c HDd e f
−→ −→
razor-thin 1.0 x 0.0001 x
ultra-settled 1.0 x 0.1 x
optically thick1.0 x 0.5 x1.0 x 1.0 x
ultra-settled 1.13 x 0.1 x
optically thick1.13 x 0.5 x1.13 x 1.0 x
ultra-settled 1.25 x 0.1 x
optically thick1.25 x 0.5 x1.25 x 1.0 x
a constant opening angleb flaredc strongly flaredd strongly settlede settledf mixed
are named ’primordial ultra-settled’, while those with alarger HD > 0.5 are named ’primordial optically-thick’ discs.We note that HD also influences the inner wall height, whichmay be the main source of variation of the NIR/ MIRcolours.
By inspection of the locus occupied by the evolutionarytracks of primordial (ultra-settled and optically-thick) discs,we define boundary boxes in the two-colour plane. Our re-sults are summarised in Figure 3. As for the razor-thin case,we carried out radiative transfer calculations to track thecolour evolution of each of our primordial (ultra-settled oroptically-thick) discs as they disperse via HD and IOC, al-lowing us to further identify the expected locus of objects insuch evolutionary stages. For the sake of clarity, the tracksare not plotted in Figure 3, where only the derived bound-ary boxes are shown. In particular the boxes are labelled asA, B, C, D, E for ’primordial optically-thick’ discs, disc-lesssources, ’primordial ultra-settled’ discs, IOC and HD respec-tively. Due to the overlap in the evolving discs regimes D andE, we cannot discriminate between HD and IOC for thoseobjects observed in DE. As will be shown later, however,only a very small minority of the observational sample liesin this regime.
Additionally, we run a set of models to allow us to con-strain the locus of envelope objects and estimate the con-tamination of the IOC objects by this sample. We set up576 objects with envelopes (see Whitney et al. (2003a)) fora selection of cavity angles (10◦ to 90◦) and envelope infallrates (10−6M⊙/yr to 10−9M⊙/yr). Objects with envelopesand high infall rates show the greatest overlap with the IOCregion, whereas objects with less infall are bluer. We haveindicated the locus of these models with a dashed line in Fig-ure 3 above which envelope objects lie. By comparing withobservational data (see Section 3), we found, that primor-dial discs with envelopes might introduce a contaminationin the IOC statistics of at most 10%. This bias has to bekept in mind when considering the raw statistics of the up-coming section. The boundary points of each box are listedin Appendix A.
3 ANALYSIS AND DISCUSSION
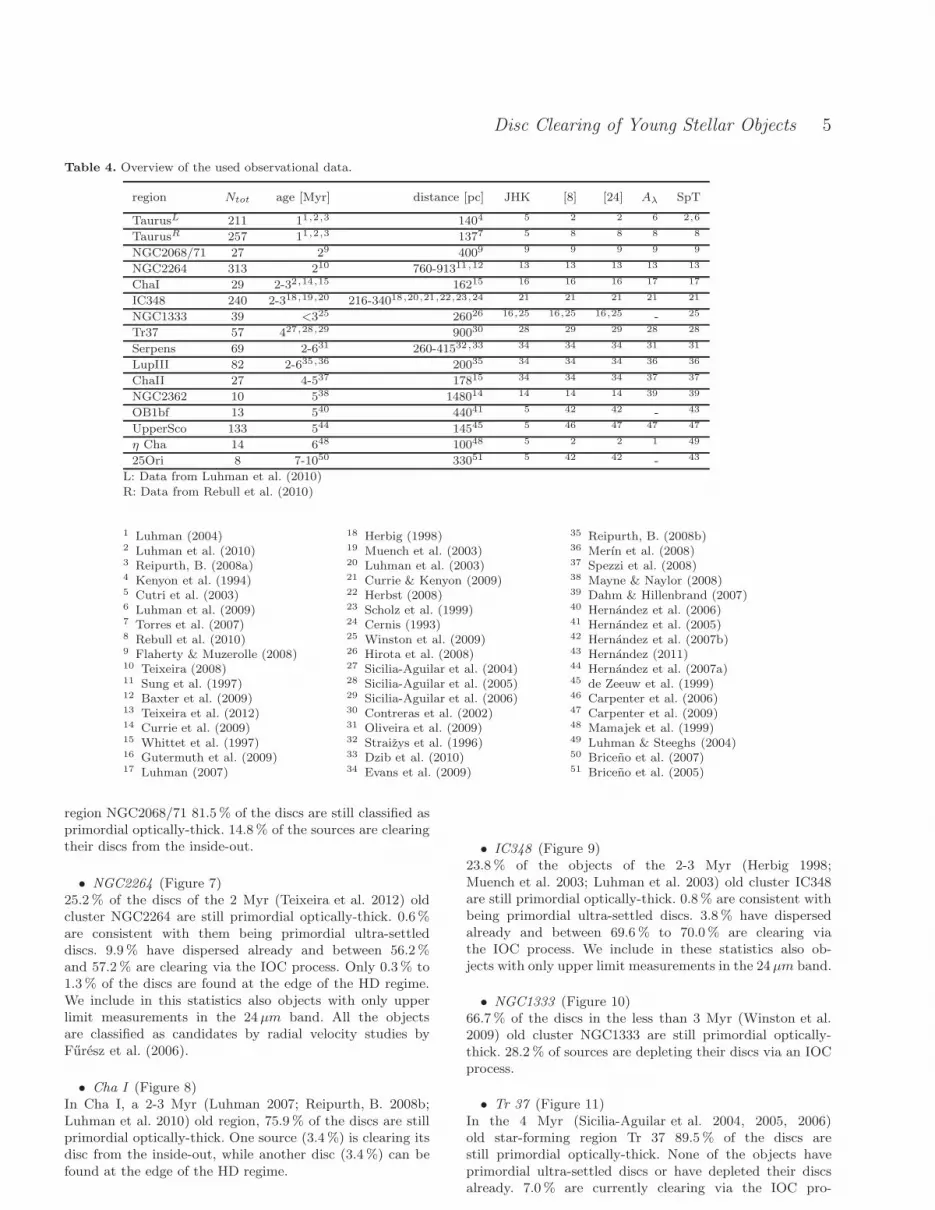
Our classification scheme, based on the radiative transfermodelling described in Section 2.2, allows us to use cur-rently available infrared photometric surveys from nearbystar-forming regions in order to address the question of whatis the preferential mode of disc dispersal. We have collectedK-band, 8µm and 24µm band data, as well as spectral typesand extinction measurements of YSOs in 15 nearby star-forming regions. Table 4 lists the references for the data andsummarises some of the physical properties of the regions.
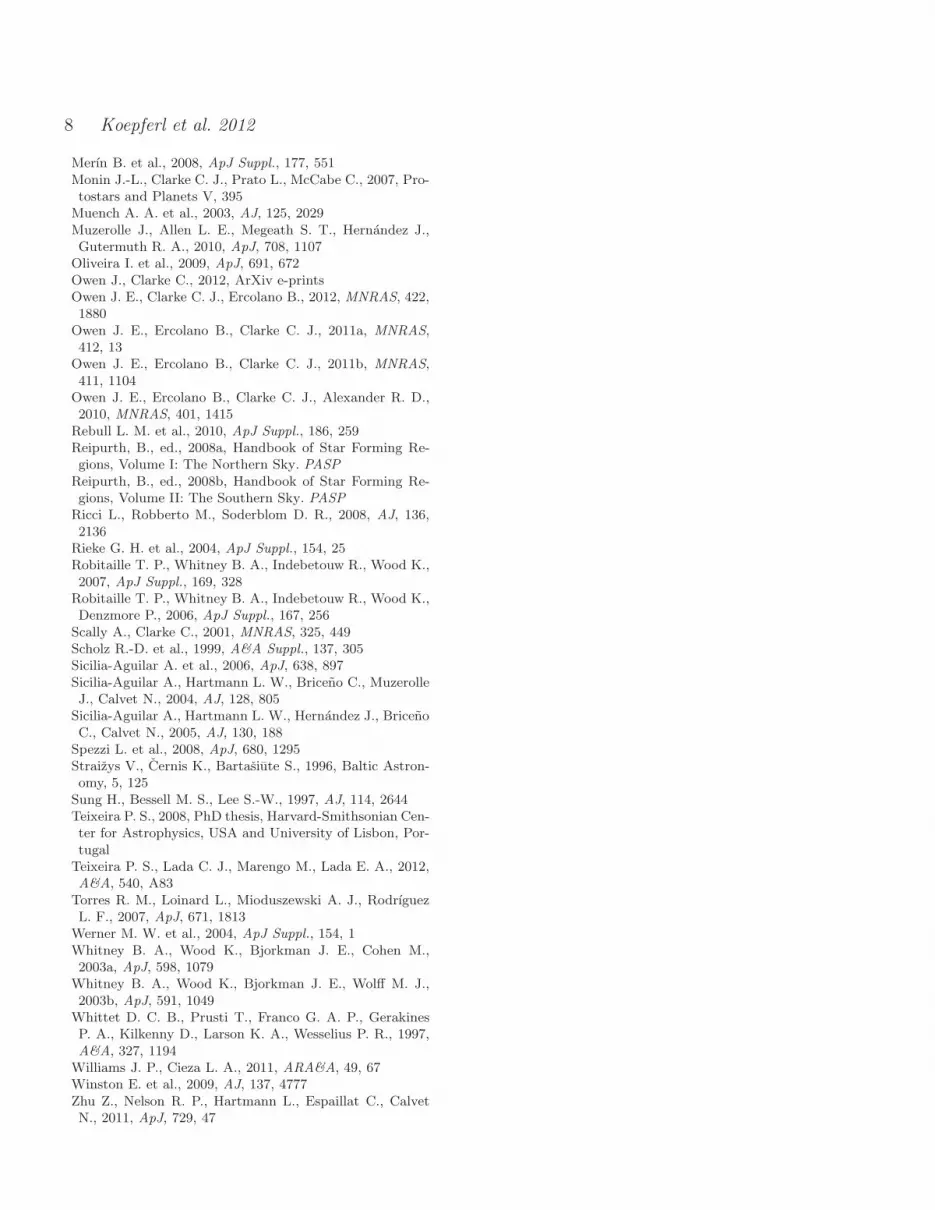
We applied our colour-colour diagnostic diagrams toclassify 1529 objects in 15 nearby star-forming regions. Thenumber statistics in each evolutionary stage and for eachspectral type regime are presented in Table 5. It is worthnoticing here, that we deal in most cases with small num-ber statistics; for this reason we provide actual numbers inTable 5 rather than percentages. In what follows, however,we prefer to use percentages in order to simplify the dis-cussion. The standard statistical errors (e.g.
√N), however,
should be kept in mind when considering the raw percent-ages given. Given the overlap between regions D (IOC) andE (HD), discussed in the previous section, we can only pro-vide upper and lower limits to the count sources in theseregimes.
In summary, 38.9% of the objects out of the entire sam-ple lie in the primordial disc region whereas between 31.3%and 31.9% disperse their discs from the inside-out and up to21.7% of the sources have already lost their disc. So, almosta third of the available sources are currently clearing theirdiscs from the inside-out. Only between 1.5% and 2.0% ofthe objects lie in the homogeneous draining region E. We in-terpret this result as strong evidence against homogeneousdisc depletion as the main disc dispersal mode.
Figures 4 to 19 show the results for individual star-forming regions, which are also briefly summarised in thenext section. The regions are sorted by age.
3.1 Analysis
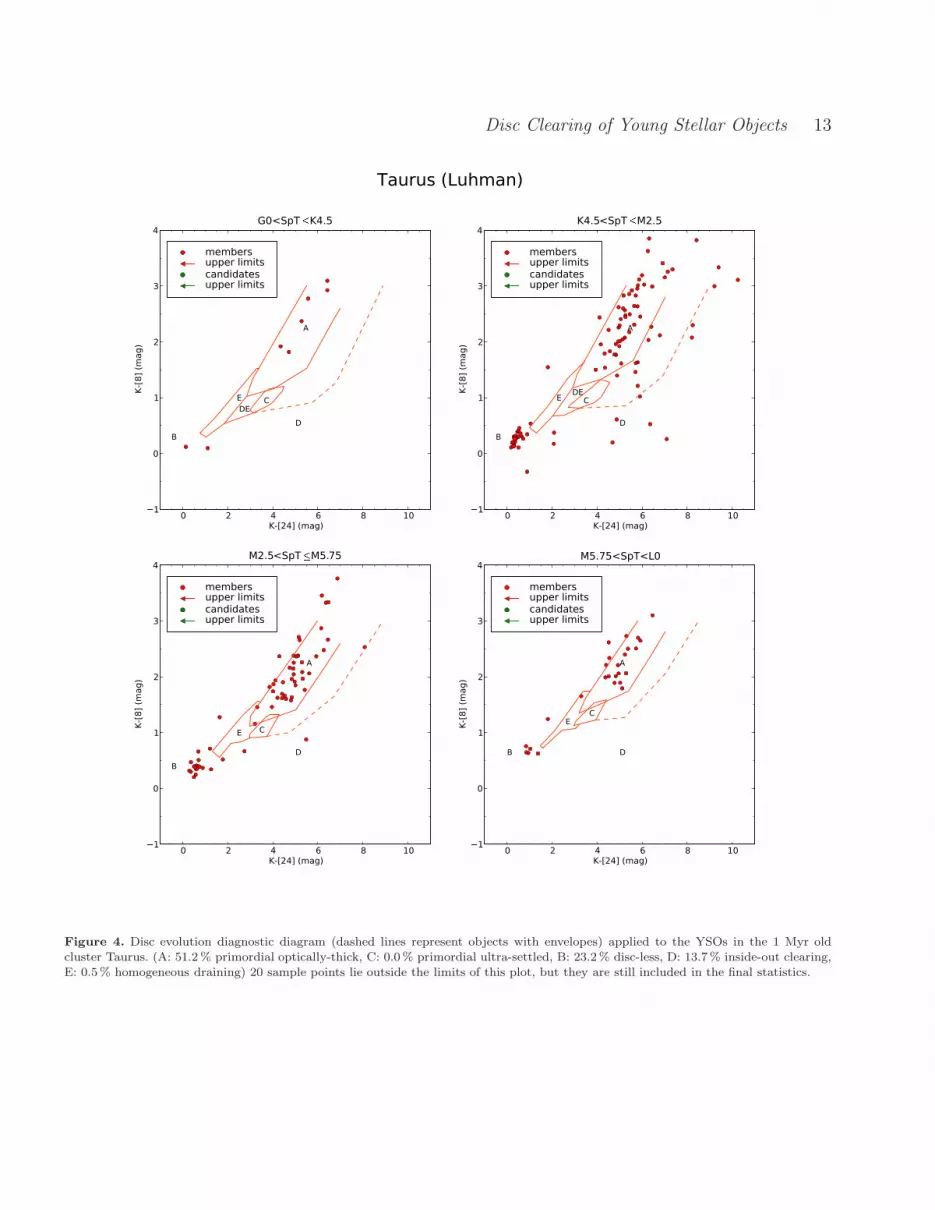
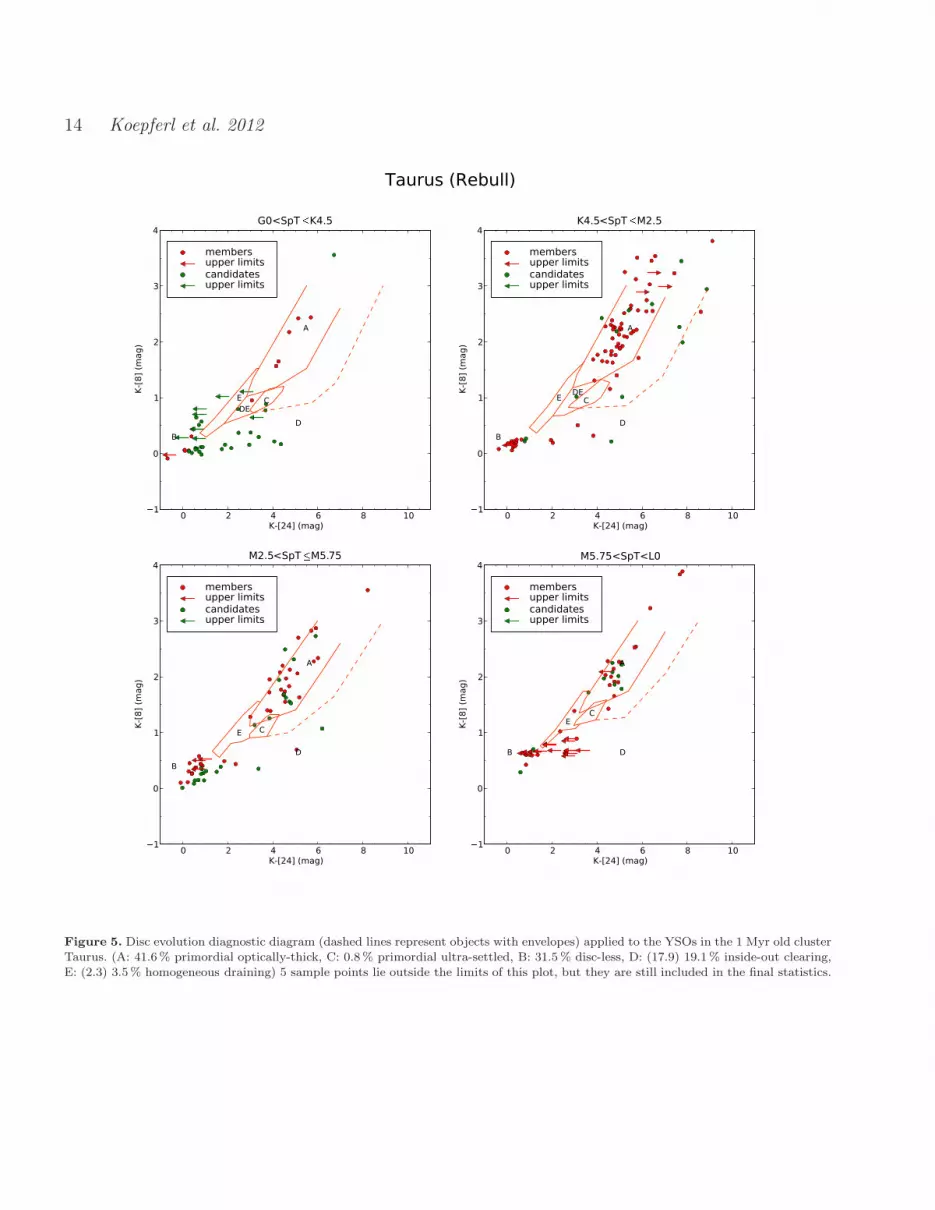
• Taurus (Figure 4, 5)For this 1 Myr (Luhman 2004; Luhman et al. 2010;Reipurth, B. 2008a) old region we have collected data bothfrom Luhman et al. (2010) and Rebull et al. (2010). Thestatistics differ when using the two compilations as detailedin what follows. 51.2% and 41.6% of the Luhman and theRebull discs, respectively, are still primordial optically-thick. None of the Luhman objects are consistent with beingprimordial ultra-settled discs, while 0.8% of the Rebullsources fall in this category. 23.2 % and 31.5% of objectsin the Luhman and Rebull compilations, respectively, havealready lost their discs. Currently, 13.7% of the Luhmansources are depleting their discs via the IOC, while between17.9% and 19.1% of the Rebull objects are undergoingthat process. Only one disc (0.5%) of the Luhman objectsand between 2.3% and 3.5% of the Rebull sources lie inHD region. In the Rebull case we also considered upperand lower limits in the 24µm band as well as candidates byRebull et al. (2010).
• NGC2068/71 (Figure 6)In the 2 Myr (Flaherty & Muzerolle 2008) old star-forming
Disc Clearing of Young Stellar Objects 5
Table 4. Overview of the used observational data.
region Ntot age [Myr] distance [pc] JHK [8] [24] Aλ SpT
TaurusL 211 11,2,3 1404 5 2 2 6 2,6
TaurusR 257 11,2,3 1377 5 8 8 8 8
NGC2068/71 27 29 4009 9 9 9 9 9
NGC2264 313 210 760-91311,12 13 13 13 13 13
ChaI 29 2-32,14,15 16215 16 16 16 17 17
IC348 240 2-318,19,20 216-34018,20,21,22,23,24 21 21 21 21 21
NGC1333 39 <325 26026 16,25 16,25 16,25 - 25
Tr37 57 427,28,29 90030 28 29 29 28 28
Serpens 69 2-631 260-41532,33 34 34 34 31 31
LupIII 82 2-635,36 20035 34 34 34 36 36
ChaII 27 4-537 17815 34 34 34 37 37
NGC2362 10 538 148014 14 14 14 39 39
OB1bf 13 540 44041 5 42 42 - 43
UpperSco 133 544 14545 5 46 47 47 47
η Cha 14 648 10048 5 2 2 1 49
25Ori 8 7-1050 33051 5 42 42 - 43
L: Data from Luhman et al. (2010)R: Data from Rebull et al. (2010)
1 Luhman (2004)2 Luhman et al. (2010)3 Reipurth, B. (2008a)4 Kenyon et al. (1994)5 Cutri et al. (2003)6 Luhman et al. (2009)7 Torres et al. (2007)8 Rebull et al. (2010)9 Flaherty & Muzerolle (2008)10 Teixeira (2008)11 Sung et al. (1997)12 Baxter et al. (2009)13 Teixeira et al. (2012)14 Currie et al. (2009)15 Whittet et al. (1997)16 Gutermuth et al. (2009)17 Luhman (2007)
18 Herbig (1998)19 Muench et al. (2003)20 Luhman et al. (2003)21 Currie & Kenyon (2009)22 Herbst (2008)23 Scholz et al. (1999)24 Cernis (1993)25 Winston et al. (2009)26 Hirota et al. (2008)27 Sicilia-Aguilar et al. (2004)28 Sicilia-Aguilar et al. (2005)29 Sicilia-Aguilar et al. (2006)30 Contreras et al. (2002)31 Oliveira et al. (2009)32 Straizys et al. (1996)33 Dzib et al. (2010)34 Evans et al. (2009)
35 Reipurth, B. (2008b)36 Merın et al. (2008)37 Spezzi et al. (2008)38 Mayne & Naylor (2008)39 Dahm & Hillenbrand (2007)40 Hernandez et al. (2006)41 Hernandez et al. (2005)42 Hernandez et al. (2007b)43 Hernandez (2011)44 Hernandez et al. (2007a)45 de Zeeuw et al. (1999)46 Carpenter et al. (2006)47 Carpenter et al. (2009)48 Mamajek et al. (1999)49 Luhman & Steeghs (2004)50 Briceno et al. (2007)51 Briceno et al. (2005)
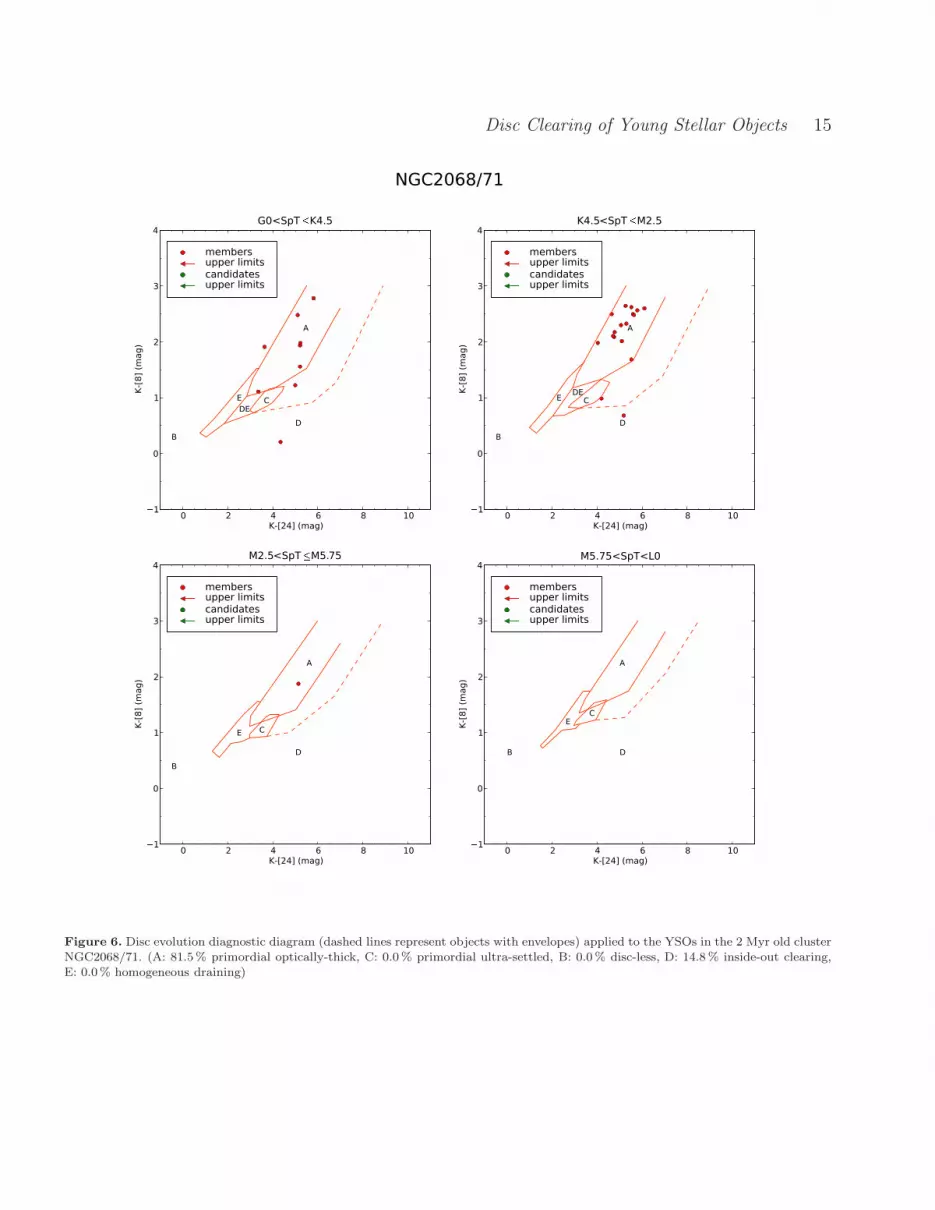
region NGC2068/71 81.5% of the discs are still classified asprimordial optically-thick. 14.8% of the sources are clearingtheir discs from the inside-out.
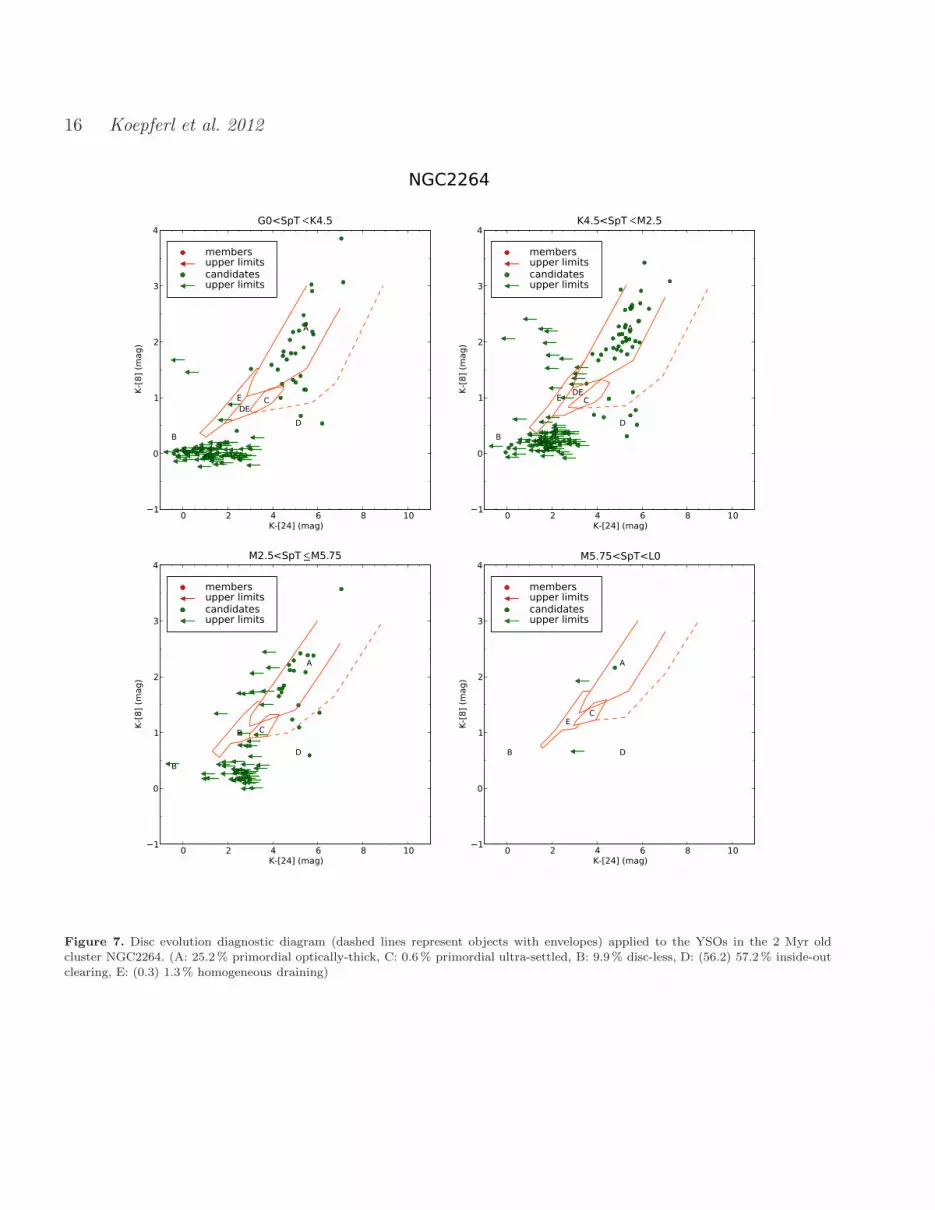
• NGC2264 (Figure 7)25.2% of the discs of the 2 Myr (Teixeira et al. 2012) oldcluster NGC2264 are still primordial optically-thick. 0.6%are consistent with them being primordial ultra-settleddiscs. 9.9% have dispersed already and between 56.2%and 57.2% are clearing via the IOC process. Only 0.3% to1.3% of the discs are found at the edge of the HD regime.We include in this statistics also objects with only upperlimit measurements in the 24µm band. All the objectsare classified as candidates by radial velocity studies byFuresz et al. (2006).
• Cha I (Figure 8)In Cha I, a 2-3 Myr (Luhman 2007; Reipurth, B. 2008b;Luhman et al. 2010) old region, 75.9% of the discs are stillprimordial optically-thick. One source (3.4%) is clearing itsdisc from the inside-out, while another disc (3.4%) can befound at the edge of the HD regime.
• IC348 (Figure 9)23.8% of the objects of the 2-3 Myr (Herbig 1998;Muench et al. 2003; Luhman et al. 2003) old cluster IC348are still primordial optically-thick. 0.8% are consistent withbeing primordial ultra-settled discs. 3.8% have dispersedalready and between 69.6% to 70.0% are clearing viathe IOC process. We include in these statistics also ob-jects with only upper limit measurements in the 24µm band.
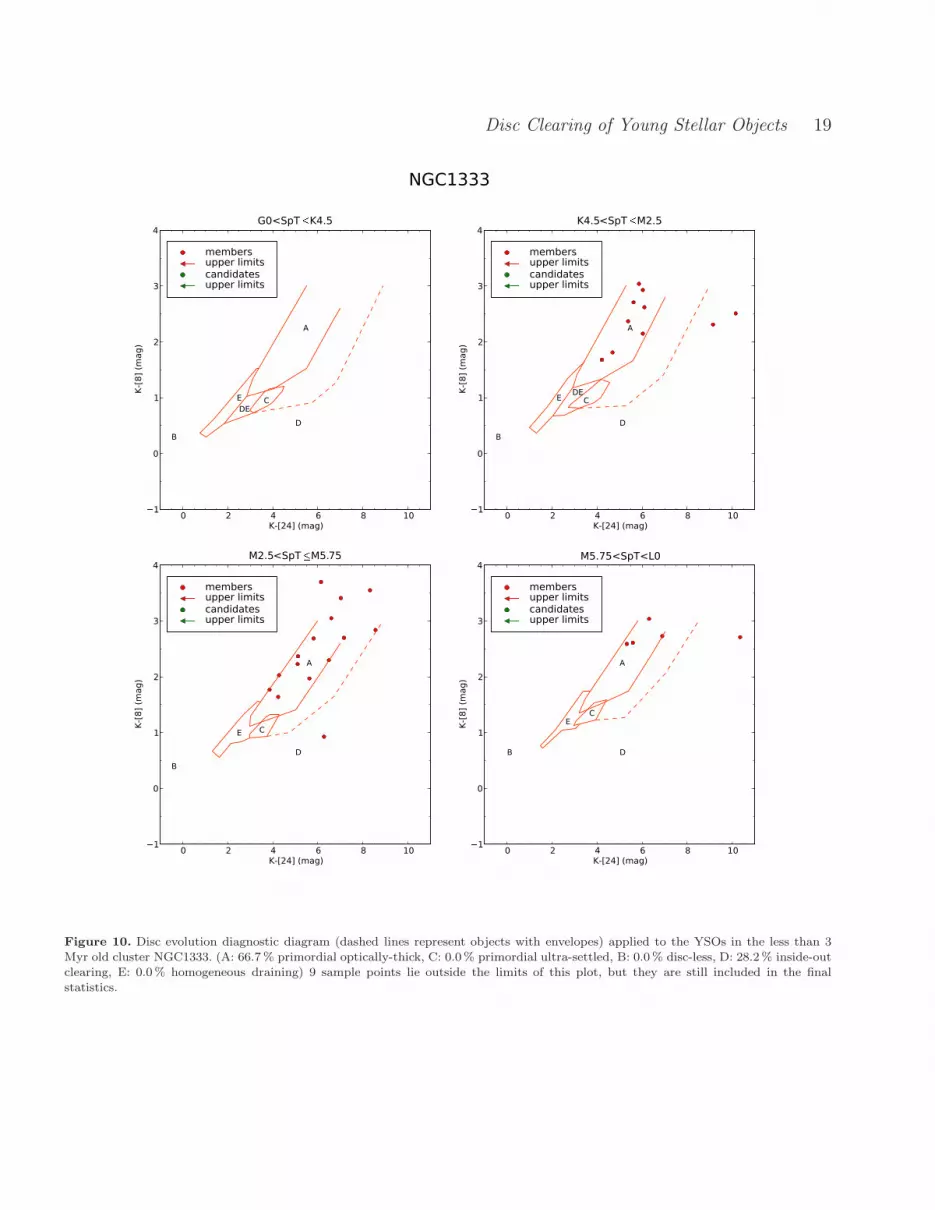
• NGC1333 (Figure 10)66.7% of the discs in the less than 3 Myr (Winston et al.2009) old cluster NGC1333 are still primordial optically-thick. 28.2 % of sources are depleting their discs via an IOCprocess.
• Tr 37 (Figure 11)In the 4 Myr (Sicilia-Aguilar et al. 2004, 2005, 2006)old star-forming region Tr 37 89.5% of the discs arestill primordial optically-thick. None of the objects haveprimordial ultra-settled discs or have depleted their discsalready. 7.0% are currently clearing via the IOC pro-

6 Koepferl et al. 2012
cess. For Tr 37 no sources are found in the HD region.Note, that we also included YSO candidates in our statistics.
• Serpens (Figure 12)For the 2-6 Myr (Oliveira et al. 2009) old cluster Serpens wehave classified 40.6% of the discs as primordial optically-thick and one disc (1.4%) as primordial ultra-settled.18.8% of the objects have already lost their discs. Betweenseven (10.1%) and eight (11.6%) discs are undergoing IOC.Between seven (10.1%) and eight (11.6 %) discs lie in theHD regime. Candidates are included in the statistics. 37.5%of the objects in the HD box are classified as candidates byOliveira et al. (2009).
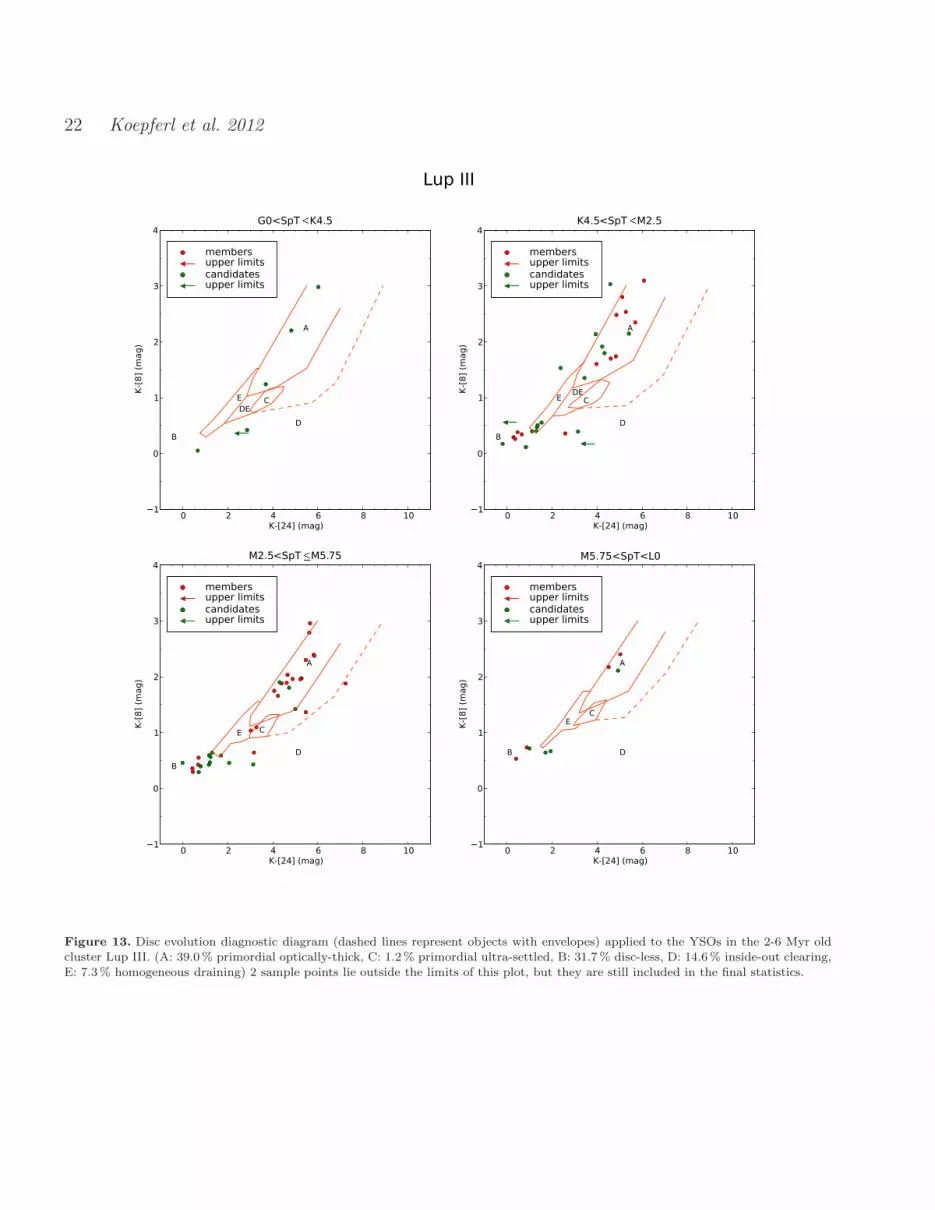
• Lup III (Figure 13)39.0% of the discs in the 2-6 Myr (Reipurth, B. 2008b;Merın et al. 2008) old star-forming cluster Lup III arestill primordial optically-thick. One disc (1.2%) has beenclassified as primordial ultra-settled. 14.6% of discs areundergoing IOC, while 31.7% have already dispersed theirdiscs. We also included YSO candidates and sources forwhich only upper limits in the 24µm flux are available inour statistics. In Lup III 7.3% of the discs are found at thephotosphere edge of the HD regime. These sources are stillclassified as candidates by Merın et al. (2008).
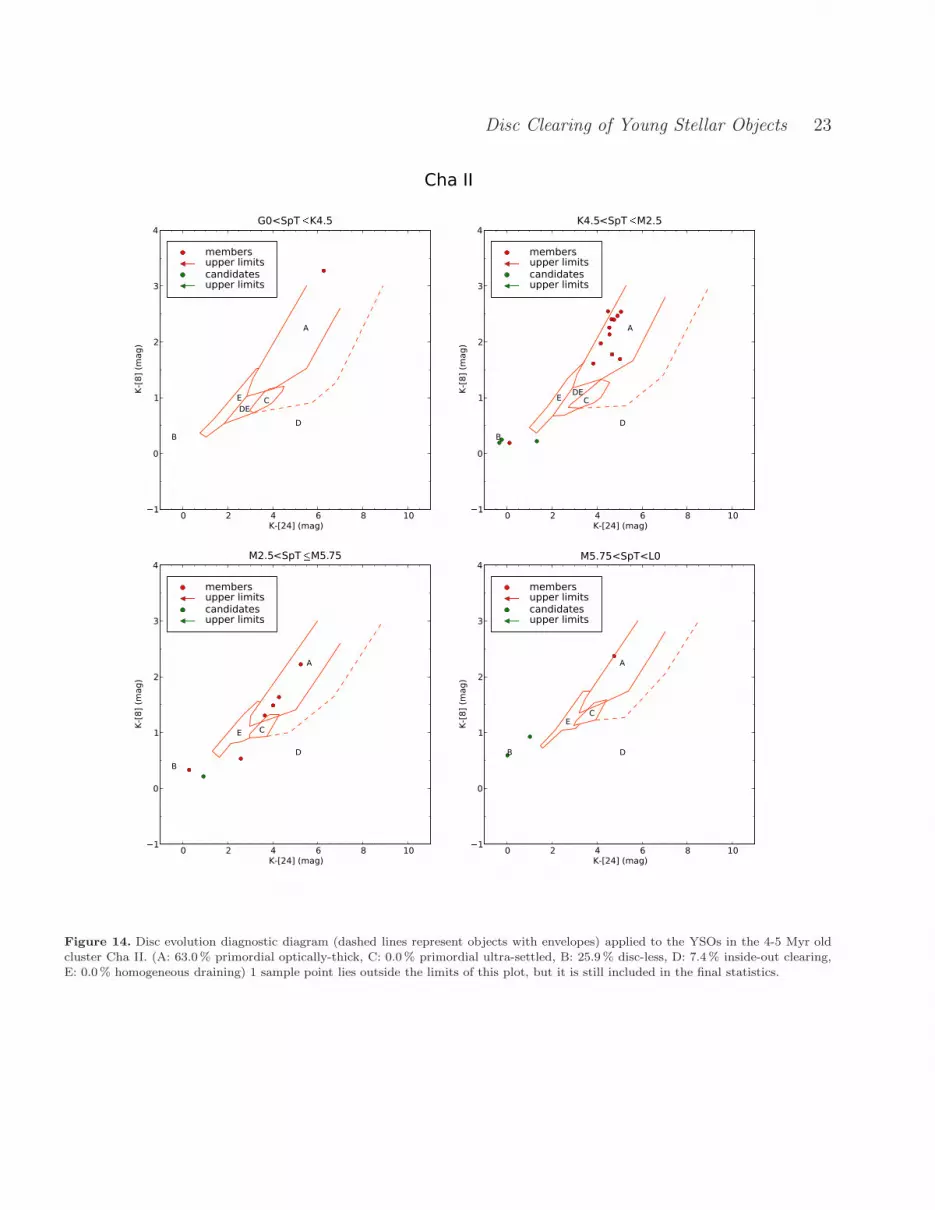
• Cha II (Figure 14)In the 4 -5 Myr (Spezzi et al. 2008) old star-forming regionCha II 63% of the discs have been classified as primordialoptically-thick, while 25.9% have already depleted theirdiscs. 7.4% of the objects are clearing their disc from theinside-out. For ChaII no discs are found in the HD region.We included candidates in our statistics.
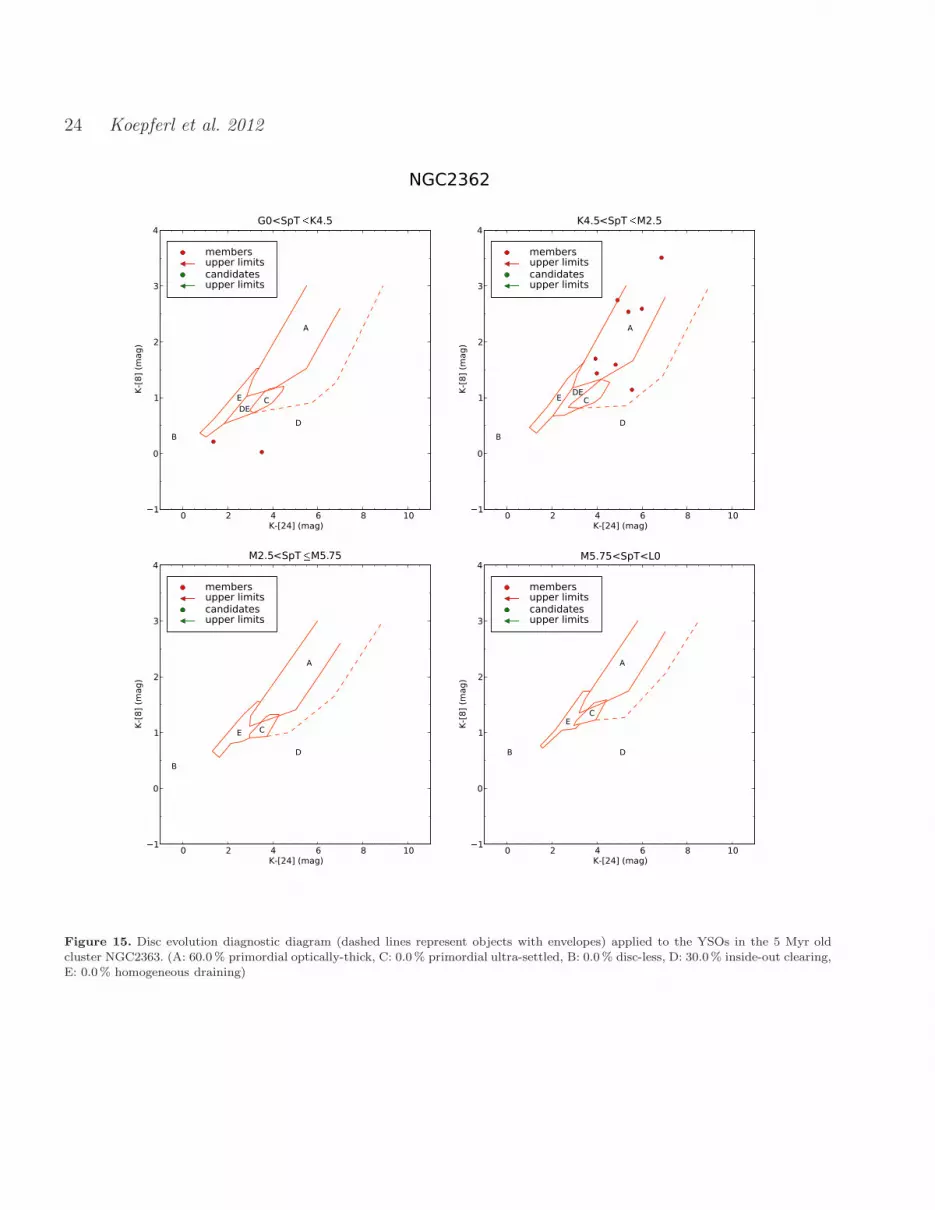
• NGC2362 (Figure 15)The 5 Myr (Mayne & Naylor 2008) old cluster NGC2362has few spectroscopically-classified objects and/ or fewdetected sources in the 24µm band. 60.0% of the sourcesare still primordial optically-thick while none are classifiedas primordial ultra-settled discs or have lost their discsalready. 30.0% are clearing their discs via an IOC process.
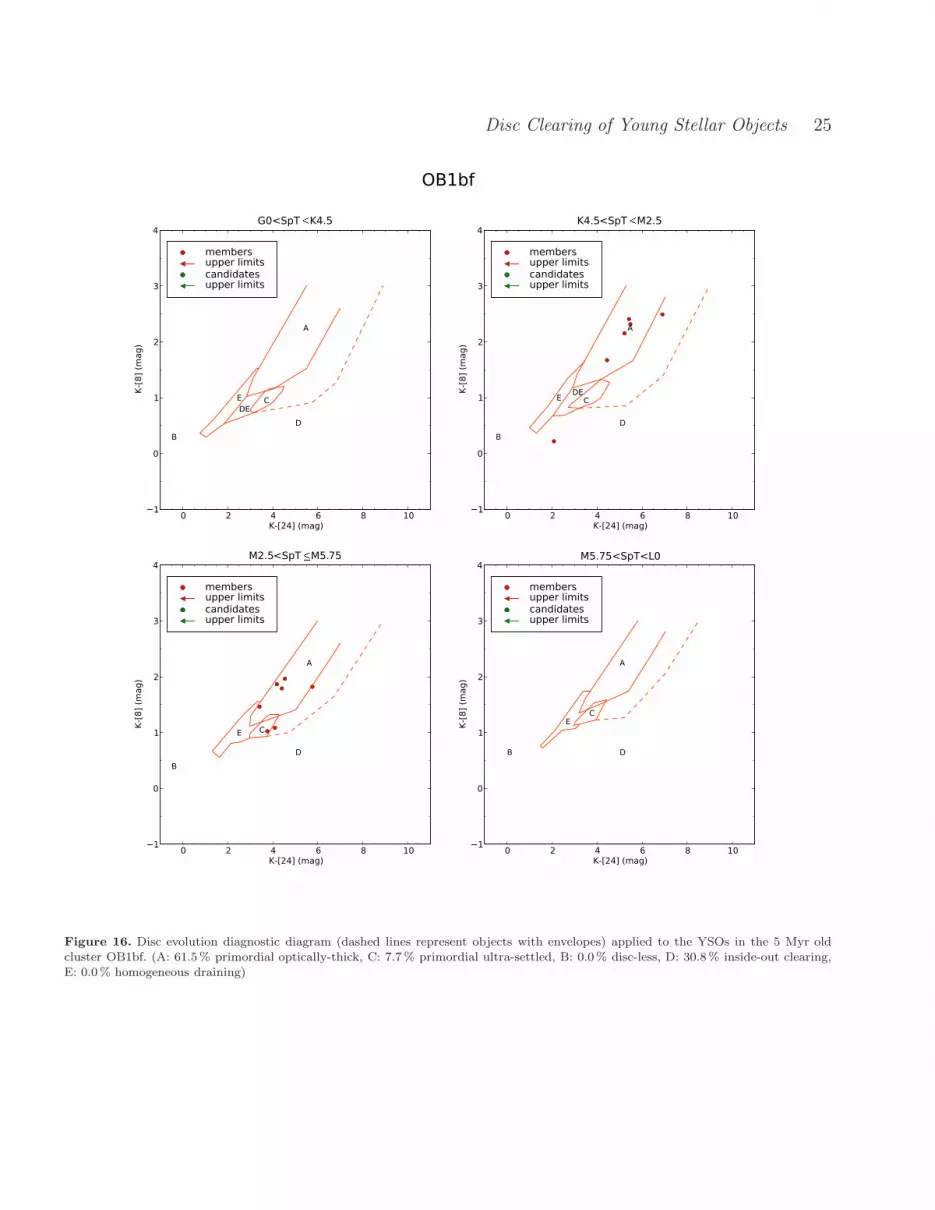
• OB1bf (Figure 16)61.5% of the discs in the 5 Myr (Hernandez et al. 2006)old star-forming region OB1bf are still primordial optically-thick discs and one disc (7.7%) is classified as primordialultra-settled. 30.8% of the sources are clearing via the IOCprocess but no sources have lost their discs so far.
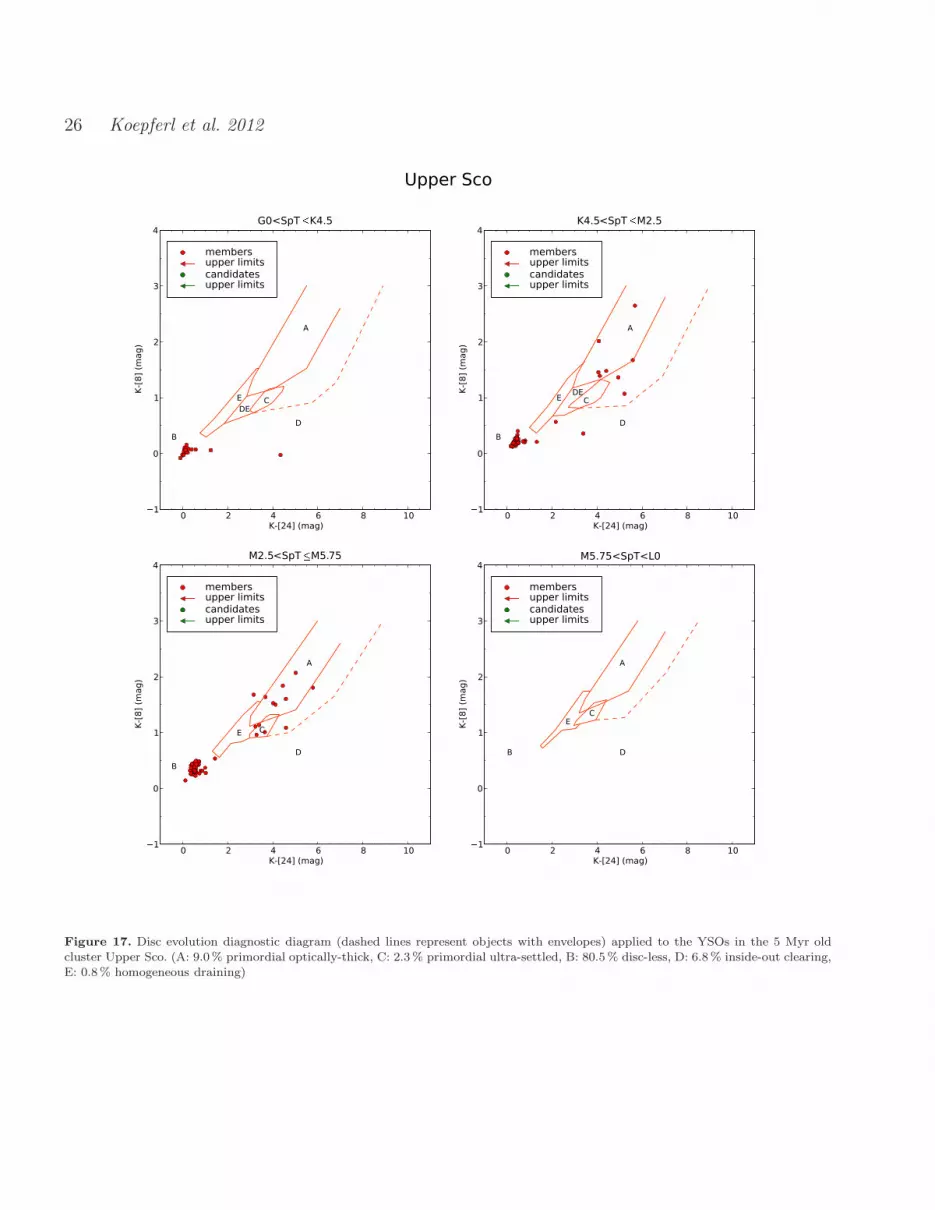
• Upper Sco (Figure 17)The 5 Myr (Hernandez et al. 2007b) old Upper Sco re-gion seems to be more evolved than most of the otherstar-forming regions considered in this work. Only 9.0%and 2.3% of the discs, respectively, are still primordialoptically-thick or classified as primordial ultra-settled.80.5% have already lost their discs and 6.8% are clearingtheir discs via the IOC process. Only one disc (0.8%) isfound at the edge of the HD regime.
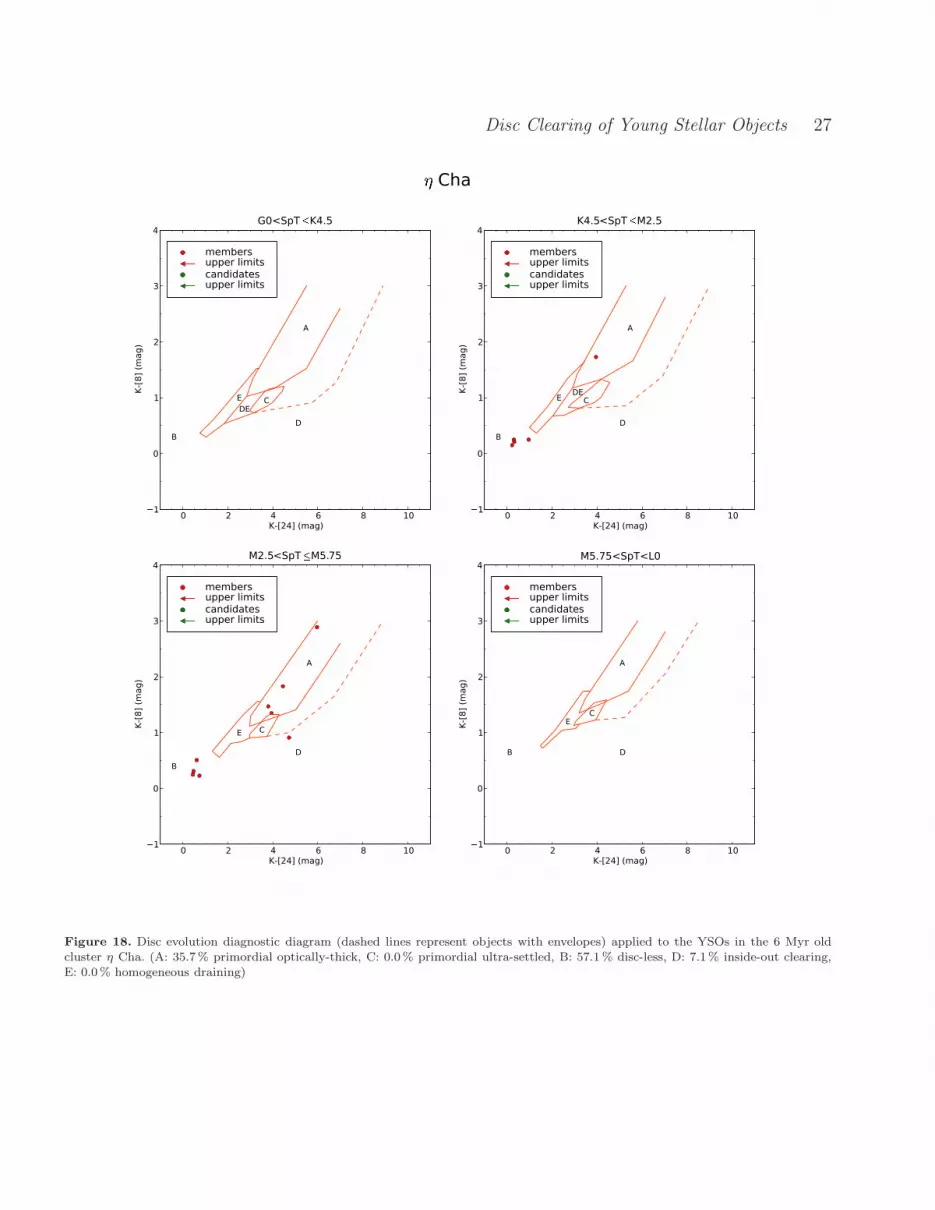
• η Cha (Figure 18)For the 6 Myr (Mamajek et al. 1999) old star-formingregion η Cha 35.7% of the objects have been classified as
primordial optically-thick. 57.1% have already depletedtheir discs, while one disc (7.1%) is undergoing IOC.
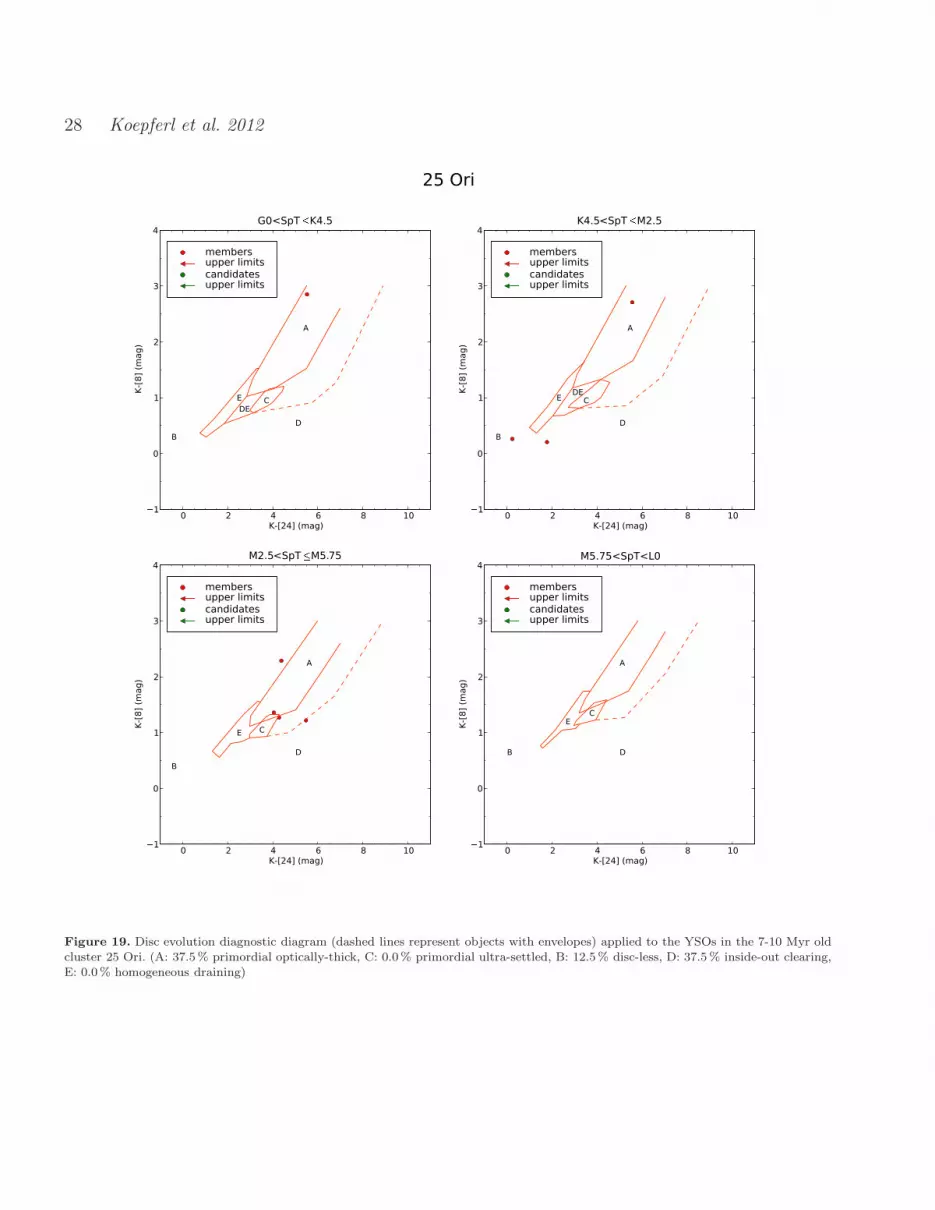
• 25 Ori (Figure 19)In the 7 - 10 Myr (Briceno et al. 2007) old star-forming re-gion 25 Ori objects have barely been detected in the 24µmband. 37.5% of the objects have primordial optically-thickdiscs, whereas one source (12.5%) has cleared its disc al-ready. 37.5 % of the objects are clearing their discs from theinside-out.
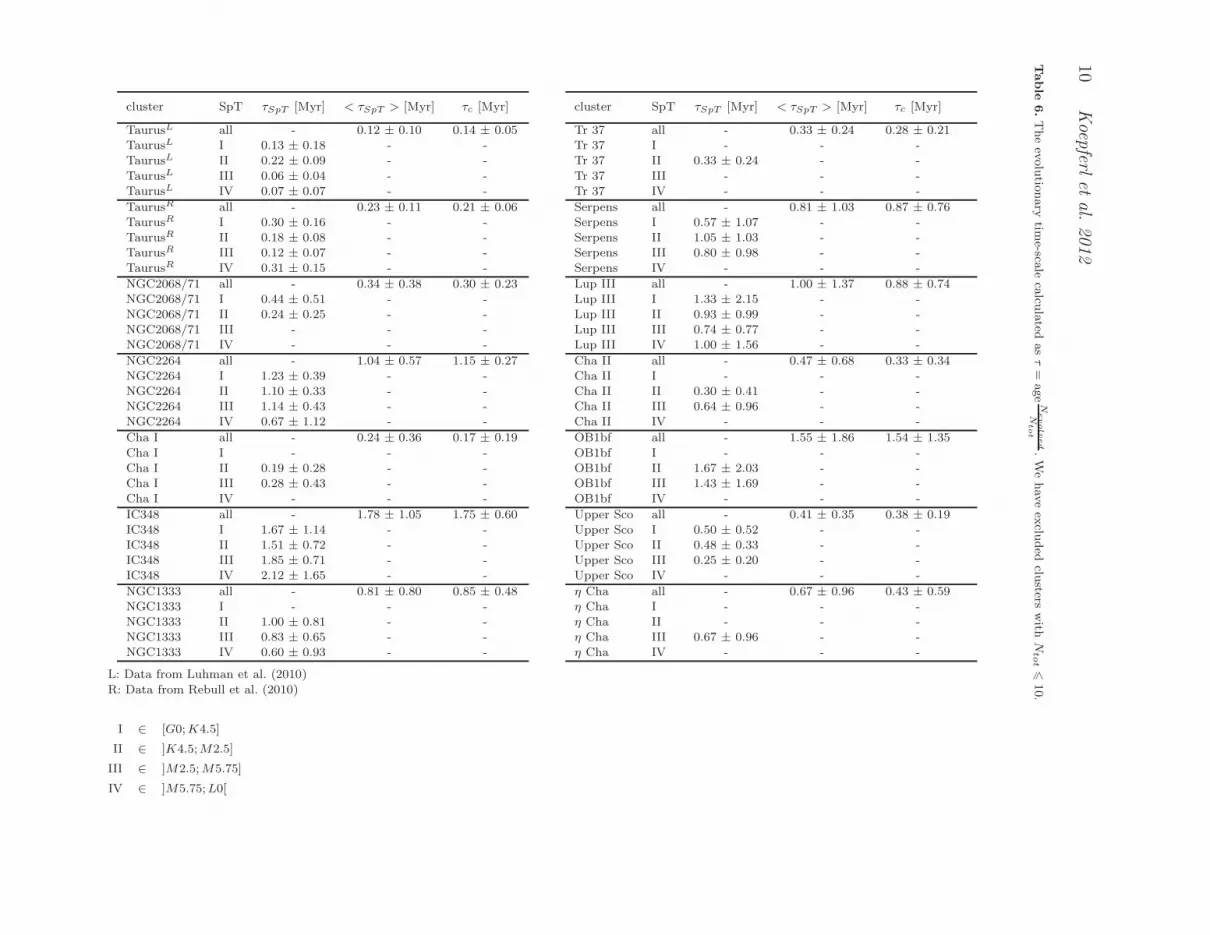
3.2 Time-scales
With the sample of YSOs in different star-forming regionsbecoming larger and larger, it is now possible to estimate thetypical time-scales for the disc dispersal phase, even thoughcluster ages of course always introduce a large uncertaintyin the estimates. In order to estimate the time-scale of thedisc dispersal phase on the basis of our sample, we haveconsidered star-forming regions that have more than 10 ob-jects. We combine boxes A and C into a single ’primordial’category and boxes D and E into a single ’evolved discs’category. All objects in box B remain classified as disc-lesssources. We count objects to the left of the A regime in the’primordial’ category, if K - [8]>1.5.
The disc-evolution time-scale of a star-forming regioncan be estimated by τ = ageNevolved
Ntot, where age is the esti-
mated age of the star-forming region and Ntot and Nevolved
are the numbers of the total and evolved disc populations,respectively. In Table 6 we list the individual time-scales forthe populations of four spectral type intervals τ (SpT) as wellas their average 〈τ (SpT)〉 and the cluster time-scale τc. Theabsolute errors arise from the error propagation of the stan-dard statistical errors (e.g.
√N) and the uncertainty in age.
Note that we arbitrarily assign an error of 10% to thosecases where no error is given in the literature.
Typical transition time-scales for the considered star-forming regions are of order 105 yrs. IC348, OB1bf,NGC2264 and Lup III seem to show larger transition time-scales of approximately 1.3 Myrs. The average time-scaleacross all spectral type 〈〈τ (SpT)〉〉 = 6.9 · 105 yrs is roughlythe same as the average cluster time-scale 〈τc〉 = 6.6·105 yrs.This is partially because there is no significant difference forτ (SpT) amongst spectral types.
We further illustrate that disc dispersal time-scales ap-pear to be independent of spectral type. We plot in Fig-ure 20, the time-scale ratio τ (II)/τ (III) (K and M stars)and show that this ratio is consistent with unity. This sug-gests that there is no significant dependence of the time-scale on stellar mass, as has already been pointed out byErcolano et al. (2011a), who performed a spatial analysis ofthe distribution of K and M stars with discs in young star-forming regions and found no significant difference in thedistributions.
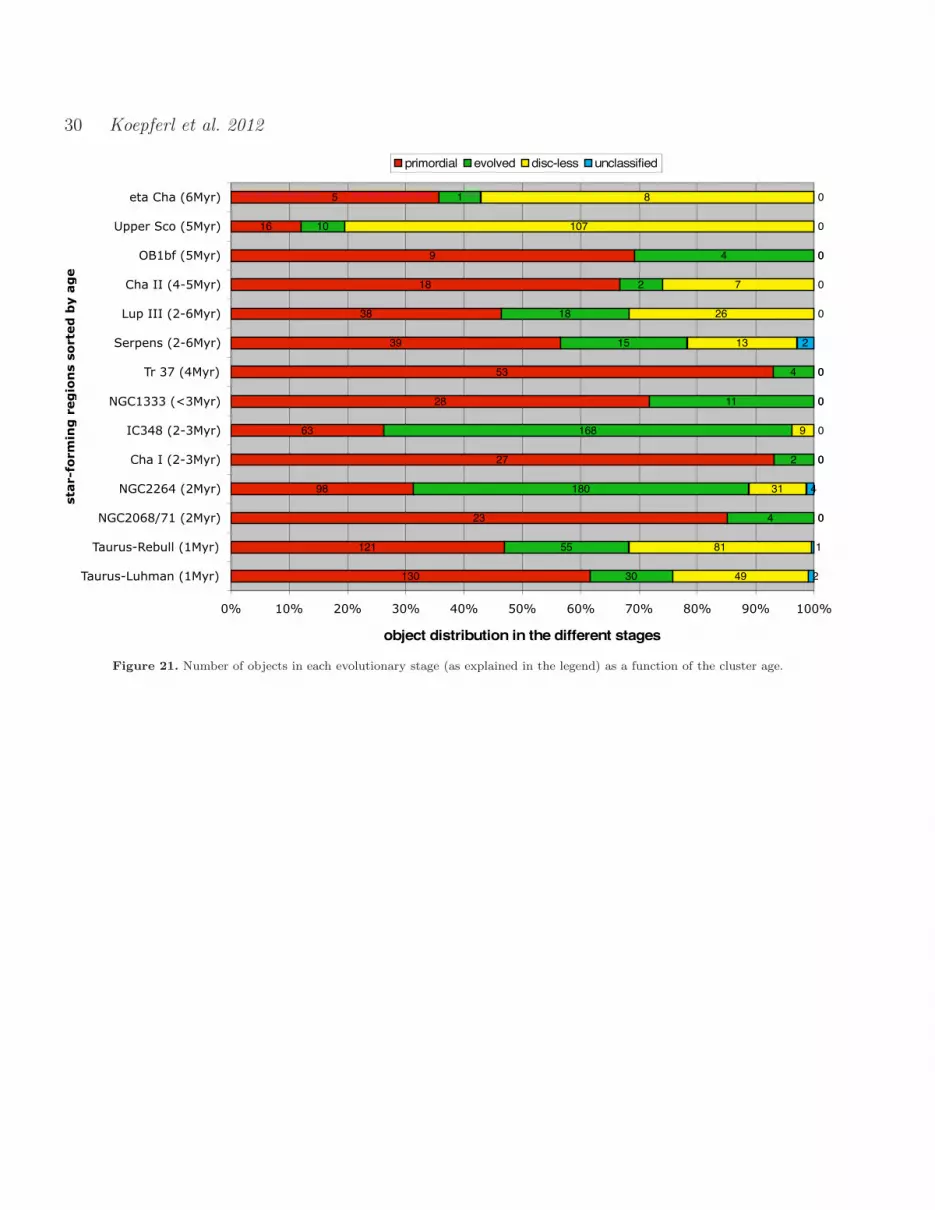
In Figure 21, we show histograms, correlating the ageof the star-forming regions with the number of objects ineach evolutionary stage. The expected correlation of per-centage of evolved and disc-less objects with age is not clearfrom the plot. As well as the usual uncertainty in the ages,a number of other factors may contribute to the scatter.Very importantly, identification of class III sources, crucialfor the statistics, relies on X-ray observations, to make unbi-
Disc Clearing of Young Stellar Objects 7
ased classifications. Unfortunately, only 4 out of 15 regionshave been sufficiently backed up by X-ray observation. 7 ofthe regions contain some classified X-ray sources, while theremaining 4 used different criteria for their member classifi-cation.
4 SUMMARY & CONCLUSIONS
We have calculated the SEDs of protoplanetary discs of dif-ferent spectral types, geometries, settling and inclination.We then considered the evolution of the infrared colours (K -[8] vs. K - [24]) of the model disks as they disperse accord-ing to different scenarios (homologous depletion, inside-outand outside-in clearing). Based on our models we proposea new diagnostic infrared colour-colour diagram to classifythe evolutionary stage of YSOs. We have applied our in-frared colour-colour diagnostic diagram to classify YSOs in15 nearby star-forming regions and study the evolution oftheir disc populations. We estimate time-scales for transi-tion phase of typically a few 105 years independent of stellarmass.
We conclude that, regardless of spectral type, currentobservations point to fast inside-out clearing as the preferredmode of disc dispersal.
ACKNOWLEDGMENTS
We thank the referee, Barbara Whitney, for a constructivereport that helped us improve the clarity and the solidity ofthe results presented in our paper. We would like to thankDr. Jesus Hernandez, who supplied us with spectral typesfor members of 25Ori and OB1bf.
REFERENCES
Alexander R. D., Armitage P. J., 2009, ApJ, 704, 989Alexander R. D., Clarke C. J., Pringle J. E., 2006a, MN-RAS, 369, 216
Alexander R. D., Clarke C. J., Pringle J. E., 2006b, MN-RAS, 369, 229
Allen L. E. et al., 2004, ApJ Suppl., 154, 363Baxter E. J., Covey K. R., Muench A. A., Furesz G., RebullL., Szentgyorgyi A. H., 2009, AJ, 138, 963
Bouwman J., Lawson W. A., Dominik C., Feigelson E. D.,Henning T., Tielens A. G. G. M., Waters L. B. F. M.,2006, ApJ Letters, 653, L57
Briceno C., Calvet N., Hernandez J., Vivas A. K., Hart-mann L., Downes J. J., Berlind P., 2005, AJ, 129, 907
Briceno C., Hartmann L., Hernandez J., Calvet N., VivasA. K., Furesz G., Szentgyorgyi A., 2007, ApJ, 661, 1119
Brott I., Hauschildt P. H., 2005, in ESA Special Publi-cation, Vol. 576, The Three-Dimensional Universe withGaia, Turon C., O’Flaherty K. S., Perryman M. A. C.,eds., p. 565
Carpenter J. M., Mamajek E. E., Hillenbrand L. A., MeyerM. R., 2006, ApJ Letters, 651, L49
Carpenter J. M., Mamajek E. E., Hillenbrand L. A., MeyerM. R., 2009, ApJ, 705, 1646
Castelli F., Kurucz R. L., 2004, ArXiv Astrophysics e-prints
Cernis K., 1993, Baltic Astronomy, 2, 214Cieza L. A. et al., 2009, ApJ Letters, 696, L84Clarke C. J., Gendrin A., Sotomayor M., 2001, MNRAS,328, 485
Contreras M. E., Sicilia-Aguilar A., Muzerolle J., CalvetN., Berlind P., Hartmann L., 2002, AJ, 124, 1585
Currie T., Kenyon S. J., 2009, AJ, 138, 703Currie T., Lada C. J., Plavchan P., Robitaille T. P., IrwinJ., Kenyon S. J., 2009, ApJ, 698, 1
Cutri R. M. et al., 2003, VizieR Online Data Catalog, 2246Dahm S. E., Hillenbrand L. A., 2007, AJ, 133, 2072de Zeeuw P. T., Hoogerwerf R., de Bruijne J. H. J., BrownA. G. A., Blaauw A., 1999, AJ, 117, 354
Dullemond C. P., Dominik C., 2005, A&A, 434, 971Dzib S., Loinard L., Mioduszewski A. J., Boden A. F.,Rodrıguez L. F., Torres R. M., 2010, ApJ, 718, 610
Ercolano B., Bastian N., Spezzi L., Owen J., 2011a, MN-RAS, 416, 439
Ercolano B., Clarke C. J., Hall A. C., 2011b, MNRAS, 410,671
Espaillat C., Furlan E., D’Alessio P., Sargent B., Nagel E.,Calvet N., Watson D. M., Muzerolle J., 2011, ApJ, 728,49
Evans, II N. J. et al., 2009, ApJ Suppl., 181, 321Fazio G. G. et al., 2004, ApJ Suppl., 154, 10Furesz G. et al., 2006, ApJ, 648, 1090Flaherty K. M., Muzerolle J., 2008, AJ, 135, 966Furlan E. et al., 2011, ApJ Suppl., 195, 3Furlan E. et al., 2009, ApJ, 703, 1964Gorti U., Dullemond C. P., Hollenbach D., 2009, ApJ, 705,1237
Gutermuth R. A., Megeath S. T., Myers P. C., Allen L. E.,Pipher J. L., Fazio G. G., 2009, ApJ Suppl., 184, 18
Hartmann L., Calvet N., Gullbring E., D’Alessio P., 1998,ApJ, 495, 385
Herbig G. H., 1998, ApJ, 497, 736Herbst W., 2008, Star Formation in IC 348, PASP, p. 372Hernandez J., Briceno C., Calvet N., Hartmann L., Muze-rolle J., Quintero A., 2006, ApJ, 652, 472
Hernandez J. et al., 2007a, ApJ, 671, 1784Hernandez J., Calvet N., Hartmann L., Briceno C., Sicilia-Aguilar A., Berlind P., 2005, AJ, 129, 856
Hernandez J. et al., 2007b, ApJ, 662, 1067Hernandez J. p. c., 2011. (personal communication)Hirota T. et al., 2008, PASJ, 60, 37Houck J. R. et al., 2004, ApJ Suppl., 154, 18Ireland M. J., Kraus A. L., 2008, ApJ Letters, 678, L59Kenyon S. J., Dobrzycka D., Hartmann L., 1994, AJ, 108,1872
Luhman K. L., 2004, ApJ, 617, 1216Luhman K. L., 2007, ApJ Suppl., 173, 104Luhman K. L., Allen P. R., Espaillat C., Hartmann L.,Calvet N., 2010, ApJ Suppl., 186, 111
Luhman K. L., Mamajek E. E., Allen P. R., Cruz K. L.,2009, ApJ, 703, 399
Luhman K. L., Stauffer J. R., Muench A. A., Rieke G. H.,Lada E. A., Bouvier J., Lada C. J., 2003, ApJ, 593, 1093
Luhman K. L., Steeghs D., 2004, ApJ, 609, 917Mamajek E. E., Lawson W. A., Feigelson E. D., 1999,ApJ Letters, 516, L77
Mayne N. J., Naylor T., 2008, MNRAS, 386, 261McCaughrean M. J., O’Dell C. R., 1996, AJ, 111, 1977
8 Koepferl et al. 2012
Merın B. et al., 2008, ApJ Suppl., 177, 551Monin J.-L., Clarke C. J., Prato L., McCabe C., 2007, Pro-tostars and Planets V, 395
Muench A. A. et al., 2003, AJ, 125, 2029Muzerolle J., Allen L. E., Megeath S. T., Hernandez J.,Gutermuth R. A., 2010, ApJ, 708, 1107
Oliveira I. et al., 2009, ApJ, 691, 672Owen J., Clarke C., 2012, ArXiv e-printsOwen J. E., Clarke C. J., Ercolano B., 2012, MNRAS, 422,1880
Owen J. E., Ercolano B., Clarke C. J., 2011a, MNRAS,412, 13
Owen J. E., Ercolano B., Clarke C. J., 2011b, MNRAS,411, 1104
Owen J. E., Ercolano B., Clarke C. J., Alexander R. D.,2010, MNRAS, 401, 1415
Rebull L. M. et al., 2010, ApJ Suppl., 186, 259Reipurth, B., ed., 2008a, Handbook of Star Forming Re-gions, Volume I: The Northern Sky. PASP
Reipurth, B., ed., 2008b, Handbook of Star Forming Re-gions, Volume II: The Southern Sky. PASP
Ricci L., Robberto M., Soderblom D. R., 2008, AJ, 136,2136
Rieke G. H. et al., 2004, ApJ Suppl., 154, 25Robitaille T. P., Whitney B. A., Indebetouw R., Wood K.,2007, ApJ Suppl., 169, 328
Robitaille T. P., Whitney B. A., Indebetouw R., Wood K.,Denzmore P., 2006, ApJ Suppl., 167, 256
Scally A., Clarke C., 2001, MNRAS, 325, 449Scholz R.-D. et al., 1999, A&A Suppl., 137, 305Sicilia-Aguilar A. et al., 2006, ApJ, 638, 897Sicilia-Aguilar A., Hartmann L. W., Briceno C., MuzerolleJ., Calvet N., 2004, AJ, 128, 805
Sicilia-Aguilar A., Hartmann L. W., Hernandez J., BricenoC., Calvet N., 2005, AJ, 130, 188
Spezzi L. et al., 2008, ApJ, 680, 1295Straizys V., Cernis K., Bartasiute S., 1996, Baltic Astron-omy, 5, 125
Sung H., Bessell M. S., Lee S.-W., 1997, AJ, 114, 2644Teixeira P. S., 2008, PhD thesis, Harvard-Smithsonian Cen-ter for Astrophysics, USA and University of Lisbon, Por-tugal
Teixeira P. S., Lada C. J., Marengo M., Lada E. A., 2012,A&A, 540, A83
Torres R. M., Loinard L., Mioduszewski A. J., RodrıguezL. F., 2007, ApJ, 671, 1813
Werner M. W. et al., 2004, ApJ Suppl., 154, 1Whitney B. A., Wood K., Bjorkman J. E., Cohen M.,2003a, ApJ, 598, 1079
Whitney B. A., Wood K., Bjorkman J. E., Wolff M. J.,2003b, ApJ, 591, 1049
Whittet D. C. B., Prusti T., Franco G. A. P., GerakinesP. A., Kilkenny D., Larson K. A., Wesselius P. R., 1997,A&A, 327, 1194
Williams J. P., Cieza L. A., 2011, ARA&A, 49, 67Winston E. et al., 2009, AJ, 137, 4777Zhu Z., Nelson R. P., Hartmann L., Espaillat C., CalvetN., 2011, ApJ, 729, 47
Disc
Clea
ringofYoungStella
rObjects
9
Table
5.
Totalnumber
ofobjects
andnumber
ofobjects
ineach
evolutio
nary
regim
e(A,B,C,D,E,F*)forthefoursp
ectraltype
interva
lsandthe15sta
r-form
ingreg
ionsconsid
eredin
this
work.
region SpT Ntot NA NB NC ND NE NF
TaurusL I 8 6 1 - 1 - -TaurusL II 102 52 25 - 23 - 4TaurusL III 71 34 18 - 4 - 15TaurusL IV 28 16 5 - 1 1 5
TaurusR I 46 7 23 1 (11)13 (1)3 1TaurusR II 90 53 18 - (15)16 (0)1 3TaurusR III 67 25 26 1 6 2 8TaurusR IV 54 22 14 - 14 3 1
NGC2068/71 I 9 6 - - 2 - 1NGC2068/71 II 17 15 - - 2 - -NGC2068/71 III 1 1 - - - - -NGC2068/71 IV - - - - - - -
NGC2264 I 106 20 18 0 (63)65 (0)2 3NGC2264 II 134 41 9 0 (72)73 (1)2 10NGC2264 III 70 17 4 2 40 0 7NGC2264 IV 3 1 0 0 1 0 1
Cha I I 2 1 - - - - 1Cha I II 13 12 - - 1 - -Cha I III 9 6 - - - 1 2Cha I IV 5 3 - - - - 2
IC348 I 21 1 6 - (13)14 (0)1 -
IC348 II 68 22 2 - 41 - 3IC348 III 138 32 1 2 102 0 1IC348 IV 13 2 - - 11 - -
NGC1333 I 1 1 - - - - -NGC1333 II 15 10 - - 5 - -NGC1333 III 18 11 - - 5 - 2NGC1333 IV 5 4 - - 1 - -
Tr 37 I 7 6 - - - - 1Tr 37 II 49 44 - - 4 - 1Tr 37 III 1 1 - - - - -Tr 37 IV - - - - - - -
region SpT Ntot NA NB NC ND NE NF
Serpens I 7 3 - 1 - 1 2Serpens II 38 25 2 - (4)5 (5)6 1Serpens III 20 - 9 - 3 1 7Serpens IV 4 - 2 - - - 2
Lup III I 6 3 1 - 2 - -Lup III II 30 12 8 - 3 4 3Lup III III 38 14 14 1 5 2 2Lup III IV 8 3 3 - 2 - -
Cha II I 1 1 - - - - -Cha II II 15 10 3 - 1 - 1Cha II III 7 4 2 - 1 - -Cha II IV 4 2 2 - - - -
NGC2362 I 2 - - - 2 - -NGC2362 II 8 6 - - 1 - 1NGC2362 III - - - - - - -NGC2362 IV - - - - - - -
OB1bf I - - - - - - -OB1bf II 6 4 - - 2 - -OB1bf III 7 4 - 1 2 - -OB1bf IV - - - - - - -
Upper Sco I 20 - 18 - 2 - -
Upper Sco II 52 6 41 - 5 - -Upper Sco III 61 6 48 3 2 1 1Upper Sco IV - - - - - - -
η Cha I - - - - - - -η Cha II 5 1 4 - - - -η Cha III 9 4 4 - 1 - -η Cha IV - - - - - - -
25 Ori I 1 1 - - - - -25 Ori II 3 1 1 - 1 - -25 Ori III 4 1 - - 2 - 125 Ori IV - - - - - - -
* unclassified objects() stand for minimum count, this is to account for objects that fall inthe overlap region between boxes D and E, as discussed in Section 2.3.2.
L: Data from Luhman et al. (2010)R: Data from Rebull et al. (2010)
I ∈ [G0;K4.5]
II ∈ ]K4.5;M2.5]
III ∈ ]M2.5;M5.75]
IV ∈ ]M5.75;L0[
10
Koep
ferlet
al.2012
Table
6.Theevolutio
nary
time-sca
lecalcu
lated
asτ=
ageN
evolved
Ntot
.Wehav
eex
cluded
clusters
with
Ntot6
10.
cluster SpT τSpT [Myr] < τSpT > [Myr] τc [Myr]
TaurusL all - 0.12 ± 0.10 0.14 ± 0.05TaurusL I 0.13 ± 0.18 - -TaurusL II 0.22 ± 0.09 - -
TaurusL III 0.06 ± 0.04 - -TaurusL IV 0.07 ± 0.07 - -
TaurusR all - 0.23 ± 0.11 0.21 ± 0.06TaurusR I 0.30 ± 0.16 - -TaurusR II 0.18 ± 0.08 - -TaurusR III 0.12 ± 0.07 - -TaurusR IV 0.31 ± 0.15 - -
NGC2068/71 all - 0.34 ± 0.38 0.30 ± 0.23NGC2068/71 I 0.44 ± 0.51 - -NGC2068/71 II 0.24 ± 0.25 - -NGC2068/71 III - - -NGC2068/71 IV - - -
NGC2264 all - 1.04 ± 0.57 1.15 ± 0.27NGC2264 I 1.23 ± 0.39 - -NGC2264 II 1.10 ± 0.33 - -NGC2264 III 1.14 ± 0.43 - -NGC2264 IV 0.67 ± 1.12 - -
Cha I all - 0.24 ± 0.36 0.17 ± 0.19
Cha I I - - -Cha I II 0.19 ± 0.28 - -Cha I III 0.28 ± 0.43 - -Cha I IV - - -
IC348 all - 1.78 ± 1.05 1.75 ± 0.60IC348 I 1.67 ± 1.14 - -IC348 II 1.51 ± 0.72 - -IC348 III 1.85 ± 0.71 - -IC348 IV 2.12 ± 1.65 - -
NGC1333 all - 0.81 ± 0.80 0.85 ± 0.48NGC1333 I - - -NGC1333 II 1.00 ± 0.81 - -NGC1333 III 0.83 ± 0.65 - -NGC1333 IV 0.60 ± 0.93 - -
cluster SpT τSpT [Myr] < τSpT > [Myr] τc [Myr]
Tr 37 all - 0.33 ± 0.24 0.28 ± 0.21Tr 37 I - - -Tr 37 II 0.33 ± 0.24 - -
Tr 37 III - - -Tr 37 IV - - -
Serpens all - 0.81 ± 1.03 0.87 ± 0.76Serpens I 0.57 ± 1.07 - -Serpens II 1.05 ± 1.03 - -Serpens III 0.80 ± 0.98 - -Serpens IV - - -
Lup III all - 1.00 ± 1.37 0.88 ± 0.74Lup III I 1.33 ± 2.15 - -Lup III II 0.93 ± 0.99 - -Lup III III 0.74 ± 0.77 - -Lup III IV 1.00 ± 1.56 - -
Cha II all - 0.47 ± 0.68 0.33 ± 0.34Cha II I - - -Cha II II 0.30 ± 0.41 - -Cha II III 0.64 ± 0.96 - -Cha II IV - - -
OB1bf all - 1.55 ± 1.86 1.54 ± 1.35
OB1bf I - - -OB1bf II 1.67 ± 2.03 - -OB1bf III 1.43 ± 1.69 - -OB1bf IV - - -
Upper Sco all - 0.41 ± 0.35 0.38 ± 0.19Upper Sco I 0.50 ± 0.52 - -Upper Sco II 0.48 ± 0.33 - -Upper Sco III 0.25 ± 0.20 - -Upper Sco IV - - -
η Cha all - 0.67 ± 0.96 0.43 ± 0.59η Cha I - - -η Cha II - - -η Cha III 0.67 ± 0.96 - -η Cha IV - - -
L: Data from Luhman et al. (2010)
R: Data from Rebull et al. (2010)
I ∈ [G0;K4.5]
II ∈ ]K4.5;M2.5]
III ∈ ]M2.5;M5.75]
IV ∈ ]M5.75;L0[
Disc Clearing of Young Stellar Objects 11
0 1 2 3 4 5K-[24] (mag)
0.0
0.5
1.0
1.5
2.0
K-[8
] (m
ag) F
E
P
InclinationsHD face-onHD edge-onIOC face-onIOC edge-onOIC face-onOIC edge-on
K4.0
0 1 2 3 4 5K-[24] (mag)
0.0
0.5
1.0
1.5
2.0
K-[8
] (m
ag) F
E
P
InclinationsHD face-onHD edge-onIOC face-onIOC edge-onOIC face-onOIC edge-on
K8.5
0 1 2 3 4 5K-[24] (mag)
0.0
0.5
1.0
1.5
2.0
K-[8
] (m
ag)
F
E
P
InclinationsHD face-onHD edge-onIOC face-onIOC edge-onOIC face-onOIC edge-on
M4.5
0 1 2 3 4 5K-[24] (mag)
0.0
0.5
1.0
1.5
2.0
K-[8
] (m
ag)
F
E
P
InclinationsHD face-onHD edge-onIOC face-onIOC edge-onOIC face-onOIC edge-on
M8.0
Razor-thin Discs
Figure 2. Evolution of a razor-thin disc via HD, IOC and OIC for all four spectral type intervals as described in Section 2.1 and analysedin Section 2.3.1. Point F are face-on (cos i = 0.95) and point E are edge-on (cos i = 0.05) disc inclinations. The points between the Fand E represent intermediate disc inclinations in steps of ∆ cos i = 0.10. The red point P represents the approximate locus of the stellarphotosphere as given by Luhman et al. (2010). The stars mark the HD tracks for face-on and edge-on inclinations (green and blue lines,respectively). The triangles mark the IOC tracks for face-on and edge-on inclinations (yellow and cyan lines, respectively). The diamondsmark the OIC tracks for face-on and edge-on inclinations (black and purple lines, respectively).
12 Koepferl et al. 2012
0 1 2 3 4 5 6 7K-[24] (mag)
0.0
0.5
1.0
1.5
2.0
2.5
3.0
K-[8
] (m
ag)
A
C
B
EDE
D
A: Primordial optically-thickB: Stellar photosphere
C: Primordial ultra-settledD: Inside-out clearingE: Homogeneous draining
K4.0
0 1 2 3 4 5 6 7K-[24] (mag)
0.0
0.5
1.0
1.5
2.0
2.5
3.0
K-[8
] (m
ag)
A
C
B
EDE
D
A: Primordial optically-thickB: Stellar photosphere
C: Primordial ultra-settledD: Inside-out clearingE: Homogeneous draining
K8.5
0 1 2 3 4 5 6 7K-[24] (mag)
0.0
0.5
1.0
1.5
2.0
2.5
3.0
K-[8
] (m
ag)
A
C
B
E
D
A: Primordial optically-thickB: Stellar photosphere
C: Primordial ultra-settledD: Inside-out clearingE: Homogeneous draining
M4.5
0 1 2 3 4 5 6 7K-[24] (mag)
0.0
0.5
1.0
1.5
2.0
2.5
3.0
K-[8
] (m
ag)
A
C
B
E
D
A: Primordial optically-thickB: Stellar photosphere
C: Primordial ultra-settledD: Inside-out clearingE: Homogeneous draining
M8.0
Finite-thickness Discs
Figure 3. K - [8] vs. K - [24] evolutionary diagnostic diagrams (dashed lines represent objects with envelopes).The values of the boundaries are given in the Appendix.
Disc Clearing of Young Stellar Objects 13
0 2 4 6 8 10K-[24] (mag)
�1
0
1
2
3
4
K-[8
] (m
ag)
membersupper limitscandidatesupper limits
A
C
B
EDE
D
G0<SpT�K4.5
0 2 4 6 8 10K-[24] (mag)
�1
0
1
2
3
4
K-[8
] (m
ag)
membersupper limitscandidatesupper limits
A
C
B
E DE
D
K4.5<SpT�M2.5
0 2 4 6 8 10K-[24] (mag)
�1
0
1
2
3
4
K-[8
] (m
ag)
membersupper limitscandidatesupper limits
A
C
B
E
D
M2.5<SpT�M5.75
0 2 4 6 8 10K-[24] (mag)
�1
0
1
2
3
4
K-[8
] (m
ag)
membersupper limitscandidatesupper limits
A
C
B
E
D
M5.75<SpT<L0
Taurus (Luhman)
Figure 4. Disc evolution diagnostic diagram (dashed lines represent objects with envelopes) applied to the YSOs in the 1 Myr oldcluster Taurus. (A: 51.2% primordial optically-thick, C: 0.0% primordial ultra-settled, B: 23.2% disc-less, D: 13.7% inside-out clearing,E: 0.5% homogeneous draining) 20 sample points lie outside the limits of this plot, but they are still included in the final statistics.
14 Koepferl et al. 2012
0 2 4 6 8 10K-[24] (mag)
�1
0
1
2
3
4
K-[8
] (m
ag)
membersupper limitscandidatesupper limits
A
C
B
EDE
D
G0<SpT�K4.5
0 2 4 6 8 10K-[24] (mag)
�1
0
1
2
3
4
K-[8
] (m
ag)
membersupper limitscandidatesupper limits
A
C
B
E DE
D
K4.5<SpT�M2.5
0 2 4 6 8 10K-[24] (mag)
�1
0
1
2
3
4
K-[8
] (m
ag)
membersupper limitscandidatesupper limits
A
C
B
E
D
M2.5<SpT�M5.75
0 2 4 6 8 10K-[24] (mag)
�1
0
1
2
3
4
K-[8
] (m
ag)
membersupper limitscandidatesupper limits
A
C
B
E
D
M5.75<SpT<L0
Taurus (Rebull)
Figure 5. Disc evolution diagnostic diagram (dashed lines represent objects with envelopes) applied to the YSOs in the 1 Myr old clusterTaurus. (A: 41.6% primordial optically-thick, C: 0.8% primordial ultra-settled, B: 31.5% disc-less, D: (17.9) 19.1% inside-out clearing,E: (2.3) 3.5% homogeneous draining) 5 sample points lie outside the limits of this plot, but they are still included in the final statistics.
Disc Clearing of Young Stellar Objects 15
0 2 4 6 8 10K-[24] (mag)
�1
0
1
2
3
4
K-[8
] (m
ag)
membersupper limitscandidatesupper limits
A
C
B
EDE
D
G0<SpT�K4.5
0 2 4 6 8 10K-[24] (mag)
�1
0
1
2
3
4
K-[8
] (m
ag)
membersupper limitscandidatesupper limits
A
C
B
E DE
D
K4.5<SpT�M2.5
0 2 4 6 8 10K-[24] (mag)
�1
0
1
2
3
4
K-[8
] (m
ag)
membersupper limitscandidatesupper limits
A
C
B
E
D
M2.5<SpT�M5.75
0 2 4 6 8 10K-[24] (mag)
�1
0
1
2
3
4
K-[8
] (m
ag)
membersupper limitscandidatesupper limits
A
C
B
E
D
M5.75<SpT<L0
NGC2068/71
Figure 6. Disc evolution diagnostic diagram (dashed lines represent objects with envelopes) applied to the YSOs in the 2 Myr old clusterNGC2068/71. (A: 81.5% primordial optically-thick, C: 0.0% primordial ultra-settled, B: 0.0% disc-less, D: 14.8% inside-out clearing,E: 0.0% homogeneous draining)
16 Koepferl et al. 2012
0 2 4 6 8 10K-[24] (mag)
�1
0
1
2
3
4
K-[8
] (m
ag)
membersupper limitscandidatesupper limits
A
C
B
EDE
D
G0<SpT�K4.5
0 2 4 6 8 10K-[24] (mag)
�1
0
1
2
3
4
K-[8
] (m
ag)
membersupper limitscandidatesupper limits
A
C
B
E DE
D
K4.5<SpT�M2.5
0 2 4 6 8 10K-[24] (mag)
�1
0
1
2
3
4
K-[8
] (m
ag)
membersupper limitscandidatesupper limits
A
C
B
E
D
M2.5<SpT�M5.75
0 2 4 6 8 10K-[24] (mag)
�1
0
1
2
3
4
K-[8
] (m
ag)
membersupper limitscandidatesupper limits
A
C
B
E
D
M5.75<SpT<L0
NGC2264
Figure 7. Disc evolution diagnostic diagram (dashed lines represent objects with envelopes) applied to the YSOs in the 2 Myr oldcluster NGC2264. (A: 25.2% primordial optically-thick, C: 0.6% primordial ultra-settled, B: 9.9% disc-less, D: (56.2) 57.2% inside-outclearing, E: (0.3) 1.3% homogeneous draining)

Disc Clearing of Young Stellar Objects 17
0 2 4 6 8 10K-[24] (mag)
�1
0
1
2
3
4
K-[8
] (m
ag)
membersupper limitscandidatesupper limits
A
C
B
EDE
D
G0<SpTK4.5
0 2 4 6 8 10K-[24] (mag)
�1
0
1
2
3
4
K-[8
] (m
ag)
membersupper limitscandidatesupper limits
A
C
B
E DE
D
K4.5<SpTM2.5
0 2 4 6 8 10K-[24] (mag)
�1
0
1
2
3
4
K-[8
] (m
ag)
membersupper limitscandidatesupper limits
A
C
B
E
D
M2.5<SpTM5.75
0 2 4 6 8 10K-[24] (mag)
�1
0
1
2
3
4
K-[8
] (m
ag)
membersupper limitscandidatesupper limits
A
C
B
E
D
M5.75<SpT<L0
Cha I
Figure 8. Disc evolution diagnostic diagram (dashed lines represent objects with envelopes) applied to the YSOs in the 2-3 Myr oldcluster Cha I. (A: 75.9% primordial optically-thick, C: 0.0% primordial ultra-settled, B: 0.0% disc-less, D: 3.4% inside-out clearing,E: 3.4% homogeneous draining) 1 sample point lies outside the limits of this plot, but it is still included in the final statistics.

18 Koepferl et al. 2012
0 2 4 6 8 10K-[24] (mag)
1
0
1
2
3
4
K-[8
] (m
ag)
membersupper limitscandidatesupper limits
A
C
B
EDE
D
G0<SpT�K4.5
0 2 4 6 8 10K-[24] (mag)
1
0
1
2
3
4
K-[8
] (m
ag)
membersupper limitscandidatesupper limits
A
C
B
E DE
D
K4.5<SpT�M2.5
0 2 4 6 8 10K-[24] (mag)
1
0
1
2
3
4
K-[8
] (m
ag)
membersupper limitscandidatesupper limits
A
C
B
E
D
M2.5<SpT�M5.75
0 2 4 6 8 10K-[24] (mag)
1
0
1
2
3
4
K-[8
] (m
ag)
membersupper limitscandidatesupper limits
A
C
B
E
D
M5.75<SpT<L0
IC348
Figure 9. Disc evolution diagnostic diagram (dashed lines represent objects with envelopes) applied to the YSOs in the 2-3 Myr oldcluster IC348. (A: 23.8% primordial optically-thick, C: 0.8% primordial ultra-settled, B: 3.8% disc-less, D: (69.6) 70.0% inside-outclearing, E: (0.0) 0.4% homogeneous draining) 3 sample points lie outside the limits of this plot, but they are still included in the finalstatistics.
Disc Clearing of Young Stellar Objects 19
0 2 4 6 8 10K-[24] (mag)
�1
0
1
2
3
4
K-[8
] (m
ag)
membersupper limitscandidatesupper limits
A
C
B
EDE
D
G0<SpT K4.5
0 2 4 6 8 10K-[24] (mag)
�1
0
1
2
3
4
K-[8
] (m
ag)
membersupper limitscandidatesupper limits
A
C
B
E DE
D
K4.5<SpT M2.5
0 2 4 6 8 10K-[24] (mag)
�1
0
1
2
3
4
K-[8
] (m
ag)
membersupper limitscandidatesupper limits
A
C
B
E
D
M2.5<SpT M5.75
0 2 4 6 8 10K-[24] (mag)
�1
0
1
2
3
4
K-[8
] (m
ag)
membersupper limitscandidatesupper limits
A
C
B
E
D
M5.75<SpT<L0
NGC1333
Figure 10. Disc evolution diagnostic diagram (dashed lines represent objects with envelopes) applied to the YSOs in the less than 3Myr old cluster NGC1333. (A: 66.7% primordial optically-thick, C: 0.0% primordial ultra-settled, B: 0.0% disc-less, D: 28.2% inside-outclearing, E: 0.0% homogeneous draining) 9 sample points lie outside the limits of this plot, but they are still included in the finalstatistics.

20 Koepferl et al. 2012
0 2 4 6 8 10K-[24] (mag)
�1
0
1
2
3
4
K-[8
] (m
ag)
membersupper limitscandidatesupper limits
A
C
B
EDE
D
G0<SpT�K4.5
0 2 4 6 8 10K-[24] (mag)
�1
0
1
2
3
4
K-[8
] (m
ag)
membersupper limitscandidatesupper limits
A
C
B
E DE
D
K4.5<SpT�M2.5
0 2 4 6 8 10K-[24] (mag)
�1
0
1
2
3
4
K-[8
] (m
ag)
membersupper limitscandidatesupper limits
A
C
B
E
D
M2.5<SpT�M5.75
0 2 4 6 8 10K-[24] (mag)
�1
0
1
2
3
4
K-[8
] (m
ag)
membersupper limitscandidatesupper limits
A
C
B
E
D
M5.75<SpT<L0
Tr37
Figure 11. Disc evolution diagnostic diagram (dashed lines represent objects with envelopes) applied to the YSOs in the 4 Myr oldcluster Tr 37. (A: 89.5% primordial optically-thick, C: 0.0% primordial ultra-settled, B: 0.0% disc-less, D: 7.0% inside-out clearing,E: 0.0% homogeneous draining)

Disc Clearing of Young Stellar Objects 21
0 2 4 6 8 10K-[24] (mag)
�1
0
1
2
3
4
K-[8
] (m
ag)
membersupper limitscandidatesupper limits
A
C
B
EDE
D
G0<SpT�K4.5
0 2 4 6 8 10K-[24] (mag)
�1
0
1
2
3
4
K-[8
] (m
ag)
membersupper limitscandidatesupper limits
A
C
B
E DE
D
K4.5<SpT�M2.5
0 2 4 6 8 10K-[24] (mag)
�1
0
1
2
3
4
K-[8
] (m
ag)
membersupper limitscandidatesupper limits
A
C
B
E
D
M2.5<SpT�M5.75
0 2 4 6 8 10K-[24] (mag)
�1
0
1
2
3
4
K-[8
] (m
ag)
membersupper limitscandidatesupper limits
A
C
B
E
D
M5.75<SpT<L0
Serpens
Figure 12. Disc evolution diagnostic diagram (dashed lines represent objects with envelopes) applied to the YSOs in the 2-6 Myr oldcluster Serpens. (A: 40.6% primordial optically-thick, C: 1.4% primordial ultra-settled, B: 18.8% disc-less, D: (10.1) 11.6% inside-outclearing, E: (10.1) 11.6% homogeneous draining) 2 sample points lie outside the limits of this plot, but they are still included in the finalstatistics.
22 Koepferl et al. 2012
0 2 4 6 8 10K-[24] (mag)
�1
0
1
2
3
4
K-[8
] (m
ag)
membersupper limitscandidatesupper limits
A
C
B
EDE
D
G0<SpT�K4.5
0 2 4 6 8 10K-[24] (mag)
�1
0
1
2
3
4
K-[8
] (m
ag)
membersupper limitscandidatesupper limits
A
C
B
E DE
D
K4.5<SpT�M2.5
0 2 4 6 8 10K-[24] (mag)
�1
0
1
2
3
4
K-[8
] (m
ag)
membersupper limitscandidatesupper limits
A
C
B
E
D
M2.5<SpT�M5.75
0 2 4 6 8 10K-[24] (mag)
�1
0
1
2
3
4
K-[8
] (m
ag)
membersupper limitscandidatesupper limits
A
C
B
E
D
M5.75<SpT<L0
Lup III
Figure 13. Disc evolution diagnostic diagram (dashed lines represent objects with envelopes) applied to the YSOs in the 2-6 Myr oldcluster Lup III. (A: 39.0% primordial optically-thick, C: 1.2% primordial ultra-settled, B: 31.7% disc-less, D: 14.6% inside-out clearing,E: 7.3% homogeneous draining) 2 sample points lie outside the limits of this plot, but they are still included in the final statistics.
Disc Clearing of Young Stellar Objects 23
0 2 4 6 8 10K-[24] (mag)
�1
0
1
2
3
4
K-[8
] (m
ag)
membersupper limitscandidatesupper limits
A
C
B
EDE
D
G0<SpT�K4.5
0 2 4 6 8 10K-[24] (mag)
�1
0
1
2
3
4
K-[8
] (m
ag)
membersupper limitscandidatesupper limits
A
C
B
E DE
D
K4.5<SpT�M2.5
0 2 4 6 8 10K-[24] (mag)
�1
0
1
2
3
4
K-[8
] (m
ag)
membersupper limitscandidatesupper limits
A
C
B
E
D
M2.5<SpT�M5.75
0 2 4 6 8 10K-[24] (mag)
�1
0
1
2
3
4
K-[8
] (m
ag)
membersupper limitscandidatesupper limits
A
C
B
E
D
M5.75<SpT<L0
Cha II
Figure 14. Disc evolution diagnostic diagram (dashed lines represent objects with envelopes) applied to the YSOs in the 4-5 Myr oldcluster Cha II. (A: 63.0% primordial optically-thick, C: 0.0% primordial ultra-settled, B: 25.9% disc-less, D: 7.4% inside-out clearing,E: 0.0% homogeneous draining) 1 sample point lies outside the limits of this plot, but it is still included in the final statistics.
24 Koepferl et al. 2012
0 2 4 6 8 10K-[24] (mag)
�1
0
1
2
3
4
K-[8
] (m
ag)
membersupper limitscandidatesupper limits
A
C
B
EDE
D
G0<SpT�K4.5
0 2 4 6 8 10K-[24] (mag)
�1
0
1
2
3
4
K-[8
] (m
ag)
membersupper limitscandidatesupper limits
A
C
B
E DE
D
K4.5<SpT�M2.5
0 2 4 6 8 10K-[24] (mag)
�1
0
1
2
3
4
K-[8
] (m
ag)
membersupper limitscandidatesupper limits
A
C
B
E
D
M2.5<SpT�M5.75
0 2 4 6 8 10K-[24] (mag)
�1
0
1
2
3
4
K-[8
] (m
ag)
membersupper limitscandidatesupper limits
A
C
B
E
D
M5.75<SpT<L0
NGC2362
Figure 15. Disc evolution diagnostic diagram (dashed lines represent objects with envelopes) applied to the YSOs in the 5 Myr oldcluster NGC2363. (A: 60.0% primordial optically-thick, C: 0.0% primordial ultra-settled, B: 0.0% disc-less, D: 30.0% inside-out clearing,E: 0.0% homogeneous draining)
Disc Clearing of Young Stellar Objects 25
0 2 4 6 8 10K-[24] (mag)
�1
0
1
2
3
4
K-[8
] (m
ag)
membersupper limitscandidatesupper limits
A
C
B
EDE
D
G0<SpT�K4.5
0 2 4 6 8 10K-[24] (mag)
�1
0
1
2
3
4
K-[8
] (m
ag)
membersupper limitscandidatesupper limits
A
C
B
E DE
D
K4.5<SpT�M2.5
0 2 4 6 8 10K-[24] (mag)
�1
0
1
2
3
4
K-[8
] (m
ag)
membersupper limitscandidatesupper limits
A
C
B
E
D
M2.5<SpT�M5.75
0 2 4 6 8 10K-[24] (mag)
�1
0
1
2
3
4
K-[8
] (m
ag)
membersupper limitscandidatesupper limits
A
C
B
E
D
M5.75<SpT<L0
OB1bf
Figure 16. Disc evolution diagnostic diagram (dashed lines represent objects with envelopes) applied to the YSOs in the 5 Myr oldcluster OB1bf. (A: 61.5% primordial optically-thick, C: 7.7% primordial ultra-settled, B: 0.0% disc-less, D: 30.8% inside-out clearing,E: 0.0% homogeneous draining)
26 Koepferl et al. 2012
0 2 4 6 8 10K-[24] (mag)
�1
0
1
2
3
4
K-[8
] (m
ag)
membersupper limitscandidatesupper limits
A
C
B
EDE
D
G0<SpT�K4.5
0 2 4 6 8 10K-[24] (mag)
�1
0
1
2
3
4
K-[8
] (m
ag)
membersupper limitscandidatesupper limits
A
C
B
E DE
D
K4.5<SpT�M2.5
0 2 4 6 8 10K-[24] (mag)
�1
0
1
2
3
4
K-[8
] (m
ag)
membersupper limitscandidatesupper limits
A
C
B
E
D
M2.5<SpT�M5.75
0 2 4 6 8 10K-[24] (mag)
�1
0
1
2
3
4
K-[8
] (m
ag)
membersupper limitscandidatesupper limits
A
C
B
E
D
M5.75<SpT<L0
Upper Sco
Figure 17. Disc evolution diagnostic diagram (dashed lines represent objects with envelopes) applied to the YSOs in the 5 Myr oldcluster Upper Sco. (A: 9.0% primordial optically-thick, C: 2.3% primordial ultra-settled, B: 80.5% disc-less, D: 6.8% inside-out clearing,E: 0.8% homogeneous draining)
Disc Clearing of Young Stellar Objects 27
0 2 4 6 8 10K-[24] (mag)
�1
0
1
2
3
4
K-[8
] (m
ag)
membersupper limitscandidatesupper limits
A
C
B
EDE
D
G0<SpT�K4.5
0 2 4 6 8 10K-[24] (mag)
�1
0
1
2
3
4
K-[8
] (m
ag)
membersupper limitscandidatesupper limits
A
C
B
E DE
D
K4.5<SpT�M2.5
0 2 4 6 8 10K-[24] (mag)
�1
0
1
2
3
4
K-[8
] (m
ag)
membersupper limitscandidatesupper limits
A
C
B
E
D
M2.5<SpT�M5.75
0 2 4 6 8 10K-[24] (mag)
�1
0
1
2
3
4
K-[8
] (m
ag)
membersupper limitscandidatesupper limits
A
C
B
E
D
M5.75<SpT<L0
� Cha
Figure 18. Disc evolution diagnostic diagram (dashed lines represent objects with envelopes) applied to the YSOs in the 6 Myr oldcluster η Cha. (A: 35.7% primordial optically-thick, C: 0.0% primordial ultra-settled, B: 57.1% disc-less, D: 7.1% inside-out clearing,E: 0.0% homogeneous draining)
28 Koepferl et al. 2012
0 2 4 6 8 10K-[24] (mag)
�1
0
1
2
3
4
K-[8
] (m
ag)
membersupper limitscandidatesupper limits
A
C
B
EDE
D
G0<SpT K4.5
0 2 4 6 8 10K-[24] (mag)
�1
0
1
2
3
4
K-[8
] (m
ag)
membersupper limitscandidatesupper limits
A
C
B
E DE
D
K4.5<SpT M2.5
0 2 4 6 8 10K-[24] (mag)
�1
0
1
2
3
4
K-[8
] (m
ag)
membersupper limitscandidatesupper limits
A
C
B
E
D
M2.5<SpT M5.75
0 2 4 6 8 10K-[24] (mag)
�1
0
1
2
3
4
K-[8
] (m
ag)
membersupper limitscandidatesupper limits
A
C
B
E
D
M5.75<SpT<L0
25 Ori
Figure 19. Disc evolution diagnostic diagram (dashed lines represent objects with envelopes) applied to the YSOs in the 7-10 Myr oldcluster 25 Ori. (A: 37.5% primordial optically-thick, C: 0.0% primordial ultra-settled, B: 12.5% disc-less, D: 37.5% inside-out clearing,E: 0.0% homogeneous draining)

Disc Clearing of Young Stellar Objects 29
-2.00
-1.00
0.00
1.00
2.00
3.00
4.00
5.00
6.00
7.00
8.00
9.00
Taurus
(Luhman)
Taurus
(Rebull)
NGC2264 Cha I IC348 NGC1333 Serpens Lup III Cha II OB1bf Upper Sco 25 Ori
star-forming regions
tim
e-s
cale
rati
o (
II/
III)
Figure 20. Time-scale ratio τ (II)/τ (III) for K and M stars for the star-forming regions considered in this work with Ntot > 10. Tr37,NGC2068/71 and η Cha are not listed, because they lack evolving objects in one or both spectral type intervals.
30 Koepferl et al. 2012
130
121
23
98
27
63
28
53
39
38
18
9
16
5
30
55
4
180
2
168
11
4
15
2
4
10
49
81
0
31
0
9
0
0
13
26
7
0
107
8
2
1
0
4
0
0
0
0
2
0
0
0
0
01
18
0% 10% 20% 30% 40% 50% 60% 70% 80% 90% 100%
Taurus-Luhman (1Myr)
Taurus-Rebull (1Myr)
NGC2068/71 (2Myr)
NGC2264 (2Myr)
Cha I (2-3Myr)
IC348 (2-3Myr)
NGC1333 (<3Myr)
Tr 37 (4Myr)
Serpens (2-6Myr)
Lup III (2-6Myr)
Cha II (4-5Myr)
OB1bf (5Myr)
Upper Sco (5Myr)
eta Cha (6Myr)
sta
r-f
orm
ing
reg
ion
s s
orte
d b
y a
ge
object distribution in the different stages
primordial evolved disc-less unclassified
Figure 21. Number of objects in each evolutionary stage (as explained in the legend) as a function of the cluster age.
Disc Clearing of Young Stellar Objects 31
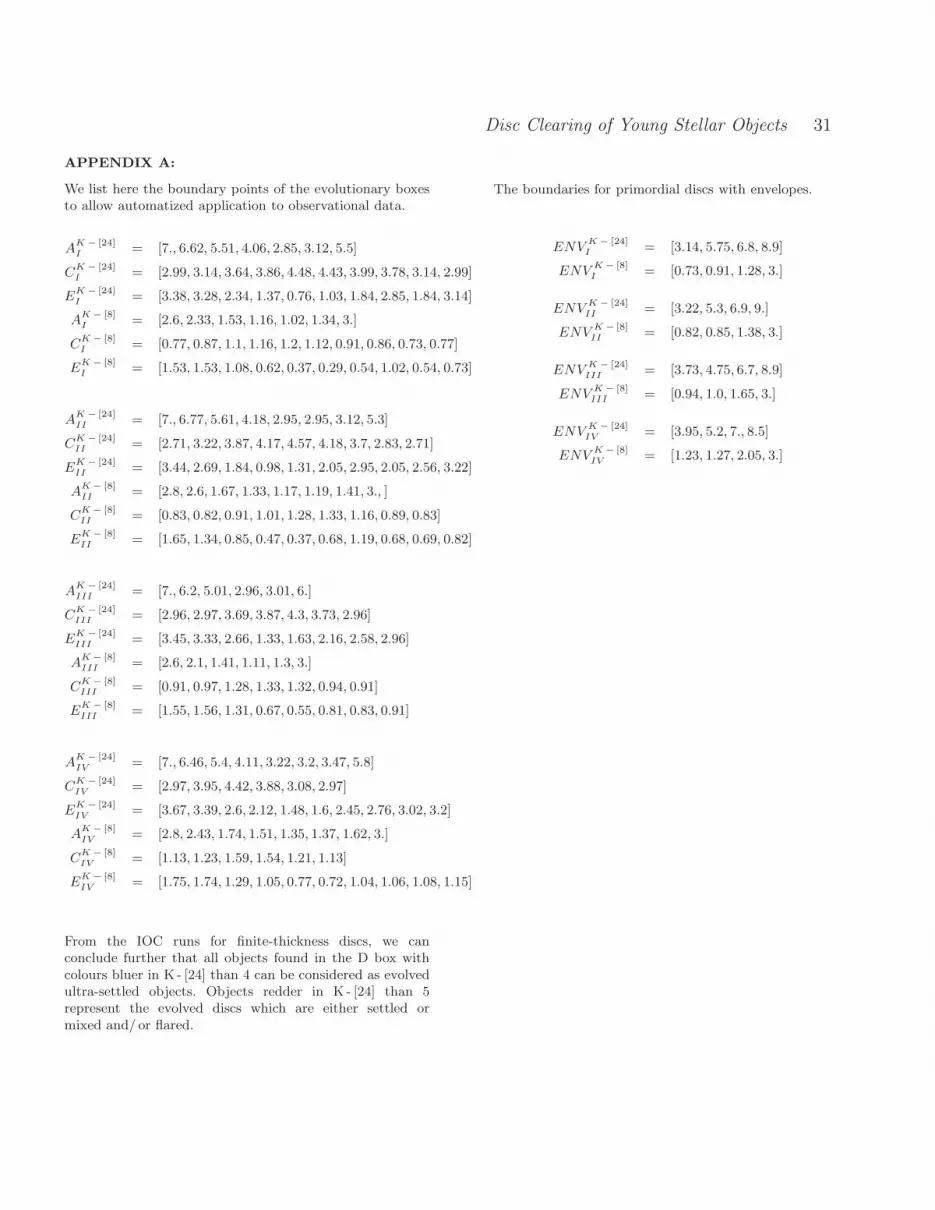
APPENDIX A:
We list here the boundary points of the evolutionary boxesto allow automatized application to observational data.
AK − [24]I = [7., 6.62, 5.51, 4.06, 2.85, 3.12, 5.5]
CK − [24]I = [2.99, 3.14, 3.64, 3.86, 4.48, 4.43, 3.99, 3.78, 3.14, 2.99]
EK − [24]I = [3.38, 3.28, 2.34, 1.37, 0.76, 1.03, 1.84, 2.85, 1.84, 3.14]
AK − [8]I = [2.6, 2.33, 1.53, 1.16, 1.02, 1.34, 3.]
CK − [8]I = [0.77, 0.87, 1.1, 1.16, 1.2, 1.12, 0.91, 0.86, 0.73, 0.77]
EK − [8]I = [1.53, 1.53, 1.08, 0.62, 0.37, 0.29, 0.54, 1.02, 0.54, 0.73]
AK − [24]II = [7., 6.77, 5.61, 4.18, 2.95, 2.95, 3.12, 5.3]
CK − [24]II = [2.71, 3.22, 3.87, 4.17, 4.57, 4.18, 3.7, 2.83, 2.71]
EK − [24]II = [3.44, 2.69, 1.84, 0.98, 1.31, 2.05, 2.95, 2.05, 2.56, 3.22]
AK − [8]II = [2.8, 2.6, 1.67, 1.33, 1.17, 1.19, 1.41, 3., ]
CK − [8]II = [0.83, 0.82, 0.91, 1.01, 1.28, 1.33, 1.16, 0.89, 0.83]
EK − [8]II = [1.65, 1.34, 0.85, 0.47, 0.37, 0.68, 1.19, 0.68, 0.69, 0.82]
AK − [24]III = [7., 6.2, 5.01, 2.96, 3.01, 6.]
CK − [24]III = [2.96, 2.97, 3.69, 3.87, 4.3, 3.73, 2.96]
EK − [24]III = [3.45, 3.33, 2.66, 1.33, 1.63, 2.16, 2.58, 2.96]
AK − [8]III = [2.6, 2.1, 1.41, 1.11, 1.3, 3.]
CK − [8]III = [0.91, 0.97, 1.28, 1.33, 1.32, 0.94, 0.91]
EK − [8]III = [1.55, 1.56, 1.31, 0.67, 0.55, 0.81, 0.83, 0.91]
AK − [24]IV = [7., 6.46, 5.4, 4.11, 3.22, 3.2, 3.47, 5.8]
CK − [24]IV = [2.97, 3.95, 4.42, 3.88, 3.08, 2.97]
EK − [24]IV = [3.67, 3.39, 2.6, 2.12, 1.48, 1.6, 2.45, 2.76, 3.02, 3.2]
AK − [8]IV = [2.8, 2.43, 1.74, 1.51, 1.35, 1.37, 1.62, 3.]
CK − [8]IV = [1.13, 1.23, 1.59, 1.54, 1.21, 1.13]
EK − [8]IV = [1.75, 1.74, 1.29, 1.05, 0.77, 0.72, 1.04, 1.06, 1.08, 1.15]
From the IOC runs for finite-thickness discs, we canconclude further that all objects found in the D box withcolours bluer in K - [24] than 4 can be considered as evolvedultra-settled objects. Objects redder in K - [24] than 5represent the evolved discs which are either settled ormixed and/ or flared.
The boundaries for primordial discs with envelopes.
ENVK − [24]I = [3.14, 5.75, 6.8, 8.9]
ENVK − [8]I = [0.73, 0.91, 1.28, 3.]
ENVK − [24]II = [3.22, 5.3, 6.9, 9.]
ENVK − [8]II = [0.82, 0.85, 1.38, 3.]
ENVK − [24]III = [3.73, 4.75, 6.7, 8.9]
ENVK − [8]III = [0.94, 1.0, 1.65, 3.]
ENVK − [24]IV = [3.95, 5.2, 7., 8.5]
ENVK − [8]IV = [1.23, 1.27, 2.05, 3.]


![Wpmen]^ - Flying Disc Museum](https://img.dokumen.tips/doc/110x75/633c817562e54755e7023f2c/wpmen-flying-disc-museum.jpg)


