Embed Size (px)
Citation preview
Dimensioning an Optical Packet/Burst Switch – More Interconnections or More Delay Lines?
Khurram AZIZ*, Shahzad SARWAR, Slavisa ALEKSIC Institute of Broadband Communications
Vienna University of Technology Vienna, Austria [email protected]
Abstract—We present performance evaluation of an optical packet/burst switch with internal fiber rings. Such a switch consists of multiple fabrics linked together by direct interconnections and optical delay lines. Having more number of optical delay lines and direct interconnections per fabric pair reduces contention and results in a reduced blocking probability. However, due to the size and cost of optical delay lines, it is desirable to minimize their number for a specific blocking probability. We propose an analytical model for the switch in order to study its scalability and packet/burst blocking probability. The switch is then dimensioned for given values of blocking probability and a given range of input load. Simulation results concerning switch scalability by taking into account the most relevant physical effects are also shown. We then consider the minimal practical switch size and discuss how the switch can be dimensioned with a combination of delay lines and direct interconnections to achieve our target of a certain blocking probability and range of input load using a minimum number of fiber delay lines.
Index Terms— Switch architecture, performance evaluation, optical switch scalability and dimensioning, packet/burst blocking probability
I. INTRODUCTION he ever increasing bandwidth capacity demand for
Internet traffic, especially due to the development of bandwidth hungry services and applications e.g. Internet video, online gaming and multimedia communications, has stimulated the development of optical communication systems at an unprecedented rate [1-3]. The potential of optical fibre can fully be realized by employing dense wavelength division multiplexing (DWDM) to accommodate more than hundred wavelengths per fibre. The capacity of each wavelength to transfer data at a rate up to 100 Gbit/s provides enormous bandwidth on a single fibre. Hence, DWDM is the prime candidate to meet the tremendous bandwidth capacity demand. Furthermore, based on DWDM, all optical networks can be categorized as optical circuit switched (OCS) networks, optical burst switched (OBS) networks, and optical packet switched (OPS) networks. Inefficient bandwidth use
and two-way signalling to set up long term connections (light paths) make OCS less attractive. Thus, OBS and OPS both are considered as promising choices for the next generation optical networks. Several optical switch architectures have been proposed [4]. It is imperative to design an optical switch that can operate within OBS and OPS networks. In an earlier study, a novel switch architecture capable of packet and burst switching, multicasting by copy-and-forward and contention resolution directly in the optical domain was proposed [5]. The main objective of this paper is to evaluate the proposed switch architecture. We introduce a queueing model to investigate the switch performance and performance gains obtained by different switch configurations, and discuss how to dimension the switch using a combination of delay lines and direct interconnections. Our goal is to achieve a given maximum blocking probability for a range of input load using a minimum number of fiber delay lines.
The rest of the paper is organized as follows. Section 2 describes the architecture of this optical switch. Switching fabrics and scalability issues are described in Section 3. Queueing model to evaluate the performance is described in Section 4. Analytical results are shown in Section 5. Finally, in Section 6, we discuss the results and conclude this paper.
II. OPTICAL SWITCH ARCHITECTURE The proposed switch architecture consists of P optical
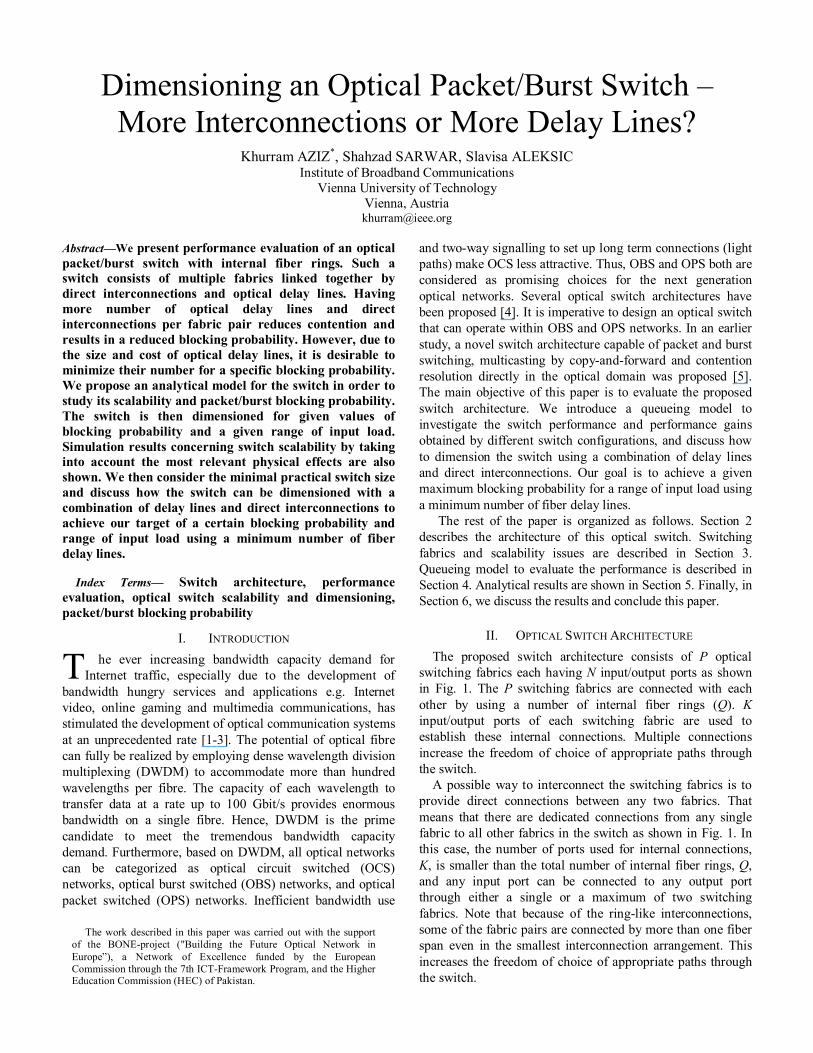
switching fabrics each having N input/output ports as shown in Fig. 1. The P switching fabrics are connected with each other by using a number of internal fiber rings (Q). K input/output ports of each switching fabric are used to establish these internal connections. Multiple connections increase the freedom of choice of appropriate paths through the switch.
A possible way to interconnect the switching fabrics is to provide direct connections between any two fabrics. That means that there are dedicated connections from any single fabric to all other fabrics in the switch as shown in Fig. 1. In this case, the number of ports used for internal connections, K, is smaller than the total number of internal fiber rings, Q, and any input port can be connected to any output port through either a single or a maximum of two switching fabrics. Note that because of the ring-like interconnections, some of the fabric pairs are connected by more than one fiber span even in the smallest interconnection arrangement. This increases the freedom of choice of appropriate paths through the switch.
T
The work described in this paper was carried out with the support of the BONE-project ("Building the Future Optical Network in Europe”), a Network of Excellence funded by the European Commission through the 7th ICT-Framework Program, and the Higher Education Commission (HEC) of Pakistan.
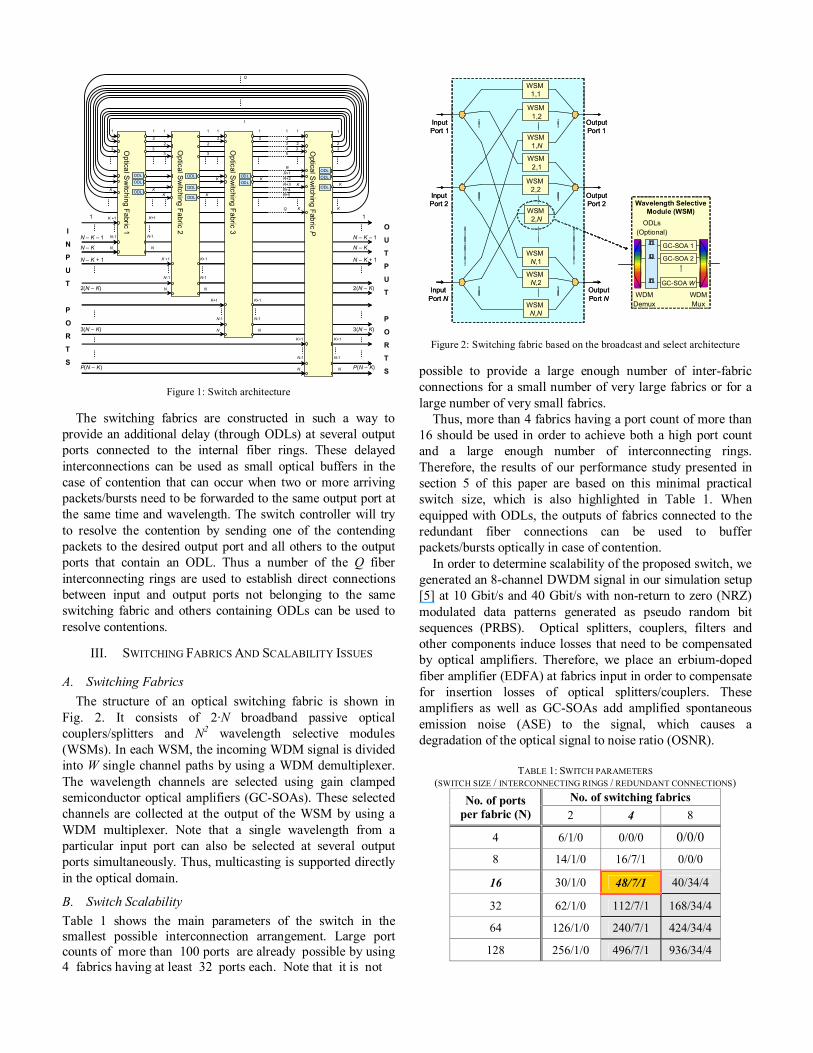
Figure 1: Switch architecture
The switching fabrics are constructed in such a way to provide an additional delay (through ODLs) at several output ports connected to the internal fiber rings. These delayed interconnections can be used as small optical buffers in the case of contention that can occur when two or more arriving packets/bursts need to be forwarded to the same output port at the same time and wavelength. The switch controller will try to resolve the contention by sending one of the contending packets to the desired output port and all others to the output ports that contain an ODL. Thus a number of the Q fiber interconnecting rings are used to establish direct connections between input and output ports not belonging to the same switching fabric and others containing ODLs can be used to resolve contentions.
III. SWITCHING FABRICS AND SCALABILITY ISSUES
A. Switching Fabrics The structure of an optical switching fabric is shown in
Fig. 2. It consists of 2·N broadband passive optical couplers/splitters and N2 wavelength selective modules (WSMs). In each WSM, the incoming WDM signal is divided into W single channel paths by using a WDM demultiplexer. The wavelength channels are selected using gain clamped semiconductor optical amplifiers (GC-SOAs). These selected channels are collected at the output of the WSM by using a WDM multiplexer. Note that a single wavelength from a particular input port can also be selected at several output ports simultaneously. Thus, multicasting is supported directly in the optical domain.
B. Switch Scalability Table 1 shows the main parameters of the switch in the smallest possible interconnection arrangement. Large port counts of more than 100 ports are already possible by using 4 fabrics having at least 32 ports each. Note that it is not
Figure 2: Switching fabric based on the broadcast and select architecture
possible to provide a large enough number of inter-fabric connections for a small number of very large fabrics or for a large number of very small fabrics.
Thus, more than 4 fabrics having a port count of more than 16 should be used in order to achieve both a high port count and a large enough number of interconnecting rings. Therefore, the results of our performance study presented in section 5 of this paper are based on this minimal practical switch size, which is also highlighted in Table 1. When equipped with ODLs, the outputs of fabrics connected to the redundant fiber connections can be used to buffer packets/bursts optically in case of contention.
In order to determine scalability of the proposed switch, we generated an 8-channel DWDM signal in our simulation setup [5] at 10 Gbit/s and 40 Gbit/s with non-return to zero (NRZ) modulated data patterns generated as pseudo random bit sequences (PRBS). Optical splitters, couplers, filters and other components induce losses that need to be compensated by optical amplifiers. Therefore, we place an erbium-doped fiber amplifier (EDFA) at fabrics input in order to compensate for insertion losses of optical splitters/couplers. These amplifiers as well as GC-SOAs add amplified spontaneous emission noise (ASE) to the signal, which causes a degradation of the optical signal to noise ratio (OSNR).
TABLE 1: SWITCH PARAMETERS
(SWITCH SIZE / INTERCONNECTING RINGS / REDUNDANT CONNECTIONS)
No. of switching fabrics No. of ports per fabric (N) 2 4 8
4 6/1/0 0/0/0 0/0/0 8 14/1/0 16/7/1 0/0/0
16 30/1/0 48/7/1 40/34/4
32 62/1/0 112/7/1 168/34/4
64 126/1/0 240/7/1 424/34/4
128 256/1/0 496/7/1 936/34/4
K+1
N-1
N
N-1
N
K +1
N-1
N
K+1
N-1
N
K+1
N-1
N
K+1
N-1
N
K+1
N-1
N
K+1
N-1
N
1
2
3
K
K +1
1
2
3
K
1
23
R
Q
45
R+1R+2R+3R+4R+5
1
2
3
1
2
3
1
2
1
2
1
2
1
2
K K
K K
Optical S
witching Fabric 1
Optical Sw
itching Fabric 2
Optical Sw
itching Fabric 3
Optical S
witching Fabric P
K K
1
Q
3 3
K K
ODL
ODL
ODL
ODL
ODL
ODL
ODL
ODL
ODL
ODL
ODL
1
N – K + 1
P(N – K)
N – K – 1
3(N – K)
I
N
P
U
T
P
O
R
T
S
N – K
2(N – K)
O
U
T
P
U
T
P
O
R
T
S
1
N – K + 1
P(N – K)
N – K – 1
3(N – K)
N – K
2(N – K)
Output Port 1
Input Port 1
Input Port 2
Output Port 2
Input Port N
Output Port N
WSM1,2
WSM 1,1
WSM1,N
WSM 2,2
WSM2,1
WSM 2,N
WSM N,2
WSM N,1
WSM N,N
Wavelength Selective Module (WSM)
WDMDemux
WDM Mux
ODLs(Optional)
GC-SOA 1
GC-SOA 2
GC-SOA W
Output Port 1
Input Port 1
Input Port 2
Output Port 2
Input Port N
Output Port N
WSM1,2
WSM 1,1
WSM1,N
WSM 2,2
WSM2,1
WSM 2,N
WSM N,2
WSM N,1
WSM N,N
Wavelength Selective Module (WSM)
WDMDemux
WDM Mux
ODLs(Optional)
GC-SOA 1
GC-SOA 2
GC-SOA W
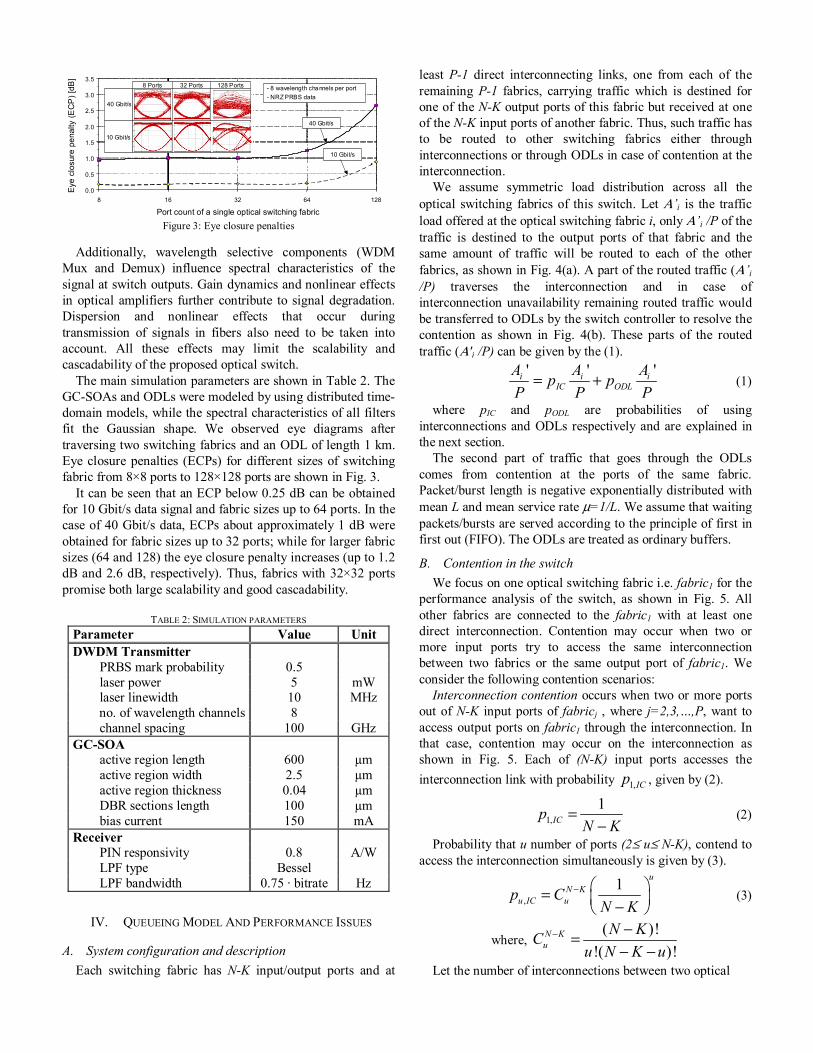
Figure 3: Eye closure penalties
Additionally, wavelength selective components (WDM Mux and Demux) influence spectral characteristics of the signal at switch outputs. Gain dynamics and nonlinear effects in optical amplifiers further contribute to signal degradation. Dispersion and nonlinear effects that occur during transmission of signals in fibers also need to be taken into account. All these effects may limit the scalability and cascadability of the proposed optical switch.
The main simulation parameters are shown in Table 2. The GC-SOAs and ODLs were modeled by using distributed time-domain models, while the spectral characteristics of all filters fit the Gaussian shape. We observed eye diagrams after traversing two switching fabrics and an ODL of length 1 km. Eye closure penalties (ECPs) for different sizes of switching fabric from 8×8 ports to 128×128 ports are shown in Fig. 3.
It can be seen that an ECP below 0.25 dB can be obtained for 10 Gbit/s data signal and fabric sizes up to 64 ports. In the case of 40 Gbit/s data, ECPs about approximately 1 dB were obtained for fabric sizes up to 32 ports; while for larger fabric sizes (64 and 128) the eye closure penalty increases (up to 1.2 dB and 2.6 dB, respectively). Thus, fabrics with 32×32 ports promise both large scalability and good cascadability.
TABLE 2: SIMULATION PARAMETERS
Parameter Value Unit DWDM Transmitter PRBS mark probability 0.5 laser power 5 mW laser linewidth 10 MHz no. of wavelength channels 8 channel spacing 100 GHz GC-SOA active region length 600 µm active region width 2.5 µm active region thickness 0.04 µm
DBR sections length 100 µm
bias current 150 mA Receiver PIN responsivity 0.8 A/W LPF type Bessel LPF bandwidth 0.75 · bitrate Hz
IV. QUEUEING MODEL AND PERFORMANCE ISSUES
A. System configuration and description Each switching fabric has N-K input/output ports and at
least P-1 direct interconnecting links, one from each of the remaining P-1 fabrics, carrying traffic which is destined for one of the N-K output ports of this fabric but received at one of the N-K input ports of another fabric. Thus, such traffic has to be routed to other switching fabrics either through interconnections or through ODLs in case of contention at the interconnection.
We assume symmetric load distribution across all the optical switching fabrics of this switch. Let Α’i is the traffic load offered at the optical switching fabric i, only Α’i /P of the traffic is destined to the output ports of that fabric and the same amount of traffic will be routed to each of the other fabrics, as shown in Fig. 4(a). A part of the routed traffic (Α’i /P) traverses the interconnection and in case of interconnection unavailability remaining routed traffic would be transferred to ODLs by the switch controller to resolve the contention as shown in Fig. 4(b). These parts of the routed traffic (Α'i /P) can be given by the (1).
' ' 'i i iIC ODL
A A Ap pP P P
= + (1)
where pIC and pODL are probabilities of using interconnections and ODLs respectively and are explained in the next section.
The second part of traffic that goes through the ODLs comes from contention at the ports of the same fabric. Packet/burst length is negative exponentially distributed with mean L and mean service rate µ=1/L. We assume that waiting packets/bursts are served according to the principle of first in first out (FIFO). The ODLs are treated as ordinary buffers.
B. Contention in the switch We focus on one optical switching fabric i.e. fabric1 for the
performance analysis of the switch, as shown in Fig. 5. All other fabrics are connected to the fabric1 with at least one direct interconnection. Contention may occur when two or more input ports try to access the same interconnection between two fabrics or the same output port of fabric1. We consider the following contention scenarios:
Interconnection contention occurs when two or more ports out of N-K input ports of fabricj , where j=2,3,…,P, want to access output ports on fabric1 through the interconnection. In that case, contention may occur on the interconnection as shown in Fig. 5. Each of (N-K) input ports accesses the interconnection link with probability 1,ICp , given by (2).
1,1
ICpN K
=−
(2)
Probability that u number of ports (2≤ u≤ N-K), contend to access the interconnection simultaneously is given by (3).
,1 u
N Ku IC up C
N K− = −
(3)
where, ( )!
!( )!N Ku
N KCu N K u
− −=− −
Let the number of interconnections between two optical
10 Gbit/s
40 Gbit/s
8 Ports 32 Ports 128 Ports
10 Gbit/s
40 Gbit/s
0.0
0.5
1.0
1.5
2.0
2.5
3.0
3.5
8 16 32 64 128
Port count of a single optical switching fabric
Eye
clos
ure
pena
lty(E
CP
) [dB
]
10 Gbit/s
40 Gbit/s
8 Ports 32 Ports 128 Ports
10 Gbit/s
40 Gbit/s
- 8 wavelength channels per port- NRZ PRBS data
10 Gbit/s
40 Gbit/s
8 Ports 32 Ports 128 Ports
10 Gbit/s
40 Gbit/s
0.0
0.5
1.0
1.5
2.0
2.5
3.0
3.5
8 16 32 64 128
Port count of a single optical switching fabric
Eye
clos
ure
pena
lty(E
CP
) [dB
]
10 Gbit/s
40 Gbit/s
8 Ports 32 Ports 128 Ports
10 Gbit/s
40 Gbit/s
- 8 wavelength channels per port- NRZ PRBS data
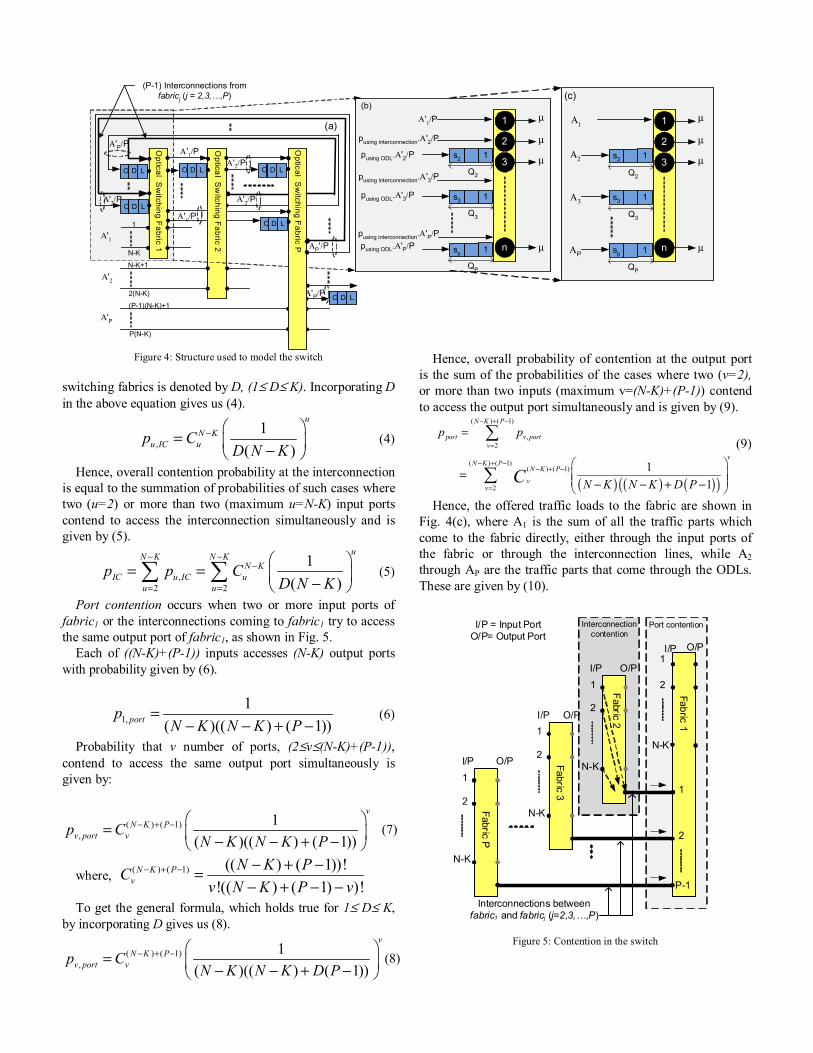
Figure 4: Structure used to model the switch
switching fabrics is denoted by D, (1≤ D≤ K). Incorporating D in the above equation gives us (4).
,1
( )
uN K
u IC up CD N K
− = −
(4)
Hence, overall contention probability at the interconnection is equal to the summation of probabilities of such cases where two (u=2) or more than two (maximum u=N-K) input ports contend to access the interconnection simultaneously and is given by (5).
,2 2
1( )
uN K N KN K
IC u IC uu u
p p CD N K
− −−
= =
= = − ∑ ∑ (5)
Port contention occurs when two or more input ports of fabric1 or the interconnections coming to fabric1 try to access the same output port of fabric1, as shown in Fig. 5.
Each of ((N-K)+(P-1)) inputs accesses (N-K) output ports with probability given by (6).
1,1
( )(( ) ( 1))portpN K N K P
=− − + −
(6)
Probability that v number of ports, (2≤v≤(N-K)+(P-1)), contend to access the same output port simultaneously is given by:
( ) ( 1),
1( )(( ) ( 1))
vN K P
v port vp CN K N K P
− + − = − − + −
(7)
where, ( ) ( 1) (( ) ( 1))!!(( ) ( 1) )!
N K Pv
N K PCv N K P v
− + − − + −=− + − −
To get the general formula, which holds true for 1≤ D≤ K, by incorporating D gives us (8).
( ) ( 1),
1( )(( ) ( 1))
vN K P
v port vp CN K N K D P
− + − = − − + −
(8)
Hence, overall probability of contention at the output port is the sum of the probabilities of the cases where two (v=2), or more than two inputs (maximum v=(N-K)+(P-1)) contend to access the output port simultaneously and is given by (9).
( ) ( ) ( )( )
( ) ( 1)
,2
( ) ( 1)( ) ( 1)
2
11
N K P
port v portv
vN K P
N K P
vv
p p
N K N K D PC
− + −
=
− + −− + −
=
=
= − − + −
∑
∑
(9)
Hence, the offered traffic loads to the fabric are shown in Fig. 4(c), where A1 is the sum of all the traffic parts which come to the fabric directly, either through the input ports of the fabric or through the interconnection lines, while A2 through AP are the traffic parts that come through the ODLs. These are given by (10).
Figure 5: Contention in the switch
O D L
Optical S
witching F
abric 1
Α'1
Α'2
Α'P
Α'2/P
Α'P/P
Α'1/P
Α'2/P
Optical S
witching Fabric 2 ΑP'/P
O D LO D L
Α'1/P
1
N-K
N-K+1
2(N-K)
(P-1)(N-K)+1
P(N-K)
O D L
O D LΑ'P/P
O D LΑ'2/P
1 µ
2 µ
n µ
13 µ
Α'1/P
s2
1sp
1s3
1 µ
2 µ
n µ
13 µs2
1sp
1s3
Α1
Α2
ΑP
Α3
(P-1) Interconnections fromfabricj (j = 2,3,…,P)
Optical S
witching F
abric P
Q2
Q3
QP
Q2
Q3
QP
(b)(c)
(a)
pusing interconnection.Α'P/P
pusing interconnection.Α'3/P
pusing interconnection.Α'2/P
pusing ODL.Α'P/P
pusing ODL.Α'3/P
pusing ODL.Α'2/P
1
2
N-K
Fabric 1
Fabric 2
1
2
N-K
1
2
N-K
Fabric 3
Fabric P
1
2
P-1
N-K
1
2
Port contention
I/P O/P
Interconnections between fabric1 and fabricj (j=2,3,…,P)
I/P O/P
I/P O/P
I/P O/P
I/P = Input PortO/P= Output Port
Interconnectioncontention
( ) ( ) ( )( )( )
1
2 3
' '1 1 1
'
port port IC
P port IC
A AA p P p pP P
AA A A p pP
= ⋅ + − ⋅ − + − ⋅
= = = = + ⋅
(10)
C. States and state transition diagram According to Queueing model we have P number of traffic
parts, see Fig. 4(c). The states of the system can be defined with 2P-1 parameters. Each system state can be represented as state (x1, x2, x3,…, xP, q2, q3,…, qP). There are two categories of parameters. The first category of parameters is denoted by xi (0≤ xi≤n), which represents the number of servers occupied with arrivals of Ai, (1≤i≤P). The second category of parameters is denoted by qj, (0≤ qj≤sj) which represents the number of waiting places occupied with packets/burst of Aj in the corresponding Qj buffer.
D. State probabilities and packet/burst blocking probability The probability that a state exists is p(x1, x2, x3,…, xP, q2,
q3,…, qP). Corresponding state transition diagram for considered system is P-dimensional and all of its states and transitions can not be shown on paper for large number of P. Therefore, general state and its transitions to and from its neighboring states are shown in Fig. 6 for two distinct phases i.e. all servers are busy and only few servers are busy, respectively. These cases are building blocks of the state transition diagram.
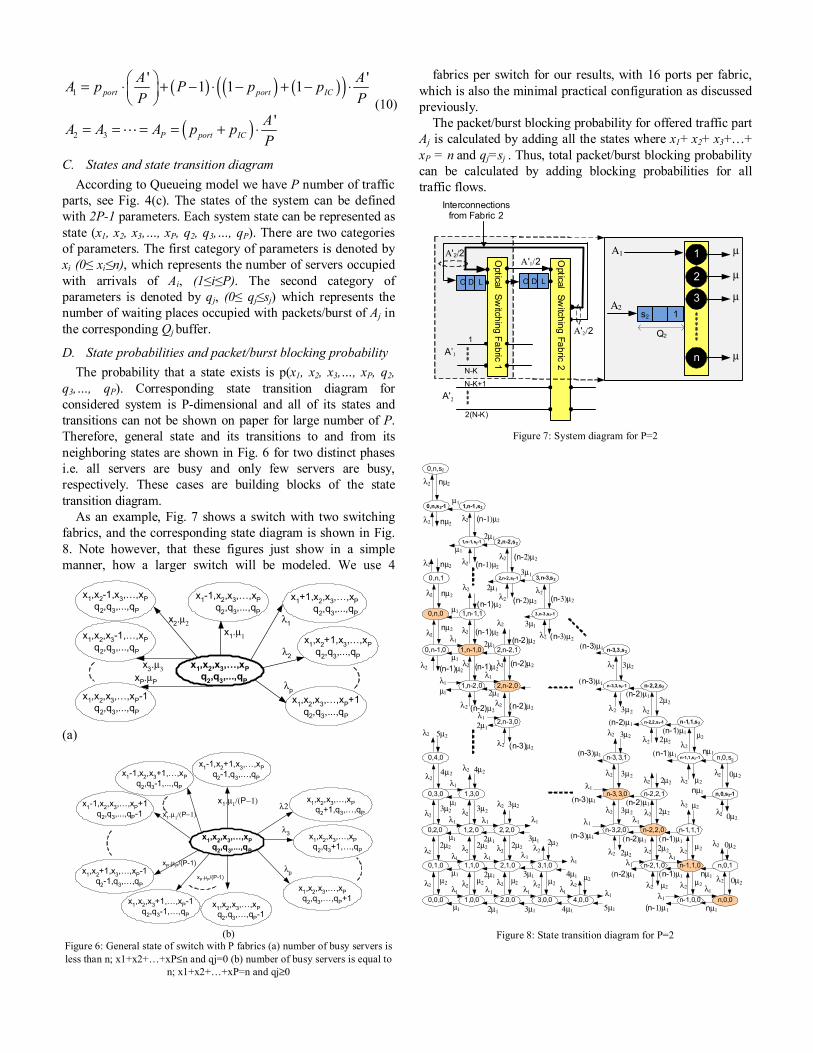
As an example, Fig. 7 shows a switch with two switching fabrics, and the corresponding state diagram is shown in Fig. 8. Note however, that these figures just show in a simple manner, how a larger switch will be modeled. We use 4
(a)
(b) Figure 6: General state of switch with P fabrics (a) number of busy servers is less than n; x1+x2+…+xP≤n and qj=0 (b) number of busy servers is equal to
n; x1+x2+…+xP=n and qj≥0
fabrics per switch for our results, with 16 ports per fabric, which is also the minimal practical configuration as discussed previously.
The packet/burst blocking probability for offered traffic part Aj is calculated by adding all the states where x1+ x2+ x3+…+ xP = n and qj=sj . Thus, total packet/burst blocking probability can be calculated by adding blocking probabilities for all traffic flows.
Figure 7: System diagram for P=2
Figure 8: State transition diagram for P=2
x1,x2,x3,…,xP q2,q3,...,qP
x1-1,x2,x3,…,xP q2,q3,...,qP
x1,x2-1,x3,…,xP q2,q3,...,qP
x1,x2,x3-1,…,xP q2,q3,...,qP
x1.µ1
x1+1,x2,x3,…,xP q2,q3,...,qP
x1,x2+1,x3,…,xPq2,q3,...,qP
x1,x2,x3,…,xP+1q2,q3,...,qP
λp
λ2
λ1x2.µ2
x3.µ3
x1,x2,x3,…,xP-1 q2,q3,...,qP
xP.µP
x1,x2,x3,…,xP q2,q3,...,qP
x1-1,x2+1,x3,…,xP q2-1,q3,…,qP
x1-1,x2,x3+1,…,xP q2,q3-1,...,qP
x1-1,x2,x3,…,xP+1 q2,q3,...,qP-1
x1.µ1/(P−1)x1.µ1/(P−1)
x1,x2,x3,…,xP q2+1,q3,…,qP
x1,x2,x3,…,xP q2,q3+1,…,qP
x1,x2,x3,…,xP q2,q3,…,qP+1
λp
λ3
λ2
x1,x2+1,x3,…,xP-1 q2-1,q3,…,qP
x1,x2,x3+1,…,xP-1 q2,q3-1,…,qP
x1,x2,x3,…,xP q2,q3,…,qP-1
xP.µP/(P-1)
xP.µP/(P-1)
Optical Sw
itching Fabric 1
A’1
A'2
Α'2/2
Α'2/2
Optical Sw
itching Fabric 2
O D LO D L
Α'1/2
1
N-K
N-K+1
2(N-K)
Interconnections from Fabric 2
Α1 1 µ
2 µ
n µ
13 µ
s2
Α2
Q2
0,0,0 1,0,0 2,0,0 3,0,0 4,0,0 n-1,0,0
0,1,0 1,1,0 2,1,0 3,1,0 n-2,1,0 n-1,1,0
0,2,0 1,2,0 2,2,0 n-3,2,0 n-2,2,0 n-1,1,1
0,3,0 1,3,0 n-3,3,0 n-2,2,1
0,4,0 n-3,3,1 n-1,1,s2-1
2,n-3,0 n-2,2,s2-1 n-1,1,s2
1,n-2,0 2,n-2,0 n-3,3,s2-1 n-2,2,s2
0,n-1,0 1,n-1,0 2,n-2,1 n-3,3,s2
0,n,0 1,n-1,1 3,n-3,s2-1
0,n,1 2,n-2,s2-1 3,n-3,s2
1,n-1,s2-1 2,n-2,s2
n,0,0
n,0,1
0,n,s2-1
0,n,s2
1,n-1,s2
n,0,s2-1
n,0,s2
λ2
µ1
µ2λ1
2µ1
λ1
3µ1
λ1
4µ1
λ1
nµ1
λ1
(n-1)µ15µ1
λ1 λ1
µ1
λ1
2µ1
λ1
3µ1
λ1
4µ1
λ1
µ1
λ1
2µ1
λ1
3µ1
λ1
µ1
λ1
λ2µ2 λ2 µ2 λ2
µ2
λ22µ2 λ2 λ2
2µ2 2µ2
λ23µ2
λ23µ23µ2
λ24µ2
λ2 5µ2
λ2 (n-1)µ2
(n-2)µ1
λ1
(n-1)µ1
λ1
nµ1
(n-1)µ1(n-2)µ1
λ1
λ2nµ2
µ1
λ1
λ2 (n-1)µ2
2µ1
λ1
λ2 (n-2)µ2
2µ1
(n-2)µ2
(n-1)µ2λ2
λ2 nµ2
λ2 nµ2
λ2 nµ2
λ2 nµ2
λ2 4µ2
λ22µ2
(n-3)µ1
λ1
λ2 (n-1)µ2
λ2 (n-2)µ2
2µ1
2µ1
µ1
µ1
3µ1
3µ1
λ2(n-3)µ2
(n-3)µ1
λ2 3µ2
λ2
2µ2
λ2
µ2
(n-3)µ1
(n-3)µ1
λ2 3µ2
λ2 3µ2
λ1
(n-3)µ1
λ2 3µ2
λ2 3µ2
(n-2)µ1
(n-2)µ1(n-1)µ1
(n-1)µ1
nµ1
0µ2
0µ2
λ2
λ2
λ2 0µ2
λ2 0µ2µ2
µ2λ2
λ22µ2λ2
(n-2)µ1
µ1(n-1)µ2
λ2
nµ1
λ2µ2
λ2µ2λ2 2µ2
λ2 2µ2
λ2 (n-2)µ2
λ1
µ1
λ1
2µ1
λ2 (n-3)µ2
λ2
λ2µ2
(n-2)µ2
λ2
λ2 (n-1)µ2
λ2 (n-2)µ2
λ2 (n-3)µ2
λ2
λ2 2µ2
λ2 µ2
2µ2λ2
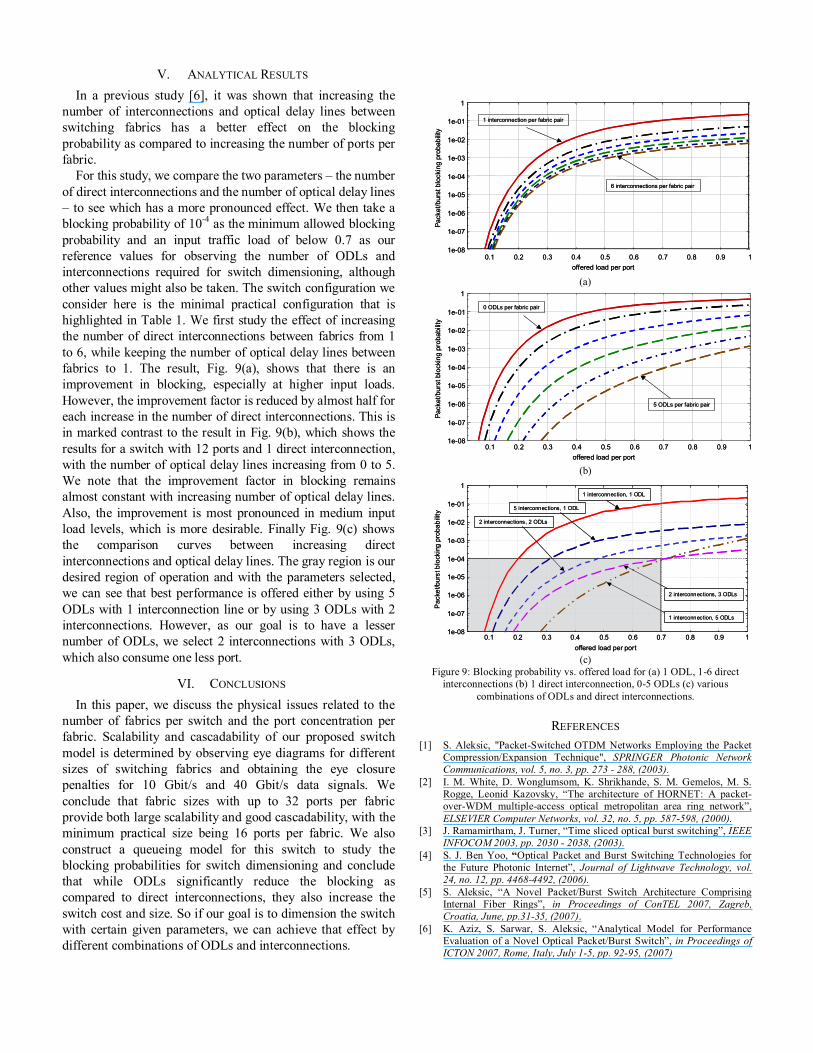
V. ANALYTICAL RESULTS In a previous study [6], it was shown that increasing the
number of interconnections and optical delay lines between switching fabrics has a better effect on the blocking probability as compared to increasing the number of ports per fabric.
For this study, we compare the two parameters – the number of direct interconnections and the number of optical delay lines – to see which has a more pronounced effect. We then take a blocking probability of 10-4 as the minimum allowed blocking probability and an input traffic load of below 0.7 as our reference values for observing the number of ODLs and interconnections required for switch dimensioning, although other values might also be taken. The switch configuration we consider here is the minimal practical configuration that is highlighted in Table 1. We first study the effect of increasing the number of direct interconnections between fabrics from 1 to 6, while keeping the number of optical delay lines between fabrics to 1. The result, Fig. 9(a), shows that there is an improvement in blocking, especially at higher input loads. However, the improvement factor is reduced by almost half for each increase in the number of direct interconnections. This is in marked contrast to the result in Fig. 9(b), which shows the results for a switch with 12 ports and 1 direct interconnection, with the number of optical delay lines increasing from 0 to 5. We note that the improvement factor in blocking remains almost constant with increasing number of optical delay lines. Also, the improvement is most pronounced in medium input load levels, which is more desirable. Finally Fig. 9(c) shows the comparison curves between increasing direct interconnections and optical delay lines. The gray region is our desired region of operation and with the parameters selected, we can see that best performance is offered either by using 5 ODLs with 1 interconnection line or by using 3 ODLs with 2 interconnections. However, as our goal is to have a lesser number of ODLs, we select 2 interconnections with 3 ODLs, which also consume one less port.
VI. CONCLUSIONS In this paper, we discuss the physical issues related to the
number of fabrics per switch and the port concentration per fabric. Scalability and cascadability of our proposed switch model is determined by observing eye diagrams for different sizes of switching fabrics and obtaining the eye closure penalties for 10 Gbit/s and 40 Gbit/s data signals. We conclude that fabric sizes with up to 32 ports per fabric provide both large scalability and good cascadability, with the minimum practical size being 16 ports per fabric. We also construct a queueing model for this switch to study the blocking probabilities for switch dimensioning and conclude that while ODLs significantly reduce the blocking as compared to direct interconnections, they also increase the switch cost and size. So if our goal is to dimension the switch with certain given parameters, we can achieve that effect by different combinations of ODLs and interconnections.
(a)
(b)
(c) Figure 9: Blocking probability vs. offered load for (a) 1 ODL, 1-6 direct
interconnections (b) 1 direct interconnection, 0-5 ODLs (c) various combinations of ODLs and direct interconnections.
REFERENCES [1] S. Aleksic, "Packet-Switched OTDM Networks Employing the Packet
Compression/Expansion Technique", SPRINGER Photonic Network Communications, vol. 5, no. 3, pp. 273 - 288, (2003).
[2] I. M. White, D. Wonglumsom, K. Shrikhande, S. M. Gemelos, M. S. Rogge, Leonid Kazovsky, “The architecture of HORNET: A packet-over-WDM multiple-access optical metropolitan area ring network”, ELSEVIER Computer Networks, vol. 32, no. 5, pp. 587-598, (2000).
[3] J. Ramamirtham, J. Turner, “Time sliced optical burst switching”, IEEE INFOCOM 2003, pp. 2030 - 2038, (2003).
[4] S. J. Ben Yoo, “Optical Packet and Burst Switching Technologies for the Future Photonic Internet”, Journal of Lightwave Technology, vol. 24, no. 12, pp. 4468-4492, (2006).
[5] S. Aleksic, “A Novel Packet/Burst Switch Architecture Comprising Internal Fiber Rings”, in Proceedings of ConTEL 2007, Zagreb, Croatia, June, pp.31-35, (2007).
[6] K. Aziz, S. Sarwar, S. Aleksic, “Analytical Model for Performance Evaluation of a Novel Optical Packet/Burst Switch”, in Proceedings of ICTON 2007, Rome, Italy, July 1-5, pp. 92-95, (2007)
1e-08
1e-07
1e-06
1e-05
1e-04
1e-03
1e-02
1e-01
1
0.1 0.2 0.3 0.4 0.5 0.6 0.7 0.8 0.9 1
Pack
et/b
urst
blo
ckin
gpr
obab
ility
offered load per port
1 interconnection per fabric pair
6 interconnections per fabric pair
1e-08
1e-07
1e-06
1e-05
1e-04
1e-03
1e-02
1e-01
1
0.1 0.2 0.3 0.4 0.5 0.6 0.7 0.8 0.9 1
Pack
et/b
urst
blo
ckin
gpr
obab
ility
offered load per port
1 interconnection per fabric pair
6 interconnections per fabric pair
1e-08
1e-07
1e-06
1e-05
1e-04
1e-03
1e-02
1e-01
1
0.1 0.2 0.3 0.4 0.5 0.6 0.7 0.8 0.9 1offered load per port
0 ODLs per fabric pair
5 ODLs per fabric pair
Pack
et/b
urst
blo
ckin
gpr
obab
ility
1e-08
1e-07
1e-06
1e-05
1e-04
1e-03
1e-02
1e-01
1
0.1 0.2 0.3 0.4 0.5 0.6 0.7 0.8 0.9 1offered load per port
0 ODLs per fabric pair
5 ODLs per fabric pair
Pack
et/b
urst
blo
ckin
gpr
obab
ility
1e-08
1e-07
1e-06
1e-05
1e-04
1e-03
1e-02
1e-01
1
0.1 0.2 0.3 0.4 0.5 0.6 0.7 0.8 0.9 1offered load per port
1 interconnection, 1 ODL
5 interconnections, 1 ODL
2 interconnections, 2 ODLs
2 interconnections, 3 ODLs
Pac
ket/b
urst
blo
ckin
gpr
obab
ility
1 interconnection, 5 ODLs
1e-08
1e-07
1e-06
1e-05
1e-04
1e-03
1e-02
1e-01
1
0.1 0.2 0.3 0.4 0.5 0.6 0.7 0.8 0.9 1offered load per port
1 interconnection, 1 ODL
5 interconnections, 1 ODL
2 interconnections, 2 ODLs
2 interconnections, 3 ODLs
Pac
ket/b
urst
blo
ckin
gpr
obab
ility
1 interconnection, 5 ODLs


