Embed Size (px)
Citation preview
Public Health Nutrition: 13(9), 1419–1429 doi:10.1017/S1368980010000662
Dietary habits of Palestinian adolescents and associatedsociodemographic characteristics in Ramallah, Nablus andHebron governorates
Nahed Mikki1,2,*, Hanan F Abdul-Rahim3, Zumin Shi1 and Gerd Holmboe-Ottesen1
1Section of Preventive Medicine and Epidemiology, Institute of General Practice and Community Medicine,University of Oslo, PO Box 1130, 0318-Oslo, Norway: 2Institute of Community and Public Health,Birzeit University, Ramallah, Occupied Palestinian Territory: 3International Affairs Department,Qatar University, Doha, Qatar
Submitted 5 June 2009: Accepted 24 February 2010: First published online 4 May 2010
Abstract
Objective: To describe food habits and associated sociodemographic factors.Design: Cross-sectional survey in 2005.Setting: Ninety-six school classes in Ramallah, Nablus and Hebron governorates,Occupied Palestinian Territory.Subjects: Grade 8 and 9 students aged 13–15 years (n 2952).Methods: Self-administered student and parent questionnaires.Results: High standard of living (STL) index and residence in Ramallah werepositively associated with intake of animal foods, Western-style foods, dairyproducts, fruits and vegetables, sweets and salty snacks. Only 26?1 % of the stu-dents ate three main meals daily; 26?2 % of the boys and 51?0 % of the girls hadbreakfast one to two times per week or less often (P , 0?001). Only one-quarterof students drank milk daily (32?9 % of boys and 18?3 % of girls, P , 0?001). Themajority of students, boys and girls in similar proportions, consumed vegetablesdaily (72?8 % v. 73?8 %, respectively). Daily fruit consumption was also equallycommon among boys and girls (58?9 % v. 55?2 %, respectively), but with cleardifferences by STL, region and parents’ education. Daily intake of sweets and saltysnacks was common among girls, and daily intake of soft drinks was commonamong boys.Conclusions: Irregular meal patterns were common among Palestinian adolescents.High STL and residence in Ramallah were associated with frequent intake of foodshigh in sugar and fat, but also with frequent intake of fruits and vegetables. Effectiveinterventions are needed to establish healthy dietary habits.
KeywordsDietary habits
Palestinian adolescentsNutrition
Sociodemographic factors
Adolescents’ eating habits affect their risk of developing
health and cognitive problems, including obesity, type 2
diabetes, poor bone mineralisation and poor academic
performance(1). Evidence suggests that adolescents’ dietary
behaviours track into adulthood(2). Currently, the main
features of adolescents’ food habits include breakfast skip-
ping, snacking and low consumption of fruits and vege-
tables(3). Breakfast skipping has been linked to inadequate
diet, increased risk of obesity, lack of attention and impaired
memory in schoolchildren(4,5). In the international report of
the Health Behaviour in School-aged Children (HBSC) sur-
vey in 2005–2006, the proportion of young people eating
breakfast daily varied between countries within a range of
40–50%(3). In the same survey, approximately 30–41% and
30–34% of adolescents in different countries reported daily
consumption of fruits and vegetables, respectively(3). Diets
rich in fruits have been shown to be protective against a
number of childhood illnesses(6,7) and some adult cancers(8).
Eating habits vary by socio-economic status, education,
gender and age(9,10).
Palestinian society is undergoing nutrition transi-
tion(11). A high prevalence of nutrition-related chronic
diseases such as diabetes and obesity has been found in
studies of Palestinian adults(12). Food consumption pat-
terns among Palestinians have changed to a more
Westernised diet with increased intake of refined modern
foods, such as white commercial bread, soft drinks and
sweets, and decreased intake of traditional foods, such as
legumes and bread made from brown flour(13). On the
other hand, severe restrictions on movement of people
and goods affect households’ economies and their access
to and ability to purchase food, leading to food insecur-
ity(14). Approximately 34 % of the West Bank (WB)
population was found to be food insecure in 2006(14).
*Corresponding author: Email [email protected]; [email protected] r The Authors 2010
Palestinian adolescents (10–19 years) comprise 24 % of
the population(15). Their dietary habits are important, yet
understudied. To our knowledge, adolescent dietary
habits in the WB have only been studied as part of the
2004 HBSC survey conducted in the WB and Gaza Strip.
The survey identified such problems as breakfast skip-
ping, especially among girls, and low-frequency intake of
milk, fruits and vegetables(16). The objectives of the pre-
sent study were to describe food habits among Palestinian
adolescents in three main governorates (administrative
divisions of the Occupied Palestinian Territory) in the WB
(Ramallah, Nablus and Hebron) and to investigate the
relationship between food habits and sociodemographic
factors (region, gender, urban/rural residence, standard of
living (STL) index and parents’ education).
Subjects and methods
Study design and population
A cross-sectional survey was conducted in urban and
rural schools in Ramallah, Hebron and Nablus gover-
norates between March and May 2005. Ramallah is loca-
ted in the middle of the WB, with 279 730 inhabitants in
2007(15). Hebron is situated in the southern part and
Nablus in the northern part, with 552 164 and 320 830
inhabitants, respectively, in 2007(15). In a comparison of
demographic and lifestyle characteristics such as age of
women at marriage, types of employment and availability
of modern household amenities, Ramallah and Hebron
cities represent two distinctive modes of urban life, with
Ramallah being more modernised and having a higher
standard of living. With respect to these indicators, Nablus
is in an intermediate position(17).
Sample selection
The sample was selected to be representative of students
attending 8th and 9th grade classes in the three gover-
norates. A list including the number of students per
classroom in 2004–2005 was provided by the Palestinian
Ministry of Education and Higher Education. The total
number of 8th and 9th grade students was 13 011 in
Ramallah, 15 315 in Nablus and 26 681 in Hebron. The
classes were divided into nine strata by gender (boys’,
girls’ and coeducational schools) and school type (public,
United Nation Relief and Works Agency (UNRWA) and
private). The sample was selected using single-stage
probability proportional-to-size sampling from each of
the nine strata within each governorate, with the class as
the primary sampling unit. A sample size of 1000 students
in each governorate was set for a maximum margin of
error of 2?9 % in the prevalence estimates of overweight/
obesity as reported previously(18). Ninety-six classes were
selected: thirty-four in Ramallah, thirty-one in Hebron and
thirty-one in Nablus. All students in the selected classes
were invited to participate in the study.
Data collection procedures
Self-administered questionnaires were used to collect
information from students and parents. The researcher
and trained fieldworkers gave students standardised
instructions on filling in their questionnaires, which were
completed in the classroom in 1?5–2 h. Fieldworkers were
present during administration of the questionnaires to
clarify questions when needed. The students’ ques-
tionnaire contained questions about age, residence,
household amenities and meal and food frequency lists.
The parents’ questionnaires included household infor-
mation such as family size and parents’ education. It was
taken home by students and returned to school the fol-
lowing day. Both students’ and parents’ questionnaires
were piloted in Ramallah with forty girls and twenty-two
boys and their parents in two classes (8th and 9th grades)
and corrections were made accordingly. The students’
questionnaire was also tested for reliability (1 week test–
retest) for a different sample of 115 students (sixty-three
girls and fifty-two boys) in two 8th grade and two 9th
grade classes in four schools (two urban and two rural) in
Ramallah governorate.
Ethical consideration
Informed consent was obtained from parents, students
and school principals. Respondents were informed that
answering the anonymous questionnaire was voluntary
and that information would be treated confidentially.
Moreover, the class teacher was not present during
administration of the questionnaires. The study was a
collaboration between the Institute of General Practice
and Community Medicine at the University of Oslo and
the Institute of Community and Public Health at Birzeit
University. The protocol was approved by both institutes
and by the Palestinian Ministry of Education and Higher
Education, the UNRWA Office of Education and the
Regional Ethical Committee of Norway.
Measures
Food and meal frequency lists
The students’ questionnaire contained a frequency list of
forty-two food items without portion sizes. Thirty-two
items in this list were based on 24 h dietary recalls carried
out for twelve adolescents (nine girls and three boys) in
the same age range before the study. More items were
added based on a previous study of Palestinian adults(13)
and thorough local knowledge of Palestinian food habits.
The food and beverage question was ‘How often do you
drink/eat the following items?’ The response categories
were converted to frequencies in times/week (in par-
entheses) and these were more than four times per day
(35), three to four times per day (24?5), one to two times
per day (10?5), four to six times per week (5), two to three
times per week (2?5), once a week (1), one to three times
per month (0?5) and seldom/never (0).
1420 N Mikki et al.
The meal/snack pattern question was ‘How often do
you eat the following meal/snack?’ The response cate-
gories were daily, three to four times per week, one to
two times per week and seldom/never.
The following food scores were constructed from the
food frequency list:
> Animal food score: including meat from beef or lamb,
chicken, liver, kidney, shawerma (dish made from beef
or lamb or chicken), sausage, hamburger, fish, canned
fish, cold cuts and eggs.> Dairy products score: including milk, flavoured milk,
yoghurt, labaneh (partially dehydrated yoghurt), white
cheese and yellow cheese.> Fruit and vegetables score: including fresh fruits, fresh
fruit juice, cucumber, tomatoes, other fresh vegetables,
cooked vegetables and green leafy vegetables (spinach
and others).> Western food score: including pasta, pizza, hamburger,
cornflakes, fried potatoes, hot dogs, and soft drinks
(regular and diet).> Sweets and salty snacks score: including sweets and
chocolates, salty snacks, fruit nectar and soft drinks
(regular and diet).
The five scores were constructed by the sum of reco-
ded responses to weekly frequency intakes of food items
divided by the number of items in each score. The 1-week
test–retest reliability of the scores had a Spearman cor-
relation from r 5 0?53 to 0?73.
Sociodemographic factors
The household STL was based on household possessions.
Ownership of central heating, family car, family mobile
phone, personal mobile phone, indoor bathroom, water
pipes, refrigerator, full automatic washing machine, col-
our television, satellite, video, computer, dish washer,
microwave oven, vacuum cleaner and Internet connec-
tion were summed; each item was given a value of 1.
Three categories were constructed: ‘low’, #6; ‘medium’,
7–10; and ‘high’, 11–16. The 1-week test–retest of own-
ership of these amenities showed consistent answers
ranging between 86?1 % and 99?1 %. The Spearman cor-
relation coefficient between STL and parents’ education
was 0?38 (P , 0?001).
Parents’ education was based on mother’s and father’s
education; three categories were constructed: ‘low’ if both
parents had less than secondary education; ‘medium’ if both
parents had completed secondary education or if one had
completed secondary education or had college or university
degree and the other had less than secondary education;
and ‘high’ if both parents had college or university degree or
if one had college or university degree and the other had
completed secondary education.
Urban/rural classification was based on Palestinian
Central Bureau of Statistics (PCBS) classification, which is
based on services and population size(19).
Family was defined as family members living together
in the same household.
Statistical analysis
Statistical analysis was performed using the Stata 10 statis-
tical software package (Stata Corporation, College Station,
TX, USA) and adjusted for design effect; the sample was
weighted according to sample and population size in each
governorate (inverse of sampling probability) and the ana-
lysis was adjusted for possible dependencies due to cluster
design. Statistical significance was set at P , 0?05. The x2 test
was used to compare frequencies, and the t test or ANOVA
was used to compare means. Multivariate linear regression
analysis was performed to model the association between
food scores and sociodemographic characteristics. The fol-
lowing tests were conducted in regression analysis: (i) lin-
earity effects of the covariates, (ii) normality of residuals, (iii)
homoscedasticity of variance and (iv) points of high influ-
ence. Plausible interactions among the independent vari-
ables in the regression models were investigated.
Results
Response rates and sample characteristics
Two schools in Ramallah refused to participate and were
replaced by schools from the same stratum of the sampling
frame. Of the 3271 students in the invited sample, 3071
(93?9%) consented to participate. Only students aged
13–15 years were included in the present analyses, thus
excluding 119 students outside these age groups(18). The
final sample consisted of 2952 students (96?1% of those
participating). In total, 2846 (96?4%) parents completed
their questionnaires. Of the 106 non-responding parents,
no difference was found in STL, urban/rural residence or
age categories of students compared to responding par-
ents. However, of the non-responding parents, 17?9%
were from Ramallah, 56?6% were from Hebron and 25?5%
were from Nablus (P , 0?05) and 72?6% had male children
(P , 0?05).
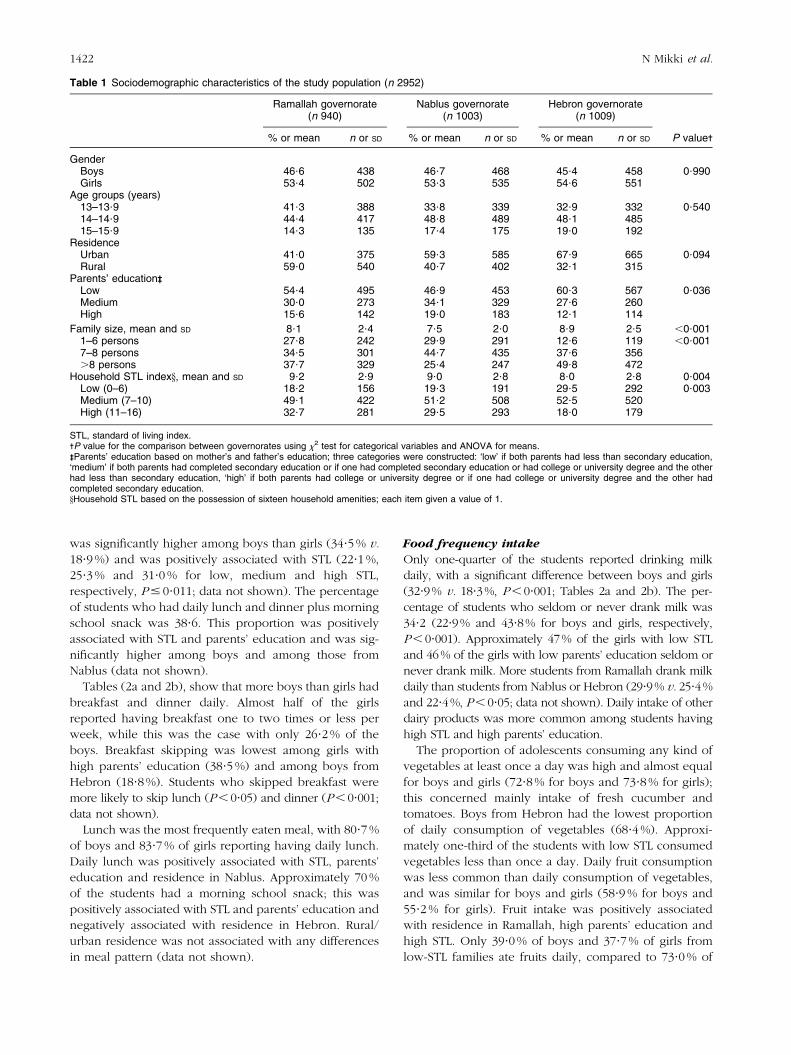
Table 1 shows that approximately equal proportions of
students were from Ramallah, Hebron and Nablus gover-
norates, with slightly more girls in all the three governorates.
The students generally came from large families, with the
largest mean family size in Hebron (8?9 v. 8?1 in Ramallah
and 7?5 in Nablus). Hebron also had the highest proportion
of families with more than eight members (49?8%, 37?7%
and 25?4% for Hebron, Ramallah and Nablus, respectively).
Ramallah governorate had the highest mean STL index
(9?2 v. 9?0 in Nablus and 8?0 in Hebron) and the highest
proportion of families in the high-STL category (32?7% v.
29?5% in Nablus and 18?0% in Hebron).
Meal pattern
Only 26?1 % of the students reported having three main
daily meals (breakfast, lunch and dinner). This proportion
Dietary habits of Palestinian adolescents 1421
was significantly higher among boys than girls (34?5 % v.
18?9 %) and was positively associated with STL (22?1 %,
25?3 % and 31?0 % for low, medium and high STL,
respectively, P # 0?011; data not shown). The percentage
of students who had daily lunch and dinner plus morning
school snack was 38?6. This proportion was positively
associated with STL and parents’ education and was sig-
nificantly higher among boys and among those from
Nablus (data not shown).
Tables (2a and 2b), show that more boys than girls had
breakfast and dinner daily. Almost half of the girls
reported having breakfast one to two times or less per
week, while this was the case with only 26?2 % of the
boys. Breakfast skipping was lowest among girls with
high parents’ education (38?5 %) and among boys from
Hebron (18?8 %). Students who skipped breakfast were
more likely to skip lunch (P , 0?05) and dinner (P , 0?001;
data not shown).
Lunch was the most frequently eaten meal, with 80?7 %
of boys and 83?7 % of girls reporting having daily lunch.
Daily lunch was positively associated with STL, parents’
education and residence in Nablus. Approximately 70 %
of the students had a morning school snack; this was
positively associated with STL and parents’ education and
negatively associated with residence in Hebron. Rural/
urban residence was not associated with any differences
in meal pattern (data not shown).
Food frequency intake
Only one-quarter of the students reported drinking milk
daily, with a significant difference between boys and girls
(32?9% v. 18?3%, P , 0?001; Tables 2a and 2b). The per-
centage of students who seldom or never drank milk was
34?2 (22?9% and 43?8% for boys and girls, respectively,
P , 0?001). Approximately 47% of the girls with low STL
and 46% of the girls with low parents’ education seldom or
never drank milk. More students from Ramallah drank milk
daily than students from Nablus or Hebron (29?9% v. 25?4%
and 22?4%, P , 0?05; data not shown). Daily intake of other
dairy products was more common among students having
high STL and high parents’ education.
The proportion of adolescents consuming any kind of
vegetables at least once a day was high and almost equal
for boys and girls (72?8 % for boys and 73?8 % for girls);
this concerned mainly intake of fresh cucumber and
tomatoes. Boys from Hebron had the lowest proportion
of daily consumption of vegetables (68?4 %). Approxi-
mately one-third of the students with low STL consumed
vegetables less than once a day. Daily fruit consumption
was less common than daily consumption of vegetables,
and was similar for boys and girls (58?9 % for boys and
55?2 % for girls). Fruit intake was positively associated
with residence in Ramallah, high parents’ education and
high STL. Only 39?0 % of boys and 37?7 % of girls from
low-STL families ate fruits daily, compared to 73?0 % of
Table 1 Sociodemographic characteristics of the study population (n 2952)
Ramallah governorate Nablus governorate Hebron governorate(n 940) (n 1003) (n 1009)
% or mean n or SD % or mean n or SD % or mean n or SD P value-
GenderBoys 46?6 438 46?7 468 45?4 458 0?990Girls 53?4 502 53?3 535 54?6 551
Age groups (years)13–13?9 41?3 388 33?8 339 32?9 332 0?54014–14?9 44?4 417 48?8 489 48?1 48515–15?9 14?3 135 17?4 175 19?0 192
ResidenceUrban 41?0 375 59?3 585 67?9 665 0?094Rural 59?0 540 40?7 402 32?1 315
Parents’ education-
-
Low 54?4 495 46?9 453 60?3 567 0?036Medium 30?0 273 34?1 329 27?6 260High 15?6 142 19?0 183 12?1 114
Family size, mean and SD 8?1 2?4 7?5 2?0 8?9 2?5 ,0?0011–6 persons 27?8 242 29?9 291 12?6 119 ,0?0017–8 persons 34?5 301 44?7 435 37?6 356.8 persons 37?7 329 25?4 247 49?8 472
Household STL indexy, mean and SD 9?2 2?9 9?0 2?8 8?0 2?8 0?004Low (0–6) 18?2 156 19?3 191 29?5 292 0?003Medium (7–10) 49?1 422 51?2 508 52?5 520High (11–16) 32?7 281 29?5 293 18?0 179
STL, standard of living index.-P value for the comparison between governorates using x2 test for categorical variables and ANOVA for means.-
-
Parents’ education based on mother’s and father’s education; three categories were constructed: ‘low’ if both parents had less than secondary education,‘medium’ if both parents had completed secondary education or if one had completed secondary education or had college or university degree and the otherhad less than secondary education, ‘high’ if both parents had college or university degree or if one had college or university degree and the other hadcompleted secondary education.yHousehold STL based on the possession of sixteen household amenities; each item given a value of 1.
1422 N Mikki et al.
boys and 68?9 % of girls from high-STL families. Daily
vegetable and fruit intakes did not differ between urban
and rural residents (data not shown).
The intakes of soft drinks, salty snacks, sweets and
cornflakes were positively associated with residence in
Ramallah and high STL. The percentage of boys who
reported eating salty snacks daily was 50?3 compared to
61?5 % of the girls (P , 0?01), while for regular soft drinks
the corresponding figures were 39?6 % for boys and
28?4 % for girls (P , 0?001). Daily intake of fried potatoes
was negatively associated with STL and parents’ educa-
tion. Frequency of eating fish was quite low; 36?1 % of the
adolescents reported consuming fish one to three times
per month and 24?8 % reported that they never consumed
fish (data not shown).
Food scores
Grouping the different food items in five scores (Table 3)
revealed significant differences between genders. Boys,
in comparison with the girls, had a significantly higher
animal food score, dairy products score and Western
food score, but this was not the case for the fruit and
vegetable score. The mean fruit and vegetable score
was 6?5 times per week for boys and 6?1 times per week
for girls (P 5 0?088). Significant differences were also
found among regions and STL categories in all five
scores. Residents of Ramallah and those with high
STL had higher scores. High parents’ education was
positively associated with dairy products score. Students
from large families (more than eight persons) had lower
food scores.
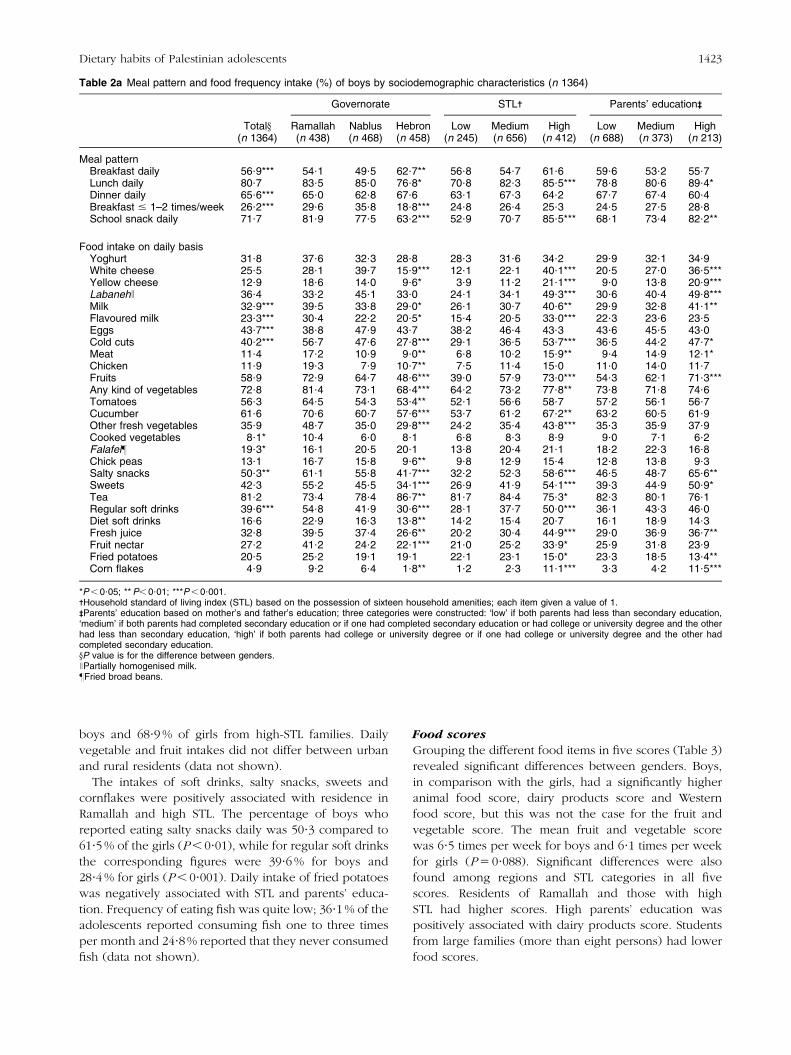
Table 2a Meal pattern and food frequency intake (%) of boys by sociodemographic characteristics (n 1364)
Governorate STL- Parents’ education-
-
Totaly Ramallah Nablus Hebron Low Medium High Low Medium High(n 1364) (n 438) (n 468) (n 458) (n 245) (n 656) (n 412) (n 688) (n 373) (n 213)
Meal patternBreakfast daily 56?9*** 54?1 49?5 62?7** 56?8 54?7 61?6 59?6 53?2 55?7Lunch daily 80?7 83?5 85?0 76?8* 70?8 82?3 85?5*** 78?8 80?6 89?4*Dinner daily 65?6*** 65?0 62?8 67?6 63?1 67?3 64?2 67?7 67?4 60?4Breakfast # 1–2 times/week 26?2*** 29?6 35?8 18?8*** 24?8 26?4 25?3 24?5 27?5 28?8School snack daily 71?7 81?9 77?5 63?2*** 52?9 70?7 85?5*** 68?1 73?4 82?2**
Food intake on daily basisYoghurt 31?8 37?6 32?3 28?8 28?3 31?6 34?2 29?9 32?1 34?9White cheese 25?5 28?1 39?7 15?9*** 12?1 22?1 40?1*** 20?5 27?0 36?5***Yellow cheese 12?9 18?6 14?0 9?6* 3?9 11?2 21?1*** 9?0 13?8 20?9***LabanehJ 36?4 33?2 45?1 33?0 24?1 34?1 49?3*** 30?6 40?4 49?8***Milk 32?9*** 39?5 33?8 29?0* 26?1 30?7 40?6** 29?9 32?8 41?1**Flavoured milk 23?3*** 30?4 22?2 20?5* 15?4 20?5 33?0*** 22?3 23?6 23?5Eggs 43?7*** 38?8 47?9 43?7 38?2 46?4 43?3 43?6 45?5 43?0Cold cuts 40?2*** 56?7 47?6 27?8*** 29?1 36?5 53?7*** 36?5 44?2 47?7*Meat 11?4 17?2 10?9 9?0** 6?8 10?2 15?9** 9?4 14?9 12?1*Chicken 11?9 19?3 7?9 10?7** 7?5 11?4 15?0 11?0 14?0 11?7Fruits 58?9 72?9 64?7 48?6*** 39?0 57?9 73?0*** 54?3 62?1 71?3***Any kind of vegetables 72?8 81?4 73?1 68?4*** 64?2 73?2 77?8** 73?8 71?8 74?6Tomatoes 56?3 64?5 54?3 53?4** 52?1 56?6 58?7 57?2 56?1 56?7Cucumber 61?6 70?6 60?7 57?6*** 53?7 61?2 67?2** 63?2 60?5 61?9Other fresh vegetables 35?9 48?7 35?0 29?8*** 24?2 35?4 43?8*** 35?3 35?9 37?9Cooked vegetables 8?1* 10?4 6?0 8?1 6?8 8?3 8?9 9?0 7?1 6?2Falafelz 19?3* 16?1 20?5 20?1 13?8 20?4 21?1 18?2 22?3 16?8Chick peas 13?1 16?7 15?8 9?6** 9?8 12?9 15?4 12?8 13?8 9?3Salty snacks 50?3** 61?1 55?8 41?7*** 32?2 52?3 58?6*** 46?5 48?7 65?6**Sweets 42?3 55?2 45?5 34?1*** 26?9 41?9 54?1*** 39?3 44?9 50?9*Tea 81?2 73?4 78?4 86?7** 81?7 84?4 75?3* 82?3 80?1 76?1Regular soft drinks 39?6*** 54?8 41?9 30?6*** 28?1 37?7 50?0*** 36?1 43?3 46?0Diet soft drinks 16?6 22?9 16?3 13?8** 14?2 15?4 20?7 16?1 18?9 14?3Fresh juice 32?8 39?5 37?4 26?6** 20?2 30?4 44?9*** 29?0 36?9 36?7**Fruit nectar 27?2 41?2 24?2 22?1*** 21?0 25?2 33?9* 25?9 31?8 23?9Fried potatoes 20?5 25?2 19?1 19?1 22?1 23?1 15?0* 23?3 18?5 13?4**Corn flakes 4?9 9?2 6?4 1?8** 1?2 2?3 11?1*** 3?3 4?2 11?5***
*P , 0?05; ** P, 0?01; ***P , 0?001.-Household standard of living index (STL) based on the possession of sixteen household amenities; each item given a value of 1.-
-
Parents’ education based on mother’s and father’s education; three categories were constructed: ‘low’ if both parents had less than secondary education,‘medium’ if both parents had completed secondary education or if one had completed secondary education or had college or university degree and the otherhad less than secondary education, ‘high’ if both parents had college or university degree or if one had college or university degree and the other hadcompleted secondary education.yP value is for the difference between genders.JPartially homogenised milk.zFried broad beans.
Dietary habits of Palestinian adolescents 1423
Determinants of food intake
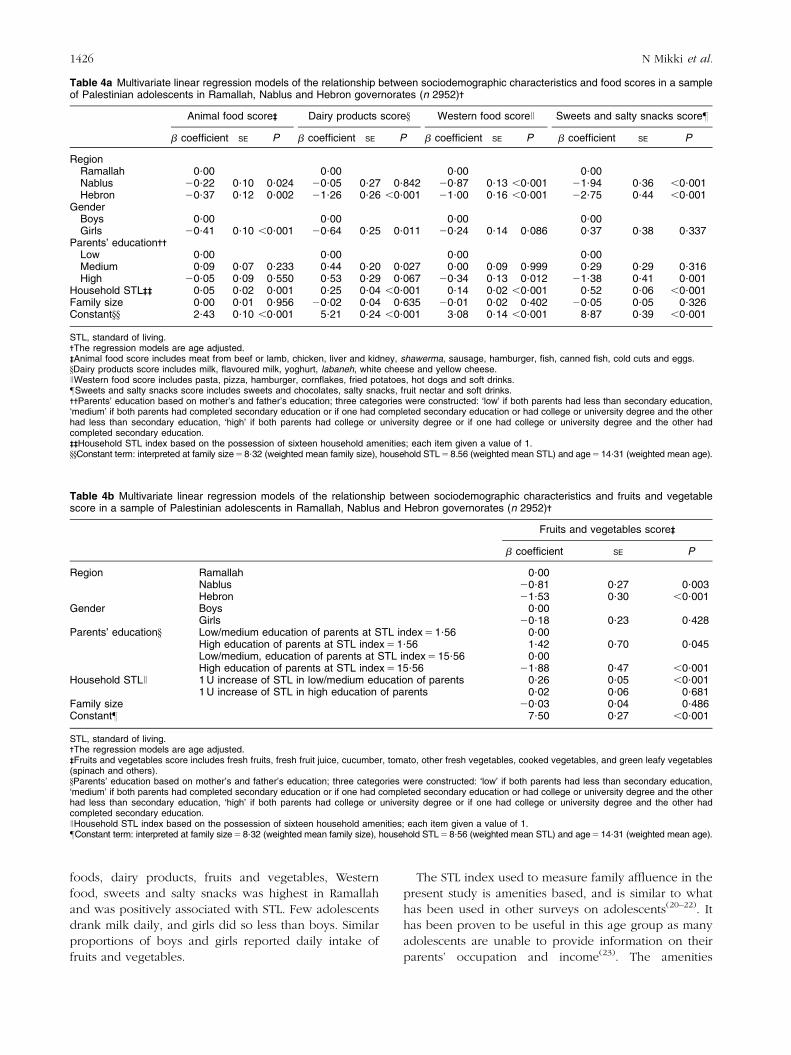
Table 4a shows the results of multivariate linear regres-
sion models of animal food score, dairy products score,
Western food score and sweets and salty snacks score
by different sociodemographic characteristics. Region and
STL were significant independent determinants in all
these scores. Gender (boys) was positively associated
with animal food score and dairy products score. Parents’
education was negatively associated with Western food
score and sweets and salty snacks score. In the fruit and
vegetable score model, we found significant interaction
between STL index and high parents’ education, and thus
this model is presented in a separate table (Table 4b).
High education of parents was positively associated with
fruit and vegetable score in the lowest STL spectrum,
but this was not the case in the highest STL level. Region
was a significant independent determinant in this score
as well.
The data met the assumptions for linear regression
models except for some detected heteroscedasticity. To
resolve this, the results were compared with robust
clustering models and no significant changes were
detected (except in the Western food score model where
gender (girls) was significant (P # 0?01) in the model with
robust clustering).
Discussion
The findings show that only one-quarter of the students
had three main meals daily and that breakfast skipping
was common among girls. Frequency intake of animal
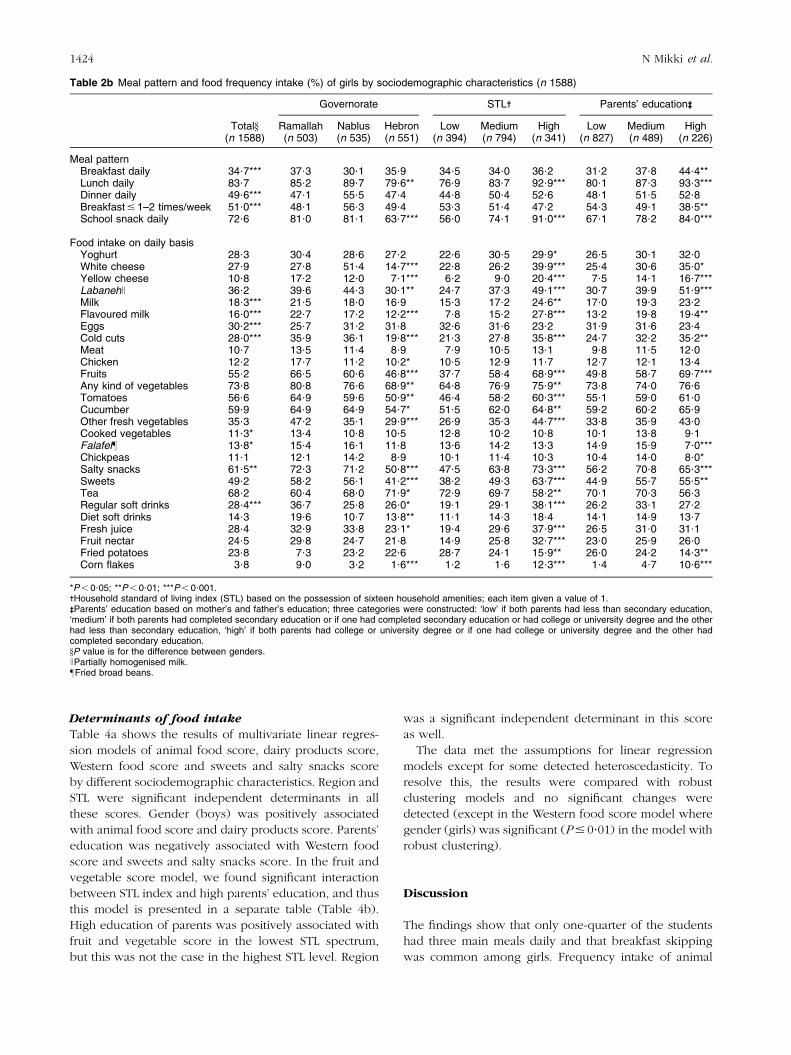
Table 2b Meal pattern and food frequency intake (%) of girls by sociodemographic characteristics (n 1588)
Governorate STL- Parents’ education-
-
Totaly Ramallah Nablus Hebron Low Medium High Low Medium High(n 1588) (n 503) (n 535) (n 551) (n 394) (n 794) (n 341) (n 827) (n 489) (n 226)
Meal patternBreakfast daily 34?7*** 37?3 30?1 35?9 34?5 34?0 36?2 31?2 37?8 44?4**Lunch daily 83?7 85?2 89?7 79?6** 76?9 83?7 92?9*** 80?1 87?3 93?3***Dinner daily 49?6*** 47?1 55?5 47?4 44?8 50?4 52?6 48?1 51?5 52?8Breakfast # 1–2 times/week 51?0*** 48?1 56?3 49?4 53?3 51?4 47?2 54?3 49?1 38?5**School snack daily 72?6 81?0 81?1 63?7*** 56?0 74?1 91?0*** 67?1 78?2 84?0***
Food intake on daily basisYoghurt 28?3 30?4 28?6 27?2 22?6 30?5 29?9* 26?5 30?1 32?0White cheese 27?9 27?8 51?4 14?7*** 22?8 26?2 39?9*** 25?4 30?6 35?0*Yellow cheese 10?8 17?2 12?0 7?1*** 6?2 9?0 20?4*** 7?5 14?1 16?7***LabanehJ 36?2 39?6 44?3 30?1** 24?7 37?3 49?1*** 30?7 39?9 51?9***Milk 18?3*** 21?5 18?0 16?9 15?3 17?2 24?6** 17?0 19?3 23?2Flavoured milk 16?0*** 22?7 17?2 12?2*** 7?8 15?2 27?8*** 13?2 19?8 19?4**Eggs 30?2*** 25?7 31?2 31?8 32?6 31?6 23?2 31?9 31?6 23?4Cold cuts 28?0*** 35?9 36?1 19?8*** 21?3 27?8 35?8*** 24?7 32?2 35?2**Meat 10?7 13?5 11?4 8?9 7?9 10?5 13?1 9?8 11?5 12?0Chicken 12?2 17?7 11?2 10?2* 10?5 12?9 11?7 12?7 12?1 13?4Fruits 55?2 66?5 60?6 46?8*** 37?7 58?4 68?9*** 49?8 58?7 69?7***Any kind of vegetables 73?8 80?8 76?6 68?9** 64?8 76?9 75?9** 73?8 74?0 76?6Tomatoes 56?6 64?9 59?6 50?9** 46?4 58?2 60?3*** 55?1 59?0 61?0Cucumber 59?9 64?9 64?9 54?7* 51?5 62?0 64?8** 59?2 60?2 65?9Other fresh vegetables 35?3 47?2 35?1 29?9*** 26?9 35?3 44?7*** 33?8 35?9 43?0Cooked vegetables 11?3* 13?4 10?8 10?5 12?8 10?2 10?8 10?1 13?8 9?1Falafelz 13?8* 15?4 16?1 11?8 13?6 14?2 13?3 14?9 15?9 7?0***Chickpeas 11?1 12?1 14?2 8?9 10?1 11?4 10?3 10?4 14?0 8?0*Salty snacks 61?5** 72?3 71?2 50?8*** 47?5 63?8 73?3*** 56?2 70?8 65?3***Sweets 49?2 58?2 56?1 41?2*** 38?2 49?3 63?7*** 44?9 55?7 55?5**Tea 68?2 60?4 68?0 71?9* 72?9 69?7 58?2** 70?1 70?3 56?3Regular soft drinks 28?4*** 36?7 25?8 26?0* 19?1 29?1 38?1*** 26?2 33?1 27?2Diet soft drinks 14?3 19?6 10?7 13?8** 11?1 14?3 18?4 14?1 14?9 13?7Fresh juice 28?4 32?9 33?8 23?1* 19?4 29?6 37?9*** 26?5 31?0 31?1Fruit nectar 24?5 29?8 24?7 21?8 14?9 25?8 32?7*** 23?0 25?9 26?0Fried potatoes 23?8 7?3 23?2 22?6 28?7 24?1 15?9** 26?0 24?2 14?3**Corn flakes 3?8 9?0 3?2 1?6*** 1?2 1?6 12?3*** 1?4 4?7 10?6***
*P , 0?05; **P , 0?01; ***P , 0?001.-Household standard of living index (STL) based on the possession of sixteen household amenities; each item given a value of 1.-
-
Parents’ education based on mother’s and father’s education; three categories were constructed: ‘low’ if both parents had less than secondary education,‘medium’ if both parents had completed secondary education or if one had completed secondary education or had college or university degree and the otherhad less than secondary education, ‘high’ if both parents had college or university degree or if one had college or university degree and the other hadcompleted secondary education.yP value is for the difference between genders.JPartially homogenised milk.zFried broad beans.
1424 N Mikki et al.
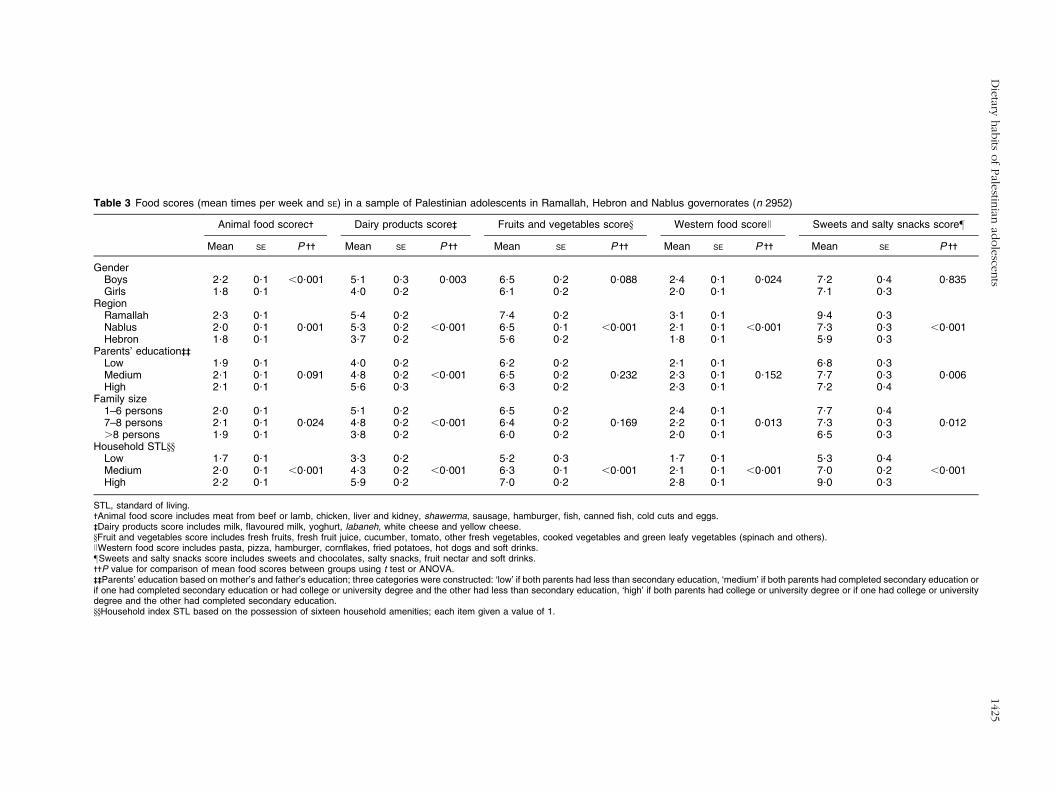
Table 3 Food scores (mean times per week and SE) in a sample of Palestinian adolescents in Ramallah, Hebron and Nablus governorates (n 2952)
Animal food scorec- Dairy products score-
-
Fruits and vegetables scorey Western food scoreJ Sweets and salty snacks scorez
Mean SE P -- Mean SE P -- Mean SE P -- Mean SE P -- Mean SE P --
GenderBoys 2?2 0?1 ,0?001 5?1 0?3 0?003 6?5 0?2 0?088 2?4 0?1 0?024 7?2 0?4 0?835Girls 1?8 0?1 4?0 0?2 6?1 0?2 2?0 0?1 7?1 0?3
RegionRamallah 2?3 0?1 5?4 0?2 7?4 0?2 3?1 0?1 9?4 0?3Nablus 2?0 0?1 0?001 5?3 0?2 ,0?001 6?5 0?1 ,0?001 2?1 0?1 ,0?001 7?3 0?3 ,0?001Hebron 1?8 0?1 3?7 0?2 5?6 0?2 1?8 0?1 5?9 0?3
Parents’ education-
-
-
-
Low 1?9 0?1 4?0 0?2 6?2 0?2 2?1 0?1 6?8 0?3Medium 2?1 0?1 0?091 4?8 0?2 ,0?001 6?5 0?2 0?232 2?3 0?1 0?152 7?7 0?3 0?006High 2?1 0?1 5?6 0?3 6?3 0?2 2?3 0?1 7?2 0?4
Family size1–6 persons 2?0 0?1 5?1 0?2 6?5 0?2 2?4 0?1 7?7 0?47–8 persons 2?1 0?1 0?024 4?8 0?2 ,0?001 6?4 0?2 0?169 2?2 0?1 0?013 7?3 0?3 0?012.8 persons 1?9 0?1 3?8 0?2 6?0 0?2 2?0 0?1 6?5 0?3
Household STLyyLow 1?7 0?1 3?3 0?2 5?2 0?3 1?7 0?1 5?3 0?4Medium 2?0 0?1 ,0?001 4?3 0?2 ,0?001 6?3 0?1 ,0?001 2?1 0?1 ,0?001 7?0 0?2 ,0?001High 2?2 0?1 5?9 0?2 7?0 0?2 2?8 0?1 9?0 0?3
STL, standard of living.-Animal food score includes meat from beef or lamb, chicken, liver and kidney, shawerma, sausage, hamburger, fish, canned fish, cold cuts and eggs.-
-
Dairy products score includes milk, flavoured milk, yoghurt, labaneh, white cheese and yellow cheese.yFruit and vegetables score includes fresh fruits, fresh fruit juice, cucumber, tomato, other fresh vegetables, cooked vegetables and green leafy vegetables (spinach and others).JWestern food score includes pasta, pizza, hamburger, cornflakes, fried potatoes, hot dogs and soft drinks.zSweets and salty snacks score includes sweets and chocolates, salty snacks, fruit nectar and soft drinks.--P value for comparison of mean food scores between groups using t test or ANOVA.-
-
-
-
Parents’ education based on mother’s and father’s education; three categories were constructed: ‘low’ if both parents had less than secondary education, ‘medium’ if both parents had completed secondary education orif one had completed secondary education or had college or university degree and the other had less than secondary education, ‘high’ if both parents had college or university degree or if one had college or universitydegree and the other had completed secondary education.yyHousehold index STL based on the possession of sixteen household amenities; each item given a value of 1.
Die
taryhab
itsofPale
stinian
adole
scents
1425
foods, dairy products, fruits and vegetables, Western
food, sweets and salty snacks was highest in Ramallah
and was positively associated with STL. Few adolescents
drank milk daily, and girls did so less than boys. Similar
proportions of boys and girls reported daily intake of
fruits and vegetables.
The STL index used to measure family affluence in the
present study is amenities based, and is similar to what
has been used in other surveys on adolescents(20–22). It
has been proven to be useful in this age group as many
adolescents are unable to provide information on their
parents’ occupation and income(23). The amenities
Table 4a Multivariate linear regression models of the relationship between sociodemographic characteristics and food scores in a sampleof Palestinian adolescents in Ramallah, Nablus and Hebron governorates (n 2952)-
Animal food score-
-
Dairy products scorey Western food scoreJ Sweets and salty snacks scorez
b coefficient SE P b coefficient SE P b coefficient SE P b coefficient SE P
RegionRamallah 0?00 0?00 0?00 0?00Nablus 20?22 0?10 0?024 20?05 0?27 0?842 20?87 0?13 ,0?001 21?94 0?36 ,0?001Hebron 20?37 0?12 0?002 21?26 0?26 ,0?001 21?00 0?16 ,0?001 22?75 0?44 ,0?001
GenderBoys 0?00 0?00 0?00 0?00Girls 20?41 0?10 ,0?001 20?64 0?25 0?011 20?24 0?14 0?086 0?37 0?38 0?337
Parents’ education--Low 0?00 0?00 0?00 0?00Medium 0?09 0?07 0?233 0?44 0?20 0?027 0?00 0?09 0?999 0?29 0?29 0?316High 20?05 0?09 0?550 0?53 0?29 0?067 20?34 0?13 0?012 21?38 0?41 0?001
Household STL-
-
-
-
0?05 0?02 0?001 0?25 0?04 ,0?001 0?14 0?02 ,0?001 0?52 0?06 ,0?001Family size 0?00 0?01 0?956 20?02 0?04 0?635 20?01 0?02 0?402 20?05 0?05 0?326Constantyy 2?43 0?10 ,0?001 5?21 0?24 ,0?001 3?08 0?14 ,0?001 8?87 0?39 ,0?001
STL, standard of living.-The regression models are age adjusted.-
-
Animal food score includes meat from beef or lamb, chicken, liver and kidney, shawerma, sausage, hamburger, fish, canned fish, cold cuts and eggs.yDairy products score includes milk, flavoured milk, yoghurt, labaneh, white cheese and yellow cheese.JWestern food score includes pasta, pizza, hamburger, cornflakes, fried potatoes, hot dogs and soft drinks.zSweets and salty snacks score includes sweets and chocolates, salty snacks, fruit nectar and soft drinks.--Parents’ education based on mother’s and father’s education; three categories were constructed: ‘low’ if both parents had less than secondary education,‘medium’ if both parents had completed secondary education or if one had completed secondary education or had college or university degree and the otherhad less than secondary education, ‘high’ if both parents had college or university degree or if one had college or university degree and the other hadcompleted secondary education.-
-
-
-
Household STL index based on the possession of sixteen household amenities; each item given a value of 1.yyConstant term: interpreted at family size 5 8?32 (weighted mean family size), household STL 5 8.56 (weighted mean STL) and age5 14?31 (weighted mean age).
Table 4b Multivariate linear regression models of the relationship between sociodemographic characteristics and fruits and vegetablescore in a sample of Palestinian adolescents in Ramallah, Nablus and Hebron governorates (n 2952)-
Fruits and vegetables score--
b coefficient SE P
Region Ramallah 0?00Nablus 20?81 0?27 0?003Hebron 21?53 0?30 ,0?001
Gender Boys 0?00Girls 20?18 0?23 0?428
Parents’ educationy Low/medium education of parents at STL index 5 1?56 0?00High education of parents at STL index 5 1?56 1?42 0?70 0?045Low/medium, education of parents at STL index 5 15?56 0?00High education of parents at STL index 5 15?56 21?88 0?47 ,0?001
Household STLJ 1 U increase of STL in low/medium education of parents 0?26 0?05 ,0?0011 U increase of STL in high education of parents 0?02 0?06 0?681
Family size 20?03 0?04 0?486Constantz 7?50 0?27 ,0?001
STL, standard of living.-The regression models are age adjusted.-
-
Fruits and vegetables score includes fresh fruits, fresh fruit juice, cucumber, tomato, other fresh vegetables, cooked vegetables, and green leafy vegetables(spinach and others).yParents’ education based on mother’s and father’s education; three categories were constructed: ‘low’ if both parents had less than secondary education,‘medium’ if both parents had completed secondary education or if one had completed secondary education or had college or university degree and the otherhad less than secondary education, ‘high’ if both parents had college or university degree or if one had college or university degree and the other hadcompleted secondary education.JHousehold STL index based on the possession of sixteen household amenities; each item given a value of 1.zConstant term: interpreted at family size 5 8?32 (weighted mean family size), household STL 5 8?56 (weighted mean STL) and age5 14?31 (weighted mean age).
1426 N Mikki et al.
included are culture specific for Palestinians and have
been used (except for microwave oven) by PCBS for
assessment of material STL(24). The weak correlation with
parents’ education indicates that these variables measure
different aspects of family socio-economic status.
Irregular meal patterns have been associated with poor
nutrient intake(5). Skipping breakfast is a worldwide
problem among adolescents and is usually higher among
girls(25,26). This was also common in the present study,
especially among girls, as approximately half of the girls
reported having breakfast one to two times or less per
week. Omitting breakfast among adolescents has been
related to lower consumption of the other main
meals(5,27), which was also the case in the present study.
Lunch was the main meal consumed among the ado-
lescents. This is in accordance with the general food
habits among Palestinians. The lunch meal often includes
chicken or red meat, rice or potatoes and vegetables.
Bread is usually consumed with every meal(13).
Significant differences in food habits were found
between boys and girls. More boys consumed animal
foods, milk and soft drinks daily, while more girls con-
sumed salty snacks and sweets. This is similar to findings
from the Palestinian HBSC survey in 2004(16). However,
the proportion of adolescents reporting daily consump-
tion of fruits and vegetables was higher than what was
reported in the Palestinian HBSC survey(16) and in the
HBSC survey of 2005–2006(3). This could be due to the
fact that HBSC survey used one general question about
the intake of vegetables, while in the present study sev-
eral questions about different types of vegetables were
included. Among these were questions about tomatoes
and cucumber, which are frequently consumed by
Palestinians as part of a salad or with bread at breakfast
and dinner. Another difference found was that equal
proportions of boys and girls reported consuming fruits
and vegetables daily, while other studies have shown that
in general girls are more likely than boys to eat fruits(3,28)
and vegetables daily(3,9,28).
The mean frequency consumption of fruits and vege-
tables in the present study was 6?5 and 6?1 times per
week for boys and girls, respectively. This means that the
majority of the adolescents did not achieve the dietary
recommendation of the WHO of five servings of fruits and
vegetables per day(29). This could imply an insufficient
intake of essential micronutrients and fibre that would
protect against chronic disease later in life(29). Despite the
deteriorating financial situation of Palestinian families(30),
some vegetables and fruits are available in the local
market at low prices. Thus, launching a campaign to
encourage the community to consume more fruits and
vegetable could be effective.
Milk and dairy products were not consumed on a daily
basis by most of the adolescents. Children and adoles-
cents are recommended to consume calcium-rich foods to
develop adequate bone mass(31). Adolescents with low
STL and those from large families had lower animal food
scores. Zinc and iron, which are available in animal foods,
are both essential for growth, neural development and
immune system function(32,33). Fish frequency consumption
was very low among adolescents, and this was comparable
to findings from another study among Palestinian adults(13).
Fish is an important source of high-quality protein, minerals
and n-3 fatty acids essential for growth and development
and for protection against chronic diseases(29). Low con-
sumption of milk, animal food and fish should be seen in
relation to micronutrient deficiencies. Iron deficiency
anaemia, iodine deficiency and vitamin A and D defi-
ciencies have been reported as public health problems
among Palestinians(14). Insufficient intake of food rich in
protein and micronutrients has also been associated with
unfavourable school performance(34).
Regional differences in food consumption patterns
were found: residents of Ramallah consumed animal
foods, dairy products, fruits and vegetables, Western
foods, sweets and salty snacks more often. These differ-
ences remained significant in the regression model after
adjusting for other variables including STL. The persistence
of these differences may be due to a more Westernised
lifestyle in Ramallah compared to the other governor-
ates(17). Moreover, food security analysis in 2006 showed
that 32?1% of the population in Ramallah was either food
insecure or marginally food insecure v. 48?6% in Nablus
and 46?7% in Hebron, probably due to the closure
regimes(14). Regional differences in overweight/obesity and
stunting among the same adolescents have also been
reported previously. The overweight/obesity prevalence
was higher among adolescents from Ramallah, while the
prevalence of stunting was higher among adolescents from
Hebron(12). The association between food patterns and
nutritional status of adolescents in these regions needs to
be investigated further.
High parents’ education is associated with healthy eat-
ing(35). Similar findings were obtained in the present study,
as parents’ education was negatively associated with Wes-
tern food score, sweet and salty snacks score. Similarly,
parents’ education has been found to be positively asso-
ciated with fruit and vegetable intake(36,37). In the present
study, high education of parents in the low-STL category
was associated with high fruit and vegetable score.
Several studies have shown that family socio-economic
status influence the food habits of adolescents(3,38,39). The
multivariate analysis of food scores revealed that house-
hold STL was a significant independent determinant of all
the scores; adolescents with high STL reported higher
frequency consumption of animal foods, Western food
and salty snacks and sweets, thus indicating less healthy
food choices. Such findings have been obtained in
countries in nutrition transition, such as China(38). In
contrast, low family affluence in Western and Northern
Europe has been found to be positively associated with
soft drinks consumption(3). A study on food consumption
Dietary habits of Palestinian adolescents 1427
patterns among Palestinian adults showed that the con-
sumption of animal food products was highest among the
wealthiest households(13). It is thus reasonable to assume
that Palestine is in a stage of nutrition transition similar to
low-income economies where the intake of a diet high in
fat and sugar is more common among the more affluent
sections of the society(40).
Limitations and strengths
The study has certain limitations, such as its cross-sectional
design, which limits the ability to establish causality.
Another limitation is using self-reported responses, which
might affect validity and reliability. The food frequency
list was not validated, but the food items were based on
24 h dietary recalls with adolescents in the same age
group and study area and thorough knowledge of food
habits in the WB. The association between food fre-
quencies and STL index yielded expected results. The
1-week test–retest reliability of the different food scores
and the household amenities in the STL index was good.
Strengths of the study included its relatively large sample
size, the single-stage cluster sampling design, the urban/
rural distribution and the high response rates.
Conclusion
Irregular meal patterns were common among adoles-
cents, especially girls. Residence in Ramallah and high
STL index were positively associated with intake of high-
sugar and high-fat foods. Consumption of foods rich in
micronutrients such as fruits, vegetables and dairy pro-
ducts was low among adolescents, especially those with
low STL. Research using improved methods for assessing
food intake is needed to support these conclusions.
Effective and context-appropriate nutrition interventions
are needed that promote healthy eating habits in schools
and communities. Such interventions should take into
consideration socio-economic and other constraints that
make access to such foods very difficult.
Acknowledgements
The present study is a collaboration between Birzeit
University and the University of Oslo supported by a
grant from the Norwegian Programme for Development,
Research and Education (NUFU) PRO X1 50/2002. The
authors declare no conflict of intererst. N.M., H.F.A. and
G.H.O. contributed to the conception, design, analysis
and interpretation of data, and drafting of the manuscript,
and approved the final version for publication. N.M.
contributed to data collection. Z.S. contributed to analysis
and interpretation of the data, commented on the
manuscript and approved the final version for publica-
tion. The authors thank the participating schools, the
Palestinian Ministry of Education and Higher Education
and the UNRWA Office of Education for facilitating
fieldwork. They are grateful to Alpha International for
Research, Polling and Informatics for conducting field-
work and for statistical support.
References
1. Lytle LA & Kubik MY (2003) Nutritional issues foradolescents. Best Pract Res Clin Endocrinol Metab 17,177–189.
2. Lien N, Lytle LA & Klepp KI (2001) Stability in consumptionof fruit, vegetables, and sugary foods in a cohort from age14 to age 21. Prev Med 33, 217–226.
3. World Health Organization (2008) Inequalities in youngpeople’s health. Health Behavior in school-aged childreninternational report from the 2005/2006 survey. http://www.euro.who.int/eprise/main/WHO/InformationSources/Publications/Catalogue/20080617_1 (accessed October2008).
4. Rampersaud GC, Pereira MA, Girard BL et al. (2005) Breakfasthabits, nutritional status, body weight, and academicperformance in children and adolescents. J Am Diet Assoc105, 743–760.
5. Sjoberg A, Hallberg L, Hoglund D et al. (2003) Mealpattern, food choice, nutrient intake and lifestyle factors inThe Goteborg Adolescence Study. Eur J Clin Nutr 57,1569–1578.
6. Chatzi L, Apostolaki G, Bibakis I et al. (2007) Protectiveeffect of fruits, vegetables and the Mediterranean diet onasthma and allergies among children in Crete. Thorax 62,677–683.
7. Antova T, Pattenden S, Nikiforov B et al. (2003) Nutritionand respiratory health in children in six Central and EasternEuropean countries. Thorax 58, 231–236.
8. Maynard M, Gunnell D, Emmett P et al. (2003) Fruit,vegetables, and antioxidants in childhood and risk of adultcancer: the Boyd Orr cohort. J Epidemiol Commun Health57, 218–225.
9. Rasmussen M, Krolner R, Klepp KI et al. (2006) Determi-nants of fruit and vegetable consumption among childrenand adolescents: a review of the literature. Part I:quantitative studies. Int J Behav Nutr Phys Act 3, 22.
10. Xie B, Gilliland FD, Li YF et al. (2003) Effects of ethnicity,family income, and education on dietary intake amongadolescents. Prev Med 36, 30–40.
11. Rionda ZL & Clements A (2000) The Burden of Disease inthe West Bank and Gaza: An Assessment Report. Ramallah:The United States Agency for International Development inthe West Bank and Gaza.
12. Husseini A, Abu-Rmeileh NM, Mikki N et al. (2009)Cardiovascular diseases, diabetes mellitus, and cancer inthe occupied Palestinian territory. Lancet 373, 1041–1049.
13. Stene L, Giacaman R, Abdul-Rahim H et al. (1999) Foodconsumption patterns in a Palestinian West Bank popula-tion. Eur J Clin Nutr 53, 953–958.
14. Food and Agriculture Organization/World Food Pro-gramme (2007) Comprehensive food security and vulner-ability analysis (CFSVA). http://documents.wfp.org/stellent/groups/public/documents/ena/wfp103646.pdf (accessedOctober 2009). .
15. Palestinian Central Bureau of Statistics (2008) Population,Housing and Establishment Census 2007. Final Results inthe West Bank – Summary (Population and Housing).Ramallah: PCBS.
16. Al Sabbah H, Vereecken C, Kolsteren P et al. (2007) Foodhabits and physical activity patterns among Palestinianadolescents: findings from the national study of Palestinian
1428 N Mikki et al.
schoolchildren (HBSC-WBG2004). Public Health Nutr 10,739–746.
17. Taraki L & Giacaman R (2006) Modernity aborted andreborn. Ways of being urban in Palestine. In LivingPalestine, Family Survival, Resistance and Mobility UnderOccupation, 1st ed., pp. 1–50 [L Taraki, editor]. New York:Syracuse University Press.
18. Mikki N, Abdul-Rahim HF, Awartani F et al. (2009)Prevalence and sociodemographic correlates of stunting,underweight, and overweight among Palestinian schooladolescents (13–15 years) in two major governorates in theWest Bank. BMC Public Health 9, 485.
19. Palestinian Central Bureau of Statistics (2003) Dissemina-tion and Analysis of Census Findings. Analytical ReportSeries (04). Characteristics of Urban and Rural Areas in thePalestinian Territory. Ramallah: PCBS.
20. Currie C, Samdal O, Boyce W et al. (2001) HealthBehaviour in School Aged Children: A World HealthOrganization Cross-National Study. Research Protocol forthe 2001/02 Survey. Edinburgh: Child and AdolescentHealth Unit, University of Edinburgh.
21. Shi Z, Lien N, Kumar BN et al. (2005) The sociodemographiccorrelates of nutritional status of school adolescents in JiangsuProvince, China. J Adolesc Health 37, 313–322.
22. Abudayya A, Thoresen M, Abed Y et al. (2007) Overweight,stunting and anemia are public health problems amonglow socioeconomic groups in school adolescents (12–15y)in the North Gaza Strip. Nutr Res 27, 762–771.
23. Currie CE, Elton RA, Todd J et al. (1997) Indicators ofsocioeconomic status for adolescents: the WHO HealthBehaviour in School-aged Children Survey. Health EducRes 12, 385–397.
24. Palestinian Central Bureau of Statistics (2005) Levels ofLiving in the Palestinian Territory. The Final Report(January 2004–January 2005). Ramallah: PCBS.
25. Keski-Rahkonen A, Kaprio J, Rissanen A et al. (2003)Breakfast skipping and health-compromising behaviors inadolescents and adults. Eur J Clin Nutr 57, 842–853.
26. Shaw ME (1998) Adolescent breakfast skipping: anAustralian study. Adolescence 33, 851–861.
27. Cavadini C, Decarli B, Grin J et al. (2000) Food habits andsport activity during adolescence: differences betweenathletic and non-athletic teenagers in Switzerland. Eur JClin Nutr 54, Suppl.1, S16–S20.
28. Vereecken CA, Inchley J, Subramanian SV et al. (2005) Therelative influence of individual and contextual socio-eco-nomic status on consumption of fruit and soft drinks amongadolescents in Europe. Eur J Public Health 15, 224–232.
29. World Health Organization (2003) Diet, Nutrition andthe Prevention of Chronic Diseases. Joint WHO/FAO ExpertConsultation. WHO Technical Report Series no. 916.Geneva: WHO.
30. The World Bank (2008) Implementing the Palestinianreform and development agenda. Economic monitoringreport to the Ad Hoc Liaison committee. http://www.worldbank.org/ps (accessed April 2009).
31. Baker SS, Cochran WJ, Flores CA et al. (1999) AmericanAcademy of Pediatrics. Committee on Nutrition. Calciumrequirements of infants, children, and adolescents. Pedia-trics 104, 1152–1157.
32. World Health Organization (2001) Iron Deficiency Anae-mia: Assessment, Prevention and Control. A Guide forProgramme Managers. WHO/NHD/01.3. Geneva: WHO.
33. Prasad AS (2003) Zinc deficiency. BMJ 326, 409–410.34. Fu ML, Cheng L, Tu SH et al. (2007) Association between
unhealthful eating patterns and unfavorable overall schoolperformance in children. J Am Diet Assoc 107, 1935–1943.
35. Patrick H & Nicklas TA (2005) A review of family and socialdeterminants of children’s eating patterns and diet quality.J Am Coll Nutr 24, 83–92.
36. Pearson N, Biddle SJ & Gorely T (2009) Family correlates offruit and vegetable consumption in children and adoles-cents: a systematic review. Public Health Nutr 12, 267–283.
37. Riediger ND, Shooshtari S & Moghadasian MH (2007) Theinfluence of sociodemographic factors on patterns of fruitand vegetable consumption in Canadian adolescents. J AmDiet Assoc 107, 1511–1518.
38. Shi Z, Lien N, Kumar BN et al. (2005) Socio-demographicdifferences in food habits and preferences of schooladolescents in Jiangsu Province, China. Eur J Clin Nutr59, 1439–1448.
39. Vereecken CA, De Henauw S & Maes L (2005) Adolescents’food habits: results of the Health Behaviour in School-agedChildren survey. Br J Nutr 94, 423–431.
40. Thang NM & Popkin BM (2004) Patterns of foodconsumption in Vietnam: effects on socioeconomic groupsduring an era of economic growth. Eur J Clin Nutr 58,145–153.
Dietary habits of Palestinian adolescents 1429


