Embed Size (px)
Citation preview
DEVELOPMENT OF SMALL SCALE PARBOILING CUM
DRYING UNIT FOR PADDY PROCESSING
By
ANN ANNIE SHAJU
(2018-18-022)
DEPARTMENT OF PROCESSING AND FOOD ENGINEERING
KELAPPAJI COLLEGE OF AGRICULTURAL ENGINEERING AND
TECHNOLOGY
TAVANUR - 679573, MALAPPURAM
KERALA, INDIA
2020
DEVELOPMENT OF SMALL SCALE PARBOILING CUM
DRYING UNIT FOR PADDY PROCESSING
by
ANN ANNIE SHAJU
(2018-18-022)
THESIS
Submitted in partial fulfilment of the requirement for the degree of
MASTER OF TECHNOLOGY
IN
AGRICULTURAL ENGINEERING
(Agricultural Processing and Food Engineering)
Faculty of Agricultural Engineering & Technology
Kerala Agricultural University
DEPARTMENT OF PROCESSING AND FOOD ENGINEERING
KELAPPAJI COLLEGE OF AGRICULTURAL ENGINEERING AND
TECHNOLOGY
TAVANUR - 679573, MALAPPURAM
KERALA, INDIA
2020
DECLARATION
I hereby declare that this thesis entitled “Development of small scale parboiling
cum drying unit for paddy processing” is a bonafide record of research work
done by me during the course of research and the thesis has not previously formed
the basis for the award of any degree, diploma, associateship, fellowship or other
similar title of any other University or Society.
Tavanur ANN ANNIE SHAJU
Date: (2018-18-022)
CERTIFICATE
Certified that this thesis entitled “Development of small scale parboiling cum
drying unit for paddy processing” is a bonafide record of research work done
independently by Ms. Ann Annie Shaju under my guidance and supervision and
that it has not previously formed the basis for the award of any degree, fellowship
or associateship to her.
Tavanur Dr. Sudheer K. P.
Date:
Dr. Sudheer K. P.
(Major Advisor, Advisory committee)
Professor & Head
Dept. of Agricultural Engineering
College of Agriculture, Vellanikkara
EXTERNAL EXAMINER
Dr. Sinija V. R .
Professor & Head
Food Processing
Business Incubation
Centre, IIFPT, Pudukkottai Road,
Thanjavur-613005
Dr. Regina Ahmed
(Member)
Senior Scientist & Head
Centre of Excellence in Rice Value
Addition, IRRI South Asia Regional
Centre (ISARC), Industrial Estate P O
Varanasi-221106
CERTIFICATE
We, the undersigned members of the advisory committee of Ms. Ann
Annie Shaju (2018-18-022) a candidate for the degree of Master of Technology in
Agricultural Engineering majoring in Agricultural Processing and Food
Engineering agree that the thesis entitled “Development of small scale parboiling
cum drying unit for paddy processing” may be submitted by Ms. Ann Annie
Shaju (2018-18-022) in partial fulfilment of the requirement for the degree.
Dr. Rose Mary Francies
(Member)
Professor & Head
Dept. of Seed Science and
Technology
College of Agriculture,
Vellanikkara
Dr. Sudheer K. P.
(Major Advisor)
Professor & Head
Dept. of Agricultural Engineering
College of Agriculture,
Vellanikkara
Dr. Rajesh G. K.
(Member)
Assistant Professor
Dept. of Processing & Food
Engineering,
KCAET, Tavanur.
Dr. Prince M. V.
(Member)
Professor & Head
Dept. of Processing & Food
Engineering,
KCAET, Tavanur.
ACKNOWLEDGEMENT
It is a matter of pleasure to glance back and recall the path one traverse
during the days of hard work and pre-perseverance. Every effort in this world
comes to its fruitful culmination not because of sincere work of one but only due to
the combined support and endeavour of many. I would consider this work nothing
more than incomplete without attending to the task of acknowledging the
overwhelming help I received during this endeavour of mine.
I would like to give my first thanks to almighty God and my Parents as
without their mercy, accomplishment of my work and preparation of this
manuscript would have not been possible.
I express my deep and sincere regards, deepest sense of gratitude and
heartful thanks to the Chairman of my Advisory Committee, Dr. Sudheer K. P.,
Professor and Head, Department of Agricultural Engineering, College of
Horticulture, Vellanikkara, Thrissur. His meticulous guidance, benevolent
criticisms, generous assistance at every stage of my research work is beyond
measure, in fact it was his ideas, smooth dealing with the thing which motivated me
to work under his guidance and any credit goes to him. It is my proud privilege to
express my heartfelt indebtedness and deepest sense of gratitude for laying out the
guidelines of research work. I have real admiration and regards to his full hearted
support and untiring help.
This would be the right moment to thank Dr. Sathiyan K. K., Dean, KCAET,
Tavanur for his support during the course of the project work.
I take this opportunity to express sincere thanks to my advisory committee
members Dr. Prince M. V., Professor and Head, Department of Processing and
Food Engineering, K.C.A.E.T, Tavanur, Dr. Rajesh G. K., Assistant Professor,
Department of Processing and Food Engineering, K.C.A.E.T, Tavanur, Dr. Rose
Mary Francies, Professor and Head, Department of Seed Science and Technology,
College of Horticulture, Vellanikkara, Thrissur and Dr. Regina Ahmed, Senior
Scientist and Head, Centre of Excellence in Rice Value Addition, IRRI South Asia
Regional Centre (ISARC), Varanasi as a members of advisory committee. I am
indebted to them for their valuable suggestions during the investigation, sensible
criticism in animating and ameliorating the manuscript and valuable counsel
during the period of study and I owe them a lot for this small venture of mine.
I shall never forget the enormous and timely help rendered by Dr. Sankalpa,
K. B., Dr. Vithu Prabha, Er. Saranya S and Er. Sreelakshmi K Unni for their kind
help and support during the course of study.
I express my profound sense of gratitude to Dr. Shahanas E., Er.
Thouseena T N, Er. Albin K Joseph, Er. Ashwin Shivanandan, Er. Sooraj M. R.
Mr. Sreekesh, Mr. Jithin, Mr. Suhail, Mr. Arun staff members of Department of
Agricultural Engineering, College of Horticulture for their immense help.
I use this opportunity to sincerely thank my dearest classmates Meera
T.,Geethu M., Megha A.S Anjaly M. G., Fathima K. S. Dilsha Suresh, and P.
Babu for their suggestion and invaluable help during my study.
It is ethereal pleasure to express heartful reverence to Department of Seed
Science and Technology, College of Horticulture Vellanikkara for providing paddy
to conduct my research work.
Selfless love is the dearest commodity on this planet and only a few in this
world are kind enough to extent their helping hands. I am expressing my sincere
thanks just for love and affection shown to me by my dear ones Ashly Zacharia and
Arun Shaji for the everlasting source of inspiration and love.
I express my thanks to all the faculty members of library, K.C.A.E.T,
Tavanur for their ever willing help and cooperation. I express my sincere thanks
and gratitude to Kelappaji College of Agricultural Engineering & Technology for
giving me an opportunity to undergo my P.G studies and Kerala Agricultural
University for proffered me a chance to study in this institution.
Above all, my success would have remained an illusion without the
ambitious encouragement, unquantifiable love, continued calm endurance,
constant support and affection showered on me throughout the educational
endeavour from my beloved parents Sri. Shaju Thomas and Late Smt. Lucy Shaju.
Their blessings and love are the source of my spirit every moment. I have been
highly fortunate and lucky to express my heartfelt thanks to dearest my grandma
Smt. Annakutty Thomas and my relatives for their kind blessings and well wishes
showed on me.
One last word; since it is practically impossible to list all the names who
have contributed to my work, it seems proper to issue a blanket of thanks for those
who helped me directly or indirectly during the course of study.
……… any omission in this small manuscript does not mean lack of gratitude
Ann Annie Shaju
.
Dedicated to my Parents
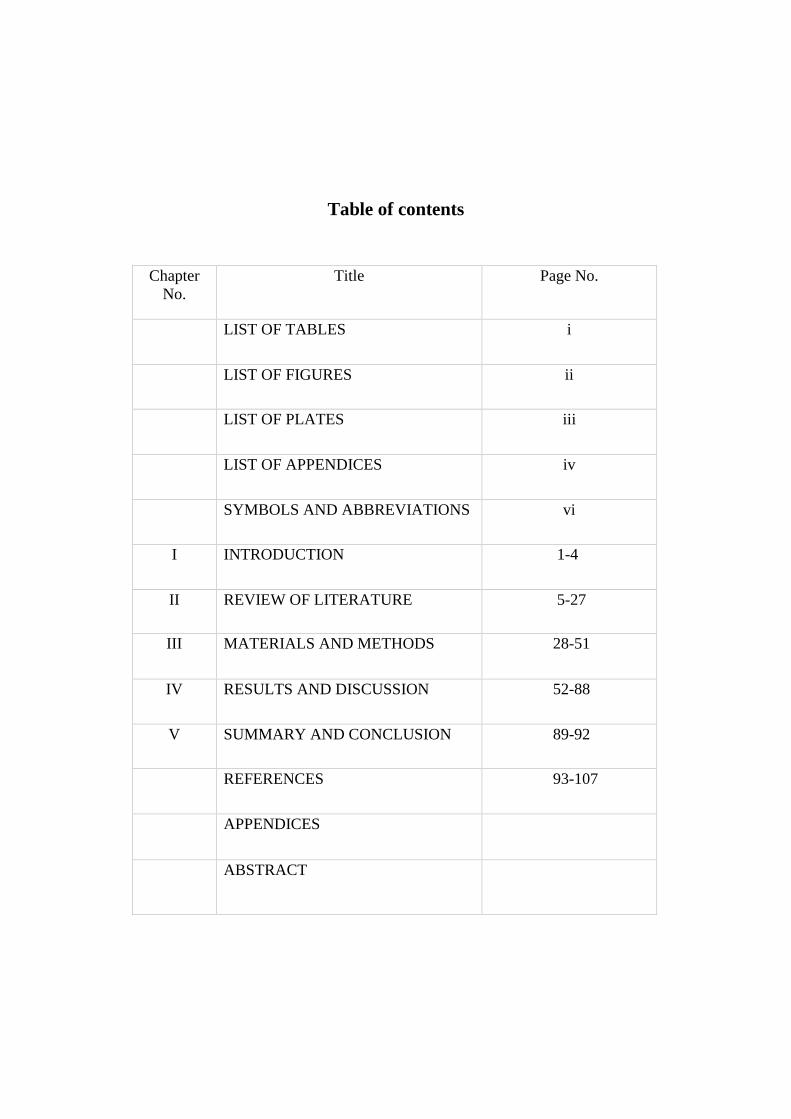
Table of contents
Chapter
No.
Title Page No.
LIST OF TABLES i
LIST OF FIGURES ii
LIST OF PLATES iii
LIST OF APPENDICES iv
SYMBOLS AND ABBREVIATIONS vi
I INTRODUCTION 1-4
II REVIEW OF LITERATURE 5-27
III MATERIALS AND METHODS 28-51
IV RESULTS AND DISCUSSION 52-88
V SUMMARY AND CONCLUSION 89-92
REFERENCES 93-107
APPENDICES
ABSTRACT
i
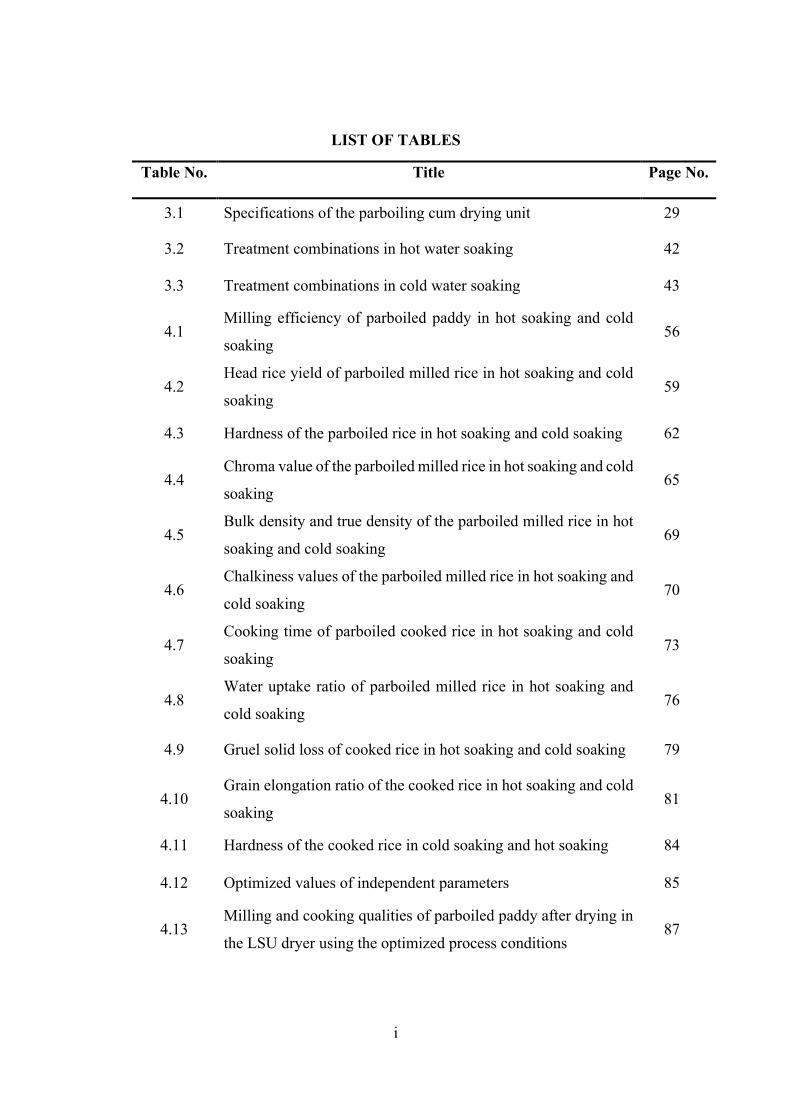
LIST OF TABLES
Table No. Title Page No.
3.1 Specifications of the parboiling cum drying unit 29
3.2 Treatment combinations in hot water soaking 42
3.3 Treatment combinations in cold water soaking 43
4.1 Milling efficiency of parboiled paddy in hot soaking and cold
soaking 56
4.2 Head rice yield of parboiled milled rice in hot soaking and cold
soaking 59
4.3 Hardness of the parboiled rice in hot soaking and cold soaking 62
4.4 Chroma value of the parboiled milled rice in hot soaking and cold
soaking 65
4.5 Bulk density and true density of the parboiled milled rice in hot
soaking and cold soaking 69
4.6 Chalkiness values of the parboiled milled rice in hot soaking and
cold soaking 70
4.7 Cooking time of parboiled cooked rice in hot soaking and cold
soaking 73
4.8 Water uptake ratio of parboiled milled rice in hot soaking and
cold soaking 76
4.9 Gruel solid loss of cooked rice in hot soaking and cold soaking 79
4.10 Grain elongation ratio of the cooked rice in hot soaking and cold
soaking 81
4.11 Hardness of the cooked rice in cold soaking and hot soaking 84
4.12 Optimized values of independent parameters 85
4.13 Milling and cooking qualities of parboiled paddy after drying in
the LSU dryer using the optimized process conditions 87
ii
LIST OF FIGURES
Figure
No.
Title Page No.
3.1 Isometric view of the parboiling cum drying unit 32
3.2 Front view of the parboiling cum drying unit 33
3.3 Right side view of the parboiling cum drying unit 33
3.4 Top view of the parboiling cum drying unit 34
3.5 Sectional view of the LSU dryer 34
3.6 Process flow chart for parboiling of paddy 42
4.1 Effect of parboiling on milling efficiency in hot soaking 55
4.2 Effect of parboiling on milling efficiency in cold soaking 55
4.3 Effect of parboiling on head rice yield in hot soaking 58
4.4 Effect of parboiling on head rice yield in cold soaking 58
4.5 Effect of parboiling on hardness in hot soaking 61
4.6 Effect of parboiling on hardness in cold soaking 61
4.7 Effect of parboiling on the Chroma value of milled rice in hot
soaking
64
4.8 Effect of parboiling on the Chroma value of milled rice in cold
soaking
64
4.9 Effect of parboiling on the bulk density of milled rice in hot
soaking
67
4.10 Effect of parboiling on the bulk density of milled rice in cold
soaking
67
4.11 Effect of parboiling on the true density of milled rice in hot
soaking
68
4.12 Effect of parboiling on the true density of milled rice in cold
soaking
68
4.13 Effect of parboiling on the cooking time of milled rice in hot
soaking
72
iii
4.14 Effect of parboiling on the cooking time of milled rice in cold
soaking
72
4.15 Effect of parboiling on the water uptake ratio of cooked rice in
hot soaking
75
4.16 Effect of parboiling on the water uptake ratio of cooked rice in
cold soaking
75
4.17 Effect of parboiling on gruel solid loss in hot soaking 78
4.18 Effect of parboiling on gruel solid loss in cold soaking 78
4.19 Effect of parboiling on grain elongation ratio in hot soaking 80
4.20 Effect of parboiling on grain elongation ratio in cold soaking 80
4.21 Effect of parboiling on hardness of cooked rice in hot soaking 83
4.22 Effect of parboiling on the hardness of cooked rice in cold
soaking
83
LIST OF PLATES
Plate No. Title Page No.
3.1 Parboiling cum drying unit 37
3.2 Soaking cum steaming chamber 37
3.3 LSU dryer 38
3.4 Conveying channels 38
3.5 Air Blower 39
3.6 Inverted V channels 39
3.7 Heat Furnace 39
iv
LIST OF APPENDICES
Appendix
No.
Title Page
No.
A1 Effect of parboiling on milling efficiency and head rice yield in hot
soaking
i
A2 Analysis of variance (ANOVA) for milling efficiency in hot
soaking
ii
A3 Analysis of variance (ANOVA) for head rice yield in hot soaking iii
A4 Effect of parboiling on qualities of milled rice in hot soaking iv
A5 Analysis of variance (ANOVA) for hardness of milled rice in hot
soaking
v
A6 Analysis of variance (ANOVA) for chroma of milled rice in hot
soaking
vi
A7 Analysis of variance (ANOVA) for bulk density of milled rice in
hot soaking
vii
A8 Analysis of variance (ANOVA) for True density of milled rice in
hot soaking
viii
A9 Effect of parboiling on qualities of cooked rice in hot soaking ix
A10 Analysis of variance (ANOVA) for cooking time of cooked rice in
hot soaking
x
A11 Analysis of variance (ANOVA) for Water uptake ratio of cooked
rice in hot soaking
xi
A12 Analysis of variance (ANOVA) for Gruel solid loss of cooked rice
in hot soaking
xii
A13 Analysis of variance (ANOVA) for Grain elongation ratio of
cooked rice in hot soaking
xiii
A14 Analysis of variance (ANOVA) for hardness of cooked rice in hot
soaking
xiv
v
B1 Effect of parboiling on milling efficiency and head rice yield in
cold soaking
xv
B2 Analysis of variance (ANOVA) for milling efficiency in cold
soaking
xvi
B3 Analysis of variance (ANOVA) for head rice yield in cold soaking xvii
B4 Effect of parboiling on qualities of milled rice in cold soaking xviii
B5 Analysis of variance (ANOVA) for hardness of milled rice in cold
soaking
xix
B6 Analysis of variance (ANOVA) for chroma of milled rice in cold
soaking
xx
B7 Analysis of variance (ANOVA) for bulk density of milled rice in
cold soaking
xxi
B8 Analysis of variance (ANOVA) for True density of milled rice in
cold soaking
xxii
B9 Effect of parboiling on qualities of cooked rice in cold soaking xxiii
B10 Analysis of variance (ANOVA) for cooking time of cooked rice in
cold soaking
xxiv
B11 Analysis of variance (ANOVA) for WAR of cooked rice in cold
soaking
xxv
B12 Analysis of variance (ANOVA) for gruel solid loss of cooked rice
in cold soaking
xxvi
B13 Analysis of variance (ANOVA) for Grain elongation ratio of
cooked rice in cold soaking
xxvii
B14 Analysis of variance (ANOVA) for hardness of cooked rice in cold
soaking
xxviii
C1 Response optimization constraints of hot soaking xxix
C2 Response optimization constraints of cold soaking xxx
D1 Cost Economics of developed parboiling cum drying unit xxxi
vi
SYMBOLS AND ABBREVIATIONS
Symbols Abbreviations
% : Percent
< : Less than
± : Plus or minus sign
° : Degree
a* : Greenness or redness
ANOVA : Analysis of variance
B : Chroma value
b* : Blueness or yellowness
℃
°F
:
:
Degree Celsius
Degree Farenheit
CFTRI : Central Food Technological Research Institute
CRRI : Central Rice Research Institute
db : Dry basis
DSG : Degree of Starch Gelatinization
et al. : And others
Fig. : Figure
g
GI
:
:
Gram
Galvanised Iron
g/cm3 : Gram per centi meter cube
GI : Glycemic Index
h : Hour
hp : Horse power
HRY : Head Rice Yield
ie., : that is
IRRI : International Rice Research Institute
KCAET : Kelappaji College of Agricultural Engineering and
Technology
vii
kg : Kilogram
kg/cm2 : kilogram per centimetre square
kg/h : kilogram per hour
kg/m3 : kilogram per meter cube
kPa : kilo Pascal
L* : Lightness or darkness
LSU : Lousiana State University
m/s : Meter per second
m3/s : Meter cube per second
min : Minute
ml : Milliliter
mm : Millimeter
N : Newton
No. : Number
OS
SS
:
:
Open Steaming
Stainless steel
RF : Rupture Force
RSM : Response Surface Methodology
s : Second
SS : Stainless Steel
TF : Thermic fluid
TI : Translucence Index
w/w : Weight/ weight
wb : Wet basis
ρb : Bulk density
ρt
cm
:
:
True density
Centimeter


INTRODUCTION

1
CHAPTER I
INTRODUCTION
Rice (Oryza sativa L) is consumed by more than half of the world
population as their staple food. In 2019, according to the Food and Agricultural
Organisation of the United Nations, global paddy production was 769.9 million
tonnes (FAOSTAT, 2019) and the national paddy production was 118.4 million
tonnes (Indiastat, 2020) during 2019. Rice is rich in carbohydrates, vitamins and
minerals. However, polishing of grain affects the nutritional quality by removing
the superficial layers of caryopsis from the rice, concentrating the carbohydrate
content and reducing the vitamins and minerals. Parboiling of rice resolves these
problems to a certain extent since it helps to concentrate nutraceuticals, improves
the palatability and extends shelf life. Parboiling is a traditional hydrothermal rice
processing treatment intended to gelatinise the starch to enhance the head rice yield,
to facilitate the penetration of nutrients present in the bran layer into the endosperm
and to reduce their loss during milling. Approximately 20% of the world’s rice
produced is being parboiled (Buggenhout et al., 2013). Parboiling is mostly
practised in countries like India, Pakistan, Bangladesh and Nigeria and also spread
into many countries such as Europe, North and South America (Bhattacharya,
2011). In India, about 50-60% of paddy is being parboiled annually (IKISAN,
2019).
Rice is composed of endosperm, germ and bran layers which comprises of
dynamic reserves of protein, vitamin, dietary fibre and minerals; also rice kernel
contains an excess of starch content (80-90%) (Saikrishna et al., 2013). Parboiling
is done before milling to impart more strength to the rice kernel so that it may well
withstand the milling stress and improve the head rice yield. Starch granule is
composed of the polyhedral crystalline structure and has some inter granular spaces
with voids and cracks which results in breakage during milling. Parboiling aids the
gelatinization of starch and filling of expanded disrupted protein in the air spaces
2
of endosperm, thus reducing the breakage. The three main stages of paddy
parboiling are soaking, steaming and drying.
Soaking is the hydration process of diffusion of water into the rice kernel,
which is essential for the starch gelatinisation. It allows absorbing the moisture
leading to swelling of the starch granule, thus enhancing the moisture content to
approximately 30% (Bhattacharya, 1996). The temperature of soaking water is
usually below the paddy gelatinisation temperature (55℃ - 72℃) to assure that the
gelatinisation occurs during steaming only. Complete gelatinisation of starch takes
place during the steaming process without removal of moisture from the soaked
grains and enables the granular texture of starchy endosperm to become pasty,
compact and translucent as well as it inhibits the biological process and inactivates
the enzymes present in it. Steaming aids in developing stronger kernels which
remains intact during the stages of milling. Drying in the parboiling process reduces
the moisture content to 12-14% from 37 - 43% which gained through soaking and
steaming (Goswami and Murlidhar, 2015). Temperature and the resistance to
airflow behaviour of bulk grain are important factors considered in the drying stage.
The tempering in the drying process allows the redistribution of moisture within the
rice kernel to reduce the moisture gradient brought by the previous drying stage.
Tempering affects the rate of moisture removal and grain quality. Drying enables
to bring down the moisture content within the safe milling and storage limit.
Starch, the major portion in the rice grain is composed of two constituents
such as amylose and amylopectin. Starch present in rice is gelatinised during
steaming. The nature of rice starch influences the milling recovery; the crystalline
nature decides the cooking qualities, pasting behaviour and glycemic index (GI) of
rice. Higher the amount of crystalline nature of rice, higher the breakage, whereas
rice having amorphous starch with lower crystallinity brings a lesser amount of
milling losses. Parboiling results in conversion of crystalline starch into the
amorphous form before the milling stage. The main benefits of parboiling are that
the grain contains more vitamin B than the raw rice, the bran of parboiled rice
3
contains higher oil content (about 25-30% oil) compared to raw rice bran (about
10-20% oil) and the parboiled rice is non-sticky and non-glutinous.
In the present context, where people are more inclined towards food with
low GI, the preference to parboiled rice with reduced GI has steeply risen (Larsen
et al., 2000). In some areas of South Asia, parboiled rice is preferred because it is
typically less sticky than non-parboiled rice (Kato et al., 1983). Besides, it is also
preferred by health sensitive consumers due to its better nutritional properties
compared to non-parboiled rice. Agronomic conditions during harvesting also
promote the need to parboil paddy because almost all the paddy harvested during
rainy season and those exposed to flooding during harvesting show excessive
breakage during milling (Bhattacharya, 2011). To counteract this, the paddy is
parboiled to improve the Head Rice Yield (HRY). Besides enhancing the nutritive
value by permitting migration of vitamins from outer to inner layer of rice kernel,
parboiling also imparts a hard texture and a smooth surface finish to the grain. This
leads to better milling quality and reduced number of brokens resulting in better
total rice outturn (72-73%).
The lack of efficient drying method may results in heavy loss during milling
of parboiled paddy. The traditional method of drying like sun drying totally depends
upon the weather and also causes losses due to scattering, birds and rodents. These
disadvantages can be circumvented by adoption of mechanical dryers (Nayak,
1996). In addition, the parboiling is an energy-intensive and time-consuming
process. The efforts to save time and energy may affect product quality. Even
though improved technologies were developed for parboiling of paddy in the
industrial sector, small scale units suffer from losses in conventional grain
processing practices and unavailability of low capacity modern equipment. A
household paddy parboiling unit which is powered by burning firewood has been
developed by Tamil Nadu Agricultural University. But it lacked a drying unit and
involved more physical labour (Anon., 2016). The major proportion of people
engaged in parboiling process being women, the development of an improved
parboiling equipment with reduced drudgery and enhanced safety measures would
4
greatly improve the employment opportunities to them and in turn, their livelihood.
Hence, a study was proposed to develop a small scale parboiling cum drying unit
for paddy processing having the capacity of two quintal with the following
objectives.
1. To develop a small scale parboiling cum drying unit for paddy processing
2. To evaluate the performance of the developed parboiling cum drying unit

REVIEW OF LITERATURE

5
CHAPTER II
REVIEW OF LITERATURE
This chapter deals with the reviews on the investigation topic ‘Development
of small scale parboiling cum drying unit for paddy processing’ and sets out to
critically analyze the previously published literature concerning the development
of parboiling unit for paddy processing, stages of parboiling, milling properties and
cooking properties of parboiled paddy.
2.1 PARBOILING
Paddy parboiling is a hydrothermal treatment which done before milling the
paddy to accomplish the starch gelatinization and it yields advantages such as
higher head rice yield, lesser broken grains, increased resistance to insects, firmer
cooked rice texture, less solid loss during cooking, better retention of nutrients and
higher oil content in the bran (Pillaiyar, 1988).
The three steps of parboiling enabled the raw rough rice to reach saturation
moisture content through soaking, to attain starch gelatinization by adding heat to
the moist kernels via steaming and the drying helped to reduce the product moisture
content required for milling (Sahay and Singh, 2001).
Paddy is very low in moisture and it is regarded as durable in nature. The
moisture content of paddy during the harvest is about 18-22%. Since the amount of
moisture inside the paddy was changes according to the environmental condition,
the harvested paddy should be dried up to 12-13%. Parboiling is a pre-milling
treatment which gives significant physico-chemical reforms in rice. The soaking
temperature and steaming pressure influences the moisture absorption by the grain,
thus affecting the time requirement. This hydrothermal treatment which is done
before the milling stage brings about physical, chemical, and physio-chemical
modifications in rice. Moisture absorption by the grain that depends on soaking
temperature and steaming pressure determines the time required for the parboiling
(Mohanty et al., 2002).
6
Ilyas and Goel (2003) stated that parboiling helped in the gelatinisation of
starch thus strengthen the kernel and enabling the grains to withstand breakage
during milling. The sun cracked grains bind themselves remarkably well and mill
like hard whole grains after they were parboiled
The traditional method of parboiling took one to two days for soaking of
paddy in the water in room temperature and the modern way of parboiling
completed the process in a shorter time which depended on the temperature of
soaking water. Long duration cold water soaking leads to microbial growth and off-
flavour development, whereas hot water soaking required high energy inputs and
produced unsatisfactory colouration to the kernels (Saifullah et al., 2004).
Parboiling allows the migration of several compounds from the aleurone
layer into the grains, thereby increasing the nutritional value. The three main stages
of parboiling were soaking, steaming and drying. Soaking done in hot water to
increase the moisture content. Steaming was done to establish partial or complete
gelatinisation. Drying helps to preserve the moisture content for storage and milling
(Ondier et al., 2012).
2.2 DEVELOPMENT OF PADDY PARBOILING SYSTEM
Levan et al. (1990) conducted a study on parboiling of paddy using a husk
fired inclined grate furnace and a CRRI mini parboiling unit in KCAET Tavanur.
Husk fired grate furnace provided the heat required for steaming and drying. The
parboiling unit consisted of two chambers, separated by a perforated portion to
enable both soaking and steaming in the same unit. A central GI pipe with
perforated laterals was provided for uniform distribution of steam. Rice husk at the
rate of 10 kg/h produced the heat required for soaking and steaming 75 kg of paddy.
The parboiling process was done with soaking and steaming time of 2 h and 15 min
respectively with a head rice yield of 64.5% and total yield of 67%.
Pillaiyar (1995) developed a thermic fluid parboiling system (TF) and
compared with the open steaming (OS) process to save the processing time, to
improve the quality of the product and to fulfil the needs of both the industry and
7
the consumer. It consists of insulated SS cylindrical drum, a circular top plate,
temperature sensing devices and a hand stirrer. The preheated thermic fluid was
circulated inside the cylindrical drum and its temperature was controlled by
centrally placed stirrer. The TF system reduced the moisture content of the soaked
paddy as well as it had superior milled rice whiteness compared to the open
steaming process.
A conduction parboiling technique was developed by Varadharaju and
Sreenarayanan (2004) using industrial oil as fuel. Compared to conventional
methods, the energy required for the conduction parboiling was only 50%. The
overall efficiency was found to be 43.32% and the heat utilisation efficiency was
increased to 77.5%, 58% and 25% for soaking, parboiling and drying respectively.
A parboiling equipment was developed by Houssou and Amonsou (2004)
to increase the quality and yield of the parboiled paddy. The two main components
of the equipment were vat and a pot. In comparison to the traditional methods, the
improved method yielded uniformly steamed product. This method significantly
reduced the rate of cracks from 24% (traditional method) to 15% (improved
method), improved the rice husking out turn from 64% (traditional method) to 70%
(improved method) and consumed less duration for the sun drying.
A Pressure parboiling system for paddy was designed and fabricated in
KCAET Tavanur. It consisted of a pressure parboiling tank with steam distribution
pipes, a steam generator and instrumentation for measuring pressure and
temperature. Paddy was treated under different soaking temperature for different
soaking periods at different parboiling pressures for parboiling time. The milling
quality, cooking quality and physical characteristics of the pressure parboiled paddy
under selected treatments were also found and the results were compared with the
traditional parboiling process. The study indicated that pressure parboiling with a
soaking period of 30 min at 70°C and a pressure of 1 kg/cm2 is optimum for Jyothi
variety of Paddy (Simi and Sudeep, 2006).
8
Umogbai (2013) developed a farm level paddy parboiling device having 200
litres capacity and compared it with the traditional and improved parboiling
method. The peculiarity of this device was that there was a rotating grid which was
acting as a stirring unit and the steaming chamber lay below the soaking chamber.
The performance of this device was assessed using long grain rice. The results
showed that the improved parboiler had a significant advantage. It required only
less time of operation and was cheaper than the traditional method. There was no
significant difference in the water uptake ratio between the two methods. The
quality of rice developed by the improved parboiler was also good compared to the
traditional parboiler.
A parboiling device was designed in Nigeria for the rural farmers to parboil
a maximum of 70 kg of paddy per batch. It consisted of the steaming chamber which
was directly below the soaking chamber. A rotating grid was incorporated to serve
as a stirrer. The parboiler was mounted on a tilting frame for ease of evacuation of
the paddy after parboiling. Firewood was used as the source of fuel. The
performance of the developed parboiler was compared with the traditional and
industrial method of parboiling. The results showed that the developed parboiler
took lesser time of operation with a soaking time of three hours at 70oC and
steaming time of 20 min at 95oC. The industrial method was an imported
technology and it was not available for use by the bulk of the rural farmers which
produce 80% of the rice consumed in Nigeria (Gbabo et al., 2014).
A study was conducted by Bello et al. (2015), to assess the parboiling
practices and constrains hindering the local parboiling technology in Kano State.
From the evaluation based on a structured questionnaire and field study,
information about the method of parboiling, equipment used, cost of parboiling,
variety of paddy used, parboiling capacity and challenges of the parboiling
activities were obtained. The survey revealed that parboiling was mostly done
manually between a soaking temperature ranges of 550C to 700C with a time range
of 9 to 17 hours. Lack of modern parboiling technologies and poor understanding
of the process of parboiling were the major constraints faced by the processors.
9
TNAU had developed a household parboiling unit having a capacity of
125 kg/batch to parboil the paddy uniformly. It consists of a drum and is divided
into three equal portions. The top two-third portion retained paddy for parboiling
and bottom one-third portion held water to produce steam for parboiling. The water
in the drum was heated by burning firewood or any agricultural waste. After the
completion of parboiling of first batch, the remaining hot water could be used for
the next batch. But it had only a steaming chamber. Soaking and drying was done
separately (Anon., 2016)
Srisang and Chungcharoen (2019) conducted a study by applying a rotating
sieve system to the parboiling process for parboiled rice production. This method
increased the quality of parboiled rice such as degree of gelatinization (DOG)
(65.02%–100%) and head rice yield (HRY) (69.65%–72.50%).
Traditional parboiling consists of double parboiling and single parboiling
whereas modern method includes several processes such as CFTRI method,
Jadhavpur university method, Converted process (U. K.), Avorio process (Italy),
Malek process, Fernandes process, Cristallo process, Schule process (Germany),
RPEC method, Pressure parboiling process (India) and Rice Growers Association
of California process (Chakraverthy, 1981; Sahay and Singh, 2001). In Indian mills,
CFTRI methods are found to be commonly used. The quality characteristics of
parboiling depend on the method of parboiling used. Each step of parboiling plays
a major role in the quality of rice. So the investigation of each step in parboiling
helps to evaluate its effect on the rice quality characteristics.
2.3 METHODS OF SOAKING
Indian Institute of Technology, Kharagpur developed a parboiling method
consist of soaking at a temperature of 70 to 80℃ for 3.5 h (Ali and Ojha, 1976).
Parboiling by hot soaking for 1.5 h at 80-85℃ was sufficient to gelatinize the grain.
The process eliminated the steaming step. The grain was equilibrated for 1-1.5 h in
the container which was insulated to retain the heat after draining the water and the
moisture penetrated into the grain aids in gelatinization. The soaking time varied
10
depending upon the temperature and the variety of paddy. Uniform gelatinisation
of paddy could be achieved, when the moisture and the heat reached the centre of
the grain through fast hydration (Bandopadhyay and Roy, 1976).
Soaking sometimes called as steeping process was regarded as the most
overwhelming process in parboiling. The paddy (rough rice) is allowed to fully
submerge in the water to gain the sufficient moisture content which enables it to
gelatinise on succeeding heating by supplying steam to it. Generally soaking is
carried out at a temperature lower than its gelatinisation temperature of the rice to
be soaked (Luh and Mikus, 1980).
The odour developed due to the soaking in conventional parboiling could
be abolished by the immersion of paddy in the water having 0.10% mercuric
chloride, 0.1% copper sulphate, 0.05% sodium chromate, 0.3% ferric chloride,
0.15% Acinol and 0.1 % thiram. Out of these, 0.05% sodium chromate (w/w)
eradicated the smell as well as it diminished the soaking loss to a great extent
(Pillaiyar et al., 1980).
In the CFTRI method of parboiling, soaking was done for 3.5 – 4 h at 70℃.
This method gave higher head rice yield. However, the product had a yellow colour.
The yellow colour was due to a non-enzymatic browning reaction and could be
reduced by giving suitable soaking temperature and time (Vassan, 1982).
Soaking in the single steam method of parboiling took two to three days and
resulted in a fermented bad smell which reduced the acceptability to the consumer
Double steam method upgraded the single steam method by reducing the soaking
hours to 36 h by steaming of paddy before and after soaking in water. The double
steam method gave higher head rice yield and had a good market value
(Bhattacharya, 1985). These methods induced low colour to the milled rice and
cook to a softer texture.
Full soaking process aids the paddy to reach a moisture content of about
30-35%. Since soaking is a temperature dependant process, high soaking
temperature yields high soaking rate and vice versa. Low-temperature soaking led
11
to microbial contamination due to the longer soaking duration which affects the
colour, taste and aroma of the grains. Though higher temperature soaking is time-
saving, it might result in more leaching loss while cooking of parboiled rice
(Velupillai and Verma, 1986).
Soaking is a hydration step that increases the moisture content of paddy to
about 30% which was essential for the completion of the parboiling process. At
room temperature, it was allowed for 24 h with paddy and water ratio by mass 1:1.2
(Haque et al., 1997). To achieve 30-35% (wb) moisture, Ramachandra et al. (2000)
proposed that 6h of soaking the paddy at 65℃ was enough for a better head rice
yield.
The study done by Miah et al. (2002) on the effect of hot soaking on the
physicochemical parameters of rice found that the quality of milled rice increased
with increase in the duration of hot soaking. The highest degree of gelatinisation
was obtained when the paddy was soaked at 80℃ for 120 min. The gelatinisation
on parboiling made the grain stronger and improved the milling qualities.
The quality of parboiled paddy could be improved by reducing the duration
of soaking. Igathinathane et al. (2005) developed a combination soaking procedure
based on the fact that hydration of paddy below the gelatinisation temperature
preserves desirable quality and it took more time. Soaking of paddy at temperatures
above the gelatinisation temperature leads to the contamination of soak water and
husk splitting. The developed combination procedure involved the use of 80℃
water up to a moisture content of 35% d.b followed by using 70℃ water till a
saturation moisture content of 42.7% db. Compared to single-stage soaking at 70℃,
this method resulted in a 67% reduction of time. The polished rice of single-stage
soaking and double stage soaking did not show any difference in terms of head rice
yield, broken grains produced, and the cracked grains produced.
Kashaninejad et al. (2007) observed the soaking behaviour with respect to
the soaking temperature at 25, 30, 40, 50, 60, and 70℃ and they found that initially
there was rapid water uptake followed by the slower rate in the later stages and
12
reached to the saturation moisture content finally. The husk of the paddy always act
as a barrier for the water absorption.
Different rice varieties might have different soaking conditions. In a study,
Ejebe et al. (2015) reported that FARO60 variety of paddy needs to be soaked at
60℃ for 6 h, Bisalayi, FARO44 and FARO52 varieties for 7 h whereas FARO61
required soaking for 8 h to achieve the desired level of moisture content (40% db).
From the above recommendations, it was noticed that a single recommendation
cannot be applied to all variety. Soaking conditions varied with individual variety.
Soaking aims to eliminate the ungelatinised portion of rice called white
core. Two methods of soaking are ambient temperature soaking and high-
temperature soaking. Former one usually took 1-3 days to hydrate the rice grains
and the later one accelerates the water penetration rate, shortens the soaking time
and inhibits the fermentation and enzymatic reaction (Leethanapanich et al., 2016).
The application of hot water and cold water soaking in paddy parboiling
process was studied by Gunathilake (2018). For hot soaking, the temperature of the
water was set to 70℃ after filling the paddy and kept for 6 h. The traditional way
of parboiling was done for 50 h in cold water. High amount of moisture was
absorbed in hot water soalking when compared to cold soaking in a short period of
time. The rice kernal in hot soaking absorbed water rapidly and saturated to the
moisture content 43.8% (db.) after 6 h. Traditional parboiling attained the saturation
moisture content of 44% (db.) in 48 h.
2.4 METHODS OF STEAMING
Researchers investigated different steaming conditions for parboiling the
rice. The husk of the soaked paddy started to split when it was steamed at a pressure
of 4 kg/cm2 in CFTRI method of parboiling (Araullo et al., 1976). Husk splitting
was regarded as the signal of completion of parboiling.
Saxena et al. (1989) reported that the milling quality of parboiled paddy was
improved on the continuous steaming process under pressure over the raw paddy.
13
Steaming of paddy at a pressure of 2 kg/ cm2 for 10 minutes yield a head rice yield
of 68.6%.
Generally steaming was given after the soaking treatment. Gelatinisation of
starch is the main aim of steaming. Marshall et al. (1993) reported that rice kernel
reaches complete gelatinisation within a very short duration of steaming if it had a
moisture content of more than 32%. The ability of the parboiled rice kernels to repel
the milling forces could be improved by increasing the steam heat treatment.
Bhattacharya and Rao (1996) studied the milling yield and process
parameters of parboiling. They suggested that under adverse condition of drying,
good milling results could be obtained if there was severe prior heat treatment at
the steaming stage. Steaming process enables the complete gelatinisation of starch
without removing the moisture from the soaked paddy. Inactivation of most of the
enzymes and biological process occurs during the steaming process. Due to the
gelatinisation process on steaming, the granular texture of the starchy endosperm
becomes pasty resulting in the sealing of cracks and the endosperm becomes more
compact and translucent.
Roy et al. (2004) conducted a comparative study of open and closed
steaming to improve the traditional parboiling process. The study was based on the
double steaming process of direct heating under open and covered conditions with
a rice cooker. Soaking and steaming were carried out in a cooker. About 20% of
paddy was submerged in water for the steaming process. Analysis of the average
value of hardness indicated that the covered method had a higher degree of
parboiling and consumed less amount of energy. But the parboiled brown rice in
the bottom layer exhibited more hardness and there was no difference in the overall
quality indices between two methods.
Sareepuang et al. (2008) suggested a steaming time of 15 min at 121℃ for
small batches to obtaining best quality of parboiled paddy. For large batches,
20-30 min of steaming was necessary. A study was conducted by
Swasdisevi et al. (2010), to investigate the effects of pre steaming time on qualities
14
of partial-parboiled rice. The results revealed that head rice yield increased with
increase in pre steaming time whereas there was a decrease in the presence of white
belly decreased. Steam could be supplied either through saturated as in open system
or superheated in a closed system. The major factors affecting the steaming was its
pressure and duration. The severity of steaming affected the degree of gelatinisation
and had a direct effect on the quality of rice (Dutta and Mahanta, 2012).
Taghinezhad et al. (2016) conducted a study on the relationship between the
degree of starch gelatinization and quality attributes of parboiled rice during
steaming. Paddy rice samples were parboiled for a soaking duration of 3 h at 65℃,
and steaming at 96°C for 2 to 10 min. The degree of starch gelatinization (DSG)
and several quality attributes (head rice yield (HRY), colour value and hardness) of
parboiled rice were measured. Results showed that DSG (46.8%–77.9%), colour
value (18.08–19.04) and hardness (118.6–219.2 N) increased following steaming.
In contrast, the HRY increased (64.8%–67.1%) with respect to steaming times
between 2-4 min and decreased (67.1%–65.0%) for steaming times between
4-10 min.
Hasbullah (2017) evaluated the effect of duration of steaming on
physicochemical quality and glycaemic index of parboiled rice. The paddy soaked
for 4 hours in 600C hot water was steamed for 20 and 30 min at 100°C. Analysis of
milled paddy which was dried to a moisture content of 14% showed that steaming
process of 20 minutes duration produced high values of head rice yield, ash, fat and
protein content and the low values of glycaemic index and carbohydrate content.
2.5 METHODS OF DRYING
Drying method influences the mechanical properties of the grain such as
grain hardness which directly depends on the efficiency of rice milling. During
harvest season, the moisture content of paddy was about 22-26% (wb) and it should
be dried to 13-14% (wb) to reduce the respiration rate, to inhibit mould growth and
to prevent the production of mycotoxins (Hall, 1970).
15
Drying of parboiled paddy was done to increase the head rice yield and to
reduce the moisture content to the optimum percentage required for the milling and
storage. The difference between the drying of parboiled rice and raw rice was that
the initial moisture content of raw rice was smaller than that of parboiled rice and
also the texture of rice kernel between these two types were different due to the
compact nature and gelatinisation of rice starch (Gariboldi, 1974).
Drying in traditional parboiling was carried out in sunlight for 1-2 days.
First, it was dried to 18-20% (wb) of moisture content and kept heaped overnight
for suffusing. Then it was dried to about 14% (wb) to get better quality and higher
milling yield (Rahaman, et al., 1996).
Wiset (2001) conducted a study on the effect of two-stage drying on rice
quality. The first stage used high temperature (up to 150°F) to decrease the moisture
to 18% (wet basis) and it was followed by the second stage at ambient temperature
to reduce the moisture content to 14% (wb). Adopting two-stage drying, we could
increase the efficiency of drying.
Parboiled paddy should be dried to 14% moisture for safe storage or milling.
The continuous-flow dryer (LSU type) was a recirculating batch dryer. Wet paddy
was recirculated in the dryer until it reaches 14% moisture. In contrast with raw
paddy, parboiled paddy required air temperatures of up to 100°C and below 75°C
during the first and second drying period respectively. The first drying period took
about three hours including dryer loading and unloading time. After tempering, the
second drying period took about two hours (IRRI Rice knowledge bank. n.d).
Islam et al. (2003) found that, drying of parboiled rice was difficult
compared to raw rice. This consumes more energy for drying to the desired moisture
content. Drying time could be reduced by using higher air temperatures, but it led
to the development of internal stresses in the grain and cause breakage during
milling. Fissuring could be reduced by providing drying temperatures between
35℃ and 45℃.
16
Drying temperature below 95°C was recommended for the paddy subjected
to parboiling to maintain the rice taste and quality (Lan and Zheng, 2004). Higher
drying air temperatures accelerate the drying process by creating higher moisture
gradients, it also caused problems like discolouration, fissures, and resultant broken
grains.
Rao et al. (2007) optimised the drying variables in thin layer drying of
paddy. Head rice yield of 65-68% obtained for a combination of variables like bed
depth 7-10 cm, air velocity 0.55-0.68 m/s and drying air temperature of 112-116℃.
A study was conducted by Swasdisevi et al. (2010), to investigate the effects
of drying temperatures on qualities of partial-parboiled rice using hot-air
fluidization technique. To obtain the suitable conditions for producing partially-
parboiled rice using hot-air fluidization technique, paddy was soaked at the
temperature of 80℃ for 5 hours and then it was blown with saturated steam having
a temperature of 102℃ for 70 s (pre-steaming). Subsequently, it was dried using
fluidization technique at the hot-air temperature of 140℃ for 2 min and then it was
tempered for 30 min; furthermore, it was ventilated at ambient air temperature until
the final moisture content reached approximately 14–16% db.
The effects of temperature (66-840C), heating time (30-180 min), and
tempering time (60-420 min) on milling yield and gelatinisation degree was studied
by Bello et al., (2015). They found that the highest milling yield (67.7%) and
maximum value of the degree of gelatinisation (37.0%) were yielded at a process
temperature of 840C using heating and tempering times of 104 min and 178 min
respectively.
The effects of temperature of drying the paddy was studied by Zheng and
Lan (2007). Paddy was dried with heated air temperatures of 45℃, 50℃, 55℃,
60℃ and 65℃. Drying of paddy at temperature of 55℃ did not affect cooking and
eating qualies of rice. Drying temperature of 55℃ was recommended to dry the
paddy for obtaining the higher head rice yield and hardness value.
17
2.6 MILLING PROPERTIES OF PARBOILED PADDY
The preferences of the consumer for milled rice vary from country to
country. Majority of the consumers favour well-milled white rice with little to
almost no bran on the endosperm. Indian consumers prefer well-milled rice and
well-milled sticky rice was preferred by Japan consumers (Lyon, 1999). Even
though parboiling results in the improvement of head rice yield by reducing the
number of broken, it also increases the hardness and darkness of the rice kernel.
Several studies were done to evaluate the changes in colour and hardness of
parboiled rice bought by the parboiling process.
2.6.1 Milling efficiency and head rice yield
The drying of paddy in a thin bed of 5 cm at drying air temperatures of 40,
50, 60, 70 and 80°C showed that the fissured grains increased linearly with increase
in temperature of drying air which decreased the milling yield. The maximum head
rice yield obtained for a hot air temperature of 500C or less, tempering period of
36h and a moisture content of 14% (Samsher and Narain 1989).
The effect of grain fissuring on milling quality was noted by Shrivastava
and Narain (1990). They found that the fissuring of rice kernels influenced the
milling quality of paddy. The number of fissured kernels on milling was inversely
proportional to the head rice yield. The short variety showed small resistance to
fissuring comparing to the long-grain variety
The maximum head rice yield was obtained when the starch had reached
about 40% gelatinisation. Extensive parboiling led to extensive starch gelatinisation
which was not necessary to obtain the maximum head rice yield (Marshall et
al.,1993). Das et al. (2004) found that the major reduction of head rice yield of
infrared parboiled rice was due to the increase in the moisture removal rate due to
the increased radiation intensity.
The milling is referred as the conversion of paddy into the edible form of
rice by the removal of outer seed-coat (husk) and bran layers. Paddy grains consist
of outer protective husk layers which is harmful for human consumption. So the
18
removal of this outer portion was the essential criteria in rice milling. The effect of
parboiling on hulling, milling and head rice recovery of a check variety and six
hybrids of paddy showed that the parboiling had increased the head rice recovery
of hybrids to 12.9% and there was no difference in the post-harvest characteristics
such as hulling and milling recovery between hybrids and check variety (Naik et
al., 2006).
Sareepuang et al. (2008) studied the effect of soaking temperature on the
head rice yield of KDML 105 rice and reported that head rice yield of parboiled
paddy were 59.22, 82.98 and 84.40% for the soaking temperatures 40, 50 and 60°C
respectively, while it was only 50.92% for the raw paddy it was only 50.92%.
Increase in soaking temperature and severity of steaming affected the head rice
yield.
Patindol et al. (2008) conducted a study on the steaming of pre-soaked
paddy under severe (20 min, 1200C, 98 kPa) and mild (20 min, 1000C, 0 kPa)
steaming treatments and found that that head rice yield was higher for the batch that
subjected to severe steaming conditions. When the rice was parboiled with a steam
pressure of 5.5 x 10⁴ N/m2, about 93.3% of HRY was obtained.
2.6.2 Hardness of parboiled rice
Roy et al. (2003) found that higher degree of parboiling increased the
hardness of the rice in the inside layer than the surface layers. Soaking and steaming
changes the structure of the bran layer and fills the fissures and cracks. Thus the
structure of the endosperm became more compact and it increased the tensile
strength.
Bello et al. (2006) examined the quality features of the milled and cooked
rice after the hydrothermal treatment. Tempering increased the quality indexes and
the temperature affects the rupture force (RF) and translucence index (TI). The rice
showed intermediate values of textural properties between raw and traditional
parboiled rice after tempering with a soaking period of 24 h at 25°C and heating at
85°C (174.4 min) or 93.7°C (45 min).
19
Hardening of rice had a key role in the parboiling process. The hardness of
the grain had an impact on grain characteristics such as resistance to the insect
damage, cooking quality etc. Comparatively parboiled rice was harder than the raw
rice at the same moisture content due to change of starch from crystalline form to
the amorphous form as a result of the irreversible swelling and fusion of starch
granules (Fofana, 2011).
2.6.3 Colour of the parboiled milled rice
Generally, parboiled rice has an amber colour. The change in colour
depended on several factors like temperature of soaking water, soaking time,
steaming pressure and duration, drying temperature and drying time (Bhattacharya
and Subba Rao, 1996; Ali and Pandya, 1974). Consumer prefer the production of
lighter parboiled rice. The long duration of soaking and high temperature steaming
upsurges the colour intensity and lightness of parboiled rice (Pillaiyar and
Mohandoss, 1981). Non-enzymic Maillard type reaction was the major reason for
the change in colour of the paddy. Maillard reactions happen when the sugars (from
the carbohydrates) and the amino acids (from the proteins) within the grain reacts.
The soaking temperature had an impact on the rice colour, as the soaking
temperature increases, the colour of the soaked rice became darker and vice versa.
Changes of rice colour in soaking were due to the diffusion of some compounds
into the endosperm from bran layers (Lamberts, 2006).
Champa et al. (2006) studied the hydrothermal treatment of paddy with a
soaking period of two hours at room temperature and 25 min of steaming in
atmospheric pressure. It retained a high degree of whiteness compared to non-
parboiled rice. Brown rice (Variety: KDML 105) had lightness value of 58.63
before soaking and it was reduced to 53.80, 52.65 and 51.30 after soaking at 40,50,
and 600C respectively.
Sareepaung et al. (2008) reported that the increase in soaking temperature
of paddy during parboiling decreased the lightness value and increased the colour
value. They inferred that less coloured product could be gained by lowering the
20
soaking temperature. The colour and lightness value of parboiled rice depends on
the treatment conditions. The darkening of parboiled rice has also happened with
the effect of migration of pigments from the husk and bran into the endosperm. The
price of parboiled rice depends on the grain whiteness / lightness. The whiteness
value was an effect of duration of soaking and steaming (Dutta and Mahanta, 2012).
Pal et al. (2018) reported that parboiled samples were more yellow (higher
b values) and darker colour (lower L values) than non-parboiled rice when the initial
soaking temperature and steaming time was increased. The b value increased
steadily with increasing steaming time.
Xiaonan (2019) found that raw rice had an opaque appearance and the
parboiled rice showed a translucent amber colour on a study on the effect of ultra-
high pressure on quality characteristics of parboiled rice. Parboiled samples had
less L* values and higher a* and b* values.
2.6.4 Bulk density and true density
The behaviour of bulk density was tandem such that, it first decreased as the
degree of milling proceeded and later it increased due to the initial increase and
subsequent decrease in the amount of fat on the surface of the milled grain
(Bhattacharya, 1969). The bulk density and true density depended on the degree of
milling and the roundness of the grain.
The behaviour of the true density of the grain was different that it was
increased from 1208.71 kg/m3 to 1342.70 kg/m3 when the temperature of soaking
increases from 25 to 40°C and at 70°C, it was decreased to 1258.71 kg/m3. The
changes of true density was due to the increase in the mass of the grain with a
corresponding increase in the volumetric expansion (Kashaninejad et al., 2009).
Bulk density of non-parboiled rice was found to be 0.80 g/cm3 in a study of
hydration behaviour of non-parboiled milled rice used in Nigerian traditional
cuisine done by Danbaba et al. (2014). The study done by Anggi et al. (2016) noted
that parboiling had no significant effect on the bulk density of partially milled
parboiled rice. The keen observation on the physical properties of parboiled milled
21
rice over the entire range of degree of milling from 0 to 8% showed that as milling
progressed, the true density increased slightly due to the loss of lighter fat on the
milling process.
2.6.5 Chalkiness
Parboiling eradicates chalkiness and increases the grain translucency.
Gariboldi (1974) stated that the presence of white-bellied rice was due to the
incomplete parboiling resulting in lower milling yield. Parboiling helps in the
disruption of proteins and gelatinisation of starch. The gelatinised starch later
expand and occupy all the voids present in the endosperm and yields the
translucency of the paddy grain (Kondo, 2006). Grain translucency was the good
quality indicator of parboiled rice and it determines the grain appearance. For both
parboiled and non-parboiled rice, the low chalky score indicates better sensory
quality. Grain translucency was inversely proportional to the amount of chalkiness
(Manful, et al., 2008).
Quality indicators of the parboiled rice were translucency and chalkiness
and these both factors were inversely related. Raw milled rice having chalkiness
score five was reduced to ‘one’ when the paddy was parboiled and thus parboiling
increased the translucency of the endosperm (Fofana, 2011).
The coexistence of a porous structure in the chalky rice made it susceptible
to rupture and the presence of either a soft or hard texture during cooking resulting
in poor palatability of the cooked rice. So the rice grains having less than 5% degree
of endosperm chalkiness was referred to as low chalky grains (Zohoun et al. 2017).
Parboiling treatments reduced the percentage of chalkiness from 5.2% to less than
1% compared to the non-parboiled sample on increasing the initial soaking
temperature from 30 to 900C (Pal et al., 2018).
2.7 COOKING CHARACTERISTICS OF PARBOILED PADDY
Cooking quality is an important quality factor of parboiling. Higher market
price could be gained for the rice having good cooking quality. Parboiling
significantly impacts cooking characteristics such as cooking time, water uptake
22
ratio, gruel solid loss, grain elongation ratio and hardness during cooking. The
cooking process of parboiled rice consumes more time due to the change of starch
granules from crystalline to amorphous form which made the endosperm texture
more compact and translucent (Oli et al., 2014).
2.7.1 Cooking time
The cooking of parboiled rice took longer time to get the same degree of
softness compared to the raw rice of the same variety. Soaking treatments might
have resulted in the partial gelatinisation of starch which may affect the cooking
time. Sareepuang et al. (2008) found that soaking temperature had a great role in
reducing the cooking time and solid loss. Parboiling of paddy with an increase in
soaking temperature to 40, 50 and 60°C reduced the cooking time from 14.59 to
14.53 and 14.33 min respectively.
Graham et al. (2015) reported that the interaction between soaking
temperature and steaming time determines the cooking time. A steady increase in
cooking time was observed for a soaking temperature less than 60°C and remained
constant in between 60 and 70°C over a wide range of steaming time 5-15 min and
increased slightly when the steaming time proceeds more than 15 min. when the
soaking temperature exceeded 70°C, cooking time decreased from 23 to 21 min as
steaming time increased from 5 to 10 min and then levelled off.
Pal et al. (2018) stated that parboiled milled rice had a cooking time ranging
from 25 to 28 minute which was higher compared to the normal milled rice. This
might be because due to parboiled milled rice took more time to absorb the water
compared to the normal milled rice. Rockembach et al. (2019) evaluated the effect
of microwave irradiation used for rapid parboiling on the morphological and
physicochemical properties of rice grains and found that grains subjected to shortest
irradiation times had shorter cooking times which may be due to the rapid water
uptake caused by the rapid entry of water through the cracks and pores in the rice
grain.
23
2.7.2 Water uptake ratio
Hashemi et al. (2005) studied the effect of cooking properties of aromatic
rice with different drying air temperatures stated that the water uptake ratio
decreased with the increase of drying air temperature up to 500C and then increased
with increase in drying air temperature. Higher drying temperature attributed to the
separation of a particular size of starch from the kernels as residual loss.
Soaking temperature and soaking time had an effect on water uptake ratio
(WAR). Increase in the soaking temperature increased the water absorption rate due
to the decrease in diffusion resistance and due to the softening and expansion of
grains (Kashaninejad et al., 2007). The presence of cracks and high moisture
gradient at the initial stage of soaking resulted in a sharp initial increase in water
absorption rate. Patindol et al. (2008) stated that the water uptake ratio, volumetric
expansion ratio, and gruel solid loss decrease during cooking. Water uptake of
parboiled rice was higher than non-parboiled rice during cooking and it was mainly
a function of soaking temperature.
2.7.3 Grain elongation ratio
Oko et al. (2012) done study on the physicochemical properties of cooked
rice in the Nigeria state on different cultivar varieties and found that grain
elongation ratio of the cooked rice of different varieties ranged from 1.08-3.20 mm
with a mean value of 2.4±0.76 mm. The major characteristics of good rice were its
linear elongation during the cooking process. They stated that lengthwise expansion
without the increase in the breadth was considered to be a highly desirable quality
grain.
The study conducted by Pal et al. (2018) on the effect of parboiling on
phenolic, protein and pasting properties of rice from different paddy varieties
reported that parboiled milled rice had a grain elongation ratio ranging from 6.78
to 10.81 which was higher than the normal milled rice (3.57 to 8.21) ratio.
24
2.7.4 Hardness
The outcome of the study done by Islam et al. (2003) on the effect of
processing conditions on cooking qualities of parboiled rice showed that cooked
parboiled rice was harder and less sticky than cooked raw rice. Rather than the
cooking conditions, the drying conditions also greatly influenced the hardness of
parboiled grains.
Patindol et al. (2008) stated that parboiling increased the hardness and
decreased the stickiness of cooked rice. On cooking, parboiled rice became firmer
and less sticky than non-parboiled rice. Kernels having cracks and break gains more
water during parboiling causing higher softness in the cooked rice. The soaking
process affects the textural properties such as hardness, adhesiveness, cohesiveness,
gumminess, chewiness and springiness etc. The hardness as well as textural
properties of cooked rice had improved with an increase in soaking temperature
(Dutta and Mahanta, 2012).
The severity of the parboiling process increases the hardness of the cooked
rice. Cooked parboiled rice had a harder texture than non-parboiled rice. The
hardening of rice texture during cooking after a parboiling treatment was due to the
thermal degradation of starch during heat treatment and reassociation of gelatinised
starch after parboiling (Graham et al. 2015).
2.7.5 Gruel solid loss
Islam et al. (2001) reported that the gruel solid loss was depended on the
cohesion of cooked parboiled rice. They were negatively correlated. High cohesion
value led to a less sticky final product. This was due to the greater cohesion between
the protein bodies and starch granules during parboiling.
Parboiling enabled the diffusion of water-soluble vitamins and nutrients into
the endosperm and thus polishing of the parboiled rice didn’t enable the loss of
nutrients. The number of solutes leached into cooking water of raw milled rice was
significantly higher than parboiled milled rice because of hydrothermal treatment.
Parboiling resulted in a decrease in solubilisation of starch into cooking water (Pal
25
et al. 2018). The loss of solids in cooking water of the parboiled samples were in
between 0.01 and 1.05g with a mean value of 0.23±0.25 (Rockembach et al., 2019).
2.8 OPTIMISATION OF PARBOILING PROCESS USING RESPONSE
SURFACE METHODOLOGY
Bas and Boyaci (2007) stated that Response Surface Methodology (RSM)
is a appropriate statistic technique widely used in the optimisation of food
processes. This approach is useful for optimising, designing, developing, and
improving processes where a response or responses are affected by several
variables.
Danbaba et al. (2014) used the Response Surface Methodology (RSM) to
study the effect of soaking temperature (X1 = 50, 60, and 70℃), steaming time
(X2 = 30, 40 and 50 min) and drying time (X3 = 10, 15 and 20 h) on head rice yield
of parboiled paddy. Head rice yield of 78.89% was predicted for the optimum
process condition such as X1 = 76.82℃, X2 = 23.18 min and X3 = 11.70 h. The study
showed that the drying time, quadratic coefficients of X1, X3 and interaction
coefficient X1X3 and X2X3 significant. RSM could be used to optimise the head rice
recovery.
Yousaf et al. (2017) optimized the hydrothermal processing conditions of
parboiling technique using RSM. Soaking temperature of 69.88℃, soaking time of
150 min and steaming time of 6.73 min were obtained as the optimised treatment
combination for the predicted 73.43% HRY, 29.85 N hardness and 32.14 min
cooking time with a composite desirability of 0.9658.
RSM could be used to determine the optimal conditions for the drying
process based on several process responses such as water loss, solid grain, final
moisture, colour and rehydration ratio. The statistical approach using RSM involves
randomization, RSM modelling graphical presentation, modelling validity criteria
26
and validation of predicted optimum conditions adequately (Yolmeh and Jafari,
2017).
Ogunbiyi et al. (2018) optimised parboiling process using Response surface
methodology with parboiling conditions such as the initial soaking temperature
(IST), Soaking Time (ST) and the final moisture content (FMC) before the milling
stage. The RSM optimised the parboiling conditions as 67.7℃ IST, 13h 8 min ST
and 12.7% FMC. These optimal conditions were expected to produce the parboiled
milled rice with 70% Head Rice Yield, 74.7 N grain hardness and a colour value of
25.8.
2.9 COST ECONOMICS
Mishra and Das (2004) developed a CRRI mini modern paddy parboiling
unit. It consists of a cylinder having two chambers separated by a perforated
partition for soaking and steaming. The paddy undergone sun drying to reach the
final moisture content 14%. The processing cost for parboiling 100 kg paddy in the
mimi plant is calculated Rs. 30/- which was less by Rs. 10/- compared to traditional
practice.
Roy et al. (2006) done a cost analysis of local parboiling processes practised
in Malda district of West Bengal using in vessel, small boiler and medium boiler.
The cost analysis was determined based on the net present worth (NPW), payback
period and internal rate of return The head rice yield was measured and its market
value was assessed by a questionnaire. The parboiled rice produced under boiler
process had a higher market value, but it required greater initial investment. The
medium boiler consumed the lowest amount of energy compared to others. The
local parboiling process could be improved in terms of energy consumption and
market value of the rice by adopting the medium boiler process.
Shwetha et al. (2011), found that the total processing cost of paddy per
quintal in Davangare district of Karnataka during 2005-’06 to 2009-’10 was
Rs. 127.00 and Rs. 196.40 for traditional and modern mills respectively. Compared
27
to the modern rice mills, the cost of paddy processing in the traditional mills was
almost 35% less.
Singha (2012) stated that the major share of paddy was processed by modern
rice mills. The mill owners and farmers are made aware of the benefits of producing
parboiled rice because it generates greater out-turn ratio compared to non-parboiled
rice and the existing hullers be upgraded to modern hullers. It was slightly
inconvenient for the individual farmers to go for parboiling before processing
because small quantities or subsistence level paddy is processed in rural areas.


MATERIALS AND METHODS

28
Chapter III
MATERIALS AND METHODS
This research work was carried to develop a small scale parboiling cum
drying unit for paddy processing. This chapter describes the materials and methods
adopted for the fabrication and development of the above-said unit. Process
parameters adopted and methodologies used for the quality evaluation of the milled
and cooked rice are also affixed here.
3.1 DEVELOPMENT OF PARBOILING CUM DRYING UNIT
The components of the paddy parboiling cum drying unit consists of two
cylindrical chambers having 100 kg capacity for the soaking cum steaming process,
an LSU (Lousiana State University) dryer (200 kg/batch), bucket elevator, steam
boiler, air blower and heating furnace. The soaking and steaming process of the
paddy was done in the cylindrical chamber and the steam required for the steaming
was provided by the steam boiler by firing the wood. The steamed paddy was
conveyed to the bucket elevator via replaceable rectangular channel. The bucket
elevator brought the paddy into the LSU dryer and the circulation continued until
the parboiled paddy reached 13% moisture content. The continuous mixing type
LSU dryer with inverted Vshaped channels was designed with capacity of 200
kg/batch and the heat required for the drying was provided through the heating
furnace. The blower fan was provided to enhance the convective heat transfer inside
the drying chamber. The parboiling cum drying unit was fabricated using SS 304
material.
3.2 SPECIFICATIONS OF THE PARBOILING CUM DRYING UNIT
The different components of the paddy parboiling unit are
• Soaking cum steaming chamber
• LSU dryer
• Bucket elevator
• Steam boiler
29
• Heat furnace
• Air blower
The detailed specifications of the unit are computed in the table 3.1 and its
isometric view, front view, right side view and top view are given in the Fig. 3.1,
3.2, 3.3 and 3.4 respectively.
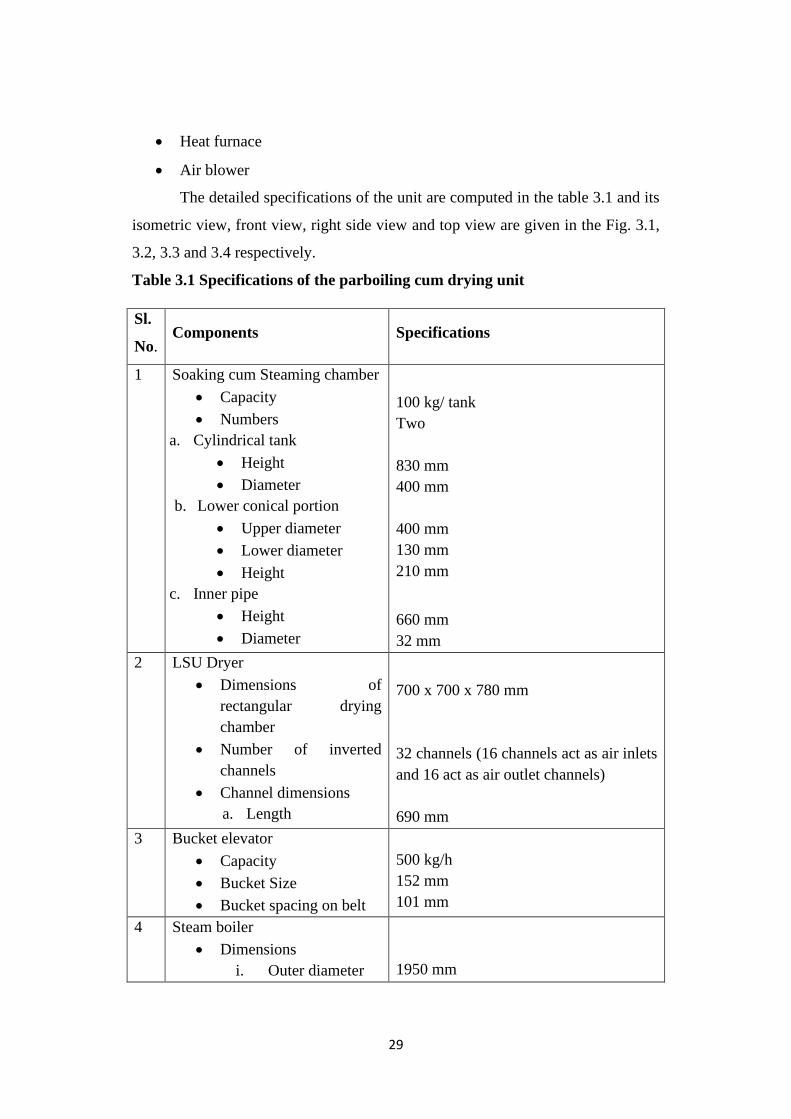
Table 3.1 Specifications of the parboiling cum drying unit
Sl.
No. Components Specifications
1 Soaking cum Steaming chamber
• Capacity
• Numbers
a. Cylindrical tank
• Height
• Diameter
b. Lower conical portion
• Upper diameter
• Lower diameter
• Height
c. Inner pipe
• Height
• Diameter
100 kg/ tank
Two
830 mm
400 mm
400 mm
130 mm
210 mm
660 mm
32 mm
2 LSU Dryer
• Dimensions of
rectangular drying
chamber
• Number of inverted
channels
• Channel dimensions
a. Length
700 x 700 x 780 mm
32 channels (16 channels act as air inlets
and 16 act as air outlet channels)
690 mm
3 Bucket elevator
• Capacity
• Bucket Size
• Bucket spacing on belt
500 kg/h
152 mm
101 mm
4 Steam boiler
• Dimensions
i. Outer diameter
1950 mm
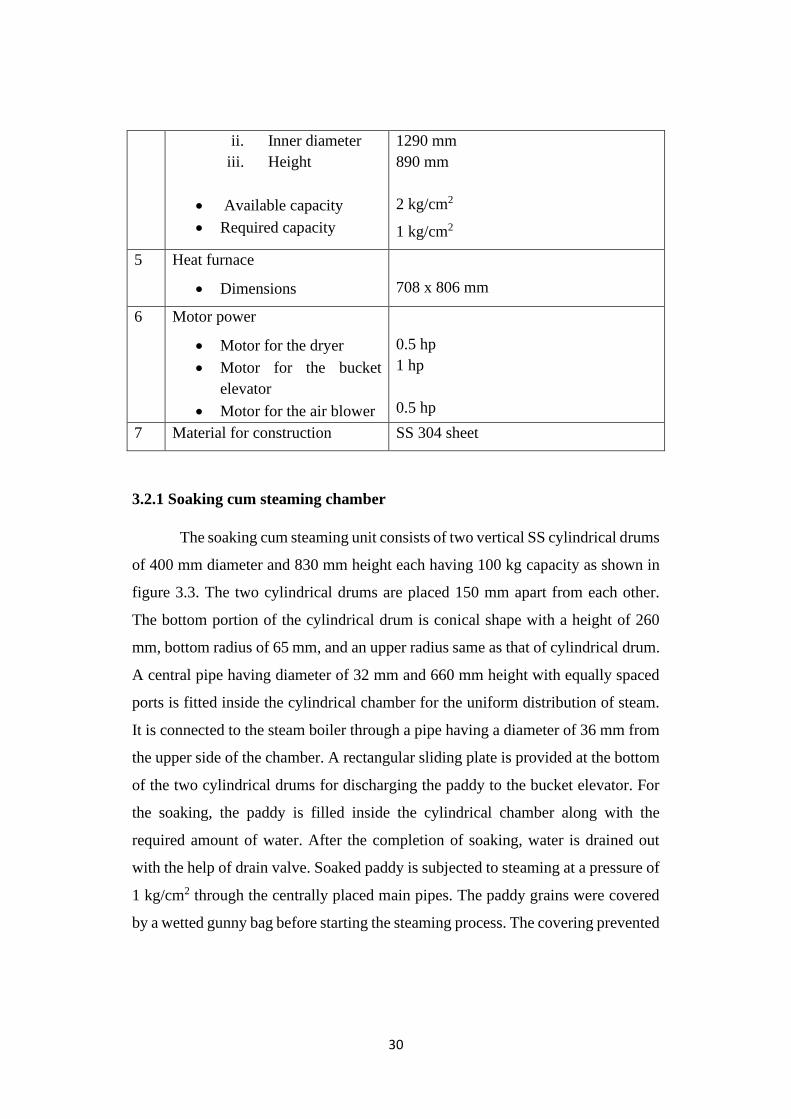
30
ii. Inner diameter
iii. Height
• Available capacity
• Required capacity
1290 mm
890 mm
2 kg/cm2
1 kg/cm2
5 Heat furnace
• Dimensions
708 x 806 mm
6 Motor power
• Motor for the dryer
• Motor for the bucket
elevator
• Motor for the air blower
0.5 hp
1 hp
0.5 hp
7 Material for construction SS 304 sheet
3.2.1 Soaking cum steaming chamber
The soaking cum steaming unit consists of two vertical SS cylindrical drums
of 400 mm diameter and 830 mm height each having 100 kg capacity as shown in
figure 3.3. The two cylindrical drums are placed 150 mm apart from each other.
The bottom portion of the cylindrical drum is conical shape with a height of 260
mm, bottom radius of 65 mm, and an upper radius same as that of cylindrical drum.
A central pipe having diameter of 32 mm and 660 mm height with equally spaced
ports is fitted inside the cylindrical chamber for the uniform distribution of steam.
It is connected to the steam boiler through a pipe having a diameter of 36 mm from
the upper side of the chamber. A rectangular sliding plate is provided at the bottom
of the two cylindrical drums for discharging the paddy to the bucket elevator. For
the soaking, the paddy is filled inside the cylindrical chamber along with the
required amount of water. After the completion of soaking, water is drained out
with the help of drain valve. Soaked paddy is subjected to steaming at a pressure of
1 kg/cm2 through the centrally placed main pipes. The paddy grains were covered
by a wetted gunny bag before starting the steaming process. The covering prevented
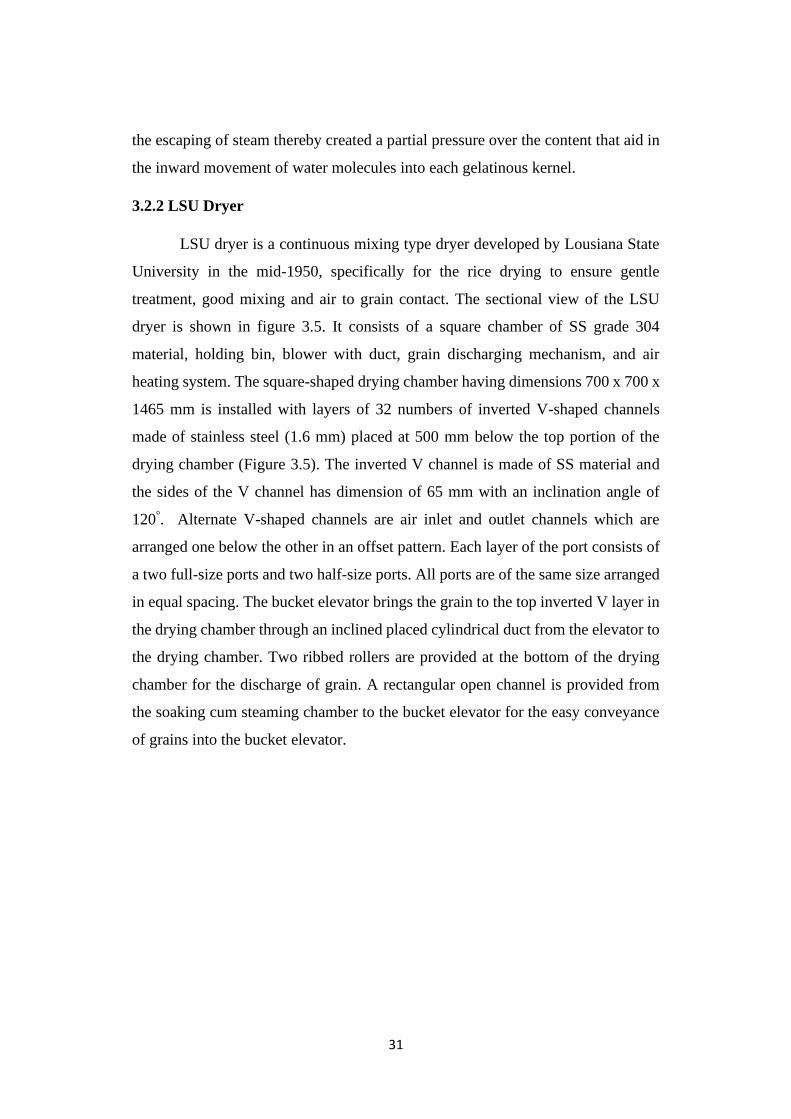
31
the escaping of steam thereby created a partial pressure over the content that aid in
the inward movement of water molecules into each gelatinous kernel.
3.2.2 LSU Dryer
LSU dryer is a continuous mixing type dryer developed by Lousiana State
University in the mid-1950, specifically for the rice drying to ensure gentle
treatment, good mixing and air to grain contact. The sectional view of the LSU
dryer is shown in figure 3.5. It consists of a square chamber of SS grade 304
material, holding bin, blower with duct, grain discharging mechanism, and air
heating system. The square-shaped drying chamber having dimensions 700 x 700 x
1465 mm is installed with layers of 32 numbers of inverted V-shaped channels
made of stainless steel (1.6 mm) placed at 500 mm below the top portion of the
drying chamber (Figure 3.5). The inverted V channel is made of SS material and
the sides of the V channel has dimension of 65 mm with an inclination angle of
120°. Alternate V-shaped channels are air inlet and outlet channels which are
arranged one below the other in an offset pattern. Each layer of the port consists of
a two full-size ports and two half-size ports. All ports are of the same size arranged
in equal spacing. The bucket elevator brings the grain to the top inverted V layer in
the drying chamber through an inclined placed cylindrical duct from the elevator to
the drying chamber. Two ribbed rollers are provided at the bottom of the drying
chamber for the discharge of grain. A rectangular open channel is provided from
the soaking cum steaming chamber to the bucket elevator for the easy conveyance
of grains into the bucket elevator.
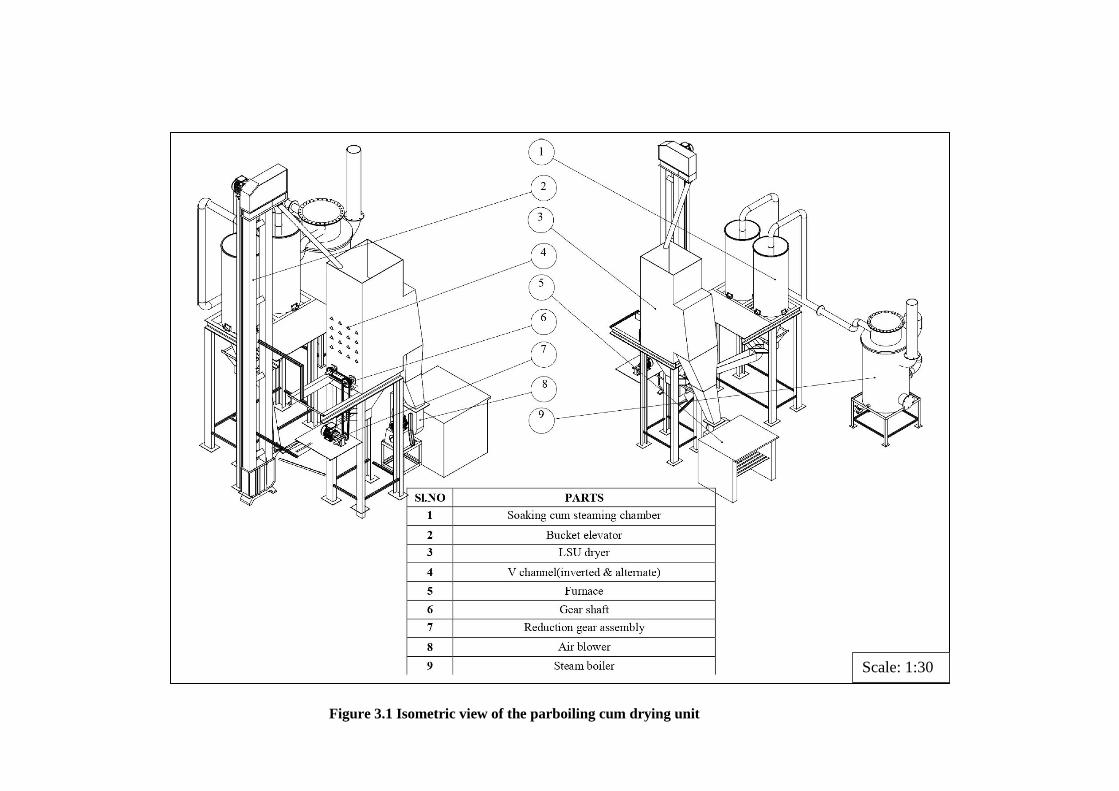
32
Figure 3.1 Isometric view of the parboiling cum drying unit
Scale: 1:30
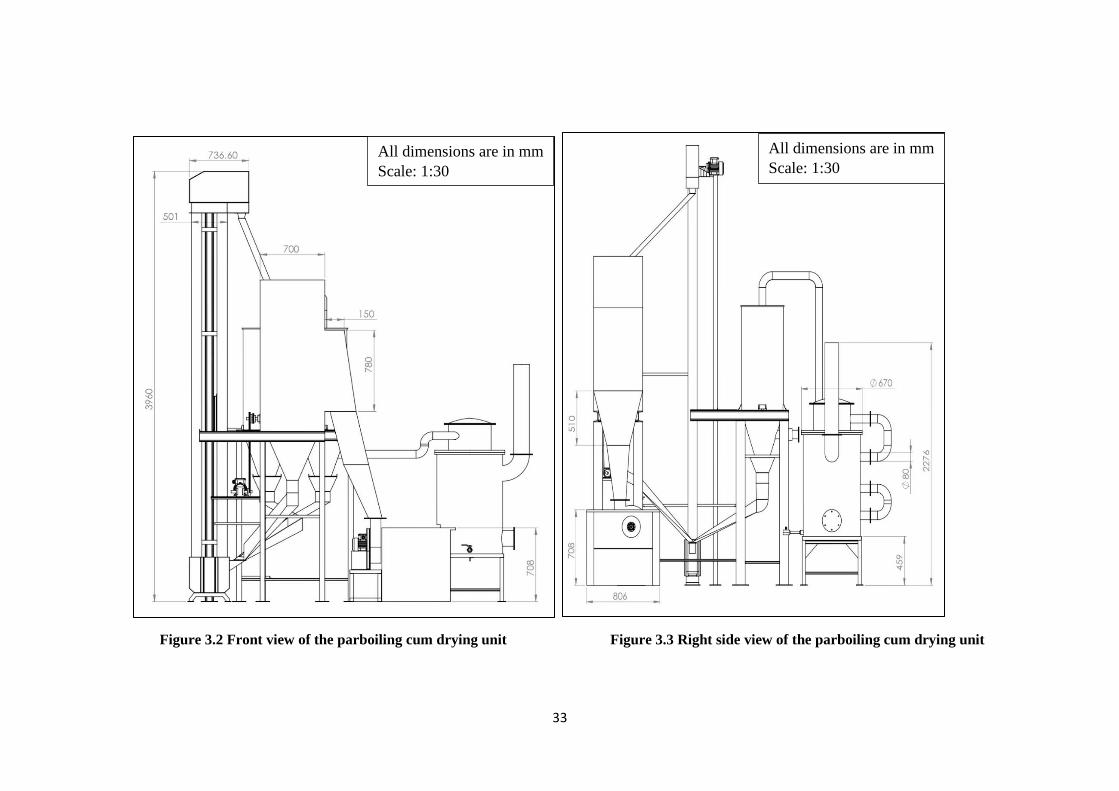
33
Figure 3.2 Front view of the parboiling cum drying unit Figure 3.3 Right side view of the parboiling cum drying unit
All dimensions are in mm
Scale: 1:30
All dimensions are in mm
Scale: 1:30
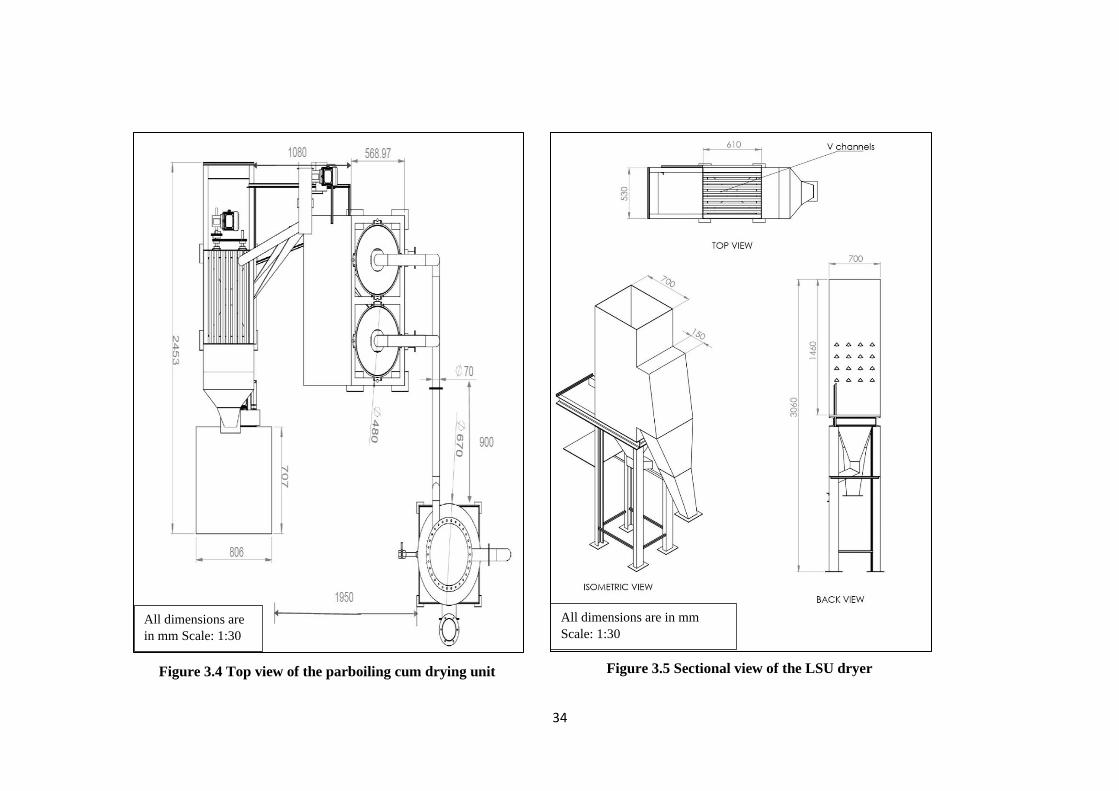
34
Figure 3.5 Sectional view of the LSU dryer
All dimensions are in mm
Scale: 1:30 All dimensions are
in mm Scale: 1:30
Figure 3.4 Top view of the parboiling cum drying unit
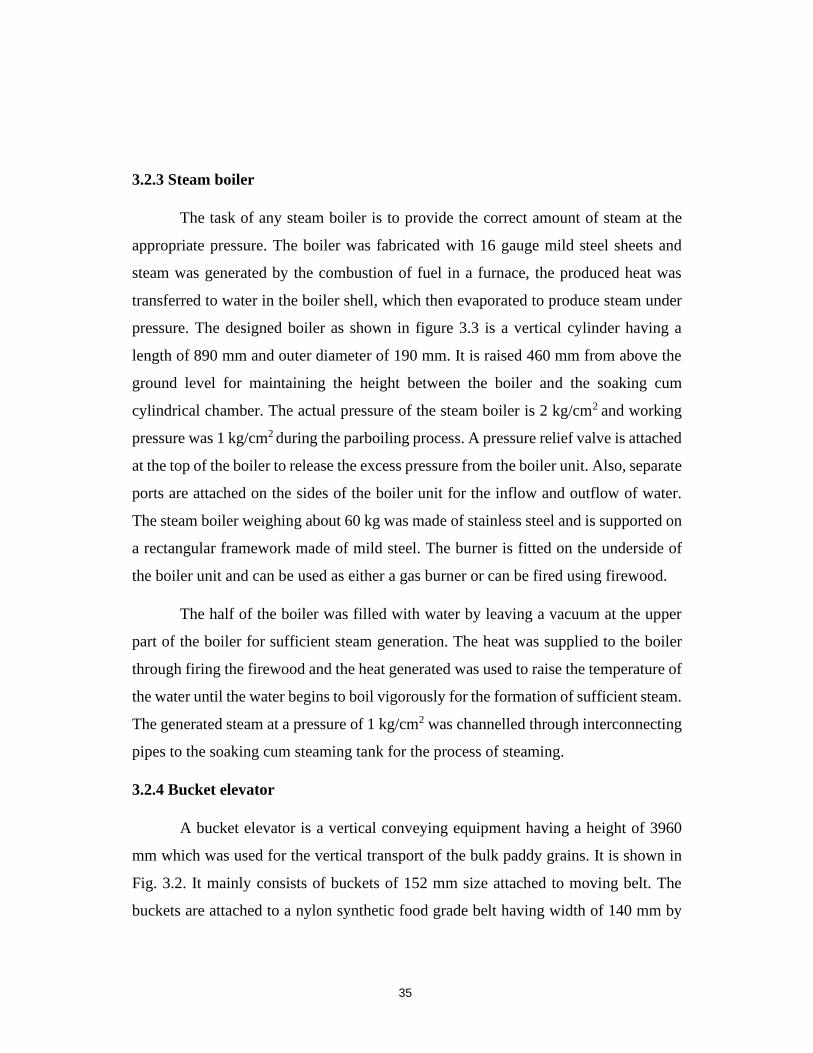
3.2.3 Steam boiler
The task of any steam boiler is to provide the correct amount of steam at the
appropriate pressure. The boiler was fabricated with 16 gauge mild steel sheets and
steam was generated by the combustion of fuel in a furnace, the produced heat was
transferred to water in the boiler shell, which then evaporated to produce steam under
pressure. The designed boiler as shown in figure 3.3 is a vertical cylinder having a
length of 890 mm and outer diameter of 190 mm. It is raised 460 mm from above the
ground level for maintaining the height between the boiler and the soaking cum
cylindrical chamber. The actual pressure of the steam boiler is 2 kg/cm2 and working
pressure was 1 kg/cm2 during the parboiling process. A pressure relief valve is attached
at the top of the boiler to release the excess pressure from the boiler unit. Also, separate
ports are attached on the sides of the boiler unit for the inflow and outflow of water.
The steam boiler weighing about 60 kg was made of stainless steel and is supported on
a rectangular framework made of mild steel. The burner is fitted on the underside of
the boiler unit and can be used as either a gas burner or can be fired using firewood.
The half of the boiler was filled with water by leaving a vacuum at the upper
part of the boiler for sufficient steam generation. The heat was supplied to the boiler
through firing the firewood and the heat generated was used to raise the temperature of
the water until the water begins to boil vigorously for the formation of sufficient steam.
The generated steam at a pressure of 1 kg/cm2 was channelled through interconnecting
pipes to the soaking cum steaming tank for the process of steaming.
3.2.4 Bucket elevator
A bucket elevator is a vertical conveying equipment having a height of 3960
mm which was used for the vertical transport of the bulk paddy grains. It is shown in
Fig. 3.2. It mainly consists of buckets of 152 mm size attached to moving belt. The
buckets are attached to a nylon synthetic food grade belt having width of 140 mm by
35
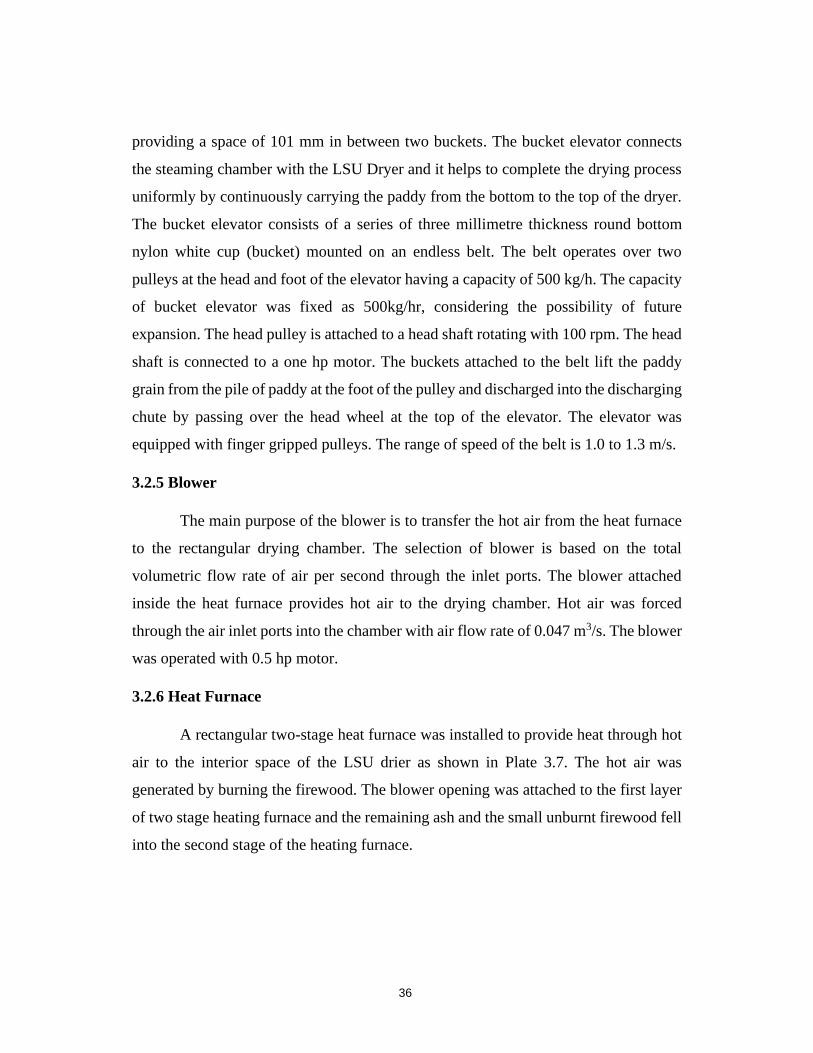
providing a space of 101 mm in between two buckets. The bucket elevator connects
the steaming chamber with the LSU Dryer and it helps to complete the drying process
uniformly by continuously carrying the paddy from the bottom to the top of the dryer.
The bucket elevator consists of a series of three millimetre thickness round bottom
nylon white cup (bucket) mounted on an endless belt. The belt operates over two
pulleys at the head and foot of the elevator having a capacity of 500 kg/h. The capacity
of bucket elevator was fixed as 500kg/hr, considering the possibility of future
expansion. The head pulley is attached to a head shaft rotating with 100 rpm. The head
shaft is connected to a one hp motor. The buckets attached to the belt lift the paddy
grain from the pile of paddy at the foot of the pulley and discharged into the discharging
chute by passing over the head wheel at the top of the elevator. The elevator was
equipped with finger gripped pulleys. The range of speed of the belt is 1.0 to 1.3 m/s.
3.2.5 Blower
The main purpose of the blower is to transfer the hot air from the heat furnace
to the rectangular drying chamber. The selection of blower is based on the total
volumetric flow rate of air per second through the inlet ports. The blower attached
inside the heat furnace provides hot air to the drying chamber. Hot air was forced
through the air inlet ports into the chamber with air flow rate of 0.047 m3/s. The blower
was operated with 0.5 hp motor.
3.2.6 Heat Furnace
A rectangular two-stage heat furnace was installed to provide heat through hot
air to the interior space of the LSU drier as shown in Plate 3.7. The hot air was
generated by burning the firewood. The blower opening was attached to the first layer
of two stage heating furnace and the remaining ash and the small unburnt firewood fell
into the second stage of the heating furnace.
36
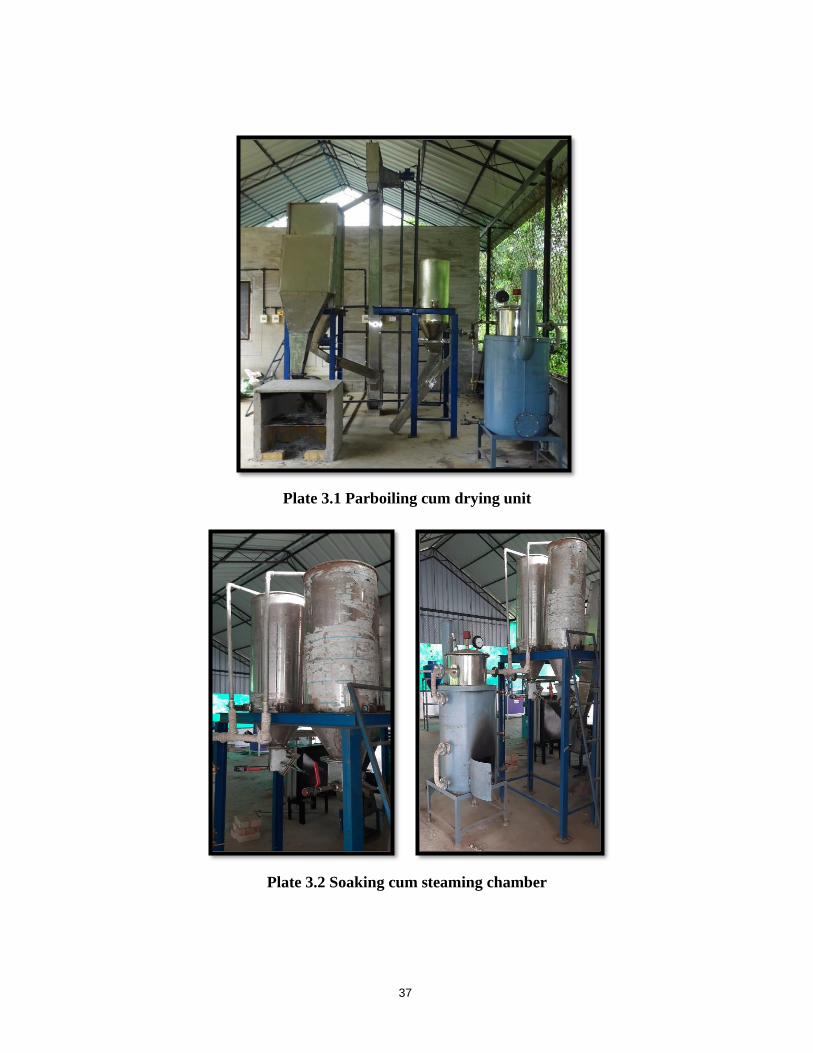
Plate 3.1 Parboiling cum drying unit
Plate 3.2 Soaking cum steaming chamber
37
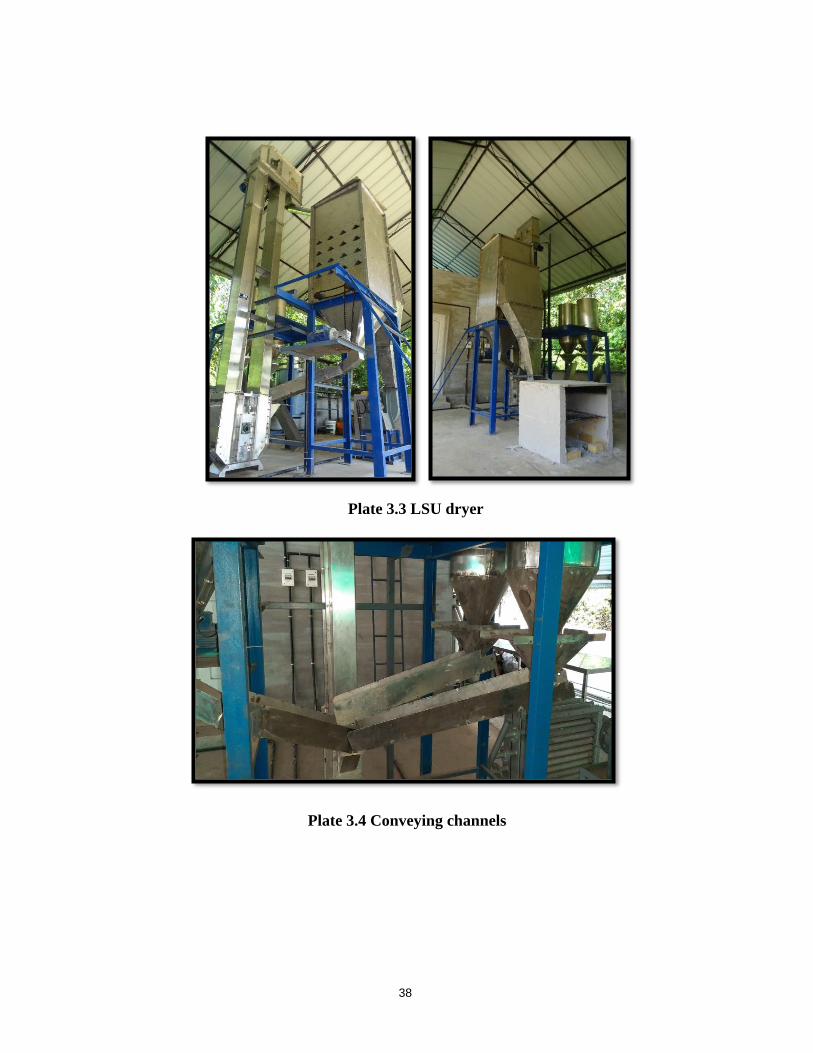
Plate 3.4 Conveying channels
Plate 3.3 LSU dryer
38
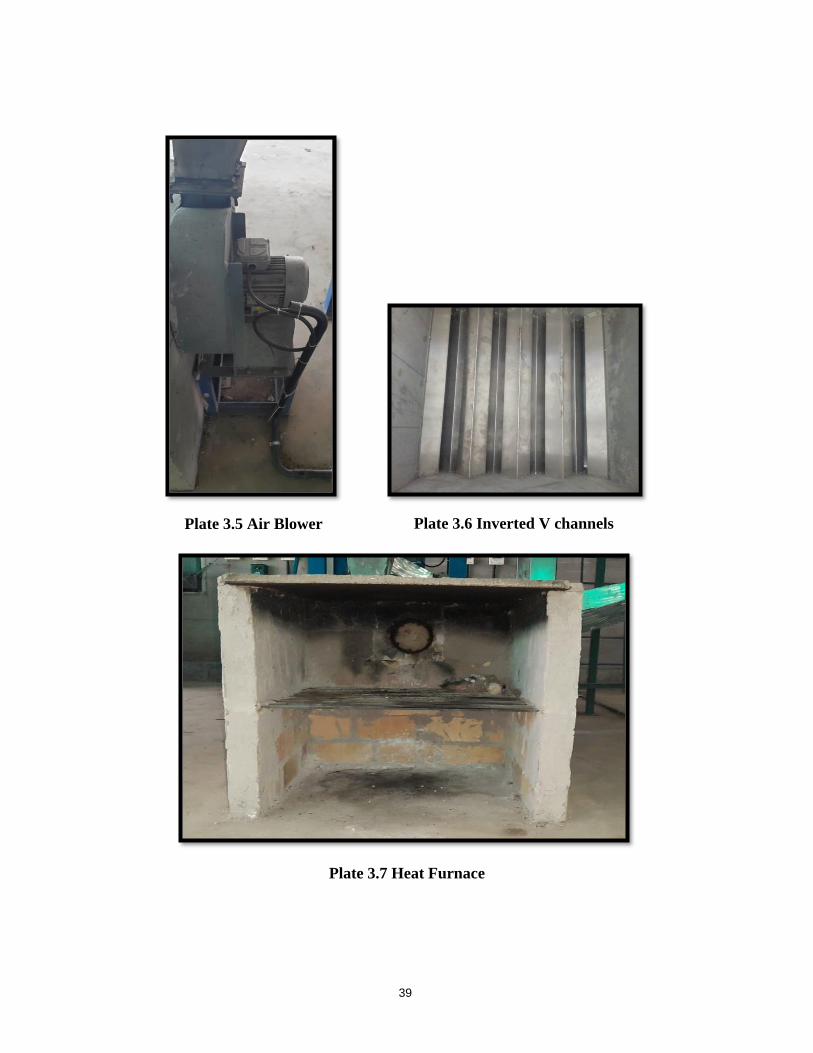
Plate 3.5 Air Blower Plate 3.6 Inverted V channels
Plate 3.7 Heat Furnace
39
3.3 PERFORMANCE EVALUATION OF DEVELOPED PARBOILING CUM
DRYING UNIT
The performance of the developed parboiling cum drying unit was evaluated
by comparing the milling and cooking qualities of the paddy. Parboiling was carried
out at three different soaking time, steaming time and drying temperatures.
Milling qualities of parboiled rice such as, milling efficiency, head rice yield,
hardness, colour, bulk density, true density and chalkiness, cooking qualities such as
cooking time, water uptake ratio, gruel solid loss, grain elongation ratio and hardness
of cooked rice were evaluated.
3.3.1 Raw Material Procurement
Properly cleaned paddy of crop variety Jyothi was procured from the
Department of Seed Science and Technology, College of Horticulture, Kerala
Agriculture University, Thrissur. The collected sample was washed with water for
removing the stones and debris before starting the trials.
3.4 STANDARDISATION OF SOAKING TIME, STEAMING TIME AND DRYING
TEMPERATURE
The three major steps of parboiling are soaking, steaming and drying. The
quality of the parboiled paddy depends mainly on these three parameters. Soaking helps
to achieve uniform hydration in the paddy grain. Traditionally the soaking was carried
in cold water for two to three days. As this could cause an off flavour for the soaked
paddy, the duration of soaking was reduced by rising the temperature of soaking water
(Igathinathane et al., 2005). In addition, since soaking of paddy at 75°C (CFTRI
Method) and allowing the paddy to cool naturally ensured the fastest possible hydration
without complication (Sahay and Singh, 2001), two methods of soaking, ie., hot
soaking and cold soaking were followed in this study. The process flow chart for the
40
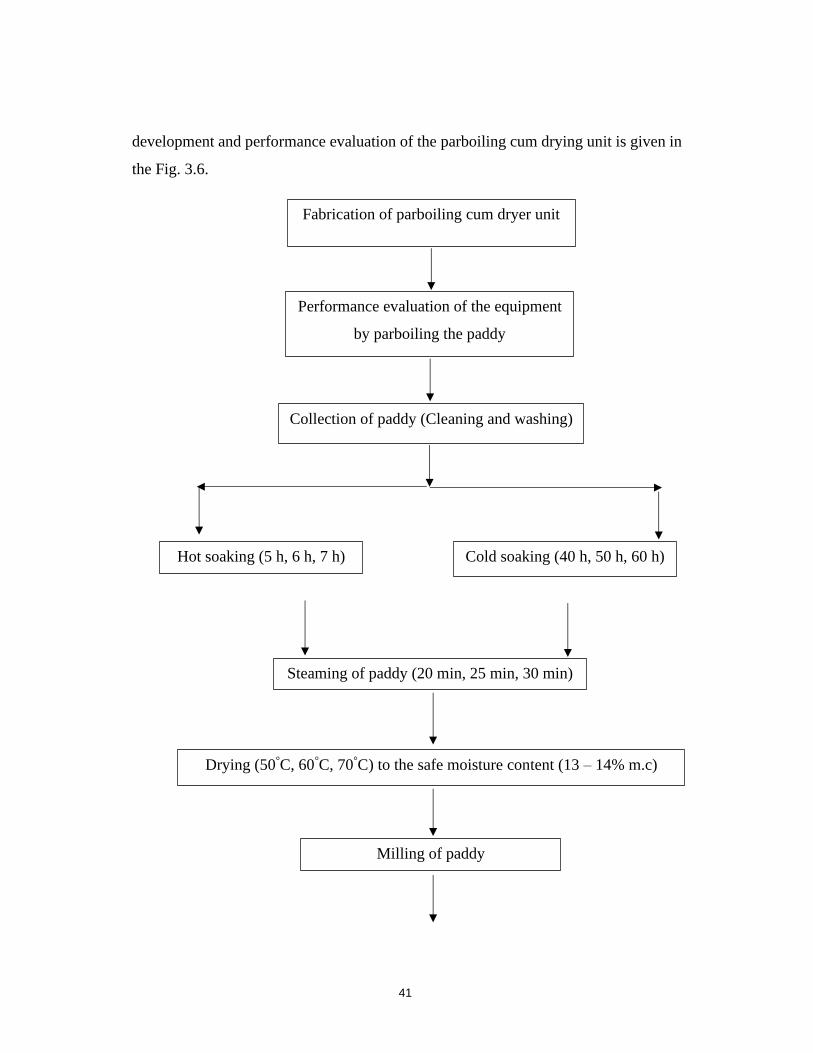
development and performance evaluation of the parboiling cum drying unit is given in
the Fig. 3.6.
Fabrication of parboiling cum dryer unit
Performance evaluation of the equipment
by parboiling the paddy
Collection of paddy (Cleaning and washing)
Hot soaking (5 h, 6 h, 7 h)
Cold soaking (40 h, 50 h, 60 h)
Steaming of paddy (20 min, 25 min, 30 min)
Drying (50°C, 60°C, 70°C) to the safe moisture content (13 – 14% m.c)
Milling of paddy
41
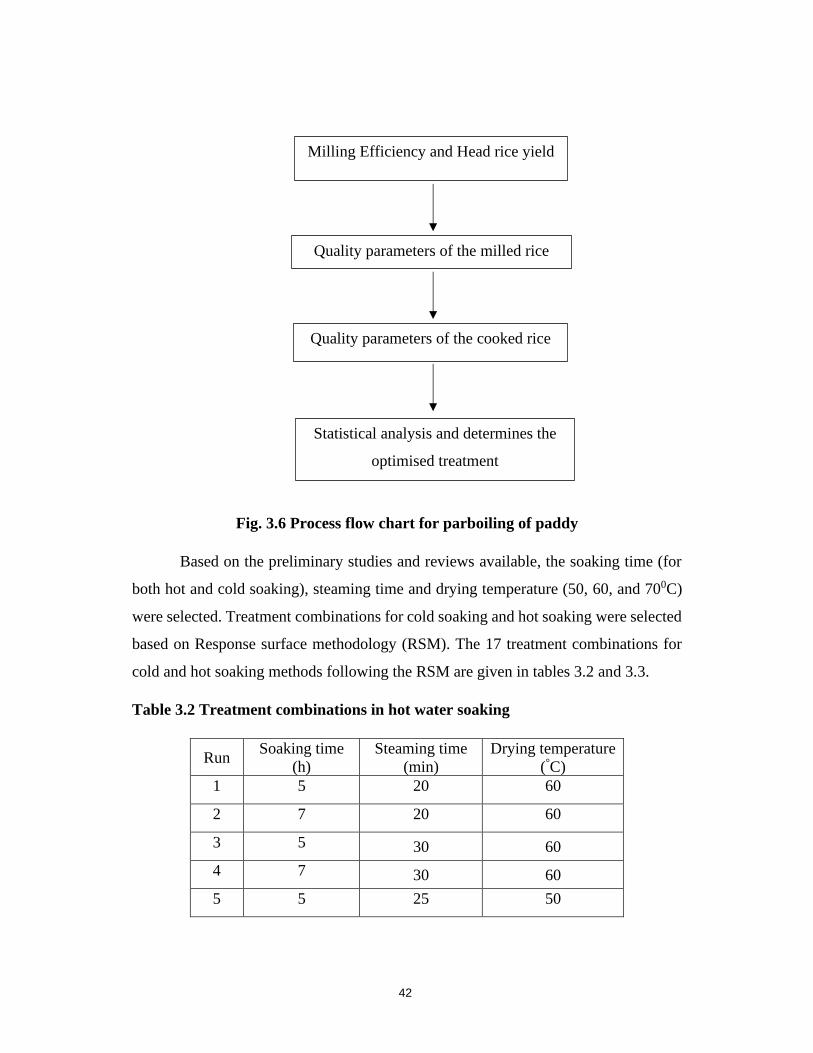
Fig. 3.6 Process flow chart for parboiling of paddy
Based on the preliminary studies and reviews available, the soaking time (for
both hot and cold soaking), steaming time and drying temperature (50, 60, and 700C)
were selected. Treatment combinations for cold soaking and hot soaking were selected
based on Response surface methodology (RSM). The 17 treatment combinations for
cold and hot soaking methods following the RSM are given in tables 3.2 and 3.3.
Table 3.2 Treatment combinations in hot water soaking
Run Soaking time
(h)
Steaming time
(min)
Drying temperature
(°C)
1 5 20 60
2 7 20 60
3 5 30 60
4 7 30 60
5 5 25 50
Quality parameters of the milled rice
Milling Efficiency and Head rice yield
Quality parameters of the cooked rice
Statistical analysis and determines the
optimised treatment
42
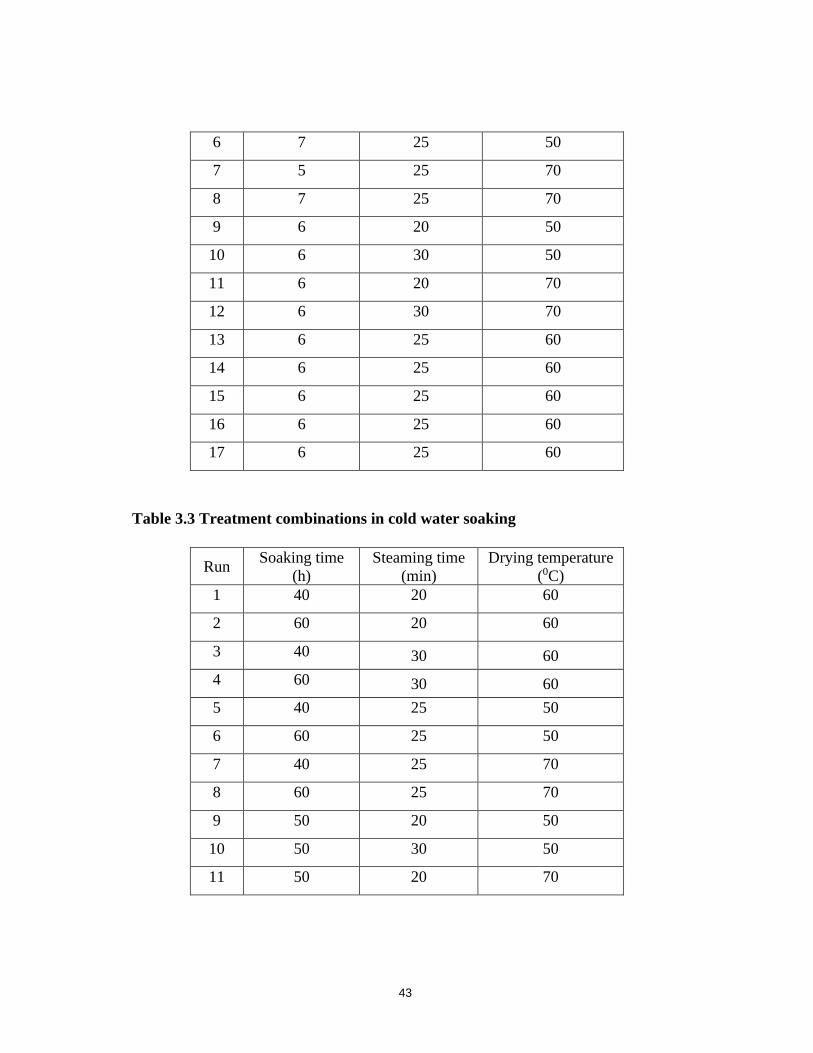
6 7 25 50
7 5 25 70
8 7 25 70
9 6 20 50
10 6 30 50
11 6 20 70
12 6 30 70
13 6 25 60
14 6 25 60
15 6 25 60
16 6 25 60
17 6 25 60
Table 3.3 Treatment combinations in cold water soaking
Run Soaking time
(h)
Steaming time
(min)
Drying temperature
(0C)
1 40 20 60
2 60 20 60
3 40 30 60
4 60 30 60
5 40 25 50
6 60 25 50
7 40 25 70
8 60 25 70
9 50 20 50
10 50 30 50
11 50 20 70
43
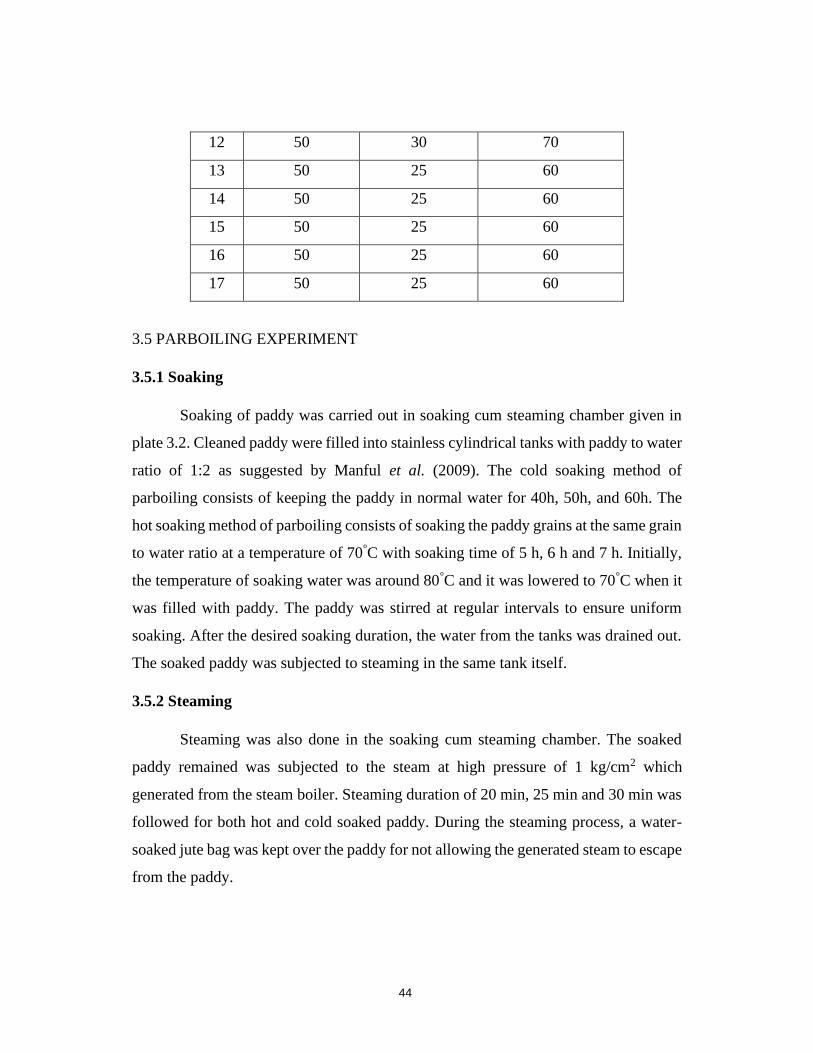
12 50 30 70
13 50 25 60
14 50 25 60
15 50 25 60
16 50 25 60
17 50 25 60
3.5 PARBOILING EXPERIMENT
3.5.1 Soaking
Soaking of paddy was carried out in soaking cum steaming chamber given in
plate 3.2. Cleaned paddy were filled into stainless cylindrical tanks with paddy to water
ratio of 1:2 as suggested by Manful et al. (2009). The cold soaking method of
parboiling consists of keeping the paddy in normal water for 40h, 50h, and 60h. The
hot soaking method of parboiling consists of soaking the paddy grains at the same grain
to water ratio at a temperature of 70°C with soaking time of 5 h, 6 h and 7 h. Initially,
the temperature of soaking water was around 80°C and it was lowered to 70°C when it
was filled with paddy. The paddy was stirred at regular intervals to ensure uniform
soaking. After the desired soaking duration, the water from the tanks was drained out.
The soaked paddy was subjected to steaming in the same tank itself.
3.5.2 Steaming
Steaming was also done in the soaking cum steaming chamber. The soaked
paddy remained was subjected to the steam at high pressure of 1 kg/cm2 which
generated from the steam boiler. Steaming duration of 20 min, 25 min and 30 min was
followed for both hot and cold soaked paddy. During the steaming process, a water-
soaked jute bag was kept over the paddy for not allowing the generated steam to escape
from the paddy.
44
3.5.3 Drying
The steamed paddy was conveyed into the LSU dryer for drying it to the safe
moisture content required for milling through bucket elevator. The elevator conveyed
the paddy into the holding bin of the LSU dryer. This paddy passed through the layers
of inverted V-shaped channels installed in the drying chamber. The grain discharge
was done through the action of ribbed rollers provided at the bottom of the drying
chamber. The hot air from the husk fired heat furnace entered into the drying chamber
through a blower. The alternate layers of V channels act as air inlet and outlet channels.
The temperature of heated air from the furnace gets reduced when it enter the drying
chamber through the inlet ports and it was used for the drying of paddy grains. The hot
air from the dryer was exhausted through the alternate layers of outlet ports. The paddy
was recirculated through the bucket elevator to achieve desired moisture content for
milling. The moisture content of paddy was tested by using universal soil moisture
meter.
The variable involved in the drying was the temperature of hot air. The main
drawback of firewood heating furnace was control of temperature. Hence, it was
difficult to determine the best temperature for drying of parboiled paddy. Therefore,
drying step was carried out in the hot air convection type dryer at different temperature.
After optimizing the temperature for drying, the final experiment was conducted with
the LSU dryer.
3.5.4 Milling of the parboiled paddy
Rice milling is the process of producing the white rice by removing the husk
and bran layer. In the present study, the parboiled paddy was subjected to milling
process with a laboratory-scale huller ( Model MRM04 Maruthi Engineering works)
having a capacity of 100 kg/h. Paddy milling yields, milled rice from main outlet and
mixture of bran and outer husk in another outlet. Milled parboiled rice was used for
quality evaluation.
45
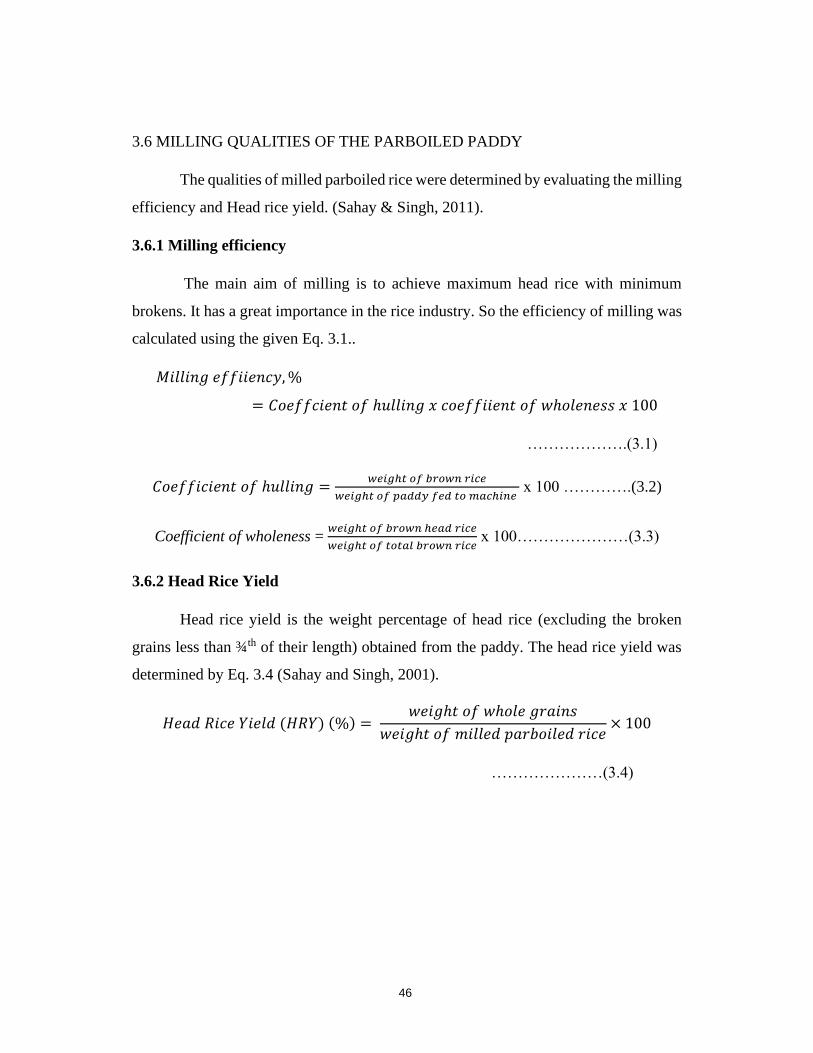
3.6 MILLING QUALITIES OF THE PARBOILED PADDY
The qualities of milled parboiled rice were determined by evaluating the milling
efficiency and Head rice yield. (Sahay & Singh, 2011).
3.6.1 Milling efficiency
The main aim of milling is to achieve maximum head rice with minimum
brokens. It has a great importance in the rice industry. So the efficiency of milling was
calculated using the given Eq. 3.1..
𝑀𝑖𝑙𝑙𝑖𝑛𝑔 𝑒𝑓𝑓𝑖𝑖𝑒𝑛𝑐𝑦, %
= 𝐶𝑜𝑒𝑓𝑓𝑐𝑖𝑒𝑛𝑡 𝑜𝑓 ℎ𝑢𝑙𝑙𝑖𝑛𝑔 𝑥 𝑐𝑜𝑒𝑓𝑓𝑖𝑖𝑒𝑛𝑡 𝑜𝑓 𝑤ℎ𝑜𝑙𝑒𝑛𝑒𝑠𝑠 𝑥 100
……………….(3.1)
𝐶𝑜𝑒𝑓𝑓𝑖𝑐𝑖𝑒𝑛𝑡 𝑜𝑓 ℎ𝑢𝑙𝑙𝑖𝑛𝑔 =𝑤𝑒𝑖𝑔ℎ𝑡 𝑜𝑓 𝑏𝑟𝑜𝑤𝑛 𝑟𝑖𝑐𝑒
𝑤𝑒𝑖𝑔ℎ𝑡 𝑜𝑓 𝑝𝑎𝑑𝑑𝑦 𝑓𝑒𝑑 𝑡𝑜 𝑚𝑎𝑐ℎ𝑖𝑛𝑒 x 100 ………….(3.2)
Coefficient of wholeness = 𝑤𝑒𝑖𝑔ℎ𝑡 𝑜𝑓 𝑏𝑟𝑜𝑤𝑛 ℎ𝑒𝑎𝑑 𝑟𝑖𝑐𝑒
𝑤𝑒𝑖𝑔ℎ𝑡 𝑜𝑓 𝑡𝑜𝑡𝑎𝑙 𝑏𝑟𝑜𝑤𝑛 𝑟𝑖𝑐𝑒 x 100…………………(3.3)
3.6.2 Head Rice Yield
Head rice yield is the weight percentage of head rice (excluding the broken
grains less than ¾th of their length) obtained from the paddy. The head rice yield was
determined by Eq. 3.4 (Sahay and Singh, 2001).
𝐻𝑒𝑎𝑑 𝑅𝑖𝑐𝑒 𝑌𝑖𝑒𝑙𝑑 (𝐻𝑅𝑌) (%) = 𝑤𝑒𝑖𝑔ℎ𝑡 𝑜𝑓 𝑤ℎ𝑜𝑙𝑒 𝑔𝑟𝑎𝑖𝑛𝑠
𝑤𝑒𝑖𝑔ℎ𝑡 𝑜𝑓 𝑚𝑖𝑙𝑙𝑒𝑑 𝑝𝑎𝑟𝑏𝑜𝑖𝑙𝑒𝑑 𝑟𝑖𝑐𝑒× 100
…………………(3.4)
46
3.6.3 Hardness of milled parboiled rice
The method suggested by Islam et al.(2002) was followed for evaluating the
hardness of milled parboiled rice. Six grains of parboiled rice were randomly selected
and the hardness of the uncracked grains were measured using the compression test by
using texture analyser (TA.XT texture analyser, stable micro systems Ltd. UK).
Texture analyzer gave a three-dimensional product analysis by measuring distance,
force and time. Force was measured against set distance and the distance was measured
to achieve set of forces. Cylindrical probe with 2 mm diameter compressed the sample
which kept on the base of the instrument.
A brown rice grain was put on the sample table attatched to the load cell and its
hardness value was measured in a flat position. A 500 N load cell, probe of 2 mm
diameter and 0.1 mm/s compression rate were used. The average hardness value of 6
determinations were expressed as Newton (N) in the present study.
3.6.4 Colour of milled parboiled rice
The Hunter's lab flex colourimeter (made by Hunter Associates Laboratory,
Reston, Virginia, USA) was used to determine the colour of milled and cooked
parboiled rice. The principle of working is by focusing the light and measuring energy
reflected from the sample across the entire visible spectrum. The colourimeter has
filters that rely on "standard observer curves" that measure the amount of red, yellow,
green, and blue colours. The colour of the rice was measured under a colourimeter scale
at a 10° observer and illuminate at D65. The instrument was initially calibrated with a
black tile and white tile provided with the instrument for further colour measurements.
The 3-dimensional scale L*, a* and b* values was used in the present study.
The luminance (L*) forms the vertical axis, which indicates a light-dark spectrum with
a range from 0 (black) to 100 (white). In the same way, a* indicates the green - red
spectrum with a range of - 60 (green) to + 60 (red), and b* indicates the blue-yellow
spectrum with a range from - 60 (blue) to + 60 (yellow) dimensions respectively (Roy
47
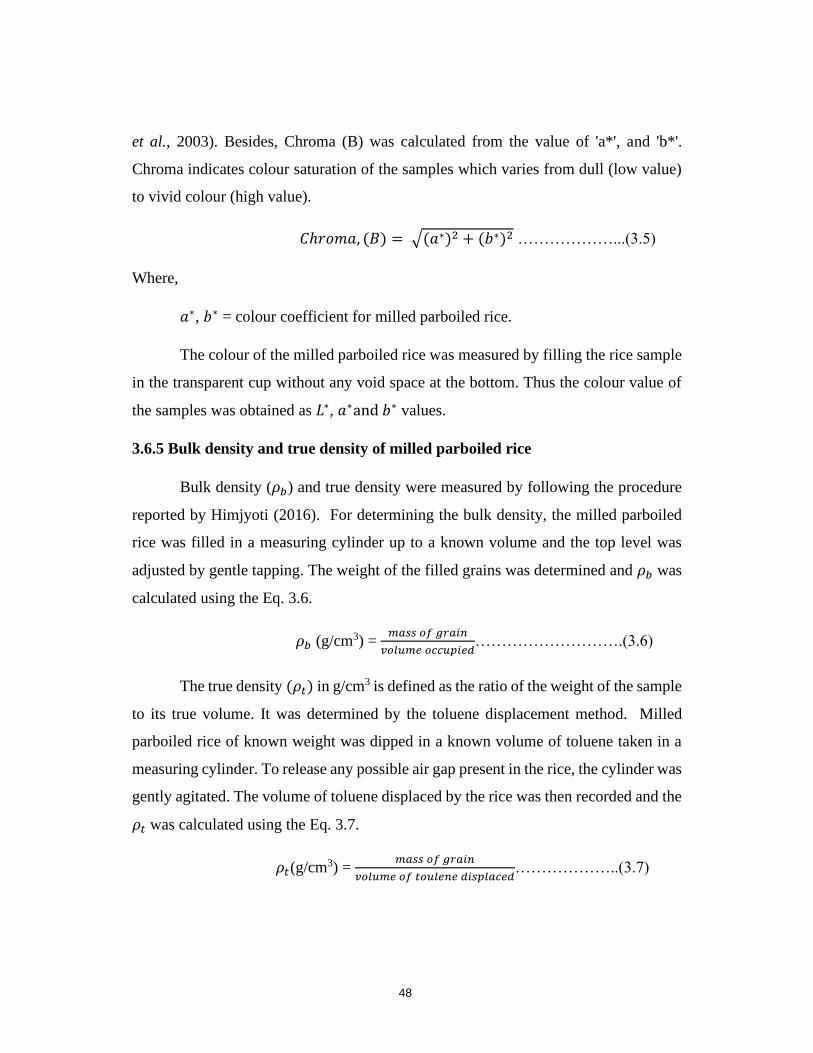
et al., 2003). Besides, Chroma (B) was calculated from the value of 'a*', and 'b*'.
Chroma indicates colour saturation of the samples which varies from dull (low value)
to vivid colour (high value).
𝐶ℎ𝑟𝑜𝑚𝑎, (𝐵) = √(𝑎∗)2 + (𝑏∗)2 ………………...(3.5)
Where,
𝑎∗, 𝑏∗ = colour coefficient for milled parboiled rice.
The colour of the milled parboiled rice was measured by filling the rice sample
in the transparent cup without any void space at the bottom. Thus the colour value of
the samples was obtained as 𝐿∗, 𝑎∗and 𝑏∗ values.
3.6.5 Bulk density and true density of milled parboiled rice
Bulk density (𝜌𝑏) and true density were measured by following the procedure
reported by Himjyoti (2016). For determining the bulk density, the milled parboiled
rice was filled in a measuring cylinder up to a known volume and the top level was
adjusted by gentle tapping. The weight of the filled grains was determined and 𝜌𝑏 was
calculated using the Eq. 3.6.
𝜌𝑏 (g/cm3) = 𝑚𝑎𝑠𝑠 𝑜𝑓 𝑔𝑟𝑎𝑖𝑛
𝑣𝑜𝑙𝑢𝑚𝑒 𝑜𝑐𝑐𝑢𝑝𝑖𝑒𝑑……………………….(3.6)
The true density (𝜌𝑡) in g/cm3 is defined as the ratio of the weight of the sample
to its true volume. It was determined by the toluene displacement method. Milled
parboiled rice of known weight was dipped in a known volume of toluene taken in a
measuring cylinder. To release any possible air gap present in the rice, the cylinder was
gently agitated. The volume of toluene displaced by the rice was then recorded and the
𝜌𝑡 was calculated using the Eq. 3.7.
𝜌𝑡(g/cm3) = 𝑚𝑎𝑠𝑠 𝑜𝑓 𝑔𝑟𝑎𝑖𝑛
𝑣𝑜𝑙𝑢𝑚𝑒 𝑜𝑓 𝑡𝑜𝑢𝑙𝑒𝑛𝑒 𝑑𝑖𝑠𝑝𝑙𝑎𝑐𝑒𝑑………………..(3.7)
48
3.6.6 Chalkiness of milled parboiled rice
Chalky rice is defined as the rice kernel having a white opaque center in its
endosperm. The amount of chalkiness greatly affects the grain appearance which
largely determines the endosperm opacity. Chalkiness was found out by following the
method suggested by IRRI (2009). Hundred head rice were randomly selected from
each trial and visually assessed for chalkiness. According to the standard evaluation
systems of International Rice Research Institute, a score of 1 (less than 10%
chalkiness), 5 (10 to 20% chalkiness) or 9 (over 20% chalkiness) were given to each
sample based on the percentage.
3.7 COOKING PROPERTIES OF PARBOILED PADDY
3.7.1 Cooking time
Cooking tests were carried out by using a boiling water bath. The time needed
for cooking the parboiled milled rice was determined by the method followed by
Roseline et al. (2010). Five grams of milled rice of each treatment was taken and
poured into 135ml of vigorously boiling distilled water in a 400ml beaker and covered
with a watch glass over it. After 15 mins of boiling, 10 grains were pressed between
two petri dishes. The grains were considered cooked when at least nine out of the 10
grains had no longer opaque centers and the corresponding time were recorded.
3.7.2 Water uptake ratio (WAR)
Water uptake ratio is the amount of water absorbed by a known quantity of rice
that was kept in a boiling water bath. This test was conducted with the reference to the
work done by Sindhu et al. (1975). Five gram of rice (W1) was taken in 135 ml of water
in a 400 ml graduated cylinder which was kept in a boiling water bath. After cooking,
it was allowed to cool and water uptake ratio was determined by weighing the cooked
rice (W2) after decanting its surface water using a blotting paper. The WAR can be
calculated using the Eq. 3.8.
49
𝑊𝑎𝑡𝑒𝑟 𝑢𝑝𝑡𝑎𝑘𝑒 𝑟𝑎𝑡𝑖𝑜 = (W2−W1)
(W1) …………………...(3.8)
W1 = weight of the parboiled rice
W2= Weight of the cooked rice
3.7.3 Gruel solid loss
Amount of solids leached from the kernel to the surrounding water during
cooking is termed as gruel solid loss. The method followed by Sareepuang et al. (2008)
was used to determine the gruel solid loss. Five grams of rice were cooked in 135 ml
of distilled water in a 400ml beaker placed in a boiling water bath. The rice water
agitated well after removing the cooked parboiled rice. Twenty five ml of previously
well agitated sample was placed in a pre-weighted petridish and air dried in an oven
for 1050C for 1h. Later the sample was fully dried until a constant weight at the same
temperature in the presence of P2O5 dessicant. The weight of the dried sample was
taken and calculate the actual amount of dried matter 135ml of rice water. The amount
of solids leached was calculated as grams of solids per grams of dry grain.
3.7.4 Grain elongation
Elongation of cooked rice was determined by measuring the initial length (L0)
of parboiled rice before cooking and the final length (L) of cooked rice after cooking
(Sareepuang et al., 2008). The grain elongation ratio was calculated using the Eq. 3.9.
𝐺𝑟𝑎𝑖𝑛 𝑒𝑙𝑜𝑛𝑔𝑎𝑡𝑖𝑜𝑛 = 𝐿₁ − 𝐿ₒ…………………(3.9)
Where
𝐿ₒ = Initial grain length before cooking
𝐿₁ = Final length after cooking
50
3.7.5 Hardness of cooked rice
Hardness of cooked rice kernels were evaluated using a texture analyser
(TA.XT texture analyser, stable micro systems Ltd. UK). The procedure followed by
Graham et al. (2015) was adopted in the present study. Twenty five milled head rice
were washed with clean water and placed in a glass beaker containing 20 ml of water.
Beaker containing samples was placed in a boiling water bath for 20 minutes. The
cooked rice kernals after draining were transferred to the petridishes lined with filter
paper to further drain the kernals. Three cooked parboiled rice grains were put in the
center of the sample platform’s grid of the texture analyser. To compress the rice kernal
to 90% deformation, a cylindrical probe having a diameter of 10 mm was used at a
pretest speed of 0.5 mm/s and post test speed of 1 mm/s was adopted. The average
values of hardness was calculated from the procured force- deformation data.
3.8 STATISTICAL ANALYSIS
Statistical analysis was carried out to study the effect of independent parameters
on all the dependent variables. Analysis of variance (ANOVA) was conducted with the
Response Surface Methodology (RSM) Box-Bhenken Design for optimisation of
different parameters involved in this study. The experimental design was performed
using the Design-Expert software version 12.0.
3.9 COST ECONOMICS
Based on the capital cost of machineries and variable costs, the processing cost
of one kilogram of parboiled paddy was calculated. The cost economics was carried
out following the standard procedure.
51

RESULTS AND DISCUSSION

Chapter IV RESULTS AND DISCUSSION
This chapter deals with the results and discussion on the development and
performance evaluation of parboiling-cum-drying for the paddy crop variety Jyothi.
Quality parameters of the milled rice and cooked rice were enumerated and discussed
in this chapter.
4.1 TESTING OF THE DEVELOPED PARBOILING CUM DRYING UNIT
The fabricated parboiling cum drying unit majorly consists of two soaking cum
steaming cylindrical chambers having a capacity of 100 kg each and a continuous
recirculating LSU dryer. The two units were fabricated using SS 304 sheet and the
steam required for the parboiling was supplied by the steam boiler. The air for drying
the paddy was heated using a furnace and supplied through the air blower. The steamed
paddy was conveyed into the LSU dryer with the help of bucket elevator. The
performance of the unit was evaluated by comparing the head rice yield and milling
efficiency of the parboiled paddy which had gone through hot soaking and cold soaking
processes varying in soaking time, steaming time and drying temperature. The quality
parameters such as hardness, chroma value, chalkiness, bulk density and true density
of the parboiled milled rice, and the cooked rice qualities like cooking time, water
uptake ratio, gruel solid loss, grain elongation ratio and the hardness were evaluated in
this study. The suitable combinations of independent parameters for the paddy
parboiling in the fabricated unit were optimized based on the statistical analysis.
4.2 STANDARDIZATION OF THE PARBOILING TREATMENT
The paddy parboiling consists of three major steps such as soaking, steaming
and drying. The treatment combinations for the research were standardized by referring
to the preliminary studies related to the parboiling process. The collected paddy after
52
the sorting and cleaning, was subjected to two different soaking process ie., cold
soaking (40 h, 50 h and 60 h) and hot soaking (5 h, 6 h, and 7 h) (Gunathilake, 2018).
Later it was subjected to steaming in different duration (20, 25 and 30 min)
(Igathinathane et al., 2005). The two consecutive steps were done on the same
cylindrical tank. The required air temperature for heat furnace based LSU dryer was
fixed according to the optimum temperature obtained from hot air tray dryer.
Therefore, after steaming, the steamed paddy was dried at three drying temperatures
(50, 60, and 70°C) in a hot air dryer (Zheng and Lan, 2007). The experiment was carried
out with 17 treatments in both cold soaking and hot soaking. As discussed under 3.6,
the effect of varying parameters on the milling and cooking qualities of parboiled rice
were studied for the performance evaluation of the developed unit. The milling
qualities selected were milling efficiency, head rice yield, hardness, bulk density, true
density and chalkiness of the milled parboiled rice. Cooking time, water uptake ratio,
grain elongation ratio, hardness and gruel solid loss were the cooking qualities. In the
present study, the treatments are fixed based on the response surface methodology
(BOX Behnken design).
4.2.1 Effect of parboiling on milling efficiency
Milling is the production of rice in its whole grain form by removing the husk
and bran layers. It preserves the rice kernels in its appropriate original shape. The effect
of various process parameters of parboiling on milling efficiency in hot soaking and
cold soaking is shown in Fig. 4.1 and 4.2. It was revealed that the variation in steaming
time and drying temperature had significant effect on the milling efficiency (Appendix
A2 and B2). Bhattacharya and Rao (1966) reported that the milling quality of rough
rice showed a striking improvement through the parboiling treatment. From table 4.1,
it could be noticed that in hot soaking, maximum efficiency value of 66.7% was
observed for paddy parboiled with a soaking duration of 7 h, steaming time of 25 min
and drying air temperature of 50°C and a minimum value of 49.01% was observed for
a soaking duration of 5 h, steaming time of 30 min and drying temperature of 60°C. In
53
cold soaking, the highest milling efficiency of 64.49% was found for a soaking duration
of 40 h, steaming time of 25 min and drying temperature of 50°C and lowest value
48.26% was found for the soaking duration of 60 h, steaming time of 30 min and drying
temperature of 70°C.
The variation of soaking time showed a slight difference in the milling
efficiency and statistically it was not significant (p value > 0.05) as shown in the
ANOVA table given in Appendix A2 and B2. This might be due to the sufficient
absorption of moisture required for the complete gelatinization during soaking
(Mohanty et al., 2002). In cold soaking, the rice husk might be split due to the long
duration of soaking and it led to the leaching and deshaping of the rice. Hot soaking
enabled the paddy to reach their optimum moisture contentment within a short duration.
It improved the milling properties of hot soaking (Miah et al., 2002). From the Fig. 4.1
and 4.2, in both the cases (hot soaking and cold soaking), the milling efficiency
increased with increase in steaming time from 20 to 25 min. However, further increase
in steaming time resulted decreased milling efficiency. Similar trend was observed by
Islam et al. (2002) in their study on the effect of processing conditions on physical
properties of parboiled rice. It might be due to the severe deformation of the grain along
with the exudation of endosperm due to the husk splitting and absorption of excessive
moisture content. On further steaming for longer duration, the deformed grain loses the
exuded part of the endosperm reducing the milling yield.
Figures 4.1 and 4.2 shows that the milling efficiency decreases with increase in
the drying temperature in both hot soaking and cold soaking methods. It might be due
to the development of steep moisture gradient developed between the surface and the
center of the kernel that cause internal stress during the rapid drying. The kernel
released these stress by cracking and these cracks were irreversible which set up lines
of weakness that aids in the development of fractures under mechanical stress during
milling (Bhattacharya and Swamy, 1967).
54
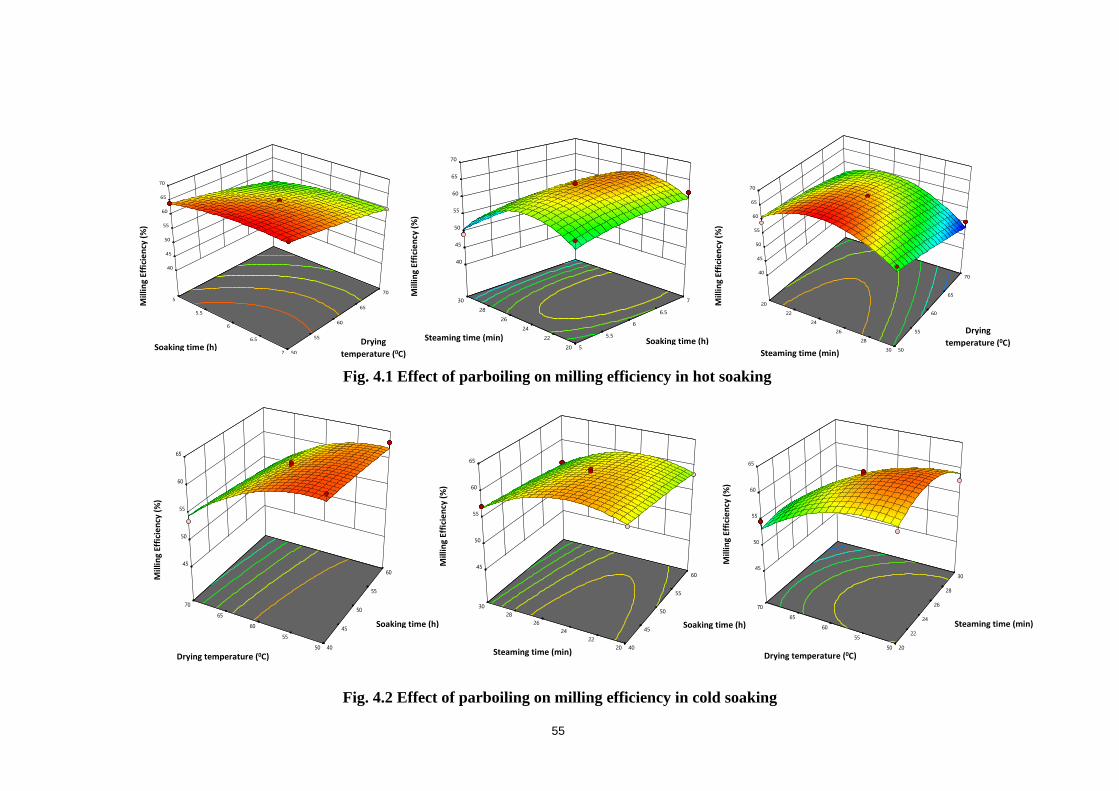
50
55
60
65
70
5
5.5
6
6.5
7
40
45
50
55
60
65
70
Mill
ing
Eff
icie
ncy
(%
)
A: Soaking time (h)
C: Dryig temperature (C)
3D SurfaceFactor Coding: Actual
Milling Efficiency (%)
Design Points:
Above Surface
Below Surface
49.0163 66.7154
X1 = A
X2 = C
Actual Factor
B = 25
20
22
24
26
28
30
5
5.5
6
6.5
7
40
45
50
55
60
65
70
Mill
ing
Eff
icie
ncy
(%
)
A: Soaking time (h)B: Steaming time (min)
3D SurfaceFactor Coding: Actual
Milling Efficiency (%)
Design Points:
Above Surface
Below Surface
49.0163 66.7154
X1 = A
X2 = B
Actual Factor
C = 60
50
55
60
65
70
20
22
24
26
28
30
40
45
50
55
60
65
70
Mill
ing
Eff
icie
ncy
(%
)
B: Steaming time (min)
C: Dryig temperature (C)
3D SurfaceFactor Coding: Actual
Milling Efficiency (%)
Design Points:
Above Surface
Below Surface
49.0163 66.7154
X1 = B
X2 = C
Actual Factor
A = 6
50
55
60
65
70
40
45
50
55
60
45
50
55
60
65
Millin
g E
ffic
ien
cy (
%)
A: Soaking time (h)
C: Dryig temperature (C)
3D SurfaceFactor Coding: Actual
Milling Efficiency (%)
Design Points:
Above Surface
Below Surface
48.2637 64.4892
X1 = A
X2 = C
Actual Factor
B = 25
20
22
24
26
28
30
40
45
50
55
60
45
50
55
60
65
Mill
ing
Eff
icie
ncy
(%
)
A: Soaking time (h)
B: Steaming time (min)
3D SurfaceFactor Coding: Actual
Milling Efficiency (%)
Design Points:
Above Surface
Below Surface
48.2637 64.4892
X1 = A
X2 = B
Actual Factor
C = 60
50
55
60
65
70
20
22
24
26
28
30
45
50
55
60
65
Millin
g E
ffic
ien
cy (
%)
B: Steaming time (min)
C: Dryig temperature (C)
3D SurfaceFactor Coding: Actual
Milling Efficiency (%)
Design Points:
Above Surface
Below Surface
48.2637 64.4892
X1 = B
X2 = C
Actual Factor
A = 50
Drying
temperature (0C) Steaming time (min)
Soaking time (h) Drying
temperature (0C)
Soaking time (h) Steaming time (min)
Mill
ing
Effi
cie
ncy
(%
)
Mill
ing
Effi
cie
ncy
(%
)
Mill
ing
Effi
cie
ncy
(%
)
Fig. 4.1 Effect of parboiling on milling efficiency in hot soaking
Mill
ing
Effi
cie
ncy
(%
)
Fig. 4.2 Effect of parboiling on milling efficiency in cold soaking
Soaking time (h)
Drying temperature (0C)
Steaming time (min)
Mill
ing
Effi
cie
ncy
(%
)
Mill
ing
Effi
cie
ncy
(%
)
Drying temperature (0C)
Soaking time (h)
Steaming time (min)
55
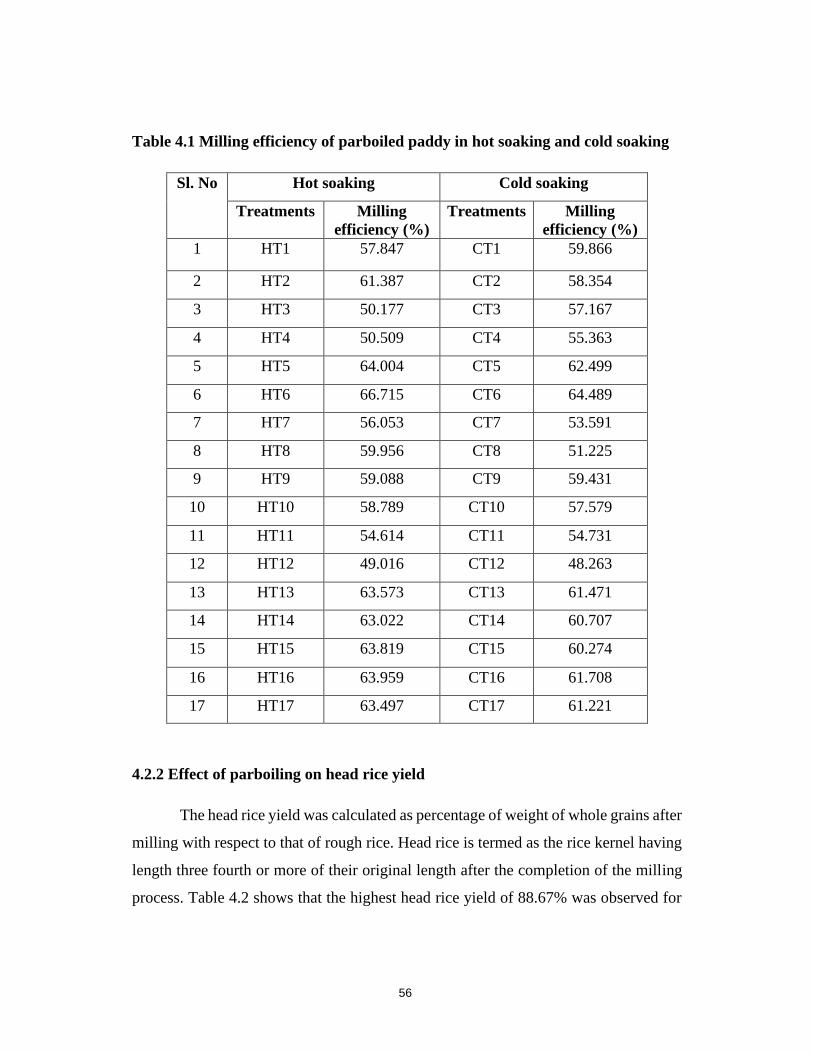
Table 4.1 Milling efficiency of parboiled paddy in hot soaking and cold soaking
Sl. No Hot soaking Cold soaking
Treatments Milling
efficiency (%)
Treatments Milling
efficiency (%)
1 HT1 57.847 CT1 59.866
2 HT2 61.387 CT2 58.354
3 HT3 50.177 CT3 57.167
4 HT4 50.509 CT4 55.363
5 HT5 64.004 CT5 62.499
6 HT6 66.715 CT6 64.489
7 HT7 56.053 CT7 53.591
8 HT8 59.956 CT8 51.225
9 HT9 59.088 CT9 59.431
10 HT10 58.789 CT10 57.579
11 HT11 54.614 CT11 54.731
12 HT12 49.016 CT12 48.263
13 HT13 63.573 CT13 61.471
14 HT14 63.022 CT14 60.707
15 HT15 63.819 CT15 60.274
16 HT16 63.959 CT16 61.708
17 HT17 63.497 CT17 61.221
4.2.2 Effect of parboiling on head rice yield
The head rice yield was calculated as percentage of weight of whole grains after
milling with respect to that of rough rice. Head rice is termed as the rice kernel having
length three fourth or more of their original length after the completion of the milling
process. Table 4.2 shows that the highest head rice yield of 88.67% was observed for
56
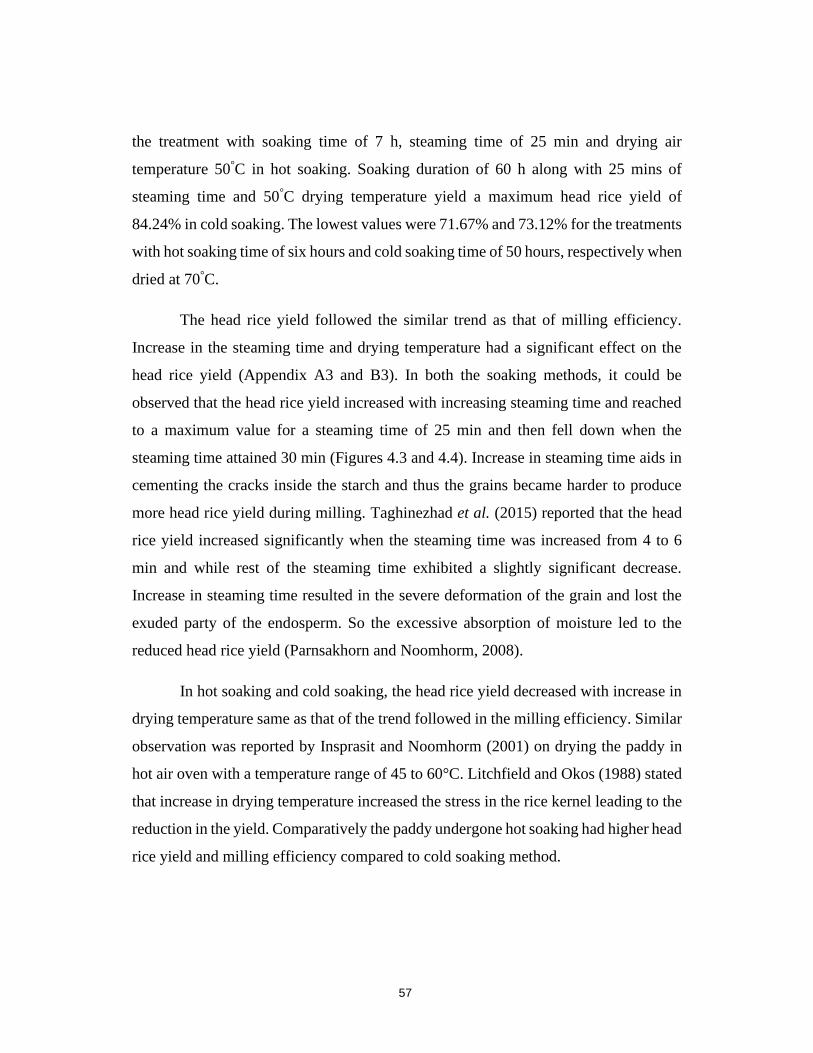
the treatment with soaking time of 7 h, steaming time of 25 min and drying air
temperature 50°C in hot soaking. Soaking duration of 60 h along with 25 mins of
steaming time and 50°C drying temperature yield a maximum head rice yield of
84.24% in cold soaking. The lowest values were 71.67% and 73.12% for the treatments
with hot soaking time of six hours and cold soaking time of 50 hours, respectively when
dried at 70°C.
The head rice yield followed the similar trend as that of milling efficiency.
Increase in the steaming time and drying temperature had a significant effect on the
head rice yield (Appendix A3 and B3). In both the soaking methods, it could be
observed that the head rice yield increased with increasing steaming time and reached
to a maximum value for a steaming time of 25 min and then fell down when the
steaming time attained 30 min (Figures 4.3 and 4.4). Increase in steaming time aids in
cementing the cracks inside the starch and thus the grains became harder to produce
more head rice yield during milling. Taghinezhad et al. (2015) reported that the head
rice yield increased significantly when the steaming time was increased from 4 to 6
min and while rest of the steaming time exhibited a slightly significant decrease.
Increase in steaming time resulted in the severe deformation of the grain and lost the
exuded party of the endosperm. So the excessive absorption of moisture led to the
reduced head rice yield (Parnsakhorn and Noomhorm, 2008).
In hot soaking and cold soaking, the head rice yield decreased with increase in
drying temperature same as that of the trend followed in the milling efficiency. Similar
observation was reported by Insprasit and Noomhorm (2001) on drying the paddy in
hot air oven with a temperature range of 45 to 60°C. Litchfield and Okos (1988) stated
that increase in drying temperature increased the stress in the rice kernel leading to the
reduction in the yield. Comparatively the paddy undergone hot soaking had higher head
rice yield and milling efficiency compared to cold soaking method.
57
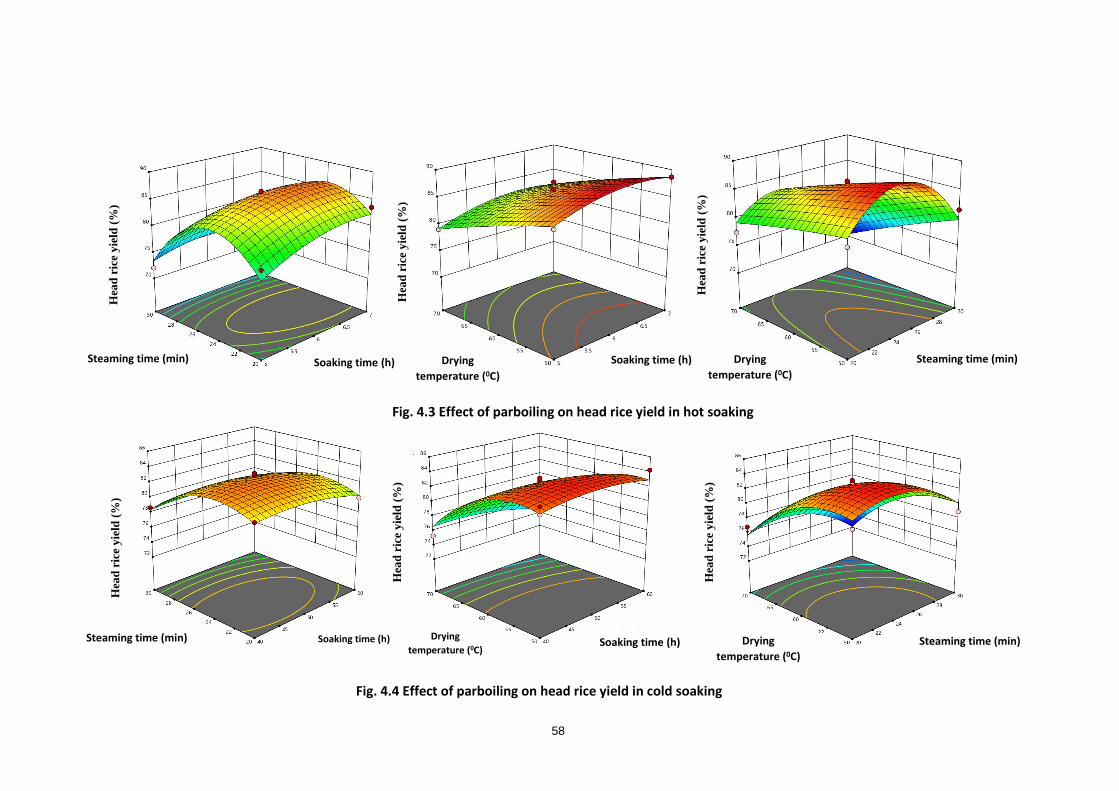
Fig. 4.3 Effect of parboiling on head rice yield in hot soaking
Hea
d r
ice
yie
ld (
%)
Hea
d r
ice
yie
ld (
%)
Hea
d r
ice
yie
ld (
%)
Hea
d r
ice
yie
ld (
%)
Hea
d r
ice
yie
ld (
%)
Hea
d r
ice
yie
ld (
%)
Steaming time (min)
Steaming time (min) Steaming time (min)
Steaming time (min) Soaking time (h)
Soaking time (h)
Soaking time (h)
Soaking time (h)
Drying
temperature (0C)
Drying
temperature (0C)
Drying
temperature (0C) Drying
temperature (0C)
Fig. 4.4 Effect of parboiling on head rice yield in cold soaking
58
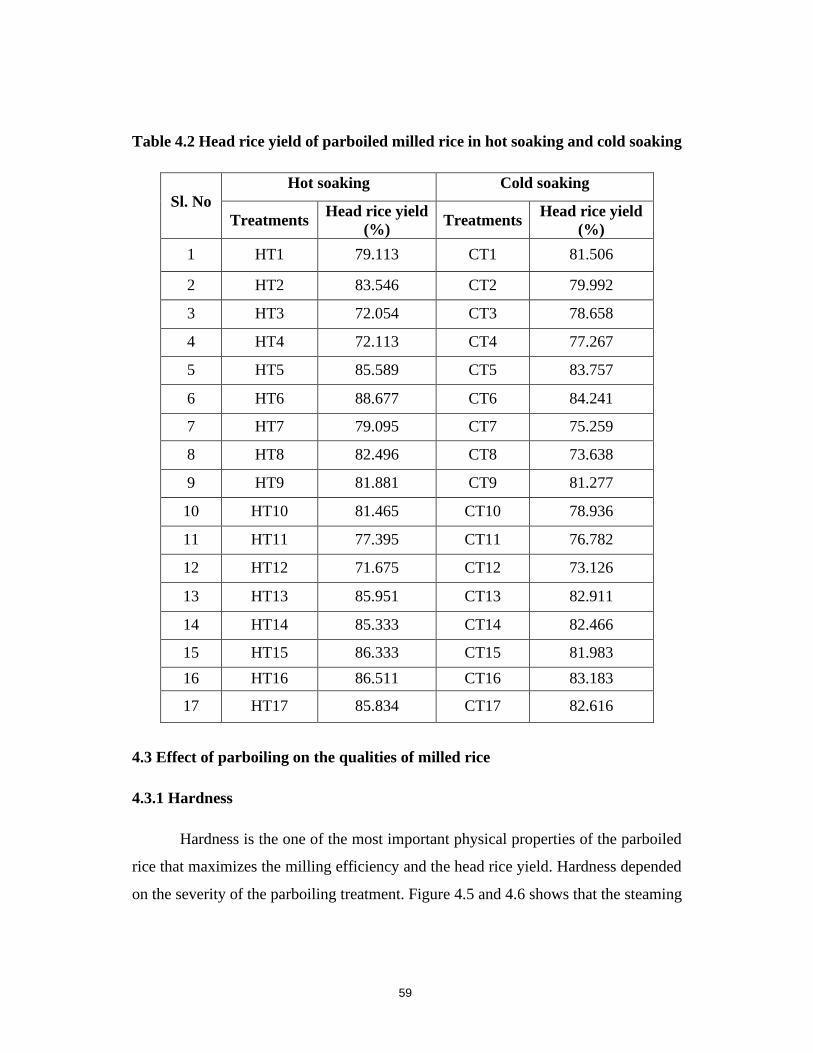
Table 4.2 Head rice yield of parboiled milled rice in hot soaking and cold soaking
Sl. No
Hot soaking Cold soaking
Treatments Head rice yield
(%) Treatments
Head rice yield
(%)
1 HT1 79.113 CT1 81.506
2 HT2 83.546 CT2 79.992
3 HT3 72.054 CT3 78.658
4 HT4 72.113 CT4 77.267
5 HT5 85.589 CT5 83.757
6 HT6 88.677 CT6 84.241
7 HT7 79.095 CT7 75.259
8 HT8 82.496 CT8 73.638
9 HT9 81.881 CT9 81.277
10 HT10 81.465 CT10 78.936
11 HT11 77.395 CT11 76.782
12 HT12 71.675 CT12 73.126
13 HT13 85.951 CT13 82.911
14 HT14 85.333 CT14 82.466
15 HT15 86.333 CT15 81.983
16 HT16 86.511 CT16 83.183
17 HT17 85.834 CT17 82.616
4.3 Effect of parboiling on the qualities of milled rice
4.3.1 Hardness
Hardness is the one of the most important physical properties of the parboiled
rice that maximizes the milling efficiency and the head rice yield. Hardness depended
on the severity of the parboiling treatment. Figure 4.5 and 4.6 shows that the steaming
59
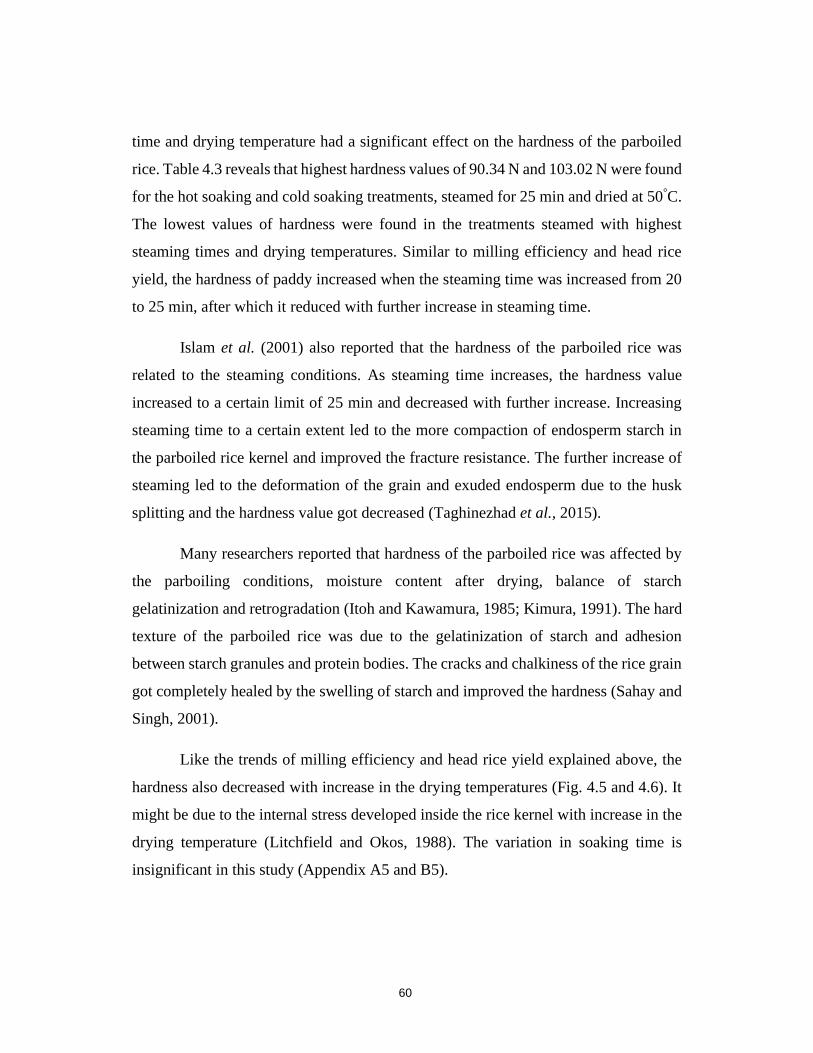
time and drying temperature had a significant effect on the hardness of the parboiled
rice. Table 4.3 reveals that highest hardness values of 90.34 N and 103.02 N were found
for the hot soaking and cold soaking treatments, steamed for 25 min and dried at 50°C.
The lowest values of hardness were found in the treatments steamed with highest
steaming times and drying temperatures. Similar to milling efficiency and head rice
yield, the hardness of paddy increased when the steaming time was increased from 20
to 25 min, after which it reduced with further increase in steaming time.
Islam et al. (2001) also reported that the hardness of the parboiled rice was
related to the steaming conditions. As steaming time increases, the hardness value
increased to a certain limit of 25 min and decreased with further increase. Increasing
steaming time to a certain extent led to the more compaction of endosperm starch in
the parboiled rice kernel and improved the fracture resistance. The further increase of
steaming led to the deformation of the grain and exuded endosperm due to the husk
splitting and the hardness value got decreased (Taghinezhad et al., 2015).
Many researchers reported that hardness of the parboiled rice was affected by
the parboiling conditions, moisture content after drying, balance of starch
gelatinization and retrogradation (Itoh and Kawamura, 1985; Kimura, 1991). The hard
texture of the parboiled rice was due to the gelatinization of starch and adhesion
between starch granules and protein bodies. The cracks and chalkiness of the rice grain
got completely healed by the swelling of starch and improved the hardness (Sahay and
Singh, 2001).
Like the trends of milling efficiency and head rice yield explained above, the
hardness also decreased with increase in the drying temperatures (Fig. 4.5 and 4.6). It
might be due to the internal stress developed inside the rice kernel with increase in the
drying temperature (Litchfield and Okos, 1988). The variation in soaking time is
insignificant in this study (Appendix A5 and B5).
60
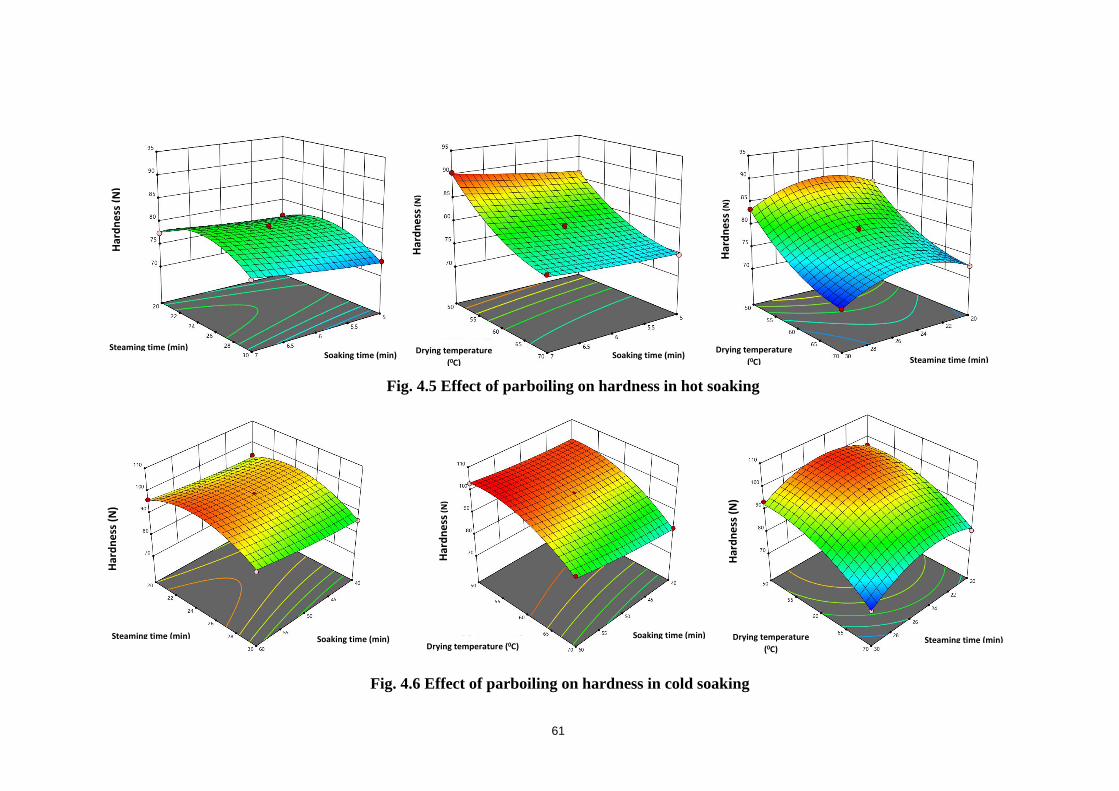
Har
dn
ess
(N
)
Steaming time (min) Soaking time (min)
Har
dn
ess
(N
)
Soaking time (min) Drying temperature
(0C)
Har
dn
ess
(N
)
Har
dn
ess
(N
)
Steaming time (min) Soaking time (min)
Har
dn
ess
(N
)
Drying temperature (0C) Soaking time (min)
Drying temperature
(0C) Steaming time (min)
Steaming time (min) Drying temperature
(0C)
Har
dn
ess
(N
)
Fig. 4.5 Effect of parboiling on hardness in hot soaking
Fig. 4.6 Effect of parboiling on hardness in cold soaking
61
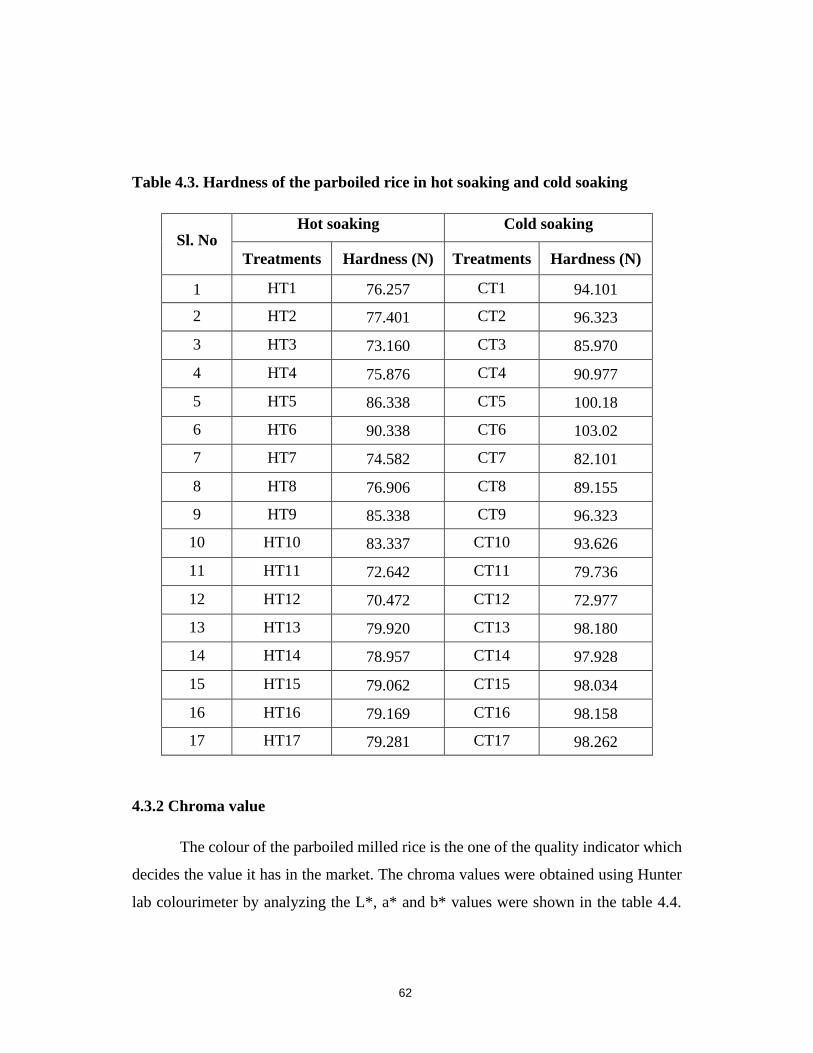
Table 4.3. Hardness of the parboiled rice in hot soaking and cold soaking
Sl. No Hot soaking Cold soaking
Treatments Hardness (N) Treatments Hardness (N)
1 HT1 76.257 CT1 94.101
2 HT2 77.401 CT2 96.323
3 HT3 73.160 CT3 85.970
4 HT4 75.876 CT4 90.977
5 HT5 86.338 CT5 100.18
6 HT6 90.338 CT6 103.02
7 HT7 74.582 CT7 82.101
8 HT8 76.906 CT8 89.155
9 HT9 85.338 CT9 96.323
10 HT10 83.337 CT10 93.626
11 HT11 72.642 CT11 79.736
12 HT12 70.472 CT12 72.977
13 HT13 79.920 CT13 98.180
14 HT14 78.957 CT14 97.928
15 HT15 79.062 CT15 98.034
16 HT16 79.169 CT16 98.158
17 HT17 79.281 CT17 98.262
4.3.2 Chroma value
The colour of the parboiled milled rice is the one of the quality indicator which
decides the value it has in the market. The chroma values were obtained using Hunter
lab colourimeter by analyzing the L*, a* and b* values were shown in the table 4.4.
62
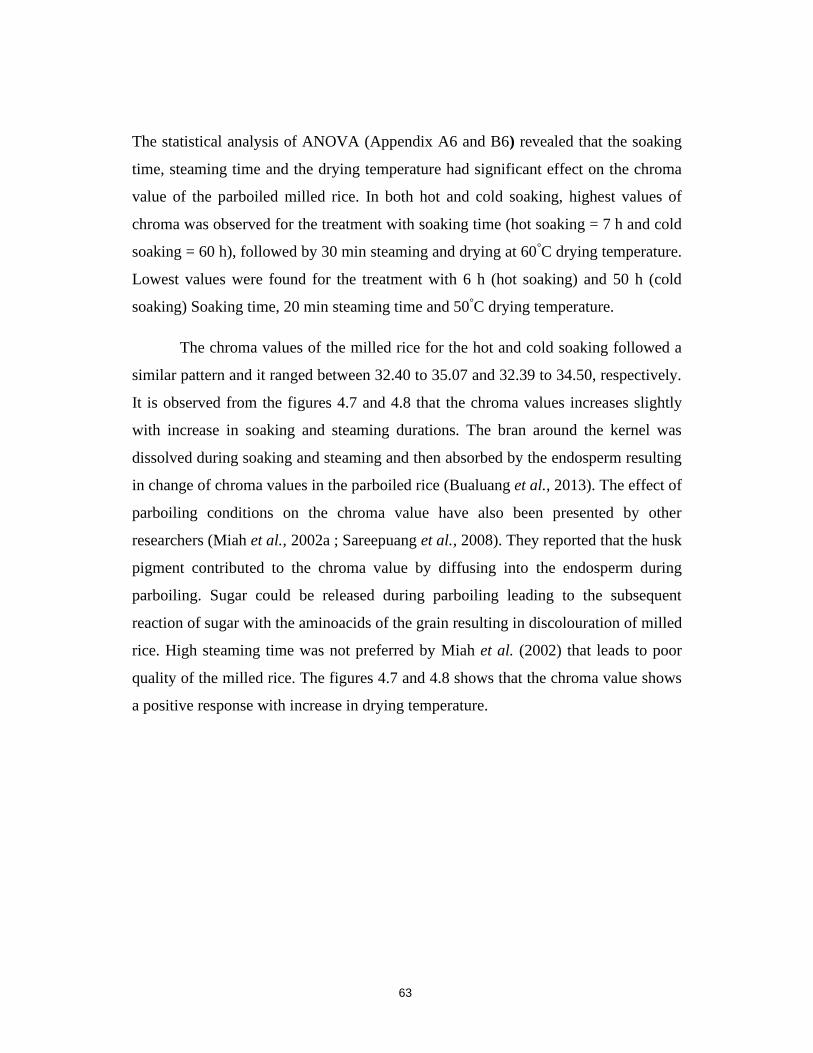
The statistical analysis of ANOVA (Appendix A6 and B6) revealed that the soaking
time, steaming time and the drying temperature had significant effect on the chroma
value of the parboiled milled rice. In both hot and cold soaking, highest values of
chroma was observed for the treatment with soaking time (hot soaking = 7 h and cold
soaking = 60 h), followed by 30 min steaming and drying at 60°C drying temperature.
Lowest values were found for the treatment with 6 h (hot soaking) and 50 h (cold
soaking) Soaking time, 20 min steaming time and 50°C drying temperature.
The chroma values of the milled rice for the hot and cold soaking followed a
similar pattern and it ranged between 32.40 to 35.07 and 32.39 to 34.50, respectively.
It is observed from the figures 4.7 and 4.8 that the chroma values increases slightly
with increase in soaking and steaming durations. The bran around the kernel was
dissolved during soaking and steaming and then absorbed by the endosperm resulting
in change of chroma values in the parboiled rice (Bualuang et al., 2013). The effect of
parboiling conditions on the chroma value have also been presented by other
researchers (Miah et al., 2002a ; Sareepuang et al., 2008). They reported that the husk
pigment contributed to the chroma value by diffusing into the endosperm during
parboiling. Sugar could be released during parboiling leading to the subsequent
reaction of sugar with the aminoacids of the grain resulting in discolouration of milled
rice. High steaming time was not preferred by Miah et al. (2002) that leads to poor
quality of the milled rice. The figures 4.7 and 4.8 shows that the chroma value shows
a positive response with increase in drying temperature.
63
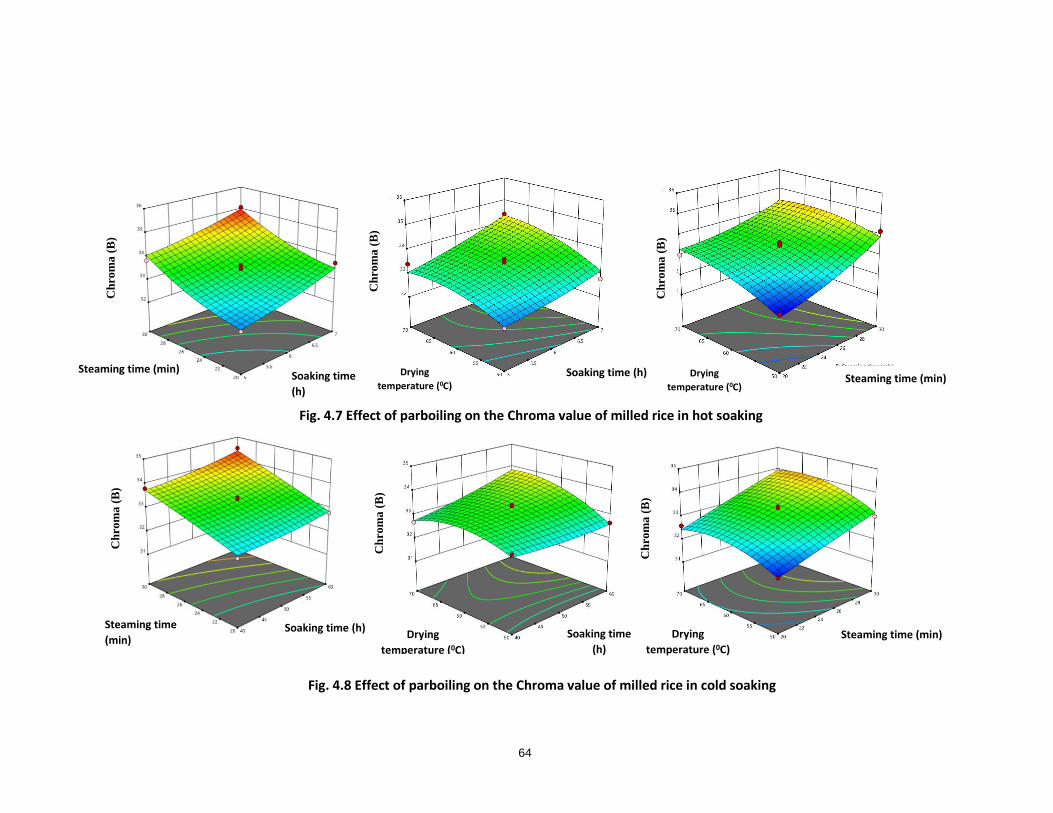
Fig. 4.8 Effect of parboiling on the Chroma value of milled rice in cold soaking
Fig. 4.7 Effect of parboiling on the Chroma value of milled rice in hot soaking
Ch
rom
a (
B)
Ch
rom
a (
B)
Ch
rom
a (
B)
Ch
rom
a (
B)
Ch
rom
a (
B)
Ch
rom
a (
B)
Steaming time (min)
Steaming time
(min)
Steaming time (min)
Steaming time (min)
Soaking time
(h)
Soaking time (h) Soaking time
(h)
Soaking time (h) Drying
temperature (0C)
Drying
temperature (0C)
Drying
temperature (0C)
Drying
temperature (0C)
64
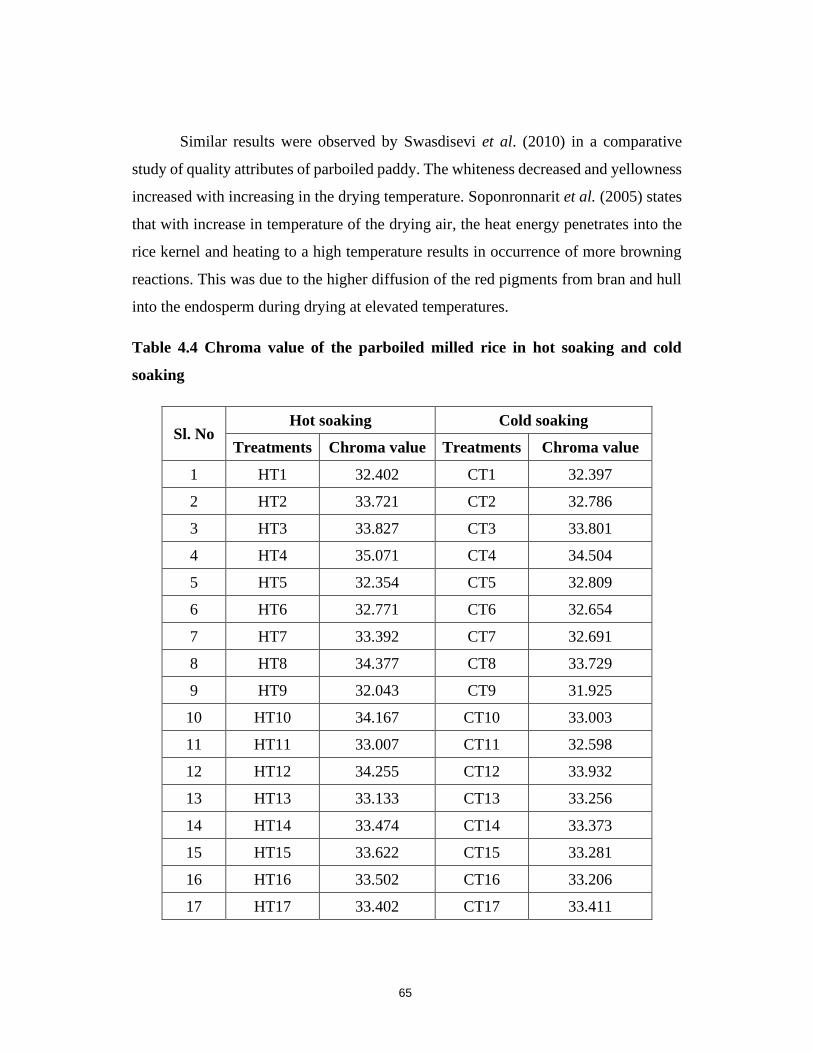
Similar results were observed by Swasdisevi et al. (2010) in a comparative
study of quality attributes of parboiled paddy. The whiteness decreased and yellowness
increased with increasing in the drying temperature. Soponronnarit et al. (2005) states
that with increase in temperature of the drying air, the heat energy penetrates into the
rice kernel and heating to a high temperature results in occurrence of more browning
reactions. This was due to the higher diffusion of the red pigments from bran and hull
into the endosperm during drying at elevated temperatures.
Table 4.4 Chroma value of the parboiled milled rice in hot soaking and cold
soaking
Sl. No Hot soaking Cold soaking
Treatments Chroma value Treatments Chroma value
1 HT1 32.402 CT1 32.397
2 HT2 33.721 CT2 32.786
3 HT3 33.827 CT3 33.801
4 HT4 35.071 CT4 34.504
5 HT5 32.354 CT5 32.809
6 HT6 32.771 CT6 32.654
7 HT7 33.392 CT7 32.691
8 HT8 34.377 CT8 33.729
9 HT9 32.043 CT9 31.925
10 HT10 34.167 CT10 33.003
11 HT11 33.007 CT11 32.598
12 HT12 34.255 CT12 33.932
13 HT13 33.133 CT13 33.256
14 HT14 33.474 CT14 33.373
15 HT15 33.622 CT15 33.281
16 HT16 33.502 CT16 33.206
17 HT17 33.402 CT17 33.411
65
4.3.3 Bulk density and True density
The values of bulk and true densities are slightly different in hot and cold
soaking methods. Figures 4.9. 4.10, 4.11 and 4.12 depicts the three dimensional plot of
effect of treatments on the true and bulk densities of the parboiled milled rice. It shows
that the variation in soaking time, steaming time and drying temperature did not
significantly impact in bulk density in both soaking methods. This finding is in
agreement with Hapsari et al. (2016) who reported that parboiling had no significant
effect on bulk density of rice. Further, the values were influenced by the roundness of
kernel. The more round the kernel, the greater bulk density. Saeed et al. (2011) also
reported that bulk density of milled rice depended on the degree of milling and fineness
characteristics of the grain.
Similar patterns to bulk density was observed for the true density of the milled
rice. The parboiling did not exert any significant effect on the true density in both
soaking methods (p value>0.05) (Appendix A7, A8, B7 and B8). This finding is par
with Bhattacharya (2013). He reported that true density of the milled rice depends on
the degree of milling and it could be due to the loss of lighter fat in the milling process.
Husk aided to keep the kernel intact maintaining the uniformity of structure
(Wahengbam and Hazarika, 2019). This might be the reason for the slight changes of
bulk density and true density of the parboiled rice under the variation of the
independent parameters.
66
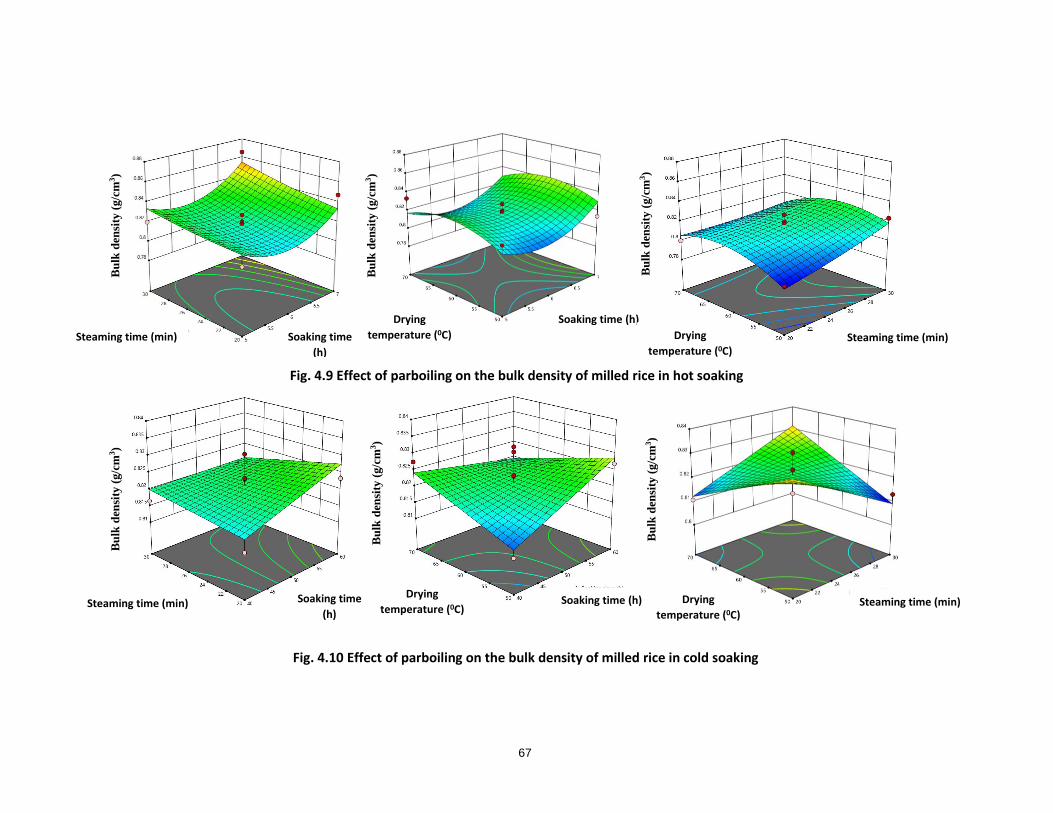
Fig. 4.9 Effect of parboiling on the bulk density of milled rice in hot soaking
Fig. 4.10 Effect of parboiling on the bulk density of milled rice in cold soaking
Bu
lk d
ensi
ty (
g/c
m3)
Steaming time (min) Steaming time (min)
Steaming time (min) Steaming time (min)
Soaking time
(h)
Soaking time
(h)
Soaking time (h)
Soaking time (h)
Drying
temperature (0C)
Drying
temperature (0C)
Drying
temperature (0C)
Drying
temperature (0C)
Bu
lk d
ensi
ty (
g/c
m3)
Bu
lk d
ensi
ty (
g/c
m3)
Bu
lk d
ensi
ty (
g/c
m3)
Bu
lk d
ensi
ty (
g/c
m3)
Bu
lk d
ensi
ty (
g/c
m3)
67
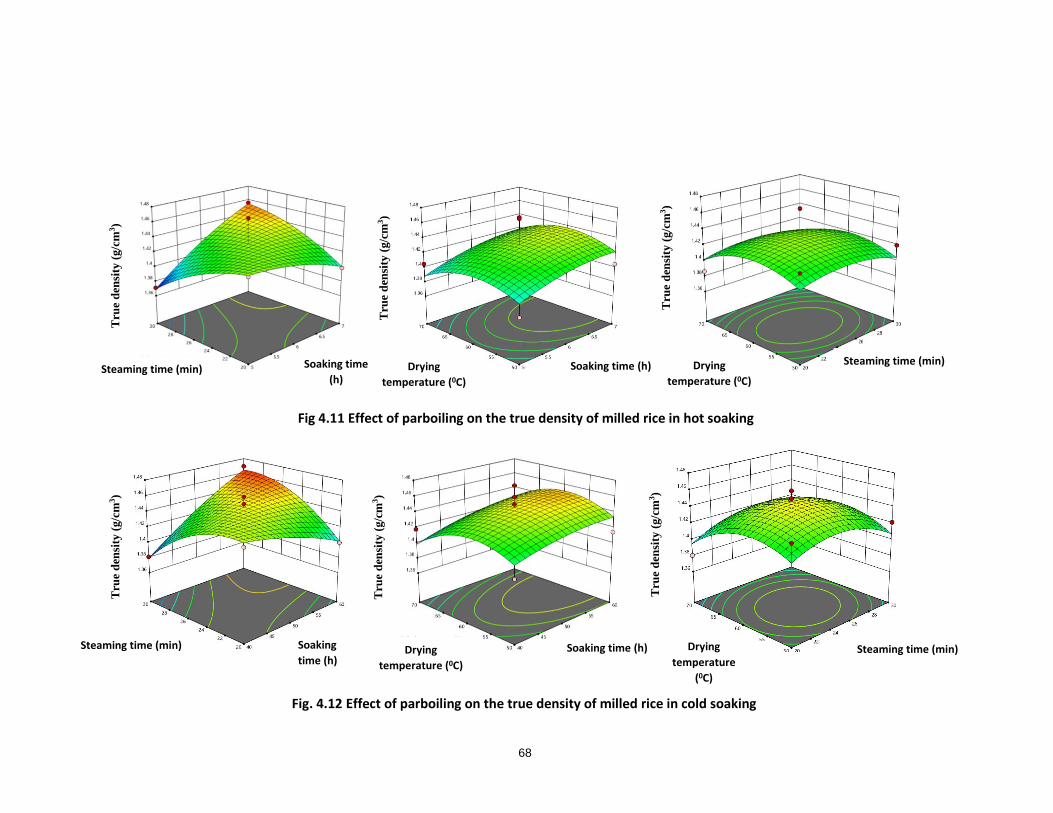
Fig 4.11 Effect of parboiling on the true density of milled rice in hot soaking
Drying
temperature (0C)
Fig. 4.12 Effect of parboiling on the true density of milled rice in cold soaking
Tru
e d
ensi
ty (
g/c
m3)
Tru
e d
ensi
ty (
g/c
m3)
Tru
e d
ensi
ty (
g/c
m3)
Tru
e d
ensi
ty (
g/c
m3)
Tru
e d
ensi
ty (
g/c
m3)
Tru
e d
ensi
ty (
g/c
m3)
Steaming time (min)
Steaming time (min)
Steaming time (min)
Steaming time (min)
Soaking time
(h)
Soaking
time (h) Soaking time (h)
Soaking time (h) Drying
temperature (0C)
Drying
temperature (0C)
Drying
temperature (0C)
Drying
temperature
(0C)
68
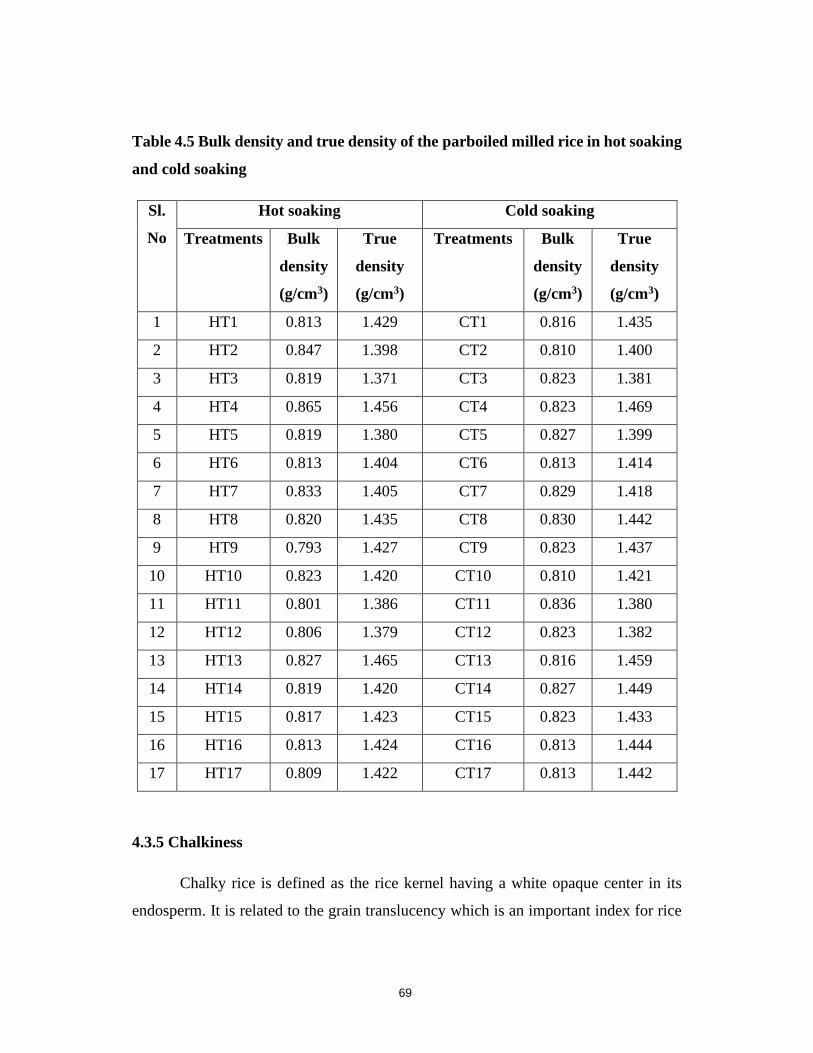
Table 4.5 Bulk density and true density of the parboiled milled rice in hot soaking
and cold soaking
Sl.
No
Hot soaking Cold soaking
Treatments Bulk
density
(g/cm3)
True
density
(g/cm3)
Treatments Bulk
density
(g/cm3)
True
density
(g/cm3)
1 HT1 0.813 1.429 CT1 0.816 1.435
2 HT2 0.847 1.398 CT2 0.810 1.400
3 HT3 0.819 1.371 CT3 0.823 1.381
4 HT4 0.865 1.456 CT4 0.823 1.469
5 HT5 0.819 1.380 CT5 0.827 1.399
6 HT6 0.813 1.404 CT6 0.813 1.414
7 HT7 0.833 1.405 CT7 0.829 1.418
8 HT8 0.820 1.435 CT8 0.830 1.442
9 HT9 0.793 1.427 CT9 0.823 1.437
10 HT10 0.823 1.420 CT10 0.810 1.421
11 HT11 0.801 1.386 CT11 0.836 1.380
12 HT12 0.806 1.379 CT12 0.823 1.382
13 HT13 0.827 1.465 CT13 0.816 1.459
14 HT14 0.819 1.420 CT14 0.827 1.449
15 HT15 0.817 1.423 CT15 0.823 1.433
16 HT16 0.813 1.424 CT16 0.813 1.444
17 HT17 0.809 1.422 CT17 0.813 1.442
4.3.5 Chalkiness
Chalky rice is defined as the rice kernel having a white opaque center in its
endosperm. It is related to the grain translucency which is an important index for rice
69
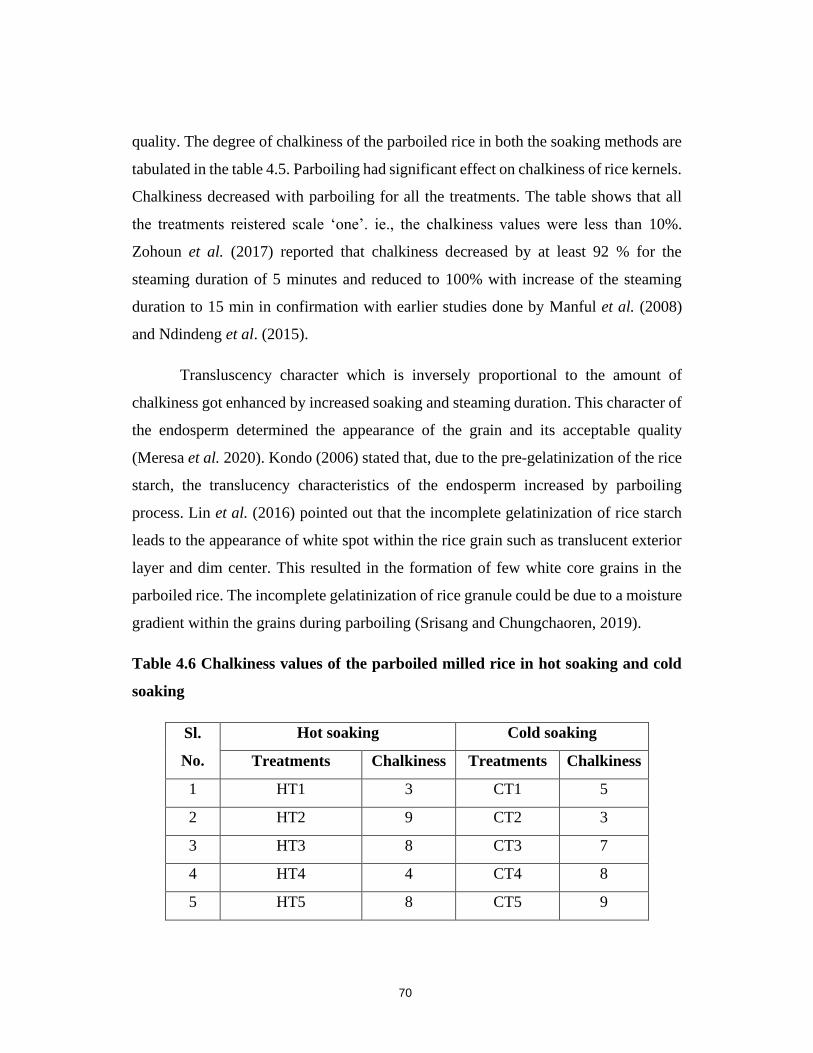
quality. The degree of chalkiness of the parboiled rice in both the soaking methods are
tabulated in the table 4.5. Parboiling had significant effect on chalkiness of rice kernels.
Chalkiness decreased with parboiling for all the treatments. The table shows that all
the treatments reistered scale ‘one’. ie., the chalkiness values were less than 10%.
Zohoun et al. (2017) reported that chalkiness decreased by at least 92 % for the
steaming duration of 5 minutes and reduced to 100% with increase of the steaming
duration to 15 min in confirmation with earlier studies done by Manful et al. (2008)
and Ndindeng et al. (2015).
Transluscency character which is inversely proportional to the amount of
chalkiness got enhanced by increased soaking and steaming duration. This character of
the endosperm determined the appearance of the grain and its acceptable quality
(Meresa et al. 2020). Kondo (2006) stated that, due to the pre-gelatinization of the rice
starch, the translucency characteristics of the endosperm increased by parboiling
process. Lin et al. (2016) pointed out that the incomplete gelatinization of rice starch
leads to the appearance of white spot within the rice grain such as translucent exterior
layer and dim center. This resulted in the formation of few white core grains in the
parboiled rice. The incomplete gelatinization of rice granule could be due to a moisture
gradient within the grains during parboiling (Srisang and Chungchaoren, 2019).
Table 4.6 Chalkiness values of the parboiled milled rice in hot soaking and cold
soaking
Sl.
No.
Hot soaking Cold soaking
Treatments Chalkiness Treatments Chalkiness
1 HT1 3 CT1 5
2 HT2 9 CT2 3
3 HT3 8 CT3 7
4 HT4 4 CT4 8
5 HT5 8 CT5 9
70
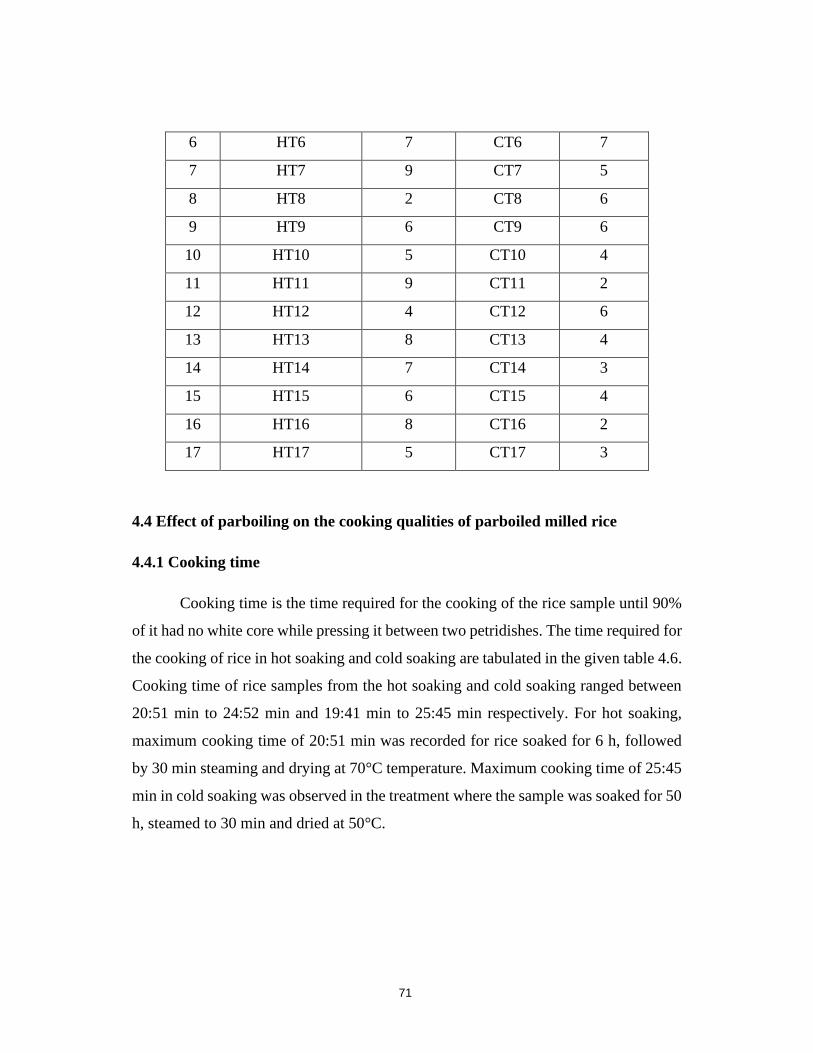
6 HT6 7 CT6 7
7 HT7 9 CT7 5
8 HT8 2 CT8 6
9 HT9 6 CT9 6
10 HT10 5 CT10 4
11 HT11 9 CT11 2
12 HT12 4 CT12 6
13 HT13 8 CT13 4
14 HT14 7 CT14 3
15 HT15 6 CT15 4
16 HT16 8 CT16 2
17 HT17 5 CT17 3
4.4 Effect of parboiling on the cooking qualities of parboiled milled rice
4.4.1 Cooking time
Cooking time is the time required for the cooking of the rice sample until 90%
of it had no white core while pressing it between two petridishes. The time required for
the cooking of rice in hot soaking and cold soaking are tabulated in the given table 4.6.
Cooking time of rice samples from the hot soaking and cold soaking ranged between
20:51 min to 24:52 min and 19:41 min to 25:45 min respectively. For hot soaking,
maximum cooking time of 20:51 min was recorded for rice soaked for 6 h, followed
by 30 min steaming and drying at 70°C temperature. Maximum cooking time of 25:45
min in cold soaking was observed in the treatment where the sample was soaked for 50
h, steamed to 30 min and dried at 50°C.
71
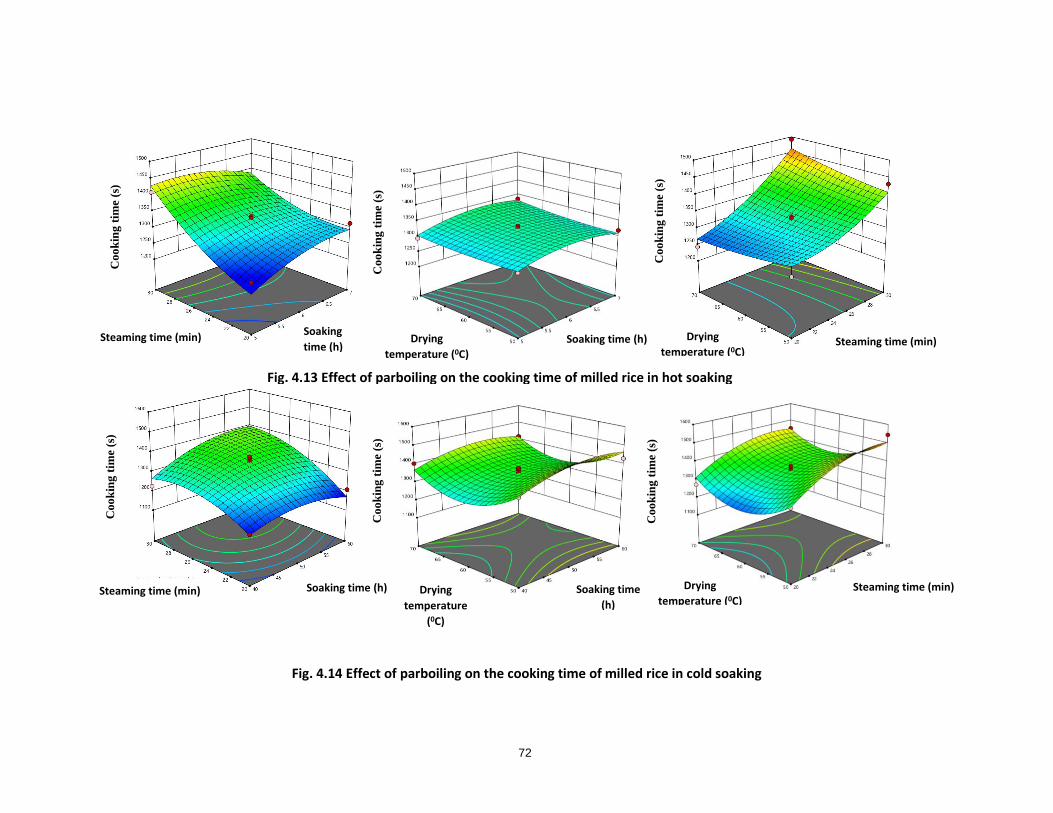
Fig. 4.13 Effect of parboiling on the cooking time of milled rice in hot soaking
Fig. 4.14 Effect of parboiling on the cooking time of milled rice in cold soaking
Co
ok
ing
tim
e (s
)
Co
ok
ing
tim
e (s
)
Co
ok
ing
tim
e (s
)
Co
ok
ing
tim
e (s
)
Co
ok
ing
tim
e (s
)
Co
ok
ing
tim
e (s
)
Steaming time (min) Steaming time (min)
Steaming time (min) Steaming time (min)
Soaking
time (h) Soaking time (h) Drying
temperature (0C)
Drying
temperature (0C)
Drying
temperature (0C)
Drying
temperature
(0C)
Soaking time (h) Soaking time
(h)
72
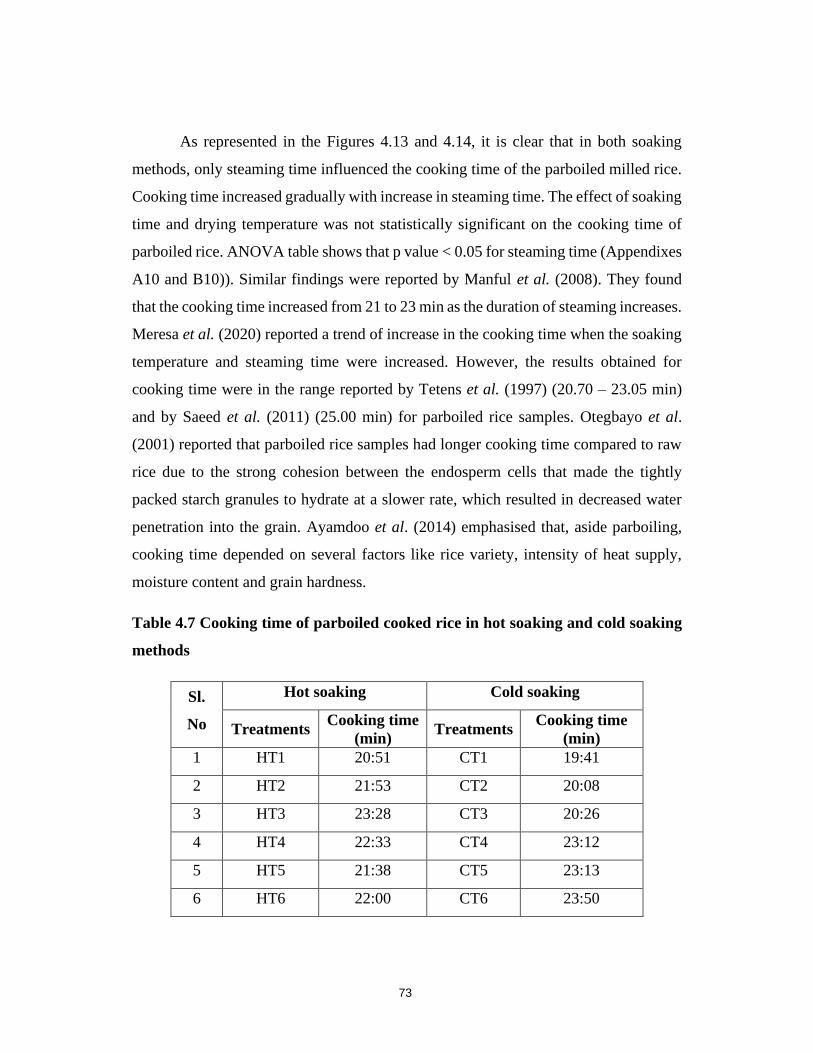
As represented in the Figures 4.13 and 4.14, it is clear that in both soaking
methods, only steaming time influenced the cooking time of the parboiled milled rice.
Cooking time increased gradually with increase in steaming time. The effect of soaking
time and drying temperature was not statistically significant on the cooking time of
parboiled rice. ANOVA table shows that p value < 0.05 for steaming time (Appendixes
A10 and B10)). Similar findings were reported by Manful et al. (2008). They found
that the cooking time increased from 21 to 23 min as the duration of steaming increases.
Meresa et al. (2020) reported a trend of increase in the cooking time when the soaking
temperature and steaming time were increased. However, the results obtained for
cooking time were in the range reported by Tetens et al. (1997) (20.70 – 23.05 min)
and by Saeed et al. (2011) (25.00 min) for parboiled rice samples. Otegbayo et al.
(2001) reported that parboiled rice samples had longer cooking time compared to raw
rice due to the strong cohesion between the endosperm cells that made the tightly
packed starch granules to hydrate at a slower rate, which resulted in decreased water
penetration into the grain. Ayamdoo et al. (2014) emphasised that, aside parboiling,
cooking time depended on several factors like rice variety, intensity of heat supply,
moisture content and grain hardness.
Table 4.7 Cooking time of parboiled cooked rice in hot soaking and cold soaking
methods
Sl.
No
Hot soaking Cold soaking
Treatments Cooking time
(min) Treatments
Cooking time
(min)
1 HT1 20:51 CT1 19:41
2 HT2 21:53 CT2 20:08
3 HT3 23:28 CT3 20:26
4 HT4 22:33 CT4 23:12
5 HT5 21:38 CT5 23:13
6 HT6 22:00 CT6 23:50
73
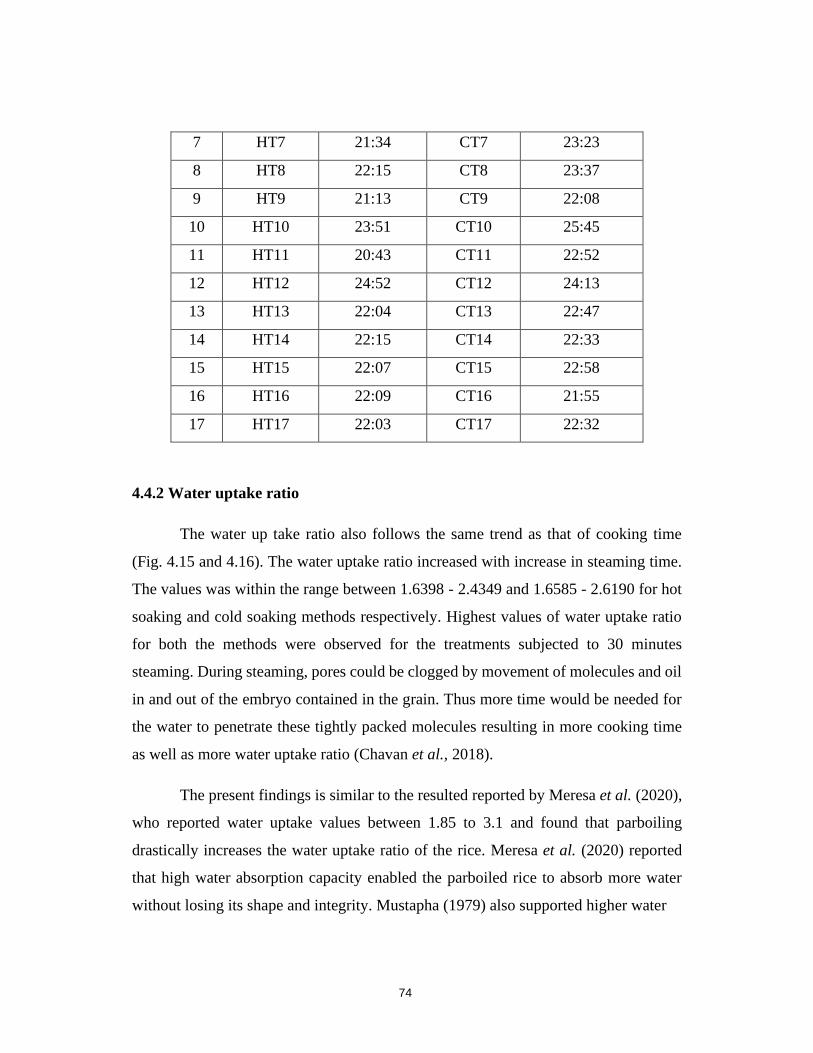
7 HT7 21:34 CT7 23:23
8 HT8 22:15 CT8 23:37
9 HT9 21:13 CT9 22:08
10 HT10 23:51 CT10 25:45
11 HT11 20:43 CT11 22:52
12 HT12 24:52 CT12 24:13
13 HT13 22:04 CT13 22:47
14 HT14 22:15 CT14 22:33
15 HT15 22:07 CT15 22:58
16 HT16 22:09 CT16 21:55
17 HT17 22:03 CT17 22:32
4.4.2 Water uptake ratio
The water up take ratio also follows the same trend as that of cooking time
(Fig. 4.15 and 4.16). The water uptake ratio increased with increase in steaming time.
The values was within the range between 1.6398 - 2.4349 and 1.6585 - 2.6190 for hot
soaking and cold soaking methods respectively. Highest values of water uptake ratio
for both the methods were observed for the treatments subjected to 30 minutes
steaming. During steaming, pores could be clogged by movement of molecules and oil
in and out of the embryo contained in the grain. Thus more time would be needed for
the water to penetrate these tightly packed molecules resulting in more cooking time
as well as more water uptake ratio (Chavan et al., 2018).
The present findings is similar to the resulted reported by Meresa et al. (2020),
who reported water uptake values between 1.85 to 3.1 and found that parboiling
drastically increases the water uptake ratio of the rice. Meresa et al. (2020) reported
that high water absorption capacity enabled the parboiled rice to absorb more water
without losing its shape and integrity. Mustapha (1979) also supported higher water
74
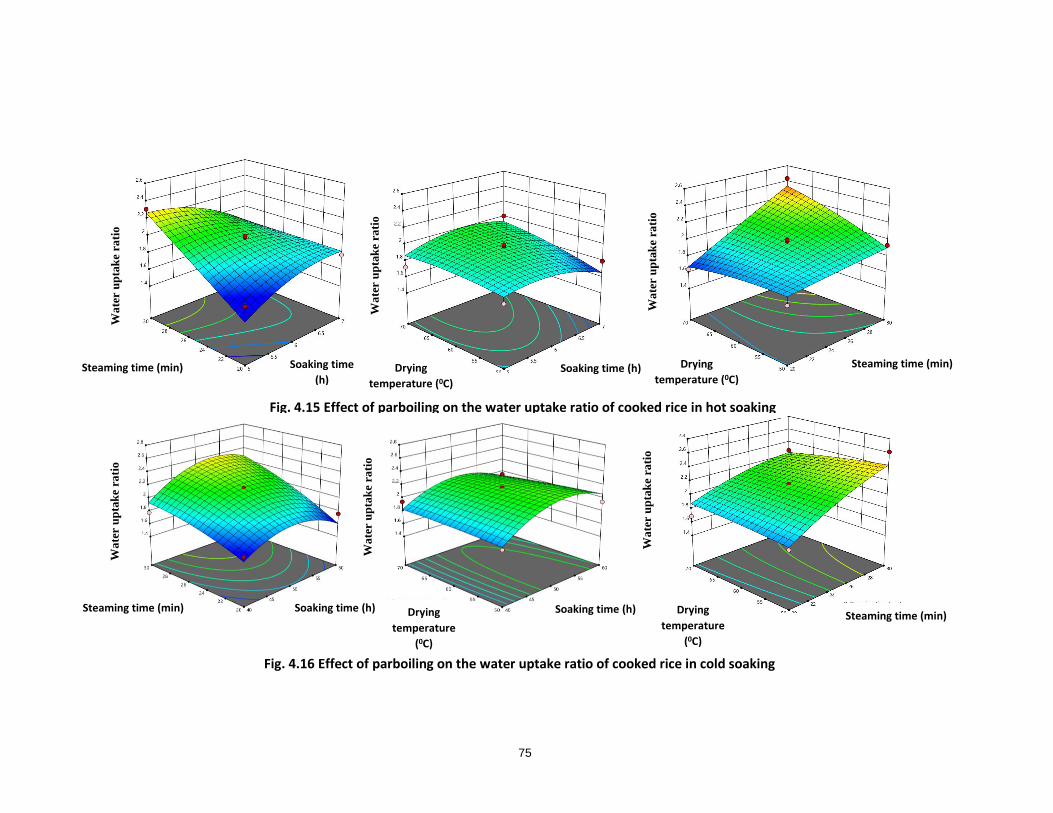
Fig. 4.15 Effect of parboiling on the water uptake ratio of cooked rice in hot soaking
Fig. 4.16 Effect of parboiling on the water uptake ratio of cooked rice in cold soaking
Wa
ter
up
tak
e ra
tio
Wa
ter
up
tak
e ra
tio
Wa
ter
up
tak
e ra
tio
Wa
ter
up
tak
e ra
tio
Wa
ter
up
tak
e ra
tio
Wa
ter
up
tak
e ra
tio
Steaming time (min) Steaming time (min) Soaking time
(h) Soaking time (h) Drying
temperature (0C)
Drying
temperature (0C)
Steaming time (min) Steaming time (min)
Soaking time (h) Soaking time (h) Drying
temperature
(0C)
Drying
temperature
(0C)
75
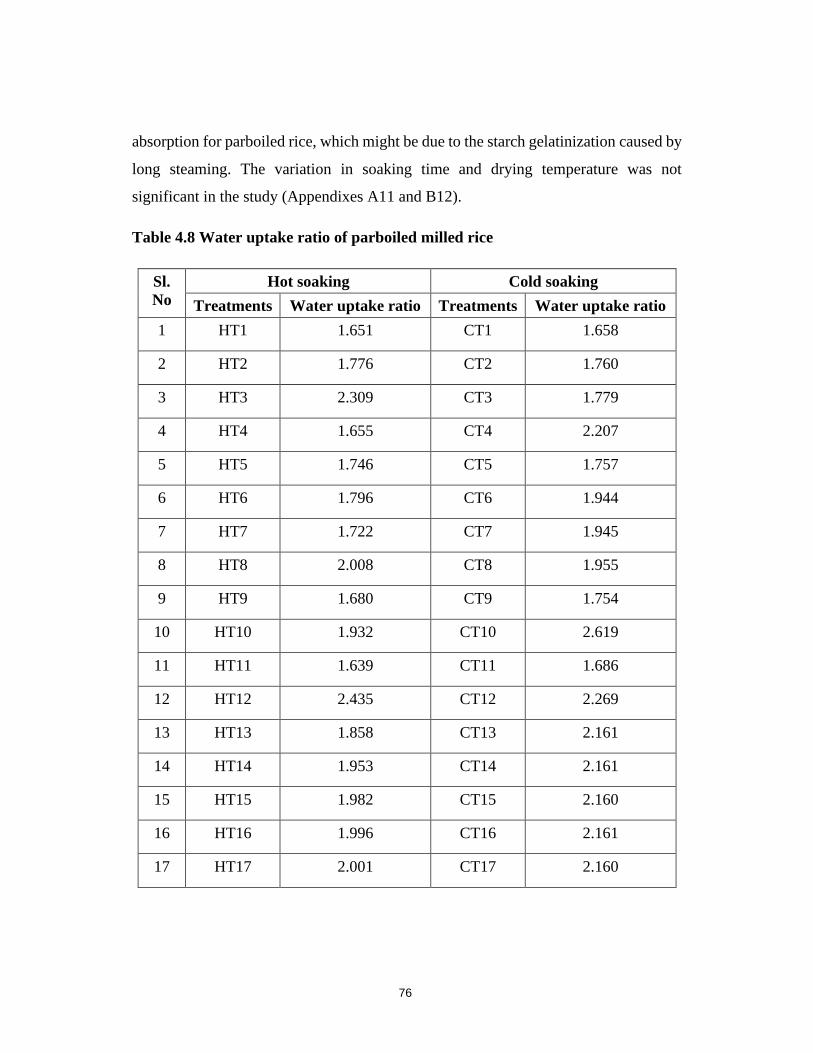
absorption for parboiled rice, which might be due to the starch gelatinization caused by
long steaming. The variation in soaking time and drying temperature was not
significant in the study (Appendixes A11 and B12).
Table 4.8 Water uptake ratio of parboiled milled rice
Sl.
No
Hot soaking Cold soaking
Treatments Water uptake ratio Treatments Water uptake ratio
1 HT1 1.651 CT1 1.658
2 HT2 1.776 CT2 1.760
3 HT3 2.309 CT3 1.779
4 HT4 1.655 CT4 2.207
5 HT5 1.746 CT5 1.757
6 HT6 1.796 CT6 1.944
7 HT7 1.722 CT7 1.945
8 HT8 2.008 CT8 1.955
9 HT9 1.680 CT9 1.754
10 HT10 1.932 CT10 2.619
11 HT11 1.639 CT11 1.686
12 HT12 2.435 CT12 2.269
13 HT13 1.858 CT13 2.161
14 HT14 1.953 CT14 2.161
15 HT15 1.982 CT15 2.160
16 HT16 1.996 CT16 2.161
17 HT17 2.001 CT17 2.160
76
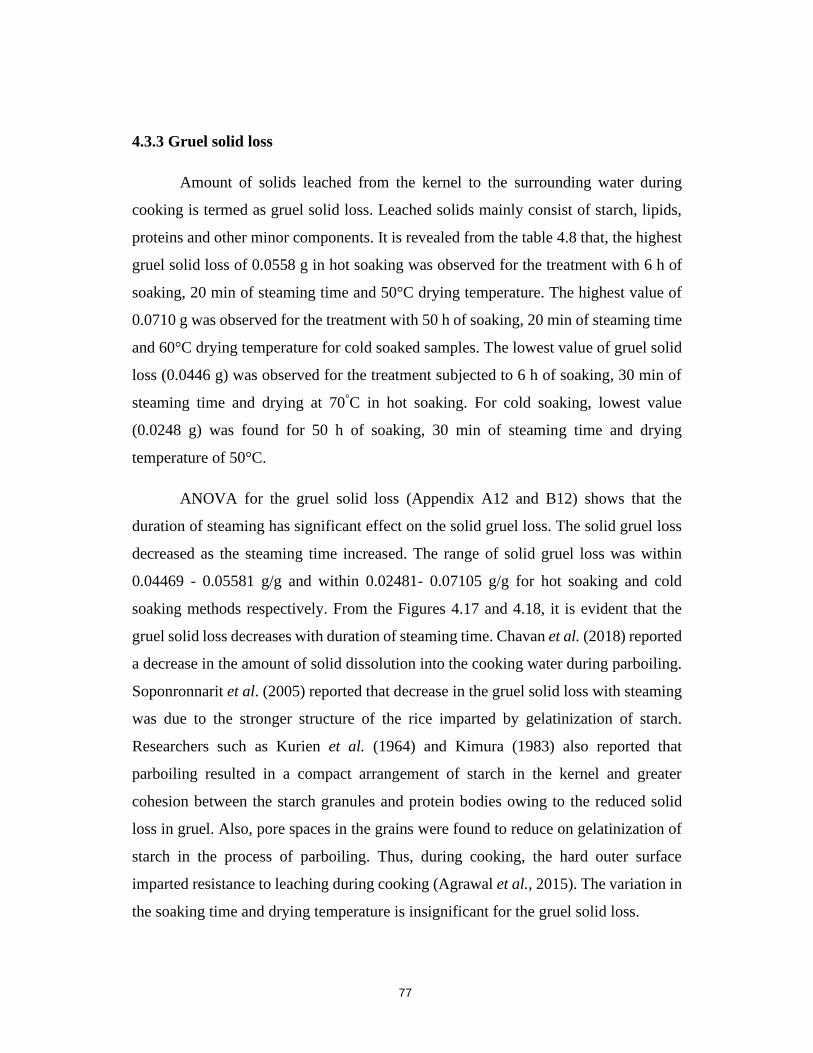
4.3.3 Gruel solid loss
Amount of solids leached from the kernel to the surrounding water during
cooking is termed as gruel solid loss. Leached solids mainly consist of starch, lipids,
proteins and other minor components. It is revealed from the table 4.8 that, the highest
gruel solid loss of 0.0558 g in hot soaking was observed for the treatment with 6 h of
soaking, 20 min of steaming time and 50°C drying temperature. The highest value of
0.0710 g was observed for the treatment with 50 h of soaking, 20 min of steaming time
and 60°C drying temperature for cold soaked samples. The lowest value of gruel solid
loss (0.0446 g) was observed for the treatment subjected to 6 h of soaking, 30 min of
steaming time and drying at 70°C in hot soaking. For cold soaking, lowest value
(0.0248 g) was found for 50 h of soaking, 30 min of steaming time and drying
temperature of 50°C.
ANOVA for the gruel solid loss (Appendix A12 and B12) shows that the
duration of steaming has significant effect on the solid gruel loss. The solid gruel loss
decreased as the steaming time increased. The range of solid gruel loss was within
0.04469 - 0.05581 g/g and within 0.02481- 0.07105 g/g for hot soaking and cold
soaking methods respectively. From the Figures 4.17 and 4.18, it is evident that the
gruel solid loss decreases with duration of steaming time. Chavan et al. (2018) reported
a decrease in the amount of solid dissolution into the cooking water during parboiling.
Soponronnarit et al. (2005) reported that decrease in the gruel solid loss with steaming
was due to the stronger structure of the rice imparted by gelatinization of starch.
Researchers such as Kurien et al. (1964) and Kimura (1983) also reported that
parboiling resulted in a compact arrangement of starch in the kernel and greater
cohesion between the starch granules and protein bodies owing to the reduced solid
loss in gruel. Also, pore spaces in the grains were found to reduce on gelatinization of
starch in the process of parboiling. Thus, during cooking, the hard outer surface
imparted resistance to leaching during cooking (Agrawal et al., 2015). The variation in
the soaking time and drying temperature is insignificant for the gruel solid loss.
77
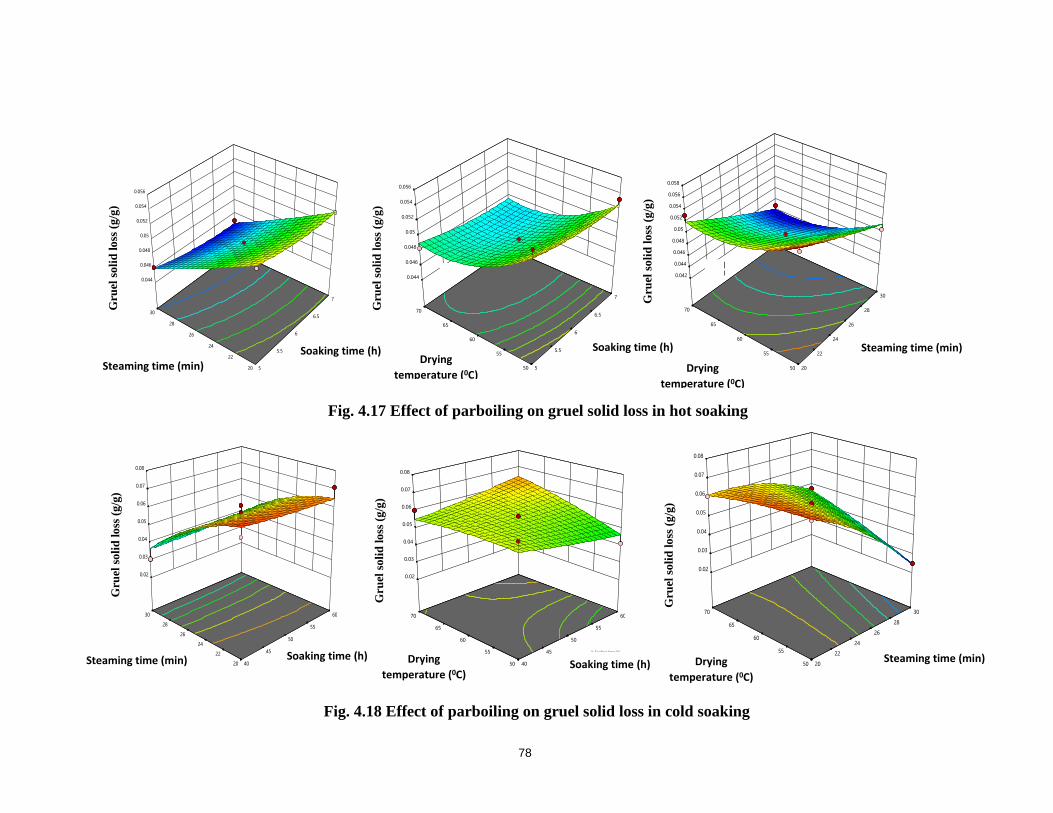
20
22
24
26
28
30
5
5.5
6
6.5
7
0.044
0.046
0.048
0.05
0.052
0.054
0.056
rue
l so
lid
lo
ss in
25
ml (g
of
dry
matt
er/
g o
f ri
ce
)
A: Soaking time (h)
B: Steaming time (min)
3D SurfaceFactor Coding: Actual
ruel solid loss in 25 ml (g of dry matter/g of ric...
Design Points:
Above Surface
Below Surface
0.04469 0.0558
X1 = A
X2 = B
Actual Factor
C = 60
50
55
60
65
70
5
5.5
6
6.5
7
0.044
0.046
0.048
0.05
0.052
0.054
0.056
rue
l so
lid lo
ss
in 2
5 m
l (g
of
dry
mat
ter/
g o
f ri
ce
)
A: Soaking time (h)
C: Dryig temperature (C)
3D SurfaceFactor Coding: Actual
ruel solid loss in 25 ml (g of dry matter/g of ric...
Design Points:
Above Surface
Below Surface
0.04469 0.0558
X1 = A
X2 = C
Actual Factor
B = 25
50
55
60
65
70
20
22
24
26
28
30
0.042
0.044
0.046
0.048
0.05
0.052
0.054
0.056
0.058
rue
l so
lid
lo
ss in
25
ml (g
of
dry
matt
er/
g o
f ri
ce
)
B: Steaming time (min)
C: Dryig temperature (C)
3D SurfaceFactor Coding: Actual
ruel solid loss in 25 ml (g of dry matter/g of ric...
Design Points:
Above Surface
Below Surface
0.04469 0.0558
X1 = B
X2 = C
Actual Factor
A = 6
20
22
24
26
28
30
40
45
50
55
60
0.02
0.03
0.04
0.05
0.06
0.07
0.08
rue
l so
lid
lo
ss (g
/g)
A: Soaking time (h)B: Steaming time (min)
3D SurfaceFactor Coding: Actual
ruel solid loss (g/g)
Design Points:
Above Surface
Below Surface
0.0248 0.07105
X1 = A
X2 = B
Actual Factor
C = 60
50
55
60
65
70
40
45
50
55
60
0.02
0.03
0.04
0.05
0.06
0.07
0.08
rue
l so
lid
lo
ss
(g
/g)
A: Soaking time (h)C: Dryig temperature (C)
3D SurfaceFactor Coding: Actual
ruel solid loss (g/g)
Design Points:
Above Surface
Below Surface
0.0248 0.07105
X1 = A
X2 = C
Actual Factor
B = 25
50
55
60
65
70
20
22
24
26
28
30
0.02
0.03
0.04
0.05
0.06
0.07
0.08
rue
l so
lid
lo
ss (g
/g)
B: Steaming time (min)C: Dryig temperature (C)
3D SurfaceFactor Coding: Actual
ruel solid loss (g/g)
Design Points:
Above Surface
Below Surface
0.0248 0.07105
X1 = B
X2 = C
Actual Factor
A = 50
Fig. 4.17 Effect of parboiling on gruel solid loss in hot soaking
Drying
temperature (0C)
Gru
el s
oli
d l
oss
(g
/g)
Gru
el s
oli
d l
oss
(g
/g)
Gru
el s
oli
d l
oss
(g
/g)
Steaming time (min)
Steaming time (min) Soaking time (h) Soaking time (h)
Drying
temperature (0C)
Fig. 4.18 Effect of parboiling on gruel solid loss in cold soaking
Gru
el s
oli
d l
oss
(g
/g)
Gru
el s
oli
d l
oss
(g
/g)
Steaming time (min) Soaking time (h) Drying
temperature (0C) Soaking time (h) Drying
temperature (0C)
Steaming time (min) G
ruel
so
lid
lo
ss (
g/g
)
78
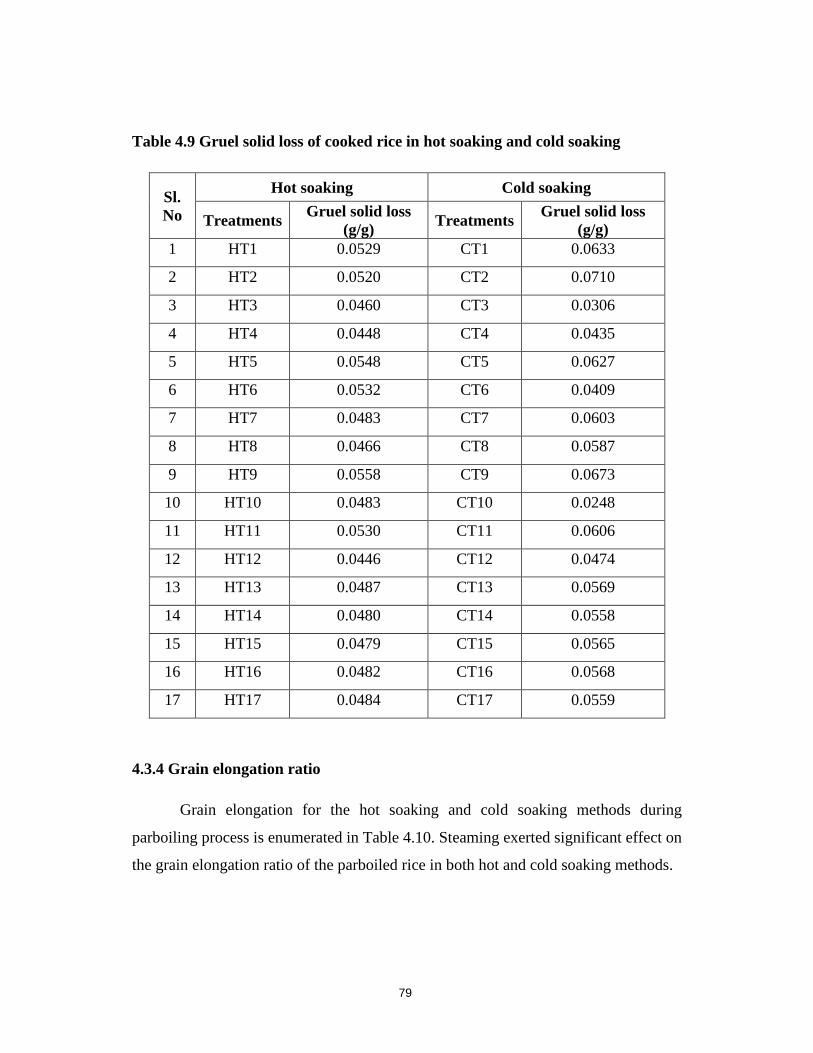
Table 4.9 Gruel solid loss of cooked rice in hot soaking and cold soaking
Sl.
No
Hot soaking Cold soaking
Treatments Gruel solid loss
(g/g) Treatments
Gruel solid loss
(g/g)
1 HT1 0.0529 CT1 0.0633
2 HT2 0.0520 CT2 0.0710
3 HT3 0.0460 CT3 0.0306
4 HT4 0.0448 CT4 0.0435
5 HT5 0.0548 CT5 0.0627
6 HT6 0.0532 CT6 0.0409
7 HT7 0.0483 CT7 0.0603
8 HT8 0.0466 CT8 0.0587
9 HT9 0.0558 CT9 0.0673
10 HT10 0.0483 CT10 0.0248
11 HT11 0.0530 CT11 0.0606
12 HT12 0.0446 CT12 0.0474
13 HT13 0.0487 CT13 0.0569
14 HT14 0.0480 CT14 0.0558
15 HT15 0.0479 CT15 0.0565
16 HT16 0.0482 CT16 0.0568
17 HT17 0.0484 CT17 0.0559
4.3.4 Grain elongation ratio
Grain elongation for the hot soaking and cold soaking methods during
parboiling process is enumerated in Table 4.10. Steaming exerted significant effect on
the grain elongation ratio of the parboiled rice in both hot and cold soaking methods.
79
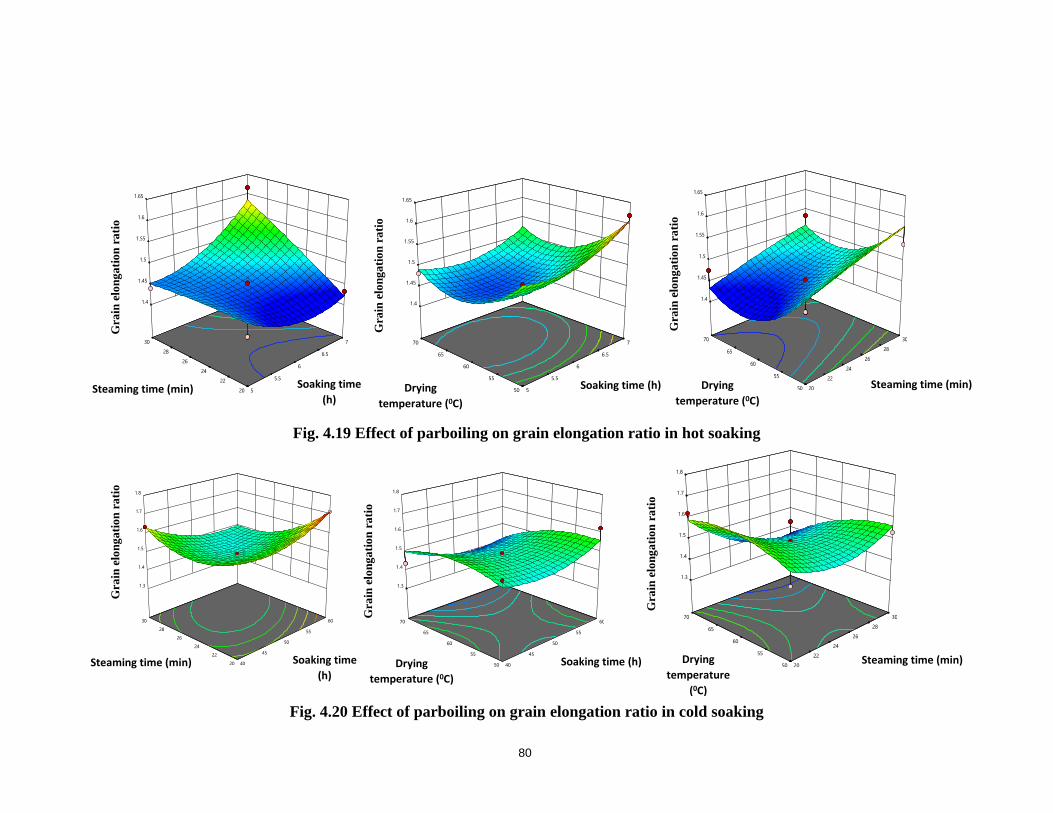
20
22
24
26
28
30
5
5.5
6
6.5
7
1.4
1.45
1.5
1.55
1.6
1.65
Gra
in e
lon
gati
on
rati
o(L
/L0
)
A: Soaking time (h)B: Steaming time (min)
3D SurfaceFactor Coding: Actual
Grain elongation ratio(L/L0)
Design Points:
Above Surface
Below Surface
1.42756 1.61963
X1 = A
X2 = B
Actual Factor
C = 60
50
55
60
65
70
5
5.5
6
6.5
7
1.4
1.45
1.5
1.55
1.6
1.65
Gra
in e
lon
gat
ion
rat
io(L
/L0
)A: Soaking time (h)C: Dryig temperature (C)
3D SurfaceFactor Coding: Actual
Grain elongation ratio(L/L0)
Design Points:
Above Surface
Below Surface
1.42756 1.61963
X1 = A
X2 = C
Actual Factor
B = 25
50
55
60
65
70
20
22
24
26
28
30
1.4
1.45
1.5
1.55
1.6
1.65
Gra
in e
lon
gati
on
rati
o(L
/L0
)
B: Steaming time (min)C: Dryig temperature (C)
3D SurfaceFactor Coding: Actual
Grain elongation ratio(L/L0)
Design Points:
Above Surface
Below Surface
1.42756 1.61963
X1 = B
X2 = C
Actual Factor
A = 6
20
22
24
26
28
30
40
45
50
55
60
1.3
1.4
1.5
1.6
1.7
1.8
Gra
in e
lon
gati
on
rati
o(L
/L0
)
A: Soaking time (h)B: Steaming time (min)
3D SurfaceFactor Coding: Actual
Grain elongation ratio(L/L0)
Design Points:
Above Surface
Below Surface
1.38554 1.7139
X1 = A
X2 = B
Actual Factor
C = 60
50
55
60
65
70
40
45
50
55
60
1.3
1.4
1.5
1.6
1.7
1.8
Gra
in e
lon
gat
ion
rat
io(L
/L0
)
A: Soaking time (h)C: Dryig temperature (C)
3D SurfaceFactor Coding: Actual
Grain elongation ratio(L/L0)
Design Points:
Above Surface
Below Surface
1.38554 1.7139
X1 = A
X2 = C
Actual Factor
B = 25
50
55
60
65
70
20
22
24
26
28
30
1.3
1.4
1.5
1.6
1.7
1.8
Gra
in e
lon
gati
on
rati
o(L
/L0
)B: Steaming time (min)C: Dryig temperature (C)
3D SurfaceFactor Coding: Actual
Grain elongation ratio(L/L0)
Design Points:
Above Surface
Below Surface
1.38554 1.7139
X1 = B
X2 = C
Actual Factor
A = 50
Fig. 4.19 Effect of parboiling on grain elongation ratio in hot soaking
Gra
in e
lon
ga
tio
n r
ati
o
Gra
in e
lon
ga
tio
n r
ati
o
Gra
in e
lon
ga
tio
n r
ati
o
Steaming time (min) Steaming time (min) Soaking time
(h) Soaking time (h) Drying
temperature (0C)
Drying
temperature (0C)
Fig. 4.20 Effect of parboiling on grain elongation ratio in cold soaking
Gra
in e
lon
ga
tio
n r
ati
o
Gra
in e
lon
ga
tio
n r
ati
o
Gra
in e
lon
ga
tio
n r
ati
o
Steaming time (min) Steaming time (min) Soaking time
(h) Soaking time (h) Drying
temperature (0C)
Drying
temperature
(0C)
80
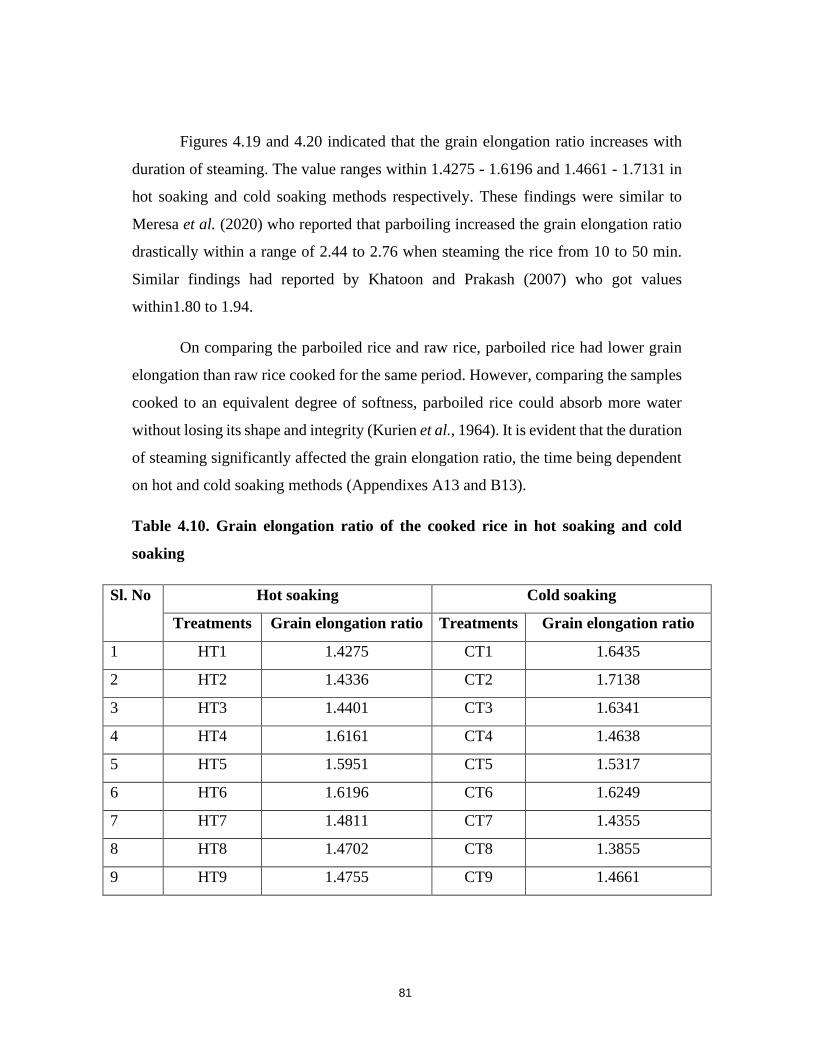
Figures 4.19 and 4.20 indicated that the grain elongation ratio increases with
duration of steaming. The value ranges within 1.4275 - 1.6196 and 1.4661 - 1.7131 in
hot soaking and cold soaking methods respectively. These findings were similar to
Meresa et al. (2020) who reported that parboiling increased the grain elongation ratio
drastically within a range of 2.44 to 2.76 when steaming the rice from 10 to 50 min.
Similar findings had reported by Khatoon and Prakash (2007) who got values
within1.80 to 1.94.
On comparing the parboiled rice and raw rice, parboiled rice had lower grain
elongation than raw rice cooked for the same period. However, comparing the samples
cooked to an equivalent degree of softness, parboiled rice could absorb more water
without losing its shape and integrity (Kurien et al., 1964). It is evident that the duration
of steaming significantly affected the grain elongation ratio, the time being dependent
on hot and cold soaking methods (Appendixes A13 and B13).
Table 4.10. Grain elongation ratio of the cooked rice in hot soaking and cold
soaking
Sl. No Hot soaking Cold soaking
Treatments Grain elongation ratio Treatments Grain elongation ratio
1 HT1 1.4275 CT1 1.6435
2 HT2 1.4336 CT2 1.7138
3 HT3 1.4401 CT3 1.6341
4 HT4 1.6161 CT4 1.4638
5 HT5 1.5951 CT5 1.5317
6 HT6 1.6196 CT6 1.6249
7 HT7 1.4811 CT7 1.4355
8 HT8 1.4702 CT8 1.3855
9 HT9 1.4755 CT9 1.4661
81
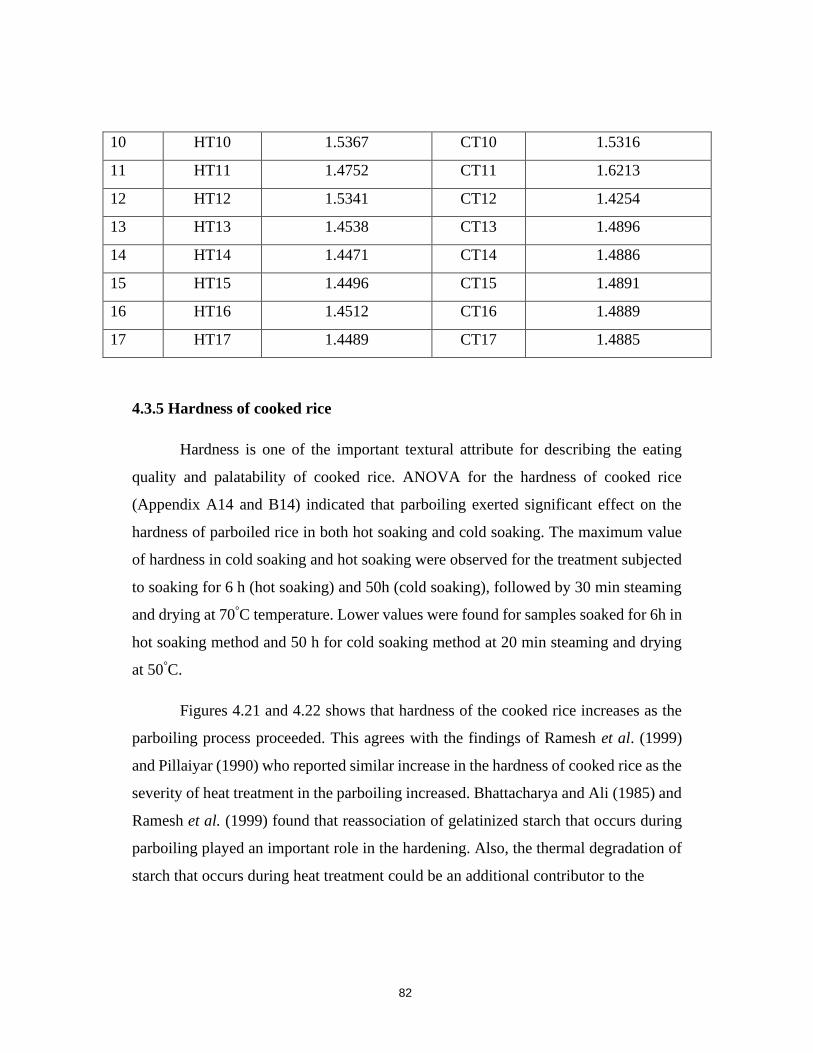
10 HT10 1.5367 CT10 1.5316
11 HT11 1.4752 CT11 1.6213
12 HT12 1.5341 CT12 1.4254
13 HT13 1.4538 CT13 1.4896
14 HT14 1.4471 CT14 1.4886
15 HT15 1.4496 CT15 1.4891
16 HT16 1.4512 CT16 1.4889
17 HT17 1.4489 CT17 1.4885
4.3.5 Hardness of cooked rice
Hardness is one of the important textural attribute for describing the eating
quality and palatability of cooked rice. ANOVA for the hardness of cooked rice
(Appendix A14 and B14) indicated that parboiling exerted significant effect on the
hardness of parboiled rice in both hot soaking and cold soaking. The maximum value
of hardness in cold soaking and hot soaking were observed for the treatment subjected
to soaking for 6 h (hot soaking) and 50h (cold soaking), followed by 30 min steaming
and drying at 70°C temperature. Lower values were found for samples soaked for 6h in
hot soaking method and 50 h for cold soaking method at 20 min steaming and drying
at 50°C.
Figures 4.21 and 4.22 shows that hardness of the cooked rice increases as the
parboiling process proceeded. This agrees with the findings of Ramesh et al. (1999)
and Pillaiyar (1990) who reported similar increase in the hardness of cooked rice as the
severity of heat treatment in the parboiling increased. Bhattacharya and Ali (1985) and
Ramesh et al. (1999) found that reassociation of gelatinized starch that occurs during
parboiling played an important role in the hardening. Also, the thermal degradation of
starch that occurs during heat treatment could be an additional contributor to the
82
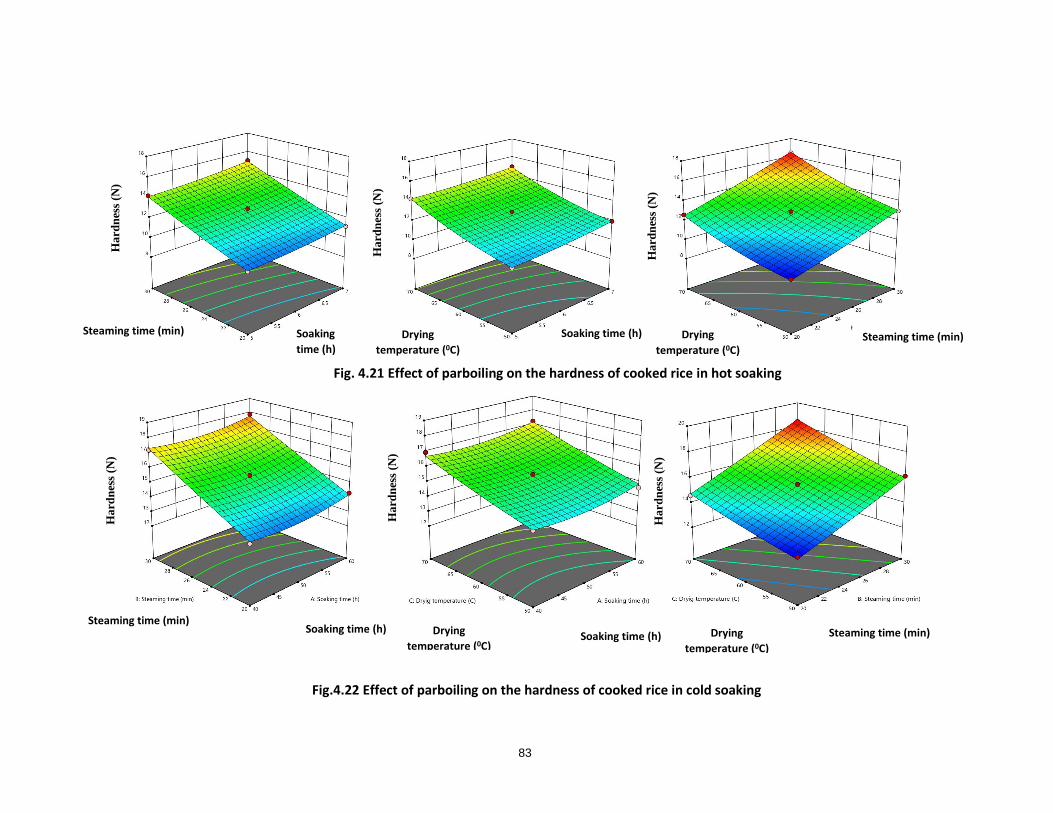
Fig. 4.21 Effect of parboiling on the hardness of cooked rice in hot soaking
Fig.4.22 Effect of parboiling on the hardness of cooked rice in cold soaking
Ha
rdn
ess
(N)
Steaming time (min) Soaking
time (h) Drying
temperature (0C)
Soaking time (h) Steaming time (min)
Ha
rdn
ess
(N)
Ha
rdn
ess
(N)
Ha
rdn
ess
(N)
Ha
rdn
ess
(N)
Ha
rdn
ess
(N)
Steaming time (min) Soaking time (h)
Drying
temperature (0C)
Soaking time (h) Steaming time (min) Drying
temperature (0C) Drying
temperature (0C)
83
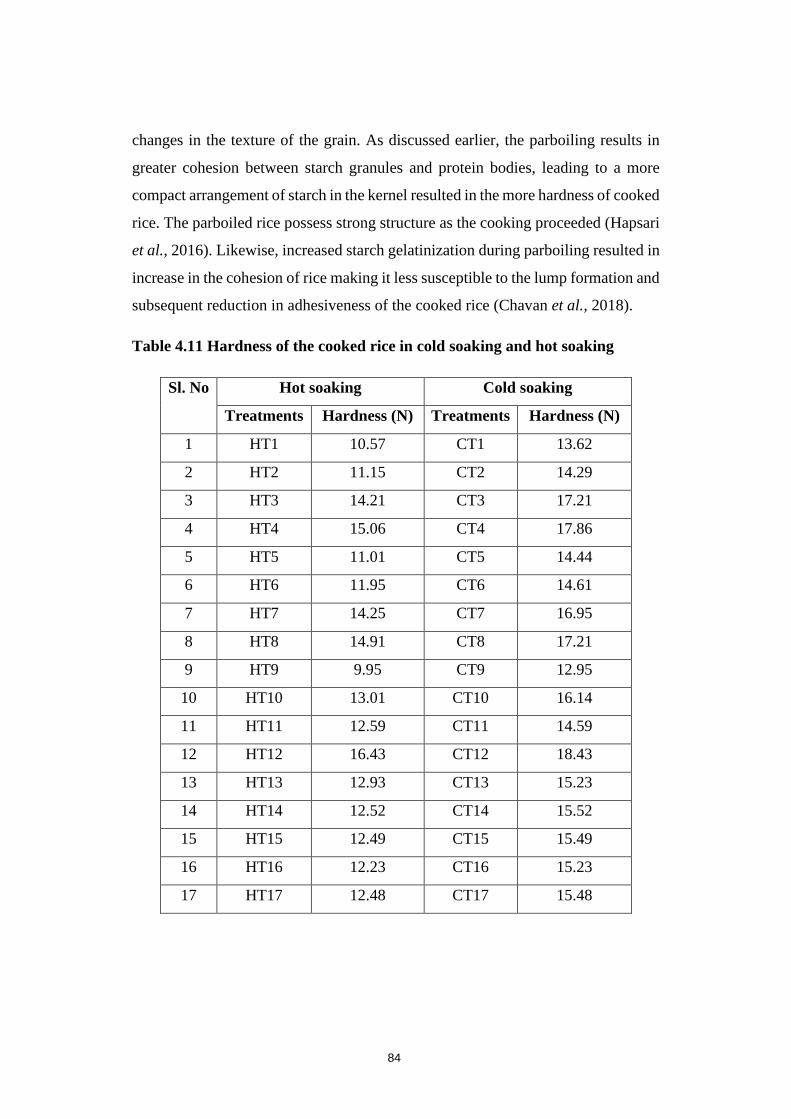
changes in the texture of the grain. As discussed earlier, the parboiling results in
greater cohesion between starch granules and protein bodies, leading to a more
compact arrangement of starch in the kernel resulted in the more hardness of cooked
rice. The parboiled rice possess strong structure as the cooking proceeded (Hapsari
et al., 2016). Likewise, increased starch gelatinization during parboiling resulted in
increase in the cohesion of rice making it less susceptible to the lump formation and
subsequent reduction in adhesiveness of the cooked rice (Chavan et al., 2018).
Table 4.11 Hardness of the cooked rice in cold soaking and hot soaking
Sl. No Hot soaking Cold soaking
Treatments Hardness (N) Treatments Hardness (N)
1 HT1 10.57 CT1 13.62
2 HT2 11.15 CT2 14.29
3 HT3 14.21 CT3 17.21
4 HT4 15.06 CT4 17.86
5 HT5 11.01 CT5 14.44
6 HT6 11.95 CT6 14.61
7 HT7 14.25 CT7 16.95
8 HT8 14.91 CT8 17.21
9 HT9 9.95 CT9 12.95
10 HT10 13.01 CT10 16.14
11 HT11 12.59 CT11 14.59
12 HT12 16.43 CT12 18.43
13 HT13 12.93 CT13 15.23
14 HT14 12.52 CT14 15.52
15 HT15 12.49 CT15 15.49
16 HT16 12.23 CT16 15.23
17 HT17 12.48 CT17 15.48
84
4.4 OPTIMISATION OF PARBOILING PROCESS VARIABLES
The optimal process condition of small-scale paddy parboiling namely,
soaking time for hot soaking (5, 6, and 7 h) and cold soaking (40, 50, 60 h), steaming
time (20, 25 and 30 min) and drying temperature (50, 60 and 70°C) were performed
using the Box-Behnken design in Design Expert Software 12.0. In the present
investigation, the independent variables were kept within the range and dependent
variables were chosen as maximum and minimum. Appendix C1 and C2 show
response optimization constraints for parboiling of paddy in hot soaking and cold
soaking respectively. The analysis showed that steaming operation significantly
influenced the milling and cooking quality parameters of paddy, like HRY,
hardness of parboiled paddy, Chroma value, cooking time, gruel solid loss and
hardness of cooked rice. Higher the drying temperatures, lower were the attributes
such as HRY and hardness. Likewise, higher the soaking and steaming durations
and drying temperatures, higher values of Chroma was obtained, which is not
desired.
The parboiling process parameters such as soaking time, steaming time and
drying temperature were analyzed for the optimal combination in the RSM using
Box-Bhenken design. The criteria considered for the parameters that offered the
maximum HRY and hardness of milled rice and cooked rice and the minimum
Chroma value, gruel solid loss and cooking time. The experimental results had the
optimum process conditions with a soaking time of 6.67 h, steaming time of 26.07
min and drying temperature of 51.48°C for hot soaking. For cold soaking, the
optimum process conditions are 60 h of steaming time followed by 27.2 min of
steaming time and drying at 52.2°C. Table 4.11 shows the optimized values of
independent parameters.
85
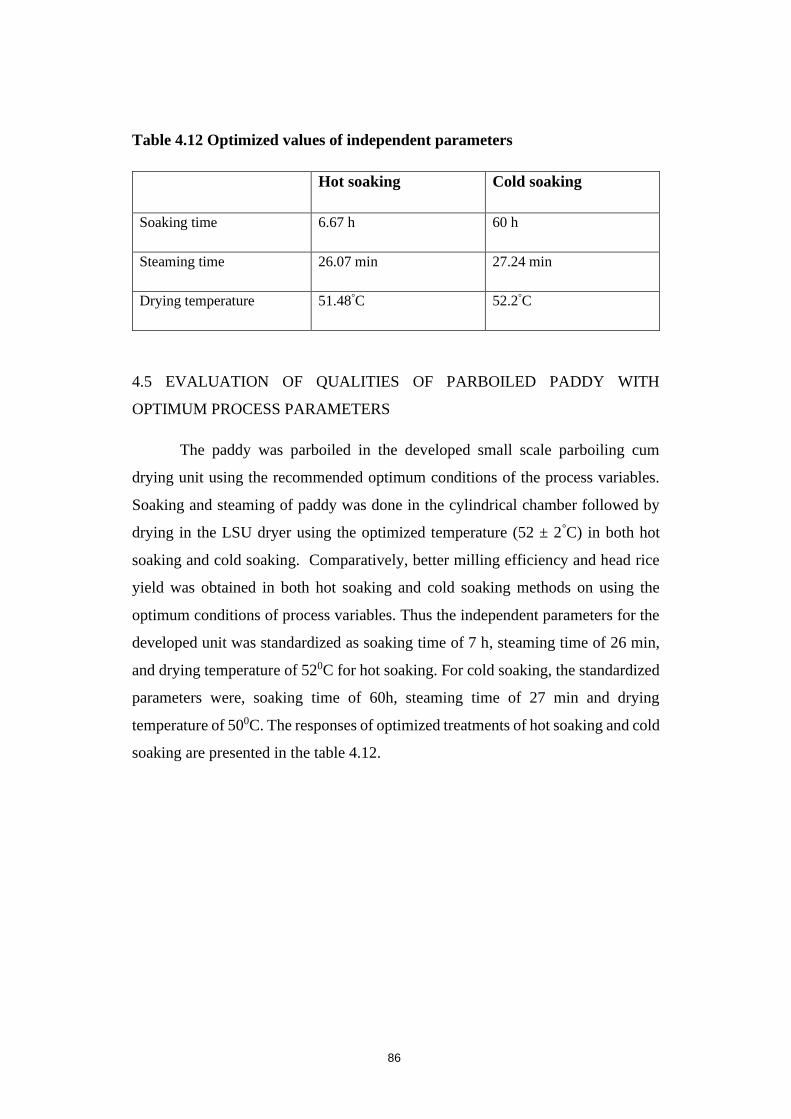
Table 4.12 Optimized values of independent parameters
Hot soaking Cold soaking
Soaking time 6.67 h 60 h
Steaming time 26.07 min 27.24 min
Drying temperature 51.48°C 52.2°C
4.5 EVALUATION OF QUALITIES OF PARBOILED PADDY WITH
OPTIMUM PROCESS PARAMETERS
The paddy was parboiled in the developed small scale parboiling cum
drying unit using the recommended optimum conditions of the process variables.
Soaking and steaming of paddy was done in the cylindrical chamber followed by
drying in the LSU dryer using the optimized temperature (52 ± 2°C) in both hot
soaking and cold soaking. Comparatively, better milling efficiency and head rice
yield was obtained in both hot soaking and cold soaking methods on using the
optimum conditions of process variables. Thus the independent parameters for the
developed unit was standardized as soaking time of 7 h, steaming time of 26 min,
and drying temperature of 520C for hot soaking. For cold soaking, the standardized
parameters were, soaking time of 60h, steaming time of 27 min and drying
temperature of 500C. The responses of optimized treatments of hot soaking and cold
soaking are presented in the table 4.12.
86
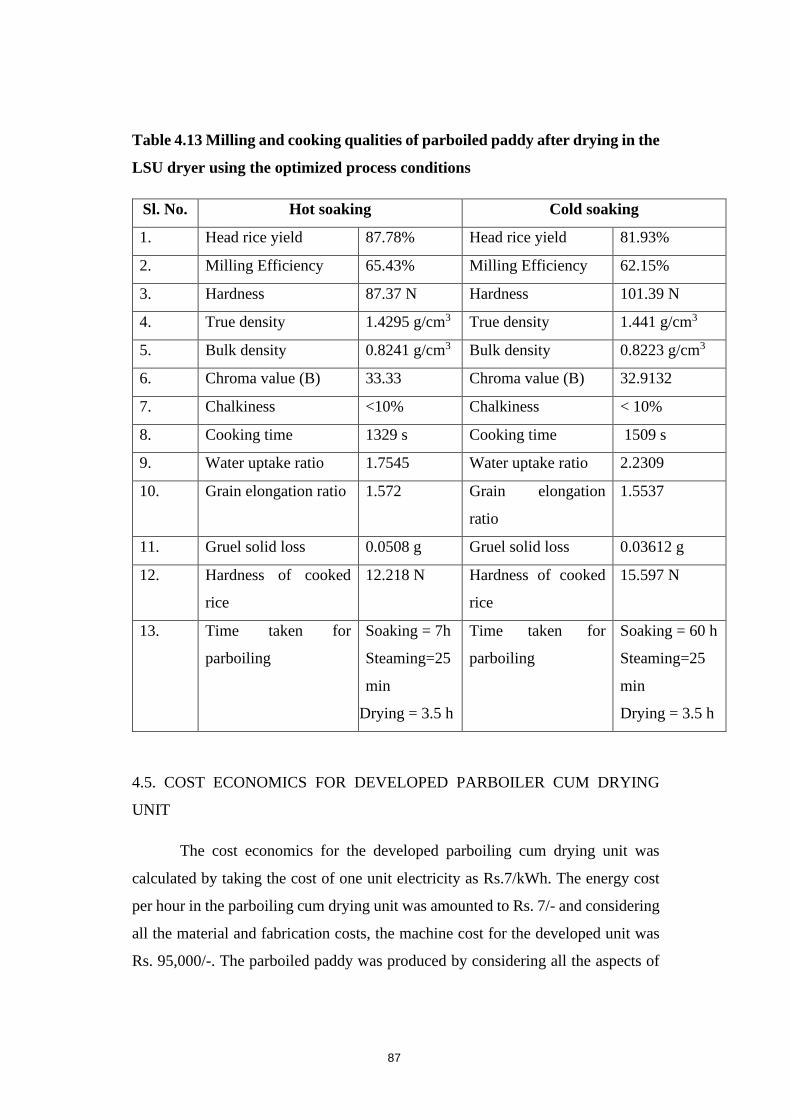
Table 4.13 Milling and cooking qualities of parboiled paddy after drying in the
LSU dryer using the optimized process conditions
Sl. No. Hot soaking Cold soaking
1. Head rice yield 87.78% Head rice yield 81.93%
2. Milling Efficiency 65.43% Milling Efficiency 62.15%
3. Hardness 87.37 N Hardness 101.39 N
4. True density 1.4295 g/cm3 True density 1.441 g/cm3
5. Bulk density 0.8241 g/cm3 Bulk density 0.8223 g/cm3
6. Chroma value (B) 33.33 Chroma value (B) 32.9132
7. Chalkiness <10% Chalkiness < 10%
8. Cooking time 1329 s Cooking time 1509 s
9. Water uptake ratio 1.7545 Water uptake ratio 2.2309
10. Grain elongation ratio 1.572 Grain elongation
ratio
1.5537
11. Gruel solid loss 0.0508 g Gruel solid loss 0.03612 g
12. Hardness of cooked
rice
12.218 N Hardness of cooked
rice
15.597 N
13. Time taken for
parboiling
Soaking = 7h
Steaming=25
min
Drying = 3.5 h
Time taken for
parboiling
Soaking = 60 h
Steaming=25
min
Drying = 3.5 h
4.5. COST ECONOMICS FOR DEVELOPED PARBOILER CUM DRYING
UNIT
The cost economics for the developed parboiling cum drying unit was
calculated by taking the cost of one unit electricity as Rs.7/kWh. The energy cost
per hour in the parboiling cum drying unit was amounted to Rs. 7/- and considering
all the material and fabrication costs, the machine cost for the developed unit was
Rs. 95,000/-. The parboiled paddy was produced by considering all the aspects of
87
fixed and variable cost involved in the investigation. The processing cost of
parboiling and milling of one kilogram paddy was Rs. 2.5/- and Rs. 2.0/-
respectively. The benefit cost ratio of the the parboiled paddy using the developed
unit was 1.33 and it was found to be economically feasible. It could be
recommended for small scale SHG/ Kudumbasree units and farmer groups. The
detailed calculation is presented in Appendix D.
88


SUMMARY AND CONCLUSION

CHAPTER V
SUMMARY AND CONCLUSION
Rice is one of the major staple food grain around the globe. India ranks
second position in rice consumption (102 million tonnes) during the period
2019-2020 (Statista, 2020). About 20% of the paddy produced in the world
undergoes parboiling process. Parboiling is an optional unit operation in paddy
processing, which results in improved milling efficiency with enhanced nutritional
quality of the rice. It helps to concentrate nutraceuticals, improves the palatability
and extends shelf life.
Parboiling is essentially a hydrothermal treatment, accomplished through
the process of soaking, steaming and drying, to gelatinize the starch. While soaking
increases the moisture content of the rice, steaming assists in the gelatinisation of
starch and drying reduces the moisture content of the paddy in harmony with the
requirements of the milling process. Parboiling yields advantages such as easier
shelling, higher head rice yield, lesser broken grains, increased resistance to insects,
firmer cooked rice texture, lesser gruel solid loss and better retention of nutrients.
Technological advancement in the industrial parboiling has resulted in
enhanced process controls in the large-scale industrial parboiling units. But the
enormous initial investments required for infrastructure, along with the time, labour
and energy involved in paddy parboiling made it uneconomical for small scale
milling and processing units to undertake parboiling. This investment and
maintenance hurdles incurred during the parboiling process results in reduced
involvement of Self-Help Groups like ‘Kudumbasree’/ Farmers cooperative
organizations, even though the sector offers potential.
Since the major share of people associated with paddy milling and
parboiling process are women, development of an improved parboiling equipment
with reduced drudgery and enhanced safety measures would significantly improve
the employment prospects and thus will reflect in their standard of living. Hence,
in the present study, a small scale gender-friendly parboiling cum drying unit was
89
developed and its performance evaluation was carried out based on the analysis of
qualities of parboiled milled rice and cooked rice.
The developed parboiling cum drying unit consists of soaking cum steaming
cylinder, LSU dryer, bucket elevator, steam boiler and heat furnace. The unit was
fabricated using food grade material SS 304, to ensure safety. Soaking and steaming
were carried out in the same chamber of capacity 100 kg/cylinder. The Steam boiler
generates the steam at a pressure of 1 kg/cm2 in the soaking cum steaming chamber.
The bucket elevator with a capacity of 500 kg/h conveys the steamed paddy into
LSU dryer and facilitates the drying process by continuous recirculation of paddy.
The LSU dryer consist of inverted V channels which acts as air inlet and outlet
ports. The hot air generated by burning of firewood in the furnace will heat up the
interior ducts of the LSU drier.
The parboiling process were carried out for the paddy crop variety Jyothi at
different combinations of soaking and steaming time and drying temperatures for
the performance evaluation of the developed unit. Trials were conducted with two
different methods of soaking viz. hot and cold soaking. Cold soaking method
consists of keeping the paddy in normal water for 40 h, 50 h, and 60 h, respectively.
The hot soaking consists of soaking the paddy at a temperature of 70°C with
corresponding soaking time of 5h, 6 h and 7 h, respectively. The soaked paddy was
subjected to steaming for a duration of 20 min, 25 min and 30 min. The steamed
paddy was conveyed into the LSU dryer to achieve optimum moisture content
suitable for milling. The required air temperature for heat furnace-based LSU dryer
was fixed according to the optimum temperature obtained from hot air dryer which
dried the paddy at three drying temperatures (50, 60 and 70℃). Seventeen treatment
combinations were selected for both hot and cold soaking based on Response
Surface Methodology Box Bhenken design.
The effect of varying parameters on the milling and cooking qualities of
parboiled rice were analysed for the performance evaluation of the developed unit.
The attributes to evaluate the effectiveness of milling were efficiency, head rice
yield, hardness, bulk density, true density, and chalkiness of the parboiled milled
90
rice. Cooking time, water uptake ratio, grain elongation ratio, hardness and gruel
solid loss were the cooking qualities measured for the evaluation. Statistical
analysis was done to study the effect of varying parameters on the milling and
cooking qualities based on RSM Box Bhenken design.
Milling efficiency of 66.7% and head rice yield of 88.67% were observed
in hot soaking for paddy parboiled with a soaking duration of 7 h, steaming time of
25 min and drying temperature of 50℃. Cold soaking yielded a milling efficiency
of 64.49% and head rice yield of 84.24% with a soaking duration of 40 h, steaming
time of 25 min and drying temperature of 70℃. Milling efficiency and head rice
yield increased with increase in the steaming time up to a certain limit (25 min) and
later it decreased. Milling efficiency and head rice yield decreased with increase in
the drying temperature.
The variation in steaming time and drying temperature had significant effect
on the hardness of the milled parboiled rice. Hardness value of 90.38 N and
103.02 N were found respectively for hot and cold soaking that steamed for 25 min
and dried at 50℃. Parboiling increased the chroma value and reduced the
chalkiness in the rice kernel for both soaking methods. The bulk density and true
density were not significantly affected by the parboiling process since it depended
on the roundness of kernel and degree of milling.
The variation in steaming time had a significant effect on the cooking
qualities of parboiled-milled rice. Cooking time of 24.52 min and 25.45 min and
corresponding water uptake ratio of 2.43 and 2.62 were obtained for the steaming
time of 30 min in hot soaking and cold soaking methods, respectively. The gruel
solid loss was found to be decreased with increased duration of steaming. The
hardness of the cooked rice improved as a consequence of parboiling.
Statistical analysis using RSM Box Benkhen design revealed that the
milling efficiency, head rice yield and hardness of the parboiled milled rice
followed a similar trend in the variation of steaming time and drying temperature.
The increase in steaming time had a significant effect on the cooking properties of
91
the parboiled milled rice. The cooking time, water uptake ratio and grain elongation
ratio had positive response with increase in steaming time and inversely associated
to the gruel solid loss.
Soaking duration of 6.67 h, steaming duration of 26 min and drying
temperature of 51.48℃ was optimised as the best treatment combination for hot
soaking. In case of cold soaking, the optimised treatment combination were 60 h
soaking time, 27.24 min steaming time and 52.2℃ drying temperature. The trials
were conducted in the LSU dryer using the optimised temperature and the responses
were verified. Optimised treatment combination gave better milling efficiency and
higher head rice recovery, high hardness, less chroma value and a reduced solid
gruel loss in both hot and cold soaking process. The time taken for the drying
process was 4 h in both soaking methods.
The processing cost of parboiling and milling of one-kilogram paddy with
the developed unit were Rs. 2.55/- and Rs. 2.0/-; respectively. The benefit cost ratio
for the parboiling process was obtained as 1.33:1, which revealed that the developed
unit was economically feasible.
In the present study, a small-scale parboiling cum drying unit was
successfully developed for paddy processing with reduced drudgery and less human
interventions. Further studies may be undertaken to improve this newly developed
unit by replacing the heat furnace with a heat exchanger. Besides, the capacity of
the parboiling unit could be enhanced by increasing the number of soaking cum
steaming chambers. Moreover the huller used in the present study may be replaced
by rubber roll shellers to improve the milling efficiency.
92

REFERENCES

REFERENCES
A.O.A.C. 1980. Official Methods of Analysis. Association of Analytical Chemists.
Arlindton, USA.
Agrawal, A. K., Lavanya, K. and Sinha, G., 2015. Paddy parboiling for improved
milling, better cooking and higher recovery of rice bran oil. Madras Agric.
J. 102: 285-289.
Ali, N. and Ojha, T. P. 1976. Parboiling. Rice Postharvest Technology.163-204p.
Ali, N. and Pandya, A. C., 1974. Basic concept of parboiling of paddy. J. Agri. Eng
Res. 19: 111-115.
Anggi, H. H., Seon, J. K. and Jong, B. E. 2016. Physical characteristics of parboiled
korean glutinous rice (Olbyeossal) using a modified method. Food Sci.
Technol. 68: 499-505.
Anon., 2016. Agricultural Processing Equipments: Value additions. TNAU Agri
tech Portal: Agricultural Engineering.
Available: http://www.agritech.tnau.ac.in.
Araullo, E. V., Padua, D. B. and Graham, M., 1976. Rice postharvest technology.
Ottawa: International Development Research Centre, Canada. 394p.
Ayamboo, A. J., Demuyakor, B., Saalia, F. K. and Francis A. 2014. Effect of
varying parboiling conditions on cooking and eating / sensory
characteristics of Jasmine 85 and Nerica 14 rice varieties. Am. J. Food
Technol. 9: 1-14.
Bandopadhyay, S. and Roy, N. C. 1976. Kinetics of absorption of liquid water by
paddy grains during parboiling. Ind. J. Technol. 14: 27-32.
Bas, D. and Boyaci, I. H. 2007. Modelling and optimisation I: usability of response
surface surface methodology. J. Food Eng. 78(3): 836-845.
93
Bello, M. O., Loubes, M. A., Aguerre, R. J. and Tolaba, M. P. 2015. Hydrothermal
treatment of rough rice: Effect of processing conditions on product
attributes. J. Food Sci. Technol. 52(8): 5156-5163.
Bello, M., Baeza, R. and Tolaba, M. P. 2006. Quality Characteristics of milled and
cooked rice affected by hydrothermal treatment. J. Food Eng.72: 124-133.
Bhattacharya, K. 2011. Rice Quality (1st Ed.). Woodhead Publishing Limited.
Cambridge, UK.
Bhattacharya, K. R. & Subba Rao, P. V., 1996. Effect of processing conditions on
quality of parboiled rice. J. Agric. food and food chem. Volume 14, pp. 476-
479.
Bhattacharya, K. R. 1985. Rice Chemistry and Technology. USA: AACC, St. Paul,
MA. 289-348p.
Bhattacahrya, K. K. 1985. Effect of parboiling on rice quality. Rice Quality. 247-
297p.
Bhattacharya, K. R. and Ali, S. Z. 1985. Advance in Cereal Science and
Technology. AACC, St. Paul, M. N.
Bhattacharya, K. R. and Rao, S. P. V. 1966. Effect of processing conditions on
quality of parboiled rice. J. Agric. Food Chem. 14: 476-479.
Bhattacharya, K. R. and Rao, S. P. V. 1996. Processing conditions and milling yield
in parboiled rice. J. Agric. food food chem. 14: 473-475.
Bhattacharya, K. R. and Swamy, Y. M. I. 1967. Conditions of drying parboiled
paddy for optimum milling quality. Cereal Chem. 44: 592-600.
Bhattacharya, K. R., 1969. Breakage of rice during milling and effect of parboiling.
Cereal chem. 46(5): 478-485.
Bualuang, O., Tirawanichakul, Y. and Tirawanichakul, S. 2013. Comparative study
between hot air and infrared drying of parboiled rice: kinetics and quality
Aspects. J. Food Process Preserv. 37: 1119-1132.
94
Buggenhout, J., Brijis, K., Celus, I. and Delcour, J. A. 2013. The breakage
susceptibility of raw and parboiled rice: A review. J. Food Eng. 17: 304-
315.
Chakraverty, A. 1981. Post harvest technology of cereals and pulses. Oxford and
IBH Publishers, New Delhi.
Champa, W. A. H., Fernando, M. D. and Palipane, K. B. 2006. Hydrothermal
treatment to increase head rice yield and to improve palatability
characteristics of rice. Innovative Approaches in post harvest Eng. Technol.
72-79p.
Chavan, P., Sharma, S. R., Mittal, T. C. Mahajan, G. and Gupta, S. K. 2018. Effect
of Parboiling Technique on Physico-chemical and Nutritional
characteristics of Basmati Rice. Agric Res. J. 55(3): 490-499.
Danbaba, N., Nkama, I., Badau, M. H., Ukwungwu, M. N., Maji, A. T., Abo, M.
E., Hauwawu, H., Fati, K.I. and Oko, A. O. 2014. Optimization of Rice
parboiling process for optimum Head Rice Yield: A Response Surface
Methodology (RSM) Approach. Int. J. Agric. Forestry. 4(3): 154-165.
Danbaba, N., Nkama, I., Badau, M. H., Ukwungwu, M. N., Maji, A. T., Abo, M.
E., Hauwawy, H., Fati, K. I. and Oko, A. O. 2014. Optimization of Rice
Parboiling Process for Optimum Head Rice Yield: A Response Surface
Methodology (RSM) Approach. Int. J. Agric. Forestry. 4(3): 154-165.
Das, S., Mukherjee, R. K. and Chakraverty, A. 2004. Development of production
technique for crystalline parboiled rice.. J. Agric. eng. 23(1): 99-104.
Dimick, D. 2014. Here’s why we haven’t quite figured out how to feed billions
more people. National Geographic News, 4 Oct. 2014.
Dutta, H. and Mahanta, C. L. 2012. Effect of hydrothermal treatment varying in
time and pressure on the properties of parboiled rices with different amylose
content. Food Res. Int. 49: 655-663.
95
Dutta, H., Mahanta, C. L., Singh, V., Baruah, B. and Rahman, N. 2015. Physical,
physicochemical and nutritional characteristics of Bhoja chaul, atraditional
ready to eat dry parboiled rice product processed by an improvised soaking
technique. Food chem.
Ejebe, C., Danbaba,, N. and Ngadi, M. 2015. Effect of steaming on physical and
thermal properties of parboiled rice. Eur. Int. J. of Sci. Technol. 4(4): 71-80.
FAOSTAT. 2019. FAOSTAT home page [on line]. Available:
http://www.fao.org/faostat/en/#data/QC
Fofana, M. 2011. Effect of improved parboiling methods on the physical and
cooked grain characteristics of rice varieties in Benin. Int. Food Res. J. 18:
715-721.
Gariboldi, F. 1974. Rice processing. Rome, Italy, Food and Agricultural
Organisation of the United Nation. 97p.
Gbabo, Agidi, Abdullahi, Lukman and Kuku, M. A. 2014. Design, Fabrication and
testing of improved traditional Rice Parboiler. Int. J. Eng. Tech. Res. 2(9):
331-338.
Goswami, T. K. and Murlidhar, M. 2015. Quick Parboiling, Drying and Milling of
Paddy. J. Food Dairy Technol. 3(2): 37-42.
Graham, S. A., Manful, J. T. Ndindeng, S. A. and Tchatcha, D. A.. 2015. Effects of
soaking and steaming regimes on the quality of artisanal parboiled rice. J.
Food Process. Preserv. 1-11p.
Gunathilake, D. M. C. 2018. Application of two temperature hot water soaking for
improving of paddy parboiling process. Agric. Eng. Int. 20(4): 164-168.
Hall, C. W. 1970. Handling and Storage of Food Grains in Tropical and Subtropical
Areas. FAO Agricultural Development Paper. 90p.
96
Hapsari, A. H., Kim, S. J. and Eun, J. B. 2016. Physical characteristics of parboiled
Korean glutinous rice (Olbyeossal) using a modified method. LWT- Food
Sci. and Technol. 68: 499-505.
Haque, A. K. M. A., Choudhury, N. H., Quasem, M. A. and Arboleda, J. R. 1997.
Rice post - harvest practices and loss estimates in bangladesh -part III:
Parboiling to milling. Agric. Mech. Asia, Afr. and Latin Am. 28(3): 51-55.
Hasbullah, R. 2017. Steaming process of paddy to improve quality and reduce
glycemic index of parboiled rice. Acta Hortic: 1152p.
Hashemi, J., Naoto, S. and Tushinori, K., 2005. Controlled ambient aeration during
rice storage II: Effects on rice quality. ASAE Annual Meeting.
Himjyoti and Dutta. 2016. Study on the effects of parboiling on rice and rice
products of Assam. Ph.D (Food Eng. and Technology) thesis, Tezpur
University, Tezpur.
Houssou, P. and Amonsou, E. 2004. Development on improved parboiling
equipment for paddy rice in benin. Uganda J. Agril. Sci. 9: 617-620.
Igathinathane, C., Chattopadhyay, P. K. and Pordesimo, L. O. 2005. Combination
soaking procedure for rough rice parboiling. Trans. Am. Soc. Agric.
Engineers. 48(2): 665-671.
IKISAN, 2019. Agri-Informatics and Servicces: Rice Marketing. Available:
http://www.ikisan.com/ka-rice-marketing.html
Ilyas, M. S. and Goel, R. K. 2003. Paper presented in the national Seminar on value
addition in paddy held at Chennai: A solution to surplus production. 23-24p.
Indiastat, 2020. Season-wise Area, Production and Productivity of Rice in India
(1949-1950 to 2020-2021-1st Advance Estimates). Available:
https://www.indiastat.com/table/agriculture-data/2/rice-production/data.
97
Insprasit, C. and Noomhorm, A. 2001. Effect of drying air temperature and grain
temperature of dryer and operation on rice quality. Drying technol. 19(2):
389-404.
International Rice Research Institute (IRRI). 2009. Rice Knowledge bank.
www.knowledgebank.irri.org.
IRRI Rice knowledge bank. n.d. Drying Available:
http://www.knowledgebank.irri.org/grainQuality/module_4/popups/pu_dr
ying.htm
Islam, M. D., Shimizu, N. and Kimura, T., 2001. Quality Evaluation of Parboiled
Rice with Physical Properties. Food Sci. Tehnol. Res. 57-63p.
Islam, M. R., Shimizu, N. and Kimura, T. 2003. Effect of processing conditions on
cooking qualities of parboiled rice. J. Jpn. Soc. Agr. Mach. 65(23): 85-93.
Islam, M. R., Shimizu, N. and Kimura, T. 2004. Energy requirement in parboiling
and its relationship to some important quality indicators. J. Food Eng. 63:
433-139.
Islam, R., Roy, P., Shimizu, N. and Kimura, T. 2002. Effect of processing
conditions on physical properties of parboiled rice. Food Sci. Technol. Res.
8(2): 106-112.
Itoh, K. and Kawamura, S. 1985. Processing conditions of parboiled rice and its
qualities (Studies on parboiled rice part I). Nippon Shokuhin Kogyo
Gakkaishi. 32: 471-479.
Kashaninejad, M., Dehghani, A. A. and Kashiri, M. 2009. Modeling of wheat
soaking using two artificial neural networks (MLP and RBF). J. Food Eng.
91: 602-607.
Kashaninejad, M., Maghsoudlou, Y., Rafiee, S. and Morteza, K. 2007. Study of
hydration kinetics and density changes of rice (Tarom Mahali) during hydro
thermal processing. J. Food Eng. 39: 17-22.
98
Kato, H., Ohta, T., Tsugita, T. and Hosaka, Y. (1983). Effect of parboiling on
texture and flavor components of cooked rice. J. Agric. Food Chem. 31:818-
823.
Khatoon, N. & Prakash, J., 2007. Physico-chemical characteristics , cooking quality
and sensory attributes of microwave cooked rice varieties. Food Sci.
Technol. Res. 13(1): 35-40.
Kimura, T. 1983. Properties of parboiled rice produced from Japanese paddy. Agric.
Mech. Asia, Afr. Latin Am. 14(58): 31-33.
Kimura, T. 1991. Effects of processing conditions on the hardening characteristics
of parboiled grain. J. Soc. Agric. Struct. Jpn. 22(2): 49-54.
Kondo, M. 2006. Analysis on the effects of air temperature during ripening and
grain protien contents on grain chalkiness in rice. Jpn J. Crop Sci. 75: 234-
235.
Kondo, M., 2006. Analysis on the effects of air temperature during ripening and
grain protien contents on grain chalkiness in rice. Jpn J. crop Sci. 75: 234-
235.
Kurien, P., Murty, R., Desikachar, H. and Subramanyan, V. 1964. Effect of
parboiling on the swelling quality of rice. Cereal Chem. 41: 16-22.
Lamberts, L. 2006. Effect of processing conditions on colour change of brown and
milled parboiled rice. Cereal chem. 83: 80-85.
Lan, Y. and Zheng, X. 2004. Rice taste and quality affected by drying conditions.
Ottava, Ontario, Canada.
Larsen, H. N., Rasmussen, O. W., Rasmussen, P. H., Alstrup, K. K., Biswas, S. K.,
Tetens, I. Thilsted, S. H. and Hermansen, K. 2000. Glycemic Index of
Parboiled rice depends on the severity of processing: study in type two
Diabetic subjects. European J. Clinical Nutri. 54: 380-385.
99
Leethanapanich, K., Mauromoustakos, A. and Wang, Y. J. 2016. Effect of soaking
temperature on commingled rice properties. J, Cereal Sci. 69: 267-274.
Levan, K. V., Regina, M. F., Sailaja, L. and Sajeev, M. S. 1990. Design and
fabrication of husk fired inclined grate furnace and testing of CRRI mini
parboiling unit. B. Tech. (Ag. Eng.) report, Kerala Agricultural University,
Thrissur.
Lin, Z., Zheng, D., Zhang, X., Wang, Z., Lei, J. and Lui, Z. 2016. Chalky part differs
in chemical composition from translucent part of japonica rice grains as
revealed by a notched-belly mutant with white-belly. J. Sci. Food Agric. 96:
3937-3943.
Litchfield, J. B. and Okos, M. R., 1988. Prediction of corn kernel stress and
breakage induced by drying, tempering and cooling. Trans. ASAE. 31: 585-
594.
Luh, B. S. and Mikus, R. R., 1980. Parboiled rice in rice production and utilization.
501-542p.
Luz, M. L. G. S., Elias, M. C. and Luz, C. A. S., 1993. Evaluation of tempering
time for parboiled rice. University dade Federal de Pelotas, Pelotas RS,
Brazil. 190p.
Lyon, B. G. 1999. Effects of degree of milling, drying condition and moisture
content on sensory texture of cooked rice. Cereal Chem. 76(1): 56-62.
Manful, J. T., Abbey, L. D. and Coker, R. D. 2009. Effect of artisanal parboiling
methods on milling yield and cooked rice textural characteristics. J. Food
Quality. 32: 725-734.
Manful, J. T., Grimm, C. C., Gayin, J. and Coker, R. D. 2008. Effect of variable
parboiling on crystallinity of rice samples. Cereal Chem. 85: 92-95.
100
Marshall, W. E., Wadsworth, J. I., Verma, L. R. and Velupillai, L. 1993.
Determining the degree of gelatinisation in parboiled rice: comparison of a
subjective and objective method. J. Cereal Chem. 70(2) : 226-230.
Meresa, A., Demissew, A., Yilma, S., Tegegne, G. and Temesgen, K. 2020. Effect
of parboiling conditions on physical and cooking quality of selected rice
varieties. Int. J. Food Sci. 1-9p.
Miah, M. A. K., Haque, A., Douglass, M. P. and Clarke, B. 2002. Effect of hot
soaking time on the degree of starch gelatinisation parboiling of rice. Int. J.
Food Sci. Technol. 37(5): 539 - 545.
Miah, M. A. K., Haque, A., Douglass, M. P. and Clarke, B. 2002. Parboiling of rice.
Part I: Effect of hot soaking time on quality of milled rice. Int. J. Food Sci.
Technol. 37: 527-537.
Mohanty, S. N., Bal, S., Das, S. K. and Panda, M. K. J. 2002. Efffects of hydrostatic
parboiling on milling quality of rice. J. Agril. Eng. 39(2): 9-14.
Mustapha, F.O. 1979. The effect of parboiling on some physicochemical properties
of some local rice varieties. B.Sc. thesis, University of Ife, Nigeria.
Naik, R., Murty, R. K. G. R. and Virakramath, B. C. 2006. Value addition of
selected rice hybrids through parboiling. Oryza. 43(1): 48-50.
Nayak, P. 1996. Problems and prospects of rice mill modernization; a case study.
J. Assam Univ. 1(1): 22-28.
Ndindeng, S. A., Manful, J. T., Futakuchi, K., Mapiemfu, D.L. and Etoa, A. 2015.
A novel artisanal parboiling technology for rice processors in sub-Saharan
Africa. Food Sci. and Nutr. 3(6): 557-568.
Ogunbiyi, M. O., Adejumo, B. A., Gbabo, A. and Chinma, C. E.2018. Optimisation
of parboiling Process using Response Surface Methodology (RSM) to
improve the Physical Properties of Parboiled Milled Rice. Int. J. Eng. Res.
Technol. 7(7): 312-318.
101
Oko, A. O., Ubi, B. E. and Dambaba, N. 2012. Rie cooking quality and physico-
chemical characteristics: a comparative Analysis of Selected Local and
Newly Introduced Rice Varieties in Ebonyi staye, Nigeria. Food Public
Health. 2(1): 43-49.
Oli, P., Ward, R., Adhikari, B. and Torley, P. 2014. Parboiled rice: Understanding
from a material science vapproach. J. Food Eng.124: 173-183.
Ondier, G. O., Siebenmorgen, T. and Mauromoustakos, A. 2012. Drying
characteristics and milling quality of rough rice dried in a single pass
incorporating glass transition principles. Dry Technol. 30: 1821-1830.
Otegbayo, B. O., Osamuel, F. and Fashakin, J. B. 2001. Effect of parboiling on
physico- chemical qualities of two local rice varieties in Nigeria. J. Food
Technol. Afr. 6: 130-132.
Pal, P., Singh, N., Kaur, P. amd Kaur, A. 2018. Effect of parboiling on phenolic,
protein and pasting properties of rice from different paddy varieties. J. Food
Sci. 1:1-11
Panigrahi, A. K., Mishra, S. and Mohapatra, U. 2019. Economics of small-scale
mill in Ganjam district of Odisha. J. Pharmacogn. Phytochem. 8(2): 1579-
1582.
Parnsakhorn, S. and Noomhorm, A. 2008. Changes in physicochemical properties
of parboiled brown rice during heat treatment. Agric. Eng. Int. CIGR.
8: 1-20.
Patindol, J., Newton, J. and Wang, Y. J. 2008. Functional properties as affected by
laboratory - scale parboiling of rough rice and brown rice. J. Food Sci.
73(8): 370-377.
Piillaiyar, P. 1995. Influence of processing variables on the production and quality
of parboiled rices. Unpublished phD thesis, Annamalai University,
Annamalai Nahar.
102
Pillaiyar, P. 1990. Rice: Postproduction Manual. Wiley Eastern Ltd. New Delhi,
India.
Pillaiyar, P. and Mohandoss, R, 1981. Hardness and colour in parboiled rices
produced at low and high temperatures. J. Food Sci. Trechnol. 18: 7-9.
Pillaiyar, P., Vasan, B. S., Rajendran, G. and Dhamarajan, V. 1980. Prevention of
foul odour and minimizing soaking loss in conventional parboiling of
paddy. J. Food Sci. Technol. 17: 228-230.
Rahaman, M. A., Miah, M. A. K. and Ahmed, A. 1996. Status of rice processing
technology in bangladesh in Bangladesh. Agric. Mech. in Asia, Afr. Latin
Am. 27: 46-50.
Ramachandra, Y. V., Subramanian, D. K., Joshi, N. V. and Gunaga, S. V. 2000.
Domestic energy consumption pattern in uttara kannada District, Karnataka
state. Indian J. Energy Conserv. Manag. 41: 775-831.
Ramesh, M., Ali, S. Z. and Bhattacharya, K. R. 1999. Structure of rice starch and
its relation to cooked rice texure. Carbohydr. Polym. 38: 337-347.
Rao, P. S., Bal, S. and Goswami, T. K. 2007. Modelling and optimization of drying
variables in thin layer drying of parboiled paddy. J. Food Eng. 78: 480-487.
Rockembach, C. T., Halal, S. L. M. E., Mesko, M. F.,Gutkoski, L. C., Elias, M. C.
and Oliveira, M. D. 2019. Morphological and physicochemical properties
of rice grains submitted to rapid parboiling by microwave irradiation. LWT-
Food Sci. Technol. 103: 44-52.
Roseline, B.T.M., Fofana, M., Innocent, B. and Futakuchi, K. 2010. Effect of
parboiling and storage on grain physical and cooking characteristics of the
some NERICA rice varieties. Innovations and Partnerships to Realize
Africa’s Rice Potential. Second Africa Rice Congress, Bamako, Mali.
Roy, P., Shimizu, N., Furuichi, S. and Kimura, T. 2003. Improvement of traditional
parboiling process. J. Jpn. Soc. Agrc. Mach. 65(1): 159-166.
103
Roy, P., Shimizu, N., Shiina, T. and Kimura T. 2006. Energy consumption and cost
analysis of local parboiling processes. J. Food Eng. 646-655p.
Roy, P., Shimizu, N., Shiina, T. and Kimura, T. 2003. Life cycle inventory analysis
of local parboiling processes. J. Jpn Soc. Agric. Mach. 67(1): 61-67.
Saeed, F., Pasha, I., Anjum, F. M., Suleria, H. A. R. and Farooq, M. 2011. Effect
of parboiling on physicochemical and cooking attributes of different rice
cultivars. Int. J. Food Safety. 13: 237-245.
Sahay, K. M. and Singh, K. K. 2001. Unit operations of agricultural processing
(2nd Ed.). Vikas Publishing House Pvt. Ltd, New Delhi, 274p.
Saifullah, M. H. S., Dwyane, A., Suter and Lan, Y. 2004. Effect of steaming, drying,
storage and loading rate on the stress relation constant of parboiled rice. Am.
Soc. Agric. biol. Eng.
Saikrishna, A., Dutta, S., Subramanian, V. and Moses, J.A. 2013. Ageing of rice: A
review. J. Cereal Sci. 81: 161-170.
Samsher and Narain, M. 1989. Fissuring and milling behaviour of paddy as
influenced by drying air temperature. IE (I) J. 69: 66-72.
Sareepuang, K., Siriamornpun, S., Wiset, L. Meeso, N., 2008. Effect of soaking
temperature on physical, chemical and cooking properties of parboiled
Fragrant rice. World J. Agric. Sci. 4(4): 409-415.
Saxena, G. K., Bal, S. and Siripurupu, S. C. B. 1989. Effect of continous steaming
under pressure on the quality of rice parboiled at different initial moisyure
contents. J. Agric. Eng. 26(3): 282-288.
Shrivastava, A. K. and Narain, M. 1990. Effect of grain fissuring on milling quality
of paddy. J. Inst. of Eng.71: 6-9.
Shwetha, M. K. 2011. Economics of Paddy Processing: A comparative analysis of
Conventional and Modern Rice Mills, Karnataka. J. Agri. Sci. 24(3): 331-
335.
104
Simi, V. P. & Sudeep, P. S., 2006. Studies on Pressure parboiling of paddy. B. Tech
(Agric. Eng.) report, Kerala Agricultural university.
Sindhu, S. J., Gill, M. S. and Bains, G. S. 1975. Milling of paddy in relation to yield
and qualty of rice of different Indian varieties. J. Agric. Food Chem. 23(6):
1183-1185.
Singha, K. 2012. Economics of paddy processing industry in India: a case of
Karnataka. Sci. J. Agric. 1(4): 80-91.
Soponronnarit, S., Nathakaranakule, A., Jirajindalert, A. and Taechapairoj, C. 2005.
Parboiling brown rice using super heated steam fluidisation technique. J.
Food Eng. 75: 423-432.
Srisang, N. and Chungchaoren, T. 2019. Quality attributes of parboiled rice
prepared with a parboiling process using a rotating sieve system. J. Cereal
Sci. 85: 286-294.
Statista, 2020. Global rice consumption 2019/20. Available:
https://www.statista.com/statistics/255977/total-global-rice-consumption/
Swasdisevi, T., Sriariyakula, W., Tia, W. and Soponronnarit, S., 2010. Effect of
pre-steaming on production of partially-parboiled rice using hot-air
fluidization technique. J. Food Eng. 96: 455-462.
Taghinezhad, E., Khoshtaghaza, M. H., Minaei, S. Suzuki, T. 2016. Relationship
between degree of starch gelatinisation and quality attributes of parboiled
rice during steaming. Rice Sci. 23(6): 339-344.
Taghinezhad, E., Khoshtaghaza, M. H., Minaei, S. and Latifi, A. 2015. Effect of
soaking temperature and steaming time on the quality of parboiled Iranian
Paddy Rice. Int. J. Food Eng., 11(4): 547-556.
Tetens, S. K., Biswas, L. V., Gilts, K. A., Kabir, S. H., Thilsted, T. and Choudhury,
N. H. 1997. Physico-chemical characteristics as indicators of starch
availability from milled rice. J. Cereal Sci., Volume 26, pp. 355-361.
105
Tian, Y., Zhao, J., Xie, Z., Wang, J., Xu, X. and Jin, Z. 2014. Effect of different
pressure- soaking treatments on colour, texture, morphology and
retrogradation properties of cooked rice. LWT- Food Sci. Technol. 55(1):
368-373.
Umogbai, V. I. (2013). Development of a farm level paddy rice parboiling device.
Int. J. Recent Technol. Eng. 2(2): 16-21.
Varadharaju, N. and Sreenarayanan, V. 2004. Energy requirement for conduction
parboiling paddy. J. Irrig. Eng. 85: 37-43.
Vassan, B. S. 1982. Improvement of quality of parboiled rice in the modern mills.
J. Agric. Eng. 19: 59-60.
Velupillai, L. and Verma, L. R. 1986. Drying andefffects on parboiled rice quality
tempering. Trans. ASAE. 29(1): 312-319.
Wahengbam, E. D. and Hazarika, M. K. 2019. Quality of ready-to-eat komal chawal
produced by brown rice parboiling method. J. Food Sci. Technol, 56(1):
187-199.
Wiset, L. 2001. Effects of high temperature drying on rice quality. Agric. Eng. Int.
Volume 3.
Xiaonan, X. 2019. Effect of ultra-high pressure on quality characteristics of
parboiled rice. J. Cereal Sci. 87: 117-123.
Yolmeh, M. and Jafari, S. M. 2017. Applications of Response Surface Methodology
in the Food Industry Processes. Food Bioprocess Technol. 10: 413-433.
Yousaf, K. Kunjie, C. Cairong, C. Abbas, A. Huang, Y. Arslan, C. and Xuejin, Z.
2017. The Optimization and Mathematical Modeling of Quality Attributes
of Parboiled Rice Using a Response Surface Method. J. Food Quality. 1-
12p.
Zheng, X. and Lan, Y. 2007. Effects of Drying Temperature and Moisture Content
on Rice Taste Quality. Agric. Eng. Int. 9: 1-9.
106
Zohoun, E. V., Tang, E. N., Soumanou, M. M., Manful, J. Akissoe, N. H., Bigoga,
J. Futakuchi, K. Ndindeng, S. A. 2017. Physicochemical and nutritional
properties of rice as affected by parboiling steaming time at atmospheric
pressure and variety. Food Sci. Nutr. 6: 638-652.
107


APPENDICES

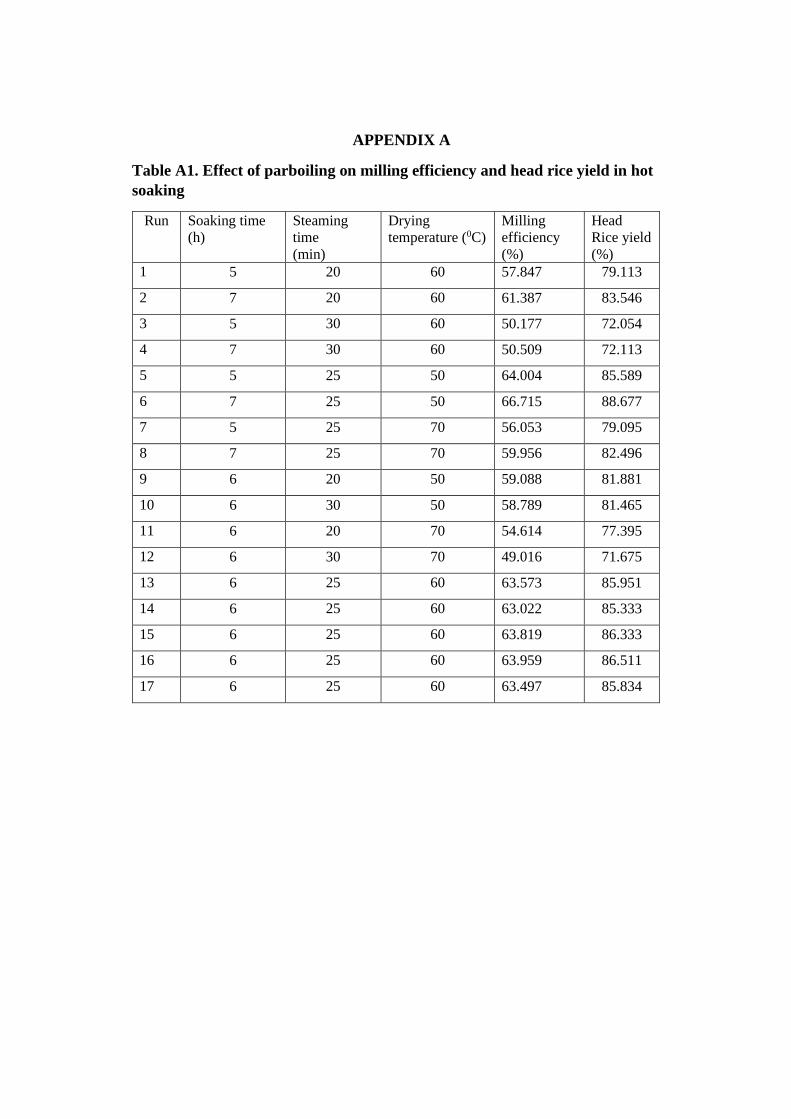
APPENDIX A
Table A1. Effect of parboiling on milling efficiency and head rice yield in hot
soaking
Run Soaking time
(h)
Steaming
time
(min)
Drying
temperature (0C)
Milling
efficiency
(%)
Head
Rice yield
(%)
1 5 20 60 57.847 79.113
2 7 20 60 61.387 83.546
3 5 30 60 50.177 72.054
4 7 30 60 50.509 72.113
5 5 25 50 64.004 85.589
6 7 25 50 66.715 88.677
7 5 25 70 56.053 79.095
8 7 25 70 59.956 82.496
9 6 20 50 59.088 81.881
10 6 30 50 58.789 81.465
11 6 20 70 54.614 77.395
12 6 30 70 49.016 71.675
13 6 25 60 63.573 85.951
14 6 25 60 63.022 85.333
15 6 25 60 63.819 86.333
16 6 25 60 63.959 86.511
17 6 25 60 63.497 85.834
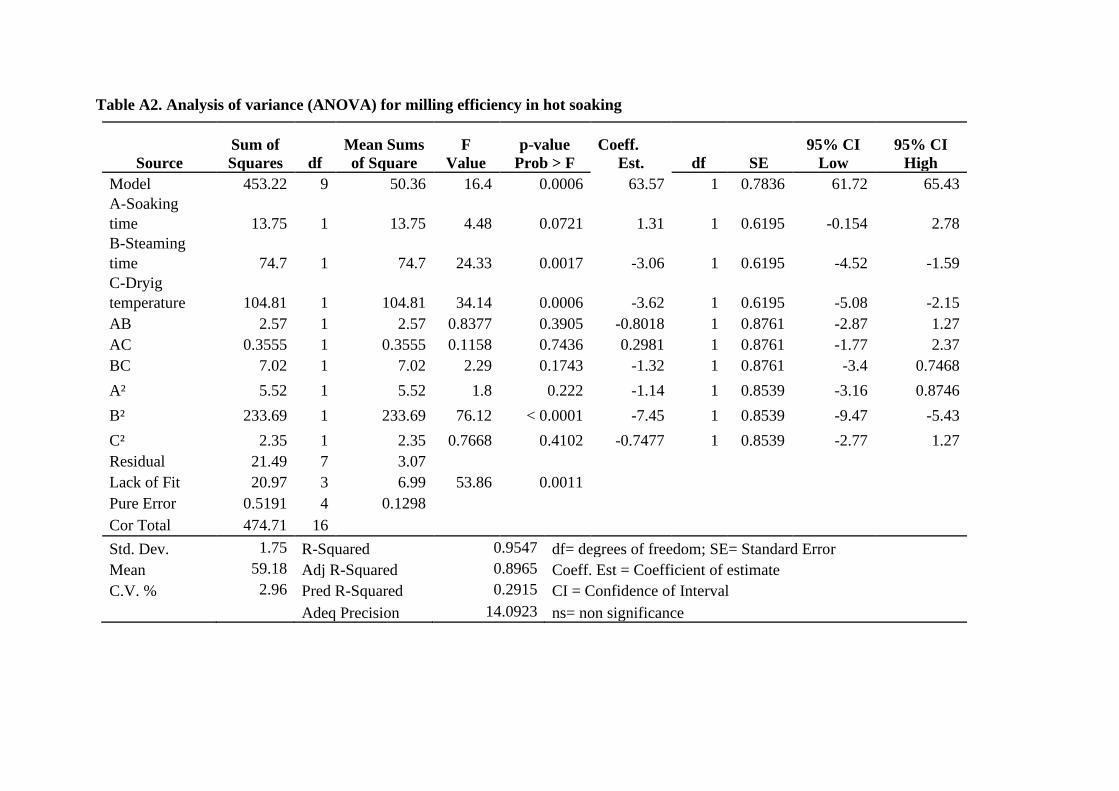
Table A2. Analysis of variance (ANOVA) for milling efficiency in hot soaking
Source
Sum of
Squares df
Mean Sums
of Square
F
Value
p-value
Prob > F
Coeff.
Est. df SE
95% CI
Low
95% CI
High
Model 453.22 9 50.36 16.4 0.0006 63.57 1 0.7836 61.72 65.43
A-Soaking
time 13.75 1 13.75 4.48 0.0721 1.31 1 0.6195 -0.154 2.78
B-Steaming
time 74.7 1 74.7 24.33 0.0017 -3.06 1 0.6195 -4.52 -1.59
C-Dryig
temperature 104.81 1 104.81 34.14 0.0006 -3.62 1 0.6195 -5.08 -2.15
AB 2.57 1 2.57 0.8377 0.3905 -0.8018 1 0.8761 -2.87 1.27
AC 0.3555 1 0.3555 0.1158 0.7436 0.2981 1 0.8761 -1.77 2.37
BC 7.02 1 7.02 2.29 0.1743 -1.32 1 0.8761 -3.4 0.7468
A² 5.52 1 5.52 1.8 0.222 -1.14 1 0.8539 -3.16 0.8746
B² 233.69 1 233.69 76.12 < 0.0001 -7.45 1 0.8539 -9.47 -5.43
C² 2.35 1 2.35 0.7668 0.4102 -0.7477 1 0.8539 -2.77 1.27
Residual 21.49 7 3.07 Lack of Fit 20.97 3 6.99 53.86 0.0011 Pure Error 0.5191 4 0.1298 Cor Total 474.71 16
Std. Dev. 1.75 R-Squared 0.9547 df= degrees of freedom; SE= Standard Error
Mean 59.18 Adj R-Squared 0.8965 Coeff. Est = Coefficient of estimate
C.V. % 2.96 Pred R-Squared 0.2915 CI = Confidence of Interval
Adeq Precision 14.0923 ns= non significance
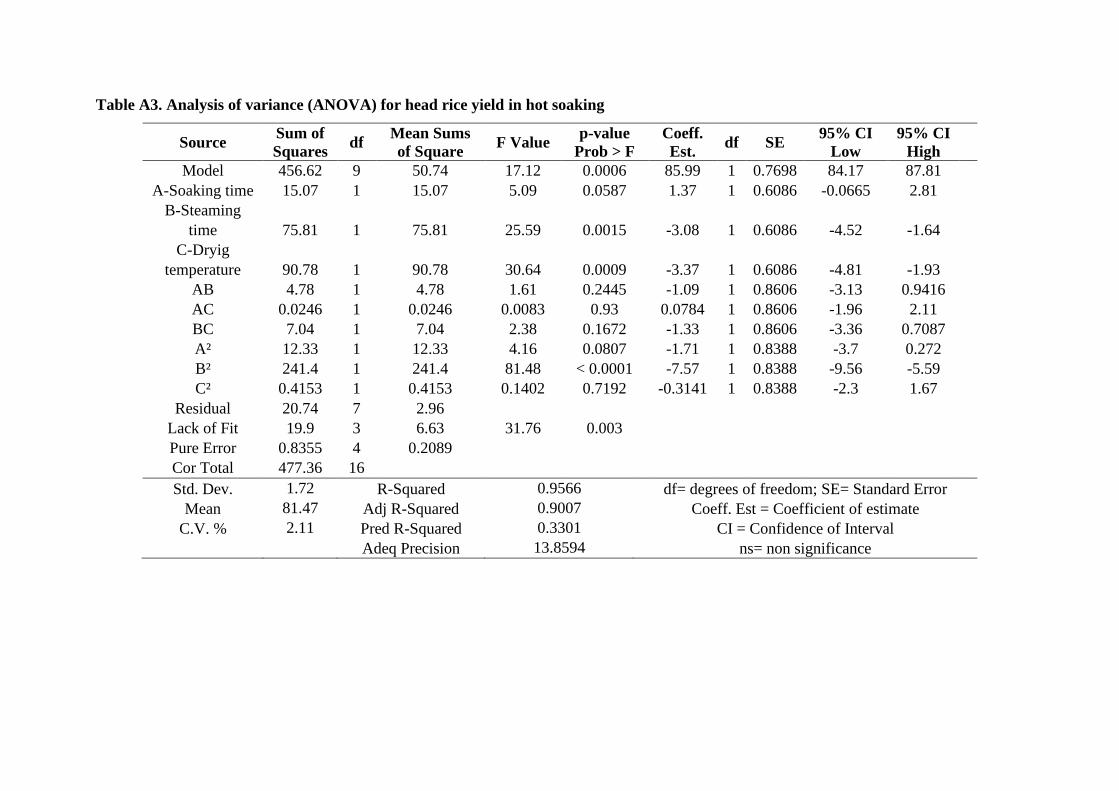
Table A3. Analysis of variance (ANOVA) for head rice yield in hot soaking
Source Sum of
Squares df
Mean Sums
of Square F Value
p-value
Prob > F
Coeff.
Est. df SE
95% CI
Low
95% CI
High
Model 456.62 9 50.74 17.12 0.0006 85.99 1 0.7698 84.17 87.81 A-Soaking time 15.07 1 15.07 5.09 0.0587 1.37 1 0.6086 -0.0665 2.81
B-Steaming
time 75.81 1 75.81 25.59 0.0015 -3.08 1 0.6086 -4.52 -1.64 C-Dryig
temperature 90.78 1 90.78 30.64 0.0009 -3.37 1 0.6086 -4.81 -1.93 AB 4.78 1 4.78 1.61 0.2445 -1.09 1 0.8606 -3.13 0.9416 AC 0.0246 1 0.0246 0.0083 0.93 0.0784 1 0.8606 -1.96 2.11 BC 7.04 1 7.04 2.38 0.1672 -1.33 1 0.8606 -3.36 0.7087 A² 12.33 1 12.33 4.16 0.0807 -1.71 1 0.8388 -3.7 0.272 B² 241.4 1 241.4 81.48 < 0.0001 -7.57 1 0.8388 -9.56 -5.59 C² 0.4153 1 0.4153 0.1402 0.7192 -0.3141 1 0.8388 -2.3 1.67
Residual 20.74 7 2.96 Lack of Fit 19.9 3 6.63 31.76 0.003 Pure Error 0.8355 4 0.2089 Cor Total 477.36 16 Std. Dev. 1.72 R-Squared 0.9566 df= degrees of freedom; SE= Standard Error
Mean 81.47 Adj R-Squared 0.9007 Coeff. Est = Coefficient of estimate
C.V. % 2.11 Pred R-Squared 0.3301 CI = Confidence of Interval
Adeq Precision 13.8594 ns= non significance
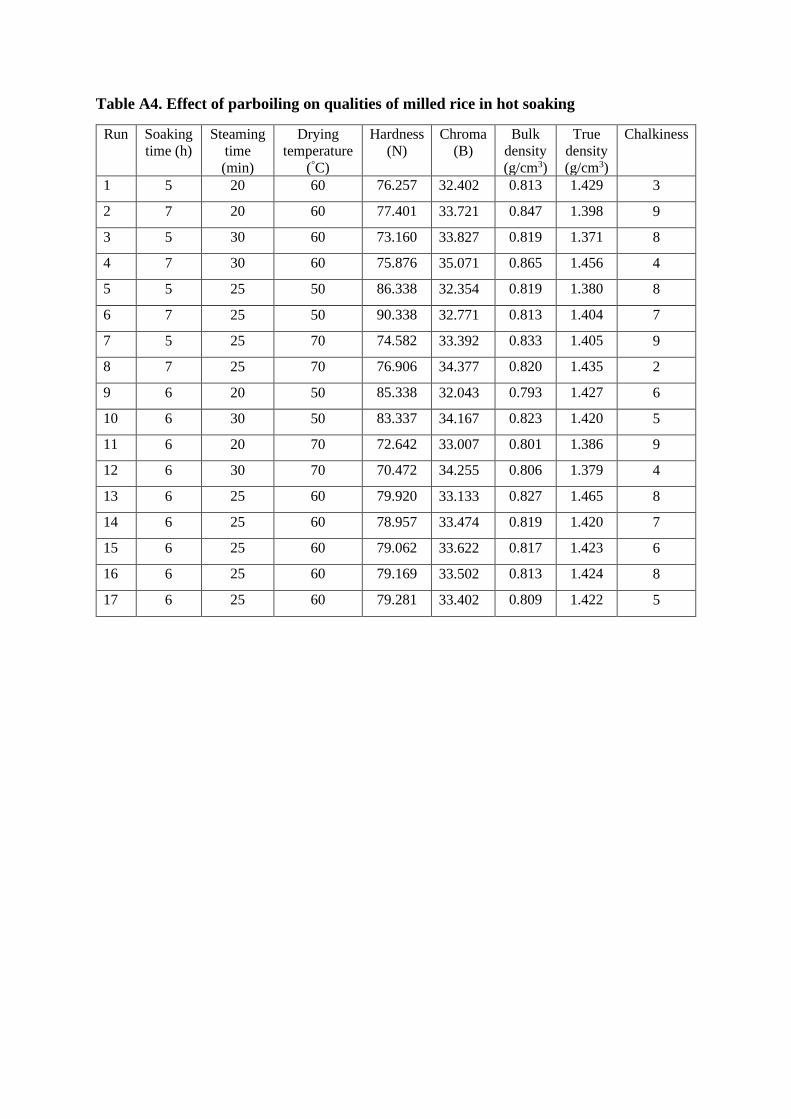
Table A4. Effect of parboiling on qualities of milled rice in hot soaking
Run Soaking
time (h)
Steaming
time
(min)
Drying
temperature
(°C)
Hardness
(N)
Chroma
(B)
Bulk
density
(g/cm3)
True
density
(g/cm3)
Chalkiness
1 5 20 60 76.257 32.402 0.813 1.429 3
2 7 20 60 77.401 33.721 0.847 1.398 9
3 5 30 60 73.160 33.827 0.819 1.371 8
4 7 30 60 75.876 35.071 0.865 1.456 4
5 5 25 50 86.338 32.354 0.819 1.380 8
6 7 25 50 90.338 32.771 0.813 1.404 7
7 5 25 70 74.582 33.392 0.833 1.405 9
8 7 25 70 76.906 34.377 0.820 1.435 2
9 6 20 50 85.338 32.043 0.793 1.427 6
10 6 30 50 83.337 34.167 0.823 1.420 5
11 6 20 70 72.642 33.007 0.801 1.386 9
12 6 30 70 70.472 34.255 0.806 1.379 4
13 6 25 60 79.920 33.133 0.827 1.465 8
14 6 25 60 78.957 33.474 0.819 1.420 7
15 6 25 60 79.062 33.622 0.817 1.423 6
16 6 25 60 79.169 33.502 0.813 1.424 8
17 6 25 60 79.281 33.402 0.809 1.422 5
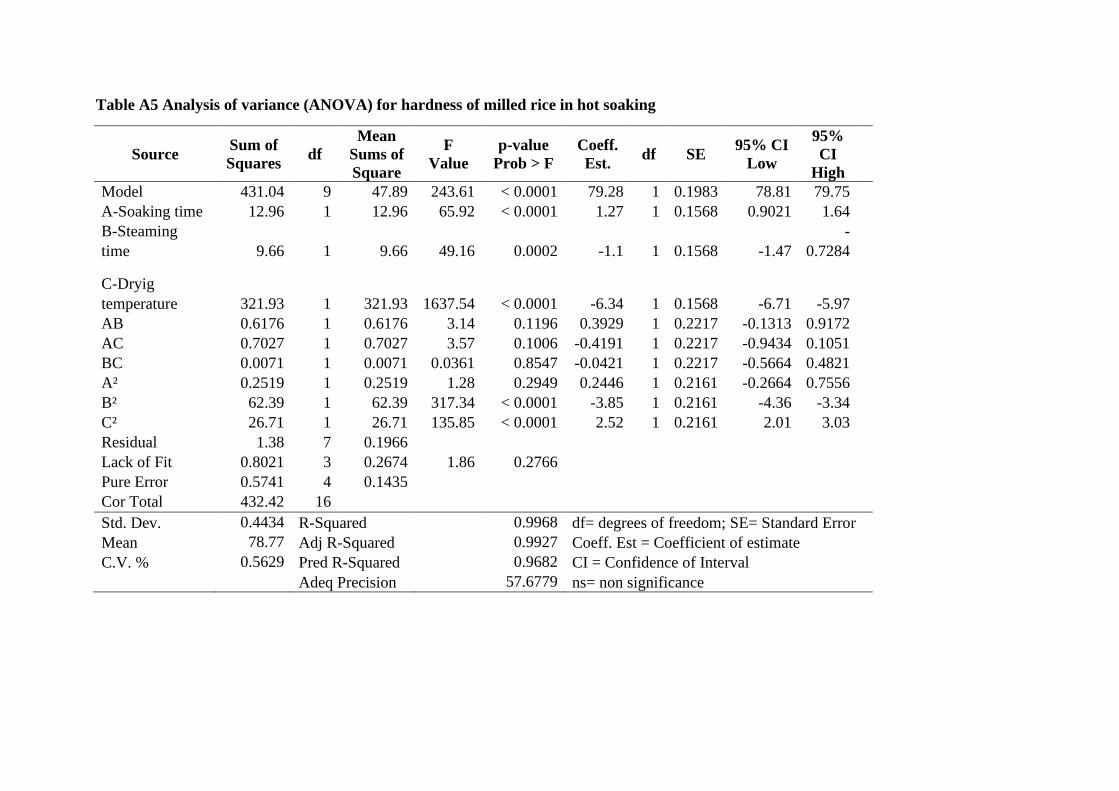
Table A5 Analysis of variance (ANOVA) for hardness of milled rice in hot soaking
Source Sum of
Squares df
Mean
Sums of
Square
F
Value
p-value
Prob > F
Coeff.
Est. df SE
95% CI
Low
95%
CI
High
Model 431.04 9 47.89 243.61 < 0.0001 79.28 1 0.1983 78.81 79.75
A-Soaking time 12.96 1 12.96 65.92 < 0.0001 1.27 1 0.1568 0.9021 1.64
B-Steaming
time 9.66 1 9.66 49.16 0.0002 -1.1 1 0.1568 -1.47
-
0.7284
C-Dryig
temperature 321.93 1 321.93 1637.54 < 0.0001 -6.34 1 0.1568 -6.71 -5.97
AB 0.6176 1 0.6176 3.14 0.1196 0.3929 1 0.2217 -0.1313 0.9172
AC 0.7027 1 0.7027 3.57 0.1006 -0.4191 1 0.2217 -0.9434 0.1051
BC 0.0071 1 0.0071 0.0361 0.8547 -0.0421 1 0.2217 -0.5664 0.4821
A² 0.2519 1 0.2519 1.28 0.2949 0.2446 1 0.2161 -0.2664 0.7556
B² 62.39 1 62.39 317.34 < 0.0001 -3.85 1 0.2161 -4.36 -3.34
C² 26.71 1 26.71 135.85 < 0.0001 2.52 1 0.2161 2.01 3.03
Residual 1.38 7 0.1966
Lack of Fit 0.8021 3 0.2674 1.86 0.2766
Pure Error 0.5741 4 0.1435
Cor Total 432.42 16
Std. Dev. 0.4434 R-Squared 0.9968 df= degrees of freedom; SE= Standard Error
Mean 78.77 Adj R-Squared 0.9927 Coeff. Est = Coefficient of estimate
C.V. % 0.5629 Pred R-Squared 0.9682 CI = Confidence of Interval
Adeq Precision 57.6779 ns= non significance
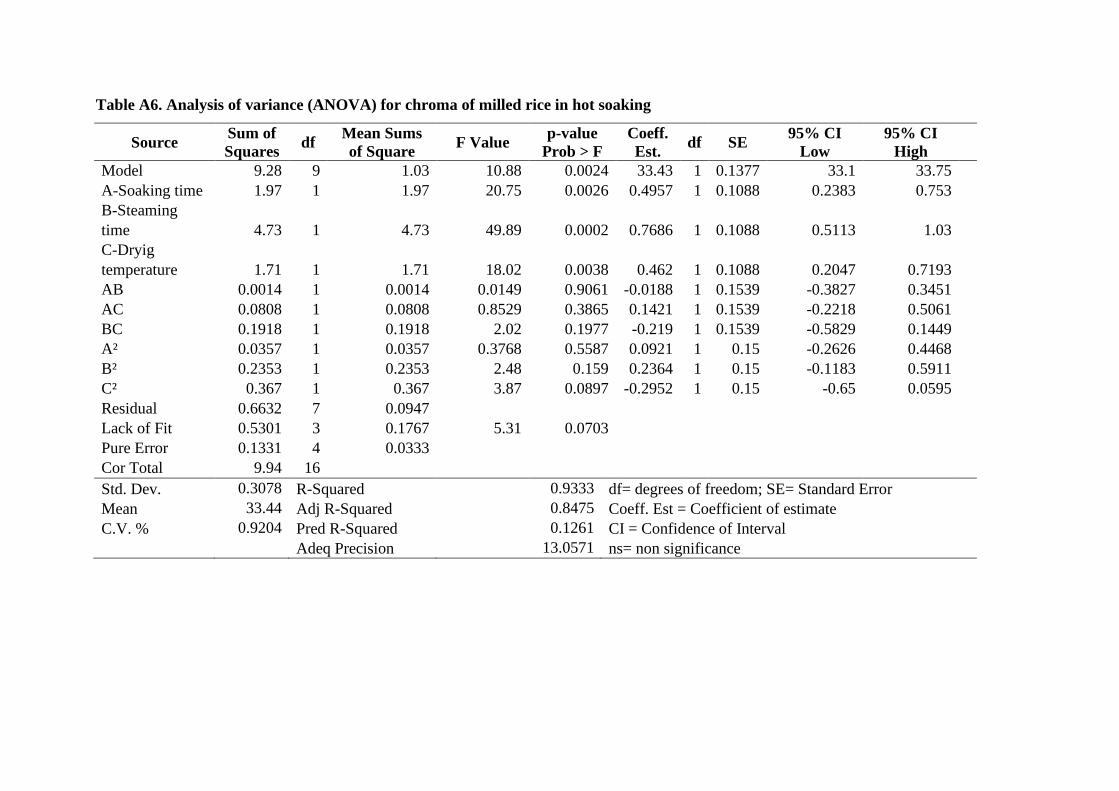
Table A6. Analysis of variance (ANOVA) for chroma of milled rice in hot soaking
Source Sum of
Squares df
Mean Sums
of Square F Value
p-value
Prob > F
Coeff.
Est. df SE
95% CI
Low
95% CI
High
Model 9.28 9 1.03 10.88 0.0024 33.43 1 0.1377 33.1 33.75 A-Soaking time 1.97 1 1.97 20.75 0.0026 0.4957 1 0.1088 0.2383 0.753 B-Steaming
time 4.73 1 4.73 49.89 0.0002 0.7686 1 0.1088 0.5113 1.03 C-Dryig
temperature 1.71 1 1.71 18.02 0.0038 0.462 1 0.1088 0.2047 0.7193 AB 0.0014 1 0.0014 0.0149 0.9061 -0.0188 1 0.1539 -0.3827 0.3451 AC 0.0808 1 0.0808 0.8529 0.3865 0.1421 1 0.1539 -0.2218 0.5061 BC 0.1918 1 0.1918 2.02 0.1977 -0.219 1 0.1539 -0.5829 0.1449 A² 0.0357 1 0.0357 0.3768 0.5587 0.0921 1 0.15 -0.2626 0.4468 B² 0.2353 1 0.2353 2.48 0.159 0.2364 1 0.15 -0.1183 0.5911 C² 0.367 1 0.367 3.87 0.0897 -0.2952 1 0.15 -0.65 0.0595 Residual 0.6632 7 0.0947 Lack of Fit 0.5301 3 0.1767 5.31 0.0703 Pure Error 0.1331 4 0.0333 Cor Total 9.94 16 Std. Dev. 0.3078 R-Squared 0.9333 df= degrees of freedom; SE= Standard Error
Mean 33.44 Adj R-Squared 0.8475 Coeff. Est = Coefficient of estimate
C.V. % 0.9204 Pred R-Squared 0.1261 CI = Confidence of Interval
Adeq Precision 13.0571 ns= non significance
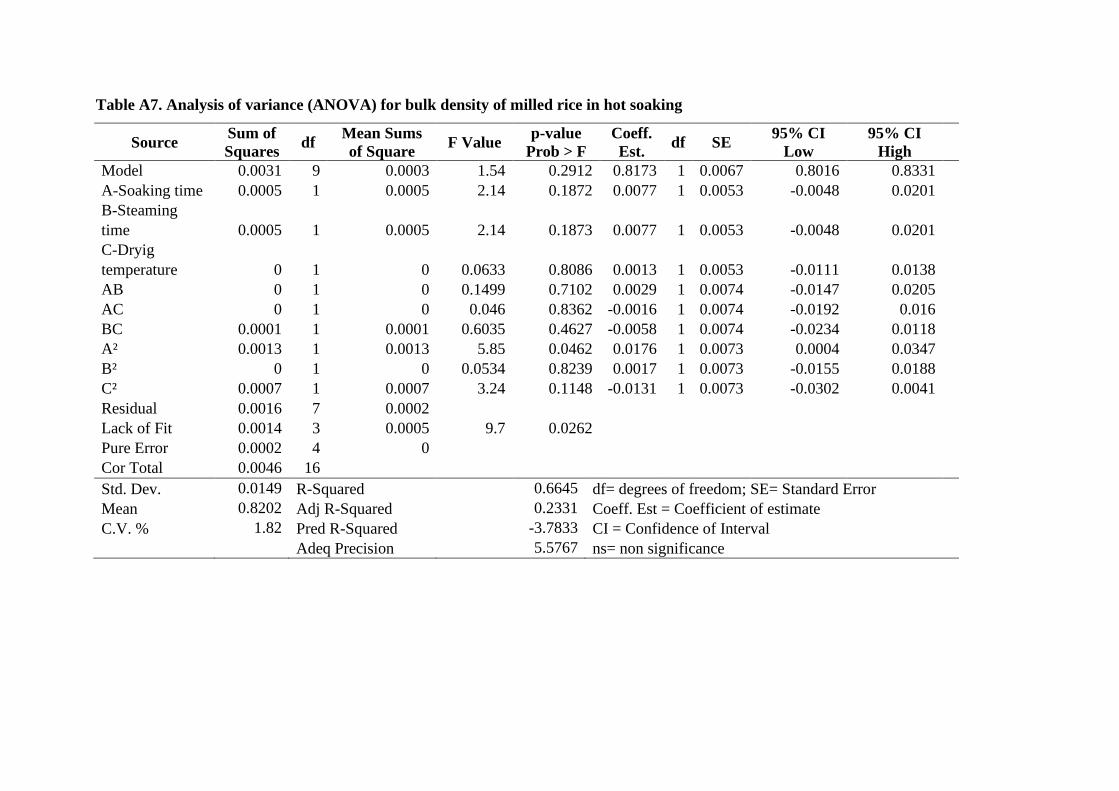
Table A7. Analysis of variance (ANOVA) for bulk density of milled rice in hot soaking
Source Sum of
Squares df
Mean Sums
of Square F Value
p-value
Prob > F
Coeff.
Est. df SE
95% CI
Low
95% CI
High
Model 0.0031 9 0.0003 1.54 0.2912 0.8173 1 0.0067 0.8016 0.8331 A-Soaking time 0.0005 1 0.0005 2.14 0.1872 0.0077 1 0.0053 -0.0048 0.0201 B-Steaming
time 0.0005 1 0.0005 2.14 0.1873 0.0077 1 0.0053 -0.0048 0.0201 C-Dryig
temperature 0 1 0 0.0633 0.8086 0.0013 1 0.0053 -0.0111 0.0138 AB 0 1 0 0.1499 0.7102 0.0029 1 0.0074 -0.0147 0.0205 AC 0 1 0 0.046 0.8362 -0.0016 1 0.0074 -0.0192 0.016 BC 0.0001 1 0.0001 0.6035 0.4627 -0.0058 1 0.0074 -0.0234 0.0118 A² 0.0013 1 0.0013 5.85 0.0462 0.0176 1 0.0073 0.0004 0.0347
B² 0 1 0 0.0534 0.8239 0.0017 1 0.0073 -0.0155 0.0188
C² 0.0007 1 0.0007 3.24 0.1148 -0.0131 1 0.0073 -0.0302 0.0041
Residual 0.0016 7 0.0002 Lack of Fit 0.0014 3 0.0005 9.7 0.0262 Pure Error 0.0002 4 0 Cor Total 0.0046 16 Std. Dev. 0.0149 R-Squared 0.6645 df= degrees of freedom; SE= Standard Error
Mean 0.8202 Adj R-Squared 0.2331 Coeff. Est = Coefficient of estimate
C.V. % 1.82 Pred R-Squared -3.7833 CI = Confidence of Interval
Adeq Precision 5.5767 ns= non significance
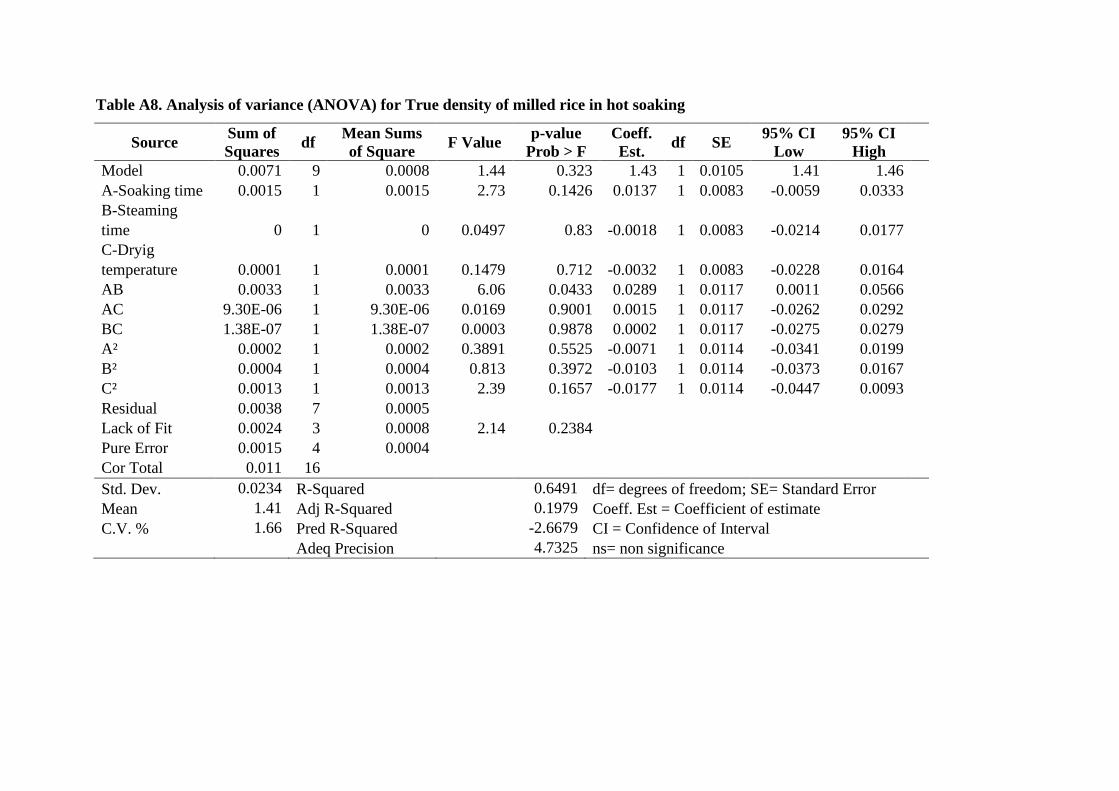
Table A8. Analysis of variance (ANOVA) for True density of milled rice in hot soaking
Source Sum of
Squares df
Mean Sums
of Square F Value
p-value
Prob > F
Coeff.
Est. df SE
95% CI
Low
95% CI
High
Model 0.0071 9 0.0008 1.44 0.323 1.43 1 0.0105 1.41 1.46 A-Soaking time 0.0015 1 0.0015 2.73 0.1426 0.0137 1 0.0083 -0.0059 0.0333 B-Steaming
time 0 1 0 0.0497 0.83 -0.0018 1 0.0083 -0.0214 0.0177 C-Dryig
temperature 0.0001 1 0.0001 0.1479 0.712 -0.0032 1 0.0083 -0.0228 0.0164 AB 0.0033 1 0.0033 6.06 0.0433 0.0289 1 0.0117 0.0011 0.0566 AC 9.30E-06 1 9.30E-06 0.0169 0.9001 0.0015 1 0.0117 -0.0262 0.0292 BC 1.38E-07 1 1.38E-07 0.0003 0.9878 0.0002 1 0.0117 -0.0275 0.0279 A² 0.0002 1 0.0002 0.3891 0.5525 -0.0071 1 0.0114 -0.0341 0.0199 B² 0.0004 1 0.0004 0.813 0.3972 -0.0103 1 0.0114 -0.0373 0.0167 C² 0.0013 1 0.0013 2.39 0.1657 -0.0177 1 0.0114 -0.0447 0.0093 Residual 0.0038 7 0.0005 Lack of Fit 0.0024 3 0.0008 2.14 0.2384 Pure Error 0.0015 4 0.0004 Cor Total 0.011 16 Std. Dev. 0.0234 R-Squared 0.6491 df= degrees of freedom; SE= Standard Error
Mean 1.41 Adj R-Squared 0.1979 Coeff. Est = Coefficient of estimate
C.V. % 1.66 Pred R-Squared -2.6679 CI = Confidence of Interval
Adeq Precision 4.7325 ns= non significance
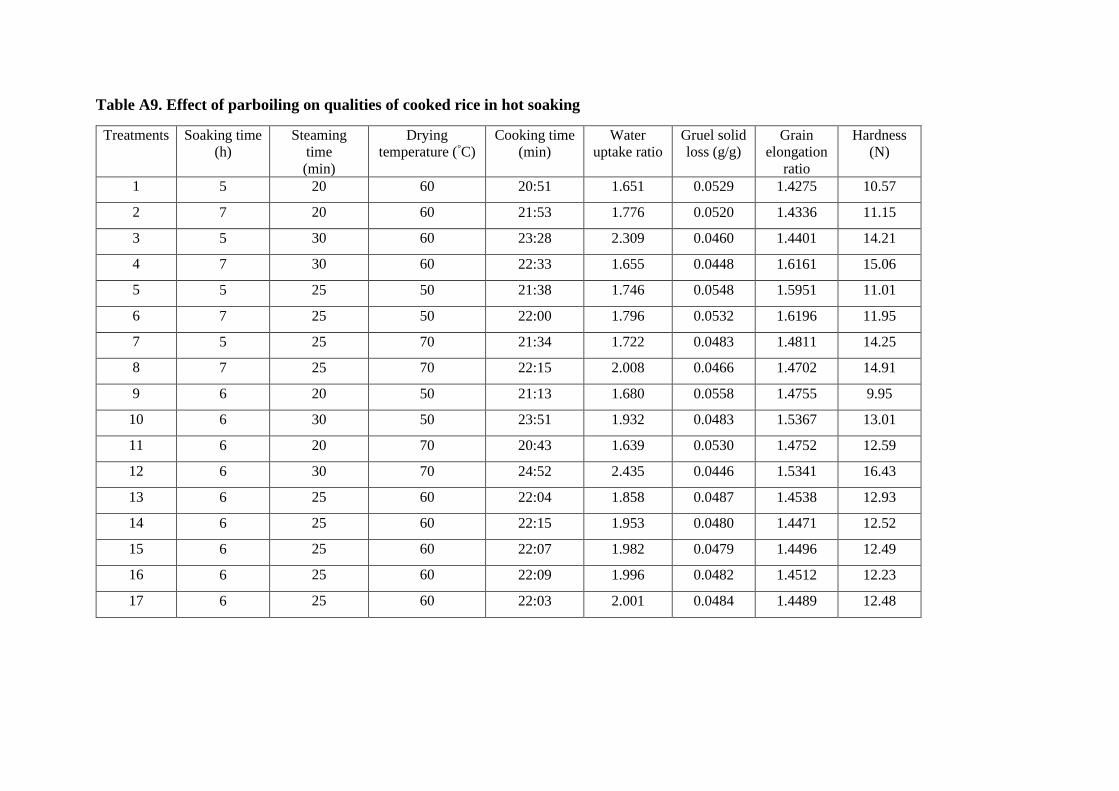
Table A9. Effect of parboiling on qualities of cooked rice in hot soaking
Treatments Soaking time
(h)
Steaming
time
(min)
Drying
temperature (°C)
Cooking time
(min)
Water
uptake ratio
Gruel solid
loss (g/g)
Grain
elongation
ratio
Hardness
(N)
1 5 20 60 20:51 1.651 0.0529 1.4275 10.57
2 7 20 60 21:53 1.776 0.0520 1.4336 11.15
3 5 30 60 23:28 2.309 0.0460 1.4401 14.21
4 7 30 60 22:33 1.655 0.0448 1.6161 15.06
5 5 25 50 21:38 1.746 0.0548 1.5951 11.01
6 7 25 50 22:00 1.796 0.0532 1.6196 11.95
7 5 25 70 21:34 1.722 0.0483 1.4811 14.25
8 7 25 70 22:15 2.008 0.0466 1.4702 14.91
9 6 20 50 21:13 1.680 0.0558 1.4755 9.95
10 6 30 50 23:51 1.932 0.0483 1.5367 13.01
11 6 20 70 20:43 1.639 0.0530 1.4752 12.59
12 6 30 70 24:52 2.435 0.0446 1.5341 16.43
13 6 25 60 22:04 1.858 0.0487 1.4538 12.93
14 6 25 60 22:15 1.953 0.0480 1.4471 12.52
15 6 25 60 22:07 1.982 0.0479 1.4496 12.49
16 6 25 60 22:09 1.996 0.0482 1.4512 12.23
17 6 25 60 22:03 2.001 0.0484 1.4489 12.48
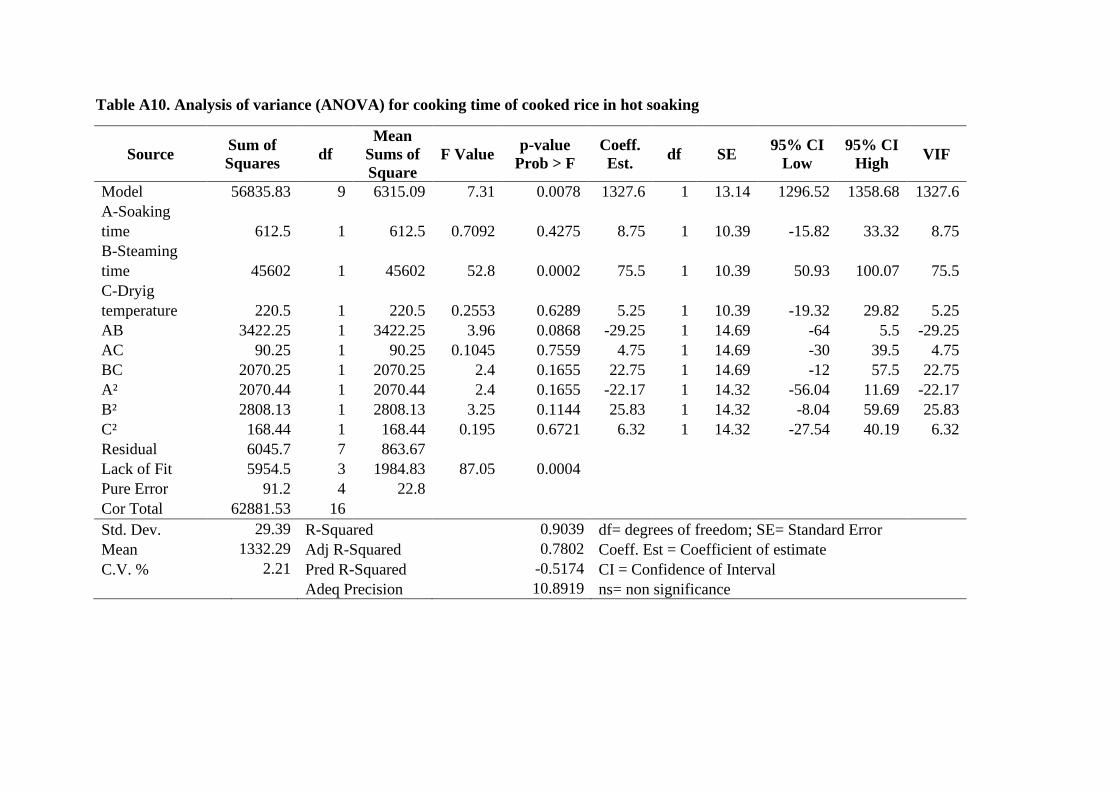
Table A10. Analysis of variance (ANOVA) for cooking time of cooked rice in hot soaking
Source Sum of
Squares df
Mean
Sums of
Square
F Value p-value
Prob > F
Coeff.
Est. df SE
95% CI
Low
95% CI
High VIF
Model 56835.83 9 6315.09 7.31 0.0078 1327.6 1 13.14 1296.52 1358.68 1327.6
A-Soaking
time 612.5 1 612.5 0.7092 0.4275 8.75 1 10.39 -15.82 33.32 8.75
B-Steaming
time 45602 1 45602 52.8 0.0002 75.5 1 10.39 50.93 100.07 75.5
C-Dryig
temperature 220.5 1 220.5 0.2553 0.6289 5.25 1 10.39 -19.32 29.82 5.25
AB 3422.25 1 3422.25 3.96 0.0868 -29.25 1 14.69 -64 5.5 -29.25
AC 90.25 1 90.25 0.1045 0.7559 4.75 1 14.69 -30 39.5 4.75
BC 2070.25 1 2070.25 2.4 0.1655 22.75 1 14.69 -12 57.5 22.75
A² 2070.44 1 2070.44 2.4 0.1655 -22.17 1 14.32 -56.04 11.69 -22.17
B² 2808.13 1 2808.13 3.25 0.1144 25.83 1 14.32 -8.04 59.69 25.83
C² 168.44 1 168.44 0.195 0.6721 6.32 1 14.32 -27.54 40.19 6.32
Residual 6045.7 7 863.67
Lack of Fit 5954.5 3 1984.83 87.05 0.0004
Pure Error 91.2 4 22.8
Cor Total 62881.53 16
Std. Dev. 29.39 R-Squared 0.9039 df= degrees of freedom; SE= Standard Error
Mean 1332.29 Adj R-Squared 0.7802 Coeff. Est = Coefficient of estimate
C.V. % 2.21 Pred R-Squared -0.5174 CI = Confidence of Interval
Adeq Precision 10.8919 ns= non significance
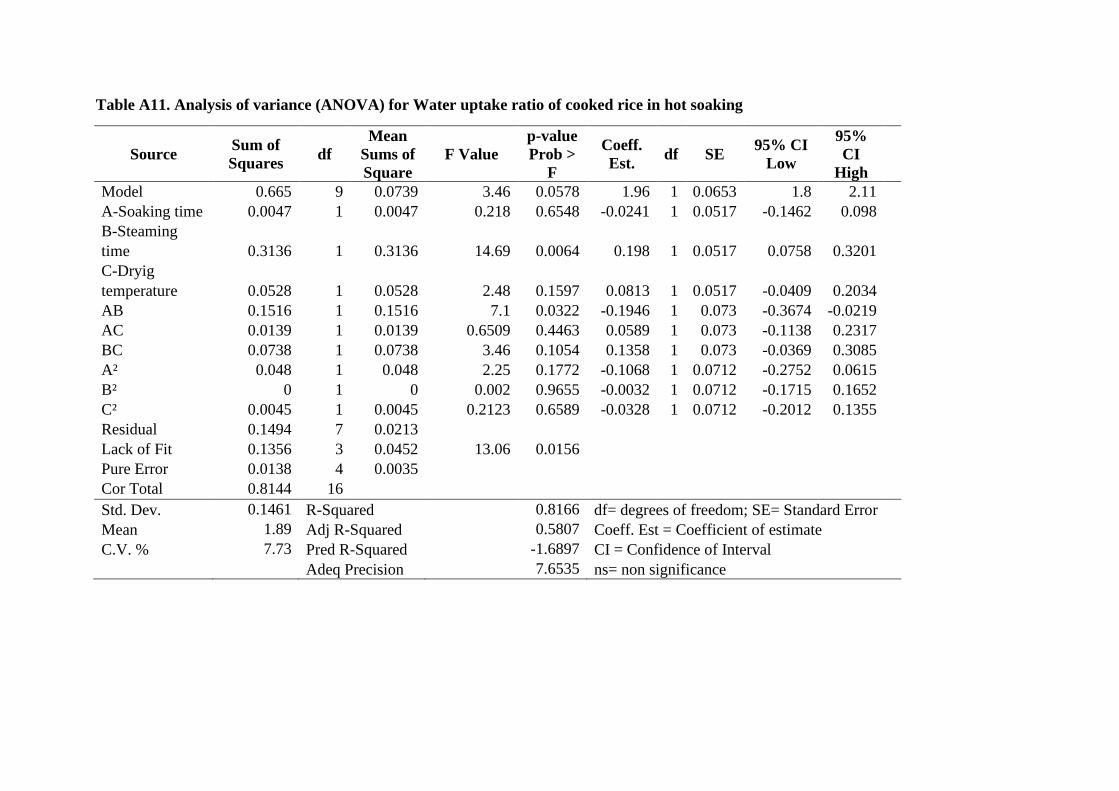
Table A11. Analysis of variance (ANOVA) for Water uptake ratio of cooked rice in hot soaking
Source Sum of
Squares df
Mean
Sums of
Square
F Value
p-value
Prob >
F
Coeff.
Est. df SE
95% CI
Low
95%
CI
High
Model 0.665 9 0.0739 3.46 0.0578 1.96 1 0.0653 1.8 2.11
A-Soaking time 0.0047 1 0.0047 0.218 0.6548 -0.0241 1 0.0517 -0.1462 0.098
B-Steaming
time 0.3136 1 0.3136 14.69 0.0064 0.198 1 0.0517 0.0758 0.3201
C-Dryig
temperature 0.0528 1 0.0528 2.48 0.1597 0.0813 1 0.0517 -0.0409 0.2034
AB 0.1516 1 0.1516 7.1 0.0322 -0.1946 1 0.073 -0.3674 -0.0219
AC 0.0139 1 0.0139 0.6509 0.4463 0.0589 1 0.073 -0.1138 0.2317
BC 0.0738 1 0.0738 3.46 0.1054 0.1358 1 0.073 -0.0369 0.3085
A² 0.048 1 0.048 2.25 0.1772 -0.1068 1 0.0712 -0.2752 0.0615
B² 0 1 0 0.002 0.9655 -0.0032 1 0.0712 -0.1715 0.1652
C² 0.0045 1 0.0045 0.2123 0.6589 -0.0328 1 0.0712 -0.2012 0.1355
Residual 0.1494 7 0.0213
Lack of Fit 0.1356 3 0.0452 13.06 0.0156
Pure Error 0.0138 4 0.0035
Cor Total 0.8144 16
Std. Dev. 0.1461 R-Squared 0.8166 df= degrees of freedom; SE= Standard Error
Mean 1.89 Adj R-Squared 0.5807 Coeff. Est = Coefficient of estimate
C.V. % 7.73 Pred R-Squared -1.6897 CI = Confidence of Interval
Adeq Precision 7.6535 ns= non significance
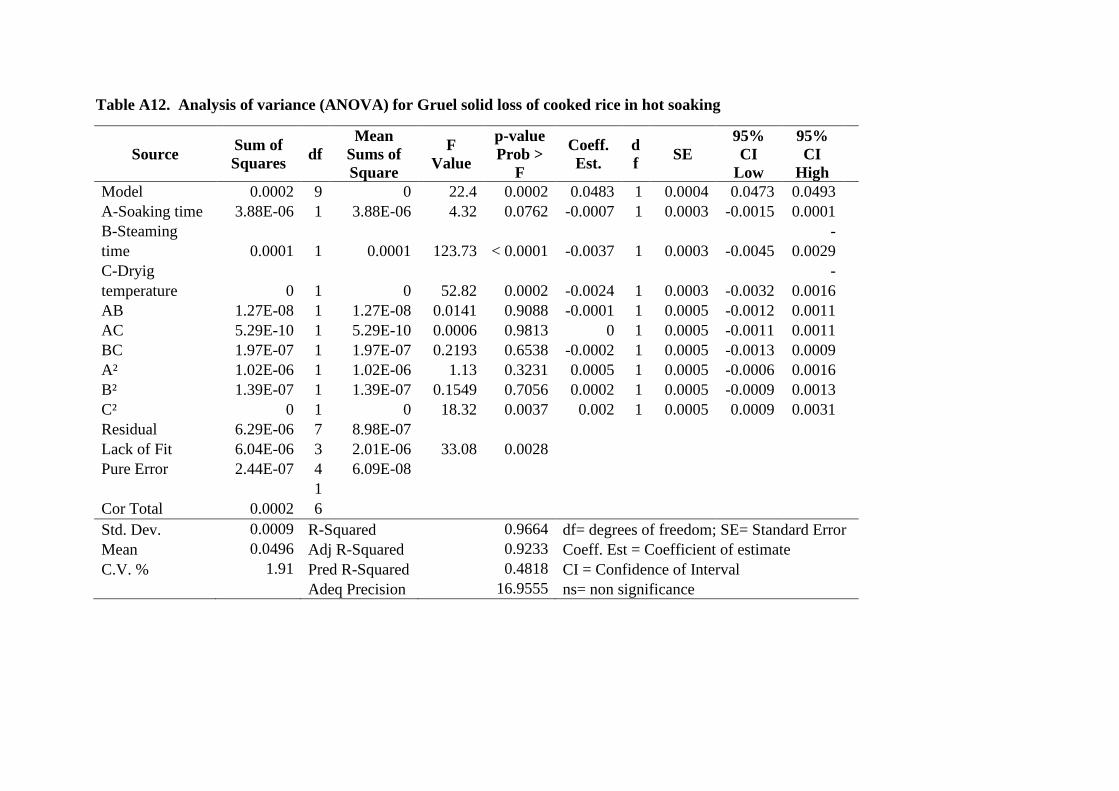
Table A12. Analysis of variance (ANOVA) for Gruel solid loss of cooked rice in hot soaking
Source Sum of
Squares df
Mean
Sums of
Square
F
Value
p-value
Prob >
F
Coeff.
Est.
d
f SE
95%
CI
Low
95%
CI
High
Model 0.0002 9 0 22.4 0.0002 0.0483 1 0.0004 0.0473 0.0493
A-Soaking time 3.88E-06 1 3.88E-06 4.32 0.0762 -0.0007 1 0.0003 -0.0015 0.0001
B-Steaming
time 0.0001 1 0.0001 123.73 < 0.0001 -0.0037 1 0.0003 -0.0045
-
0.0029
C-Dryig
temperature 0 1 0 52.82 0.0002 -0.0024 1 0.0003 -0.0032
-
0.0016
AB 1.27E-08 1 1.27E-08 0.0141 0.9088 -0.0001 1 0.0005 -0.0012 0.0011
AC 5.29E-10 1 5.29E-10 0.0006 0.9813 0 1 0.0005 -0.0011 0.0011
BC 1.97E-07 1 1.97E-07 0.2193 0.6538 -0.0002 1 0.0005 -0.0013 0.0009
A² 1.02E-06 1 1.02E-06 1.13 0.3231 0.0005 1 0.0005 -0.0006 0.0016
B² 1.39E-07 1 1.39E-07 0.1549 0.7056 0.0002 1 0.0005 -0.0009 0.0013
C² 0 1 0 18.32 0.0037 0.002 1 0.0005 0.0009 0.0031
Residual 6.29E-06 7 8.98E-07
Lack of Fit 6.04E-06 3 2.01E-06 33.08 0.0028
Pure Error 2.44E-07 4 6.09E-08
Cor Total 0.0002
1
6
Std. Dev. 0.0009 R-Squared 0.9664 df= degrees of freedom; SE= Standard Error
Mean 0.0496 Adj R-Squared 0.9233 Coeff. Est = Coefficient of estimate
C.V. % 1.91 Pred R-Squared 0.4818 CI = Confidence of Interval
Adeq Precision 16.9555 ns= non significance
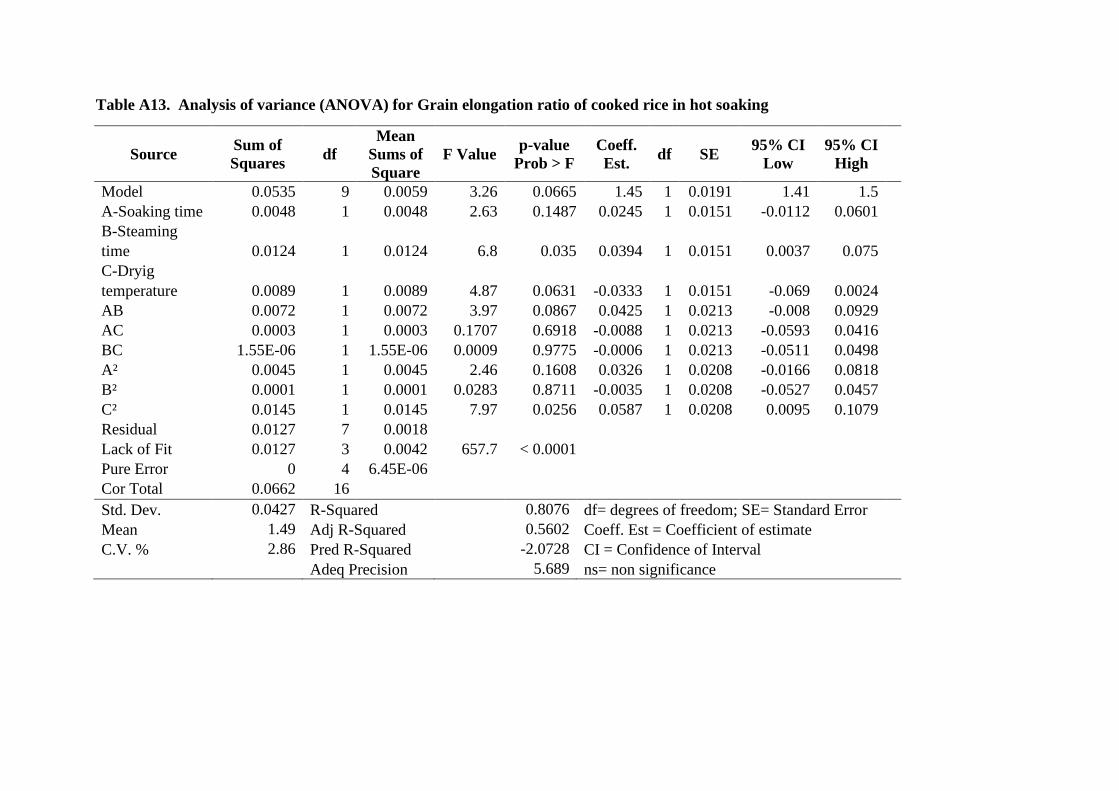
Table A13. Analysis of variance (ANOVA) for Grain elongation ratio of cooked rice in hot soaking
Source Sum of
Squares df
Mean
Sums of
Square
F Value p-value
Prob > F
Coeff.
Est. df SE
95% CI
Low
95% CI
High
Model 0.0535 9 0.0059 3.26 0.0665 1.45 1 0.0191 1.41 1.5
A-Soaking time 0.0048 1 0.0048 2.63 0.1487 0.0245 1 0.0151 -0.0112 0.0601
B-Steaming
time 0.0124 1 0.0124 6.8 0.035 0.0394 1 0.0151 0.0037 0.075
C-Dryig
temperature 0.0089 1 0.0089 4.87 0.0631 -0.0333 1 0.0151 -0.069 0.0024
AB 0.0072 1 0.0072 3.97 0.0867 0.0425 1 0.0213 -0.008 0.0929
AC 0.0003 1 0.0003 0.1707 0.6918 -0.0088 1 0.0213 -0.0593 0.0416
BC 1.55E-06 1 1.55E-06 0.0009 0.9775 -0.0006 1 0.0213 -0.0511 0.0498
A² 0.0045 1 0.0045 2.46 0.1608 0.0326 1 0.0208 -0.0166 0.0818
B² 0.0001 1 0.0001 0.0283 0.8711 -0.0035 1 0.0208 -0.0527 0.0457
C² 0.0145 1 0.0145 7.97 0.0256 0.0587 1 0.0208 0.0095 0.1079
Residual 0.0127 7 0.0018
Lack of Fit 0.0127 3 0.0042 657.7 < 0.0001
Pure Error 0 4 6.45E-06
Cor Total 0.0662 16
Std. Dev. 0.0427 R-Squared 0.8076 df= degrees of freedom; SE= Standard Error
Mean 1.49 Adj R-Squared 0.5602 Coeff. Est = Coefficient of estimate
C.V. % 2.86 Pred R-Squared -2.0728 CI = Confidence of Interval
Adeq Precision 5.689 ns= non significance
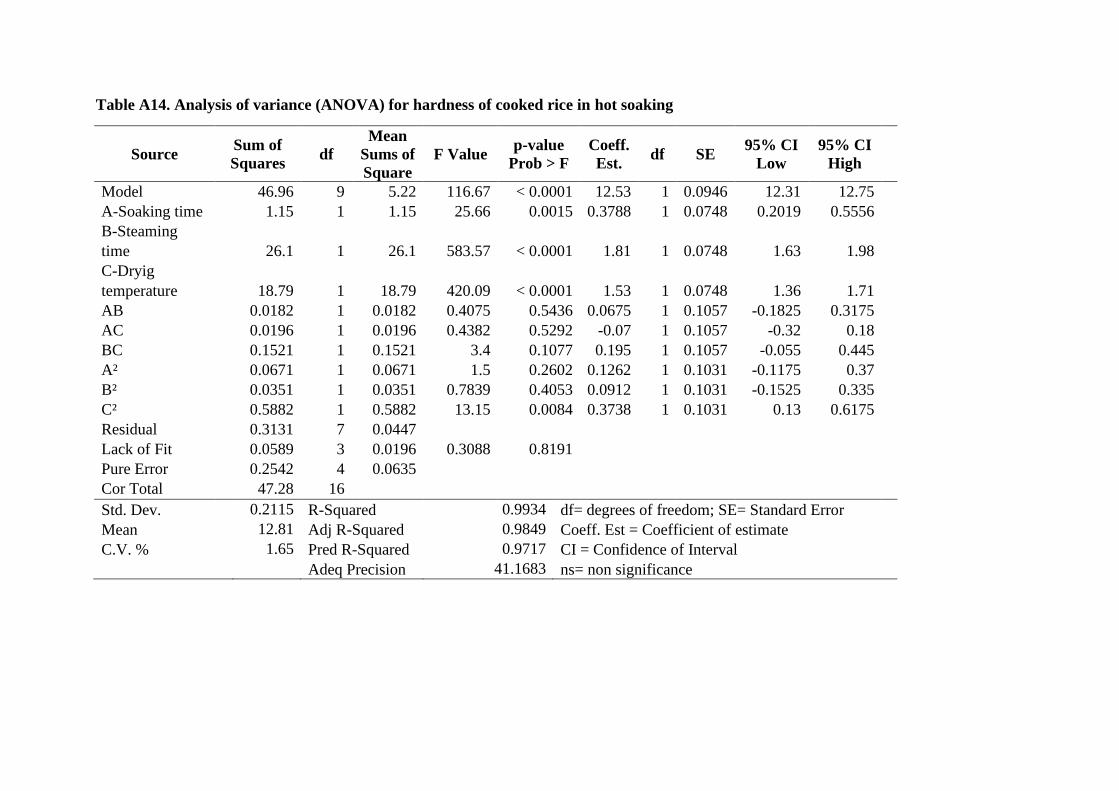
Table A14. Analysis of variance (ANOVA) for hardness of cooked rice in hot soaking
Source Sum of
Squares df
Mean
Sums of
Square
F Value p-value
Prob > F
Coeff.
Est. df SE
95% CI
Low
95% CI
High
Model 46.96 9 5.22 116.67 < 0.0001 12.53 1 0.0946 12.31 12.75
A-Soaking time 1.15 1 1.15 25.66 0.0015 0.3788 1 0.0748 0.2019 0.5556
B-Steaming
time 26.1 1 26.1 583.57 < 0.0001 1.81 1 0.0748 1.63 1.98
C-Dryig
temperature 18.79 1 18.79 420.09 < 0.0001 1.53 1 0.0748 1.36 1.71
AB 0.0182 1 0.0182 0.4075 0.5436 0.0675 1 0.1057 -0.1825 0.3175
AC 0.0196 1 0.0196 0.4382 0.5292 -0.07 1 0.1057 -0.32 0.18
BC 0.1521 1 0.1521 3.4 0.1077 0.195 1 0.1057 -0.055 0.445
A² 0.0671 1 0.0671 1.5 0.2602 0.1262 1 0.1031 -0.1175 0.37
B² 0.0351 1 0.0351 0.7839 0.4053 0.0912 1 0.1031 -0.1525 0.335
C² 0.5882 1 0.5882 13.15 0.0084 0.3738 1 0.1031 0.13 0.6175
Residual 0.3131 7 0.0447
Lack of Fit 0.0589 3 0.0196 0.3088 0.8191
Pure Error 0.2542 4 0.0635
Cor Total 47.28 16
Std. Dev. 0.2115 R-Squared 0.9934 df= degrees of freedom; SE= Standard Error
Mean 12.81 Adj R-Squared 0.9849 Coeff. Est = Coefficient of estimate
C.V. % 1.65 Pred R-Squared 0.9717 CI = Confidence of Interval
Adeq Precision 41.1683 ns= non significance
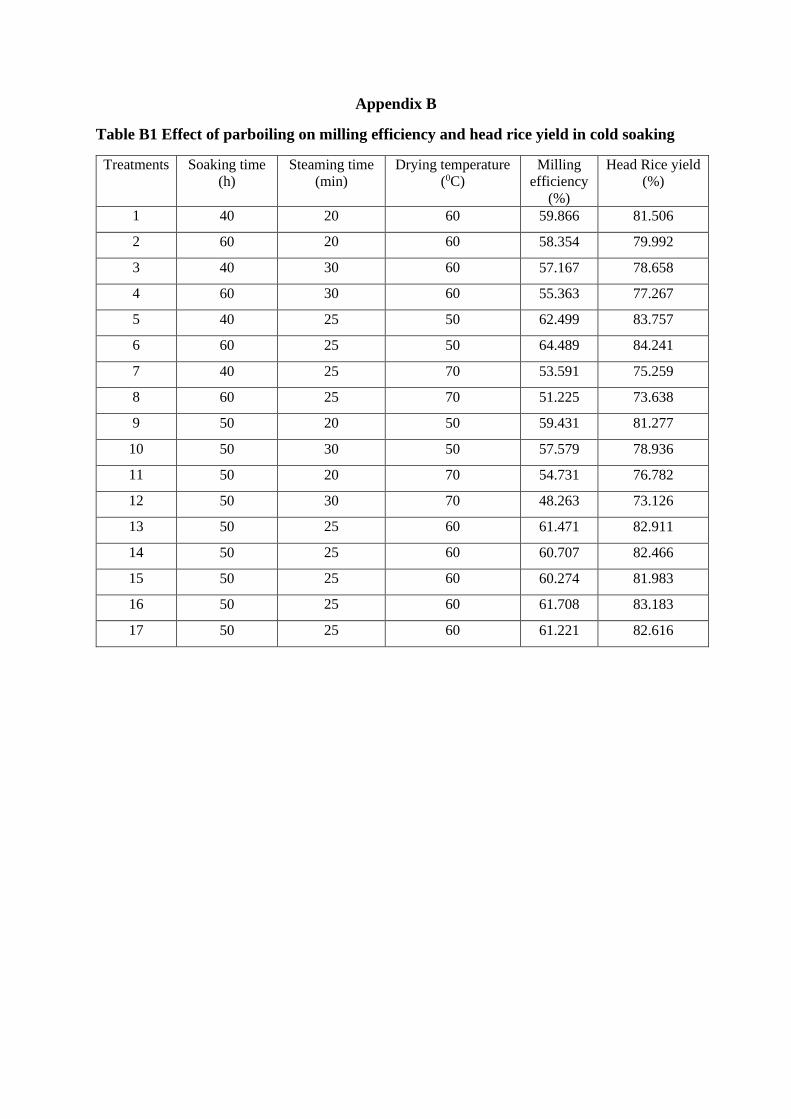
Appendix B
Table B1 Effect of parboiling on milling efficiency and head rice yield in cold soaking
Treatments Soaking time
(h)
Steaming time
(min)
Drying temperature
(0C)
Milling
efficiency
(%)
Head Rice yield
(%)
1 40 20 60 59.866 81.506
2 60 20 60 58.354 79.992
3 40 30 60 57.167 78.658
4 60 30 60 55.363 77.267
5 40 25 50 62.499 83.757
6 60 25 50 64.489 84.241
7 40 25 70 53.591 75.259
8 60 25 70 51.225 73.638
9 50 20 50 59.431 81.277
10 50 30 50 57.579 78.936
11 50 20 70 54.731 76.782
12 50 30 70 48.263 73.126
13 50 25 60 61.471 82.911
14 50 25 60 60.707 82.466
15 50 25 60 60.274 81.983
16 50 25 60 61.708 83.183
17 50 25 60 61.221 82.616
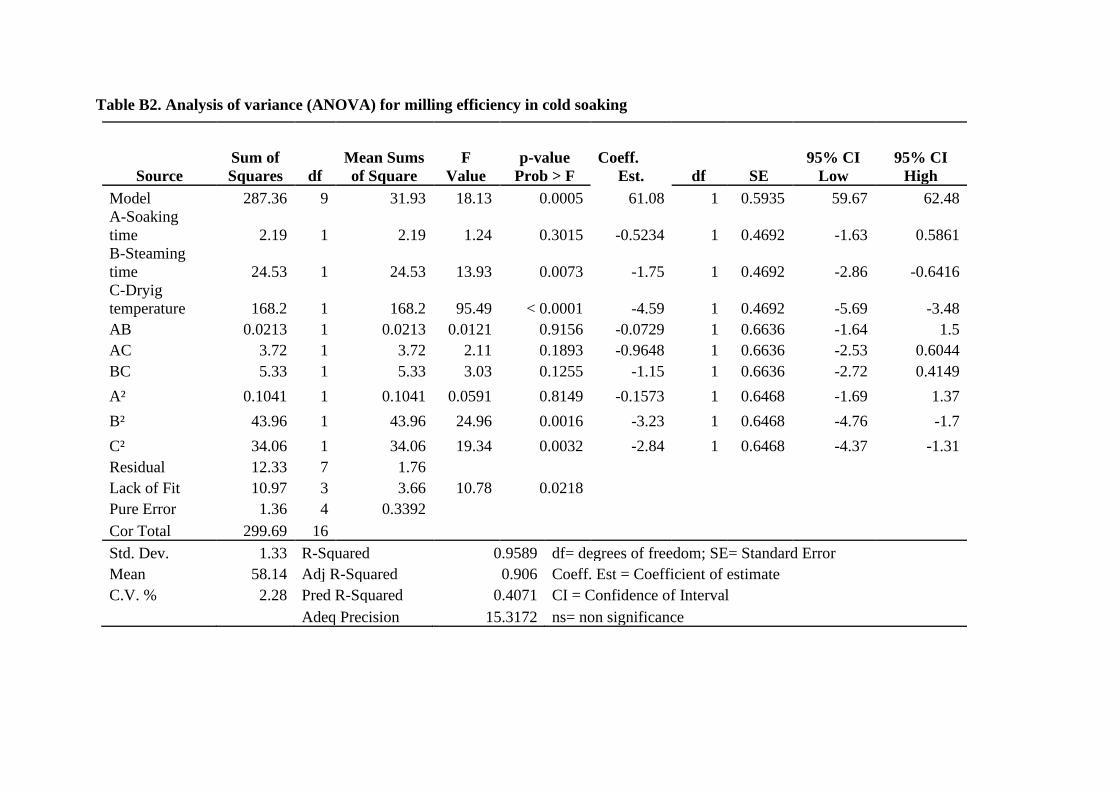
Table B2. Analysis of variance (ANOVA) for milling efficiency in cold soaking
Source
Sum of
Squares df
Mean Sums
of Square
F
Value
p-value
Prob > F
Coeff.
Est. df SE
95% CI
Low
95% CI
High
Model 287.36 9 31.93 18.13 0.0005 61.08 1 0.5935 59.67 62.48
A-Soaking
time 2.19 1 2.19 1.24 0.3015 -0.5234 1 0.4692 -1.63 0.5861
B-Steaming
time 24.53 1 24.53 13.93 0.0073 -1.75 1 0.4692 -2.86 -0.6416
C-Dryig
temperature 168.2 1 168.2 95.49 < 0.0001 -4.59 1 0.4692 -5.69 -3.48
AB 0.0213 1 0.0213 0.0121 0.9156 -0.0729 1 0.6636 -1.64 1.5
AC 3.72 1 3.72 2.11 0.1893 -0.9648 1 0.6636 -2.53 0.6044
BC 5.33 1 5.33 3.03 0.1255 -1.15 1 0.6636 -2.72 0.4149
A² 0.1041 1 0.1041 0.0591 0.8149 -0.1573 1 0.6468 -1.69 1.37
B² 43.96 1 43.96 24.96 0.0016 -3.23 1 0.6468 -4.76 -1.7
C² 34.06 1 34.06 19.34 0.0032 -2.84 1 0.6468 -4.37 -1.31
Residual 12.33 7 1.76 Lack of Fit 10.97 3 3.66 10.78 0.0218 Pure Error 1.36 4 0.3392
Cor Total 299.69 16
Std. Dev. 1.33 R-Squared 0.9589 df= degrees of freedom; SE= Standard Error
Mean 58.14 Adj R-Squared 0.906 Coeff. Est = Coefficient of estimate
C.V. % 2.28 Pred R-Squared 0.4071 CI = Confidence of Interval
Adeq Precision 15.3172 ns= non significance
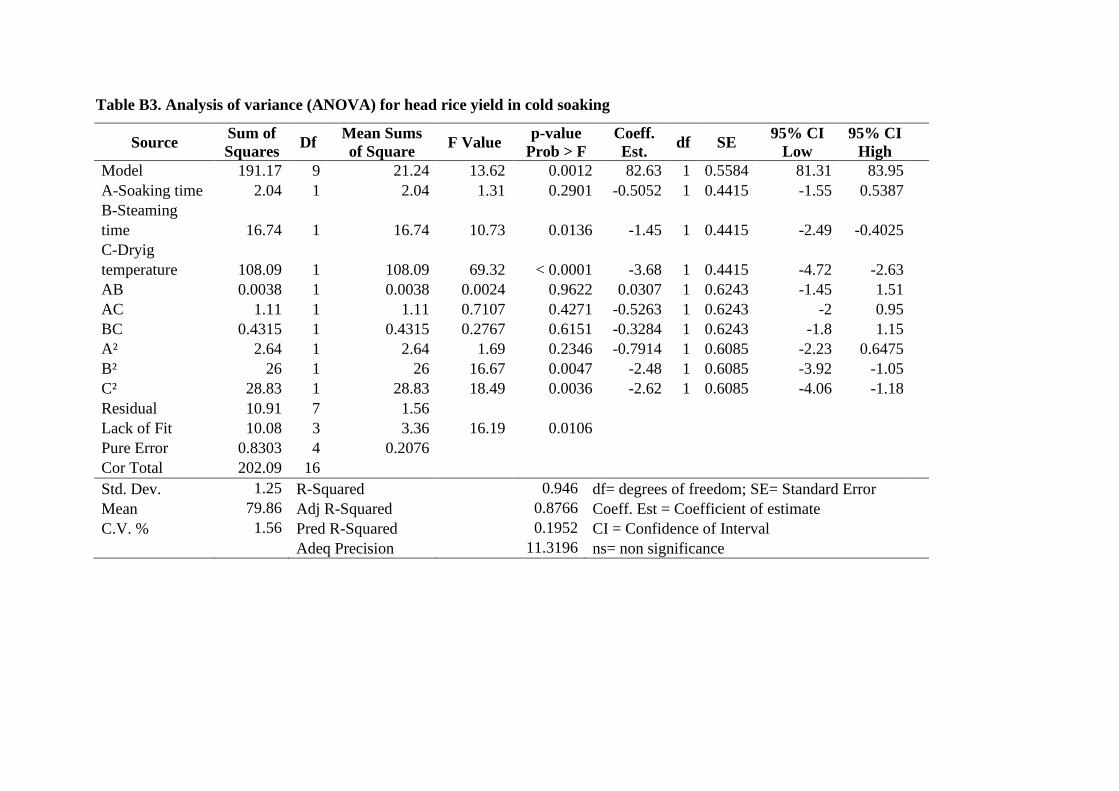
Table B3. Analysis of variance (ANOVA) for head rice yield in cold soaking
Source Sum of
Squares Df
Mean Sums
of Square F Value
p-value
Prob > F
Coeff.
Est. df SE
95% CI
Low
95% CI
High
Model 191.17 9 21.24 13.62 0.0012 82.63 1 0.5584 81.31 83.95 A-Soaking time 2.04 1 2.04 1.31 0.2901 -0.5052 1 0.4415 -1.55 0.5387 B-Steaming
time 16.74 1 16.74 10.73 0.0136 -1.45 1 0.4415 -2.49 -0.4025 C-Dryig
temperature 108.09 1 108.09 69.32 < 0.0001 -3.68 1 0.4415 -4.72 -2.63 AB 0.0038 1 0.0038 0.0024 0.9622 0.0307 1 0.6243 -1.45 1.51 AC 1.11 1 1.11 0.7107 0.4271 -0.5263 1 0.6243 -2 0.95 BC 0.4315 1 0.4315 0.2767 0.6151 -0.3284 1 0.6243 -1.8 1.15 A² 2.64 1 2.64 1.69 0.2346 -0.7914 1 0.6085 -2.23 0.6475 B² 26 1 26 16.67 0.0047 -2.48 1 0.6085 -3.92 -1.05 C² 28.83 1 28.83 18.49 0.0036 -2.62 1 0.6085 -4.06 -1.18 Residual 10.91 7 1.56 Lack of Fit 10.08 3 3.36 16.19 0.0106 Pure Error 0.8303 4 0.2076 Cor Total 202.09 16 Std. Dev. 1.25 R-Squared 0.946 df= degrees of freedom; SE= Standard Error
Mean 79.86 Adj R-Squared 0.8766 Coeff. Est = Coefficient of estimate
C.V. % 1.56 Pred R-Squared 0.1952 CI = Confidence of Interval
Adeq Precision 11.3196 ns= non significance
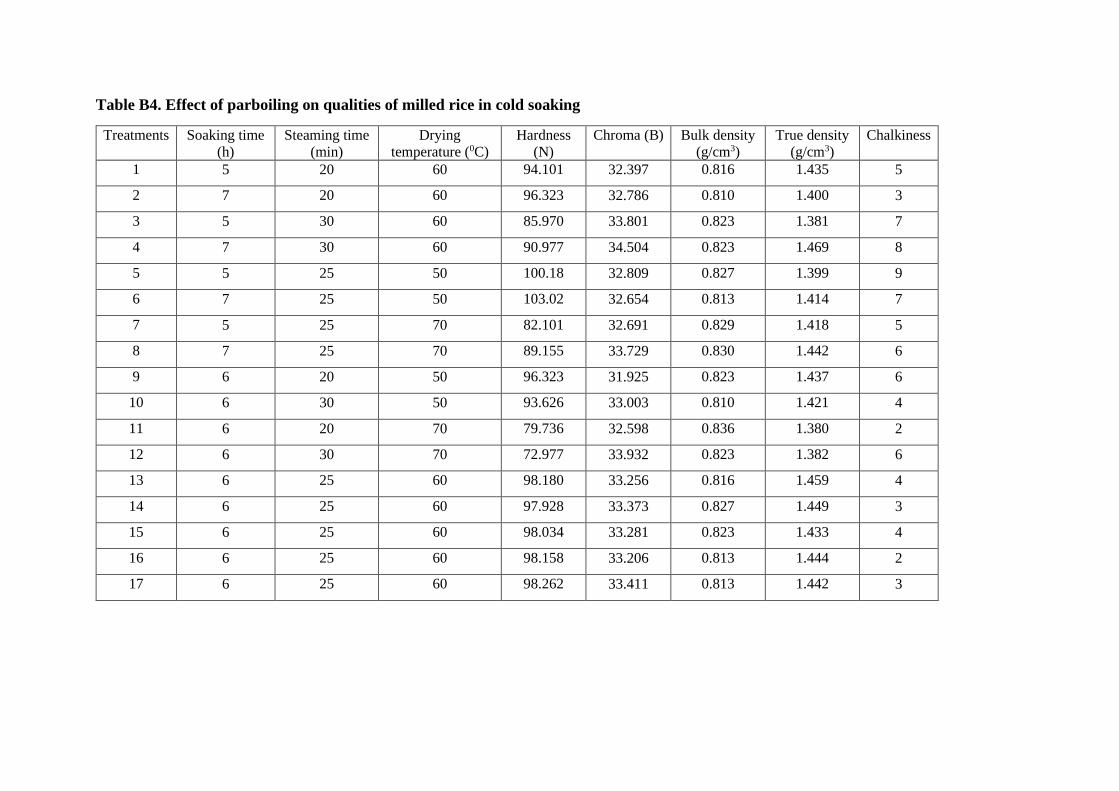
Table B4. Effect of parboiling on qualities of milled rice in cold soaking
Treatments Soaking time
(h)
Steaming time
(min)
Drying
temperature (0C)
Hardness
(N)
Chroma (B) Bulk density
(g/cm3)
True density
(g/cm3)
Chalkiness
1 5 20 60 94.101 32.397 0.816 1.435 5
2 7 20 60 96.323 32.786 0.810 1.400 3
3 5 30 60 85.970 33.801 0.823 1.381 7
4 7 30 60 90.977 34.504 0.823 1.469 8
5 5 25 50 100.18 32.809 0.827 1.399 9
6 7 25 50 103.02 32.654 0.813 1.414 7
7 5 25 70 82.101 32.691 0.829 1.418 5
8 7 25 70 89.155 33.729 0.830 1.442 6
9 6 20 50 96.323 31.925 0.823 1.437 6
10 6 30 50 93.626 33.003 0.810 1.421 4
11 6 20 70 79.736 32.598 0.836 1.380 2
12 6 30 70 72.977 33.932 0.823 1.382 6
13 6 25 60 98.180 33.256 0.816 1.459 4
14 6 25 60 97.928 33.373 0.827 1.449 3
15 6 25 60 98.034 33.281 0.823 1.433 4
16 6 25 60 98.158 33.206 0.813 1.444 2
17 6 25 60 98.262 33.411 0.813 1.442 3
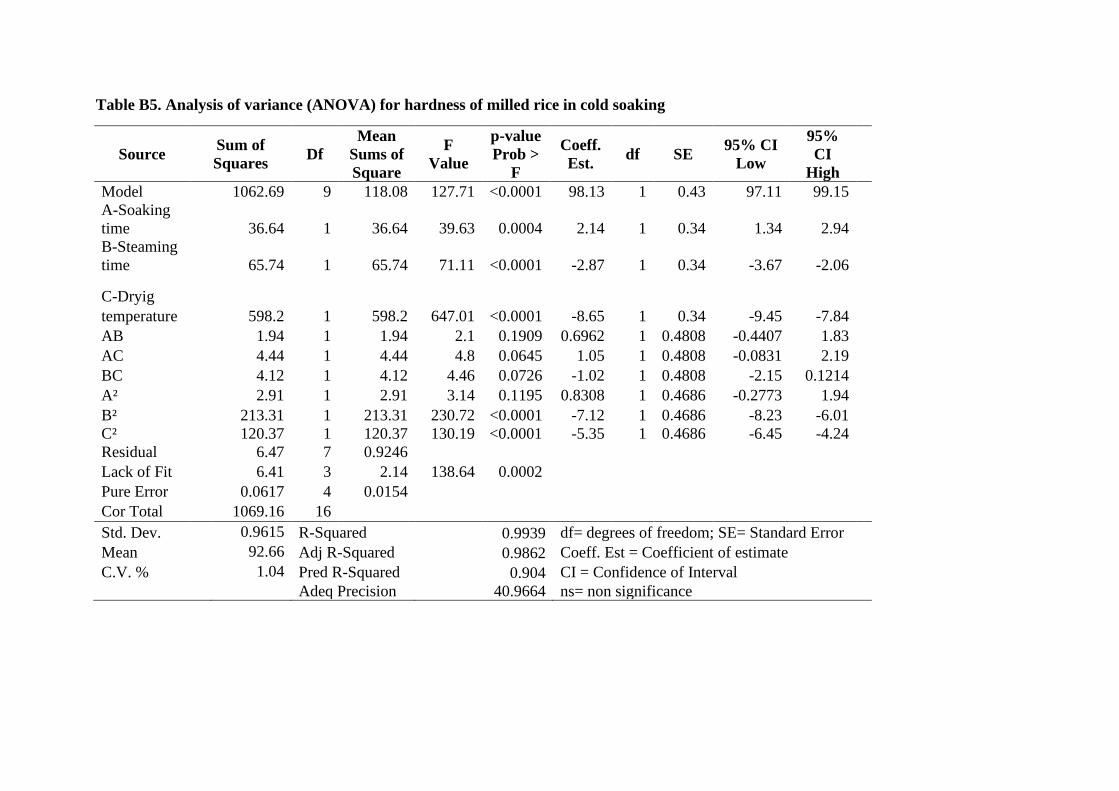
Table B5. Analysis of variance (ANOVA) for hardness of milled rice in cold soaking
Source Sum of
Squares Df
Mean
Sums of
Square
F
Value
p-value
Prob >
F
Coeff.
Est. df SE
95% CI
Low
95%
CI
High
Model 1062.69 9 118.08 127.71 <0.0001 98.13 1 0.43 97.11 99.15
A-Soaking
time 36.64 1 36.64 39.63 0.0004 2.14 1 0.34 1.34 2.94
B-Steaming
time 65.74 1 65.74 71.11
<0.0001 -2.87 1 0.34 -3.67 -2.06
C-Dryig
temperature 598.2 1 598.2 647.01
<0.0001 -8.65 1 0.34 -9.45 -7.84
AB 1.94 1 1.94 2.1 0.1909 0.6962 1 0.4808 -0.4407 1.83
AC 4.44 1 4.44 4.8 0.0645 1.05 1 0.4808 -0.0831 2.19
BC 4.12 1 4.12 4.46 0.0726 -1.02 1 0.4808 -2.15 0.1214
A² 2.91 1 2.91 3.14 0.1195 0.8308 1 0.4686 -0.2773 1.94
B² 213.31 1 213.31 230.72 <0.0001 -7.12 1 0.4686 -8.23 -6.01
C² 120.37 1 120.37 130.19 <0.0001 -5.35 1 0.4686 -6.45 -4.24
Residual 6.47 7 0.9246
Lack of Fit 6.41 3 2.14 138.64 0.0002
Pure Error 0.0617 4 0.0154
Cor Total 1069.16 16
Std. Dev. 0.9615 R-Squared 0.9939 df= degrees of freedom; SE= Standard Error
Mean 92.66 Adj R-Squared 0.9862 Coeff. Est = Coefficient of estimate
C.V. % 1.04 Pred R-Squared 0.904 CI = Confidence of Interval
Adeq Precision 40.9664 ns= non significance
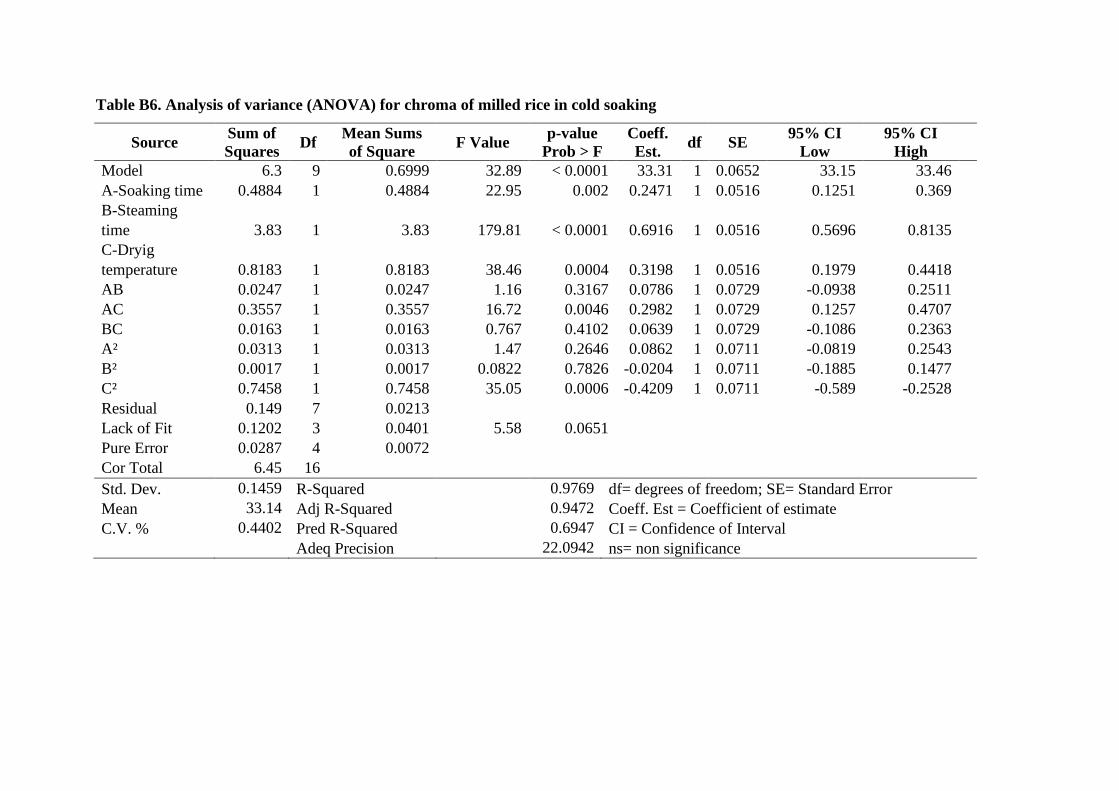
Table B6. Analysis of variance (ANOVA) for chroma of milled rice in cold soaking
Source Sum of
Squares Df
Mean Sums
of Square F Value
p-value
Prob > F
Coeff.
Est. df SE
95% CI
Low
95% CI
High
Model 6.3 9 0.6999 32.89 < 0.0001 33.31 1 0.0652 33.15 33.46 A-Soaking time 0.4884 1 0.4884 22.95 0.002 0.2471 1 0.0516 0.1251 0.369 B-Steaming
time 3.83 1 3.83 179.81 < 0.0001 0.6916 1 0.0516 0.5696 0.8135 C-Dryig
temperature 0.8183 1 0.8183 38.46 0.0004 0.3198 1 0.0516 0.1979 0.4418 AB 0.0247 1 0.0247 1.16 0.3167 0.0786 1 0.0729 -0.0938 0.2511 AC 0.3557 1 0.3557 16.72 0.0046 0.2982 1 0.0729 0.1257 0.4707 BC 0.0163 1 0.0163 0.767 0.4102 0.0639 1 0.0729 -0.1086 0.2363 A² 0.0313 1 0.0313 1.47 0.2646 0.0862 1 0.0711 -0.0819 0.2543 B² 0.0017 1 0.0017 0.0822 0.7826 -0.0204 1 0.0711 -0.1885 0.1477 C² 0.7458 1 0.7458 35.05 0.0006 -0.4209 1 0.0711 -0.589 -0.2528 Residual 0.149 7 0.0213 Lack of Fit 0.1202 3 0.0401 5.58 0.0651 Pure Error 0.0287 4 0.0072 Cor Total 6.45 16 Std. Dev. 0.1459 R-Squared 0.9769 df= degrees of freedom; SE= Standard Error
Mean 33.14 Adj R-Squared 0.9472 Coeff. Est = Coefficient of estimate
C.V. % 0.4402 Pred R-Squared 0.6947 CI = Confidence of Interval
Adeq Precision 22.0942 ns= non significance
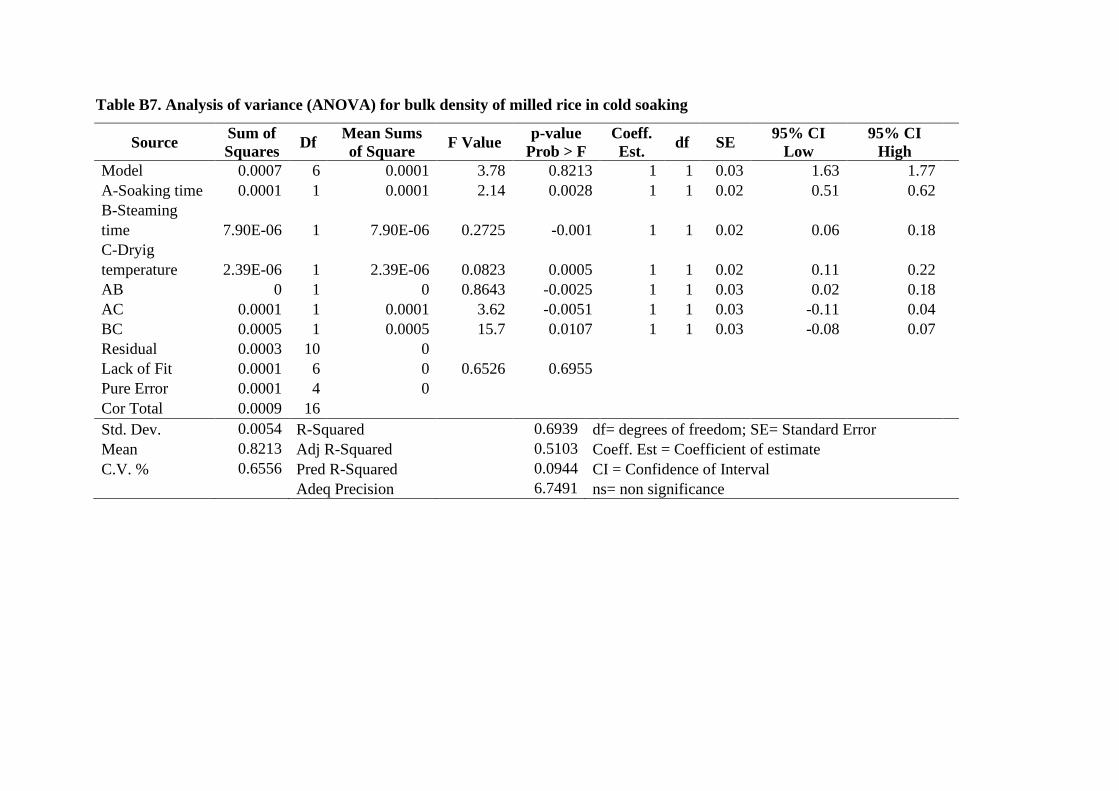
Table B7. Analysis of variance (ANOVA) for bulk density of milled rice in cold soaking
Source Sum of
Squares Df
Mean Sums
of Square F Value
p-value
Prob > F
Coeff.
Est. df SE
95% CI
Low
95% CI
High
Model 0.0007 6 0.0001 3.78 0.8213 1 1 0.03 1.63 1.77 A-Soaking time 0.0001 1 0.0001 2.14 0.0028 1 1 0.02 0.51 0.62 B-Steaming
time 7.90E-06 1 7.90E-06 0.2725 -0.001 1 1 0.02 0.06 0.18 C-Dryig
temperature 2.39E-06 1 2.39E-06 0.0823 0.0005 1 1 0.02 0.11 0.22 AB 0 1 0 0.8643 -0.0025 1 1 0.03 0.02 0.18 AC 0.0001 1 0.0001 3.62 -0.0051 1 1 0.03 -0.11 0.04 BC 0.0005 1 0.0005 15.7 0.0107 1 1 0.03 -0.08 0.07 Residual 0.0003 10 0 Lack of Fit 0.0001 6 0 0.6526 0.6955 Pure Error 0.0001 4 0 Cor Total 0.0009 16 Std. Dev. 0.0054 R-Squared 0.6939 df= degrees of freedom; SE= Standard Error
Mean 0.8213 Adj R-Squared 0.5103 Coeff. Est = Coefficient of estimate
C.V. % 0.6556 Pred R-Squared 0.0944 CI = Confidence of Interval
Adeq Precision 6.7491 ns= non significance
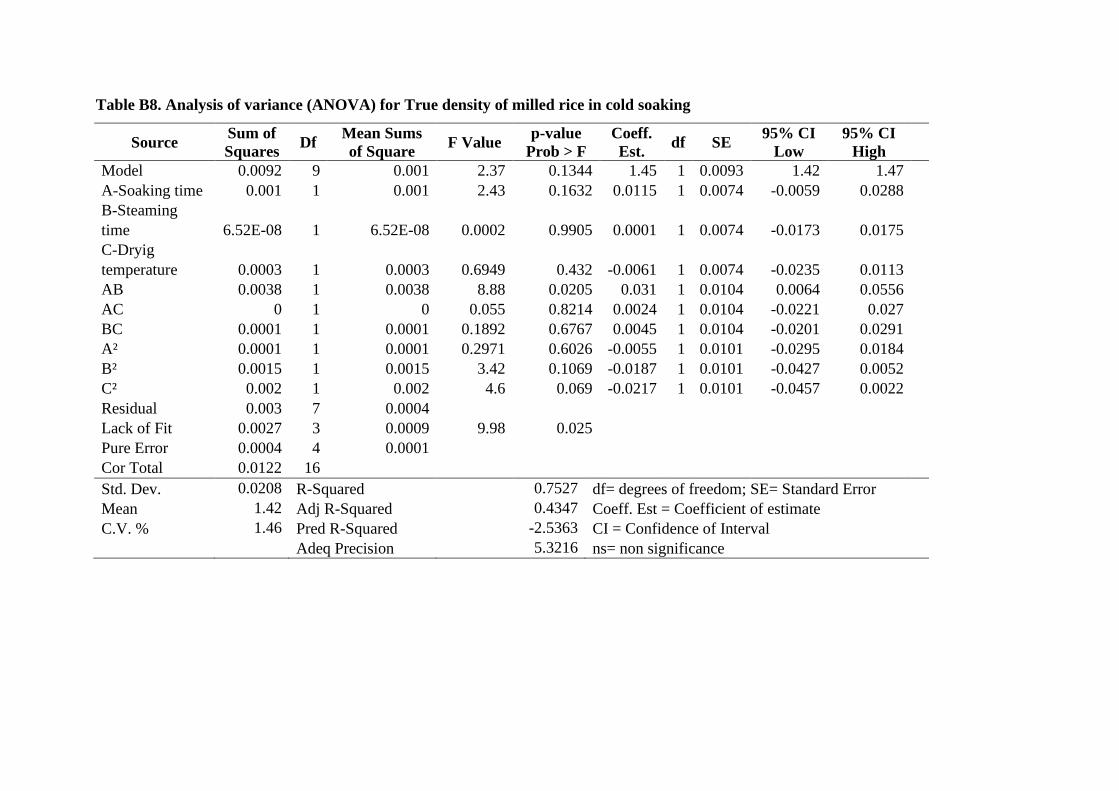
Table B8. Analysis of variance (ANOVA) for True density of milled rice in cold soaking
Source Sum of
Squares Df
Mean Sums
of Square F Value
p-value
Prob > F
Coeff.
Est. df SE
95% CI
Low
95% CI
High
Model 0.0092 9 0.001 2.37 0.1344 1.45 1 0.0093 1.42 1.47 A-Soaking time 0.001 1 0.001 2.43 0.1632 0.0115 1 0.0074 -0.0059 0.0288 B-Steaming
time 6.52E-08 1 6.52E-08 0.0002 0.9905 0.0001 1 0.0074 -0.0173 0.0175 C-Dryig
temperature 0.0003 1 0.0003 0.6949 0.432 -0.0061 1 0.0074 -0.0235 0.0113 AB 0.0038 1 0.0038 8.88 0.0205 0.031 1 0.0104 0.0064 0.0556 AC 0 1 0 0.055 0.8214 0.0024 1 0.0104 -0.0221 0.027 BC 0.0001 1 0.0001 0.1892 0.6767 0.0045 1 0.0104 -0.0201 0.0291 A² 0.0001 1 0.0001 0.2971 0.6026 -0.0055 1 0.0101 -0.0295 0.0184 B² 0.0015 1 0.0015 3.42 0.1069 -0.0187 1 0.0101 -0.0427 0.0052 C² 0.002 1 0.002 4.6 0.069 -0.0217 1 0.0101 -0.0457 0.0022 Residual 0.003 7 0.0004 Lack of Fit 0.0027 3 0.0009 9.98 0.025 Pure Error 0.0004 4 0.0001 Cor Total 0.0122 16 Std. Dev. 0.0208 R-Squared 0.7527 df= degrees of freedom; SE= Standard Error
Mean 1.42 Adj R-Squared 0.4347 Coeff. Est = Coefficient of estimate
C.V. % 1.46 Pred R-Squared -2.5363 CI = Confidence of Interval
Adeq Precision 5.3216 ns= non significance
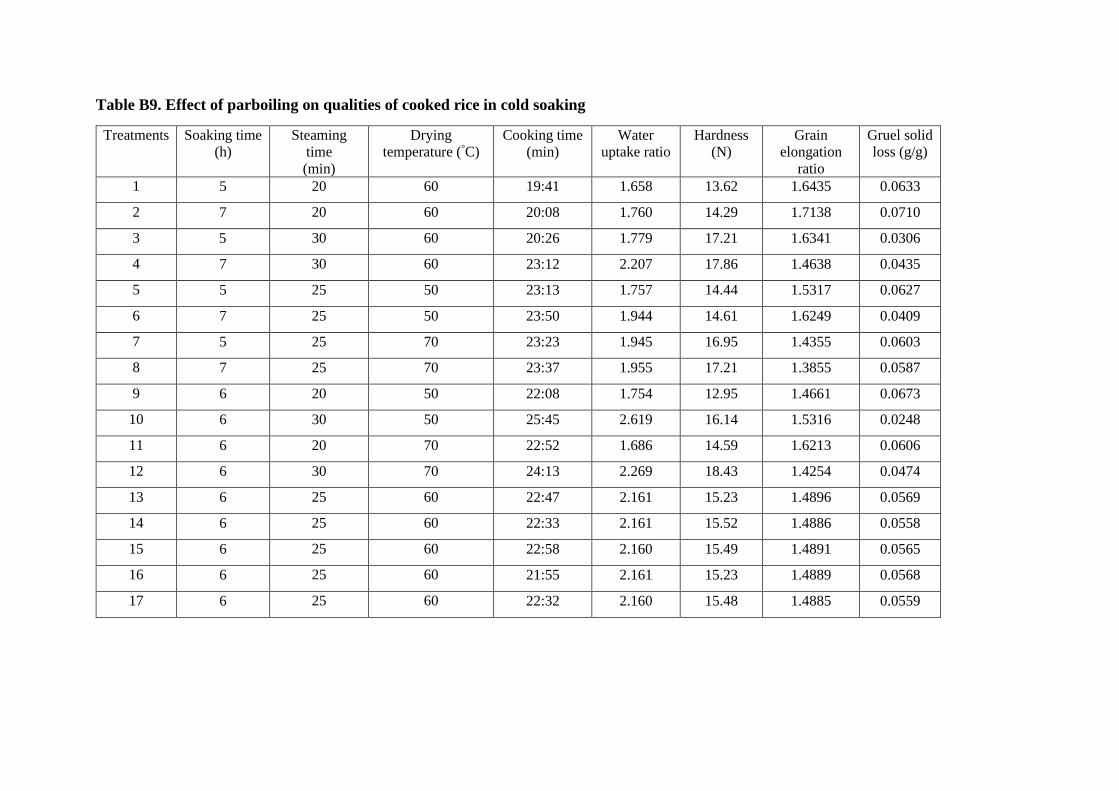
Table B9. Effect of parboiling on qualities of cooked rice in cold soaking
Treatments Soaking time
(h)
Steaming
time
(min)
Drying
temperature (°C)
Cooking time
(min)
Water
uptake ratio
Hardness
(N)
Grain
elongation
ratio
Gruel solid
loss (g/g)
1 5 20 60 19:41 1.658 13.62 1.6435 0.0633
2 7 20 60 20:08 1.760 14.29 1.7138 0.0710
3 5 30 60 20:26 1.779 17.21 1.6341 0.0306
4 7 30 60 23:12 2.207 17.86 1.4638 0.0435
5 5 25 50 23:13 1.757 14.44 1.5317 0.0627
6 7 25 50 23:50 1.944 14.61 1.6249 0.0409
7 5 25 70 23:23 1.945 16.95 1.4355 0.0603
8 7 25 70 23:37 1.955 17.21 1.3855 0.0587
9 6 20 50 22:08 1.754 12.95 1.4661 0.0673
10 6 30 50 25:45 2.619 16.14 1.5316 0.0248
11 6 20 70 22:52 1.686 14.59 1.6213 0.0606
12 6 30 70 24:13 2.269 18.43 1.4254 0.0474
13 6 25 60 22:47 2.161 15.23 1.4896 0.0569
14 6 25 60 22:33 2.161 15.52 1.4886 0.0558
15 6 25 60 22:58 2.160 15.49 1.4891 0.0565
16 6 25 60 21:55 2.161 15.23 1.4889 0.0568
17 6 25 60 22:32 2.160 15.48 1.4885 0.0559
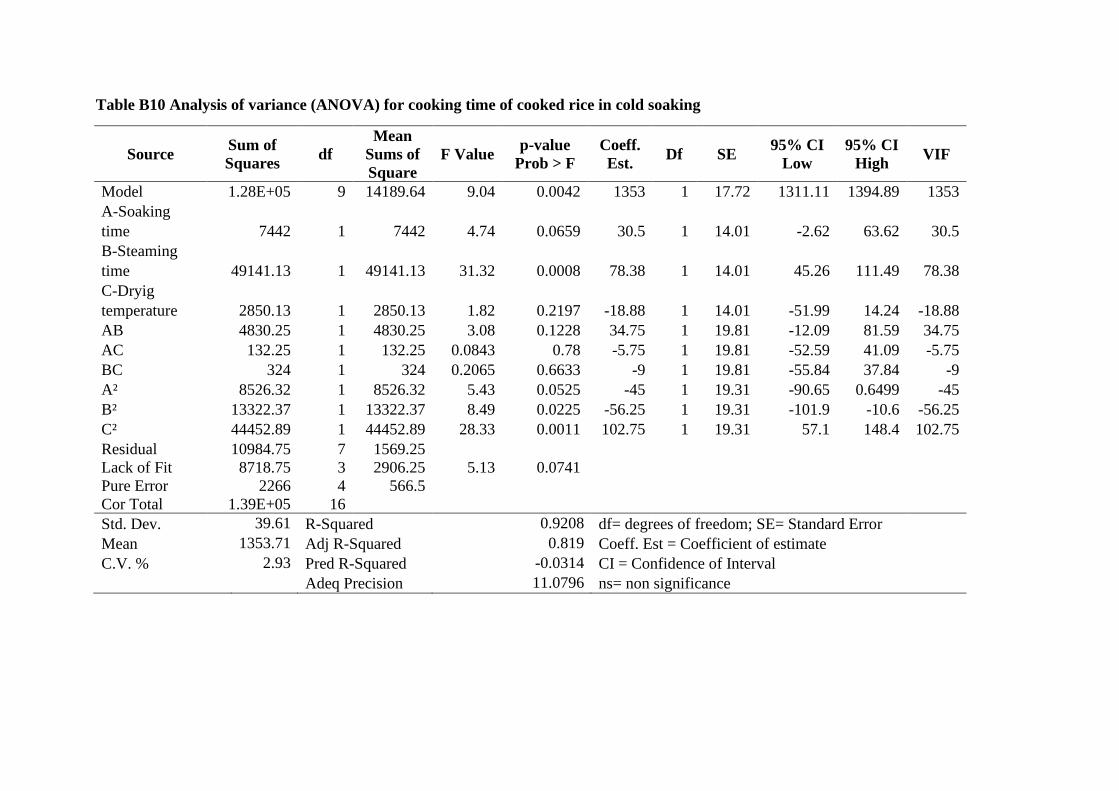
Table B10 Analysis of variance (ANOVA) for cooking time of cooked rice in cold soaking
Source Sum of
Squares df
Mean
Sums of
Square
F Value p-value
Prob > F
Coeff.
Est. Df SE
95% CI
Low
95% CI
High VIF
Model 1.28E+05 9 14189.64 9.04 0.0042 1353 1 17.72 1311.11 1394.89 1353
A-Soaking
time 7442 1 7442 4.74 0.0659 30.5 1 14.01 -2.62 63.62 30.5
B-Steaming
time 49141.13 1 49141.13 31.32 0.0008 78.38 1 14.01 45.26 111.49 78.38
C-Dryig
temperature 2850.13 1 2850.13 1.82 0.2197 -18.88 1 14.01 -51.99 14.24 -18.88
AB 4830.25 1 4830.25 3.08 0.1228 34.75 1 19.81 -12.09 81.59 34.75
AC 132.25 1 132.25 0.0843 0.78 -5.75 1 19.81 -52.59 41.09 -5.75
BC 324 1 324 0.2065 0.6633 -9 1 19.81 -55.84 37.84 -9
A² 8526.32 1 8526.32 5.43 0.0525 -45 1 19.31 -90.65 0.6499 -45
B² 13322.37 1 13322.37 8.49 0.0225 -56.25 1 19.31 -101.9 -10.6 -56.25
C² 44452.89 1 44452.89 28.33 0.0011 102.75 1 19.31 57.1 148.4 102.75
Residual 10984.75 7 1569.25
Lack of Fit 8718.75 3 2906.25 5.13 0.0741
Pure Error 2266 4 566.5
Cor Total 1.39E+05 16
Std. Dev. 39.61 R-Squared 0.9208 df= degrees of freedom; SE= Standard Error
Mean 1353.71 Adj R-Squared 0.819 Coeff. Est = Coefficient of estimate
C.V. % 2.93 Pred R-Squared -0.0314 CI = Confidence of Interval
Adeq Precision 11.0796 ns= non significance
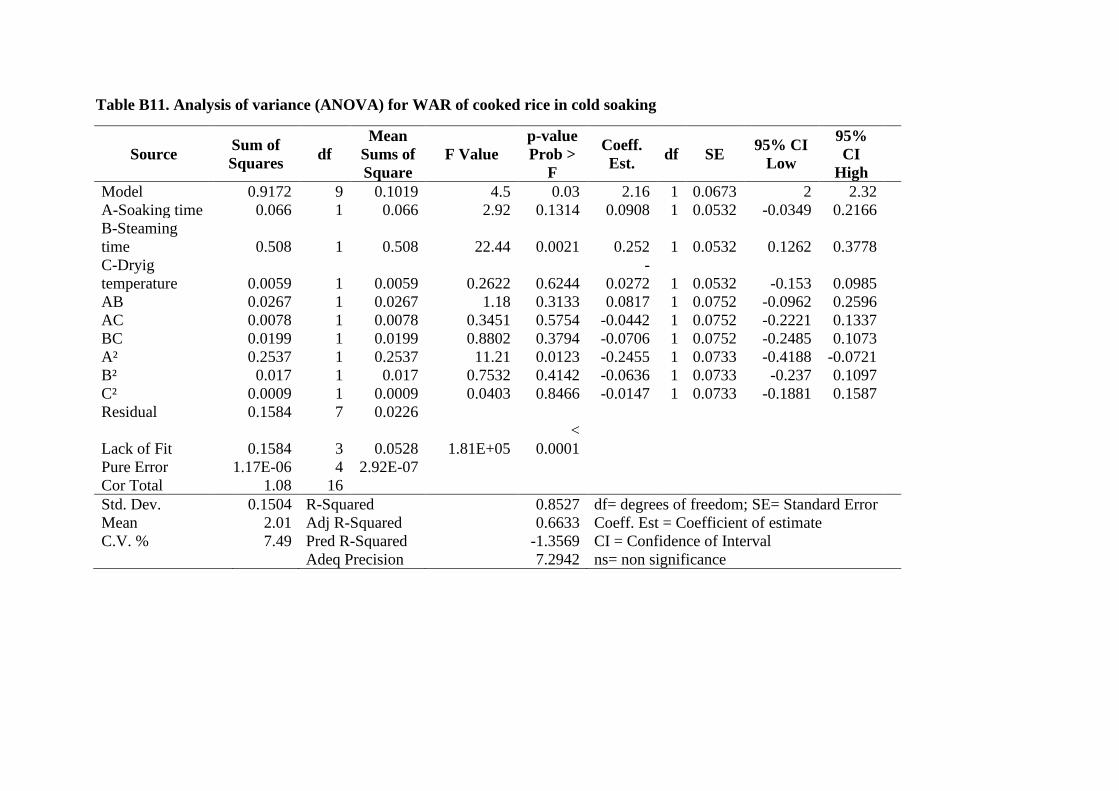
Table B11. Analysis of variance (ANOVA) for WAR of cooked rice in cold soaking
Source Sum of
Squares df
Mean
Sums of
Square
F Value
p-value
Prob >
F
Coeff.
Est. df SE
95% CI
Low
95%
CI
High
Model 0.9172 9 0.1019 4.5 0.03 2.16 1 0.0673 2 2.32
A-Soaking time 0.066 1 0.066 2.92 0.1314 0.0908 1 0.0532 -0.0349 0.2166
B-Steaming
time 0.508 1 0.508 22.44 0.0021 0.252 1 0.0532 0.1262 0.3778
C-Dryig
temperature 0.0059 1 0.0059 0.2622 0.6244
-
0.0272 1 0.0532 -0.153 0.0985
AB 0.0267 1 0.0267 1.18 0.3133 0.0817 1 0.0752 -0.0962 0.2596
AC 0.0078 1 0.0078 0.3451 0.5754 -0.0442 1 0.0752 -0.2221 0.1337
BC 0.0199 1 0.0199 0.8802 0.3794 -0.0706 1 0.0752 -0.2485 0.1073
A² 0.2537 1 0.2537 11.21 0.0123 -0.2455 1 0.0733 -0.4188 -0.0721
B² 0.017 1 0.017 0.7532 0.4142 -0.0636 1 0.0733 -0.237 0.1097
C² 0.0009 1 0.0009 0.0403 0.8466 -0.0147 1 0.0733 -0.1881 0.1587
Residual 0.1584 7 0.0226
Lack of Fit 0.1584 3 0.0528 1.81E+05
<
0.0001
Pure Error 1.17E-06 4 2.92E-07
Cor Total 1.08 16
Std. Dev. 0.1504 R-Squared 0.8527 df= degrees of freedom; SE= Standard Error
Mean 2.01 Adj R-Squared 0.6633 Coeff. Est = Coefficient of estimate
C.V. % 7.49 Pred R-Squared -1.3569 CI = Confidence of Interval
Adeq Precision 7.2942 ns= non significance
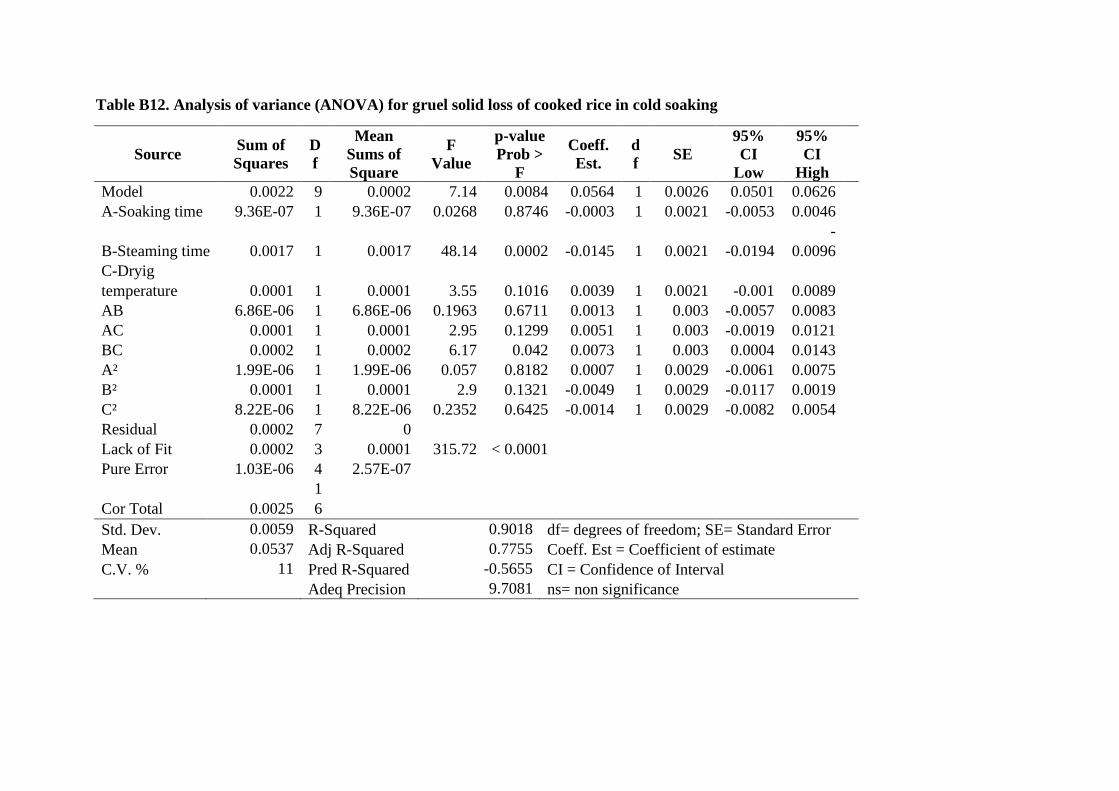
Table B12. Analysis of variance (ANOVA) for gruel solid loss of cooked rice in cold soaking
Source Sum of
Squares
D
f
Mean
Sums of
Square
F
Value
p-value
Prob >
F
Coeff.
Est.
d
f SE
95%
CI
Low
95%
CI
High
Model 0.0022 9 0.0002 7.14 0.0084 0.0564 1 0.0026 0.0501 0.0626
A-Soaking time 9.36E-07 1 9.36E-07 0.0268 0.8746 -0.0003 1 0.0021 -0.0053 0.0046
B-Steaming time 0.0017 1 0.0017 48.14 0.0002 -0.0145 1 0.0021 -0.0194
-
0.0096
C-Dryig
temperature 0.0001 1 0.0001 3.55 0.1016 0.0039 1 0.0021 -0.001 0.0089
AB 6.86E-06 1 6.86E-06 0.1963 0.6711 0.0013 1 0.003 -0.0057 0.0083
AC 0.0001 1 0.0001 2.95 0.1299 0.0051 1 0.003 -0.0019 0.0121
BC 0.0002 1 0.0002 6.17 0.042 0.0073 1 0.003 0.0004 0.0143
A² 1.99E-06 1 1.99E-06 0.057 0.8182 0.0007 1 0.0029 -0.0061 0.0075
B² 0.0001 1 0.0001 2.9 0.1321 -0.0049 1 0.0029 -0.0117 0.0019
C² 8.22E-06 1 8.22E-06 0.2352 0.6425 -0.0014 1 0.0029 -0.0082 0.0054
Residual 0.0002 7 0
Lack of Fit 0.0002 3 0.0001 315.72 < 0.0001
Pure Error 1.03E-06 4 2.57E-07
Cor Total 0.0025
1
6
Std. Dev. 0.0059 R-Squared 0.9018 df= degrees of freedom; SE= Standard Error
Mean 0.0537 Adj R-Squared 0.7755 Coeff. Est = Coefficient of estimate
C.V. % 11 Pred R-Squared -0.5655 CI = Confidence of Interval
Adeq Precision 9.7081 ns= non significance
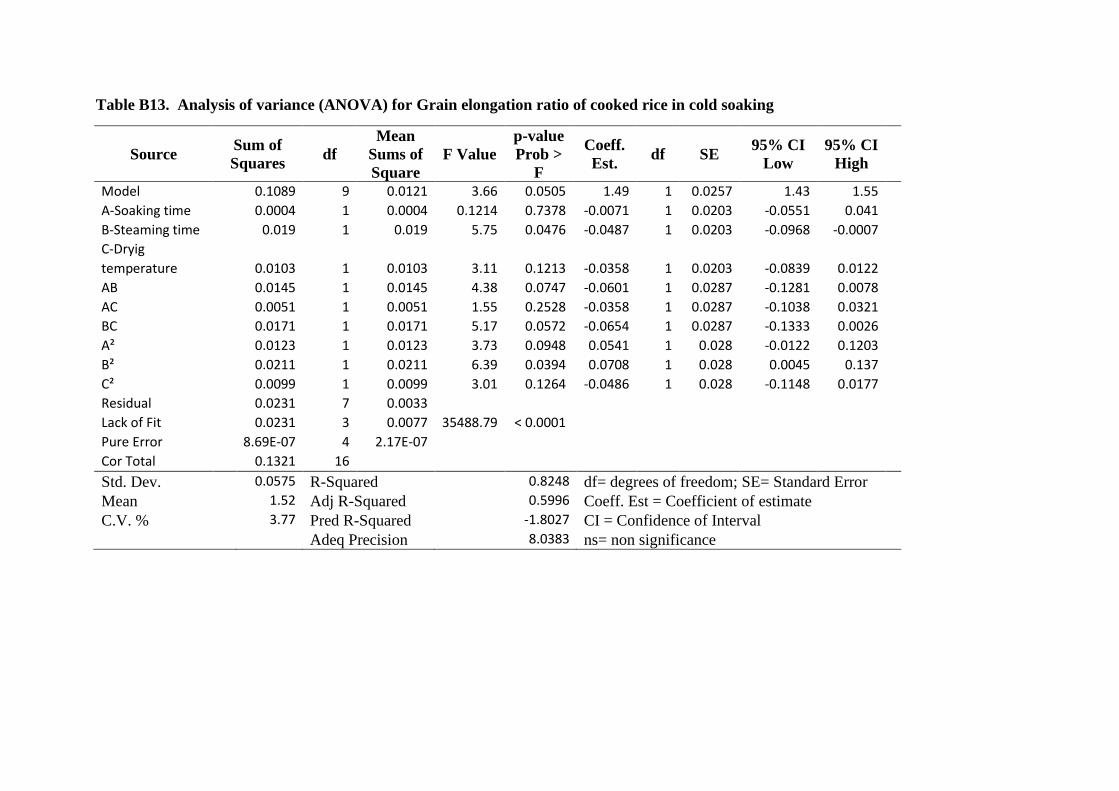
Table B13. Analysis of variance (ANOVA) for Grain elongation ratio of cooked rice in cold soaking
Source Sum of
Squares df
Mean
Sums of
Square
F Value
p-value
Prob >
F
Coeff.
Est. df SE
95% CI
Low
95% CI
High
Model 0.1089 9 0.0121 3.66 0.0505 1.49 1 0.0257 1.43 1.55
A-Soaking time 0.0004 1 0.0004 0.1214 0.7378 -0.0071 1 0.0203 -0.0551 0.041
B-Steaming time 0.019 1 0.019 5.75 0.0476 -0.0487 1 0.0203 -0.0968 -0.0007
C-Dryig
temperature 0.0103 1 0.0103 3.11 0.1213 -0.0358 1 0.0203 -0.0839 0.0122
AB 0.0145 1 0.0145 4.38 0.0747 -0.0601 1 0.0287 -0.1281 0.0078
AC 0.0051 1 0.0051 1.55 0.2528 -0.0358 1 0.0287 -0.1038 0.0321
BC 0.0171 1 0.0171 5.17 0.0572 -0.0654 1 0.0287 -0.1333 0.0026
A² 0.0123 1 0.0123 3.73 0.0948 0.0541 1 0.028 -0.0122 0.1203
B² 0.0211 1 0.0211 6.39 0.0394 0.0708 1 0.028 0.0045 0.137
C² 0.0099 1 0.0099 3.01 0.1264 -0.0486 1 0.028 -0.1148 0.0177
Residual 0.0231 7 0.0033
Lack of Fit 0.0231 3 0.0077 35488.79 < 0.0001
Pure Error 8.69E-07 4 2.17E-07
Cor Total 0.1321 16
Std. Dev. 0.0575 R-Squared 0.8248 df= degrees of freedom; SE= Standard Error
Mean 1.52 Adj R-Squared 0.5996 Coeff. Est = Coefficient of estimate
C.V. % 3.77 Pred R-Squared -1.8027 CI = Confidence of Interval
Adeq Precision 8.0383 ns= non significance
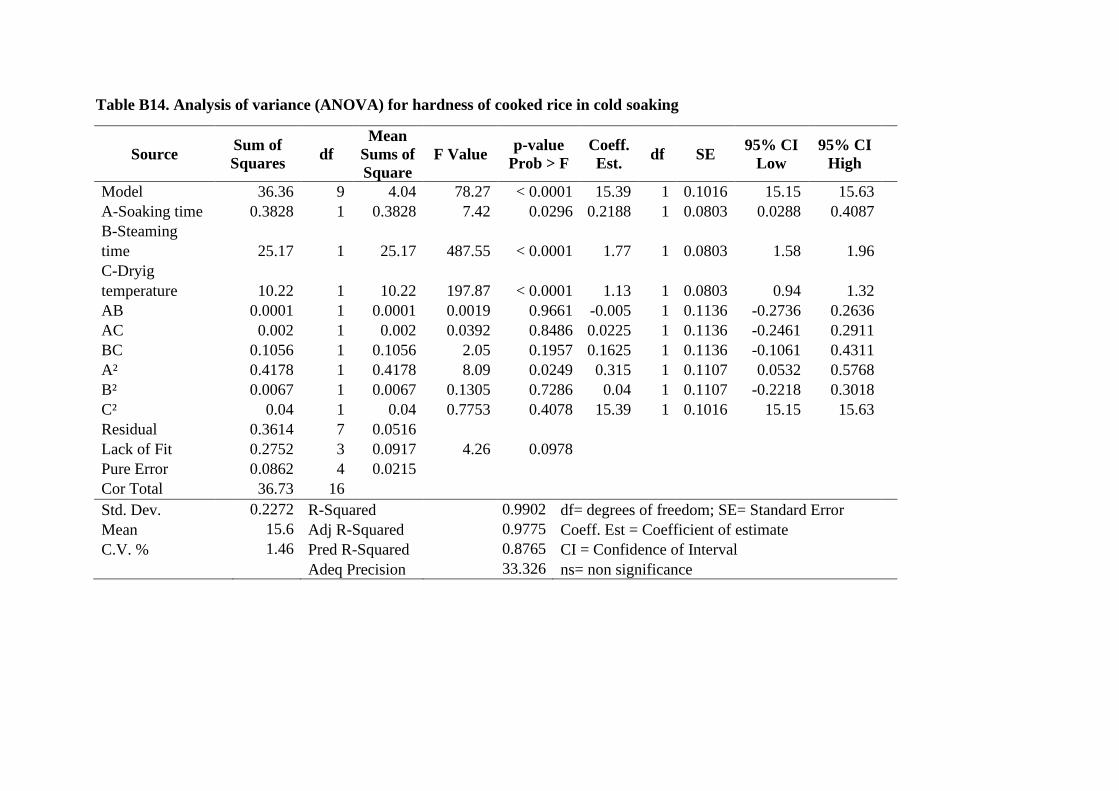
Table B14. Analysis of variance (ANOVA) for hardness of cooked rice in cold soaking
Source Sum of
Squares df
Mean
Sums of
Square
F Value p-value
Prob > F
Coeff.
Est. df SE
95% CI
Low
95% CI
High
Model 36.36 9 4.04 78.27 < 0.0001 15.39 1 0.1016 15.15 15.63
A-Soaking time 0.3828 1 0.3828 7.42 0.0296 0.2188 1 0.0803 0.0288 0.4087
B-Steaming
time 25.17 1 25.17 487.55 < 0.0001 1.77 1 0.0803 1.58 1.96
C-Dryig
temperature 10.22 1 10.22 197.87 < 0.0001 1.13 1 0.0803 0.94 1.32
AB 0.0001 1 0.0001 0.0019 0.9661 -0.005 1 0.1136 -0.2736 0.2636
AC 0.002 1 0.002 0.0392 0.8486 0.0225 1 0.1136 -0.2461 0.2911
BC 0.1056 1 0.1056 2.05 0.1957 0.1625 1 0.1136 -0.1061 0.4311
A² 0.4178 1 0.4178 8.09 0.0249 0.315 1 0.1107 0.0532 0.5768
B² 0.0067 1 0.0067 0.1305 0.7286 0.04 1 0.1107 -0.2218 0.3018
C² 0.04 1 0.04 0.7753 0.4078 15.39 1 0.1016 15.15 15.63
Residual 0.3614 7 0.0516
Lack of Fit 0.2752 3 0.0917 4.26 0.0978
Pure Error 0.0862 4 0.0215
Cor Total 36.73 16
Std. Dev. 0.2272 R-Squared 0.9902 df= degrees of freedom; SE= Standard Error
Mean 15.6 Adj R-Squared 0.9775 Coeff. Est = Coefficient of estimate
C.V. % 1.46 Pred R-Squared 0.8765 CI = Confidence of Interval
Adeq Precision 33.326 ns= non significance
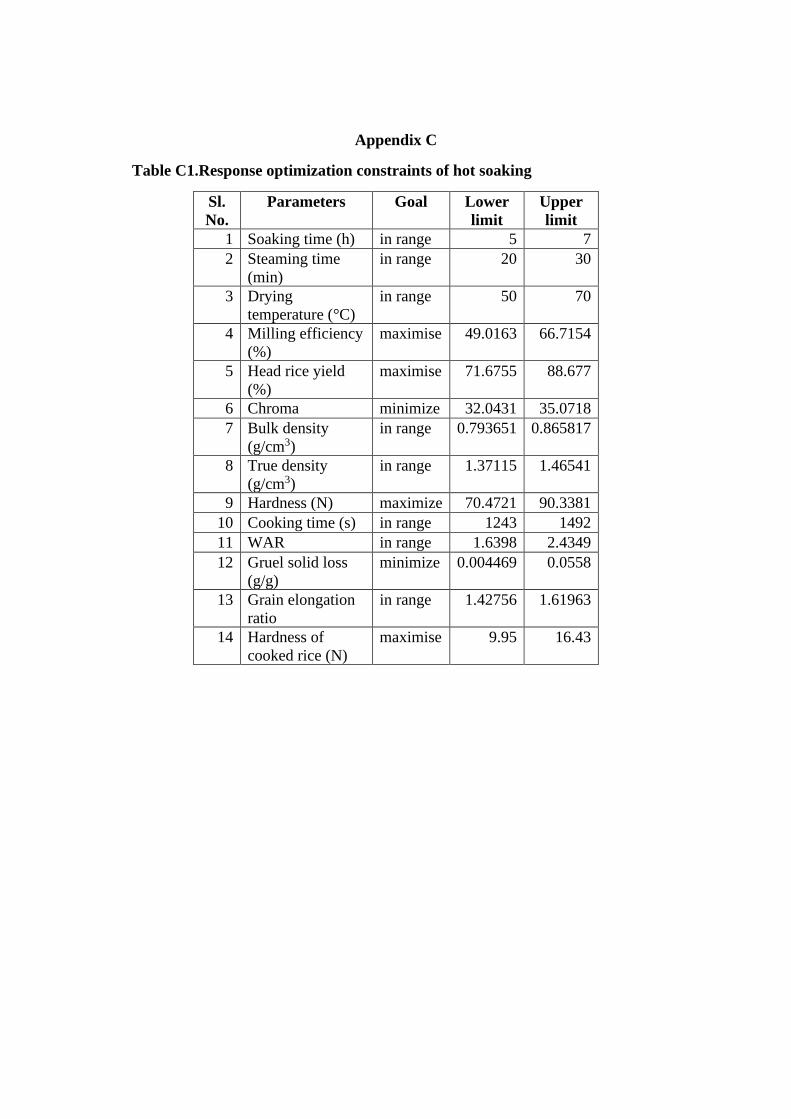
Appendix C
Table C1.Response optimization constraints of hot soaking
Sl.
No.
Parameters Goal Lower
limit
Upper
limit
1 Soaking time (h) in range 5 7
2 Steaming time
(min)
in range 20 30
3 Drying
temperature (°C)
in range 50 70
4 Milling efficiency
(%)
maximise 49.0163 66.7154
5 Head rice yield
(%)
maximise 71.6755 88.677
6 Chroma minimize 32.0431 35.0718
7 Bulk density
(g/cm3)
in range 0.793651 0.865817
8 True density
(g/cm3)
in range 1.37115 1.46541
9 Hardness (N) maximize 70.4721 90.3381
10 Cooking time (s) in range 1243 1492
11 WAR in range 1.6398 2.4349
12 Gruel solid loss
(g/g)
minimize 0.004469 0.0558
13 Grain elongation
ratio
in range 1.42756 1.61963
14 Hardness of
cooked rice (N)
maximise 9.95 16.43
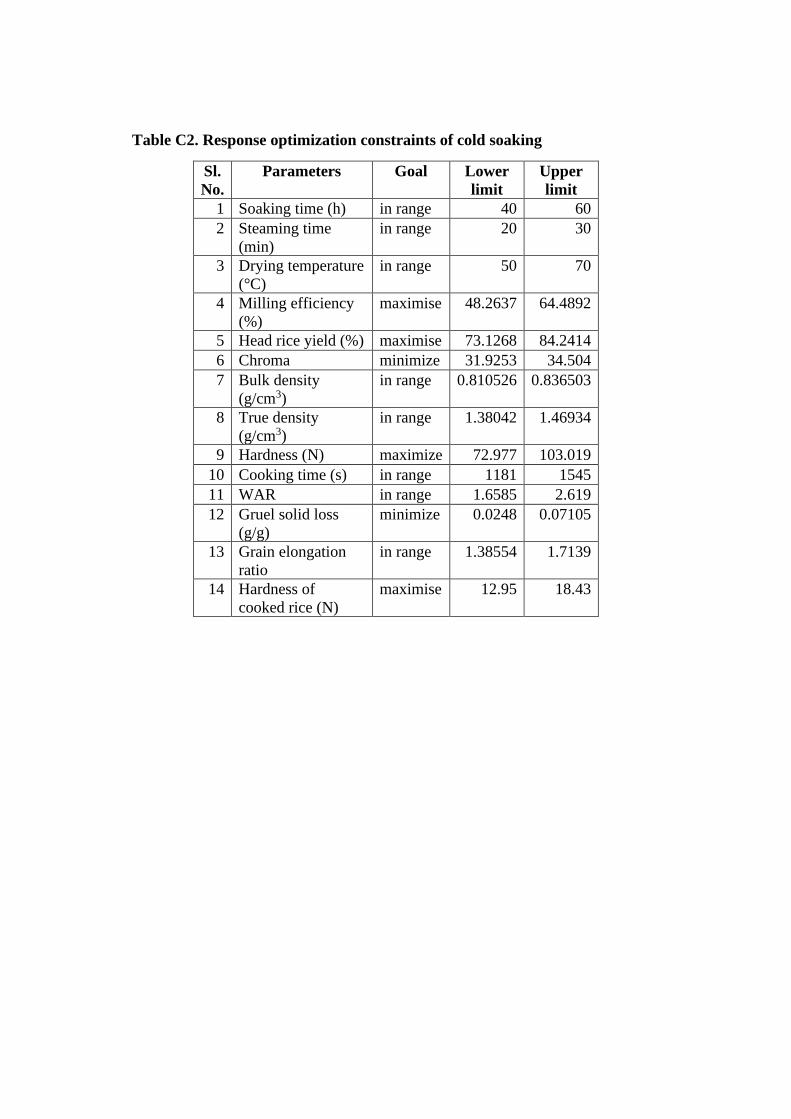
Table C2. Response optimization constraints of cold soaking
Sl.
No.
Parameters Goal Lower
limit
Upper
limit
1 Soaking time (h) in range 40 60
2 Steaming time
(min)
in range 20 30
3 Drying temperature
(°C)
in range 50 70
4 Milling efficiency
(%)
maximise 48.2637 64.4892
5 Head rice yield (%) maximise 73.1268 84.2414
6 Chroma minimize 31.9253 34.504
7 Bulk density
(g/cm3)
in range 0.810526 0.836503
8 True density
(g/cm3)
in range 1.38042 1.46934
9 Hardness (N) maximize 72.977 103.019
10 Cooking time (s) in range 1181 1545
11 WAR in range 1.6585 2.619
12 Gruel solid loss
(g/g)
minimize 0.0248 0.07105
13 Grain elongation
ratio
in range 1.38554 1.7139
14 Hardness of
cooked rice (N)
maximise 12.95 18.43
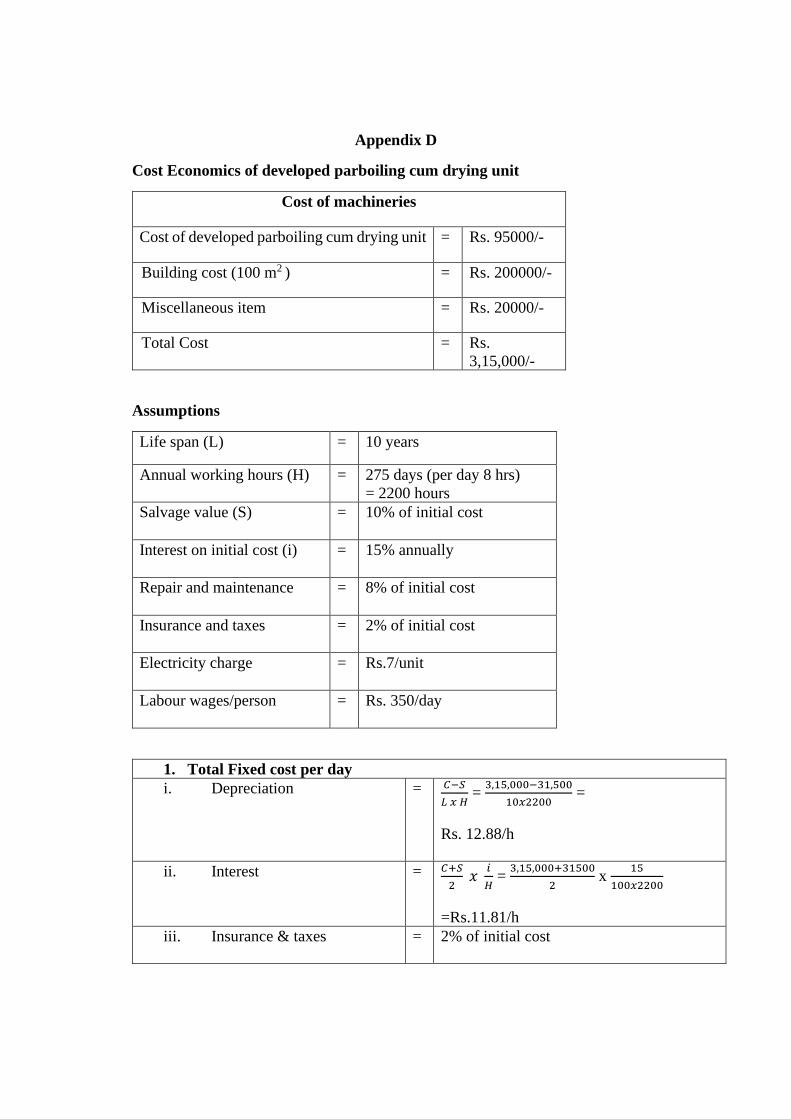
Appendix D
Cost Economics of developed parboiling cum drying unit
Cost of machineries
Cost of developed parboiling cum drying unit = Rs. 95000/-
Building cost (100 m2 ) = Rs. 200000/-
Miscellaneous item = Rs. 20000/-
Total Cost = Rs.
3,15,000/-
Assumptions
Life span (L) = 10 years
Annual working hours (H) = 275 days (per day 8 hrs)
= 2200 hours
Salvage value (S) = 10% of initial cost
Interest on initial cost (i) = 15% annually
Repair and maintenance = 8% of initial cost
Insurance and taxes = 2% of initial cost
Electricity charge = Rs.7/unit
Labour wages/person = Rs. 350/day
1. Total Fixed cost per day
i. Depreciation = 𝐶−𝑆
𝐿 𝑥 𝐻 =
3,15,000−31,500
10𝑥2200 =
Rs. 12.88/h
ii. Interest = 𝐶+𝑆
2 𝑥
𝑖
𝐻 =
3,15,000+31500
2 x
15
100𝑥2200
=Rs.11.81/h
iii. Insurance & taxes = 2% of initial cost
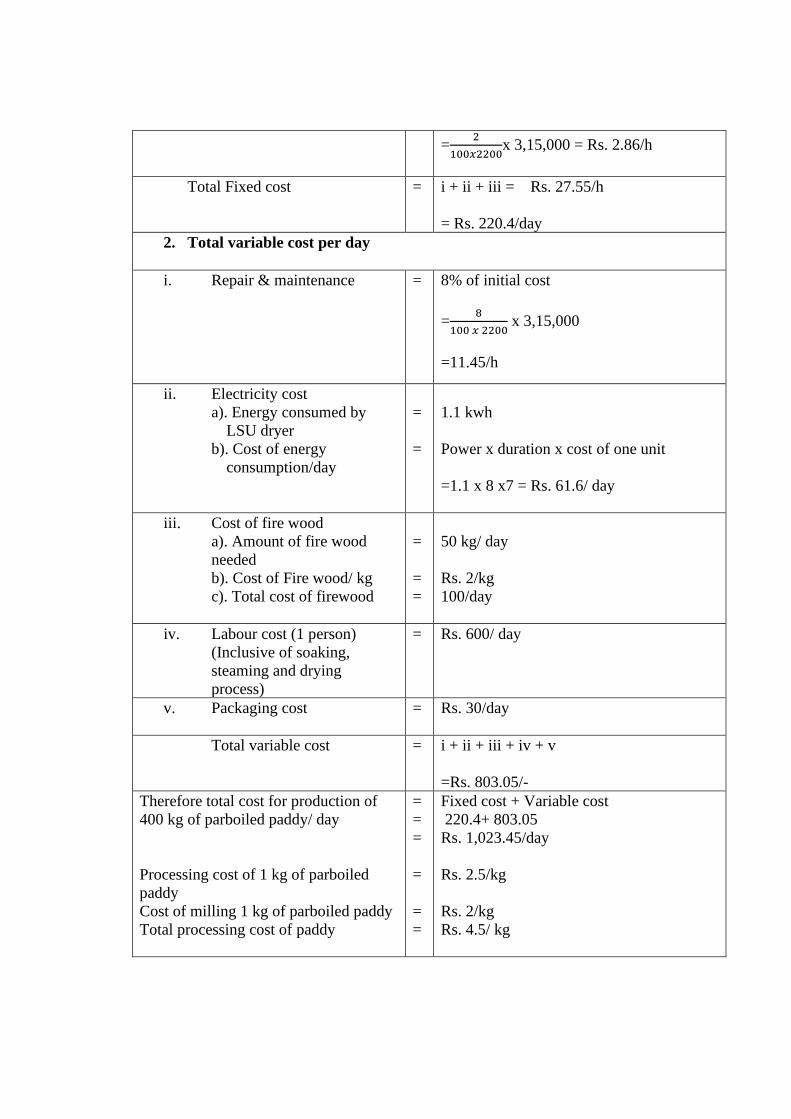
=2
100𝑥2200x 3,15,000 = Rs. 2.86/h
Total Fixed cost = i + ii + iii = Rs. 27.55/h
= Rs. 220.4/day
2. Total variable cost per day
i. Repair & maintenance = 8% of initial cost
=8
100 𝑥 2200 x 3,15,000
=11.45/h
ii. Electricity cost
a). Energy consumed by
LSU dryer
b). Cost of energy
consumption/day
=
=
1.1 kwh
Power x duration x cost of one unit
=1.1 x 8 x7 = Rs. 61.6/ day
iii. Cost of fire wood
a). Amount of fire wood
needed
b). Cost of Fire wood/ kg
c). Total cost of firewood
=
=
=
50 kg/ day
Rs. 2/kg
100/day
iv. Labour cost (1 person)
(Inclusive of soaking,
steaming and drying
process)
= Rs. 600/ day
v. Packaging cost
= Rs. 30/day
Total variable cost = i + ii + iii + iv + v
=Rs. 803.05/-
Therefore total cost for production of
400 kg of parboiled paddy/ day
Processing cost of 1 kg of parboiled
paddy
Cost of milling 1 kg of parboiled paddy
Total processing cost of paddy
=
=
=
=
=
=
Fixed cost + Variable cost
220.4+ 803.05
Rs. 1,023.45/day
Rs. 2.5/kg
Rs. 2/kg
Rs. 4.5/ kg

Processing cost of parboiling and milling the paddy in rice mills = Rs.6/kg
Benefit-cost ratio = 6
4.5 = 1.33
Therefore the total processing cost of 1 kg of parboiled paddy in the parboiling
cum drying unit was found to be Rs. 2.5. The benefit cost ratio was found to be
1.33:1

DEVELOPMENT OF SMALL SCALE PARBOILING CUM
DRYING UNIT FOR PADDY PROCESSING
by
ANN ANNIE SHAJU
(2018-18-022)
ABSTRACT OF THE THESIS
Submitted in partial fulfilment of the requirement for the degree of
MASTER OF TECHNOLOGY
IN
AGRICULTURAL ENGINEERING
(Agricultural Processing and Food Engineering)
Faculty of Agricultural Engineering & Technology
Kerala Agricultural University
DEPARTMENT OF PROCESSING AND FOOD ENGINEERING
KELAPPAJI COLLEGE OF AGRICULTURAL ENGINEERING AND
TECHNOLOGY
TAVANUR - 679573, MALAPPURAM
KERALA, INDIA
2020

Abstract
Parboiling is an optional unit operation in paddy processing, which results in
enhanced milling efficiency with improved nutritional quality of the rice. It is
accomplished through the process of soaking, steaming and drying, to gelatinize the
starch. Technological advancement in the industrial parboiling has resulted in
extensive improvisation of process controls in large-scale industrial parboiling units.
But enormous initial investments required for infrastructure, along with the time,
labour and energy involved in paddy parboiling made it uneconomical for small scale
milling and processing units to undertake parboiling. In this scenario, a small scale
parboiling cum drying unit with reduced drudgery and less human interventions was
fabricated in this present study for paddy processing and its evaluation was done. The
unit mainly consists of two soaking cum steaming chambers (100 kg/tank), LSU dryer,
bucket elevator, steam boiler and heat furnace. Soaking and steaming was carried out
in the same chamber and drying was carried out in the LSU dryer. The paddy crop
variety Jyothi was parboiled at different soaking and steaming times (20, 25 and 30
min) and drying temperatures (50, 60 and 70°C) in both hot soaking and cold soaking
methods. The performance evaluation of the developed unit was done by analysing the
milling and cooking qualities of the parboiled paddy. The treatments were optimised
using the Response Surface Methodology (Box Behnken) method. An increase in
steaming time exerted a significant effect on milling and cooking qualities of parboiled
paddy. The increase in drying time decreased the milling efficiency, head rice yield
and hardness of the parboiled milled rice. After optimisation, for hot soaking, milling
efficiency of 65.43% and head rice yield of 87.78% were obtained with a soaking time
of 7 h, steaming time of 26.07 min and drying temperature of 52°C. In case of cold
soaking, milling efficiency of 62.15% and head rice yield of 81.93% were obtained
with a soaking time of 60 h, steaming time of 27 min and drying temperature of 52°C.
The processing cost of parboiling one-kilogram paddy in the developed unit were Rs.
2.55/-. The benefit cost ratio for the parboiling process was found to be 1.33:1, which
revealed that the developed unit was economically feasible.