Embed Size (px)
Citation preview

DEVELOPMENT OF METHODOLOGY FOR QUANTITATIVE DETECTION OF E. COLI O157:H7 IN GROUND BEEF VIA IMMUNOASSAYS
AND THE POLYMERASE CHAIN REACTION
A Dissertation presented
by
ASSEM ABOLMAATY SAYEDAHMED
Submitted to the Graduate School of the University of Massachusetts Amherst in partial fulfillment
of the requirements for the degree of
DOCTOR OF PHILOSOPHY
May 2006
Food Science
UMI Number: 3215906
32159062006
Copyright 2006 bySayedahmed, Assem Abolmaaty
UMI MicroformCopyright
All rights reserved. This microform edition is protected against unauthorized copying under Title 17, United States Code.
ProQuest Information and Learning Company 300 North Zeeb Road
P.O. Box 1346 Ann Arbor, MI 48106-1346
All rights reserved.
by ProQuest Information and Learning Company.

© Copyright by Assem Abolmaaty Sayedahmed 2006 All Rights Reserved

DEVELOPMENT OF METHODOLOGY FOR QUANTITATIVE DETECTION OF E. COLI O157:H7 IN GROUND BEEF VIA IMMUNOASSAYS
AND THE POLYMERASE CHAIN REACTION
A Dissertation presented
by
ASSEM ABOLMAATY SAYEDAHMED
Approved as to style and content by: Robert E. Levin, Chair
Ronald G. Labbe, Member
Lynne A. McLandsborough, Member
Sarah M. Dorner, Member
Fergus M. Clydesdale, Department Head Food Science

DEDICATION
To the memory of my father

ACKNOWLEDGMENT
I have sincere thanks to many who contributed in executing this mammoth task.
First and foremost, I would like to acknowledge and thank Dr. Robert E. Levin
for providing me a home at his research laboratory and helping to initiate the research
that I have undertaken during the completion of this work. I appreciate his dedication to
his students, teaching, and research. As my advisor, he has been invaluable in improving
everything related to my academic career. Without his help, constant encouragement, and
support, this work would not have been possible.
I thank Dr. Ronald G. Labbe for his help, suggestions and being among the
defense committee. His interaction with me has been as friend and mentor. I thank Dr.
Lynne A McLandsborough and Dr. Sarah Dorner for being among the defense committee
I thank Dr. Mohamed Amin Abdallah for his help and support and encouragement
toward my academic carrier. I would like to thank Dr. Fergus M. Clydesdale, Dr. Wasef
Nawar, Dr. Kalidas Shetty, and Dr. Mokhtar Atallah, for their advice and support during
my stay here at the University of Massachusetts. I thank Mrs. Ruth Witkowsky for her
help in the lab during the completion of my research. My sincere appreciation and thank
to my wife, and my son who have been patient , supportive and understanding of the
early mornings and late nights spent away from them completing this endeavor.
I
ABSTRACT
DEVELOPMENT OF METHODOLOGY FOR QUANTITATIVE DETECTION OF E. COLI O157:H7 IN GROUND BEEF VIA IMMUNOASSAYS
AND THE POLYMERASE CHAIN REACTION
MAY 2006
ASSEM ABOLMAATY SAYEDAHMED*
B.S., AIN SHAMS UNIVERSITY, EGYPT.
M.S., AIN SHAMS UNIVERSITY, EGYPT.
Ph.D., UNIVERSITY OF MASSSACHUSETTS AMHERST.
Directed by: Professor Robert E. Levin
Escherichia coli O157:H7 is recognized as a major human enteropathogen.
Immunotechnology and DNA based methods were developed for quantitative detection
of E. coli O157:H7 in ground beef. A direct spectrophotometric immuno-agglutination
assay was developed for quantitation of specific Escherichia coli O157 IgG. Optimum
conditions of the assay consisted of 1 x 10⁸ cells/ml, 40oC, and 0.005M phosphate buffer
containing 0.05% NaCl at pH 7.4. The assay was able to quantitate (13 to 104) μg IgG/ml
of anti O157 IgG in crude antiserum and was effectively used with different batches of
locally produced antisera.
A new cell lysis solution designated TZ (2.0% Triton X-100 in 0.1 M Tris-HCl
buffer plus 2.5 mg sodium azide/ml, pH 8.0) was developed. TZ lysis solution was found
superior to a variety of cell lysing methods (d.H2O, PCR buffer, SDS, Triton X-100,
* The author uses his initial first name and middle name (A. Abolmaaty) for publication purposes
II

proteinase K, and lysozyme in combination with proteinase K) and released the greatest
yield of E. coli O157:H7 DNA targets prior to PCR. Highest amplification of E. coli
O157: H7 SLT-1 and SLT-2 DNA sequences were achieved with the aid of TZ lysis
solution and pellet paint.
Using 0.01 M phosphate buffered saline pH 6.0 with the aid of differential
centrifugation resulted in 57% + 6 recovery of E. coli O157:H7 from seeded ground beef.
The optimization of PCR reaction mixture resulted in a minimum detection level of 100
SLT-1 DNA sequence compared to 200 DNA targets before the optimization. Prior to
optimization, the minimum limits for the SLT-2 DNA sequence was 150 DNA targets
compared to 20 after complete optimization. The complete optimization of PCR reaction
mixture contained 1 mM MgCl2, 1.6 µM each of the two primers, (2.5 and 5 units) of Taq
polymerase for SLT-1 and SLT-2 respectively, and 0.2 mM of Deoxynucleotide
Triphosphates (dNTPs). The methodologies developed thereby resulted in the detection
of 100 cells of E. coli O157:H7 with SLT-1 primer and 50 cells with SLT-2 primer per 10
grams of ground beef after 5.5 hours of pre-enrichment in 30 ml of TSB+ at 37oC.
III
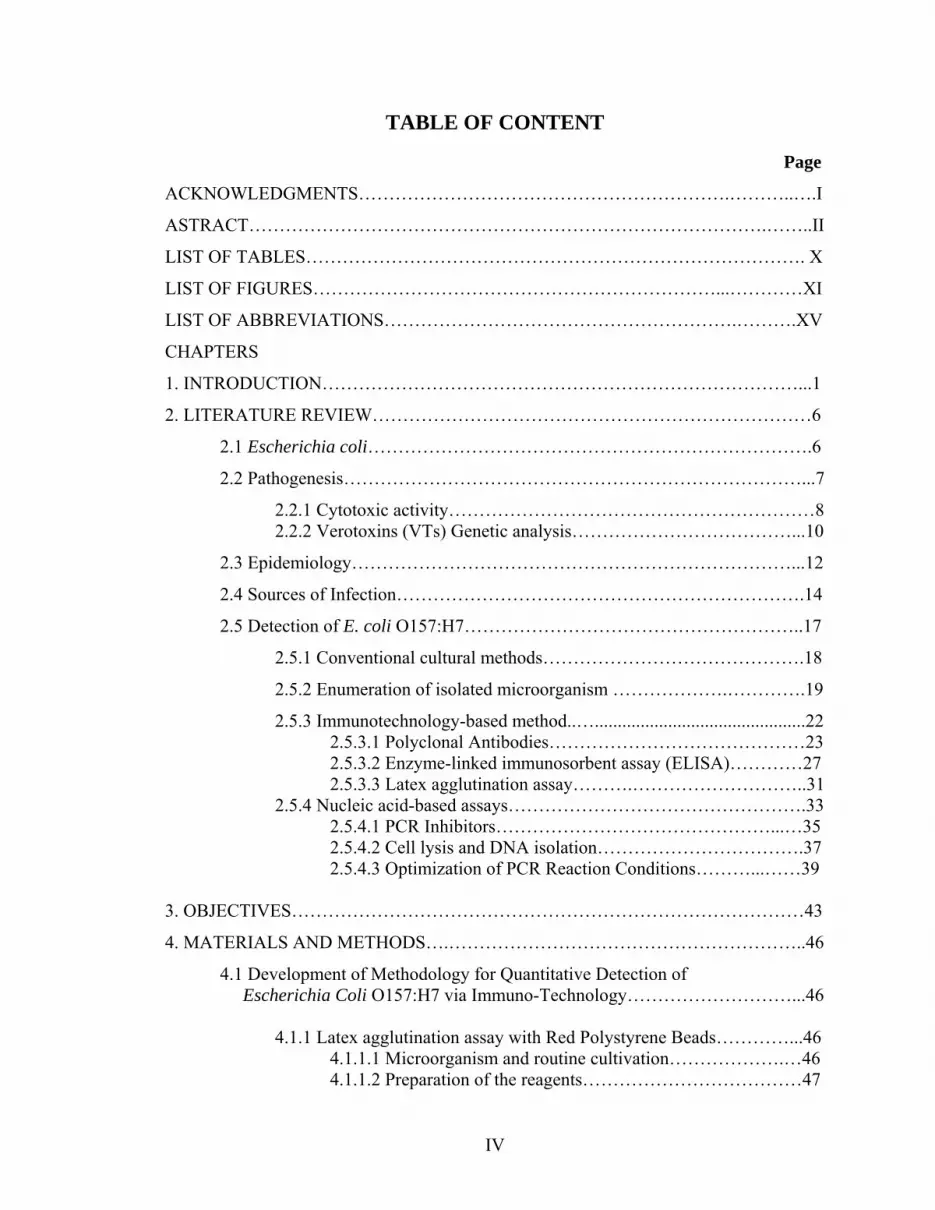
TABLE OF CONTENT
Page
ACKNOWLEDGMENTS…………………………………………………….………..….I
ASTRACT………………………………………………………………………….……..II
LIST OF TABLES………………………………………………………………………. X
LIST OF FIGURES…………………………………………………………...…………XI
LIST OF ABBREVIATIONS………………………………………………….……….XV
CHAPTERS
1. INTRODUCTION……………………………………………………………………...1
2. LITERATURE REVIEW………………………………………………………………6
2.1 Escherichia coli……………………………………………………………….6
2.2 Pathogenesis…………………………………………………………………...7
2.2.1 Cytotoxic activity……………………………………………………8 2.2.2 Verotoxins (VTs) Genetic analysis………………………………...10
2.3 Epidemiology………………………………………………………………...12
2.4 Sources of Infection………………………………………………………….14
2.5 Detection of E. coli O157:H7………………………………………………..17
2.5.1 Conventional cultural methods…………………………………….18
2.5.2 Enumeration of isolated microorganism ……………….………….19
2.5.3 Immunotechnology-based method..…..............................................22 2.5.3.1 Polyclonal Antibodies……………………………………23 2.5.3.2 Enzyme-linked immunosorbent assay (ELISA)…………27 2.5.3.3 Latex agglutination assay……….………………………..31
2.5.4 Nucleic acid-based assays………………………………………….33 2.5.4.1 PCR Inhibitors………………………………………...…35 2.5.4.2 Cell lysis and DNA isolation…………………………….37 2.5.4.3 Optimization of PCR Reaction Conditions………...……39
3. OBJECTIVES…………………………………………………………………………43
4. MATERIALS AND METHODS….…………………………………………………..46
4.1 Development of Methodology for Quantitative Detection of Escherichia Coli O157:H7 via Immuno-Technology………………………...46
4.1.1 Latex agglutination assay with Red Polystyrene Beads…………...46 4.1.1.1 Microorganism and routine cultivation……………….…46 4.1.1.2 Preparation of the reagents………………………………47
IV

4.1.1.3 Procedure for IgG coating beads………………………....47 4.1.1.4 Latex agglutination assay………………………………...47
4.1.2 ELISA quantitative detection assay for Shiga like toxin 1 (SLT-1) and Shiga like toxin 2 (SLT-2) obtained from different verotoxin-producing Escherichia coli…………………………………………………....48
4.1.2.1 Preparation of Iron-depleted syncase broth……………...48 4.1.2.2 Preparation of bacterial extracts…………………………49 4.1.2.3 Globotriosyl Ceramide (GB3) ELISA procedure………..49
4.1.3 Production of Rabbit’s anti E. coli O157………………………......51 4.1.3.1 Preparation of E. coli O157 antigen………………...……51 4.1.3.2 Preparation of the antibody……………………………....51 4.1.3.3 Slide agglutination assay………………………………...52
4.1.4 Development of a Spectrophotometric Immuno-agglutination Assay for Quantitation of IgG for E. coli O157………………...…52
4.1.4.1 Microorganism and routine cultivation……………….….52 4.1.4.2 Purification of IgG……………………………………….53 4.1.4.3 Spectrophotometric Agglutination assay………………...53 4.1.4.4 Optimization of the assay………………………………..54 4.1.4.5 Determination of the concentration of specific E. coli O157 IgG in crude antiserum….…………………54 4.1.4.6 Quantitative determination of anti E. coli O157 in rabbit's antiserum………………………….………..…55
4.2 Development of Methodology for the Detection of E. coli O157:H7 via the Polymerase Chain Reaction (PCR)………………………………......55
4.2.1 Effect of lysing methods and their variables on the yield of Escherichia coli O157: H7 DNA and its PCR amplification...........55
4.2.1.1 Microorganism and routine cultivation………………….55 4.2.1.2 Spectrophotometric lysing assay…………………….......56 4.2.1.3 Lysis of cell suspensions for quantitation of released DNA…………………………………………56 4.2.1.4 Fluorometric analysis…………………………………….57 4.2.1.5 Primers design………………...……………………….…58 4.2.1.6 PCR protocol and Image analysis………………………..58
4.2.2 Development of a New Cell Lysis Solution for Releasing Genomic DNA from Bacterial Cells for DNA Amplification by Polymerase Chain Reaction ……………………………………….59
4.2.2.1 Lysis of cell suspensions for quantitation of released DNA…………………………………………….59 4.2.2.2 Optimization of TZ buffer……………………………….60
V

4.2.2.3 Purification of DNA lysates…….……………………......60
4.2.3 Optimization of PCR conditions for the detection of Escherichia coli O157:H7 shiga like toxin genes……….………....61
4.2.3.1 Lysis of cell suspensions prior to the amplification of DNA……………………………………61 4.2.3.2 Optimization of PCR reaction mixture for the maximum amplification………………….…………..62
4.3 Development of Methodology for the Detection of E. coli O157:H7 in Ground Beef via the Polymerase Chain Reaction………………………...62
4.3.1 Preparation of ground beef samples…………………………….….62 4.3.1.1 Testing for the absence of verotoxins producing Shiga like toxin 1 and 2 in ground beef………………….62 4.3.1.2 Inactivation of E. coli by the use of freezing and thawing process……………………………………...63
4.3.2 Development of methodology for the extraction of E. coli O157:H7 from ground beef…………………………………64
4.3.2.1 The effect of different extraction solutions on the turbidity of the filtrates………………………………64 4.3.2.3 Extraction of target cells with the aid of differential centrifugation and the use of coffee filter………………..64
4.3.3 Enumeration of bacteria using per-enrichment media…………..…65
4.3.4 Cell lysis and DNA Purification…...................................................65
4.3.5 PCR protocol and Image analysis………………………………….66
5. REASULTS AND DISCUSSION…………………………………………………….67
5.1 Development of Methodology for the Detection of E. coli O157:H7 via Immunoassays…………………………………………………67
5.1.1 Latex agglutination assay with Red polystyrene beads……………67
5.1.2 Quantitation of an ELISA assay for the rapid detection of E.coli O157:H7 SLT-1 and SLT-2…….………………………….69 5.1.3 Quantitative determination of rabbit's anti E. coli O157 via Spectrophotometric Immuno-agglutination Assay….……..…..72
5.1.3.1 Effect of cell concentration on rate of agglutination……………………………………………..72
VI

5.1.3.2 Effect of antiserum concentration on rate of agglutination…………………………………………..…73 5.1.3.3 Effect of temperature on agglutination activity……………………………………………………77 5.1.3.4 Effect of wavelength on observed rates of agglutination……………………………………………..77 5.1.3.5 Effect of pH, phosphate buffer (PB) and NaCl concentration on agglutination activity…………………..77 5.1.3.6 Content of specific E. coli O157 IgG in crude antiserum…………………………………………………83 5.1.3.7 Rate of agglutination activity with affinity purified IgG……………………………………………………….86 5.1.3.8 Quantitative determination of specific rabbit's anti E. coli O157 via Spectrtophotometric immuno-agglutination assay………………………….......87
5.2 Development of Methodology for the Detection of E. coli O157:H7 via the Polymerase Chain Reaction (PCR)…………………………………..94
5.2.1 Effect of lysing methods and their variables on the yield of Escherichia coli O157: H7 DNA and its PCR amplification……...94
5.2.1.1 Spectrophotometric assay for kinetics of cell lysis………94 5.2.1.2 Effect of culture age on the yield of DNA…………...…..96 5.2.1.3 Effect of incubation temperature with both lysozyme and protease K on the yield of DNA….…...….99 5.2.1.4 Effect of cell density and proteinase K concentration on the yield of DNA…………………….....99 5.2.1.5 Comparison of DNA yields with different cell treatment methods………………………………….102 5.2.1.6 The effect of lysing methods on PCR products………...103 5.2.1.7 Yield of PCR products as the result of optimization of proteinase K lysing method……………………………107
5.2.2. Maximum yield of released amplified DNA and as a result of developing a new lysis solution (TZ)…………………110
5.2.2.1 Influence of sodium azide on PCR results……………...110 5.2.2.2 Yield of amplified DNA as a result of varying The concentration of NAN3 with Tris-HCl, SDS, Triton X and PCR buffer………………………………..110 5.2.2.3 Effect of pH of TZ lysing solution on the level of amplified DNA……………………………..116 5.2.2.4 Effect of lysis temperature of TZ lysing solution on the level of amplified DNA………………...116 5.2.2.5 Effect of pH, and concentrations of TX and NaN3 in TZ lysing solution on the yield of DNA…….……….116
VII

5.2.2.6 Effect of NaN3 on the yield of DNA…………………...120 5.2.2.7 Comparative study for the maximum amplification of released DNA using different lysing methods………………………………………….120 5.2.2.8 PCR Detection of low numbers of E. coli O157:H7 With the aid of TZ lysing solution and pellet paint…......123 5.2.2.9 Applications of TZ lysis solution with other pathogens…………………...……………….125
5.2.3. Optimization of PCR conditions for detection of Escherichia coli O157:H7 Shiga-Like Toxin Genes…………….126
5.2.3.1 Effect of MgCl2 concentration on the amplification of DNA………………………………128 5.2.3.2 Effect of Taq polymerase concentration on the amplification of DNA………………………………128 5.2.3.3 Effect of varying the concentrations of SLT-1 and SLT-2 primers on the amplification of DNA…………..129 5.2.3.4 Influence of PCR nucleotide mixture concentration on the amplification of target DNA sequences…………134 5.2.3.5 Amplification of SLT-1 and SLT-2 gene sequences as a result of varying the concentration of DNA templates…….…………………136
5.3 Quantitative Detection of E. coli O157:H7 in Ground Beef via the Polymerase Chain Reaction………………………………………...141
5.3.1 Preparation of ground beef samples for the Isolation of E. coli O157:H7 prior to PCR…………………………………141
5.3.1.1 Absence of E. coli and other verotoxins producing SLT-1 and SLT-2 in Ground beef samples……………..141 5.3.1.2 Effect of different extraction solutions on the transparency of the resulted filtrates…………….141 5.3.1.3 Extraction of target cells with the aid of differential centrifugation and the use of coffee filters…………..…142
5.3.2 Enumeration of bacteria using pre-enrichment media…………....143 3.3. PCR detectable limits of SLT-1 and SLT-2 of cells after enumeration…………………………………………..146
6. REFERENCES……………………………………………………………………....151
VIII

7. APPENDIXES……………………………………………………………………….176
7.1 Latex agglutination titration with E.coli O157:H7 and E. coli 4015……….176 7.2 Latex agglutination assay with various cell densities of boiled E.coli O157:H7…………………………………………………...176 7.3 ELISA titration curve with partially purified VT1 extracted from E. coli O157:H7………………...…………………….....…177 7.4 Titration of commercial IgG obtained from Difco Lab. using slide agglutination assay……………………………………………...177 7.5 Effect of cell concentration on agglutination rates with 1/16 antiserum dilution……………….……………………….………178 7.6 Effect of cell concentration on agglutination rates with different antiserum concentrations…………………………….…...….183 7.7 Titration of rabbit's anti E. coli O157 (LVN0) using slide agglutination assay…………...…………………………………186 7.8 Titration of rabbit's anti E. coli O157 (LVN2) using slide agglutination assay…………..……………………………….…188 7.9 TKO Calf thymus DNA Standard curve for fluorometric DNA measurements………………………………….…….…189
IX
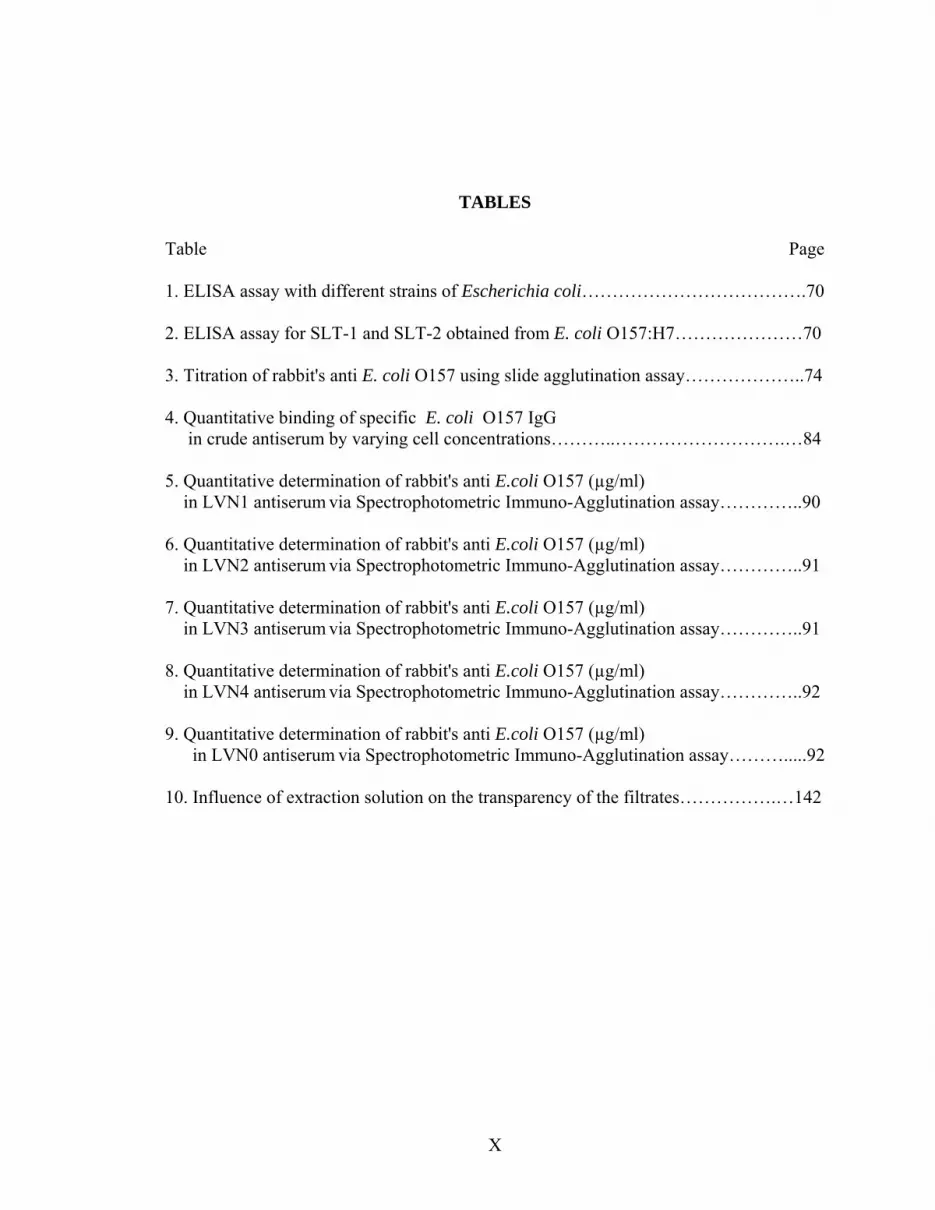
TABLES Table Page 1. ELISA assay with different strains of Escherichia coli……………………………….70 2. ELISA assay for SLT-1 and SLT-2 obtained from E. coli O157:H7…………………70 3. Titration of rabbit's anti E. coli O157 using slide agglutination assay………………..74 4. Quantitative binding of specific E. coli O157 IgG in crude antiserum by varying cell concentrations………..……………………….…84 5. Quantitative determination of rabbit's anti E.coli O157 (µg/ml) in LVN1 antiserum via Spectrophotometric Immuno-Agglutination assay…………..90 6. Quantitative determination of rabbit's anti E.coli O157 (µg/ml) in LVN2 antiserum via Spectrophotometric Immuno-Agglutination assay…………..91 7. Quantitative determination of rabbit's anti E.coli O157 (µg/ml) in LVN3 antiserum via Spectrophotometric Immuno-Agglutination assay…………..91 8. Quantitative determination of rabbit's anti E.coli O157 (µg/ml) in LVN4 antiserum via Spectrophotometric Immuno-Agglutination assay…………..92 9. Quantitative determination of rabbit's anti E.coli O157 (µg/ml) in LVN0 antiserum via Spectrophotometric Immuno-Agglutination assay……….....92 10. Influence of extraction solution on the transparency of the filtrates…………….…142
X

FIGURES
Figure Page
1. Latex agglutination assay titration with pathogenic E.coli O157: H7…………...……68
2. ELISA titration curve with partially purified VT1 extracted from E. coli O157:H7………..………………………………………………………..71
3. Effect of cell concentration on rate of agglutination with antiserum diluted 1/16……75
4. The relationship between agglutination activity, antiserum dilution, and cell concentration………………………………………………………………...76
5. Effect of temperature on agglutination activity……………………………………….78
6. Effect of wave length on agglutination activity……………………………………….79
7. Effect of pH on agglutination activity………………………………………………...80
8. Effect of phosphate buffer concentration on agglutination activity…………………...81
9. Effect of NaCl concentration on agglutination activity…………………….………...82
10. The relationship between agglutination activity and antiserum concentration with 1 x 10⁸ cells / ml………………………………………………...85
11. Rate of agglutination activity with affinity purified antibody……………………………..86
12. Yield of rabbit's anti E. coli O157 as a result of injecting different cell concentrations of cell suspension versus the commercial IgG………………………89 13. Yield of rabbit's anti E. coli O157 at different times of bleeding………………........93
XI

14. Spectrophotometric detection of effects of lysozyme and proteinase k on cells……………………………………………………………………………......95 15. Yield of DNA as a result off different enzymatic treatments and culture age…..…...97 16. Yield of DNA as a function of incubation time with proteinase K……………….....98 17. Influence of incubation temperature on the yield of DNA resulting from the treatment of cells with lysozyme followed by treatment with proteinase K…....101 18. The effect of cell density and proteinase K concentration on the yield of DNA…...102 19. Effect of lysing methods on the yield of DNA…………………………………..…104 20. Effect of different lysing methods on PCR amplification products and image analysis of DNA bands………………………………………………….105 21. Effect of proteinase K concentration on PCR products and image analysis………..108 22. Effect of incubation time with proteinase K, of cells treated with lysozyme, on PCR amplification……………………………...109 23. Effect of NaN3 with different lysing methods on PCR amplification of target DNA………………………………………………………..111 24. Amplification of released target DNA as a result varying the NaN3 concentration in 0.2 M Tris-HCl at pH 8.0………………………………112 25. Amplification of released DNA as a result of varying the NaN3 concentration in SDS …………………………………………………………...….113 26. Amplification of released DNA as a result of varying the NaN3 concentration in Triton-X 100 (TX)……………………………………………….....................…….114 27. Amplification of released DNA as a result of lysing cells in PCR buffer with varying NaN3 concentrations ………………...……………….115 28. Influence of pH value of the lysis solution (TZ initial) on the amplification of released DNA……………………………………………...117 29. Amplification of released DNA as a result of lysing cells with 1.0% w/v Triton-X 100 (TX) plus 2.5 mg/ml of NaN3 in 0.2 M Tris-HCl, pH 8.0 at different incubation temperatures…………………..118
XII

30. Influence of different pH values, TX concentration and NaN3 concentrations of TZ lysing soln. (1.0% w/v Triton-X 100 (TX) plus 2.5 mg/ml of NaN3 in 0.2 M Tris-HCl, pH 8.0 ) on the yield of DNA……….119 31. Effect of NaN3 together with different lysis methods on the yield of DNA from E. coli O157:H7……………………………………………………..121 32. Comparative study for the maximum amplification of released DNA using different lysing methods……………………………………………………...122 33. Gel electrophoresis of PCR amplification products with E. coli O157:H7 SLT-2 as a result of using different isolation procedure with the use of pellet paint……………………………………………….124 34. Gel electrophoresis of PCR amplification products with E. coli O157:H7 SLT-2 as a result of the use of TZ lysis solution with and without pellet paint…………………………………………125 35. Gel electrophoresis of PCR amplification with molecular standard along with E. coli O157:H7 verotoxins genes VT1 and VT2………………………127 36. Effect of MgCl2 concentration on the amplification of SLT-1 and SLT-2 target sequences………………………………………………………....131 37. Effect of Taq polymerase concentrations on the amplification of DNA…………...132 38. Effect of varying the concentration of SLT-1 and SLT-2 primers on the amplification of DNA…………………………………………………….…133 39. Gel electrophoresis of PCR amplification products with E. coli O157:H7 SLT-1 and SLT-2 as a result of varying the concentration of dNTPs……………...135 40. Gel electrophoresis of PCR amplification products with E. coli O157:H7 SLT-1 as a result of varying the concentration of target DNA……………………..137 41. Amplification of SLT-1 DNA as a result of varying the concentration of DNA template…………………………………………………….138 42. Gel electrophoresis of PCR amplification products with E. coli O157:H7
SLT-2 as a result of varying the concentration of target DNA………….………….139
43. Amplification of SLT-2 DNA as a result of varying the concentration of DNA template……………………………………………..….140 44. Yield of E. coli O157:H7 as a result of enumeration in TSB+…………………..….145
XIII

45. Gel electrophoresis of PCR products for the detection of E. coli O157:H7 (SLT-1) in ground beef after 5.5 hours of incubation in TSB+ at 37oC……………147 46. Detection limits of SLT-1 target sequences as a result of the enumeration of E. coli O157:H7 isolated from ground beef……………………………………..148 47. Gel electrophoresis of PCR products for the detection of E. coli O157:H7 (SLT-2) in ground beef after 5.5 hours of incubation in TSB+ at 37oC……………149 48. PCR detection limits of SLT-2 target sequences as a result of enumeration of E. coli O157:H7 isolated from ground beef……………………………………..150
XIV

LIST OF ABBREVIATIONS A/E: attaching and effacing adherence BLI: Bio-Layer Interferometry CDC: Centers for Disease Control and Prevention CDEC: cell-detaching E. coli CFU: colony forming Unit CLDTEC: cytolethal distending toxin-producing E. coli DAEC: diffusely adherent E. coli DMSO: Dimethyl sulfoxide dNTPs: Deoxynucleotide Triphosphates (dATP, dCTP, dGTP, and dTTP) Eae: EA gene EAEC: enteroaggregative E. coli EHEC: enterohemorrhagic E. coli EIEC: enteroinvasive E. coli EIA: enzyme immunoassay ELISA: enzyme-linked immunosorbent assays EPEC: Enteropathogenc E. coli ETEC: enterotoxigenic E. coli Gb3: globotriaosylceramide HC: hemorrhagic colitis HUS: hemolytic uremic syndrome Ig: Immnoglobulins K: proteinase K KZ proteinase K plus 0.25 mg Sodium Azide / ml LK: Lysozyme in combination with proteinase K LKZ: LK plus 0.25 mg Sodium Azide / ml LT: Heat-labile toxins enterotoxins MCH-PCR: Magnetic capture-hybridization PCR P: PCR buffer PZ: PCR buffer plus 0.25 mg Sodium Azide / ml PBS: 0.005 M phosphate buffer plus 0.05% NaCl, pH 7.4 PCR: Polymerase chain reaction PCRRFLP: restriction fragment length polymorphisms pO157: DNA sequence upstream of eae rfbO157: the 60-Mda plasmid O157 LPS RT-PCR: Real time PCR SDS: Sodium dodecyl sulphate SDZ: 0.05% SDS plus 2.5 mg/ ml of sodium azide SERAD: Scottish Executive Environment and Rural Affairs Department SLT: Shiga-Like Toxin SMAC: Sorbitol MacConkey agar culture TSB+: Tryptic Soy Broth plus 0.5% dextrose TSA: Tryptic Soy agar plates
XV
STEC: Shiga toxin-producing Escherichia coli Stxs: shiga toxin genes ST: Heat-Stable toxins enterotoxins TIR: translocated intimin receptor TTP: thrombotic thrombocytopenic purpura uidA: O157 specific mutated GUD gene VRBA: Violet Red Bile Agar plates VTEC: verotoxin-producing E. coli VTs: Verotoxins Z: Sodium Azide
XVI

1
CHAPTER 1
INTRODUCTION
Escherichia coli (E. coli) is one of several types of bacteria that normally inhabit
the intestine of humans and animals (commensal organism). Some strains of E. coli are
capable of causing disease under certain conditions, such as when the immune system is
compromised. Disease may also result from an environmental exposure. Infections with
Escherichia coli pose a serious threat to public health with outbreaks arising from food
and water that has been contaminated with human or animal feces or sewage. Exposure
may also occur during hospitalization, resulting in pneumonia in immunocompromised
patients or those on a ventilator. Shiga toxin-producing Escherichia coli (STEC) strains,
also called verotoxin-producing E. coli (VTEC) strains, represent the most important
recently emerged group of food-borne pathogens (Paton et al., 1998a and Karmali, 1989).
For the past two decades, STEC strains have been a major cause of gastroenteritis
that may be complicated by hemorrhagic colitis (HC) or the hemolytic uremic syndrome
(HUS) which is the main cause of acute renal failure in children (Banatvala et al., 2001,
Todd and Dundas, 2001, Slutsker et al., 1997, Kaplan et al., 1992, and Karmali et al.,
1983). E. coli O157:H7 is the most common serotype associated with the disease but
other non O157:H7 serotypes have also been implicated (Boerlin et al., 1999, Karmali,
1998, Blanco, 2001). All STEC strains have stx1 and/or stx2 genes which determine the
production of Shiga toxin (Stx). Occurrence of the stx1 gene is most common among O26,
2
O103, and O111 strains (Karch et al., 1999a, Ojeda et al., 1995, Rios et al., 1999, and
Schmidt et al.,1999).
Since its identification as a pathogen in 1982, STEC O157:H7 has been the cause
of a series of outbreaks especially in Canada, Japan, the United Kingdom, and the United
States (Karmali, 1989, Tarr et al., 1997). E. coli O157:H7 is a potentially deadly bacteria
that can cause bloody diarrhea and dehydration. Low number of cells less than 100 of
E.coli O157:H7 can colonize inside the intestine producing Shiga-Like Toxin (SLT)
which causes severe damage to the epithelial cells that line the walls of the intestine. The
damage from this bacterial strain is so severe, that not only is there a loss of water and
salts, but blood vessels are also damaged, resulting in intestinal hemorrhage. This
condition is particularly dangerous to young children and may be lethal since they can not
tolerate much blood and fluid loss.
According to the Centers for Disease Control and Prevention (CDC), at least 200
deaths and 20,000 illnesses in the United States annually are attributed to ST-producing
E. coli (STEC) organisms belonging to the O157:H7 serotype. Transmission of the
organism occurs through consumption of undercooked meat, un-pasteurized dairy
products and vegetables, or water contaminated by feces of carriers. Person-to-person
transmission of STEC has also been documented (Paton et al., 1998b and Karmali, 1989).
Undercooked hamburger was the suspected vehicle in most outbreaks of HC and HUS
(Doyle and Schoeni, 1987). The reputation of O157:H7 as the "hamburger bug" has been
called into question since many other foodstuffs have now been identified as vehicles of
infection.

3
The organism is more heat sensitive than typical Salmonella. Thermal inactivation
studies of E. coli O157:H7 in ground beef (Padhye and Doyle, 1992) revealed that the
organism has no unusual heat resistance, with D values of 270, 45, 24 and 9.6 at the
respective temperature of 57.2oC, 60oC, 62.8oC, 64.3oC. Padhye and Doyle (1992) also
demonstrated that organism can survive well in ground beef during frozen storage by
determining that there was no significant change in the number of E. coli O157:H7 in
ground beef frozen at -80oC and held at -20oC for up to 9 months.
Development of biochemical, serotyping, and genotyping methods to detect Shiga
toxin-producing Escherichia coli (STEC) has been one of the most important tasks for
preventing or interrupting the spread of VTEC. These methodologies must be specific,
sensitive, rapid, easy to use, and commercially available so that microbiological
laboratories can readily use them. Conventional methods for the detection and
identification of Escherichia coli O157:H7 include growth of non-sorbitol-fermenting
E. coli colonies on Sorbitol MacConkey agar culture (SMAC), followed by serological
confirmation with O157- and H7-specific antisera as described by Karmali, 1989. Culture
alone is time consuming and can be insensitive, especially for the detection of small
numbers of E. coli O157:H7, and is unable to detect non-O157 verotoxin-producing
E. coli (Novicki et al., 2000 and Tarr, 1995).
Recent rapid methods for the detection of STEC include assays which employ
antibodies or nucleic acid sequences that uniquely recognize this pathogen. Recent
studies have shown that enzyme-linked immunosorbent assays may be more sensitive
than culture methods and are able to detect verotoxins or specific serotype antigens
(Novicki et al., 2000, Dylla et al., 1995). VTEC often present in an injured or stressed

4
condition are not recoverable and result in false negatives. A recovery step such as the
use of pre-enrichment and/or enrichment media must therefore be built into the protocol.
PCR has become a very rapid and reliable tool for the molecular biology-based diagnosis
of a variety of infectious diseases (Fredricks and Relman, 1999).
PCR-based assays have been developed for several food-borne pathogenic
bacteria; genes coding for virulence factors and ribosomal RNA are their primary targets.
Examples include assays for E. coli O157 and other STEC (Brian et al., 1992, Gannon et
al., 1992, Gannon et al., 1993, Jay, et al., 1985, Lin et al., 1993, Pollard et al., 1990, and
Thomas et al., 1994). PCR has been applied for the detection of microorganisms from
cultures, tissues and directly from clinical samples. The isolation of E. coli O157:H7 from
complex samples (environmental, animal faeces, food and clinical specimens) is a major
challenge (Duffy et al., 2002a). Samples often contain low numbers of VTEC, with very
high levels of background flora and natural inhibitors which can interfere with isolation
and subsequent detection of the pathogen (Duffy et al., 2002a). Fecal specimens and meat
samples are among the most complex specimens for direct PCR testing due to the
presence of inherent PCR inhibitors that are often coextracted along with bacterial DNA
(Brian et al., 1992). Few studies have evaluated or compared simple DNA extraction
methods that would facilitate and improve the sensitivity of PCR detection of enteric
pathogens (Caeiro et al., 1999, Da Silva et al., 1999, Lantz et al., 1997, Lou et al., 1997,
Stacy-Phipps et al., 1995, and Widjojoatmodjo et al., 1992). Detection of VTEC by
conventional PCR was observed to encounter when the technique was applied directly to
foods (Powell et al., 1994, Lees et al., 1994). Attempts have been made to remove the
inhibitors to PCR present in food samples by ether extraction, column purification
5
(Simon et al., 1996), or by the addition of bovine serum albumin, proteinase inhibitors
(Powell et al., 1994), and Tween 20 (Simon et al., 1996). Magnetic capture-hybridization
PCR (MCH-PCR) was initially used to overcome the inhibitory effect of humic acid
present in soil samples during PCR amplification (Jacobsen, 1995). Various methods
have been described for the rapid and noncontaminated isolation of E. coli O157:H7
DNA for application to the PCR.
The efficiency of cell lysis and the procedures for harvesting target DNA are
factors that can limit the sensitivity of the assay. Different lysing methods that have been
used to achieve cell lysis and the release of DNA include: lysozyme, proteinase K, and
boiling cells in distilled water, PCR buffer, SDS, and Triton X-100. Pellet paint obtained
from Novagon is a visible flourescent dye-labeled carrier formulated specifically for use
in alcohol precipitation of nucleic acids. The five minute protocol requires no low
temperature incubation or prolonged centrifugation. Pellet paint does not interfere with
many molecular biology procedures including PCR.

6
CHAPTER 2
LITERATURE REVIEW
2.1 Escherichia coli
The bacterium Escherichia coli (E. coli), originally known as Bacterium coli
commune, belongs to the Family Enterobacteriaceae (Escherich, 1885) and was first
isolated and characterized in 1885 by the German scientist and pediatrician, Theodor
Escherich (Neill et al., 1994). E. coli is a member of the family Enterobacteriaceae
(Ewing, 1986), which encompasses many genera, including known pathogens such as
Salmonella, Shigella, and Yersinia. Although most strains of E. coli are not regarded as
pathogens, they can be opportunistic pathogens that cause infections in
immunocompromised hosts. Escherichia coli is naturally and widely distributed in the
intestine of humans and warm-blooded animals. It is the predominant facultative
anaerobe in the bowel and part of the essential intestinal flora that maintains the
physiology of the healthy host (Conway 1995, Neill et al., 1994). It has been stated that
the average E. coli population in an adult's intestine is approximately 0.1 percent of the
total bacteria. E. coli strains are often characterized as facultative anaerobic, motile,
gram-negative, non-spore forming rods, and lactose fomenters(Schaechter, M. 2000). The
bacteria are needed by the body to aid in the production of several vitamins, such as
Vitamin K and the B-vitamins.

7
Some strains of E. coli are capable of causing disease under certain conditions
such as when the immune system is compromised. Disease may also result from an
environmental exposure. Although there is an overlap in characteristics between strains,
at least six categories of diarrheagenic E. coli have been described: enteropathogenic E.
coli (EPEC), enterotoxigenic E. coli (ETEC), enteroinvasive E. coli (EIEC),
enterohemorrhagic E. coli (EHEC), enteroaggregative E. coli (EAEC), and diffusely
adherent E. coli (DAEC) (Nataro and Kaper 1998). Two additional categories, cell-
detaching E. coli (CDEC) (Gunzburg et al., 1993) and cytolethal distending toxin-
producing E. coli (CLDTEC) (Johnson and Lior 1988) have also been proposed.
Classification is based on the presence of different chromosomal or plasmid-encoded
virulence genes in E. coli enteropathogens that are absent in most commensal strains, as
well as their pattern of interaction with epithelial cells and tissue culture monolayers
(Nataro and Kaper 1998). STEC strains that cause human infections belong to a large
number of O: H serotypes. The most common of these strains, Enterohemorrhagic E. coli
(EHEC) O157: H7, has been identified by the CDC as an emerging foodborne pathogen.
2.2 Pathogenesis
The emergence or recognition of Shiga-toxigenic Escherichia coli (STEC) as
a cause of diarrhea, hemorrhagic colitis (HC), hemolytic uremic syndrome (HUS), and
thrombotic thrombocytopenic purpura (TTP) in humans is a significant public health
concern worldwide (Kaplan et al., 1992). STEC isolated from humans with specific
clinical signs are called Enterohemorrhagic E. coli (EHEC). EHEC, therefore are

8
considered to be a subset of STEC. Differences between EHEC and STEC are thought to
be due to variability in virulence factor armament (Willshaw 2001).
Shigatoxin-producing Escherichia coli (STEC), also known as Verotoxin-
producing Escherichia coli (VTEC), are a diverse group of E. coli belonging to over 200
serotypes, and are defined by production of one or more Verotoxins (VTs), also known as
Shigatoxins (Stxs). VTEC pathogenic for humans cause diarrhea, bloody diarrhea and the
hemolytic uremic syndrome. Most serious human infections are caused by
enterohemorrhagic E. coli (EHEC), a virulent sub-group of VTEC which includes the
predominant serotype, E. coli O157:H7, and others such as O26:H11 and O111:H
(Johnson et al, 1996). Shigatoxin (Stx), also known as shiga-like toxin (SLT) or verotoxin
(VT), derives its name from its similarity to shiga toxin that is produced by Shigella
dysenteriae type one. The term verotoxin refers to the ability of the toxin to cause lethal
cytopathic effects in vero cell cultures (African green monkey kidney cells) and was
introduced in 1977, around the same time as the term SLT (Konowalchuk et al., 1977,
O’Brien and LaVeck 1983, O’Brien et al., 1983).
2.2.1 Cytotoxic activity
Most EHEC are acid resistant, which allows them to survive the acid conditions
of the stomach. ETEC strains cause diarrhea through the action of the Heat-labile
enterotoxins (LT) and Heat-Stable enterotoxins (ST). These strains may express an LT
only, an ST only, or both an LT and an ST. These toxins have recently been reviewed
(Hirayama 1995, Hirst 1995, Hol et al., 1995, Holmes et al., 1995, O’Brien and Holmes
1996). ETEC strains are generally considered to represent a pathogenic prototype. The
organisms colonize the surface of the small bowel mucosa and elaborate their

9
enterotoxins, giving rise to a net secretory state. Some investigators have reported that
ETEC strains may exhibit limited invasiveness in cell cultures, but this has not been
demonstrated in vivo (Elsinghorst and Kopecko, 1992; Elsinghorst and Weitz 1994). It is
believed that ETEC strains adhere to the colon and distal small intestine; however, typical
lesions have not been demonstrated (Kehl, 2002). The best-characterized adherence
phenotype is the intimate or attaching and effacing adherence (A/E). A/E lesions consist
of loss of enterocyte microvilli and intimate attachment of the bacterium to the cell
surface with associated cytoskeletal changes resulting in the formation of a pedestal. The
mechanism whereby A/E lesions are produced does not share the same characteristics as
enteropathogenic E. coli but is analogous. STEC organisms that demonstrate the A/E
phenotype contain a LEE (locus for enterocyte effacement) pathogenicity island which
contains eaeA, whose gene product intimin, mediates intimate attachment to the
enterocyte (Kehl 2002). LEE also encodes a TIR (translocated intimin receptor) homolog
is secreted from the organism and delivered to the host cell along with a number of other
proteins via a type III secretion system. Although there is a strong association between
the presence of eaeA and severe disease, some STEC organisms do not possess the eaeA
gene including some from patients with HUS and hemorrhagic colitis. Thus, intimin is
not essential for virulence (Paton, 1998b)
STEC toxin production is variable. STEC can produce stx1, stx2, both stx1 and
stx2, or stx2 variants. Structurally, stxs are A-B toxins that inhibit protein synthesis. The
cytotoxic activity is due to enzymatic cleavage (N-glycosidase) of an adenine residue in
the 28S rRNA leading to inhibition of protein synthesis in the target cell (Melton-Celsa
and O'Brien 2003). The A subunit acts as a ribosomal RNA N-glycosidase, cleaving an

10
adenine residue from ribosomal RNA (28s rRNA) at the site where the attachment of
aminoacyl tRNA occurs (Harmon et al., 2000, and Saxena et al., 1989). This cleavage
stops protein synthesis and causes apoptosis. Cleavage of the holotoxin (composed of the
B pentamer and a single A subunit) results in the enzymatically active N-terminal A1
component and a C-terminal A2 component. The B subunit binds to a glycolipid receptor
in mammalian cellular membranes called globotriaosylceramide (Gb3). Binding of the B
subunit plays a crucial role in the entry of the A subunit into specific cells (Ling et al.,
1998). Recent studies indicate that stx1 and stx2 may bind at different locations of the
Gb3 moiety and that cellular messengers modulate the presence of the receptor and the
sensitivity of the cell to stx (Eisenhauer et al., 2001, and Itoh et al., 2001). Variability of
stx2 may be a result of genetic recombination of the stx2 B subunit genes rather than base
substitutions (Gannon et al., 1990, and Ito et al., 1988). Binding stx at different locations
of the Gb3 moiety provides a mechanism that could explain variable receptor affinity or
tropisms demonstrated by different stxs. By far, the most notable STEC serotype is
O157:H7. In fact, STEC are often broadly classified as O157:H7 or non-O157 (Bower,
1999). It is well documented that multiple STEC serotypes and strains cause disease in
humans or are capable of causing disease based on their virulence factor armament
(Harmon et al., 2000)
2.2.2 Verotoxins (VTs) Genetic Analysis
Verotoxins (VTs) are divided into two groups based on their antigenic diversity,
VT1 and VT2, which were shown to be genetically (55% DNA homology) and
immunologically (not cross reactive) different from each other (Karmali 1989). VT1 can
be neutralized by the antiserum against Shiga toxin produced by Shigella dysenteriae

11
type 1, whereas VT2 cannot be neutralized by the same serum (O'Brien and Holmes
1987). The structural genes for VT1 and VT2 are bacteriophage encoded (Scotland et al.,
1983, Strockbine et al., 1986) and share 55% overall nucleotide sequence homology
(Jackson et al., 1987a).VT1 is genetically and immunologically related to Shiga toxin
(Stx) which is produced by Shigella dysenteriae type 1 strains (Jackson et al. 1987b).
Despite these differences, VT1, VT2 and Stx genes are similar in function and are
genetically organized in an operon structure with two genes encoding the A- (toxin) and
the B- (cell receptor binding) subunits (Paton,1998b).
The genetic analysis of the VT genes found in different VTEC isolates resulted in
the detection of an increasing number of genetic variants of VT1/Stx1 and VT2/Stx2.
Five genetic variants of VT1 and 12 variants of VT2 were recently described for the
VT/Stx family by Scheutz et al., 2001b. This nomenclature organizes six groups of toxin
types (1, 2, 2c, 2d, 2e and 2f) according to antigenic variability, differences in toxicity for
cells or animals, capacity to be activated by mouse mucus and by differences in DNA or
amino acid sequences. Epidemiological and clinical investigations on the association of
toxin types with the animal reservoir of VTEC and with human pathogenicity revealed
remarkable differences. VTEC producing VT1 and/or VT2 were found in diseased
humans and in cattle as a natural reservoir. VT1 and/or VT2 are associated with VTEC
belonging to the EHEC (enterohaemorrhagic E. coli) group (O26, O103, O111, O118,
O145 and O157) which cause severe disease in human (Boerlin et al., 1999, Koch et al.,
2001, Beutin et al. 2002a,b, Friedrich et al., 2002a). A strong association was made
between the presence of the VT2/Stx2 gene and the severity of human disease
(Nishikawa et al., 2000, Beutin et al., 2002a, Friedrich et al., 2002b). The VT2c/Stx2c

12
variant was found to be less associated with bloody diarrhoea and HUS than VT2/Stx2 in
the previously mentioned studies. Certain toxin types, such as VT2e/Stx2e (frequent in
porcine VTEC) and VT2f/Stx2f (associated with pigeon VTEC), are rarely or never
found in VTEC from diseased humans are regarded as less important for human
pathogenicity of the strains (Schmidt et al., 2000, Beutin et al., 2002b, and Friedrich et al.,
2002b). Other toxins types such as VT2d-ount/Stx2d and VT1-ox3/Stx1-ox3 (also called
Stx1c) have been associated with sheep as animal reservoir (Koch et al., 2001;
Ramachandran et al., 2001, and Brett et al., 2003). These toxin types were also found in
VTEC from diseased humans but were more frequently associated with milder disease
such as uncomplicated diarrhea (Pierard et al., 1998, Koch et al., 2001, and Friedrich et
al., 2002b).
2.3 Epidemiology
ETEC strains are associated with two major clinical syndromes: weanling
diarrhea, among children in the developing world, and traveler’s diarrhea. The
epidemiologic pattern of ETEC disease is largely determined by a number of factors: (i)
mucosal immunity to ETEC infection develops in exposed individuals; (ii) immune
asymptomatic individuals may shed large numbers of virulent ETEC organisms in the
stool; and (iii) the infection requires a relatively high infectious dose (DuPont et al.,
1989). These factors create a situation in which ETEC contamination of the environment
in areas of widespread infection is extremely prevalent; and most infants in such areas
will encounter ETEC upon weaning. The percentage of cases of sporadic endemic infant
diarrhea which are due to ETEC usually varies from 10 to 30% (Albert et al., 1995,

13
Flores-Abuxapqui et al., 1994, Hoque et al., 1994, Levine et al., 1993, Mangia et al.,
1993, Schultsz 1994, and Tornieporth et al., 1995).
Escherichia coli O157:H7 was first recognized as a foodborne pathogen with
major public health consequences in 1982, when it was associated with two outbreaks of
bloody diarrhea in Oregon and Michigan (Riley et al., 1983). Since 1982, VTEC
infections have been reported in more than 30 countries on 6 continents. In Wales,
England, the provisional number of laboratory reports of E.coli O157 fell from a peak of
1084 in 1999 to 595 for the year 2002 but rose to 675 temporarily in 2003. E.coli O157 is
a world wide threat to public health. It is estimated that about 75,000 cases of E.coli
O157 occur annually in the USA (Perna, 2001) with an estimated 2100 cases (2.8%)
requiring hospitalisation. It is however, less commonly reported in patients in less
industrialized countries. The CDC monitors E. coli O157:H7 through six surveillance
systems. One of the surveillance systems is PulseNet. It operates on a national scale to
determine E. coli outbreaks and if individual infections are related (CDC 1999a).
Between 1982 and 1998, over 4,400 cases of human illness resulted from 203 outbreaks
that involved exposure to E. coli O157:H7. Of these cases, 968 (22%) were hospitalized,
228 (5%) progressed to hemolytic uremic syndrome (HUS) or thrombotic
thrombocytopenic purpura (TTP), and 28 (0.6%) died. Surveillance data indicate that the
highest incidence of illness from E. coli O157:H7 occurs in children under 5 years of age
(CDC 1999a).

14
2.4 Sources of Infection
Human VTEC infections are linked frequently to food, water, animals and
environmental sources contaminated with the manure of infected but healthy animals
(Mead et al., 1999, Mead et al., 1997, Wilson et al., 1997). Transmission of VTEC to
humans from animal reservoirs typically occurs through fecal contamination of food or
water, direct or indirect contact with animals, or by person-to person contact (Willshaw,
2001). E. coli O157:H7 infection can occur from eating undercooked and/or
contaminated ground beef, drinking raw/unpasteurized milk, and/or drinking or
swimming in sewage-contaminated water. The bacteria have also been found on some
vegetables such as sprouts and lettuce (Chen et al., 1998). Transmission of the bacteria
may also occur through the oral-fecal route; this type of transmission is most common in
childcare centers and in families with young children (Chen et al., 1998).
Faecal contamination is one of the primary contributory factors to the persistence
of VTEC in the environment and is a potential vector for infection of animal populations.
Faecal contamination contributes to the transmission of VTEC to humans through the
contamination of food crops and water sources, and by direct contact. Because animals
particularly cattle provide the basis for several transmission routes to humans, the
prevalence and epidemiology of VTEC within the animal population is of considerable
interest. Sources of transmission of VTEC to animals may include the soil in pens, water
troughs and animal attendants (Duffy et al., 2002b).
VTEC may be present in the gut and faeces of cattle presented for slaughter.
During the slaughter process, these and other food pathogens may be transferred to
carcasses, workers, factory surfaces and equipment. It is generally accepted that the

15
extent to which manure adheres to hides of cattle influences the levels of microbial
contamination on the derived carcasses. To control such risks, many countries have
already implemented or are developing "clean cattle policies" which aim to reduce the
VTEC contamination of carcasses and derived raw meat products (Duffy et al., 2002a).
The entry of faecal material into the abattoir and subsequent cross-contamination can be
limited by visual ante mortem inspection of the cleanliness of the hides. Strategies for the
processing of dirty animals may include: rejection of animals with excessively dirty
hides; washing of the animals; hide trimming or clipping; slaughter of dirty animals at the
end of the kill period, and reducing the speed of slaughter line (Duffy et al., 2002a).
Epidemiological evidence indicates that ground beef is the primary source of human
exposure to E. coli O157:H7. Between 1982 and 1993, ground beef was identified as the
transmission source in 54% of E. coli O157:H7 outbreaks (Griffin 1995). Of the E. coli
O157:H7 outbreaks reported between 1993 and 1998, most (72%) were foodborne. Of the
foods implicated in these outbreaks, beef was the most common (45%) source. When
specified, 90% of the time beef product was ground (CDC, 2000; CDC, 1999b; Wilson et
al., 1997). Studies of sporadic cases of E. coli O157:H7 illness also identified ground
beef as the primary source of human exposure (MacDonald et al., 1988, Le Saux et al.,
1993, Slutsker et al., 1998, Kassenborg et al., 2001).
Ground meat, such as minced beef, has been associated with a number of
outbreaks of VTEC infection. Ground beef is a high-risk product because pathogens on
the surface of the meat are mixed into the product during the mincing process.
Commonly used preservatives, such as 3% sodium lactate, have no significant effect on
the survival of VTEC in such products (Duffy et al., 2002b). The primary control measure

16
therefore remains adequate cooking of the product (70ºC for 2 min or meat juices run
clear). VTEC will survive during the normal shelf life of ground beef products e.g. chill
storage for up to 7 days or frozen storage for several months (Duffy et al., 2002b). In
1993, a highly publicized, hamburger-associated outbreak of STEC O157:H7 focused
public and governmental attention on the problem. In January of 1993, a multistate
outbreak of STEC O157:H7 infection was first recognized in Washington State. During
January, 230 culture-confirmed cases were reported. HC and HUS cases were reported
following the consumption of hamburgers from several restaurants of one fast-food chain.
The incriminated lots of ground beef had been distributed throughout several western
states prompting an interstate recall of the ground beef following reports of bloody
diarrhea in those states (CDC, 1993). Processing errors and inadequate cooking were
identified as probable causes for the outbreak. Surveillance implemented by the state of
Washington was a key element in the early recognition and intervention to control the
epidemic (Griffin et al., 1994). According to USDA reports, it is estimated that nearly
73,000 infections by E. coli O157:H7 occur in the United States each year, and 61 of
those cases are fatal. E. coli hemorrhagic diarrhea was first identified by the CDC in
August 1982 when 29 sporadic cases emerged. Twenty-five cases included individuals
who had consumed hamburgers from their homes and/or restaurants within one week of
their symptoms. E. coli O157:H7 was isolated from stool specimens of 28 of the
individuals.
While food and water still account for a significant proportion of outbreaks,
person-to-person spread was reported to be important, particularly among vulnerable
groups such as children under 5 years and the elderly, practically in settings such as
17
nursing homes (Kehl, 2002). The number of cases and outbreaks attributable to direct and
indirect faecal contact is causing increasing concern in many countries. Contact with
animal faeces at "petting zoos", open farms and from faecally-contaminated mud was
reported to be responsible for 14% of outbreak cases in England and Wales (Kehl, 2002).
A further study in Scotland suggested that direct and indirect contact with farm animal
faeces may be responsible for as many as 50% of sporadic VTEC cases.
2.5 Detection of E. coli O157:H7
Traditional methods for the detection of food borne pathogen often rely on time-
consuming growth in culture media, followed by isolation, biochemical identification,
and sometimes serology. Recent advances in technology made the detection and
identification process faster, more convenient, more sensitive, and more specific than
conventional assays. These new methods are often referred to as "rapid methods", a
subjective term used loosely to describe a vast group of tests that includes miniaturized
biochemical kits, antibody and DNA-based tests, and assays that are modifications of
conventional tests to speed up analysis (Dziezak, 1987; Fung, 1991; Fung et al., 1988;
Ibrahim, 1986; Stager and Davis 1992). Rapid methods and automation in microbiology
is a dynamic area in applied microbiology dealing with the study of improved methods in
the isolation, early detection, characterization, and enumeration of microorganisms and
their products in clinical, food, industrial, and environmental samples.
In the past 20 years, this field has emerged into an important subdivision of the
general field of applied microbiology and is gaining momentum nationally and
internationally as an area of research and application to monitor the numbers, kinds, and
18
metabolites of microorganisms related to food spoilage, food preservation, food
fermentation, food safety, and foodborne pathogens.
5.2.1 Conventional cultural methods.
Conventional cultural methods for the detection of E. coli O157:H7 rely mainly
on partially selective properties such as the inability to ferment sorbitol within 24 h, lack
of β-glucuronidase activity and resistance to tellurite, cefixime and cefsulodin (Chapman,
2001; De Boer and Heuvelink, 2000; and Karch et al., 1999b). Conventional methods
include blending of the food product with a selective enrichment medium to increase the
population of the target organism; plating onto selective or differential agar plates to
isolate pure cultures and examining the cultures by phenotypic analysis or metabolic
fingerprinting (monitoring of carbon or nitrogen utilization). The major drawbacks are
that these methods are labor-intensive, take 2 - 3 days for results, and up to 7 - 10 days
for confirmation. To avoid delays, many of the modern detection tools have been
developed using a conventional method along with an automated or semiautomated
DNA, antibody, or biochemical-based methods.
Consequently, several commercially available chromogenic agars may have
greater selectivity for E. coli O157:H7. The most commonly used plating medium for
isolation of E. coli O157:H7 is sorbitol-MacConkey agar containing cefixime and
tellurite (Manafi and Kremsmaier, 2001). This medium is suitable only for O157:H7
strains (most but not all E.coli O157 strains do not ferment sorbitol). The composition of
the enrichment broth and plating medium is important if VTEC is to be isolated from
contaminated materials; and several groups are working on determining the optimum
combination of selective agents. Notably, methods relying on the sorbitol-negative and β-

19
glucuronidase-negative properties of E. coli O157:H7 did not allow detection of the
sorbitol-positive, β-glucuronidase-positive E. coli O157: H- strains causing human
disease (Karch et al., 1999b). Colonies typical of E. coli O157:H7 on these media can be
tested for the O157 antigen by simple agglutination tests. Documented E. coli O157:H7
isolates can then be characterized by biotyping, standard O and H serotyping and/or
tested for VTs or for selected genetic markers by PCR or colony blot hybridization
(Karch et al., 1999b, Paton, 1998b).
2.5.2 Enumeration of isolated microorganism
Food contains a large array of ingredients that include proteins, carbohydrates,
fats, oils, chemicals, and numerous other compounds. Many of these components can
have an adverse effect on bacterial viability and can therefore interfere with the detection
of specific pathogens (Swaminathan, 1994). The physical composition of foods also
varies greatly between liquid, solid, semisolid, or other forms. The differences in
viscosities and the presence of ingredients such as fats and oils can also interfere with
consistent extraction and isolation of bacteria and may impede efforts to obtain uniform
food homogenates for reproducible analysis (Swaminathan, 1994). There are many
problems with the developed techniques for E. coli O157:H7. A major challenge is the
isolation of E. coli O157:H7 from complex sample types (environmental, animal faeces,
food and clinical specimens). Often the sample will contain low numbers of VTEC, very
high levels of background flora and natural inhibitors of bacterial growth which interfere
with isolation and subsequent detection of the pathogen. In many samples, VTEC are
present in an injured or stressed condition and unless a recovery step is built into the
protocol these cells may not be recovered, giving a false negative result (Swaminathan,

20
1994). In addition to the problems of variable matrices, testing of food samples is further
complicated by indigenous microflora that may be present in some foods at very high
levels. Normal flora bacteria generally cause no significant health risks; however, their
physical presence often interferes with the selective isolation and identification of
specific bacteria (Clark, 1980). This interference is especially critical when foods are
being analyzed for pathogens such as Shigella, Salmonella, or enterohemorrhagic
Escherichia coli that have low infective doses and may cause illnesses when present in
very small numbers per gram of food (Dupont et al., 1989). In the case of raw ground
beef, the target organism (E. coli O157) is often present at very low levels (<100 CFU/g),
while the level of other organisms may be as high as 104 to 106 CFU/g. In this situation,
the majority of the non-E. coli O157 organisms in the meat could serve as competitors
(Tsai et al., 2000) which may prevent the detection of E. coli O157:H7.
Microorganisms subjected to sublethal environmental stresses undergo metabolic
injury, often manifested as the inability to form colonies on selective agars on which
uninjured cells can survive and grow (Hurst, 1977 and Jay, 1986). The differential in
counts between selective and nonselective media is a mean to determine the degree to
which a microbial population is sublethally injured (McCleer, 1995). Bacteria undergo
sublethal cellular injury from a variety of inimical processes, including acidification,
heating, and freezing (McClear, 1995). Antimicrobial agents for reducing bacterial
contamination and pathogens, such as toxigenic Escherichia coli O157:H7 and
Salmonella spp., on cattle, swine, and sheep carcasses are often used (Hartung, 1993;
Karmali, 1989; and Sockett et al., 1993). Antimicrobial treatments include organic acid
sprays (generally lactic or acetic acids), hot water or steam treatments, and antimicrobial
21
chemical applications, such as chlorine, chlorine dioxide, and trisodium phosphate
(Abdul-Raouf, 1993; Barkate, 1993; Dickson and Anderson, 1991; Dickson and Siragusa
1994; Dorsa et al., 1996; Davey and Smith, 1989; Rochelle et al., 1996; Siragusa, 1995;
and Zhao 1993). While sufficient exposure to these treatments can result in bactericidal
effects, more often the pathogen population is reduced but not completely inactivated.
Depending on the antimicrobial agent, after the initial microbial reduction from the
antimicrobial treatment, either a residual antimicrobial effect, such as in the cases of
lactic and acetic acid treatments (Dorsa et al., 1996), or only an immediate reduction with
no residual bacteriostatic effect, as in the case of hot water or steam, can be observed.
Following heat treatment, sublethally injured food-borne pathogens could assume added
significance because they are potentially as dangerous as their uninjured counterparts
(McCarthy, 1998 and McClear, 1995).
Several workers have reported identification methods and media for detecting
sublethally injured food-borne pathogens in foods (Clavero and Beuchat, 1995; Cole,
1993; Hartman, 1975; Hartung, 1993; McClear, 1995; Sage and Ingham, 1998; and Speck
et al., 1975). These injured or stressed cells are extremely sensitive to ingredients used in
selective microbiological media; therefore, they can be easily missed when standard
microbiological methods are used to detect them (Busta, 1976; Hurst, 1977; and
Scheusner et al., 1971). To overcome these difficulties, conventional microbiological
procedures and media were constantly modified for specific bacterial types or foods. One
effective procedure adapted for food analysis was the stepwise enrichment of food
samples to enhance the detectability of specific pathogens. Generally, the process starts
with pre-enrichment, in which food samples are incubated in a nutritious, nonselective

22
medium to allow the resuscitation of injured or stressed bacteria (Hartman, 1979; Ray,
1979; and Warseck, 1973). Pre-enriched samples are transferred into a specially
formulated medium for selective enrichment, where the bacteria of interest are allowed to
grow while the growth of normal microflora is suppressed. Occasionally, a post-
enrichment step is also included so that the selectively enriched bacteria can proliferate in
numbers easier to detect. Following the scheme of conventional procedures, culture-
enriched samples are plated onto selective and differential media, where different
bacterial types are presumptively recognized on the basis of distinguishing colony
characteristics. Cell separation using immunomagnetic beads has been developed for the
detection of E. coli O157:H7 (Chapman et al., 1994; Fratamico et al., 1992; Okrend et al,
1992; and Wells et al., 1983). This relatively simple and rapid method uses iron-
impregnated latex beads coated with an antibody against E. coli O157. Antibody coated
beads were added to samples that have already been enriched and after repeated washing
and concentration, the majority of non-target organisms can be removed leaving the
target E. coli O157 in the sample container.
2.5.3 Immunotechnology-based methods
The basic principle of antibody-based detection (immunoassay) is the binding of
antibodies to a target antigen, followed by the detection of the antigen-antibody complex.
Antibodies are produced by the body in response to a specific invading pathogen.
Experimentally, these molecules are produced in laboratory animals against a specific
antigenic component of the pathogen or toxin. The most important characteristic of an
antibody is its ability to recognize only the target antigen in the presence of other
organisms and interfering food components. In addition, the successful use of antibodies

23
to detect pathogens depends on the stable expression of target antigens in a pathogen
which are often influenced by temperature, preservatives, acids, salts, or other chemicals
found in foods (Wyatt, 1992).
Over the years, a number of immunological methods (enzyme immunoassays,
colony blot and passive agglutination assays) for detection of VTs have been developed.
A lot of the immunological assays available today are commercial ready to use test kits
which is an advantage for routine clinical laboratories.
2.5.3.1 Polyclonal Antibodies
Antibodies are commercially available in a variety of forms such as antiserum,
ascites containing monoclonal antibody, purified immunoglobulin, and affinity purified
antibody. These forms may vary significantly in antibody concentration, purity and
heterogeneity (Wyatt, 1992). The antibody may be provided as a whole molecule or as an
antibody fragment: F(ab')2, Fc or F(ab). The goal is to choose an antibody system that
provides the greatest sensitivity with the least amount of non-specific activity (Wyatt,
1992; Harlow and Lane, 1988b).
Rabbits have been used in the production of polyclonal antibody for over 40
years. The advantage of the rabbits over other species include the excellent
responsiveness of the rabbit and wide variety of immunogens with the production of
precipitating antibodies (Canadian Council on Animal Care, 2002; Harlow and Lane,
1988a), the adequate body size of the rabbit permits the obtainment of reasonable blood
volumes for analysis, the availability of the marginal ear vein for easy venepuncture, and
the accumulation of a vast amount of information involving the purification of rabbit
immunoglobulins (Ig). The reputation of the rabbit for polyclonal antibody production is

24
well deserved; and their use will continue in this role for the fore seeable future (Wyatt,
1992, Canadian Council on Animal Care, 2002; Harlow and Lane, 1988a).
Immunoglobulins (also known as antibodies) are glycoproteins synthesized and secreted
by B-lymphocytes and plasma cells. They are separated into classes based on physical
characteristics including the structure of the heavy chain, size and valency (number of
antigen binding sites). Mammalian species produce 5 classes of immunoglobulins: IgG,
IgM, IgA, IgE and IgD. The basic structure of an immunoglobulin secreted by a single B
cell is a heterodimer consisting of 2 identical light chains and 2 identical heavy chains
arranged such that there is a bifold axis of symmetry in the molecule and a valency of
two (Wyatt, 1992; Stills, 1994; Harlow and Lane, 1988a). The light chains consist of
approximately 110 amino acids referred to as the variable region at the N terminal end of
the molecule and approximately 110 amino acids referred to as the constant region at the
C terminal end. The heavy chain has a similar structure of an approximately 110 amino
acid variable region, but it is followed by an approximately 330 amino acid constant
region (Harlow and Lane, 1988b). The variable regions serve as the antigen binding part
of the molecule and provide each different antibody molecule with its binding specificity.
Polyclonal antibodies are obtained from the serum of animals immunized with a
particular antigen. The antibody pool obtained from serum is the result of many B cell
clones, each secreting one specific antibody. The primary antibody response is initiated
on exposure to immunogen. During the early stages of primary immune response only
antibodies of the IgM classes are produced. As the primary immune response proceeds,
IgG and IgA antibodies are produced in increasing quantities and become the
predominant classes of immunoglobulins present in the serum (Stills, 1994; Harlow and
25
Lane, 1988a). Affinity purified antibodies are useful as primary and secondary antibodies
in heterogeneous immunoassays and make excellent secondary antispecies (e.g., Goat
anti-human IgG) antibody conjugates. Anti-bacterial membrane or viral coat proteins are
directed to multiple antigenic determinants. Therefore, unlike monoclonal antibodies,
affinity purified antibodies can be used as both the capture and detection antibody in
capture immunoassay systems (Harlow and Lane, 1988c). Although affinity purified
polyclonal antibodies have many advantages, they are not the antibody of choice for
some immunoassay systems. In competitive assays designed for measuring drugs or small
molecular weight analytes, polyclones are not as reliable as monoclonal antibodies.
Affinity purified antibodies require consistent antiserum quality. Due to the normal
variation in the animals producing the antibody, there is greater variation in the final
activity of an affinity purified polyclonal antibody than a monoclonal antibody (Harlow
and Lane, 1988c). For systems that require exact reproducibility, monoclonal antibodies
may be a better choice than polyclonal. For assays requiring broad spectrum specificity to
large molecular weight antigens, affinity purified polyclonal antibodies are the clear
choice (Harlow and Lane, 1988c). Since an affinity purified polyclonal antibody contains
multiple individual antibodies with varying affinities for an epitope, the affinity constant
can not be accurately determined. Multiple antibody affinities may increase the assay
variation about a standard curve in comparison to an assay designed with a single
monoclonal antibody.
Antiserum refers to a pool of serum containing all of the antibody fraction plus
other serum proteins. Due to serum proteins other than immunoglobulins, immunoassays
using unpurified antiserum components usually exhibit high background, poor dynamic

26
range, and low sensitivity. Antibody purified from antiserum is obtained by selective
precipitation and various forms of chromatography. An IgG fraction may only contain
10% specific antibody and is only slightly more purified than antiserum (Harlow and
Lane, 1988c). This fraction however, is void of many serum proteins that can interfere
with immunoassays. An affinity purified antibody is one that has been purified from the
IgG fraction by affinity chromatography to a selected antigen. Affinity purified
antibodies exhibit the highest specificity and sensitivity that can be obtained from a
circulating serum antibody pool (Harlow and Lane, 1988c). These antibodies exhibit
specific activity to a population of antigenic determinants including continuous and
discontinuous antigenic sites.
Accurate antibody quantitation is critical to the selection of cell lines for
development and to optimize antibody production. Moreover, antibody concentration can
be determined by measuring the rate of binding to a capture molecule under a set of
standard conditions. A standard curve is derived from the different binding rates and used
to calculate the concentration of the unknown samples according to user-defined curve fit
parameters. A Sensitive assay for measurement of antibodies to Clostridium botulinum
neurotoxins A, B, and E: using hapten-labeled-antibody elution to isolate specific
complexes was developed (Doellgast et al., 1997).
A sensitive enzyme-linked immunosorbent assay (ELISA) was developed (Klein-
Schneegans et al., 1989a) to measure mouse serum heavy chain immunoglobulin isotypes
in nanograms per milliliter. The assays have been used to determine the absolute
concentrations of mouse serum heavy chain Ig isotypes. The serum concentrations of
IgM, IgG1, IgG2b, IgG3 and IgA were determined in mice of C57BL/6 background, from

27
weaning to one year of age, by quantitative isotype-specific, indirect double sandwich
enzyme-linked immunosorbent assays (Klein-Schneegans et al 1989b). An indirect double
sandwich ELISA (Klein-Schneegans et al., 1989c) which permits the specific and
quantitative measurement of mouse IgM, IgA and IgG subclasses with one major
exception: IgG2a of the b allotype (Igh-1b in mouse strains) could not be reliably
quantitated even by a very specific and sensitive asymmetrical sandwich ELISA (using
two different anti-IgG2a isotype antibodies for capture and for detection). The
comparative quantitation of serum antibodies to a defined antigen, using the amplified
enzyme-linked immunosorbent assay (a-ELISA), has been demonstrated in a model
system in which bovine immunoglobulins (Ig) IgG1, IgG2, IgA, and IgM antibodies to
human serum albumin were measured (Butler et al., 1980).
Numerous immunoassays are available as screening tests for E. coli O157:H7 (De
Boer and Heuvelink, 2000). Many have good test sensitivity when applied to enrichment
cultures, but most detect the O157 antigen and give false-positive results when non-
VTEC of this serogroup or antigenically-related organisms are present.
2.5.3.2 Enzyme-linked immunosorbent assay (ELISA)
The enzyme-linked immunosorbent assay (ELISA) remains the most widely used
format for immunoassays (Swaminathan and Feng, 1994; Clark and Engvall, 1980). The
ELISA format was widely used to develop methods to detect pathogenic bacteria and
bacterial toxins in foods (Notermans and Wernars, 1991b; and Swaminathan and Konger,
1986). Several ELISAs based on different cell-surface and cytoplasmic antigen targets
have been developed for the specific detection of E. coli O157:H7 or for the detection of
all Shiga-like toxin (SLT)-producing E. coli (SLTEC). These targets include the E. coli

28
O157 SLT-I and SLT-II, low molecular mass (<10,000 kDa) outer-membrane proteins,
and two proteins (160 and 161 MDa) encoded by a 60-MDa plasmid carded by STEC. A
commercial ELISA kit based on polyclonal O157 antibody is available from 3M
Company (St. Paul, MN). This kit, sold under the name HEC O157 ELISA method, is
designed to rapidly screen meats (specifically ground beef) for the presence of E. coli
O157. In this method, enrichment cultures (6-8 h, 37°C) of foods are inoculated onto 3M
Petrifilm E. coli count plates. After incubation for 18 h at 42°C, the colonies are replica-
plated on disks provided by the manufacturer. E. coli O157 colonies on the disk are
identified by an immunoblot method using a polyclonal antibody raised against E. coli
O157 cells. The advantage of the method is that it allows rapid screening and elimination
of E. coli O157-negative foods. Also, it allows one to confirm the identity of the
antibody-reactive colonies using culture methods. However the method uses a polyclonal
antibody; therefore it may yield false-positive reactions. All positive reactions must be
confirmed by other methods (Padhye and Doyle, 1992; Sernowski, and Ingham, 1992).
Padhye and Doyle 1991a, developed a monoclonal antibody specific for E. coli O157:H7;
the monoclonal antibody recognized outer membrane proteins of 5-6 kDa in size and
reacted specifically with serotypes O157:H7 and O126:H11. These authors used the
monoclonal antibody for detection and a polyclonal O157 antibody for capture of bacteria
in a two-site ELISA to rapidly detect E. coli O157:H7 in foods (Padhye and Doyle,
1991b). This assay is commercially available as EHEC-TE (KOrganon Teknika).
Monoclonal antibodies that specifically recognize SLT-I (Strockbine et al., 1985) or
SLT-II (Downes et al., 1988), and those that recognize common epitopes in both toxins
(Padhye et al., 1989), were prepared. Since E. coli strains of O157:H7 serotype produce

29
SLT-I or SLT-II or both, a rapid test that screens for both toxins is useful for the indirect
assessment of the presence of the organism in foods. Antibodies to SLTs are also useful
for detecting other serotypes of enterohemorrhagic E. coli that produce SLT(s). This may
be potentially useful because present culture methods are inclined toward the isolation of
sorbitol-negative E. coli O157:H7.
Eight different EIA/ELISA tests for VT detection were developed and
commercially distributed (Scheutz et al., 2001a). Since these tests are easy to use and do
not require specific materials or skills, some of them are widely used in routine
laboratory testing for VTEC in different countries. Most of these tests are used for non-
discriminative detection of VT in supernatants from stool or from bacterial cultures on
microtitre plates coated with VT1/VT2 specific (monoclonal) antibodies. Following
addition of the test supernatant solution and incubation at room temperature for a given
time to allow binding of any VT present to the antibodies, microtiter plate is washed and
another set of antibodies conjugated with enzyme (such as horse-radish peroxidase, or
alkaline phosphatase) is added, thus sandwiching any VT between the two sets of
antibodies. After a short incubation time (about 30 min) at room temperature and
washing, an enzyme substrate and a chromogen are added, which produce a blue or
yellow color. After a short incubation at room temperature in the dark, the intensity of
color is proportional to the amount of VT present in the original sample. A stopping
reagent is used prior to the determination of the color intensity in a microtitre plate
spectrophotometer. This method only identifies the presence of VT in a supernatant and
unlike the immunoblot method will not identify the VTEC present. As VTEC are often
only present in small numbers, picking colonies to find VTEC, growing them in a broth,

30
preparing a supernatant and then testing them can prove very time consuming and require
the use of many wells untill the VTEC are isolated. However, for the rapid screening of
foods or human faeces, where generally few samples are expected to be positive, these
test systems are very valuable. Use of the Premier-EHEC (Meridian Bioscience, Inc.,
Cincinnati, OH, USA) ELISA detects VT in specimens by an immunological method and
has been successfully used to screen specimens for VTEC (Kirchgatterer et al., 2002; and
Klein et al., 2002). This ELISA test has been developed for non-discriminative detection
of different VTs. The Ridascreen® test (R-biopharm, Darmstadt, Germany) was
compared with the Vero cell test and PCR for detection of VTEC and VT production on
bacterial isolates (Bonardi et al., 2000). This study evaluated three different analytical
methods; Vero cell test, PCR and the sandwich ELISA 'RIDASCREEN Verotoxin' test
for identification of Verocytotoxin-producing E. coli O157:H7 (VTEC) strains. The
PROSPECT® Shiga toxin (STEC) microplate assay (Alexon-Trend, REMEL, Lenexa,
KS, USA) is similar to the previous test except that the microtitre plate wells are coated
with a polyclonal anti-VT1 and 2 antibody and the second antibody is a monoclonal anti-
VT1 and 2 labeled with horse-radish peroxidase. Obviously, both the advantages and
disadvantages of the Ridascreen test also apply. ELISA resulted from an aggressive
search for alternatives to labeling antibodies or antigens with radioisotopes used in
radioimmunoassays and immunoradiometric techniques (Swaminathan and Konger,
1986; and Padhye et al., 1989). The two-site ELISA, commonly known as sandwich
ELISA, is appropriate for the detection of bacteria in foods. It involves the capture of
antigen by an antibody that is immobilized on a solid matrix. After washing to remove
unbound materials, a second antibody that recognizes a different epitope from the capture

31
antibody is added and allowed to react with the capture antibody-antigen complex. If the
second antibody is labeled with an enzyme (direct two-site ELISA), the substrate for the
enzyme is added after washing excess unbound second antibody. A spectrofluorometer or
an epifluorescence microscope is used to measure emission of fluorescence when a
fluorescent-labeled antibody is used. The sensitivities of these methods for the detection
of E. coli O157:H7 are in the range of 104–107 bacterial cells; and the assays take about
3-4 h to complete (Swaminathan and Feng, 1994). Often, the second antibody is
unlabeled; and detection is achieved by adding a third labeled antibody that specifically
recognizes an epitope on the second antibody (indirect two-site ELISA). In indirect
ELISA, the enzyme-labeled antibody does not recognize any epitope on the antigen;
therefore, a single generic enzyme-labeled antibody can be used to detect different
antigens. The use of a microtitration plate as the solid phase to immobilize the capture
antibody has led to standardization of the assay format and allows partial to complete
automation of the ELISA. As with the immunofluorescent technique, the major problem
with ELISAs for food-borne pathogenic bacteria was the inadequate specificity of the
polyclonal antibodies. The development of hybridoma technology (Kohler and Milstein,
1975), and the ability to prepare monoclonal antibodies with high specificity, led to
significant improvements in the specificity of ELISAs.
2.5.3.3 Latex agglutination assay
The latex agglutination assay kits use latex particles sensitized with antibodies to
the target analyte. Latex particles have been used for many years in the development of a
wide range of immunoassays, from rapid and simple semiquantitative assays to very
precise and sensitive assays used with automated photometric analyzers (Litchfield et al.,

32
1984; Galvin et al., 1983; Price and Newman, 1997). Isolates agglutinating in O157
antiserum or O157 latex reagent should be identified biochemically as E. coli, since
strains of several species cross-react with O157 antiserum (Bettelheim et al., 1993;
Corbel, 1985; Lior and Borczyk, 1987). However, because biochemical confirmation may
take 24 hours or longer, an oral report of presumptive E. coli O 157 may be given before
biochemical identification is completed. Many workers have studied influences of protein
adsorption, pH, ionic strength, and detergents on the stability and surface charge of latex
particles (Nakamura et al., 1992; Hidalgo-Alvarez and Galisteo-Gonzalez, 1995;
Elgersma et al., 1992a; Elgersma et al., 1992b).
Agglutination assay (E. coli latex test, Oxoid Ltd, Hampshire, UK) is
commercially available for rapid presumptive detection of E. coli belonging to serogroup
O157. March and Ratnam (1989) evaluated the latex agglutination test using clinical
isolates of E. coli O157:H7 and faecal specimens obtained during an outbreak of
haemorrhagic colitis. The latex test showed a complete and rapid agglutination with all
200 E. coli O157:H7 strains and a clear-cut negative reaction with the 50 non-E. coli
O157 strains tested. Escherichia coli O157: H7 was not detected in any of the 400
outbreak-related food samples studied, although about 130 food samples yielded
presumptive colonies on cellobiose MacConkey agar. None of the colonies were
identified as E. coli O157: H7 by the latex agglutination assay, and all were later
identified as Enterobacter, Flavomonas or Havnia spp. (Borczyk et al., 1990)
demonstrated with the latex agglutination test that non-specific agglutination occurred
among several sorbitol-negative Escherichia bacteria, including E. hermanii, E. coli
0148:NM and E. coli 0117:H27.
33
2.5.4 Nucleic acid-based assays
DNA-based methods for identification and further characterization include DNA
specific probes used in colony hybridization assays and PCR assays. Genes and DNA
sequences that have been studied to characterize presumptive STEC O157:H7 include eae
(EA gene), stx (shiga toxin genes), uidA (O157 specific mutated GUD gene), a DNA
sequence upstream of eae, the 60-Mda plasmid (pO157) and the hlyA that pO157
encodes (Meng and Doyle, 1998; Meyer-Broseta et al., 2001; Nataro, and Kaper, 1998;
Strockbine et al., 1998). Studies on healthy cattle or carcass contamination have utilized
different methods that incorporated DNA probes, PCR assays, or both on isolates derived
from culture (Johnson et al., 1983). Using PCR for direct analysis of complex samples
(e.g. fecal and food samples) can be problematic because of background flora and
inhibitory factors (Nataro, and Kaper, 1998). PCR assays, which have been described as
multiplex reactions, can identify virulence factor genes and confirm serotype (Fratamico
et al., 2000; Gannon et al., 1997; Paton 1998a). PCR assays amplify genes encoding the
O157 LPS (rfbO157) and H7 antigen (fliC) to detect or confirm serotype (Fields et al.,
1997; Paton 1998a). One protocol using PCR and restriction fragment length
polymorphisms (PCRRFLP) has been described that characterizes fliC sequences that
allow differentiation of flagellar antigen groups (Paton 1998a). A DNA-based typing
scheme has been suggested based on O157- and H7- specific primers that would allow
sensitive and rapid detection of the O157:H7 serotype (Wang and Reeves, 1998; and
Wang et al., 2000). As with culture methodology, characterization of isolates is
constantly changing, particularly with molecular methods that identify homogeneous
DNA sequences unique to STEC O157:H7.

34
Nucleic acid-based assays can be made exquisitely sensitive; and their specificity
can be adjusted from a broad to a very narrow range by careful design of the probe and
precise control of hybridization conditions (Saiki et al., 1988). Probes for detecting
specific bacteria or genes coding for toxins can be developed by shotgun screening of
restriction genomic DNA fragments or by targeting unique sequences on genes coding for
known products. Virulence-associated genes are commonly targeted for pathogenic
microorganisms. Amplification in vitro of target DNA is accomplished using the
polymerase chain reaction (PCR), an ingeniously simple but conceptually elegant
procedure (Mullis et al., 1986; Saiki et al., 1988). The PCR amplification technique is
carried out in cycles, each cycle consisting of three steps. In the first step, target DNA is
denatured. In the second step, specific primers that are homologous to flanking segments
of complementary strands on the target DNA are allowed to anneal to the target DNA.
Finally, DNA polymerase extends the annealed primers using target DNA sequences as
the template. In practice, the target DNA is mixed with nucleoside triphosphates and
appropriate primers in the presence of a suitable buffer. Heating the mixture to 95-100°C
denatures the DNA, and the subsequent cooling of the reactants (37-55°C) allows
annealing to take place. The addition of DNA polymerase at this point allows primers to
extend in both directions. Following the completion of one cycle, the sample is denatured
for another annealing and extension step, which amplifies not only the original target
region but also the amplification product of the first cycle. As long as primer and
nucleotide concentrations remain in excess of the product, the reaction will increase the
number of target copies in an exponential manner. Theoretically, a single target can
generate 1.5 × 10⁶ copies after 30 cycles of PCR (Chapman et al., 1994). After the pre-

35
PCR steps, the PCR products are detected by agarose gel electrophoresis. Several of the
new PCR assays for food-borne pathogens use a colorimetric or chemiluminescent assay
to detect the amplified product. This method of detection, particularly if formatted for a
microtitration plate, is sensitive, simple to perform, lends itself to the simultaneous
analysis of large numbers of samples, and is amenable to various levels of automation
(Kapperud et al., 1993; Wahlberg et al., 1990; Wiedmann et al., 1993). Molecular
methods, particularly PCR, have proven useful as screening tests for E. coli O157:H7,
and for confirmatory identification of putative isolates. In addition to reducing test time,
real-time PCR offers the possibility of direct quantification of the organism (Johnson,
2004)
2.5.4.1 PCR Inhibitors
The PCR is an extremely powerful method for detecting microorganisms in
complex biological samples, such as clinical, environmental, and food samples, but it is
limited in part by the presence of substances that inhibit the PCR or reduce the
amplification efficiency. The PCR inhibitors may act through one or more of the
following mechanisms: interference with the cell lysis step, degradation or capture of the
nucleic acids, or inactivation of the thermostable DNA polymerase (Wilson, 1997).
A number of components have been reported to be PCR inhibitors, namely, bile salts and
complex polysaccharides in feces (Lantz et al., 1997; Monteiro et al., 1997), heme in
blood (Akane et al., 1994), humic substances in soil (Tsai et al., 1992), proteinases in
milk (Powell et al., 1994), and urea in urine (Khan et al., 1991). It has been reported that
anticoagulants, leukocyte DNA, and heme compounds in blood also inhibit PCRs (Morata
et al., 1998; Garcia, 2002). Much effort is being devoted to the development of sample

36
preparation methods to overcome the problem of PCR inhibitors (Lantz et al., 1994a).
Different techniques are being employed to reduce the effect of PCR inhibitors and/or to
separate the microorganisms from the PCR inhibitors. For example, aqueous two phase-
systems (Lantz et al., 1994b), boiling (Olce´n et al., 1995), density gradient centrifugation
(Lindqvist et al., 1997), dilution (Chernesky et al., 1997), DNA extraction methods
(Klein et al., 1997), enrichment media (Wernars et al., 1991b), filtration (DiMichele and
Lewis, 1993), and immunological techniques (Fluit et al., 1993) have been used to
facilitate PCR. The thermostable DNA polymerase is perhaps the most important target
site of PCR-inhibiting substances. The most widely used polymerase in PCR-based
methods for the detection of microorganisms is Taq DNA polymerase from Thermus
aquaticus. The polymerase can be degraded by proteinases (Powell et al., 1994),
denatured by phenol (Katcher and Schwartz, 1994) or detergents (Rossen et al., 1992),
and inhibited by blocking of the active site by the inhibitor, which is the effect of heme
(Akane et al., 1994). Al-Soud and Rådström (1998) compared the effects of known PCR-
inhibiting samples on nine thermostable DNA polymerases. Samples of blood, cheese,
faeces, and meat, as well as various ions, were added to PCR mixtures containing various
thermostable DNA polymerases. The PCR-inhibiting effect of various components in
biological samples can, to some extent, be eliminated by the use of the appropriate
thermostable DNA polymerase. Molecular methods for the detection of E. coli O157:H7
in food systems are becoming more widely accepted as an alternative to traditional
growth-based tests (Fratamico and Strobaugh, 1998; Palumbo et al., 1995; Tsai and
Ingham, 1997; Vernozy-Rozand, 1997)

37
2.5.4.2 Cell lysis and DNA isolation
An elementary aspect of DNA amplification is that the failure to expose nucleic
acids as targets for amplification will result in reaction failure. Loss of cell wall integrity
may not be adequate for amplification of DNA; and enzymatic degradation of cellular
debris will often be necessary (Wilson et al., 1993). Protocols which rely on some or all
of the physical, chemical, and enzymic methods for cell lysis are available. Insufficient
lysis may result from inadequate lysis reaction conditions, enzyme inactivation, or lytic
enzymes of poor quality or consistency. Starnbach et al., (1989) demonstrated that PCR
could successfully take place with unpurified DNA released from cells by boiling. Such
an approach saves considerable amount of time compared with that needed by more
elaborate extraction protocols. Nevertheless, if whole cells are loaded into the reaction
tube and released DNA fails to be sufficiently separated from structural and DNA-
binding proteins by boiling, PCR inhibition may result. Extraction by boiling alone has
been noted to reduce sensitivity due to the mechanism described above or poor lysis
efficiency and may give rise to spurious bands in some cases (Gibson et al., 1994) or
prevent amplification altogether (Todd et al., 1992). The high concentration of salt in
Listeria selective media was found to be the reason for unlysed cells and false-negative
reactions by the Accuprobe DNA probe test (Partis et al., 1994), and PCR may be
similarly affected. Proteolytic enzymes and denaturants may degrade enzymes used for
lysis. Phenolic compounds (Simon et al., 1996) from the sample or carried over from
organic DNA purification procedures can inhibit the reaction by denaturing the lytic
enzymes (Jacobsen and Rasmussen, 1992) and failing to expose the DNA. It may be that
the stage of the growth cycle and nutrient conditions are important for the susceptibility
to lysis of some cells. These factors have been little studied.
38
The polymerase chain reaction (PCR) technique is considered to have the
sensitivity and specificity required to achieve the detection limits for bacterial pathogens
in food (Starbuck et al. 1992). The isolation and harvesting procedures for bacterial
target DNA including the efficiency of cell lysis are factors that can limit the sensitivity
of the assay. Since PCR inhibitors affect the efficiency of amplification, small variations
in the amount of inhibitors that are not removed can lead to large variations in PCR
product amplification (Innis et al., 1995; Diaco, 1995). Various methods have been
described for isolation of DNA from bacterial cells prior to PCR: guanidine
isothiocyanate (Pitcher et al., 1989; Parrish and Greenberg, 1995), SDS plus proteinase K
(Samadpour et al., 1993; Dickinson et al., 1994; and Simon et al., 1996), boiling in d-
H2O (Border et al., 1990, Weagant et al., 1994, and Withman et al.,1996), lysozyme plus
proteinase K (Furrer et al., 1991; Wiedemann et al., 1995; and Withman et al., 1996),
SDS (Gannon et al., 1992; Fluit et al., 1993; Ramotar et al., 1995), lysozyme plus
mutanolysin (Gannon et al., 1992), SDS plus NaOH in microwave treatment (700 W)
(Herman et al., 1995), Triton X-100 (Wernars et al., 1991a; Starbuck et al., 1992), SDS
plus lysozyme (Pollard et al., 1990; Bessesen et al., 1990), Sonication plus boiling
(Bessesen et al., 1990), proteinase K and Tween 20 (Gradil et al., 1994), salt solution
containing MgSO4 and MnSO4 (Breaks et al., 1992), Proteinase K in Sarcosyl, EDTA,
Tween 20 and Nonidet (Soumet et al., 1994), and 1M NaOH pH 10 (Szabo et al., 1994).
In an attempt to overcome problems due to inhibitory contaminants, a variety of
treatments have been examined, e.g. lysozyme, proteinase K, detergents, boiling,
centrifugation, filtration, DNA affinity columns and magnetic beads coated with specific
antibodies or lectins (Kroll, 1993). Four template DNA preparation methods differed in

39
performance with respect to the type of samples tested. Boiling and three commercial kits
were evaluated for extracting DNA from pure suspensions and artificially contaminated
ground beef and chicken (Li and Mustapha, 2002). The detection sensitivity of the PCR
assay for pure cultures was independent of the template preparation method (P=0·946).
Boiling and GeneReleaser failed to detect Salmonella typhimurium at 4 × 10⁶ CFU / g in
ground chicken. PrepMan Ultra and the high pure PCR template preparation kit
facilitated reliable and sensitive detection of Salmonella typhimurium in two types of
food. The sensitivities were approximately 4 ×10³ CFU/ g.
2.5.4.3 Optimization of PCR Reaction Conditions
PCR is a very sensitive procedure requiring meticulous care and precautions to
avoid contaminations. In addition, cycling parameters, PCR reaction components could
also lead to non-specific amplification (Innis and Gelfand, 1990). The magnesium
concentration may affect all of the following: primer annealing, strand dissociation
temperature of both template and PCR product, product specificity, formation of primer-
dimer artifacts, and the enzyme activity and fidelity. Taq polymerase requires free
dNTPs. Accordingly, PCRs should contain 0.5 to 2.5 mM magnesium over the total
dNTP concentration (Innis and Gelfand, 1990). Two variables, which are reported to
greatly influence the specificity of the PCR reaction, are Mg++ and dNTP concentration
(Dwivedi et al., 2003). The most significant components in a PCR reaction mixture are
Mg++ and whatever is used to stabilize the enzyme. Mg++ should be optimized for each
primer/template combination. Mg2+ ions provide the following important functions in
the PCR reaction (Nakano et al., 1999, Ahsenla et al., 2001, and Dwivedi et al., 2003):
form a soluble complex with dNTP's which (essential for dNTP incorporation), necessary

40
co-factor for Taq polymerase activity, and increases the Tm (melting temperature) of
primer/template interaction (i.e. stabilizes the duplex interaction).
Alteration of PCR components such as PCR buffer constituents, dNTPs, and
enzyme concentrations in multiplex PCR compared to those reported for most uniplex
PCRs results in little, if any, improvement in the sensitivity or specificity of the test.
Furthermore, increasing the concentration of these factors may increase the likelihood of
mis-priming with subsequent production of spurious nonspecific amplification products
(Elfath et al., 2000). Kim et al. (2000) found that collagen, a major component of several
foods, inhibited PCR. The inhibitory action of collagen on PCR can be partially reversed
by adjusting the concentration of magnesium ion in the reaction mixture and by the use of
various DNA extraction methods to remove the collagen from the DNA. Also, the source
of thermostable DNA polymerase is affected by the presence of collagen. Taq
polymerase from different suppliers may not produce the same results (Annis and
Gelfand, 1990) due to differences in formulation, assay conditions, and/or unit definition.
Kim et al., (2000) also suggested that rapid detection of enterotoxigenic Clostridium
perfringens by PCR requires an optimization of the extraction and PCR reaction mixture
composition. Suboptimal reaction conditions may arise for a number of reasons, but are
primarily due to inappropriate primers, improper time or temperature conditions, variable
polymerase quality, and incorrect MgCl2 concentration (Wilson, 1997). These factors
should be optimized by varying the concentrations of the components in the PCR reaction
mixture and running several PCR temperature profiles. Temperature inconsistencies
across the block of a thermal cycler have been found to be responsible for poor
amplification (Levin, 1969; Gannon et al., 1993), but was mastered by the addition of
41
formamide, which reduces the melting temperature of DNA (Levin, 1969). Dimethyl
sulfoxide (DMSO) has been shown to improve reaction yield during RT-PCR (Chapman,
et al., 1994). Sensitivity was improved up to 25-fold for some viral target RNAs. That
study involved the use of recombinant Thermus thermophilus polymerase; and no
inhibitors were mentioned. The optimal concentration of DMSO was dependent on the
template and facilitated both the reverse transcriptase and PCRs. It was suggested that
DMSO may enhance PCR by eliminating nonspecific amplification, altering the thermal
activity of the polymerase or improving the annealing efficiencies of primers by
destabilizing secondary structures within the template (Chapman, et al., 1994).
PCR primers generally range in length from 15-30 bases and are designed to flank
the DNA sequence of interest. Primers should contain 40.60% G+C and care should be
taken to avoid sequences that produce internal secondary structure (Wilson, 1997). The
3´-ends of the primers should not be complementary to avoid the production of primer-
dimers in the PCR reaction. Avoiding three G or C nucleotides in a row near the 3´-end
of the primer should be also considered. Ideally, both primers should anneal at the same
temperature. The annealing temperature is dependent upon the primer with the lowest
melting temperature (Tm) (Wilson, 1997).
Magnesium concentration is a crucial factor affecting the performance of Taq
DNA polymerase. Reaction components including template DNA, chelating agents (e.g.,
EDTA or citrate), dNTPs and proteins all affect the amount of free magnesium in the
PCR reaction mixture (Smith et al., 1996). In the absence of adequate free magnesium,
Taq DNA Polymerase is inactive (Smith et al., 1996). Conversely, excess free
magnesium reduces enzyme fidelity (Eckert et al., 1990) and may increase the level of

42
nonspecific amplification (Williams, 1989; Ellsworth et al., 1993). According to Innis
and Gelfand, (1990), deoxynucleotide Triphosphates (dNTPs) concentrations between
0.02 to 0.2 mM each result in the optimal balance among yield, specificity, and fidelity.
The four dNTPs should be used at equivalent concentrations to minimize incorporation
errors. Both the specificity and the fidelity of PCR are increased by using lower dNTPs
concentrations than those originally recommended. For these reasons, it is important to
empirically determine the optimal magnesium concentration for each reaction. The
concentration of Mg++ ions, a vital cofactor for Taq polymerase, which affect the success
and specificity of amplification (Wilson, 1997). The sequestration of Mg++ ions by
various compounds and interference by Ca++ ions may inhibit amplification (Fratamico et
al., 1992, Griffin et al., 1994). The Ca++ ions in milk may be a cause of its inhibitory
properties. A number of DNA polymerases are now commercially available. These
polymerases originate from several extreme thermophiles and exhibit differences in
processivity and fidelity, making some more suitable than others for specific tasks.
Batches of polymerase may be pooled to overcome variability in enzyme quality.
Production of PCR product may be improved in some situations if mixtures of different
polymerases are used. Inhibitory effects may be minimized by optimizing the reaction
conditions and insuring that appropriate quantities of all reactants are freely available
within the reaction mixture and by minimizing the presence of any contaminants and
known inhibitors.
43
CHAPTER 3
OBJECTIVES
The objective of this study is to develop a rapid, specific, sensitive, and reliable
method for the quantitative detection of low numbers of E. coli O157:H7 in ground beef
via Immunotechnology and DNA based methods. In order to achieve our goal, the project
was broken down into different stages as needed. The study was broken down into the
following objectives:
• Objective 1. Development of Immunotechnology-based methods for the detection
of verotoxin-producing E. coli (VTEC) strains and their Shiga like toxins (SLT-1
and SLT-2) which included the following:
Latex agglutination assay and ELISA were performed to confirm
identifying the E. coli O157:H7 strain screened.
Rabbit anti E. coli O157 was produced in Morrill Antibody Production
Center, Animal Care Department, University of Massachusetts at Amherst
using New Zealand rabbits. This local supply of rabbit's antibodies to VT1
and VT2 O157 somatic antigen reduced the cost of purchasing commercial
antibody and provided a more efficient antibody with more specificity to
the particular strain of Escherichia coli O157:H7 (C9490) under study
A Spectrophotometric Immuno-agglutination Assay was developed for
Quantitative determination of anti E. coli O157 obtained from rabbit's

44
antiserum. This new method was used successfully over a period of one
year to determine the concentration of specific antibody (anti E. coli
O157) in rabbit's antiserum. It also confirmed the specificity and
sensitivity of all antibodies and of their suitability for the intended
purpose.
• Objective 2. Development of Polymerase Chain Reaction (PCR), methodologies
for the quantitative detection of low numbers of E. coli O157:H7 by conducting the
following procedures:
The effects of different lysing methods and their variables on the
yield of Escherichia coli O157: H7 DNA and its amplification were
studied. The efficiency of cell lysis and the procedures for harvesting
target DNA are factors that can limit the sensitivity of the assay. The
presence of detergents or other lysing reagents may have a significant
effect on the efficiency of DNA amplification. Treating cells with lytic
enzymes (proteinase K with or without lysozyme) can result in a high
yield of DNA but requires lengthy incubation to achieve efficient cell lysis
and also inhibits PCR. For this reason we studied various cell lysis
methods for the quantitative release of target DNA and resulting
quantitative PCR amplification.
A newly formulated cell lysis solution was developed for releasing
genomic DNA from bacterial cells for DNA amplification by Polymerase
Chain Reaction. The presence of substances that inhibit PCR or reduce the

45
amplification efficiency limits the detection of microorganisms in complex
biological samples including clinical, environmental, and food samples.
The PCR inhibitors may also act through interference with the cell lysis
step. Few studies have been conducted to search for better cell lysis
methodologies prior to PCR. Development of a new innovative cell lysis
method resulted in a higher yield of both isolated and amplified DNA in
comparison to standard DNA extraction procedures.
PCR conditions were optimized for detection of Escherichia coli O157:H7
Shiga-Like Toxin Genes. The efficiency of PCR is limited by the
amplification conditions which include the composition of PCR reaction
mixture and the thermo cycling profile for the PCR protocol. Therefore,
the concentration of primers, dNTPs, MgCl2, and Taq polymerase in the
reaction mixture as well as MgCl2/dNTPs, also critical, were investigated.
Optimization of the PCR procedure increased the detection sensitivity
evaluated by the highest yield of PCR product.
• Objective 3. Development of an appropriate procedure for the extraction and
enumeration of E. coli O157:H7 from ground beef, in order to achieve the maximum
recovery of cells and to minimize the remains of PCR inhibitors. PCR inhibitors can
be removed or minimized during sample preparation when bacterial cells are isolated
prior to lysing. A number of well known cell extraction methods were studied. A new
extraction method was developed to obtain the highest recovery of E. coli O157:H7
extracted from seeded ground beef. Enumeration was conducted also in enrichment
media to recover injured cells and allow high sensitivity of the PCR procedure.

46
CHAPTER 4
MATERIALS AND METHODS
4.1. Development of Methodology for Quantitative Detection of Escherichia
coli O157:H7 via Immuno-Technology.
4.1.1. Latex agglutination assay with Red Polystyrene Beads
4.1.1.1. Microorganism and routine cultivation
Escherichia coli O157:H7 strain C9490 was obtained from the Centers for
Disease Control, Atlanta GA 30333. Other Escherichia coli strains also used were E. coli
4015 received from devoret, KY 700 received from K. Yamamato, KY 946 received
from K. Yamamato, KY 945 received from K. Yamamato, KY 943 received from K.
Yamamato, GE 94 received from K. Yamamato, Garvais was isolated from fish samples
in our laboratory, and AB 1157 received from Genetic Stock Center, School of Medicine,
New Haven, CT 06510. Cells were routinely grown overnight in 100 ml of Tryptic Soy
Broth plus 0.5% dextrose (TSB+) at 37o C in 250 ml baffled flasks with rotary agitation
(200 rpm). Cells were harvested by centrifuging broth cultures at 10,000g for 10 min at
4o C. The cells were resuspended in 0.85% saline and diluted in saline to achieve
required cell densities unless otherwise stated. Cell densities were determined
spectrophotometrically and with the use of a Petroff-Hausser bacterial counting chamber
along with plate counts using Tryptic Soy agar plates (TSA) following incubation at
37oC for 24 h.

47
4.1.1.2 Preparation of the reagents
Polystyrene microsphere beads with the diameter of 0.6 - 0.9 μm and a
concentration of 5% w/v were purchased from Bang Laboratories, Inc. (979 Keystone
Way, Carmel, IN 46032-2823). Beads were used without any prior cleaning. Coat / wash
Buffer was prepared by adding 470 ml of Solution A [27.6 g of (NaH2PO4, H2O) in 1 litre
of d.water] to 30 ml of solution B [28.4 g of (Na2HPO4, anhydrous) in 1 litre de-ionized
water] and then adjusted to pH 5.5 with 0.5 M HCl or 0.5 M NaOH. The final volume
was adjusted to 1 Litre with de-ionized water. Antibody solution was prepared by adding
200 μg of IgG to 4 ml of coat / wash buffer. Wash /storage buffer composed of 0.01 M
(NaH2PO4, H2O) in 0.9% NaCl at pH 7.8.
4.1.1.3 Procedure for IgG coating beads
Polystyrene microsphere beads were agitated before use and suspended
thoroughly in solution before sampling. A 0.2-ml microsphere solution was mixed with
2.0 ml of antibody solution in a micro centrifuge tubes incubated for 1 hr at room
temperature with periodic mixing, and then centrifuged at 10,000 g for 30 min. After
discarding the supernatant, the precipitate was resuspended in 2.0 ml coat/wash buffer
and centrifuged as above. After discarding the supernatant, pellet was resuspended in 0.5
ml wash /storage buffer, transferred to a microcentrifuge tube and then centrifuged at
11,000 rpm for 3 min. The supernatant was again discarded; and pellet was resuspended
in 2.0 ml wash storage buffer, ( 0.1% sodium azide was added as needed for storage).
4.1.1.4 Latex agglutination assay
An agglutination test, as described in the Bang Laboratories method was modified
by adding 30 μl of coat/wash buffer to 30μl of cell suspension in a single welled

48
microscopic slide followed by adding 30μl of coated beads. Slides were gently shaken to
facilitate agglutination, incubated for 15 min at room temperature and then photographed.
Agglutination was visually reported using a visual scale of -, +, +, ++, +++, and ++++,
with - being no agglutination. Cell suspensions of E. coli O157:H7 were of two types,
non boiled and boiled cells. Boiled cells were heated in a boiling water bath for 15 min.
The assay was performed with different cell densities. Controls were prepared by adding
either E. coli 4O15 or sterile distilled water instead of the tested cells.
4.1.2 ELISA quantitative detection assay for Shiga like toxin 1 (SLT-1) and Shiga
like toxin 2 (SLT-2) obtained from different verotoxin-producing Escherichia
coli
4.1.2.1 Preparation of Iron-depleted syncase broth.
Shiga-like toxins (SLT) was prepared according to O'Brien et al., 1982. Iron-
depleted syncase broth was prepared by adding 10 g of amino acids (casein hydrolysate
enzymatic contains vitamin), 1.17 g NH4Cl, 5.0 g KH2PO4, 5.0 g Na2HPO4, and 1.0 ml
Trace salts (5.0% MgSO4 and 0.5% MnCl2 in 0.001 N H2SO4) in 1 litre of distilled water.
The broth mixture was dissolved and then pH was adjusted to 8.0 with 2.0 N NaOH.
Broth-resin mixture was prepared by adding 20 g of Chelex 100 (100-200 mesh; sodium
form; Bio-Rad) per liter of the broth mixture and then incubated for 2 hr at 4oC with
stirring. The iron-chelating beads were removed by filtration through a large Buchner
funnel lined with two sheets of filter paper (Whatman no.1). Three litre of Iron-depleted
syncase broth were prepared as described above, was distributed evenly in 500 ml
volumes into six 1.0 Liters flasks precleaned by a surface active agent which removes

49
iron and other contaminants from glassware. The broth was sterilized at 121oC for 20 min
in an autoclave, allowed to cool, and a sterile solution of 0.2% glucose, 0.004% L-
tryptophan, and 0.002% nicotinic acid treated with 2 % Chelex was added. To conserve
Chelex, the resin was scraped from Whatman filter paper, boiled in 10 volumes of 1 N
HCl, and then washed five times in distilled water. The acid-treated Chelex was then
boiled in 10 volumes of 1N NaOH, washed five times in distilled water, and the excess
water was removed.
4.1.2.2. Preparation of bacterial extracts.
Iron-depleted syncase broth was inoculated with overnight culture media as
described in (4.1.1.1) and then incubated at 37oC for 48 hr with agitation (260 rpm).
Bacterial cells were harvested by centrifugation at 10,000 g for 20 min at 4oC. ELISA
assay for SLT-1 and SLT-2 was performed using the supernatant. Pellets were
resuspended in 20 ml of 0.05% M KCl, 0.01 M MgCl2, and 0.02 M Tris at pH 7.4. Cell
density was determined microscopically and/or spectrophotometrically as described
above. Cell suspensions were subjected to disruption by using an ultrasonic liquid
processor (Model XL2020) for 15 min. The lysate was centrifuged at 10,000g for 20 min
at 4oC. The supernatant was clarified by using ultra centrifugation at 100,000 g, 4oC for
70 min.
4.1.2.3 Globotriosyl Ceramide (GB3) ELISA procedure.
GB3 ELISA procedure was performed according to Ashkenzi and Cleary (1989)
with some modifications. GB3 (Supelco, Bellefonte, PA.) was diluted in hot methanol
and applied to the wells of polyvinyl chloride micro dilution plates (Dynatech
Laboratories, Inc., Alexandria, Va.), which were left uncovered. The diluent evaporated
50
leaving GB3 attached to the plates. GB3 was obtained from Matreya Company, Pleasant
Gape, Pennsylvania. Monoclonal antibodies (13 C4, mouse ascetic fluid) to SLT-1 and
SLT-2 (B subunit was obtained from CDC Diarrhea laboratory, Atlanta, Georgia, and
used at a 1:1000 dilution. Peroxidase- conjugated rabbit anti-mouse immunoglobulin G
was added at a dilution of 1:1000. After binding the secondary antibody to the wells,
orthophenylene diamine (0.4 mg/ml)-0.1% H2O2 in citrate -phosphate buffer (25 mM
citrate, 50 mM phosphate (pH 5) was added. The reaction was stopped with 2.5 N H2SO4;
and the samples were transferred to 0.25 cm length cuvets, diluted with d.water and A490
was measured spectrophotometrically. The control was prepared by adding 0.1% BSA
instead of the sample to 0.05% Tween 80-phosphate-buffered saline (PBS). The assay
was performed in triplicate. Sensitivity was determined by a titration curve with crude
sonic extracts of verotoxins.
Plates were coated with 100μl of GB3/well and then incubated at room
temperature for 4.0 h. Wells were then washed by adding 200μl /well of washing solution
(Tween 80-PBS), incubated at room temperature for 1 min and then dried on paper
towels. Pellets were washed 5 times. BSA blocking solution (200 μl /well) was added and
incubated at 37oC for 1 h followed by 3 washes as described above. A test sample (100
μl / well) was then added and incubated at 37oC for 1 hr followed by 5 washes as
previously described. A volume of 100μl/well of monoclonal antibodies was added,
incubated at 37oC for 1 h and then washed five times as above. Peroxidase conjugated
rabbit antimouse IgG (100 μl / well) was added and then incubated at 37oC for 1 h
followed by 5 washes as previously described. O.P.D (100 μl / well) prepared, was added,
incubated at 37oC for 1 h followed by adding 100 µl/well of stop reaction solution.

51
4.1.3 Production of Rabbit’s anti E. coli O157
Antiserum was produced in Morrill Antibody Production Center, Animal Care
Department, University of Massachusetts at Amherst using New Zealand white Rabbits
which were obtained from Millbrook Farms, Amherst, MA. The rabbits were held for
several days in the facility to acclimate them. An initial bleeding was done on new rabbits
to test pre-immune serum. New rabbits were also tranquilized with an intramuscular
injection of 0.25 ml ketamine HCl (100 mg/ml) and 0.25 ml Xylazine (20 mg/ ml) for 6-8
Ib. rabbit, (0.5 ml Ketamin & 0.5 ml Xylazine for 8-12 Ib. rabbit)
4.1.3.1 Preparation of E. coli O157 antigen.
One litre of overnight culture media was prepared and harvested as described in
section 4.1.1.1.The cell suspension was treated in 4% formaldehyde overnight at 20oC.
The formaldehyde was removed by washing the cells three times with 30 ml of phosphate
buffered physiological saline (0.01 M K2HPO4, 0.01 M NaH2PO4, and 0.85% NaCl) at
pH 7.4. New Zealand white female rabbits were injected intradermally along the back
with 10 x 0.05 c.c. of a cell suspension (4 x 10⁹ and 4 x 10¹⁰cells/ml) in sterile 0.85%
NaCl containing 0.05% Al(OH)3 as an adjuvant. The Al (OH)3 was prepared as
described by Harlow and Lane (1988a) and sterilized by autoclaving. The injections and
boosting protocols was performed as described by Harlow and Lane, (1988a).
4.1.3.2. Preparation of the antibody.
Ten days after injection with cell suspensions, the rabbits were placed in
restaining cage, and an ear shaved and wiped with 70% alcohol prior to drawing blood
using a piece of tygon tubing with a 20 gauge needle attached to both ends. One needle
was inserted into the blood vessel and the other into a vacutainer serum separator tube;

52
and then 2-3 mls of blood was drawn. The maximum amount of blood drawn did not
exceed the limit of 8 ml/ Kg. The needle was removed, and pressure was applied to the
vessel to stop the bleeding. Once clotted, the ear was again wiped with alcohol and
mineral oil was applied to the skin surface. Injection and boosting continued as described
in Harlow and Lane (1988a). Boosting of the rabbits occurred every other week after the
first boosting to check the level of anti O157 in rabbit antiserum.
4.1.3.3. Slide agglutination assay.
Different dilutions of rabbits' antiserum were prepared (1- 0, 1- 2, 1- 4, 1- 8, 1-16,
1- 32, 1- 64, 1-128, 1- 256, 1- 512, and 1- 1024). The overnight culture was harvested as
described in 4.1.1.1. Pellets were then resuspended in PBS and different concentrations of
cell densities were prepared in PBS as follows; 5 x 10⁹, 1 x 10⁹, 5 x 10⁸, 1 x 10⁸, 5 x 10⁷,
1 x 10⁷ cells/ml. The slide agglutination assay was performed by mixing 0.1 ml of each
antiserum dilution with 0.1 ml of varying numbers of cells in PBS using nine-well glass
titer plates followed by rotary agitation at 78 rpm for 10 min at room temperature.
Agglutination was then visually determined using a visual scale of -, +, +, ++, +++, and
++++, with - being no agglutination.
4.1.4 Development of A Spectrophotometric Immuno-agglutination Assay for the
Quantitation of IgG for E. coli O157
4.1.4.1 Microorganism and routine cultivation
Escherichia coli O157:H7 strain C9490 was cultivated and then harvested as
described above in section 4.1.1.1. Cells were then resuspended in phosphate buffered

53
saline (PBS; 0.005 M phosphate buffer plus 0.05% NaCl, pH 7.4) and diluted in PBS to
achieve required cell densities unless otherwise stated.
4.1.4.2. Purification of IgG
A protein A agarose column (2.5 ml packed volume, Sigma, cat. no p-2545) was
equilibrated with binding buffer (0.02 M NaH2PO4 , 0.15 M NaCl, 0.025 NaN3) by
gravity flow. Rabbit’s anti E. coli O157 was obtained as described above. Antiserum
(1.0 ml) was then passed through the column three times. The column was then washed
with 10 volumes of binding buffer. Elution of IgG was performed with five column
volumes of eluting buffer (0.2 M Na2HPO4 plus 0.1 M citric acid, pH 3.0) and 2.0 ml
fractions collected. Purified IgG fractions exhibiting absorbance at 280 nm (11 tubes)
were pooled and neutralized with 0.1 N NaOH. The pooled IgG was quantified using the
spectrophotometric agglutination assay. The protein content was estimated according to
the method of Lowry (1951) with the use of bovine serum albumin (Sigma) for the
generation of a standard curve. The column was regenerated by reequilibrating with 25
volumes of binding buffer.
4.1.4.3 Spectrophotometric Agglutination assay
The assay was performed in PBS pretempered to 40oC and consisted of mixing
1 x 10⁸ cells/ml with a 1/32 dilution of antiserum containing 3.3 µg of E. coli O157 IgG
in a final volume of 2.0 ml in a cuvet of 1 cm path length. Temperature was maintained
constant at 40oC with the use of a thermistor temperature controlled cuvet chamber
(Levin, 1969). The rate of increase in absorbance at 550 nm with time was followed
with the use of a blank cuvet containing the same cell concentration but no antiserum.
An Hitachi uv/visible spectrophotometer (model 100-40) with a digital readout to 0.001

54
absorbance units was used to follow the increase in absorbance with time. Final readings
were calculated as shown in Appendix.5, by subtracting the absorbance of the control
from sample's reading at 550 nm at different times of incubation. The above assay
conditions were employed unless otherwise stated
4.1.4.4 Optimization of the assay
To achieve the maximum antibody-antigen reaction, the assay was optimized by
varying the following values: temperature, wave length, IgG concentration, phosphate
buffer concentration, NaCl concentration, pH value, and cell density. Only one variable
was changed at a time.
4.1.4.5 Determination of the concentration of specific E. coli O157 IgG in crude
antiserum
Cells were first suspended in sterile PBS. Cell suspensions in sterile PBS (1.9 ml)
were then mixed with 0.1 ml of crude antiserum in 4.0 ml glass vials with teflon lined
caps to yield 5 x 10⁶ to 5 x 10⁸ cells/ml. The vials were then subjected to slow rotary
agitation (2 rpm) for 2 h by attachment to a vertical Multipurpose Rotator (Scientific
Industries, Inc., Springfield, MA; Model no. 150v). The 2.0 ml mixture was then passed
through a 0.20 µ porosity membrane filter (25 mm diam.) to remove the cells. The filter
was then rinsed with 0.5 ml of PBS which was combined with the filtrate. The filtrate
was then applied to the protein A agarose column for purification of total IgG present.
The protein content of the purified IgG was then determined (Lowry, 1951) and was
subtracted from the protein content of total purified IgG derived from 0.1 ml of antiserum
to which cells had not been added. This procedure was performed in duplicate and the
mean difference in protein content was taken as the amount of specific E. coli IgG bound
55
to the cells. Specific agglutination activity is defined as the increase in absorbance per
min at 600 nm divided by the µg of E. coli O157 specific IgG per 2 ml of antibody-
antigen reaction mixture. Agglutination activity refers to the rate of increase in
absorbance at 600 nm per min. Cell counts were determined with dark-phase microscopy
and a Petroff-Hausser bacteria counting chamber.
4.1.4.6. Quantitative determination of anti E. coli O157 in rabbit's antiserum
For a period of one year, Spectrophotometric Immuno-agglutination assay was
used for quantitative measurement of specific E. coli IgG in rabbits' antiserum produced
in Morrill Antibody Production Center at the University of Massachusetts, Amherst, MA
01003.
4.2 Development of Methodology for the Detection of E. coli O157:H7 via the
Polymerase Chain Reaction (PCR).
4.2.1 Effect of lysing methods and their variables on the yield of Escherichia coli
O157: H7 DNA and its PCR amplification
4.2.1.1 Microorganism and routine cultivation
E. coli O157:H7 strain C9490 was routinely grown in 50 ml of Tryptic Soy Broth
(Difco) containing 0.5% dextrose at 37oC in 250 ml baffled flasks with rotary agitation
(250 rpm). Exponentially growing cells (~1 x 10⁹cells/ml) were harvested by
centrifuging broth cultures at 16,000g for 10 min at 4o C after 4 h incubation. Aged cells
were harvested after 24 h incubation (~ 3.9 x 10⁹cells/ml). Cell pellets were resuspended
in 30 ml of distilled water, pelleted again and the concentration of cells adjusted as
required for lysing. Plate counts were correlated with absorbance readings at 600 nm.

56
4.2.1.2 Spectrophotometric lysing assay
Cell suspensions were treated with varying concentrations of lysozyme ( 2.0, 4.0,
6.0, 8.0, 10 mg/ ml) in PCR buffer (50 mM KCl ,0.01% gelatin, 10 mM Tris-HCl at pH
9.0) containing 1x 10⁸ cells/ml. The assay was routinely performed in cuvets of 1 cm
light path containing 2.0 ml of a cell suspension at 25oC. Temperature was maintained
constant with the use of a thermistor controlled cuvet chamber (Levin, 1960). The rate of
change in absorbance at 600 nm with time was followed with the use of a blank cuvet
containing the same cell concentration but no lysozyme. For cells treated with Proteinase
K, 0.1 ml of a cell suspension containing 4.2 x 10⁹ or 7.2 x 10⁹ cells/ml was added to 1.9
ml of preheated PCR buffer in a cuvet at 55oC containing 0.4 mg of Proteinase K. The
change in absorbance at 600 nm was followed for 40 min. With cells treated with both
lysozyme and proteinase K, the cells were first suspended in PCR buffer at a density of
4.2 x 10⁹ cells/ml at 25oC containing 2.0 mg/ml of lysozyme. The cell suspension was
incubated at 25oC for 15 min and then 0.1 ml was transferred to 1.9 ml of preheated PCR
buffer at 55oC containing a total of 0.4 mg of proteinase K.
4.2.1.3 Lysis of cell suspensions for quantitation of released DNA
Cells suspensions of 0.2 ml containing a total of 2 x 10⁸ cells were subjected to a
variety of treatments consisting of suspending cells in d-H2O (Weagant et al. 1994), 1%
w/v Triton X-100 (TX) (Wernars et al., 1991a), 0.05% SDS (Fluit et al., 1993), and PCR
buffer containing 500 mM KCl, 100 mM Tris-HCl (pH 9.0 at 25o C) and 1% TX in
distilled water. Cell lysis was achieved by heating these cell suspensions at 94.5oC or
99.5oC for 10 min in a thermal cycler followed by cooling to 5oC. Cells were treated with
lysozyme, proteinase K, and with lysozyme in combination with proteinase K

57
(Wiedemann et al., 1995) in 0.2 ml of PCR buffer containing the required cell density and
enzyme concentrations. Lysozyme treatment was performed by incubating cell
suspensions (0.2 ml) containing a total of 2 x 10⁸ cells and different concentrations of
lysozyme as required ( 2, 4, 6, 8, 10, 12, 14 mg/ ml) at 25oC for 15 min. Proteinase K
treatment was performed by incubating similar cell suspensions (0.2 ml) with different
concentrations of proteinase K as required (0.1, 0.2, 0.4, 0.6, 0.8, 1.0, 1.2, 1.4, and 1.6 mg
/ ml) at 55oC for 60 min. Treatment of cells with both lysozyme and proteinase K was
performed as follows: cells were suspended in 0.2 ml of PCR buffer containing
lysozyme in different concentrations as required ( 1, 2, 4, 6, and 8 mg/ml). The cell
suspensions were then incubated at 25oC for 15 min. Proteinase K was then added in
varying concentrations (0.1, 0.2, and 0.8 mg / ml) and the cell suspensions incubated at
55oC for 60 min unless otherwise stated. The resulting lysed cell preparations and the
controls (2 x10⁸ cells in 0.2 ml PCR buffer without enzymes) were then heated at
94.5oC or 99.5oC for 10 min as described above. All assays were performed at least twice
and the mean values reported.
4.2.1.4 Fluorometric analysis
All fluorometric DNA measurements were performed with a TKO 100 Mini-
Fluorometer (Hoefer Scientific Ins.). Lysed cell suspensions were centrifuged for 5 min
at 14,000 rpm. A portion (10 µl) of each supernatant was then assayed fluorometrically
with 2.0 ml of dye solution (10 mM Tris-Cl, 1 mM EDTA, 0.2 M NaCl, and 0.1 mg/ml of
Hoechst 33258 dye) to determine the relative release of DNA from cells. A standard
curve was generated (Appendix.9) with calf thymus DNA (Sigma). Fluorescence values

58
of controls (lysis solutions without cells) were subtracted from fluorescence values
obtained with lysed cell suspensions to obtain final fluorescence values.
4.2.1.5 Primers design
The primers selected to amplify the VT-1 gene segment were:
5'-TAAAACGCCGTCCTTC-3' and 5'TACTCAACCTTCCCCAGTT-3' and amplify a
764-bp fragment (nucleotides 256 to 1019). The primers selected to amplify the VT-2
gene segment were:
5'-TCTTCGGTATCCTATTCCC-3' and 5'-GCCATTGCATTAACGAAAC-3' and
amplify a 980-bp (nucleotides 260 to 1235).The primers were synthesized by National
Biosciences and were derived from Genebank with the use of the Wisconsin Software
Package version 8.1.
4.2.1.6 PCR protocol and Image analysis
The PCR protocol described by Ramotar et al., 1995, was used. The PCR mixture
consisted of 5 µl of 10X PCR mix (final concentrations: 50 mM KCl ,0.01% gelatin, 10
mM Tris-HCl at pH 9.0), 2.5 mM MgCl2, 0.2 mM each of dATP, dCTP, dGTP, and
dTTP (Boehringer Mannheim), 0.001mM each of the two primers (VT-1), and 1 µl of
DNA sample containing 1 x 10⁵ templates (derived from number of CFU) , and 2.5 units
of Taq polymerase (Promega) in a final volume of 50 µl. The PCR mixture was overlaid
with 50 ml of sterile mineral oil and processed in a thermal cycler. The cycling conditions
consisted of initial denaturation at 95oC for 5 min and then 40 cycles with denaturation at
94oC for 1 min, annealing at 55oC for 1 min, and extension at 72oC for 1 min. Final
extension was performed at 72oC for 7 min. Two blanks were routinely used containing
all components of the reaction mixture except the DNA sample or DNA Taq polymerase.

59
Amplified products were subjected to electrophoreses in 1.0% agarose gels and were
stained with 1µg /ml of ethidium bromide in the gel and in the electrophoresis buffer (0.2
M Tris base, 0.1 M Sodium acetate, 0.01 M Na2.EDTA, and 0.02 M sodium azide at pH
7.8). Digital images were obtained using a Spectroline Model EAS-1000 Electronic
Archival System (Spectronics Corporation). NIH Image 1.59 software was then used for
relative quantitation of DNA bands.
4.2.2 Development of a New Cell Lysis Solution for Releasing Genomic DNA from
Bacterial Cells for DNA Amplification by Polymerase Chain Reaction
(Abolmaaty et al., 2000)
4.2.2.1 Lysis of cell suspensions for quantitation of released DNA.
Cell suspension of E. coli O157:H7 strain prepared as described above in section
4.2.1.1. Cells suspensions of 0.2 ml containing a total of 2 x 10⁷ cells unless otherwise
stated were subjected to a variety of treatments consisting of suspending cells in d-H2O
(Weagant et al. 1994), 1% w/v Triton X-100 (TX) (Wernars et al., 1991a), 0.05% SDS
(Fluit et al., 1993), and PCR buffer containing 500 mM KCl, 100 mM Tris-HCl (pH 9.0
at 25o C) and 1% TX in d-H2O. Cell lysis was achieved by heating these cell suspensions
at 99.5oC for 10 min in a thermal cycler followed by cooling to 5oC. Cells were treated
with proteinase K as described above, and with lysozyme in combination with proteinase
K (Wiedemann et al., 1995). Proteinase K and Lysozyme were obtained from Sigma.
Treatment with proteinase K was performed by incubating cell suspensions with
proteinase K (0.8 mg / ml) in 0.2 ml of PCR buffer at 55oC for 60 min followed by
cooling to 5oC. Treatment of cells with both Lysozyme and proteinase K was performed

60
as follows: cells were suspended in 190 µl of PCR buffer containing 2.0 mg/ml of
Lysozyme. The cell suspensions were then incubated at 25oC for 15 min. Proteinase K
was then added at a final concentration of 0.2 mg / ml and the cell suspensions incubated
at 55oC for 60 min followed by cooling to 5oC. The initial new lysing solution (TZ initial)
was prepared containing 1.0% w/v Triton-X 100 (TX) plus 2.5 mg/ml of NaN3 in 0.2 M
Tris-HCl buffer at pH 7.0 unless otherwise indicted. TZ buffer was then heated at 100oC
for 20 min in a water bath and then cooled before use. A cell suspension (0.1 ml) in d-
H2O containing a total of 2.0 x 10⁷ cells was added to 0.1 ml of 2X TZ lysing solution.
The cell suspension was heated at 99.5o C for 10 min unless otherwise stated, and then
cooled to 5oC in a PCR vial within a thermocycler. The lysates were centrifuged at
10,000 g for 10 min at room temperature prior to PCR. Controls consisted of the lysing
mixtures without cells. All assays were performed at least twice and the mean values
reported. Yield of released DNA was quantitatively measured by the use of TKO 100
Mini-Fluorometer (Hoefer Scientific Ins.) as described above.
4.2.2.2. Optimization of TZ buffer
To achieve the highest yield and PCR amplification of the released DNA, TZ
initial was optimized by varying the following: pH value, incubation temperature,
incubation time, denaturation temperature and NaN3 concentration. The concentration of
NaN3 varied with the different buffer systems TX-100, PCR buffer, SDS, and Tris-HCl.
Only one parameter was varied at a time.
4.2.2.3. Purification of DNA lysates
Lysates were obtained from 100 cells in 400 µl of cell suspensions using different
lysing methods as described above. The lysates were centrifuged at 10,000 g for 10 min

61
at room temperature and the supernatants transferred to a 2.0 ml microcentrifuge vial.
Pellet paint (2 µl, Novagen) which is a visible flourescent dye-labeled carrier formulated
specifically for use in alcohol precipitation of nucleic acids was then added followed by
the addition of 40 µl of 3M Na Acetate. The samples were then briefly mixed. Two
volumes of absolute ethanol were added, the samples briefly vortexed, and then were
allowed to stand at room temperature for 2 min. The vials were then centrifuged at
10,000 g for 10 min. A pink pellet with captured DNA was visible at the bottom of the
tubes. The supernatants were removed and residual ethanol was evaporated by incubating
the vials at 75oC for 8 min. The pink pellets were resuspended in 20 µl of milli-Q water
and then the entire 20 µl transferred to 30 µl of PCR mixture in a PCR tube. PCR
protocol and Image analysis were performed as described above.
4.2.3 Optimization of PCR Conditions for the Detection of Escherichia coli O157:H7
Shiga-Like Toxin Genes
4.2.3.1 Lysis of cell suspensions prior to the amplification of DNA.
A cell suspension of E. coli O157:H7 strain C9094 was prepared as described
above in section 4.2.1.1. After harvesting, the cells were lysed prior to PCR by the use of
the new lysis solution (TZ) resulted from the optimization of TZ lysing solution (4.2.2.2)
as described earlier. Cell suspensions contained a total of 2 x 10⁷ cells, unless otherwise
stated, in 0.2 ml of TZ lysing solution. Cell lysis was achieved by heating cell
suspensions at 99.5 oC for 10 min in a thermal cycler followed by cooling to 5oC. One µl
was then subjected to PCR amplification.
62
4.2.3.2 Optimization of PCR reaction mixture for the maximum amplification.
PCR protocol and Image analysis were performed as described above.
Optimization of the PCR was performed to obtain the highest yield of amplified DNA.
Optimization of the PCR reaction mixture was performed in a final volume of 50 µl PCR
reaction mixture but with varying the concentration of one of the following components
while the others remained constant: 0.25, 0.5, 1.0, 1.5, 2.0, 2.5, 3.0, 3.5 mM of MgCl2;
0.2, 0.4, 0.6, 0.8, 1.0 mM of dNTPs; 1.25, 2.5, 3.75, 5.0, , 6.25, 7.5 U of Taq DNA
polymerase; and 0.5, 1.0, 1.2, 1.4, 1.6, 1.8 µM of each primer. After achieving the
maximum amplification, PCR was conducted with different concentrations of target
DNA to generate standard curves for both SLT-1 and SLT-2. PCR protocol and Image
analysis were performed as described above.
4.3 Development of Methodology for the Detection of E. coli O157:H7 in Ground
Beef via the Polymerase Chain Reaction.
4.3.1 Preparation of ground beef samples
4.3.1.1 Testing for the absence of E. coli O157:H7 in ground beef.
Ground beef containing 5% fat was purchased from a local retail store.
Biochemical, immunological and genotyping methods were used to examine the
purchased ground beef for the absence of E. coli and other verotoxins producing SLT-1
and SLT-2. Ten grams of ground beef samples were added to 90 ml of Tryptic Soy Broth
plus 0.5% dextrose into a stomacher bag with inserted mesh (Whirl-pak, NASCO, Fort
Atkinson, Wisconsin, USA). The stomacher bags were placed in the stomacher 400 BA
7021 (Seward, Tekmar, Cincinnati, Ohio, USA) at normal speed (230 rpm) for 90 second.
63
The homogenate was transferred to a 1 litre flask and then incubated with rotary agitation
(300 rpm) at 37oC for 24 h. Culture media was centrifuged at 1000 rpm for 3 min to
remove large debris. One loop of the supernatant was streaked onto Violet Red Bile Agar
(VRBA) plates. After incubation overnight at 37oC, typical characteristic purple colonies
were isolated with TSA slants and culture, transferred onto TSA slants which were then
incubated overnight at 37oC. The growth on these slants was tested by the following
methods: latex polystyrene beads, Spectrophotometric immuno-agglutinating assay,
ELISA assay (Ashkenazi and Cleary, 1989) for the detection of E. coli O157 serotype,
and PCR for the corresponding genes.
4.3.1.2 Inactivation of E. coli by the use of freezing and thawing process
Ground beef that tested negative for E. coli O157:H7 and other verotoxins
producing SLT-1 and SLT-2 was distributed into plastic ziplock bags in a thin layer (0.5
cm). Packed bags were frozen and thawed at least three times in liquid nitrogen and then
kept in the freezer at -20oC for future use. Aseptically, one sample was thawed and
10 g was added to 90 ml of sterile TSB+ into a stomacher bag with inserted mesh. The
stomacher bags were placed in the stomacher at normal speed (230 rpm) for 90 second.
One loop of the filtrate was streaked onto Violet red Agar plates (VRBA) which were
incubated at 37oC for 24 hours. If the freeze and thaw process was successful, these
would be no colonies on the plates after incubation. A volume of 10 ml filtrate was
transferred into 100 ml TSB+ in 250 ml baffled flasks. Flasks were then incubated for 24
hours at 37oC. The growth was tested for E.coli O157:H7 using latex polystyrene beads,
Spectrophotometric immuno-agglutinating assay, ELISA assay for SLT-1 and 2, and
PCR for VT1 and VT2 genes.

64
4.3.2 Development of methodology for the extraction of E. coli O157:H7 from
ground beef.
4.3.2.1 The effect of different extraction solutions on the turbidity of the filtrates
Ground beef samples (10g) were placed into the stomacher bags with 90 ml of
one of the following extraction solutions:
• Stomaching buffer at pH 7.0 as described in Listertest (Vicam L.P) containing 8.0
g NaCl, 1.2 g Na2HPO4, 0.2 g KH2PO4, 0.2 KCl, and 0.5 ml tween-20.
• 0.01 M KCl and 0.5 ml tween-20.
• 0.1 M of (KH2PO4, Na2HPO4, and NaCl) at pH 6.0.
• 0.01M of KH2PO4, 0.01Na2HPO4, and 0.85%NaCl at pH 7.4.
• PCR buffer (500 mM KCl, 100 mM Tris-HCl, pH 9.0, 1% Triton X-100).
The stomacher bags were placed in the stomacher at low speed (170 rpm) for 60
seconds at room temperature. The filtrates were passed through paper coffee filters using
a vacuum pump (SKH 32EG 550T, Millipore filter corporation). The filtrate’s
transparency was measured at 600 nm. The extraction solution resulting in the clearest
supernatant was selected to be used for the entire project.
4.3.2.2 Extraction of target cells with the aid of differential centrifugation and the
use of paper coffee filters.
Aseptically, 0.2 ml of cell suspension containing ~ 2 x 10⁴ cells in PBS (0.1 M
phosphate buffer saline, pH 6.0) prepared as described above was added to 10 g of
thawed ground beef. The bacterial cells were allowed to bind for 15 min in the
refrigerator at 5 to 8oC. Homogenates were prepared by stomaching 10 g of ground beef
(5% fat) with 90 ml of PBS in stomaching page at 165 rpm for 60 sec. Removal of tissue
debris was performed in three steps: first, through a paper coffee filter to remove large
tissue debris; second, at low speed centrifugation (1,000 rpm) to precipitate the medium

65
particles; and third at high speed centrifugation to precipitate target cells with small
particles. The homogenate containing bacteria was filtered through a paper coffee filter in
a sterile Buchner funnel using a vacuum pump. The filtrate was then centrifuged at 1000
rpm for 2 min at 4oC. After discarding the pellet, the supernatant was centrifuged at
10,000 rpm for 10 min at 4oC. Pellets were resuspended in 10 ml of sterile saline (0.85%
NaCl) and then 0.1 ml surface plated onto Violet Red Bile Agar (VRBA) plates. After
overnight incubation at 37oC, characteristic purple colonies were counted to determine
percent recovery of the seeded E. coli.
4.3.3 Enumeration of bacteria using pre-Enrichment media
Cell suspensions containing varying cell numbers (10, 50, 100, 200, 500 cells
prepared in 0.2 ml PBS) as described above were seeded into 10 g samples of ground
beef. Bacteria cells were allowed to bind for 15 min in the refrigerator at 5-8oC as
described above. Homogenates and filtrates were prepared using the differential
centrifugation with the aid of coffee filter method as previously described. Pellets were
resuspended in 30 ml of Tryptic Soy Broth plus 0.5% dextrose in 250 ml baffled flasks.
Flasks were incubated with rotary agitation (300 rpm) at 37oC for different periods of
incubation (3.5, 4.5 and 5.5 h). Cells were then harvested by centrifuging broth cultures
at 16,000g for 10 min at 4oC. After reresuspended the pellets in 1.0 ml of d-H2O in
microcentrifuge tubes, 0.1 ml was plated onto VRBA plates.
4.3.4 Cell lysis and DNA Purification.
Cell lysis procedure was performed using the new lysis solution (TZ) as described
earlier. For direct detection of E. coli O157:H7 in ground beef, TZ lysing buffer was
added to resuspended pellets obtained from differential centrifugation prior to PCR .
66
DNA lysates were purified with the aid of pellet paint (Nonagen) in alcohol precipitation
of nucleic acids followed by the addition of 3M Na Acetate as described above. Samples
were briefly mixed and two volumes of absolute ethanol were added, briefly vortexed and
then allowed to stand at room temperature for 2 min. The vials were centrifuged at
10,000 g for 10 min. Captured DNA resulted in a pink pellet which were visible at the
bottom of the tubes. The supernatant was carefully removed. This sequence was repeated
twice and residual ethanol was evaporated from the pellets by incubating the vials at 75oC
for 8 min. The fluorescent pellets were resuspended in 50μl of milli-Q water and 10μl
was for PCR as described above unless otherwise stated. As for an indirect detection
method for E. coli O157:H7 in ground beef via PCR, TZ lysing buffer was added to
resuspended pellets obtained from pre-enrichment media. DNA lysates were purified as
descried above prior to PCR.
4.3.5 PCR protocol and Image analysis.
The PCR protocol was performed by adding 10 μl of fluorescent pellets
suspension to the PCR mixture in a final volume of 50 μl into PCR vials. The PCR
reaction mixture contained the optimum concentration of MgCl2, Primers, dNTPs, Taq
polymerase and PCR buffer as determined by the PCR optimization study described
above. The PCR reaction mixture was overlaid with 50μl of sterile mineral oil, then the
PCR vials were placed in the thermocycler for amplification according to the thermal
protocol described by Ramotar et al. (1995). Image analysis was performed as described
earlier.

67
CHAPTER 5
RESULTS AND DISCUSSION
5.1 Development of Methodology for Quantitative Detection of E. coli O157:H7 via
Immunoassays
5.1.1 Latex agglutination assay with Red Polystyrene beads
Agglutination occurred with both boiled and none boiled E. coli O157:H7 (Fig.1)
while it did not occur with the control sample (E. coli 4O15). A cell density of
1 x 10⁸cells/ml gave the highest agglutination with non boiled cells while it was not as
distinct with boiled cells (Fig.1, Appendix.1, and Appendix.2). This may have occurred
due to the denaturation of some antigen in the cell wall and/or to unmasking of antigen
during the heating process. The highest agglutination with boiled cells was obtained with
1 x10⁷ cells/ml. Clumping between insoluble antigen and coated beads did not occur
when cell density was above 5 x 10⁸ cells/ml or less than 5 x10⁶ cells/ml. It was
concluded that this test was only an efficient qualitative assay for high concentration of
cells and limited with a narrow range of cell density (5 x10⁸ to 5 x10⁶ cells / ml).
Furthermore, it was difficult to detect cells treated with heating. Other species of E. coli
cross-react with O157 antiserum (Bettelheim et al., 1993; Corbel, 1985; Lior and
Borczyk, 1987). When other E. coli strains were tested, agglutination occurred with KY
70, KY 946, KY 945, KY 943, GE 94, and AB 1157, although it did not occur with E.
coli 4015 and E. coli G. Gervais. Therefore, isolates agglutinating in O157 antiserum or
O157 latex reagent should be identified biochemically.

68
A: Non boiled cells B: Boiled cells
Fig. 1. Latex agglutination assay titration with pathogenic E. coli O157: H7 strain
(C9490). Latex agglutination assay photographs as a result of adding 30 μl of
coat/wash buffer to 30μl of E. coli O157:H7 suspension into a single welled
microscopic slide and then adding 30μl of coated polystyrene beads. Control
consisted of 30μl of E. coli 4015 suspension (1 x 10⁸ cells/ ml) instead of E. coli
O157:H7. Different Cells densities / ml were used as shown above in the images

69
5.1.2 Quantitation of ELISA assay for the rapid detection of E.coli O157:H7 SLT-1
and SLT-2.
The pathogenicity of Escherichia coli strains O157:H7, 4015, KY 70, KY 946,
KY 945, KY 943, GE 94, and AB 1157 were studied. ELISA confirmed that all eight
strains produce both toxin (SLT-1 and SLT-2) while E. coli Gervais strain produced
neither toxins (Table.1). The ELISA assay demonstarted that the yield of SLT-1 produced
by E.coli O157:H7 was higher than SLT-2. It was clear that Shiga-like toxins 1 and 2 are
enterotoxins but they also exist outside cells in the culture media. The yield of Shiga-like
toxins 1 and 2 produced by E. coli O157:H7 strain C9490 was much higher than from
other strains (Table.2). The supernatant of the culture media yielded a volume of 2800 ml
which contained 1.8 mg of partially purified SLT-1 while the supernatant of sonicated
cells (15 ml) contained only 0.41 mg. A titration curve with different concentrations of
crude shiga like toxin was performed to determine the sensitivity of the assay (Fig.2 and
Apendix.3). A proportional relationship occurred between the concentrations of partially
purified Shiga toxin and absorbance at 490 nm with a power equation of {f (x) = a *
x0.394)}, where a = exp (-0.534) with a standard deviation of 0.972, x is the concentration
of the toxin, and f (x) is the reading at 490 nm (Fig.2). A similar pattern was obtained by
Ashkenazi and Clearly (1989) when they determined the sensitivity from a titration curve
with twofold dilutions of a known amount of purified Shiga toxin with GB3 ELISA.
Latex agglutination and ELISA assays confirmed the identity of E. coli O157:H7 strain
(C9490).

70
Table.1 ELISA assay with different strains of Escherichia coli a E. coli VT1 VT 2 Strains A490 Ave Stnd. Err A490 Ave Stnd. Err O157:H7 (C9490) 0.391 0.405 0.014 0.365 0.381 0.206 0.420 0.397 4015 0.102 0.107 0.005 0.181 0.176 0.005 0.113 0.171 KY 700 0.231 0.220 0.011 0.182 0.176 0.005 0.209 0.171 KY 946 0.267 0.260 0.007 0.270 0.265 0.005 0.253 0.260 KY 945 0.192 0.168 0.023 0.206 0.187 0.021 0.143 0.169 KY 943 0.132 0.111 0.011 0.180 0.172 0.008 0.100 0.164 GE 94 0.282 0.275 0.007 0.103 0.109 0.006 0.268 0.115 AB 1157 0.282 0.283 0.002 0.204 0.194 0.010 0.285 0.184 Gervais 0.000 0.000 0.000 0.000 0.000 0.000 0.000 0.000 a ELISA assay was performed in duplicates with 100 μl of partially purified toxin
obtained from 15 ml of sonicated cells supernatant. Readings were taken at 490 nm. Ave is the average.
Table.2 ELISA assay for SLT-1 and SLT-2 obtained from E. coli O157:H7a. Toxin A490 A490 Ave.1 b Ave.2 c Stnd. err Control 0.00 0.00 0.00 0.00 0.00 SLT 1 Supernatant 0.563 0.493 0.528 0.460 0.035 0.460 0.421 0.441 0.361 0.462 0.412 Lysates 0.960 0.891 0.925 0.914 0.018 0.921 0.955 0.938
0.862 0.896 0.879
SLT 2 Supernatant 0.034 0.026 0.030 0.033 0.003 0.046 0.032 0.039 0.21 0.037 0.029 Lysates 0.295 0.286 0.291 0.345 .028 0.325 0.410 0.367 0.345 0.412 0.378 a same as table 2, b Ave.1 = average of duplicate data, c Ave.2 = average of the means

71
0.3
0.4
0.5
0.6
0.7
0.8
0.9
1
0 1 2 3 4 5
AB
SO
RB
AN
CE
AT
490
nm
CRUDE TOXIN (ug / well))
1.0
f(x) = a * (x^3.939234E-1 ),wherea = exp(-5.339821E-1 )R^2 = 9.720104E-1
Power Equation
Fig. 2. ELISA titration curve with partially purified VT1 extracted from
E. coli O157:H7. Absorbance was taken at 490 nm in triplicate using a cuvet
capacity of 0.5 ml. ELISA assay was performed with 100 μl of partially
purified toxin obtained from 15 ml of sonicated cells supernatant. 100-μl of the
final reaction mixture was transferred into the cuvet and then 300 μl of 1 N
H2SO4 was added. Readings were normalized using the dilution factor of 4. The
control reading was taken using the ELISA negative control. Inserted is curve
fitting with power equation.

72
5.1.3 Quantitative determination of rabbit's anti E. coli O157 via
Spectrophotometric Immuno-agglutination Assay.
5.1.3.1 Effect of cell concentration on rate of agglutination
Antigen antibody reaction was studied by mixing local rabbits' antiserum diluted
to 1:16 in PBS with different cell concentrations (1 x 10² to 1 x 10⁹) cells/ml). The rates
of increase in absorbance at 600 nm corresponding with antigen antibody reaction were
measured as described in Appendix.5. The final reading was calculated as shown in
Appendix.5, by subtracting the absorbance of the control from sample's reading at 600
nm at different time of incubation. The rates of increase in absorbance at 600 nm
reflecting agglutination were enhanced with higher cell concentrations up to 2.5 x 10⁸
cells/ml (Fig.3 and Appendix.5). A maximum response was observed with 2.5 x 10⁸
cells/ml (Fig.3 and Appendix.5). When an antiserum dilution of 1/16 was mixed with 5 x
108 cells / ml the absorbance rose slightly during the first 6 min, then the antigen
antibody complex could no longer hold the suspension that much causing it to decrease.
There was no evident detection of the antigen antibody reaction for cell densities between
1 x 10² to 1 x 10⁶ cells / ml. The antigen antibody complex with 1 x 10⁹ cells / ml failed to
keep cells in suspension showing a remarkable decrease in absorbance (Fig.3 and
Appendix.5). A linear relationship of the antigen antibody reaction occurred when
antiserum dilution of 1/16 was mixed with 7.5 x 10⁷ , 5 x 10⁷ , 1 x 10⁷ cells / ml and
incubated for 20 min at 40oC ( Fig.3). With cell density of 2.5 x 10⁸ / ml a linear pattern
occurred only for the first 10 min of the reaction. These data indicated that the cell
density between 2.5 x 10⁸ to 5 x 10⁷ cells / ml could be used successfully for more studies
of the kinetics of antigen antibody reaction.

73
5.1.3.2 Effect of antiserum concentration on the rate of agglutination
Dilution of antiserum had a notable effect on the increase in absorbance as a
reflection of agglutinating activity. Agglutination activity refers to the rate of increase in
absorbance at 600 nm per min in 2 ml of antibody-antigen reaction mixture.
Agglutination activity was obtained from initial slopes of the original data (Appendixes;
6-a, 6-b, and 6-c). Rates of agglutination consistently decreased when antiserum was
diluted from 1/16 to 1/512 with cell concentrations of 2.5 x 10⁸, 1 x 10⁸, 7.5 x 10⁷, and
5 x 10⁷/ml as shown in Fig. 4. The relationships between agglutinating activity,
antiserum dilution, and cell concentrations are summarized in Fig. 4. This data indicates
that agglutination activity had an ascending pattern with increasing cell numbers and
antiserum concentration. Among all various cell densities and antiserum dilutions,
Spectrophotometric immuno-Agglutination assay gave an ideal linear pattern with a cell
density of 1 x 10⁸ plus 1/32 antiserum dilution. Therefore, this reaction mixture was
selected for the next studies on antigen antibody reaction kinetics. It is of interest that
with high antiserum dilutions (1/64 and 1/256), agglutination could be detected
spectrophotometrically, whereas the slide agglutination test failed to yield visual
agglutination with all four cell concentrations used with antiserum dilutions of 1/64 and
above (Table. 3). Specific agglutination activity is defined as the increase in absorbance
per min at 600 nm divided by the μg of E coli O157 specific IgG per 2 ml of antibody-
antigen reaction mixture.

74
Table.3 Titration of rabbit's anti E. coli O157 using slide agglutination assay∗.
Antiserum Cell density /ml
Dilution 1 x 10⁹ 2.5 x 10⁸ 1 x 10⁸ 7.5 x 10⁷ 5 x 10⁷ 1 x 10⁷
1- 0 ++++ +++ ++ + - -
1- 2 ++++ ++++ +++ ++ + -
1- 4 +++ +++ +++ ++ + -
1- 8 + ++ ++ ++ + -
1- 16 + + + + - -
1- 32 - + + + - -
1- 64 - - - - - -
1- 128 - - - - - -
1- 256 - - - - - -
1- 512 - - - - - -
1- 1024 - - - - - -
* A serial dilution of Rabbits' anti E.coli O157 was prepared in PBS as mentioned above.
Slide agglutination assay was conducted by mixing 0.1 ml of each antiserum
dilution with 0.1 ml of different densities of cells suspension using nine-well glass
titer plates followed by rotary agitation at 78 rpm for 10 min at room temperature.
Agglutination was then recorded using a visual scale of -, +, +, ++, +++, and
++++, with - being no agglutination.
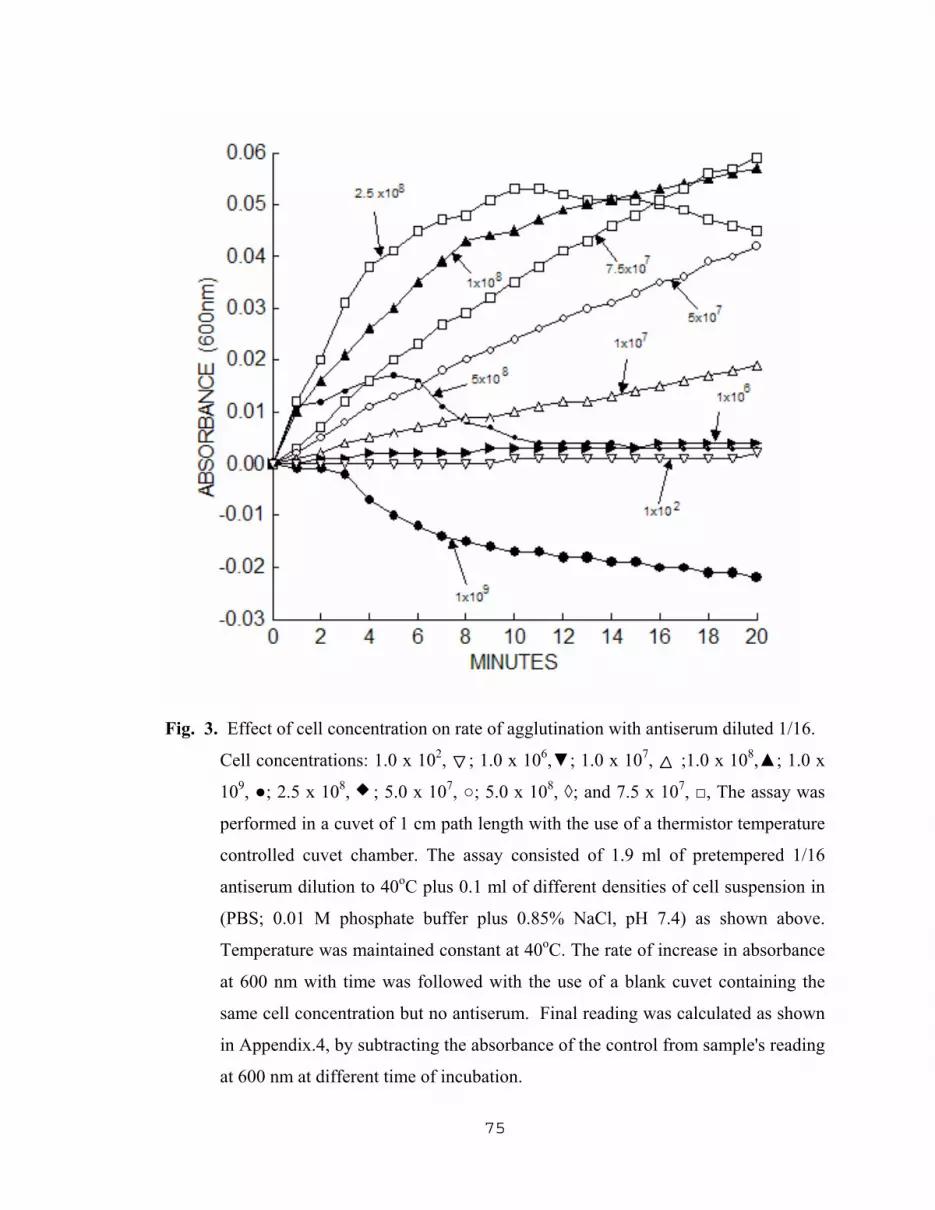
75
Fig. 3. Effect of cell concentration on rate of agglutination with antiserum diluted 1/16. Cell concentrations: 1.0 x 10², ; 1.0 x 10⁶,▼; 1.0 x 10⁷, ;1.0 x 10⁸,▲; 1.0 x
109, ●; 2.5 x 10⁸, ; 5.0 x 10⁷, ○; 5.0 x 10⁸, ◊; and 7.5 x 10⁷, □, The assay was
performed in a cuvet of 1 cm path length with the use of a thermistor temperature
controlled cuvet chamber. The assay consisted of 1.9 ml of pretempered 1/16
antiserum dilution to 40oC plus 0.1 ml of different densities of cell suspension in
(PBS; 0.01 M phosphate buffer plus 0.85% NaCl, pH 7.4) as shown above.
Temperature was maintained constant at 40oC. The rate of increase in absorbance
at 600 nm with time was followed with the use of a blank cuvet containing the
same cell concentration but no antiserum. Final reading was calculated as shown
in Appendix.4, by subtracting the absorbance of the control from sample's reading
at 600 nm at different time of incubation.

76
Fig. 4. The relationship between agglutination activity, antiserum dilution, and cell
concentration. Data points derived from initial slopes obtained from
appendixes; 6-a, 6-b, and 6-c. Assay was performed as described in the legend of
Fig.3.

77
5.1.3.3 Effect of temperature on agglutination activity
Maximum or near maximum agglutination with a linear relationship occurred at
30oC, 35oC, and 40oC when the temperature of antigen antibody reaction mixture was
varied (Fig.5). At 50oC and 55oC agglutination did not occur. At 60oC a notable
decrease in absorbance occurred due to rapid precipitation and settling of thermally
denatured proteins. Inserted Fig.5 derived from the primary data indicates that the
optimum incubation temperature for Spectrophotometric Immuno Agglutination assay is
40oC.
5.1.3.4 Effect of wavelength on observed rates of agglutination
Near linear rates of agglutination were obtained when the wavelength was varied
from 450 to 750 nm (Fig.6). The slope however was maximum at 550 nm and least at
750 nm. The slope at 600 nm was 14% less than at 550 nm. Therefore, the optimum
wave length for Spectrophotometric immuno Agglutination assay was found to be
550 nm.
5.1.3.5 Effect of pH, phosphate buffer (PB) and NaCl concentration on agglutination
activity
The optimum pH for agglutinating activity was found to be 7.4 (Fig. 7). We
assessed the optimum phosphate puffer concentration at pH 7.4 with 0.05% NaCl present
with each buffer concentration and found that 0.1M phosphate buffer significantly
inhibited agglutination (Fig. 8). The insert (Fig. 8) derived from the primary data
indicates that 0.005M PB is optimum. The concentration of NaCl was also found to be
critical. Concentrations of 1 and 5% NaCl were found to notably inhibit agglutination

78
while 0.04% and 0.2% yielded maximum and near maximum rates of agglutination
respectively (Fig. 9).
Fig. 5. Effect of temperature on agglutination activity.
The assay consisted of mixing 0.1 ml of 1 x 10⁸ cells/ml with 1.9 ml of 1/32
pretempered antiserum dilution containing 3.3 μg of E. coli O157 IgG in a final
volume of 2.0 ml in a cuvet of 1 cm path length. Antiserum dilution was
pretempered to appropriate temperature before adding the cells. The cell
suspension and antiserum dilution were prepared in PBS (0.01 M phosphate
buffer plus 0.85% NaCl, pH 7.4). The designated temperature remained constant.
The rate of increase in absorbance at 600 nm with time was followed with the use
of a blank cuvet containing the same cell concentration but no antiserum. Data
points in inserted figure derived from initial slopes of main plots.

79
Fig. 6. Effect of wave length on agglutination activity.
Spectrophotometric Immuno-agglutination Assay was conducted as described in
the legend of Fig. 6 except temperature was constant at 40oC and the wave length
varied. The rate of increase in absorbance with time was followed at different
wave lengths as shown above with the use of a blank cuvet containing the same
cell concentration but no antiserum. Data points in inserted figure derived from
initial slopes of main plots.

80
Fig. 7. Effect of pH on agglutination activity.
Spectrophotometric Immuno-agglutination Assay was performed as described in
the legend of Fig. 6 except the wave length was constant at 550 nm and the rate of
increase in absorbance with time was followed at 550 nm at different pH values as
shown above. The assay was conducted with the use of a blank cuvet containing
the same cell concentration but no antiserum. Data points in inserted figure
derived from initial slopes of main plots.

81
Fig. 8. Effect of phosphate buffer concentration on agglutination activity.
Spectrophotometric Immuno-agglutination Assay was performed as described in
the legend of Fig. 8 except the cell suspension and antiserum dilution were
prepared in different concentrations of PBS plus 0.85% NaCl at pH 7.4). The rate
of increase in absorbance at 550 nm with time was followed with the use of a
blank cuvet containing the same cell concentration but no antiserum. Data points
in inserted figure derived from initial slopes of main plots.

82
Fig. 9. Effect of NaCl concentration on agglutination activity.
Spectrophotometric Immuno-agglutination Assay was performed as described in
the legend of Fig. 8 except the cell suspension and antiserum dilution was
prepared in PBS (0.005 M plus different concentrations of NaCl) at pH 7.4. The
rate of increase in absorbance at 550 nm with time was followed with the use of a
blank cuvet containing the same cell concentration but no antiserum. Data points
in inserted figure derived from initial slopes of main plots.

83
5.1.3.6. Content of specific E. coli O157 IgG in crude antiserum.
When crude antiserum was mixed with varying numbers of cells no additional
binding of IgG occurred from 1 x 10⁸ to 5 x10⁸ cells /ml (Table 4). These results
indicated that all IgG specific for E. coli O157 antigen had been bound at these cell
concentrations. E. coli O157 (bound and unbound to IgG) were removed by filtration
through 0.2μ membrane; and then the filtrate was passed through protein A agarose
column followed by washing the column with 10 volumes of binding buffer (0.02 M
NaH2PO4, 0.15 M NaCl, and 0.025 NaN3). The Bound antibodies were eluted with 0.2 M
Na2HPO4 plus 0.1 M citric acid, pH 3.0 and 2.0 ml fractions collected. Protein content of
the eluted fractions was determined. The amount of specific IgG bound to the cells was
calculated by subtracting the amount of protein in the eluted fractions from the protein
content of control fraction which obtained from antiserum without cells (Table 4). The
content of specific E. coli O157 IgG in the crude antiserum was found to be 167 mg/0.1
ml (Table 4). A quantitative linear relationship was obtained for agglutination when the
absorbance increase at 7 min was plotted against antiserum dilutions with 1 x 10⁸ cells /
ml (Fig. 10).

84
Table.4 Quantitative binding of specific E. coli O157 IgG in crude antiserum by varying cell concentrations. a NO. cells per ml IgG bound ( μg)
5 x 10⁶ 56.1 + 20.1
5 x 10⁷ 107 + 4.3
1 x 10⁸
167 + 0.3
5 x 10⁸ 167 + 0.1
a Cell suspensions (1.9 ml) were mixed with 0.1 ml of antiserum to yield a final volume
of 2.0 ml.

85
Fig. 10. The relationship between agglutination activity and antiserum concentration
with 1 x 10⁸ cells / ml. Data points derived from the increase in absorbance after
7 min of incubation. The assay consisted of mixing 0.1 ml of 1 x 10⁸ cells/ml with
1.9 ml of 1/32 antiserum dilution pretempered to 40oC containing 3.3 μg of E. coli
O157 IgG in a final volume of 2.0 ml in a cuvet of 1 cm path length. Cell
suspension and antiserum dilution were prepared in PBS (0.005 M phosphate
buffer plus 0.05% NaCl, pH 7.4). Temperature remained constant. The rate of
increase in absorbance at 550 nm with time was followed with the use of a blank
cuvet containing the same cell concentration but no antiserum.

86
5.1.3.7 Rate of agglutination activity with affinity purified IgG.
Affinity purified IgG was found to yield a perfectly linear relationship between
the increase in absorbance at 550 nm and the reaction time during the first 14 min of
incubation (Fig. 11).
0
0.01
0.02
0.03
0.04
0 2 4 6 8 10 12 14
AB
SO
RB
AN
CE
(55
0 nm
)
MINUTES
0.0
Fig. 11. Rate of agglutination activity with affinity purified antibody.
Agglutination activity was determined with 1 x 10⁸ cells/ ml, and purified rabbit's
anti E. coli O157 (3.3 μg IgG/ml), equivalent to 1/32 dilution of crude antiserum,
at 40oC, and in 0.005 M PB containing 0.05% NaCl at pH 7.4 in a final volume of
2.0 ml. The rate of increase in absorbance at 550 nm with time was followed with
the use of a blank cuvet containing the same cell concentration but no antiserum.

87
5.1.3.8 Quantitative determination of specific rabbit's anti E. coli O157 via the
Spectrophotometric immuno-agglutination assay.
Five rabbits (LVN0, LVN1, LVN2, LVN3, and LVN4) were used to produce anti
E. coli O157. The first bleeding, performed 14 days after the intradermal injection along
the back with 10 x 0.05 c.c. of 4 x 10⁹ cell suspension in sterile 0.85% NaCl containing
0.05% Al(OH)3 as adjuvant showed a low immune response (Fig.13 and tables 5 through
9). A low response usually occurs during the early stages of primary immune response
because only antibodies of the IgM class are produced (Stills, 1994). When the cell
density of the injection dose was increased to 4 x 10¹⁰cells/ml the quantity of rabbits'
antibody increased dramatically (Fig. 12). Yield of anti E.coli O157 obtained from LVN1
was the highest among the rabbits and yielded twice as much as the commercial IgG
obtained from Difco Laboratories (Fig. 12).
Due to the normal variation in the animals producing the antibody, there was
variation in the affinity and the quantity of polyclonal antibody (Fig. 13) which was also
mentioned by Canadian Council on Animal Care (2002). A similar pattern occurred with
slide agglutination assay but it was less sensitive as shown in Appendix 7 (a, b, c, and d)
and Appendix 8 (a, b, c, and d). High concentrations of anti E.coli O157 above 1/64 were
detected quantitatively via Spectrophotometric Immuno-agglutination assay while it was
not observed qualitatively with slide agglutination assay.
Detection of specific anti E. coli O157 was made easy by Spectrophotometric
Immuno-agglutination assay. Instead of having a table full of data to describe the strength
of an antibody based on visual observation (Appendixes 4, 7 and 8) , which usually vary
from person to person, Spectrophotometric Immuno-agglutination assay was a rapid,
convenient and inexpensive Spectrophotometric agglutination assay for determining the

88
concentration in crude antisera of IgG specific for the somatic antigen of E. coli O157.
The assay is based on the rate of increase in absorbance (agglutination activity) using a
known concentration of bacterial cells, spans an absorbance range from 0 to 0.06
absorbance units, and is able to quantitate 13 to 104 mg IgG/ml of specific E. coli O157
IgG per ml of crude antiserum. The assay is notably more sensitive than slide
agglutination. Optimum conditions of the assay are: 1 x 10⁸ cells / ml, 40oC, and 0.005M
phosphate buffer (PB) containing 0.05% NaCl at pH 7.4. We have found the assay useful
for measuring the concentration of O157 specific IgG (µg/ml) in different batches of
crude antisera for a period of one year (Tables 5 through 9). We anticipate that the assay
can be readily adapted for the quantitation of IgG's specific for other antigens and for use
with other bacterial species.

89
0
1000
2000
3000
4000
0
1000
2000
3000
4000
comm
meth #1
meth #2
Commercial IgG
Cell conc. of
4 x 10 /ml
Cell conc. of
4 x 10 / ml
9
10
Fig. 12. Yield of rabbit's anti E. coli O157 as a result of injecting different cell
concentrations of cell suspension versus the commercial IgG. Rabbits were
intradermal injected along the back with 10 x 0.05 c.c. of a cell suspension in
sterile 0.85% NaCl containing 0.05% Al(OH)3 as adjuvant. The assay consisted of
mixing 0.1 ml of 1 x 10⁸cells/ml with 1.9 ml of the antiserum pretempered to
40oC in a final volume of 2.0 ml in a cuvet of 1 cm path length. Cell suspension
and antiserum dilutions were prepared in PBS (0.005 M phosphate buffer plus
0.05% NaCl, pH 7.4). Temperature remained constant. The rate of increase in
absorbance at 550 nm with time was followed with the use of a blank cuvet
containing the same cell concentration but no antiserum.

90
Table.5 Quantitative determination of rabbit's anti E.coli O157 (µg/ml) in LVN1 antiserum via Spectrophotometric Immuno-Agglutination assay*
Times of Absorbance at 550 nm after 7 min at 40oC µg specific IgG
Bleeding A B C D E F G
0-time 0.282 0.495 0.495 0.000 0.000 0.000 0.000
0.281 0.490 0.490 0.000
1-st 0.264 0.297 0.333 0.036 0.039 150.34 1503.4
0.266 0.293 0.335 0.042
2-nd 0.264 0.292 0.337 0.042 0.044 229.16 2291.6
0.266 0.295 0.338 0.043
3-rd 0.264 0.338 0.389 0.051 0.052 274.21 2742.1
0.266 0.334 0.387 0.053
4-th 0.265 0.370 0.437 0.067 0.068 364.3 3643.0
0.266 0.381 0.450 0.069
5-th 0.264 0.366 0.435 0.069 0.067 358.94 3589.4
0.264 0.367 0.432 0.065
6-th 0.264 0.350 0.418 0.068 0.068 364.3 3643.0
0.265 0.349 0.419 0.068
∗ Spectrophotometric Immuno-Agglutination assay was performed by mixing 0.1 ml of
1 x 10⁸ cells/ml with 1.9 ml of the antiserum pretempered to 40oC in a final
volume of 2.0 ml in a cuvet of 1 cm path length. Cell suspension and antiserum
dilution were prepared in PBS (0.005 M phosphate buffer plus 0.05% NaCl, pH
7.4). Temperature was remained constant. The rate of increase in absorbance at
550 nm with time was followed with the use of a blank cuvet containing the same
cell concentration but no antiserum.
A: A 550 just before adding IgG, B: A 550 nm immediately after adding IgG,
C: A 550 taken 7 min after B, D: The difference (C - B), E: average of D,
F: μg of specific IgG / 2.0 ml of Ab-Ag reaction mixture, G: μg of specific IgG /
ml of crude IgG.

91
Table.6 Quantitative determination of rabbit's anti E.coli O157 (µg/ml) in LVN2 antiserum via Spectrophotometric Immuno-Agglutination assay∗
Time of Absorbance at 550 nm after 7 min at 40oC µg specific IgG
Bleeding A B C D E F G
0-time 0.272 0.490 0.490 0.000 0.000 0.000 0.000
0.271 0.485 0.485 0.000
1-st 0.272 0.300 0.315 0.015 0.015 68.53 685.3
0.271 0.310 0.326 0.016
2-nd 0.272 0.315 0.339 0.024 0.024 116.55 1165.5
0.275 0.317 0.341 0.024
3-rd 0.271 0.303 0.333 0.030 0.028 138.51 1385.1
0.270 0.297 0.323 0.026
4-th 0.275 0.321 0.349 0.028 0.030 156.47 1564.7
0.277 0.315 0.347 0.032
Table.7 Quantitative determination of rabbit's anti E.coli O157 (µg/ml) in LVN3 antiserum via Spectrophotometric Immuno-Agglutination assay*
Times of Absorbance at 550 nm after 7 min at 40C µg specific IgG
Bleeding A B C D E F G
0-time 0.266 0.269 0.269 0.000 0.000 0.000 0.000
0.265 0.268 0.268 0.000 0.000
1-st 0.267 0.265 0.285 0.020 0.019 88.400 884.00
0.268 0.265 0.284 0.019
2-nd 0.269 0.277 0.303 0.026 0.026 127.81 1278.1
0.268 0.277 0.304 0.027
3-rd 0.266 0.280 0.311 0.031 0.030 150.34 1503.4
0.265 0.280 0.310 0.030
4-th 0.266 0.300 0.337 0.037 0.037 189.75 1897.5
0.270 0.303 0.341 0.038
∗ see legend to Table 6.

92
Table.8 Quantitative determination of rabbit's anti E.coli O157 (µg/ml) in LVN0 antiserum via Spectrophotometric Immuno-Agglutination assay∗
Times of Absorbance at 550 nm after 7 min at 40C µg specific IgG
Bleeding A B C D E F G
0-time 0.232 0.237 0.237 0.000 0.000 0.000 0.0000
0.233 0.238 0.238 0.000
1-st 0.234 0.238 0.260 0.022 0.020 93.47 934.7
0.233 0.238 0.256 0.018
2-nd 0.233 0.259 0.287 0.028 0.028 139.08 1390.8
0.231 0.258 0.287 0.029
3-rd 0.236 0.060 0.289 0.029 0.029 144.71 1447.1
0.234 0.260 0.290 0.0030
4-th 0.236 0.256 0.289 0.033 0.034 172.3 1723.0
0.238 0.257 0.292 0.035
Table.9 Quantitative determination of rabbit's anti E.coli O157 (µg/ml) in LVN4 antiserum via Spectrophotometric Immuno-Agglutination assay∗
Times of Absorbance at 550 nm after 7 min at 40oC µg specific IgG
Bleeding A B C D E F G
0-time 0.265 0.470 0.470 0.000 0.000 0.000 0.000
0.266 0.472 0.472 0.000
1-st 0.272 0.451 0.467 0.016 0.016 71.51 715.1
0.271 0.457 0.474 0.017
2-nd 0.270 0.323 0.353 0.030 0.028 144.71 1447.1
0.271 0.324 0.350 0.026
3-rd 0.271 0.341 0.374 0.033 0.033 167.23 1672.3
0.272 0.349 0.383 0.034
4-th 0.265 0.303 0.342 0.039 0.038 195.38 1953.8
0.268 0.308 0.346 0.038
∗ see legend to Table 6 .

93
0
1000
2000
3000
4000
0 1 2 3 4 5 6
TIME Of BLEEDING
LVN. 2
LVN.0
LVN.1
Fig. 13. Yield of rabbit's anti E. coli O157 at different times of bleeding.
Spectrophotometric Immuno-Agglutination assay was performed as described in
Fig. 6. Rabbits were intradermal injected along the back with 10 x 0.05 c.c. of a
cell suspension of 4 x 10¹⁰ cells/ml in sterile 0.85% NaCl containing 0.05%
Al(OH)3 as adjuvant The rate of increase in absorbance at 550 nm with time was
followed with the use of a blank cuvet containing the same cell concentration but
no antiserum. Rabbits were injected with 4x10⁹ cells/ml. Data points derived
from final data in tables 6, 7, and 10.
YIE
LD O
F A
NTI
E. C
OLI
O15
7 (µ
g / m
l)

94
5.2. Development of Methodology for the Detection of E. coli O157:H7 via the
Polymerase Chain Reaction (PCR).
5.2.1 Effect of lysing methods and their variables on the yield of Escherichia coli
O157: H7 DNA and its PCR amplification
5.2.1.1 Spectrophotometric assay for kinetics of cell lysis.
When cells were treated with lysozyme at 25oC, an increase in absorbance
occurred during the first 2 min (Fig. 14A). Lysozyme facilitates bacterial cell lysis by
degradation of the peptidoglycan layer of the cell wall. Since the peptidoglycan layer is
less substantial in gram-negative bacteria than in gram- positive bacteria (Gannon et al.,
1992) this may cause an initial swelling as a result of spheroplast formation. Higher
increases in absorbance occurred with increasing concentrations of lysozyme (Fig. 14A).
The effect of lysozyme on aged cells was insignificant compared to that on young cells
(Fig. 14A). A notable decrease in absorbance was observed when cells were treated with
proteinase K indicating cell lysis (Fig. 14B). Cells treated with lysozyme (10 mg/ml) for
15 min at 25oC and then held at 55oC exhibited no decrease in absorbance (Fig. 14C).
When cells were treated with both lysozyme (10 mg/ml) and proteinase K (0.2 mg / ml) a
near linear decrease in absorbance occurred during the first 20 min at 55oC (Fig. 14C).
As seen in Fig. 14A, cell treated with 1 mg/ml of lysozyme had an increase in absorbance
and plateau at 14 min. That was notably less than with 10 mg/ml of lysozyme. Cells
treated with 1 mg lysozyme plus proteinase K (0.2 mg / ml) had a slower rate of decrease
in absorbance and reached the same final absorbance value after 20 min at 55oC as cells
treated with 10 mg / ml lysozyme plus proteinase K (Fig. 14C). A comparison of Fig.
14B with Fig. 14C indicates that lysozyme treatment in conjunction with proteinase K
treatment offers no advantage over treatment with just proteinase K for achieving
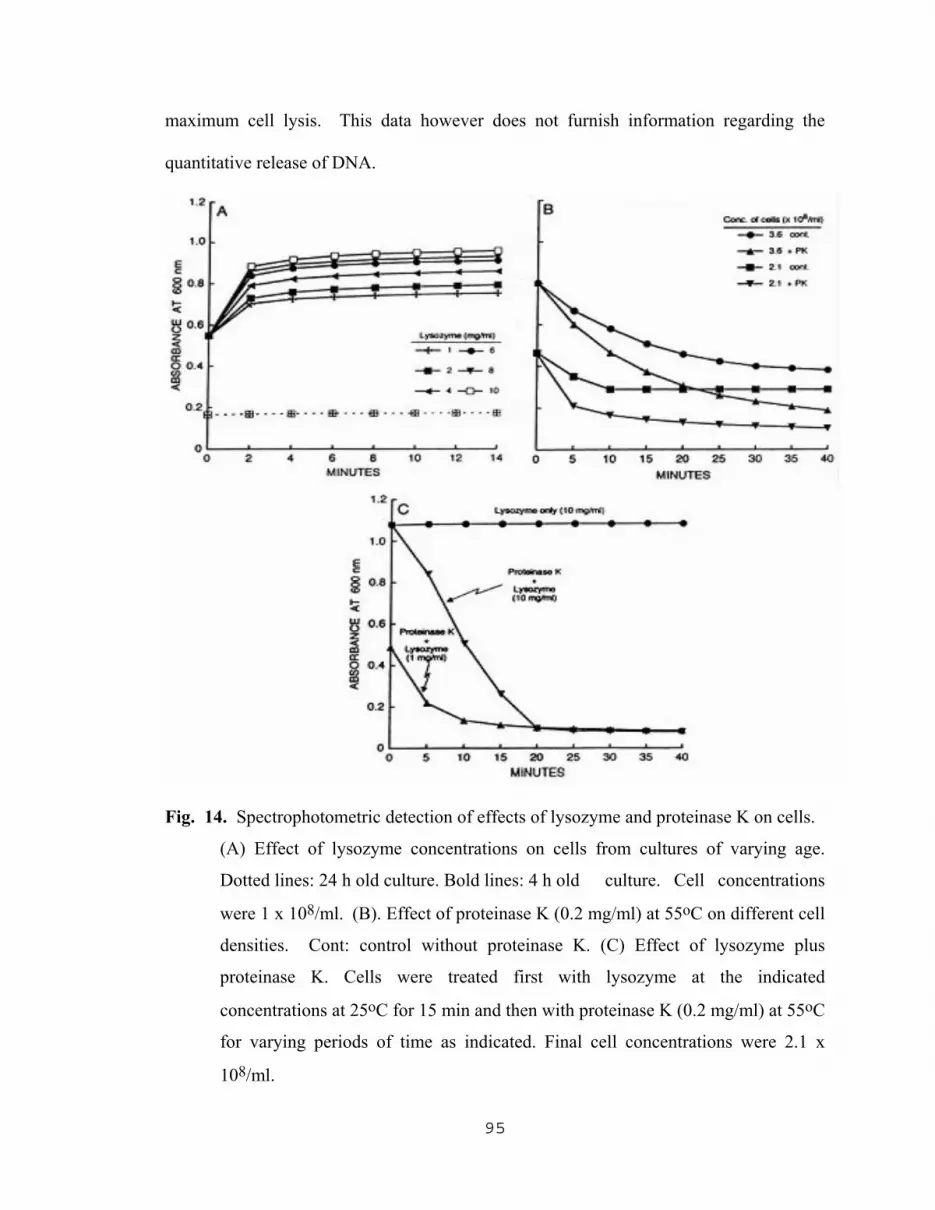
95
maximum cell lysis. This data however does not furnish information regarding the
quantitative release of DNA.
Fig. 14. Spectrophotometric detection of effects of lysozyme and proteinase K on cells.
(A) Effect of lysozyme concentrations on cells from cultures of varying age.
Dotted lines: 24 h old culture. Bold lines: 4 h old culture. Cell concentrations
were 1 x 10⁸/ml. (B). Effect of proteinase K (0.2 mg/ml) at 55oC on different cell
densities. Cont: control without proteinase K. (C) Effect of lysozyme plus
proteinase K. Cells were treated first with lysozyme at the indicated
concentrations at 25oC for 15 min and then with proteinase K (0.2 mg/ml) at 55oC
for varying periods of time as indicated. Final cell concentrations were 2.1 x
108/ml.
96
5.2.1.2 Effect of culture age on the yield of DNA
The yield of DNA following enzymatic treatment of cells was affected by culture
age (Fig. 15A, B, and C). The cells from a 4 h old culture gave a consistently higher
yield of DNA than a 24 h old culture (Fig. 15A, B, and C). The results also indicated that
the enzyme concentration yielding the maximum amount of DNA varied with the age of
the cells. With lysozyme treatment alone, the maximum yield of DNA was achieved with
8 mg/ml of lysozyme with young cells (Fig. 15A). With Proteinase K treatment alone, the
maximum yield of DNA was achieved with 0.8 mg / ml with young cells and with 0.1 mg
/ ml with old cells (Fig. 15B). When cells were first treated with lysozyme and then with
proteinase K the maximum yield of DNA with young cells was achieved with 2 mg/ml of
lysozyme plus 0.8 mg of proteinase K / ml (Fig. 15C).
With aged cells the maximum yield of DNA was with 6 mg/ml of lysozyme plus
0.1 mg of proteinase K / ml (Fig. 15C). A comparison of the data plotted in Fig. 15B and
16C indicates that treatment of young and aged cells with both lysozyme (2 mg/ml) and
proteinase K (0.8 mg / ml) yielded higher levels of DNA than treatment with just
proteinase K (0.8 mg / ml) alone. When young cells were treated with lysozyme (2
mg/ml) for 15 min followed by treatment with proteinase K (0.8 mg / ml) and incubated
for different intervals of time, DNA yield increased during the first 40 min reaching the
maximum at 45 min of incubation at 55oC and subsequent heating at 99.5oC for 10 min
(Fig. 16).
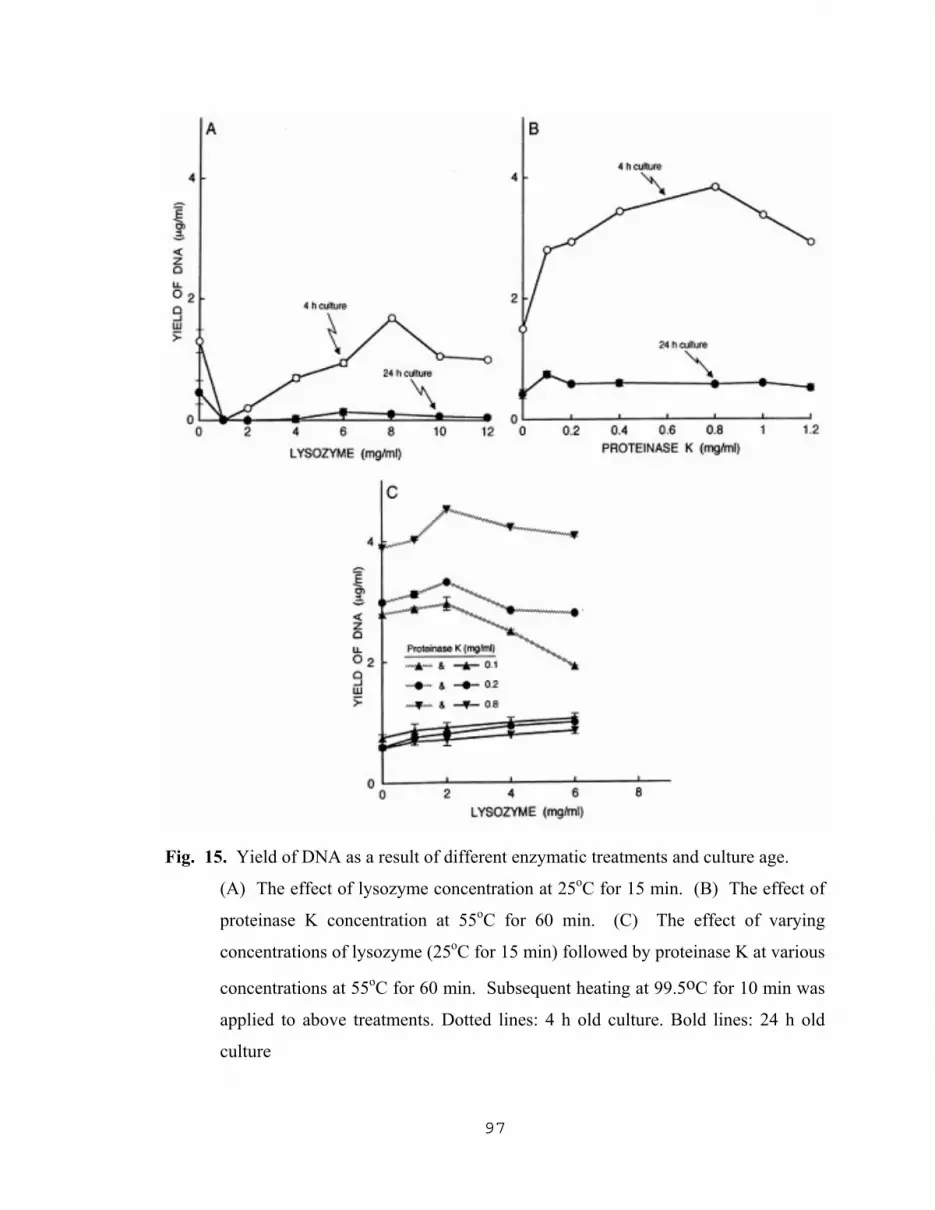
97
Fig. 15. Yield of DNA as a result of different enzymatic treatments and culture age.
(A) The effect of lysozyme concentration at 25oC for 15 min. (B) The effect of
proteinase K concentration at 55oC for 60 min. (C) The effect of varying
concentrations of lysozyme (25oC for 15 min) followed by proteinase K at various
concentrations at 55oC for 60 min. Subsequent heating at 99.5oC for 10 min was
applied to above treatments. Dotted lines: 4 h old culture. Bold lines: 24 h old
culture

98
Fig. 16. Yield of DNA as a function of incubation time with proteinase K.
Cells were first treated with lysozyme (2 mg/ml) for 15 min at 25oC followed by
treatment with proteinase K (0.8 mg / ml) at 55oC for the indicated periods of time
and then subsequent heating at 99.5oC for 10 min.

99
5.2.1.3 Effect of incubation temperature with both lysozyme and proteinase K on the
yield of DNA
The influence of incubation temperature with both lysozyme and proteinase K
was examined. When cells were treated with lysozyme (2 mg/ml) for 15 min at various
temperatures followed by treatment with proteinase K (0.8 mg / ml) at 55oC for 45 min
the yield of DNA was maximum at 37oC, slightly lower at 25oC, and was notably lower
at 45oC and above (Fig. 17A). When cells were treated with lysozyme (2 mg/ml) at
25oC for 15 min followed by treatment with proteinase K (0.8 mg / ml) at various
temperatures for 45 min, the highest yield of DNA was obtained at 55oC (Fig. 17B).
5.2.1.4 Effect of cell density and proteinase K concentration on the yield of DNA
When cell suspensions of varying cell densities (2.0 x 10⁸ to 14 x 108/ml) were
treated with lysozyme (2 mg/ml) for 15 min at 25oC followed by treatment with varying
proteinase K concentrations (0.1, 0.2, 0.4, and 0.8 mg / ml) higher cell concentrations
required higher levels of proteinase K in order to obtain maximum yields of DNA (Fig.
18).
With a cell density greater than 1 x 10⁹ / ml, 0.8 mg of proteinase K / ml were
required for maximum DNA release whereas with low cell densities (2 x 10⁸ cells/ml or
lower) reduced levels of proteinase K sufficed to achieve near maximum DNA release
(Fig. 18). The resulting plots were linear at the lower cell concentrations (2-6 x 10⁸/ml).
As a result of optimizing the enzymatic treatments, cells treated with lysozyme (2 mg/ml)
at 25oC for 15 min followed by proteinase K (0.8 mg / ml) at 55oC for 45 min yielded a
higher amount of DNA (Fig. 15C and Fig. 16) with an increase of 23.3% compared to the

100
proteinase K concentration (0.2 mg / ml) and incubation time (60 min) recommended by
(Wiedemann et al., 1995). When cells were treated only with Proteinase K, an increasing
rate of 30.66% occurred with 0.8 mg of proteinase K / ml cell suspension (Fig. 15B).

101
02468 02468
YIELD OF DNA ( ug / ml )
TEM
PE
RA
TUR
E
3
5 C
45
C
55
C
65 C
7
5 C
oo
oo
o
B
02468 02468 YIELD OF DNA (ug/ml)
TEM
PE
RA
TUR
E
25 C
37
C
45 C
5
0 C
5
5 C
oo
oo
o
A Fig.
17.
Inf
luen
ce o
f in
cuba
tion
tem
pera
ture
on
the
yiel
d of
DN
A r
esul
ting
from
the
treat
men
t of
cells
with
lyso
zym
e fo
llow
ed b
y tre
atm
ent w
ith p
rote
inas
e K
. (A
) Eff
ect o
f inc
ubat
ion
tem
pera
ture
on
lyso
zym
e (2
mg/
ml)
treat
men
t for
15
min
follo
wed
by
treat
men
t with
pro
tein
ase
K (0
.8 m
g / m
l)
at 5
5oC
for 4
5 m
in.
(B) E
ffec
t of i
ncub
atio
n te
mpe
ratu
re o
n pr
otei
nase
K (0
.8 m
g / m
l) tre
atm
ent
for 4
5 m
in fo
llow
ing
treat
men
t with
lyso
zym
e at
25o
C fo
r 15
min
.

102
Fig. 18. The effect of cell density and proteinase K concentration on the yield of DNA.
Cells were first treated with lysozyme (2 mg/ml) at 25oC for 15 min followed by
treatment with varying concentrations of proteinase K at 55oC for 60 min.
5.2.1.5 Comparison of DNA yields with different cell treatment methods
The yield of released DNA increased in the following order of cell treatment:
lysozyme, distilled water, PCR buffer, SDS, TX, proteinase K, and lysozyme plus
proteinase K (Fig. 19A and B). Heating lysozyme treated cells at 94.5oC for 10 min
Proteinase K (mg / ml)
▲ 0.8 ■ 0.2
● 0.4 ▼ 0.1

103
failed to release detectable DNA (Fig. 19B). Heating lysozyme treated cells at 99.5oC for
10 min released only a slight amount of DNA (Fig. 19B). Heating treated cells at 99.5oC
was uniformly more efficient than heating at 94.5C for releasing DNA (Fig. 19B). The
maximum yield of DNA was achieved when cells were first treated with lysozyme and
then with proteinase K (Fig. 19B)
5.2.1.6 The effect of lysing methods on PCR products
Digital image analysis of DNA bands following agarose gel electrophoresis after
40 cycles of PCR can be seen in (Figs. 20, 21, and 22). Three methods of cell treatment
(PCR buffer, proteinase K, and lysozyme plus proteinase K) yielded high levels of DNA
amplification as shown in Fig. 20.
PCR results confirmed that lysozyme and proteinase K inhibit Taq polymerase
although they released higher yields of DNA than did the use of only PCR buffer (Fig.
19A and B)). In addition, the use of proteinase K and lysozyme plus proteinase K require
one hour more than simply heating cells in PCR buffer to release DNA. Treatment with
TX and SDS inhibited Taq polymerase (Fig. 20) although they released slightly higher
yields of DNA than did heating in PCR buffer (Fig. 19A). Greater amplification resulted
when cells were heated in SDS and PCR buffer than heating in distilled water (Fig. 20).

104
0246810 0246810 YIELD OF DNA (ug/ml)
LYS
ING
ME
THO
DS
d.
H O
P
CR
-B
SD
S
TX
-100
A
2
0246810 0246810 YIELD OF DNA ( ug / ml )
LYS
ING
ME
THO
DS
94.5
C
99.5
C
Lys.
C
ont.
P
K
L
ys.+
PK
Hea
ting
tem
pera
ture
oo
B
Fig.
19
. Ef
fect
of l
ysin
g m
etho
ds o
n th
e yi
eld
of D
NA
. (A
) Non
enz
ymat
ic m
etho
ds: c
ells
wer
e he
ated
at 9
9.5
o C fo
r 10
min
in d
iffer
ent m
enst
rua
as fo
llow
s:
DW
: dis
tille
d w
ater
, P: P
CR
buf
fer,
SDS:
0.0
5 %
SD
S, a
nd
TX: 1
% T
riton
X-1
00.
(B) E
nzym
atic
met
hods
: L: c
ells
trea
ted
only
with
lyso
zym
e (2
mg/
ml f
or 1
5 m
in a
t
25o C
). K
: Cel
ls tr
eate
d on
ly w
ith p
rote
inas
e K
(0.8
mg
/ ml)
for 4
5 m
in a
t 55o C
, LK
: cel
ls tr
eate
d w
ith
lyso
zym
e (2
mg/
ml)
for 1
5 m
in a
t 25o C
follo
wed
by
treat
men
t with
pro
tein
ase
K (0
.8 m
g / m
l) fo
r 45
min
at
55o C
. A
fter e
nzym
atic
trea
tmen
t, ce
lls w
ere
heat
ed a
t the
des
igna
ted
tem
pera
ture
s for
10
min
.
DW
P
SD
S
T
X
L
P
K
L
K

105
Fig. 20. Effect of different lysing methods on PCR amplification products and image
analysis of DNA bands. Bar graphs of relative areas and intensity of DNA bands
have been rearranged and placed in ascending order. Protocols for cell treatment
and lysis are the same as in Figure 19 except that final heating of cells was at
99.5oC for 10 min. after each cell treatment and then 1 μl subjected to PCR
amplification according to Ramotar et al., 1995. Bar graphs are the mean values
with standard deviations derived from three different cell cultures. DNA bands
and their integrated peak areas are representative of a typical agarose gel.
L TX DW SDS LK P K
LYSING METHODS
RE
LATI
VE
FLU
OR
ES
CE
NC
E IN
TEN
SIT
Y

106
5.2.1.7 Yield of PCR products as the result of optimization of proteinase K lysing
method
When cells were treated with just proteinase K (0.1, 0.2, 0.4, and 0.8 mg / ml) the
maximum yield of amplified DNA was obtained with 0.8 mg (Fig. 21). A similar pattern
of DNA yield was observed as a result of varying the concentration of proteinase K (Fig
15 b).
When cells were treated with lysozyme (2 mg/ml at 25oC for 15 min) and
followed by treatment with proteinase K (0.8 mg / ml) at a constant temperature of 55o C
for intervals that varied in 15 min increments from 15 min to 90 min (Fig. 22), 15 min
resulted in slightly less than a maximum yield of amplified DNA while 30 and 45 min at
resulted in maximum yields of amplified DNA and more than 45 min was of no particular
advantage.
Gannon et al., (1992) found that boiling of cell suspensions in distilled water less
efficient than other lysing methods, although it can provide satisfactory levels of DNA
amplification with high cell concentrations. Gannon et al., (1992) also found that boiled
material subjected to PCR produced multiple DNA bands with some samples. Maximum
DNA amplification occurred when cells were first treated with lysozyme (2 mg/ml, 25oC
for 15 min) and then with proteinase K (0.8 mg / ml, 55oC for 45 min) followed by
heating at 99.5oC for 10 min (Fig. 22). It is of interest to note that the highest values for
both DNA released from cells and amplified DNA products were achieved at 45 min of
incubation with proteinase K when cells were first treated with lysozyme. The most
effective methods for lysing cells in order to achieve a maximum yield of released DNA
and amplification occurred with PCR buffer and proteinase K. Dickinson et al. (1995),

107
found that with Yersinia enterocolitica., increasing the proteinase K concentration
achieved a high level of sensitivity for detection of amplified target DNA.
The results indicate that for the direct amplification of released target DNA there are
no advantages to the enzymatic treatment of cells compared to heating cells in PCR
buffer at 99.5oC. The greater yield of target DNA resulting from enzyme treatment is
negated by the partial inhibition of the PCR due to the presence of either lysozyme or
proteinase K even after their denaturation at 99.5oC. only 1 μL of cell lysates was
amplified in an attempt to eliminate inhibition by lysozyme and proteinase K. Maximum
amplification, following enzymatic treatment of cells and lysis, can be expected only
after the target DNA has been subjected to purification
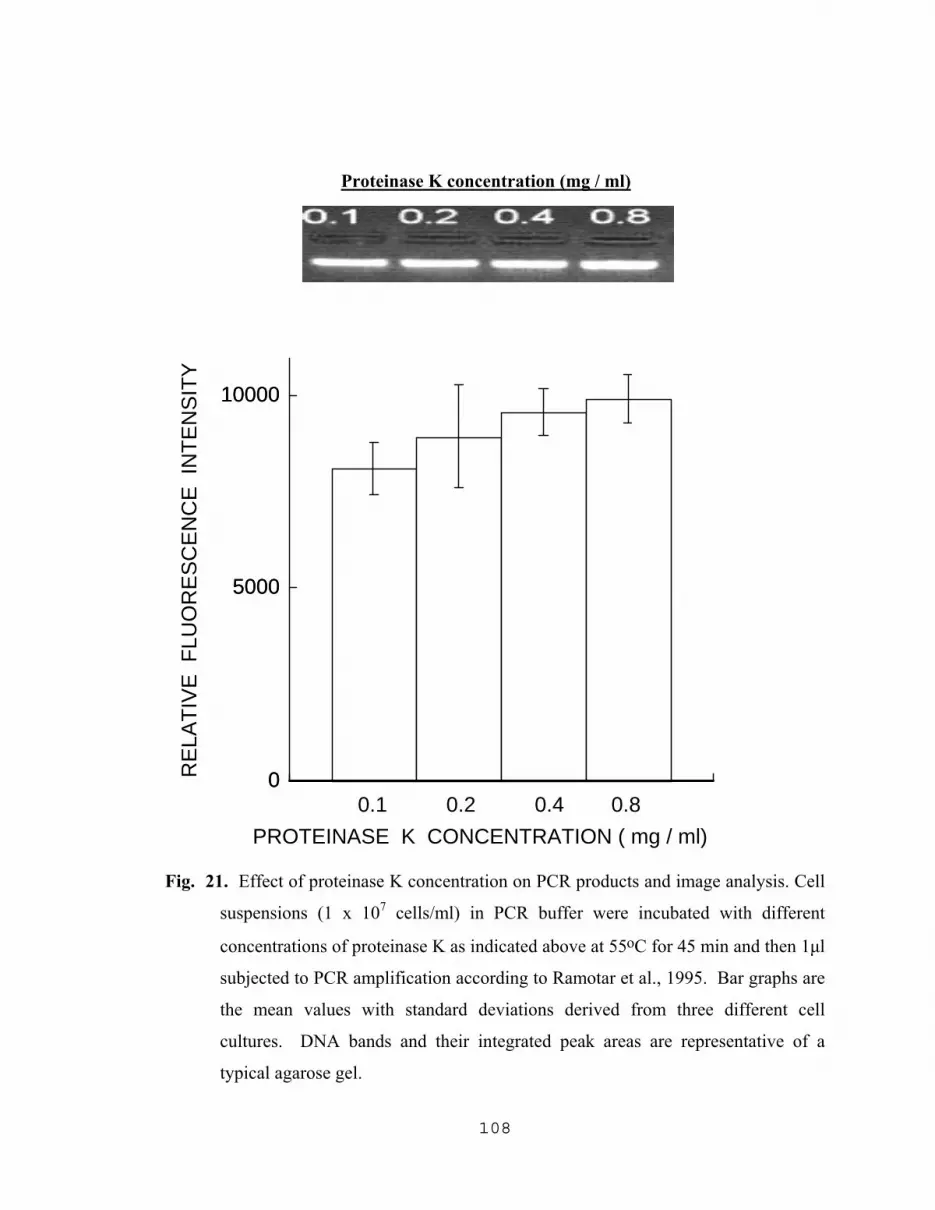
108
0
5000
10000
0
5000
10000
RE
LATI
VE
AR
EA
PROTEINASE K CONCENTRATION ( mg / ml) 0.1 0.2 0.4 0.8
Fig. 21. Effect of proteinase K concentration on PCR products and image analysis. Cell
suspensions (1 x 10⁷ cells/ml) in PCR buffer were incubated with different
concentrations of proteinase K as indicated above at 55oC for 45 min and then 1μl
subjected to PCR amplification according to Ramotar et al., 1995. Bar graphs are
the mean values with standard deviations derived from three different cell
cultures. DNA bands and their integrated peak areas are representative of a
typical agarose gel.
Proteinase K concentration (mg / ml) R
ELA
TIV
E F
LUO
RE
SC
EN
CE
IN
TEN
SIT
Y

109
0
5000
10000
0
5000
10000
RE
LATI
VE
AR
EA
MINUTES
15 30 45 60 75 90
1000
500
0.00
Fig. 22. Effect of incubation time with proteinase K, of cells treated with lysozyme, on
PCR amplification. Cells were first treated with lysozyme (2 mg/ml) at 25oC for
15 min followed by treatment with proteinase K (0.8 mg / ml) for the times
intervals at 55oC. Lysates was heated at 99.5oC for 10 min and then 1 μl
subjected to PCR amplification according to Ramotar et al., 1995. Bar graphs are
the mean values with standard deviations derived from three different cell
cultures. DNA bands and their integrated peak areas are representative of a
typical agarose gel.
RE
LATI
VE
FLU
OR
ES
CE
NC
E IN
TEN
SIT
Y
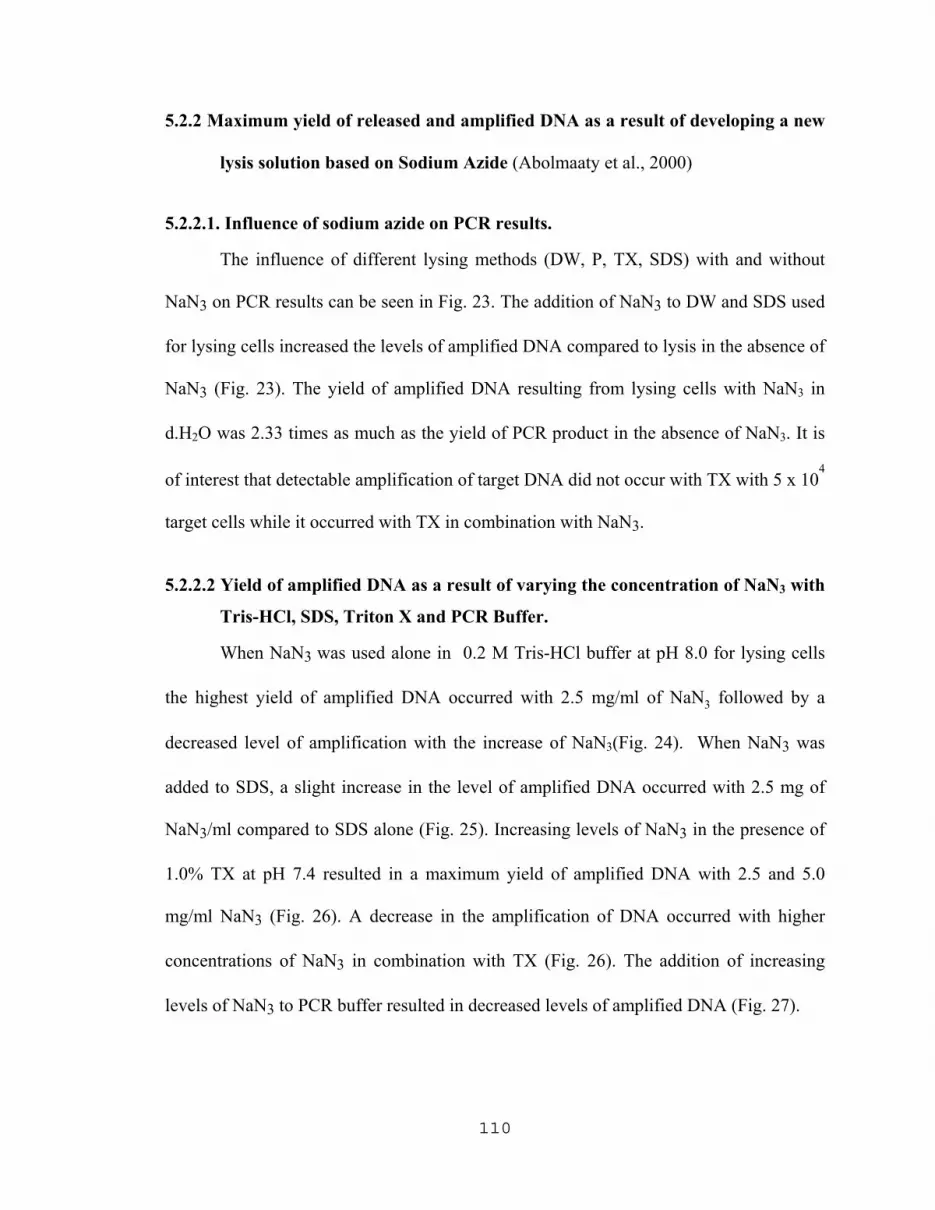
110
5.2.2 Maximum yield of released and amplified DNA as a result of developing a new
lysis solution based on Sodium Azide (Abolmaaty et al., 2000)
5.2.2.1. Influence of sodium azide on PCR results.
The influence of different lysing methods (DW, P, TX, SDS) with and without
NaN3 on PCR results can be seen in Fig. 23. The addition of NaN3 to DW and SDS used
for lysing cells increased the levels of amplified DNA compared to lysis in the absence of
NaN3 (Fig. 23). The yield of amplified DNA resulting from lysing cells with NaN3 in
d.H2O was 2.33 times as much as the yield of PCR product in the absence of NaN3. It is
of interest that detectable amplification of target DNA did not occur with TX with 5 x 10⁴
target cells while it occurred with TX in combination with NaN3.
5.2.2.2 Yield of amplified DNA as a result of varying the concentration of NaN3 with
Tris-HCl, SDS, Triton X and PCR Buffer.
When NaN3 was used alone in 0.2 M Tris-HCl buffer at pH 8.0 for lysing cells
the highest yield of amplified DNA occurred with 2.5 mg/ml of NaN3 followed by a
decreased level of amplification with the increase of NaN3(Fig. 24). When NaN3 was
added to SDS, a slight increase in the level of amplified DNA occurred with 2.5 mg of
NaN3/ml compared to SDS alone (Fig. 25). Increasing levels of NaN3 in the presence of
1.0% TX at pH 7.4 resulted in a maximum yield of amplified DNA with 2.5 and 5.0
mg/ml NaN3 (Fig. 26). A decrease in the amplification of DNA occurred with higher
concentrations of NaN3 in combination with TX (Fig. 26). The addition of increasing
levels of NaN3 to PCR buffer resulted in decreased levels of amplified DNA (Fig. 27).

111
Fig. 23. Effect of NaN3 with different lysing methods on PCR amplification of target
DNA. Cell suspensions of 0.2 ml containing a total of 2 x 10⁷ cells were subjected
to a variety of lysis treatments consisting of suspending cells in d-H2O (DW), d-
H2O plus 5.0 mg/ml of NaN3 (Z), PCR buffer (P), and PCR buffer plus 5.0 mg/ml
of NaN3 (PZ), 1% Triton X-100 (TX), 1% Triton X-100 plus 5.0 mg/ml of NaN3
at pH 7.4 (TZ initial), 0.05% SDS (SDS), 0.05% SDS plus 5.0 mg/ml of NaN3
(SDZ), Cell lysis was achieved by heating these cell suspensions at 99.5oC for 10
min in a thermal cycler followed by cooling to 5oC. One µl was then subjected to
PCR amplification according to Ramotar et al., 1995. Bar graphs represent the
mean values with standard deviations derived from two different experiments.
DNA bands and their integrated peak areas represent a typical agarose gel.
RE
LATI
VE
FLU
OR
ES
CE
NC
EIN
TEN
SIT
Y
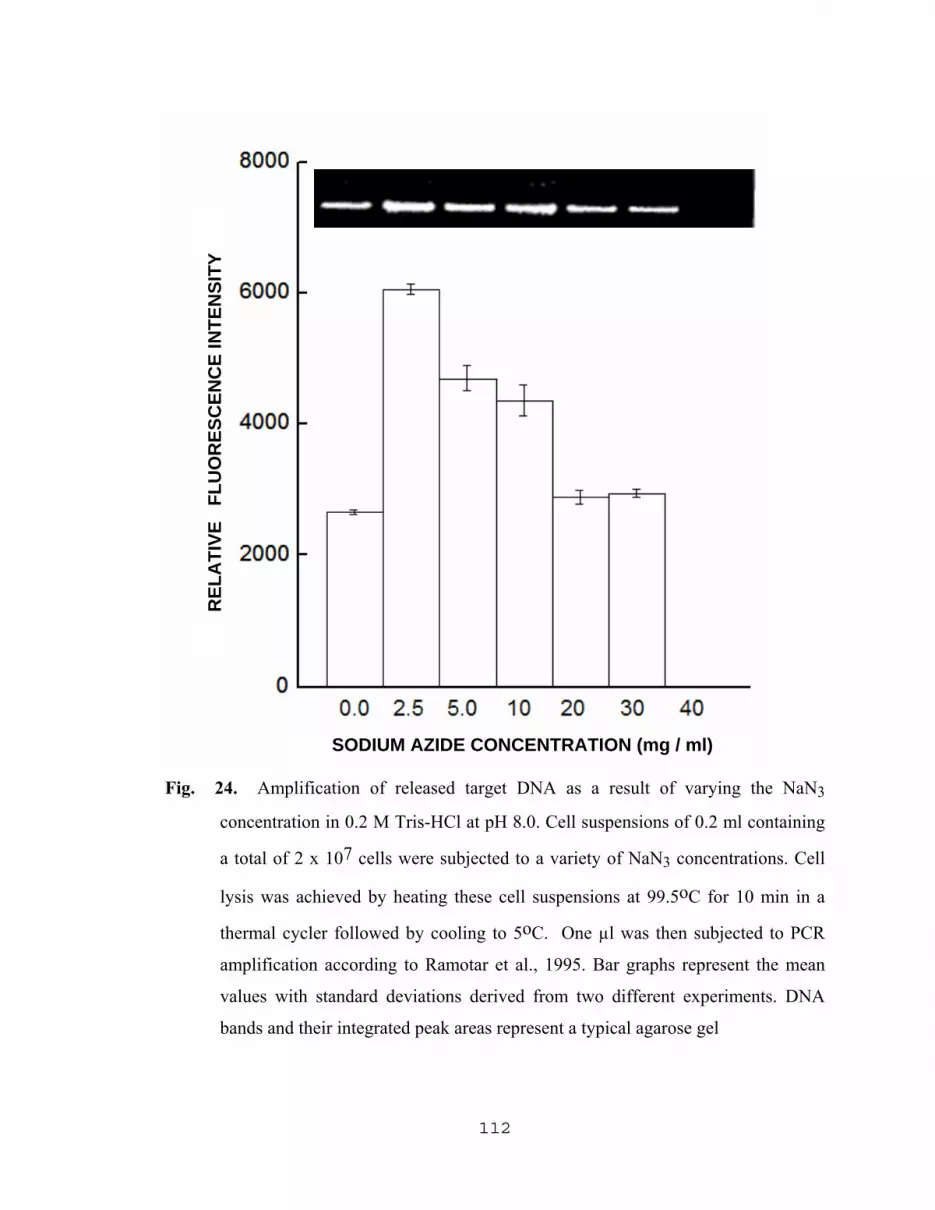
112
Fig. 24. Amplification of released target DNA as a result of varying the NaN3
concentration in 0.2 M Tris-HCl at pH 8.0. Cell suspensions of 0.2 ml containing
a total of 2 x 10⁷ cells were subjected to a variety of NaN3 concentrations. Cell
lysis was achieved by heating these cell suspensions at 99.5oC for 10 min in a
thermal cycler followed by cooling to 5oC. One µl was then subjected to PCR
amplification according to Ramotar et al., 1995. Bar graphs represent the mean
values with standard deviations derived from two different experiments. DNA
bands and their integrated peak areas represent a typical agarose gel
SODIUM AZIDE CONCENTRATION (mg / ml)
REL
ATI
VE
FLU
OR
ESC
ENC
E IN
TEN
SITY

113
Fig. 25. Amplification of released DNA as a result of varying the NaN3 concentration in
SDS. Cells suspensions of 0.2 ml containing a total of x 107 cells were subjected
to a variety of NaN3 concentrations in 0.05% SDS. Cell lysis was achieved by
heating these cell suspensions at 99.5oC for 10 min in a thermal cycler followed
by cooling to 5oC. One µl then was subjected to PCR amplification according to
Ramotar et al., 1995. Bar graphs represent the mean values with standard
deviations derived from two different experiments. DNA bands and their
integrated peak areas represent a typical agarose gel.
SODIUM AZIDE CONCENTRATION (mg / ml)
REL
ATI
VE F
LUO
RES
CEN
CE
INTE
NSI
TY

114
0
2000
4000
6000
8000
10000
0
2000
4000
6000
8000
10000
RE
LATI
VE
AR
EA
0.0 2.5 5.0 10 20 30SODIUM AZIDE CONCENTRATION ( g/ml)μ
Fig. 26. Amplification of released DNA as a result of varying the NaN3 concentration in
Triton-X 100 (TX). Cells suspensions of 0.2 ml containing a total of 2 x 10⁷ cells
were subjected to 1.0% w/v Triton-X 100 (TX) but with various NaN3
concentrations as above. Cell lysis was achieved by heating these cell suspensions
at 99.5oC for 10 min in a thermal cycler followed by cooling to 5oC. One µl was
then subjected to PCR amplification according to Ramotar et al, 1995. Bar graphs
represent the mean values with standard deviations derived from three different
experiments. DNA bands and their integrated peak areas represent a typical
agarose gel.
SODIUM AZIDE CONCENTRATION (mg / ml)
REL
ATI
VE F
LUO
RES
CEN
CE
INTE
NSI
TY

115
Fig. 27. Amplification of released DNA as a result of lysing cells in PCR buffer with
varying NaN3 concentrations. Cell suspensions of 0.2 ml containing a total of 2 x
107 cells were subjected to a variety of NaN3 concentrations in PCR buffer. Cell
lysis was achieved by heating these cell suspensions at 99.5oC for 10 min in a
thermal cycler followed by cooling to 5oC. One µl was then subjected to PCR
amplification according to Ramotar et al., 1995. Bar graphs represent the mean
values with standard deviations derived from three different experiments. DNA
bands and their integrated peak areas represent a typical agarose gel.
SODIUM AZIDE CONCENTRATION (mg / ml)
REL
ATI
VE F
LUO
RES
CEN
CE
INTE
NSI
TY

116
5.2.2.3 Effect of pH of TZ lysing solution on the level of amplified DNA.
PCR results were influenced by the pH value of the TZ lysing solution. The
highest yield of amplified DNA with the TZ lysing solution occurred at a pH 8.0 (Fig.
28). As the pH value increased, a dramatic decrease occurred in the level of amplified
DNA.
5.2.2.4 Effect of lysis temperature of TZ lysing solution on the level of amplified
DNA.
The temperature during lysis with TZ lysing solution influenced the PCR results.
Maximum levels of amplified DNA occurred when the cells were lysed at 65oC followed
by a linear decrease with the increase of lysis temperature until it reached the minimum
at 95oC and then a dramatic increase approaching the maximum occurred at 99.5oC (Fig.
29).
5.2.2.5. Effect of pH, and concentrations of TX and NaN3 in TZ lysing solution on
the yield of DNA.
When pH was varied, the highest yield of DNA released from cells was obtained
with TZ adjusted to a pH of 8.0 (Fig. 30a). These results are consistent with the effect of
pH on PCR results (Fig. 28). Increasing levels of TX in the presence of 2.5 mg of NaN3
at pH 8.0 resulted in a maximum yield of released DNA with 2.0% TX (Fig. 30b). At a
pH 8.0 and 2% TX, varying the concentrations of NaN3 resulted in a maximum yield of
released DNA with 2.5 mg/ml of NaN3 followed by a dramatic decrease in the yield of
DNA with the increased concentrations of NaN3 (Fig. 30c).
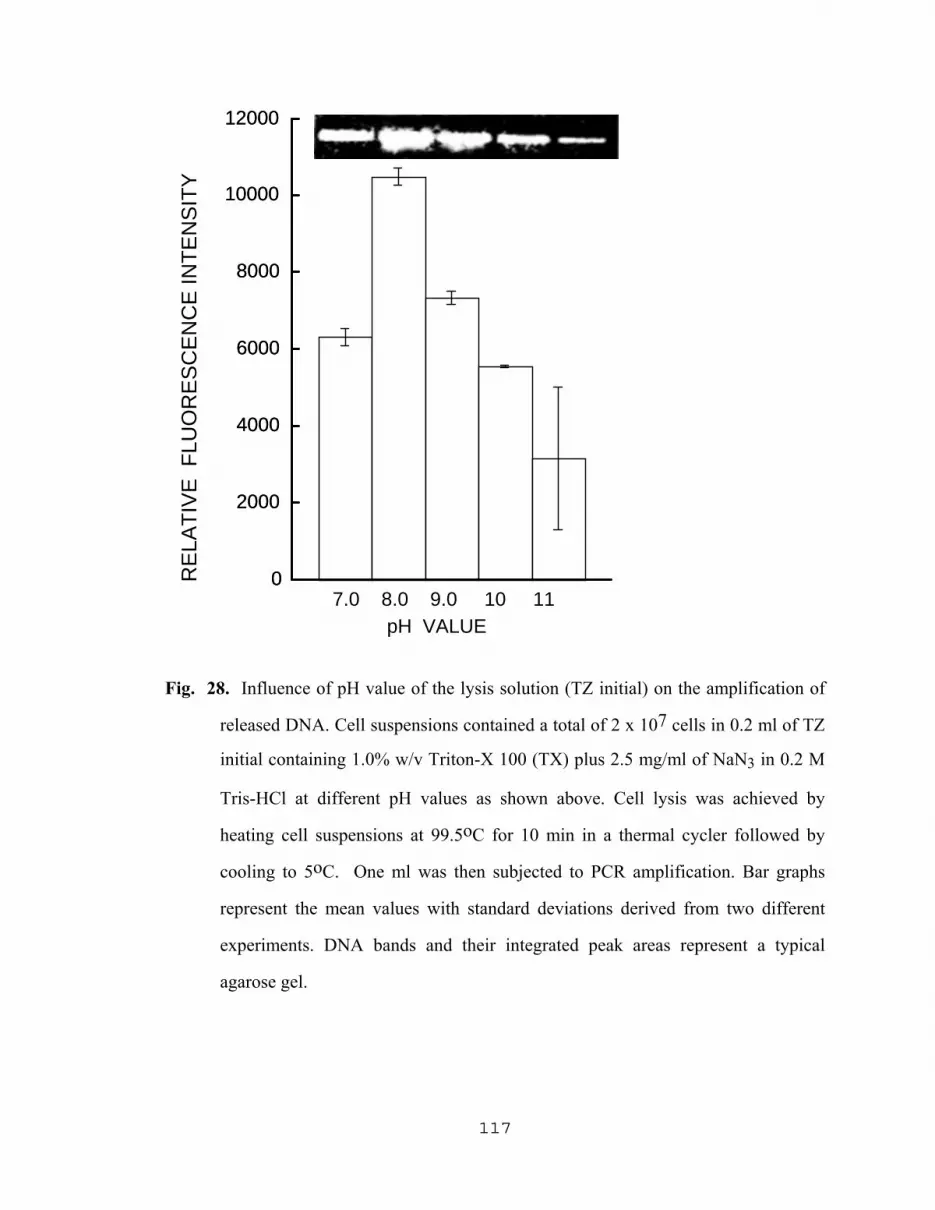
117
0
2000
4000
6000
8000
10000
12000
0
2000
4000
6000
8000
10000
12000
RE
LATI
VE
AR
EA
7.0 8.0 9.0 10 11pH VALUE
Fig. 28. Influence of pH value of the lysis solution (TZ initial) on the amplification of
released DNA. Cell suspensions contained a total of 2 x 10⁷ cells in 0.2 ml of TZ
initial containing 1.0% w/v Triton-X 100 (TX) plus 2.5 mg/ml of NaN3 in 0.2 M
Tris-HCl at different pH values as shown above. Cell lysis was achieved by
heating cell suspensions at 99.5oC for 10 min in a thermal cycler followed by
cooling to 5oC. One ml was then subjected to PCR amplification. Bar graphs
represent the mean values with standard deviations derived from two different
experiments. DNA bands and their integrated peak areas represent a typical
agarose gel.
RE
LATI
VE
FLU
OR
ES
CE
NC
E IN
TEN
SIT
Y
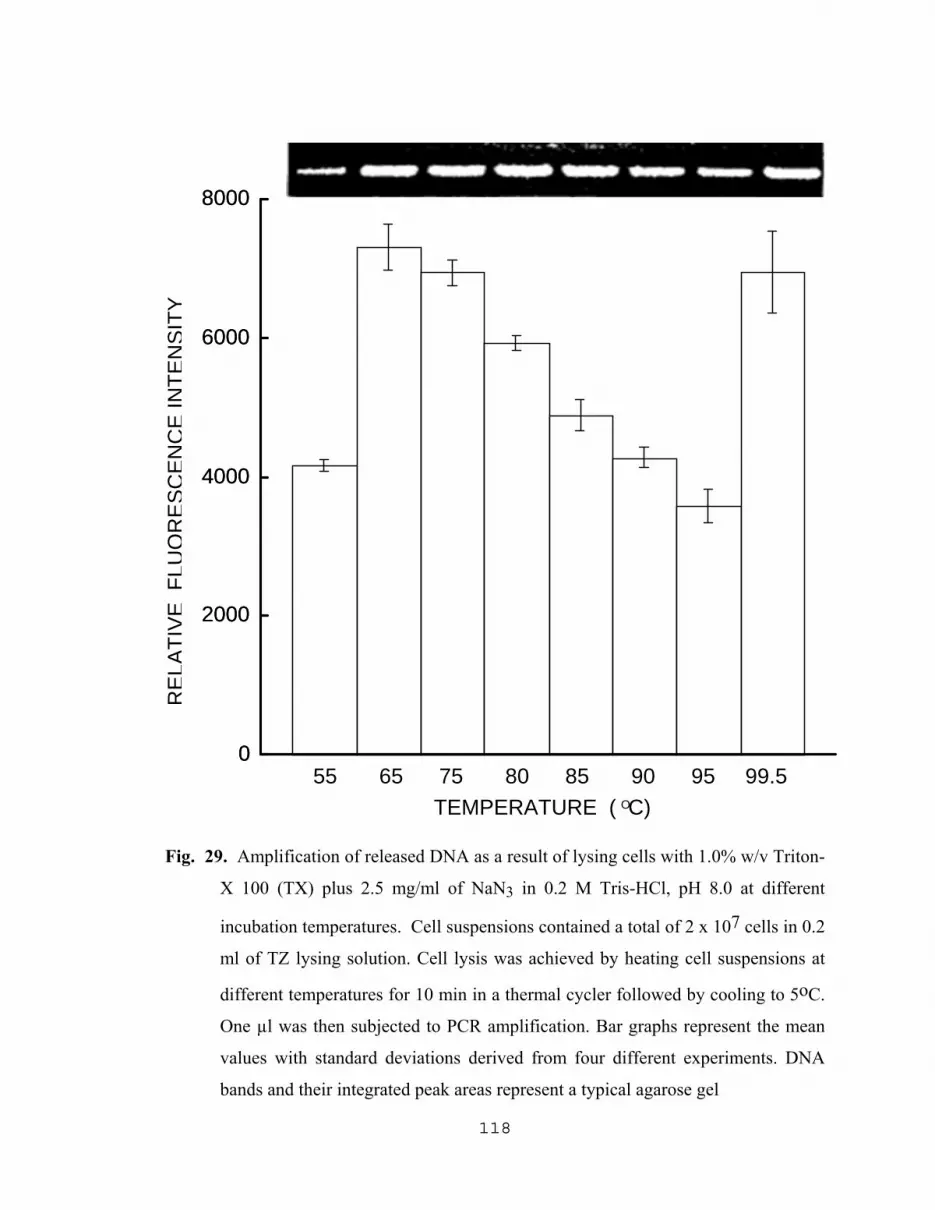
118
0
2000
4000
6000
8000
0
2000
4000
6000
8000R
ELA
TIV
E A
RE
A
55 65 75 80 85 90 95 99.5TEMPERATURE ( C)O
Fig. 29. Amplification of released DNA as a result of lysing cells with 1.0% w/v Triton-
X 100 (TX) plus 2.5 mg/ml of NaN3 in 0.2 M Tris-HCl, pH 8.0 at different
incubation temperatures. Cell suspensions contained a total of 2 x 10⁷ cells in 0.2
ml of TZ lysing solution. Cell lysis was achieved by heating cell suspensions at
different temperatures for 10 min in a thermal cycler followed by cooling to 5oC.
One µl was then subjected to PCR amplification. Bar graphs represent the mean
values with standard deviations derived from four different experiments. DNA
bands and their integrated peak areas represent a typical agarose gel
R
ELA
TIV
EFL
UO
RE
SC
EN
CE
INTE
NS
ITY
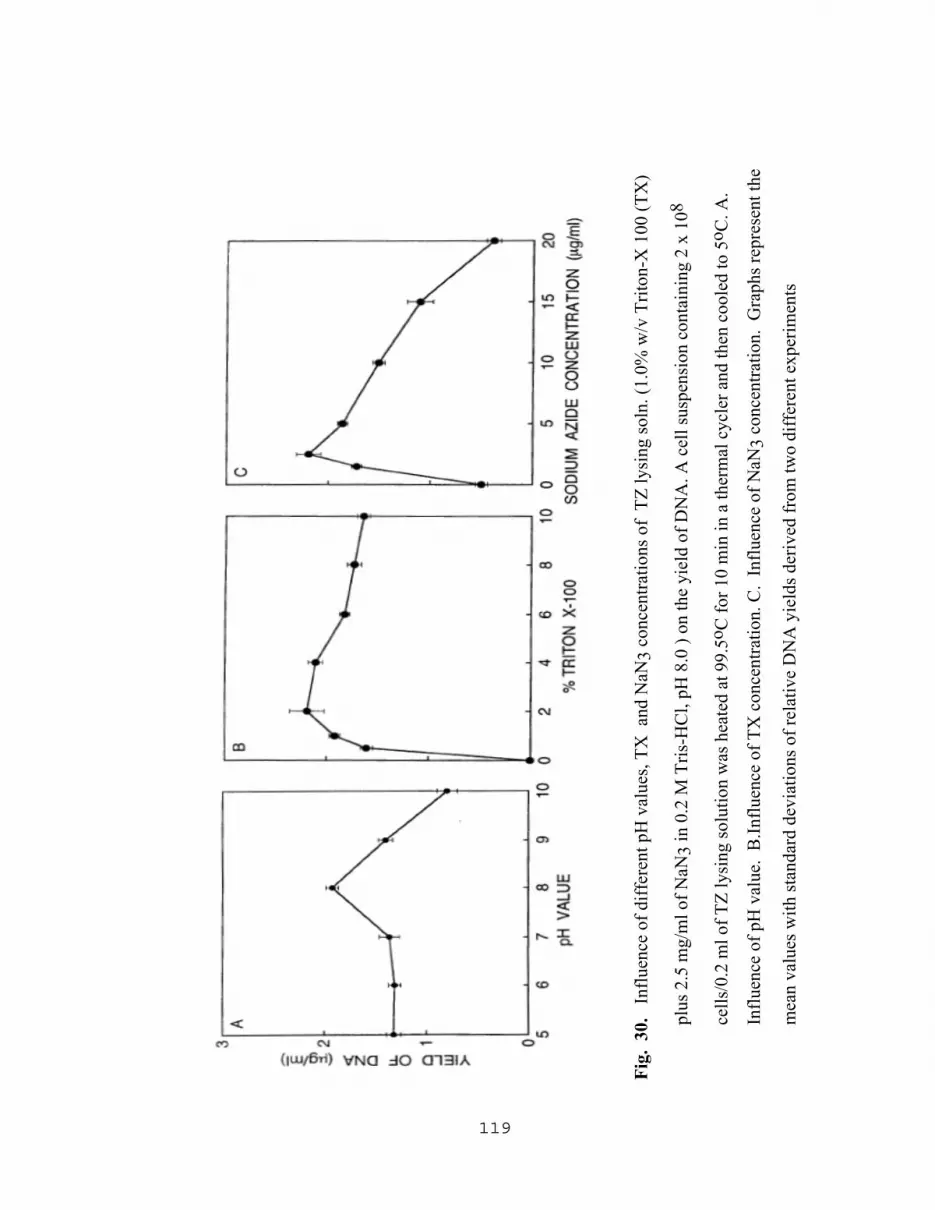
119
Fig.
30.
In
fluen
ce o
f diff
eren
t pH
val
ues,
TX a
nd N
aN3
conc
entra
tions
of
TZ ly
sing
soln
. (1.
0% w
/v T
riton
-X 1
00 (T
X)
plus
2.5
mg/
ml o
f NaN
3 in
0.2
M T
ris-H
Cl,
pH 8
.0 )
on th
e yi
eld
of D
NA
. A c
ell s
uspe
nsio
n co
ntai
ning
2 x
108
cells
/0.2
ml o
f TZ
lysi
ng so
lutio
n w
as h
eate
d at
99.
5oC
for 1
0 m
in in
a th
erm
al c
ycle
r and
then
coo
led
to 5
o C. A
.
Influ
ence
of p
H v
alue
. B
.Influ
ence
of T
X c
once
ntra
tion.
C.
Influ
ence
of N
aN3
conc
entra
tion.
Gra
phs r
epre
sent
the
mea
n va
lues
with
stan
dard
dev
iatio
ns o
f rel
ativ
e D
NA
yie
lds d
eriv
ed fr
om tw
o di
ffer
ent e
xper
imen
ts

120
5.2.2.6 Effect of NaN3 on the yield of DNA
The effect of different lysing methods: d-H2O, SDS, TX, PCR buffer, L, K, and L
in combination with K (LK) with and without NaN3 on the yield of released DNA can be
seen in Fig. 31. An increase in the yield of DNA occurred with NaN3 in combination
with d-H2O, SDS, and TX compared to these lysis methods without NaN3 (Fig. 23). A
decrease in the yield of released DNA occurred when cells were lysed with PCR buffer
(Fig. 27), K, and LK methods in combination with NaN3 compared to the use of these
lysis solutions without NaN3( Fig. 31). Treating cells with L with or without NaN3 did
not release DNA.
5.2.2.7 Comparative study for the maximum amplification of released DNA using
different lysing methods.
The final TZ lysis solution (2.5 mg NaN3 plus 2.0% TX in 0.2 M Tris-HCl at pH
8.0) resulted in at least twice the yield of released DNA compared to the other lysis
methods (Fig. 31). The mechanism whereby NaN3 significantly enhances lysis by SDS
and TX is obscure. Lysing cells with 2.5 mg/ml of NaN3 in combination with 1% TX at
pH 8.0 gave the highest level of amplified DNA compared to K, PCR buffer, and SDS in
combination with NaN3 (Fig. 32).

121
0
1
2
3
0
1
2
3
YIE
LD O
F D
NA
( g
/ml)
LYSING METHODS
L DW P SDS TX LK K0.
with sodium azidewithout sodium azide
Fig. 31. Effect of NaN3 together with different lysis methods on the yield of DNA from
E. coli O157:H7. Dashed columns, with NaN3; Bold columns, without NaN3.
Non enzymatic methods: cells were heated at 99.5 oC for 10 min in a thermal
cycler followed by cooling to 5oC with different lysing treatments as follows:
DW: distilled water, SDS: 0.05 % SDS, P: PCR buffer, and TZ lysing solution.
Enzymatic methods: L: cells treated only with lysozyme (2 mg/ml for 15 min at
25oC). K: Cells treated only with proteinase K (0.8 mg / ml) for 45 min at 55oC,
LK: cells treated with lysozyme (2 mg/ml) for 15 min at 25oC followed by
treatment with proteinase K (0.2 mg / ml) for 60 min at 55oC. After enzymatic
treatment, cells were heated at the designated temperatures for 10 min in a
thermal cycler followed by cooling to 5oC. Each method was performed with and
without 2.5 mg/ml of NaN3. The final number of cells was 2 x 10⁸/0.2 ml. Bar
graphs represent the mean values with standard deviations derived from two
different experiments.
Yie
ld o
f DN
A (µ
g / m
l)
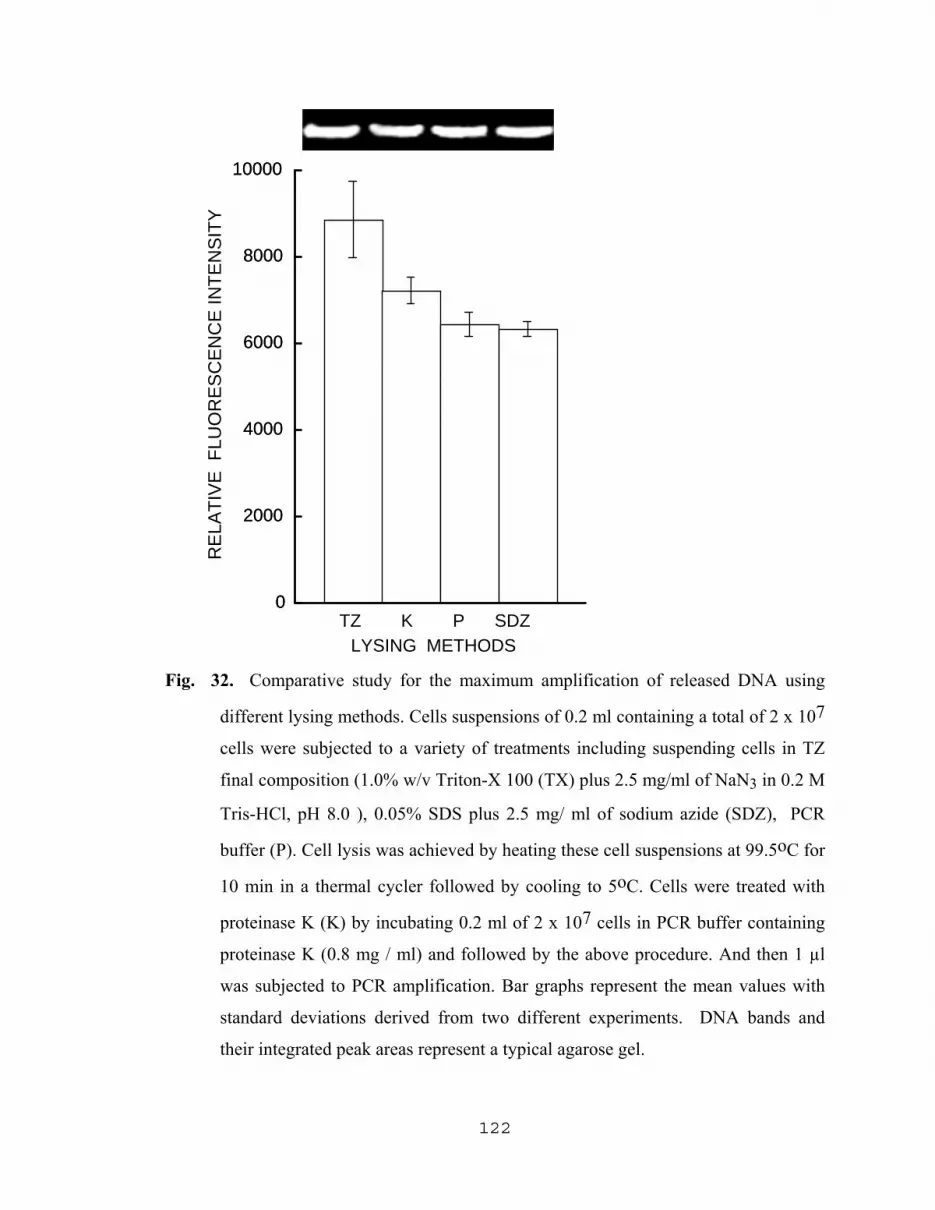
122
0
2000
4000
6000
8000
10000
0
2000
4000
6000
8000
10000
RE
LATI
VE
AR
EA
TZ K P SDZLYSING METHODS
Fig. 32. Comparative study for the maximum amplification of released DNA using
different lysing methods. Cells suspensions of 0.2 ml containing a total of 2 x 10⁷
cells were subjected to a variety of treatments including suspending cells in TZ
final composition (1.0% w/v Triton-X 100 (TX) plus 2.5 mg/ml of NaN3 in 0.2 M
Tris-HCl, pH 8.0 ), 0.05% SDS plus 2.5 mg/ ml of sodium azide (SDZ), PCR
buffer (P). Cell lysis was achieved by heating these cell suspensions at 99.5oC for
10 min in a thermal cycler followed by cooling to 5oC. Cells were treated with
proteinase K (K) by incubating 0.2 ml of 2 x 10⁷ cells in PCR buffer containing
proteinase K (0.8 mg / ml) and followed by the above procedure. And then 1 µl
was subjected to PCR amplification. Bar graphs represent the mean values with
standard deviations derived from two different experiments. DNA bands and
their integrated peak areas represent a typical agarose gel.
RE
LATI
VE
FLU
OR
ES
CE
NC
E IN
TEN
SIT
Y

123
5.2.2.8 PCR Detection sensitivity of low numbers of E. coli O157:H7 with the aid of
TZ lysing solution and pellet paint.
The yield of amplified DNA as a result of using pellet paint was studied. PCR
results indicated that 100 cells obtained from 4 hours old culture were readily detected
using the TZ lysing solution in conjunction with the capture of DNA by pellet paint while
other lysing methods: SDS, SDZ, TX, Z, d-H2O, K, KZ, LK, LKZ in conjunction with
pellet paint failed to yield detectable bands of amplified DNA (Fig. 33).
When 10,000 cells were lysed in TZ buffer in a total volume of 0.4 ml followed
by precipitation of the target DNA with pellet paint, the yield of amplified DNA was
almost similar to that obtained from 1.0 μl DNA lysates which contained 10,000 targets
DNA (Fig. 34). It was concluded that there was no significant loss in the DNA lysates
when purified with the aid of pellet paint. Therefore, the use of pellet paint was very
efficient and increased the sensitivity of PCR reaction.
Maximum yield of both released and amplified DNA was obtained as a result of
the optimization study of TZ lysing solution. It is also of interest to notice that in the
beginning of this study, the yield of amplified DNA obtained by lysing cells with either
TZ or PCR buffer in the beginning of this study was quite similar (Fig 23). However,
after optimization, the yield of amplified DNA resulting from the use of TZ buffer was
highest in comparison to proteinase K, PCR buffer and SDZ (Fig 32).

124
Fig. 33. Gel electrophoresis of PCR amplification products with E. coli O157:H7 SLT-2
as a result of using different isolation procedure with the use of pellet paint.
DNA sample (20 µl) purified with the aid of pellet paint and containing 100
templates (derived from number of CFU) was added to the 50 µl of PCR mixture
as described above by Ramotar et al., 1995. DNA lysates were obtained from cell
suspension of pure culture by using different lysing methods as follows: Row 1,
Lanes; a, TZ; b, TX; c, SDS; d, SDZ; e, P; f, PZ; g, Z; h, DW as described in the
legend of Fig.24. Row 2, Lanes; a, TZ; b, LK; c, LKZ; d, K; e, KZ as described
in the legend of Fig.32 except LKZ and KZ included 2.5 mg/ml of NaN3.
Controls were conducted without DNA (Row 2.f), and without Taq Polymerase
(Row 2-g). TZ contained 2.5 mg of NaN3/ml and 2.0% TX in 0.2 M Tris-HCl
buffer (pH 8.0).
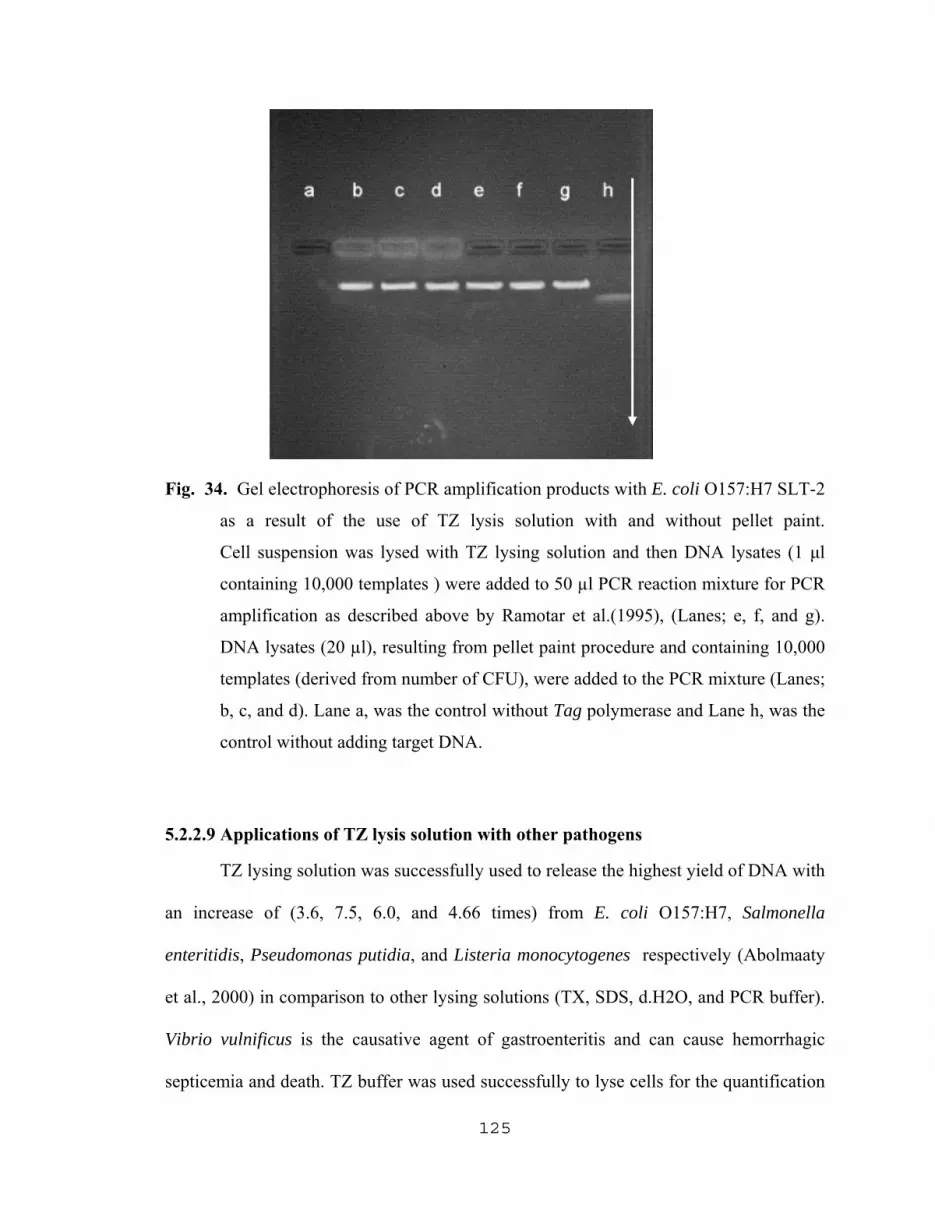
125
Fig. 34. Gel electrophoresis of PCR amplification products with E. coli O157:H7 SLT-2
as a result of the use of TZ lysis solution with and without pellet paint.
Cell suspension was lysed with TZ lysing solution and then DNA lysates (1 μl
containing 10,000 templates ) were added to 50 µl PCR reaction mixture for PCR
amplification as described above by Ramotar et al.(1995), (Lanes; e, f, and g).
DNA lysates (20 µl), resulting from pellet paint procedure and containing 10,000
templates (derived from number of CFU), were added to the PCR mixture (Lanes;
b, c, and d). Lane a, was the control without Tag polymerase and Lane h, was the
control without adding target DNA.
5.2.2.9 Applications of TZ lysis solution with other pathogens
TZ lysing solution was successfully used to release the highest yield of DNA with
an increase of (3.6, 7.5, 6.0, and 4.66 times) from E. coli O157:H7, Salmonella
enteritidis, Pseudomonas putidia, and Listeria monocytogenes respectively (Abolmaaty
et al., 2000) in comparison to other lysing solutions (TX, SDS, d.H2O, and PCR buffer).
Vibrio vulnificus is the causative agent of gastroenteritis and can cause hemorrhagic
septicemia and death. TZ buffer was used successfully to lyse cells for the quantification

126
detection of Vibrio vulnificus isolated from shellfish sample by PCR (Wang and Levin
2005a ) and competitive PCR (Wang and Levin 2004). O'Mahony and Hill 2004
developed a Real-time PCR assay with primers and probes designed by using IS900 and
TZ lysis buffer which allowed rapid detection of Mycobacterium avium subsp.
paratuberculosis DNA in artificially contaminated milk. Quantitative determination of
Vibrio parahaemolyticus by polymerase chain reaction was conducted using TZ buffer
(Wang and Levin 2005b).
5.2.3 Optimization of PCR conditions for the detection of Escherichia coli O157:H7
Shiga-Like Toxin Genes
PCR is so sensitive that a single DNA molecule can be amplified, and single-copy
genes are routinely extracted out of complex mixtures of genomic sequences and
visualized as distinct bands on agarose gel. Unquestionably, no single protocol can be
appropriate to all situations. Consequently, each new PCR application is likely to require
optimization (Innis and Gelfand, 1990). Problems that are often encountered include: no
detectable product or a low yield of desired product, the presence of nonspecific
background bands due to mispriming or misextension of the primers, the formation of
primer-dimers that compete for amplification with the desired product; and mutations or
heterogeneity due to misincorporation (Innis and Gelfand, 1990). The primers selected to
amplify E. coli O157: H7 VT-1 gene segment were: 5'-TAAAACGCCGTCCTTC-3' and
5'TACTCAACCTTCCCCAGTT-3' to amplify a 764-bp fragment (nucleotides 256 to
1019) of the VT1 gene (Fig.37). The primers selected to amplify E. coli O157: H7 VT-2
gene segment were: 5'-TCTTCGGTATCCTATTCCC-3' and

127
5'-GCCATTGCATTAACGAAAC-3' to amplify a 980-bp fragment (nucleotides 256 to
1235) of the VT-2 gene (Fig. 35).
Fig. 35. Gel electrophoresis of PCR amplification with molecular standard along with E.
coli O157:H7 verotoxins genes SLT-1 and SLT-2.
DNA sample (1 µl) containing 1 x 10⁷ templates (derived from number of CFU)
was added to the 50 µl of PCR mixture as described above by Ramotar et al.,
1995. DNA lysates were obtained from cell suspension of pure culture by using
TZ (2.5 mg of NaN3/ml and 2.0% TX in 0.2 M Tris-HCl buffer, pH 8.0). Lane a:
negative control with SLT-1, Lane b: positive control with SLT-1, Lane c: DNA
ladder (3.4 μl) obtained from Sigma, Lane d: Positive control with SLT-2, Lane e:
negative control with SLT-2.

128
5.2.3.1. Effect of MgCl2 concentration on DNA amplification.
Mg++ concentration is known to play a critical role in amplification as it can
affect DNA strand denaturation, primer annealing specificity and enzyme fidelity
(Dwivedi et al., 2003, Innis, et al., 1988, and Eeles et al., 1993). When the concentration
of MgCl2 was varied, the maximum yield of amplified DNA occurred when the PCR
reaction mixture included 1.0 mM of MgCl2 with both SLT-1 and SLT-2 (Fig. 36)
Concentration of MgCl2 greater that 1.0 mM resulted in descending pattern of amplified
DNA (Fig. 36). Amplification of SLT-1 and SLT-2 gene sequences did not occur with
0.25 mM MgCl2 (Fig. 36).
Higher Mg++ generally results in higher yield, but too high will often result in
amplification of non-specific products. Both EDTA and dNTPs will chelate the Mg++ and
lower its effective concentration in the reaction (Baumforth et al., 1999). If dNTP
concentration is too high, then Mg++ will be rapidly depleted and PCR will be inhibited.
If Mg++ content is too low, the result is little or no PCR product. If Mg++ is too high
then mispriming can result. Dwivedi et al., 2003 studied the effect of Mg++ in the
amplification of 38 kDa gene. Furthermore, he found that a 2-mM concentration yielded
the best results while higher and lower concentrations of Mg++ resulted in reduced
product yield.
5.2.3.2. Effect of Taq polymerase concentration on the amplification of DNA.
Varying the level of Taq polymerase in PCR reaction mixtures resulted in a
maximum amplification of SLT-1 and SLT-2 target sequences with 2.5 and 5 units of Taq
polymerase respectively (Fig. 37). With respect to SLT-2 target sequences, maximum

129
amplification required 5 units which is much higher than the 2.5 units recommended by
Ramotar et al.,1995 (2.5 units). From these results, it was concluded that the
concentration of Taq polymerase is critical and should be optimized (Fig. 37). The
concentration of Taq polymerase needed for SLT-2 target sequences is 2.5 x that required
for SLT-1. A recommended concentration range for Taq Polymerase is between 1 and
2.5 units (Lawyer et al. 1989) per 100μl reaction mixture when other parameters are
optimized. Enzyme requirements may vary with respect to individual target templates or
primers. When optimizing a PCR, Annis and Gelfand (1990) recommended testing
enzyme concentrations ranging from 0.5 to 5 units /100 μl reaction. If the enzyme
concentration is too high, nonspecific background product may accumulate, and if too
low, an insufficient amount of desired product is made.
5.2.3.3. Effect of varying the concentrations of SLT-1 and SLT-2 primers on the
amplification of DNA.
It was concluded that optimizing the primer concentration is very critical since
using 2.5 mM of MgCl2 as described above resulted in a dramatic decrease in the
amplification of both SLT-1 and SLT-2 target sequences. When the primers
concentration increased from 1.0 to 1.6 μM, a significant increase in the amplification
occurred with SLT-1 while only a slight increase was noticed with SLT-2 target
sequences. In our laboratory, the highest amplification of SLT-1 & SLT-2 target
sequences was obtained with 1.6 μM primers in the PCR reaction mixture followed by a
decreasing pattern (Fig. 38). Primer concentrations between 0.1 and 0.5 μM are generally
optimal (Innis and Gelfand, 1990). Higher concentrations may promote mispriming and
accumulation of nonspecific product and may increase the probability of generating a

130
template-independent artifact termed a primer-dimer. Nonspecific products and primer
artifacts are themselves substrates for PCR and compete with the desired product for
enzyme, dNTPs, and primers, resulting in a lower yield of the desired product (Innis and
Gelfand, 1990).

131
0
1000
2000
3000
4000
5000
6000
0
1000
2000
3000
4000
5000
6000
RE
LATI
VE
IN
TES
NS
ITY
MgCl2 (mM)
SLT-1
SLT-2
0.25 0.5 1.0 1.5 2.0 2.5 3.0 3.5MgCl CONCENTRATION (mM)2
Primers
Fig. 36. Effect of MgCl2 concentration on the amplification of SLT-1 and SLT-2 target
sequences. DNA samples containing 1 x 10⁵ templates were subjected to a variety
of MgCl2 concentrations in PCR reaction mixtures. Final PCR reaction mixtures
consisted of: 5 μl of 10X PCR mix, 50 mM KCl ,0.01% gelatin, 10 mM Tris-HCl
at pH 9.0), 0.2 mM each of dATP, dCTP, dGTP, and dTTP (Boehringer
Mannheim), 1 μM each of the two primers, and 2.5 units of Taq polymerase
(Promega) in a final volume of 50 μl. Bar graphs represent the mean values of
amplified DNA resulting from integrated peak areas which represent a typical
agarose gel with standard deviations derived from three different experiments.
RE
LATI
VE
FLU
OR
ES
CE
NC
E IN
TEN
SIT
Y
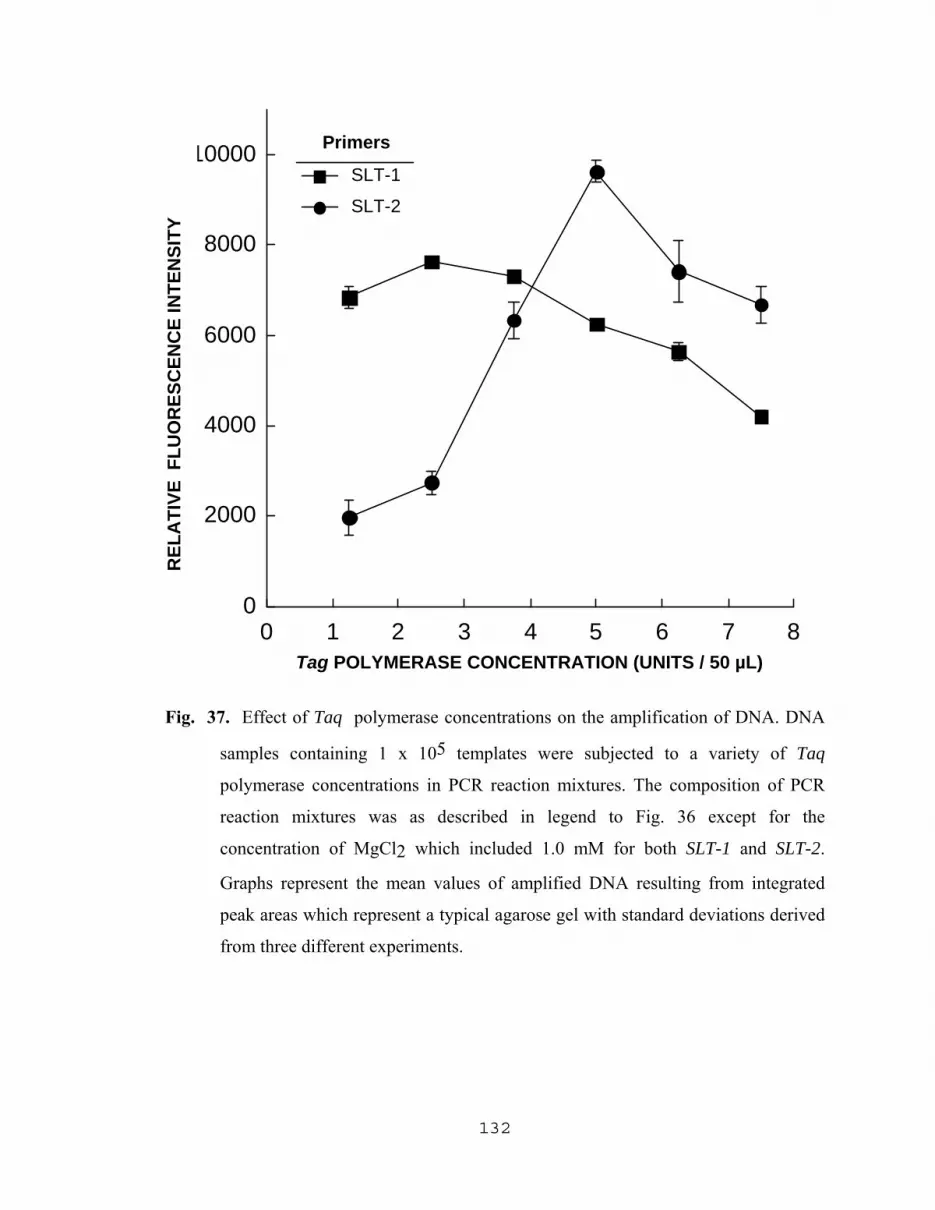
132
0
2000
4000
6000
8000
10000
0 1 2 3 4 5 6 7 8
RE
LATI
VE
IN
TEN
SIT
Y
Taq POLYMERASE CONCENTRATION ( Units / 50 ul )
SLT-1
SLT-2
Primers
Fig. 37. Effect of Taq polymerase concentrations on the amplification of DNA. DNA
samples containing 1 x 10⁵ templates were subjected to a variety of Taq
polymerase concentrations in PCR reaction mixtures. The composition of PCR
reaction mixtures was as described in legend to Fig. 36 except for the
concentration of MgCl2 which included 1.0 mM for both SLT-1 and SLT-2.
Graphs represent the mean values of amplified DNA resulting from integrated
peak areas which represent a typical agarose gel with standard deviations derived
from three different experiments.
Tag POLYMERASE CONCENTRATION (UNITS / 50 µL)
REL
ATI
VE F
LUO
RES
CEN
CE
INTE
NSI
TY
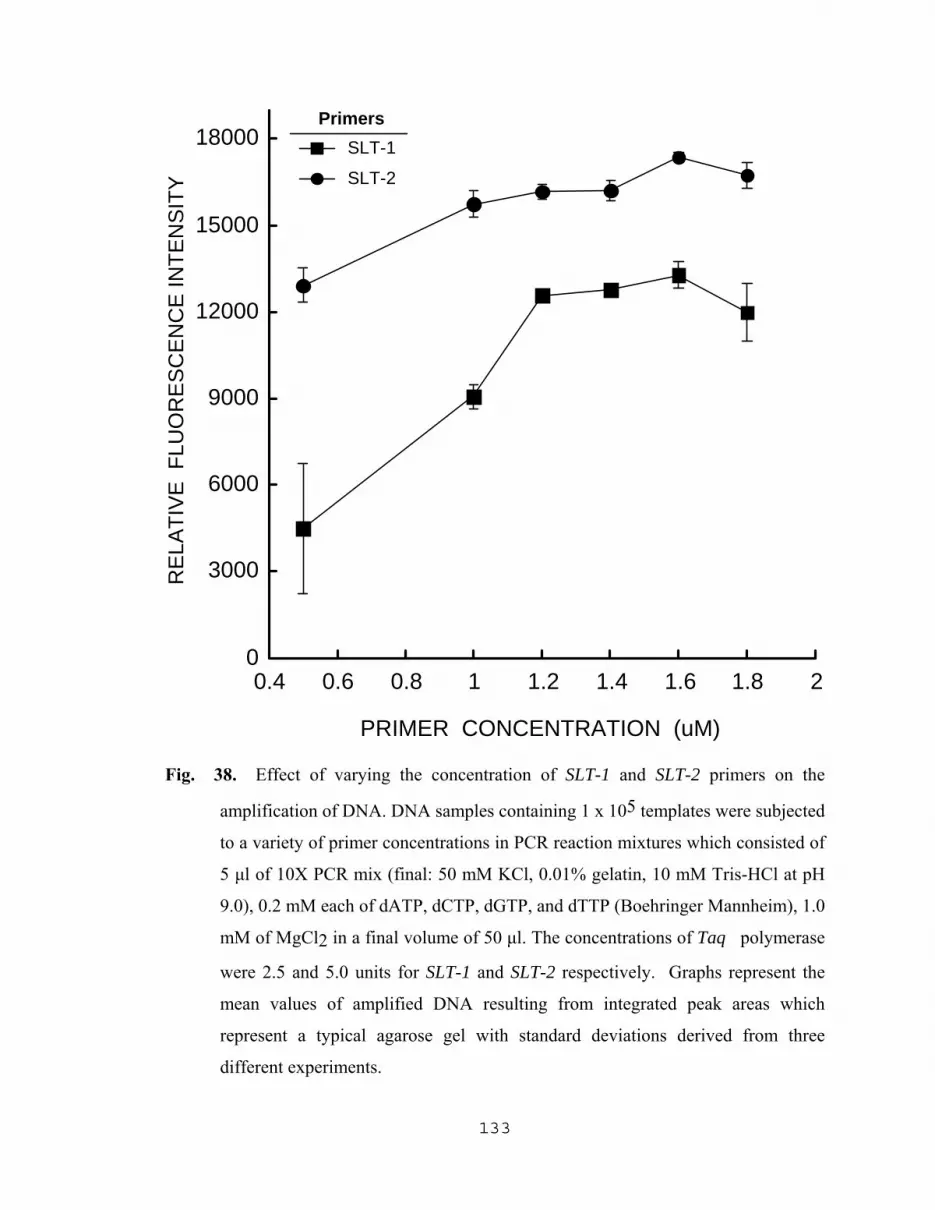
133
0
3000
6000
9000
12000
15000
18000
0.4 0.6 0.8 1 1.2 1.4 1.6 1.8 2
RE
LATI
VE
IN
TEN
SIT
Y
PRIMER CONCENTRATION (uM)
SLT-1
SLT-2
Primers
Fig. 38. Effect of varying the concentration of SLT-1 and SLT-2 primers on the
amplification of DNA. DNA samples containing 1 x 10⁵ templates were subjected
to a variety of primer concentrations in PCR reaction mixtures which consisted of
5 μl of 10X PCR mix (final: 50 mM KCl, 0.01% gelatin, 10 mM Tris-HCl at pH
9.0), 0.2 mM each of dATP, dCTP, dGTP, and dTTP (Boehringer Mannheim), 1.0
mM of MgCl2 in a final volume of 50 μl. The concentrations of Taq polymerase
were 2.5 and 5.0 units for SLT-1 and SLT-2 respectively. Graphs represent the
mean values of amplified DNA resulting from integrated peak areas which
represent a typical agarose gel with standard deviations derived from three
different experiments.
RE
LATI
VE
FLU
OR
ES
CE
NC
E IN
TEN
SIT
Y
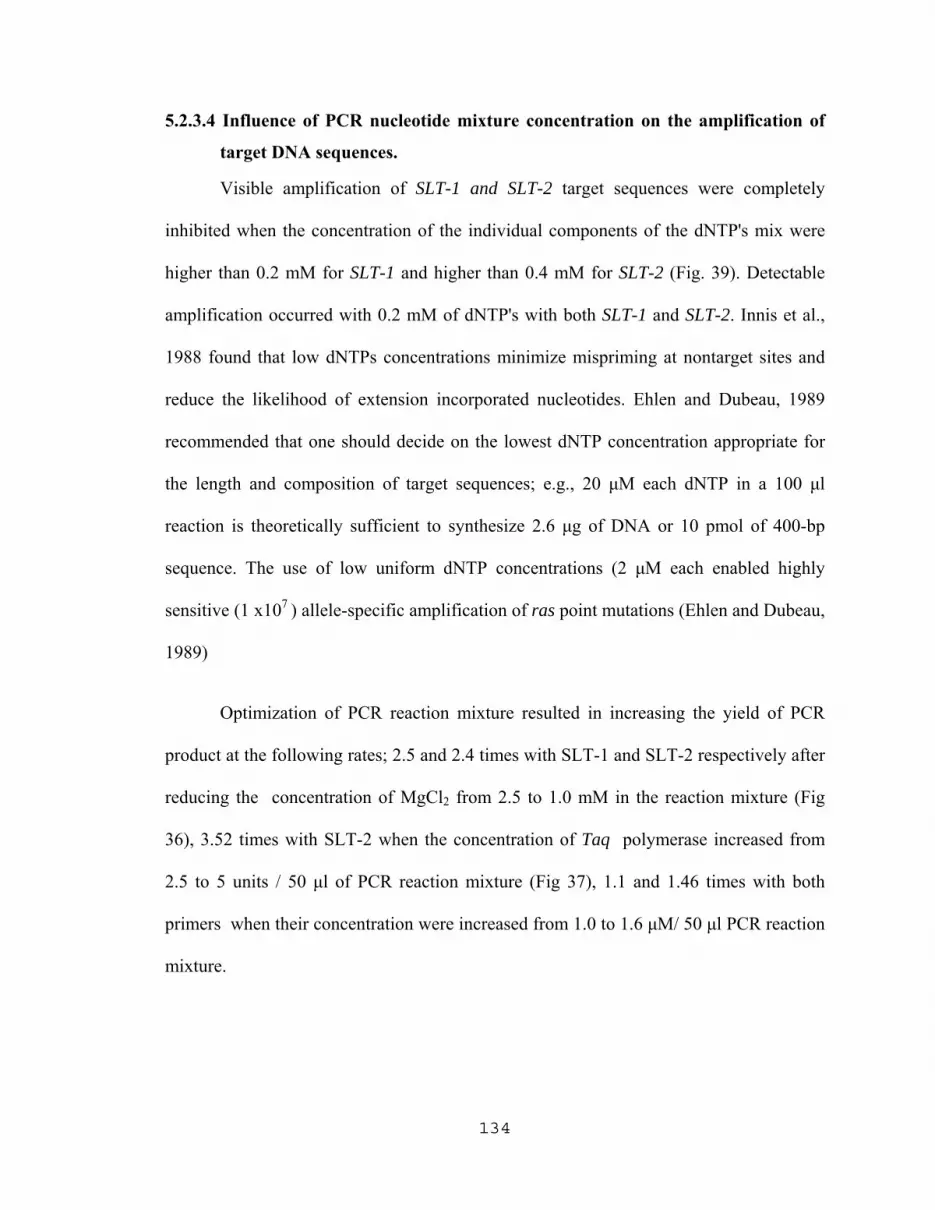
134
5.2.3.4 Influence of PCR nucleotide mixture concentration on the amplification of
target DNA sequences.
Visible amplification of SLT-1 and SLT-2 target sequences were completely
inhibited when the concentration of the individual components of the dNTP's mix were
higher than 0.2 mM for SLT-1 and higher than 0.4 mM for SLT-2 (Fig. 39). Detectable
amplification occurred with 0.2 mM of dNTP's with both SLT-1 and SLT-2. Innis et al.,
1988 found that low dNTPs concentrations minimize mispriming at nontarget sites and
reduce the likelihood of extension incorporated nucleotides. Ehlen and Dubeau, 1989
recommended that one should decide on the lowest dNTP concentration appropriate for
the length and composition of target sequences; e.g., 20 μM each dNTP in a 100 μl
reaction is theoretically sufficient to synthesize 2.6 μg of DNA or 10 pmol of 400-bp
sequence. The use of low uniform dNTP concentrations (2 μM each enabled highly
sensitive (1 x10⁷ ) allele-specific amplification of ras point mutations (Ehlen and Dubeau,
1989)
Optimization of PCR reaction mixture resulted in increasing the yield of PCR
product at the following rates; 2.5 and 2.4 times with SLT-1 and SLT-2 respectively after
reducing the concentration of MgCl2 from 2.5 to 1.0 mM in the reaction mixture (Fig
36), 3.52 times with SLT-2 when the concentration of Taq polymerase increased from
2.5 to 5 units / 50 μl of PCR reaction mixture (Fig 37), 1.1 and 1.46 times with both
primers when their concentration were increased from 1.0 to 1.6 μM/ 50 μl PCR reaction
mixture.
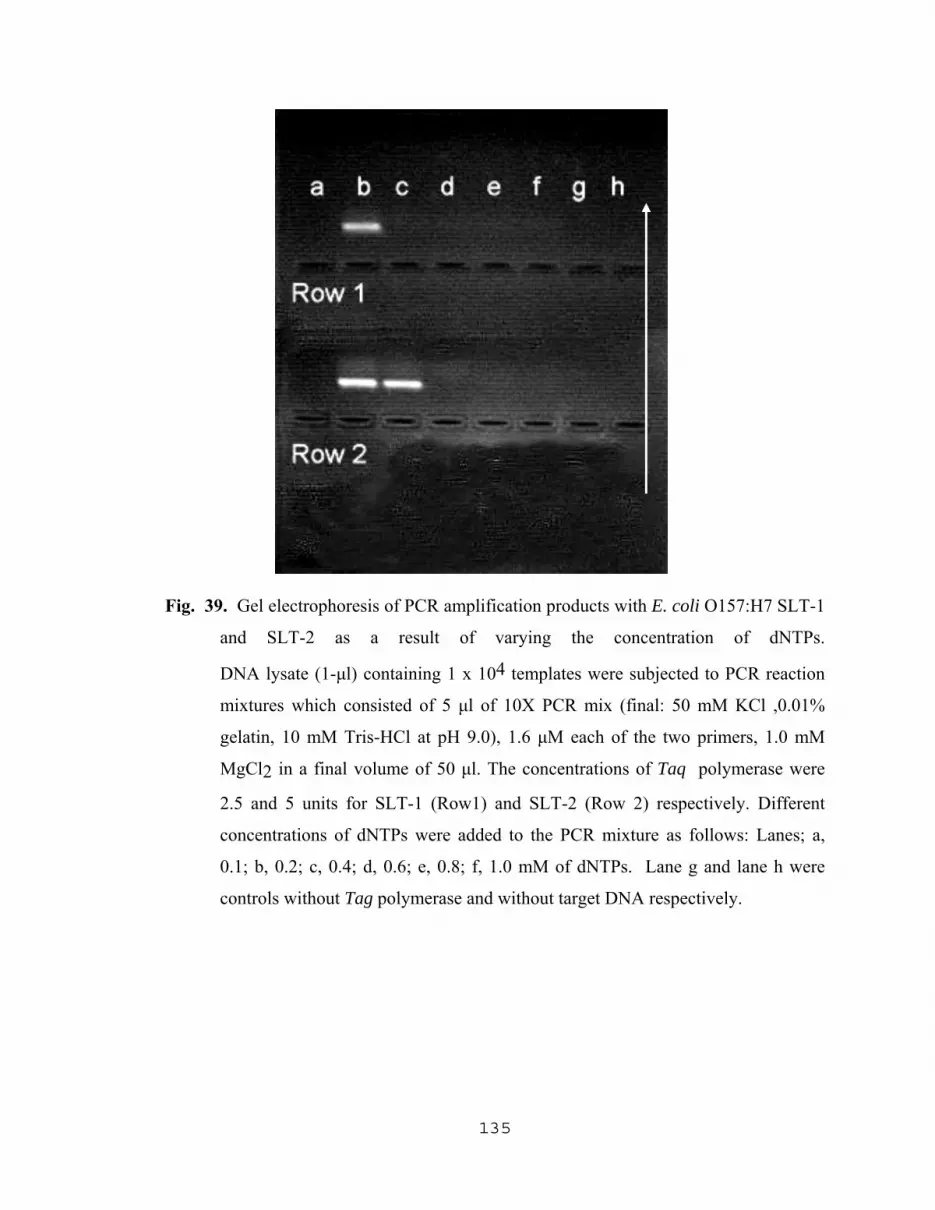
135
Fig. 39. Gel electrophoresis of PCR amplification products with E. coli O157:H7 SLT-1
and SLT-2 as a result of varying the concentration of dNTPs.
DNA lysate (1-μl) containing 1 x 10⁴ templates were subjected to PCR reaction
mixtures which consisted of 5 μl of 10X PCR mix (final: 50 mM KCl ,0.01%
gelatin, 10 mM Tris-HCl at pH 9.0), 1.6 μM each of the two primers, 1.0 mM
MgCl2 in a final volume of 50 μl. The concentrations of Taq polymerase were
2.5 and 5 units for SLT-1 (Row1) and SLT-2 (Row 2) respectively. Different
concentrations of dNTPs were added to the PCR mixture as follows: Lanes; a,
0.1; b, 0.2; c, 0.4; d, 0.6; e, 0.8; f, 1.0 mM of dNTPs. Lane g and lane h were
controls without Tag polymerase and without target DNA respectively.

136
5.2.3.5 Amplification of SLT-1 and SLT-2 gene sequences as a result of varying the
concentration of DNA templates.
Optimization of the PCR allowed amplified bands of 100 DNA templates of
Shiga-Like Toxin-1 (Figs, 40 and 41) and of 20 DNA templates of Shiga-Like Toxin-2
(Figs, 42 and 43) to be detected in agarose gels after staining with ethidium bromide. To
generate a standard curve, samples (1 μl) containing different concentrations of SLT-1
and SLT-2 target sequences were subjected to the optimized PCR reaction mixtures
which consisted of 5 μl of 10X PCR mix (final: 50 mM KCl ,0.01% gelatin, 10 mM Tris-
HCl at pH 9.0), 0.2 mM each of dATP, dCTP, dGTP, and dTTP (Boehringer Mannheim),
1.0 mM MgCl2, 1.6 μM each of the two primers in a final volume of 50 μl. The
concentrations of Taq polymerase were 2.5 and 5 units for SLT-1 and SLT-2 respectively.
A complete linear relationship was obtained when different concentrations of SLT-1
target sequences derived from CFU of 4 h old culture of E. coli 157:H7 (100 to 5,000)
were plotted against the relative integrated areas of the amplified DNA bands using a
semi-log plot (Fig. 41). The detectable limit was 100 DNA templates for the SLT-1 target
sequence. A similar linear relationship was obtained but with a lower detectable limit of
20 DNA templates when the different number of SLT-2 templates derived from CFU of 4
h old culture was varied at a lower range from 20 to 1000 (Fig. 43).
It is of interest to notice the new PCR reaction mixture formula increased the
sensitivity of PCR assay resulting in the detection of as low as 100 SLT-1 and 20 SLT-2
templates while the other reaction mixture failed to detect them and was able to detect at
least 200 SLT-1 and 150 SLT-2 DNA templates (Fig.40 and Fig. 41).

137
Fig. 40. Gel electrophoresis of PCR amplification products with E. coli O157:H7 SLT-1
as a result of varying the concentration of target DNA. DNA samples (1-μl)
representing a different number of cells (Lanes; d, 5000; e, 1000; f, 500; g, 200; h,
100 ) were subjected to two different reaction mixtures; PCR reaction mixtures
described by Ramotar et al. (1995) was used for bands in raw 1 while the
optimized PCR reaction mixture was used for raw 2. The optimized PCR reaction
mixture consisted of 5 μl of 10X PCR mix (final : 50 mM KCl ,0.01% gelatin, 10
mM Tris-HCl at pH 9.0), 1.6 μM each of the two primers, 0.2 mM each of dATP,
dCTP, dGTP, and dTTP, 2.5 units of Taq polymerase, 1.0 mM MgCl2 in a final
volume of 50 μl. Controls without Taq polymerase (Lane b) and without DNA
(Lane c) were included. DNA lysates were obtained by lysing cell suspensions
derived from CFU of 4 h pure culture.

138
0
2000
4000
6000
8000
10000
100 1000 10000
RE
LATI
VE
IN
TEN
SIT
Y
NUMBER OF SLT-1 DNA TEMPLATES
Optimized PCR reaction mixture
Standard PCR reaction mixture
Fig. 41. Amplification of SLT-1 DNA as a result of varying the concentration of DNA
template. Different concentrations of DNA template (100 to 5,000) were
subjected to different PCR reaction mixture as described in the legend of Fig. 40.
Graphs represent the mean values of amplified DNA resulting from integrated
peak areas which represent a typical agarose gel with standard deviations derived
from three different experiments. Inserted is the linear equation resulted from
curve fitting.
RE
LATI
VE
FLU
OR
ES
CE
NC
EIN
TEN
SIT
Y
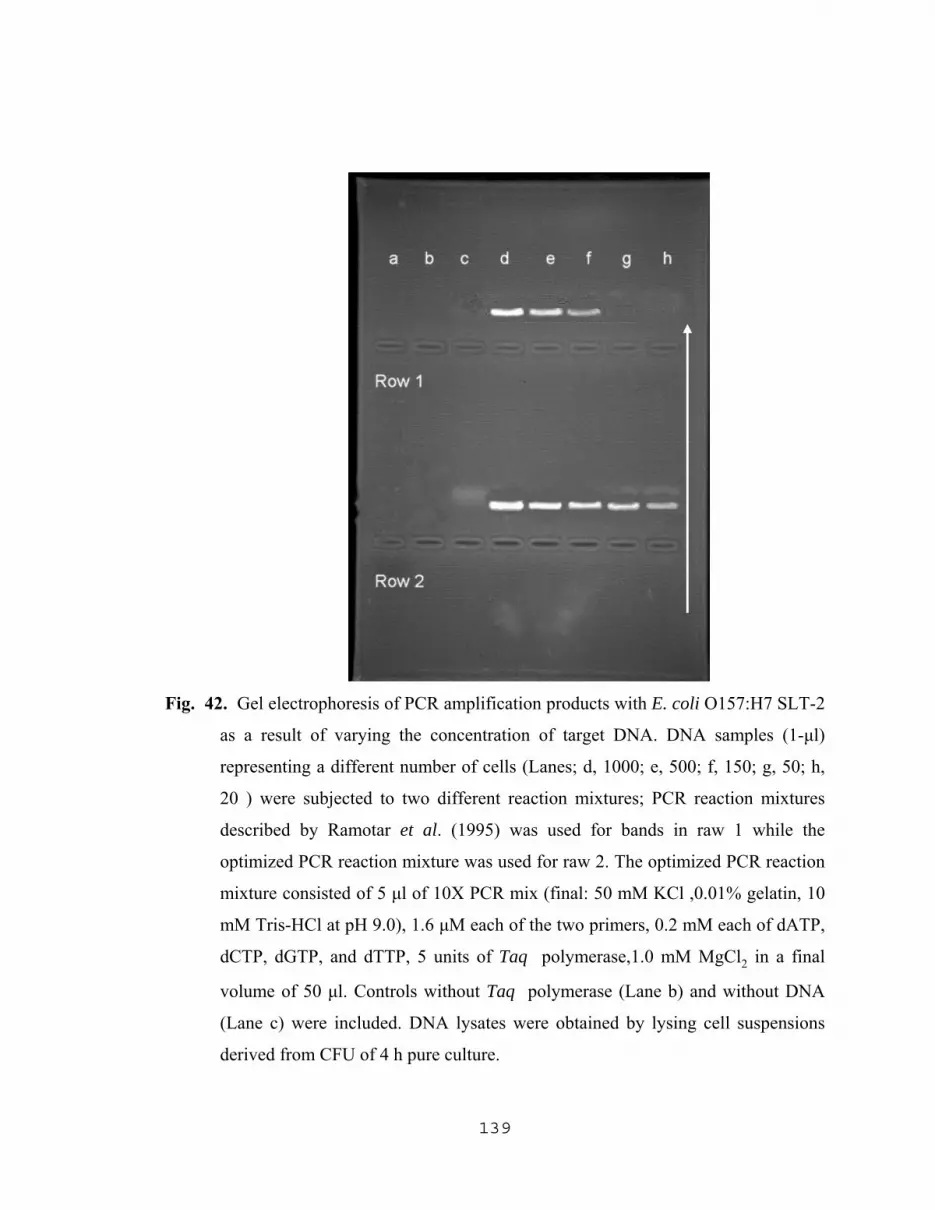
139
Fig. 42. Gel electrophoresis of PCR amplification products with E. coli O157:H7 SLT-2
as a result of varying the concentration of target DNA. DNA samples (1-μl)
representing a different number of cells (Lanes; d, 1000; e, 500; f, 150; g, 50; h,
20 ) were subjected to two different reaction mixtures; PCR reaction mixtures
described by Ramotar et al. (1995) was used for bands in raw 1 while the
optimized PCR reaction mixture was used for raw 2. The optimized PCR reaction
mixture consisted of 5 μl of 10X PCR mix (final: 50 mM KCl ,0.01% gelatin, 10
mM Tris-HCl at pH 9.0), 1.6 μM each of the two primers, 0.2 mM each of dATP,
dCTP, dGTP, and dTTP, 5 units of Taq polymerase,1.0 mM MgCl2 in a final
volume of 50 μl. Controls without Taq polymerase (Lane b) and without DNA
(Lane c) were included. DNA lysates were obtained by lysing cell suspensions
derived from CFU of 4 h pure culture.

140
0
2000
4000
6000
8000
10000
10 100 1000
RE
LATI
VE
INTE
NS
ITY
NUMBER OF SLT-2 DNA TEMPLATES
Optimized reaction mixture
Standard PCR reaction mixture
Fig. 43. Amplification of SLT-2 DNA as a result of varying the concentration of DNA
template. Different concentrations of DNA template (20 to 1000) were subjected
to different PCR reaction mixtures as above in the legend of Fig. 42. Graphs
represent the mean values of amplified DNA resulting from integrated peak areas
which represent a typical agarose gel with standard deviations derived from three
different experiments. Inserted is the linear equation resulted from curve fitting.
RE
LATI
VE
FLU
OR
ES
CE
NC
E IN
TEN
SIT
Y
5.3. Quantitative Detection of E. coli O157:H7 in Ground Beef via the Polymerase
Chain Reaction.
5.3.1 Preparation of ground beef samples for the Isolation of E. coli O157:H7 prior
to PCR
5.3.1.1 Absence of E. coli and other verotoxins producing SLT-1 and SLT-2 in
ground beef samples.
When homogenates of unseeded frozen ground beef, prepared with and without
enrichment media, were plated on VRBA plates and incubated at 37oC for 24 hours, no
colonies of E. coli was detected. Furthermore, no colonies were found on VRBA plates
streaked with one loop of filtrates from the homogenates of frozen ground beef. The
filtrates of frozen ground beef were enriched in TSB+ for 24 h at 37oC and then checked
for E. coli O157. Latex agglutination assay, Spectrophotometric immuno-agglutination
assay, ELISA assay, and PCR assay showed no evidence of target bacteria, indicating
that frozen ground beef samples were free from dead and viable E. coli O157:H7. These
results also confirmed that the freeze and thaw process was conducted successfully.
5.3.1.2 Effect of different extraction solutions on the clarity of the resulting filtrates
The filtrates, obtained from homogenates of 10 g samples of ground beef mixed
with 90 ml of different solutions, were tested colorimeterically at 600 nm (Table 10). A
clear filtrate was obtained only with 0.01 M PBS, pH 6.0 which had an absorbance of
0.133 + 0.029 at 600 nm. Due to it's clarity, 0.01 M PBS, pH 6.0 was selected to be the
extraction solution to isolate E. coli O157:H7 from ground beef prior to PCR.
141

142
Table.10 Influence of extraction solution on the transparency of the filtrates*
Extraction solution Absorbance (600 nm ) Notices
Stomaching buffer 3.83 + 0.54 Some what cloudy
0.01 M KH2PO4 0.229 + 0.029 Fairly clear
0.1 M PBS pH 6.0 0.581 + 0.047 Slightly cloudy
0.01 M PBS pH 6.0 0.133 + 0.029 Clear
PCR buffer - Cloudy milky appearance
* After Homogenization of 10 g of ground beef (5% fat) with 90 ml of one of the above
solutions in stomaching page at 170 rpm for 60 sec, ground beef samples (10g)
were placed into the stomacher bags with 90 ml of one of the same solution. The
filtrates were passed through paper coffee filters using a vacuum pump (SKH
32EG 550T, Millipore filter corporation). The filtrate’s absorbance was then
measured at 600 nm.
5.3.1.3. Extraction of target cells with the aid of differential centrifugation and the
use of paper coffee filters.
Homogenates were prepared by mixing 10 g of ground beef (5% fat) with 90 ml
of 0.01 M PBS pH 6.0 in stomaching page at 170 rpm for 60 sec. The homogenates were
subjected to a 3 steps filtration process as follows; (1) coffee filter to remove large beef
debris, (2) low speed centrifugation to precipitate the medium particles, and (3) high
speed centrifugation to precipitate target cells with small particles and remove more PCR
inhibitors. Pellets from each filtration steps were resuspended and smeared on VRBA
plates which were incubated overnight at 37oC.

143
After overnight incubation of Violet Red Bile Agar (VRBA) plates smeared with
resuspended pellets at 37oC. Characteristic purple colonies were counted to determine of
percent recovery of seeded E. coli O157:H7. A recovery of 75% +4 was obtained after
passing the homogenate through the coffee filter. Recovery decreased to 65% +3 after
centrifuging the resuspended pellets at 1000 rpm for 2 min. The final centrifugation,
which was used for PCR assay, resulted in a recovery of 57% +6. the above data
represents the mean values of the % recovery and standard errors derived from the initial
data of eleven different experiments.
3. 2. Enumeration of bacteria using pre-enrichment media
Enumeration of extracted microorganisms was conducted in 30 ml of Tryptic Soy
Broth plus 0.5% dextrose incubated at 37oC for different intervals of time (3.5, 4.5 and
5.5 h). Enumeration was performed in order to increase the number of target
microorganisms thereby increasing the sensitivity of the PCR assay. An increasing linear
relationship occurred when the final cell numbers obtained after 3.5 and 4.5 hours of
incubation were plotted against the initial cell numbers on a semi log paper; while a near
linear increasing relationship occurred after 5.5 hours of incubation (Fig. 44). For testing
E. coli O157 serologically, enriched cells obtained from ground beef seeded with 10 cells
tested positive with both latex agglutinating assay and Spectrophotometric Immuno-
agglutination assay after an incubation period of 10 hours in TSB+ at 37oC . Injury to the
specific pathogen of interest can enhance problems of normal flora interference. Many
treatments used in food processing such as heat, cold, drying, freezing, osmotic activity,

144
chemical additives and preservatives, and other factors can sublethally injure bacterial
cells (Busta, 1976 and Hurst, 1977). Heat-injured E. coli O157:H7 cannot undergo repair
and form colonies on selective media, such as Sorbitol MacConkey agar (SMAC) or
xylose lysine decarboxylase agar (XLD), respectively, because the selective agents or
dyes in these selective agars can inhibit the repair of heat-injured pathogens (Kang and
Fung, 1999, Ray 1984, McCleer, 1995). Significant differences between SMAC and
tryptic soy agar (TSA; nonselective medium) for recovery of injured microorganisms
have been observed (Abdul-Raouf 1993, Conner and Hall 1994, McCleer, 1995).

145
10
100
1000
10000
100000
10 100 1000
FIN
AL
NO
. O
F C
ELL
S
INITIAL NO. OF CELLS PER 10 g SAMPLE
3.5
4.5
5.5
Hours of incubation
Fig. 44. Yield of E. coli O157:H7 as a result of enumeration in TSB+.
Aseptically, Ten g of ground beef was seeded with varying cell densities: 10, 50,
100, 200, 500 cells. Homogenates and filtrates were prepared using the
differential centrifugation with the aid of coffee filter method as described above.
Final pellets were resuspended in 30 ml of Tryptic Soy Broth plus 0.5% dextrose
in 250 ml baffled flasks. Inoculated flasks were then incubated with rotary
agitation (300 rpm) at 37oC for different intervals of time (3.5, 4.5 and 5.5 h).
After incubation, cells were harvested by centrifuging broth cultures at 16,000g
for 10 min at 4oC. Pellets were reresuspended in 1.0 ml of d-H2O into
microcentrifuge tubes and then 0.1 ml plated into VRB plates. Data points derived
from initial data performed in replicate.

146
3.3. PCR detectable limits of SLT-1 and SLT-2 of cells after enumeration
The direct detection method (without using enrichment media) produced no
visually detectable bands of amplified SLT-1 and SLT-2 isolated from ground beef
seeded with (1x 10² – 1 x 10³ cells/ 10 g) and purified as described earlier prior to PCR.
Amplification was prevented by a high concentration of inhibitors, such as protein and fat
in the ground beef samples (Swaminathan, 1994, Tsai et al., 2000). Kim et al., (2000)
found that collagen, a major component of several foods, inhibited PCR. Relatively low
concentrations of beef (25 to 100 µg) inhibited the amplification of Clostridium
botulinum types A and F, whereas higher concentrations (250 to 500 µg) were required to
inhibit the amplification of types B and E (Lindström et al., 2001).
A linear relationship occurred between the initial number of E. coli O157:H7
added to 10 g ground beef samples and the relative integrated peak areas of PCR analysis
products resulting from the amplification of SLT-1 and SLT-2 target sequences isolated
from enrichment media (Figs. 46 and Fig. 48). PCR assay successfully detected a
minimum of 100 cells of E. coli O157:H7 with SLT-1 primer and 50 cells with SLT-2
primer per 10 grams of ground beef after 5.5 hours of pre-enrichment in 30 ml of TSB+ at
37oC (Fig. 45 through 48). The detectable limit of SLT-2 decreased to 100 cells / 10
grams of seeded ground beef after an incubation time of 4.5 hours in TSB+ at 37oC ( Fig.
47 and Fig. 48).

147
Fig. 45. Gel electrophoresis of PCR products for the detection of E. coli O157:H7 (SLT-
1) in ground beef after 5.5 hours of incubation in TSB+ at 37oC.
DNA samples (10-μl) purified with the aid of pellet paint representing different
number of cells added initially to the ground beef (Lanes: d, 200; e, 150; f, 100; g,
50 cells / 10 g ) were subjected to PCR. PCR reaction mixture consisted of 5 μl of
10X PCR mix (final: 50 mM KCl, 0.01% gelatin, 10 mM Tris-HCl at pH 9.0), 1
μM each of the two primers, 0.2 mM each of dATP, dCTP, dGTP, and dTTP, 2.5
units of Taq polymerase, 1.0 mM MgCl2 in a final volume of 50 μl. DNA lysates
were obtained by lysing cell suspensions with TZ lysing solution. Controls
without Taq polymerase (Lane b) and without DNA (Lane c) were performed.
Row 1 and Row 2 were identical.

148
0
2000
4000
6000
8000
50 100 150 200
RE
LATI
VE
IN
TEN
SIT
Y
INITIAL NO. OF CFU PER 10 g SAMPLE
Fig. 46. Detection limits of SLT-1 target sequences as a result of 5.5 hours of
enrichment of E. coli O157:H7 isolated from ground beef. DNA lysates and PCR
procedure were performed as described in the legend of Fig. 45. Graphs represent
the mean values of amplified DNA resulting from integrated peak areas which
represent a typical agarose gel with standard deviations derived from three
different experiments.
RE
LATI
VE
FLU
OR
ES
CE
NC
E IN
TEN
SIT
Y

149
A B
Fig. 47. Gel electrophoresis of PCR products for the detection of E. coli O157:H7 (SLT-
2) in ground beef after an incubation time of 5.5 h (A) and 4.5 h (B) in TSB+ at
37oC. DNA samples (10-μl) purified with the aid of pellet paint representing
different number of cells added initially to the ground beef (Lanes: d, 50; e, 100;
f, 150; g, 200 cells/ 10 g) were subjected to PCR. PCR reaction mixture consisted
of 5 μl of 10X PCR mix (final: 50 mM KCl, 0.01% gelatin, 10 mM Tris-HCl at
pH 9.0), 1.6 μM each of the two primers, 0.2 mM each of dATP, dCTP, dGTP,
and dTTP, 5 units of Taq polymerase, 1.0 mM MgCl2 in a final volume of 50 μl.
DNA lysates were obtained by lysing cell suspensions with TZ lysing solution.
Controls without Taq polymerase (Lane b) and without DNA (Lane c) were
performed. Row 1 and Row 2 were identical.

150
0
2000
4000
6000
8000
10000
12000
50 100 150 200
RE
LATI
VE
IN
TEN
SIT
Y
INITIAL NO. OF CFU PER 10 g SAMPLE
4.5 h
5.5 h
Hours of incubation
Fig. 48. PCR detection limits of SLT-2 target sequences as a result of enumeration of E.
coli O157:H7 isolated from ground beef in TSB+ at 37oC. DNA lysates and PCR
procedure were performed as described in the legend of Fig. 47. Graphs represent
the mean values of amplified DNA resulting from integrated peak areas which
represent a typical agarose gel with standard deviations derived from three
different experiments.
RE
LATI
VE
FLU
OR
ES
CE
NC
E IN
TEN
SIT
Y
151
REFERENCES
Abdul-Raouf, U. M., Beuchat, L. R. and Ammar, M. S. 1993. Survival and growth of Escherichia coli O157:H7 in ground roasted beef as affected by pH, acidulants, and temperature. Appl. Environ. Microbiol. 59:2364-2368.
Abolmaaty, A., Vu, C., Oliver, J., and Levin, R. E. 2000. Development of a New Cell
Lysis Solution for Releasing Genomic DNA from Bacterial Cells for DNA Amplification by Polymerase Chain Reaction. J. Microbios.101:181-189.
Ahsenla, N., Wittwer, C. T., and Schütz1, E. 2001. Oligonucleotide Melting
Temperatures under PCR Conditions: Nearest-Neighbor Corrections for Mg2+, Deoxynucleotide Triphosphate, and Dimethyl Sulfoxide Concentrations with Comparison to Alternative Empirical Formulas. Clinical Chemistry. 47:1956-1961.
Akane, A., Matsubara, K., Nakamura, H., Takahashi, S., and Kimura, K. 1994.
Identification of the heme compound copurified with deoxyribonucleic acid (DNA) from blood strains, a major inhibitor of polymerase chain reaction (PCR) amplification. J. Forensic Sci. 39:362-372.
Albert, M. J., Faruque, S. M., Faruque, A. S., Neogi, P. K., Ansaruzzaman, M., Bhuiyan,
N. A., Alam, K., Akbar, M. S. 1995. Controlled study of Escherichia coli diarrheal infections in Bangladeshi children. J Clin Microbiol. 33:973-977.
Al-Soud, W., and Rådström, P. 1998. Capacity of Nine Thermostable DNA Polymerases
To Mediate DNA Amplification in the Presence of PCR-Inhibiting Samples. Appl. Envir. Microbiol. 64: 3748-3753.
Ashkenzi, S. and Thomas, G. C. 1989. Rapid method to detect shiga-like toxin I based on binding to Globotriosyl ceramide (Gb3), their natural receptor. Journal of Clinical Microbiology. 27:1145-1150.
Banatvala, N., Griffin, P. M., Greene, K. D., Barrett, T. J., Bibb,W. F., Green, J. H., and Wells, J. 2001. The United States National Prospective Hemolytic Uremic Syndrome Study: microbiologic, serologic, clinical, and epidemiologic findings. J. Infect. Dis. 183:1063-1070.
Barkate, M. L., Acuff, G. R., Lucia, L. M., and Hale, D. S. 1993. Hot water decontamination of beef carcasses for reduction of initial bacterial numbers. Meat Sci. 35:397-401.
152
Baumforth, K. R., Nelson, P. N., Digby, J. E., O’Neil, J. D., Murray, P. G. 1999. The polymerase chain reaction. Mol Pathol. 52:1-10.
Bessesen, M. T., Lou, Q., Rotbart, H. A., Blaser, M. J., and Ellison R. T. 1990. Detection of listeria monocytogenes by using the polymerase chain reaction. Applied and Environmental Microbiology. 56: 2930-2932.
Bettelheim, K. A., Evangelidis, H., Pearce, J. L., Sowers, E., Strockbine, N. A. 1993. Isolation of a Citrobacter freundii strain which carries the Escherichia coli O 157 antigen. J Clin Microbiol. 31:760-761.
Beutin, L., Kaulfuss, S., Cheasty, T., Brandenburg, B. B., Zimmermann, S., Gleier, K., Willshaw, G. A. and Smith, H. R. 2002a. Characteristics and association with disease of two major subclones of Shiga toxin (verocytotoxin)-producing strains of Escherichia coli (STEC) O157 that are present among isolates from patients in Germany. Diagnostic Microbiology and Infectious Disease. 44: 337-346.
Beutin, L., Zimmermann, S. and Gleier, K. 2002b. Evaluation of the VTEC-screen "Seiken" test for detection of different types of Shiga toxin (verotoxin)-producing Escherichia coli (STEC) in human stool samples. Diagnostic Microbiology and Infectious Disease. 42: 1-8
Blanco, J., Blanco, M., Blanco, J. E., Mora, A., Alonso, M. P., González, E. A., and Bernárdez, M. I. 2001. Epidemiology of verocytotoxigenic Escherichia coli (VTEC) in ruminants. p.113-148. In G. Duffy, P. Garvey, and D. McDowell (ed.), Verocytotoxigenic Escherichia coli. Food and Nutrition Press Inc., Trumbull, Conn.
Boerlin, P., McEwen, S. A., Boerlin-Petzold, F., Wilson, J. B., Johnson, R. P., and Gyles, C. L. (1999) Associations between virulence factors of Shiga toxin-producing Escherichia coli and disease in humans. Journal of Clinical Microbiology. 37: 497-503.
Bonardi, S., Foni, E. and Maggi, E. 2000. Comparison of Vero cell assay, polymerase chain reaction and an enzyme immunoassay for identification of verocytotoxin-producing Escherichia coli O157:H7. New Microbiology. 23:47-53.
Borczyk, A., Harnett, N., Lombos, H. and Lior, H. 1990. Falsepositive identification of Eschrichia coli 01.57 by commercial Latex agglutination test. 1ncet. 226:946-947.
Border, P. M., Howard, J. J., Plastow, G. S., and Siggens K. W. 1990. Detection of listeria species and listeria monocytogenes using polymerase chain reaction. Letters in Applied Microbiology. 11: 158-162.

153
Bower, J. R. 1999. Foodborne diseases: Shiga toxin producing E. coli (STEC). J. Infect. Dis. 18:909-910.
Breaks, J. L., Moore, A. S., Patchett, S., Collins, M. D., and Kroll, R. G. 1992. Use of the polymerase chain reaction and oligonucleotide probes for the rapid detection and identification of carnobacterium species from meat. Journal of Applied Bacteriology. 72: 194-301.
Brett, K. N., Ramachandran, V., Hornitzky, M. A., Bettelheim, K. A., Walker, M. J. and Djordjevic, S. P. 2003. stx1c Is the most common Shiga toxin 1 subtype among Shiga toxin-producing Escherichia coli isolates from sheep but not among isolates from cattle. Journal of Clinical Microbiology. 41: 926-936.
Brian, M. J., Frosolono, M., Murray, B. E., Miranda, A., Lopez, E. L. 1992. Polymerase chain reaction for diagnosis of enterohemorrhagic Escherichia coli infection and hemolytic uremic syndrome. J. Clin. Microbiol. 30:1801-1806.
Busta, F. F. 1976. Practical implication of injured microorganismsin foods. J. Milk Food Technol. 39:138-145.
Butler, J. E., McGivern, P. L., Cantarero, L. A., Peterson, L. 1980. Application of the amplified enzyme-linked immunosorbent assay: comparative quantitation of bovine serum IgG1, IgG2, IgA, and IgM antibodies. Am J Vet Res. 41:1479-91.
Caeiro, J. P., Estrada-Garcia, M. T., Jiang, Z., Mathewson, J. J., Adachi, Steffen, J. A., R., and DuPont, H. L. 1999. Improved detection of enterotoxigenic Escherichia coli among patients with travelers' diarrhea, by the use of the polymerase chain reaction technique. J. Infect. Dis. 180:2053-2055.
Canadian Council on Animal Care. 2002. Guidelines on antibody productions.Ottawa ON CANADA, K1R 1B1. http://www.ccac.
Centers for Disease Control and Prevention. 2000. Escherichia coli O111:H8 outbreak among teenage campers—Texas, 1999. MMWR 49:321-324.
Centers for Disease Control and Prevention. 1999a. Summary of notifiable diseases, United States, 1998. MMWR 47(53):1-94.
Centers for Disease Control and Prevention. 1999b. Surveillance for Outbreaks of Escherichia coli O157:H7 Infection. Summary of 1998 Data. Report from the National Center for Infectious Diseases, Division of Bacterial and Mycotic Diseases to CSTE. March 1999.
Centers for Disease Control and Prevention. 1993. Preliminary report: foodborne outbreak of Escherichia coli O157:H7 infections from hamburgers-western United States, 1993. MMWR Morb.Mortal.Wkly.Rep. 42:85-86.

154
Chapman P. A. 2001. Detection of Verocytotoxin-Producing Escherichia coli O157 On The Farm And At The Abattoir. In: Verocytotoxigenic E. coli. Edited by Duffy G, Garvey P and McDowell DA. Food & Nutrition Press Inc., Trumbull, CT USA. 11-24.
Chapman, P. A., Wright, D. J., Siddons, C. A. A. 1994. Comparison of immunomagnetic separation and direct culture for the isolation of verocytotoxin-producing Escherichia coli O157 from bovine faeces. J Med Microbiol. 40:424-427
Chen, J., Johnson, R., and Griffiths, M. 1998. Detection of Verotoxigenic Escherichia coli by Magnetic Capture-hybridization PCR. Applied and Environmental Microbiology. p. 147-152
Chernesky, M. A., Jang, D., Sellors, L., Luinstra, K., Chong, S., Castriciano, S., and Mahony, J. B. 1997. Urinary inhibitors of polymerase chain reaction and ligase chain reaction and testing of multiple specimens may contribute to lower assay sensitivities for diagnosing Chlamydia trachomatis infected women. Mol. Cell Probes 11:243-249
Clark, J. A. 1980. The influence of increasing numbers of non-indicator organisms upon the detection of indicator organisms by the membrane filter and presence-absence tests. Can. J. Microbiol. 26:827-32
Clark, B. R., Engvall, E. 1980. Enzymelinked immunosorbent assay (ELISA): theoretical and practical aspects. In Enzyme lmmunoassay, ed. ET Maggio. 167-80.
Clavero, M. R. S., and Beuchat L. R. 1995. Suitability of selective plating media for recovering heat- or freeze-stressed Escherichia coli O157:H7 from tryptic soy broth and ground beef. Appl. Environ. Microbiol. 61:3268-3273.
Cole, M. B., Davies, K. W.,Munro, G., Holyoak, C. D. and Kilsby, D. C. 1993. A vitalistic model to describe the thermal inactivation of Listeria monocytogenes. J. Ind. Microbiol. 12:232-239.
Conway, P. L. 1995. Microbial ecology of the human large intestine. In: G.R. Gibson and G.T. Macfarlane, eds.1-24.
Conner, D. E., and Hall, G. S. 1994. Efficacy of selected media for recovery of Escherichia coli O157:H7 from frozen chicken meat containing sodium chloride, sodium lactate or phosphate. Food Microbiol. 11:337-344.
Corbel, M. J. 1985. Recent advances in the study of brucella antigens and their serological cross-reactions. Vet Bull. 55:927-942.

155
Da Silva, A. J., Bornay-Llinares, F. J., Moura, I. N. S., Slemenda, S. B., Tuttle, J. L., and Pieniazek, N. J. 1999. Fast and reliable extraction of protozoan parasite DNA from fecal specimens. Mol. Diagn. 4:57-64.
Davey, K. R., and Smith, M. G. 1989. A laboratory evaluation of a novel hot water cabinet for the decontamination of sides of beef. Int. J. Food Sci. Technol. 24:305-316.
De Boer, E. and Heuvelink, A. E. 2000. Methods for the detection and isolation of Shiga toxin-producing Escherichia coli. Appl Microbiol. 29:133S-143.
Diaco, R. 1995. Practical considerations for the design of quantitative PCR assays. In: M. A. Innis, D. H. Gelfand, and J. J. Sninsky, (ed.) PCR Strategies. Academic Press, San Diego, CA. 84-108.
Dickinson, J. H., Kroll, R. G., and Grant K. A. 1994. The direct application of the polymerase chain reaction to DNA extracted from foods. Letters in Applied Microbiology . 20, 212-216.
Dickson, J. S., and Siragusa, G. R. 1994. Survival of Salmonella typhimurium, Escherichia coli O157:H7, and Listeria monocytogenes during storage on beef sanitized with organic acids. J. Food Safety. 14:313-327.
Dickson, J. S., and Anderson, M. E. 1991. Control of Salmonella on beef tissue surfaces in a model system by pre- and post-evisceration washing and sanitizing, with and without spray chilling. J. Food Prot. 54:514-518.
DiMichele, L. J., and Lewis, M. J. 1993. Rapid, species-specific detection of lactic acid bacteria from beer using the polymerase chain reaction. J. Am. Brew. Chem. Soc. 51:63-66.
Doellgast, G. J., Brown, J. E., Koufman, J. A., and Hatheway, C. L. 1997. Sensitive assay for measurement of antibodies to Clostridium botulinum neurotoxins A, B, and E: use of hapten-labeled-antibody elution to isolate specific complexes. J. Clin. Microbiol. 35: 578-583
Dorsa, W. J., C. N. Cutter, G. R. Siragusa, and M. Koohmaraie. 1996. Microbial decontamination of beef and sheep carcasses by steam, hot water spray washes, and a steam-vacuum sanitizer. J. Food Prot. 59:127-135.
Downes, F. P., Barrett, T. J., Green, J. H., Aloisio, C. H., Spika, J. S. 1988. Affinity purification of Shiga-like toxin II and production of toxin-specific monoclonal antibodies. Infect. lmmun. 56: 1926-33.
Doyle, M. P., and Schoeni, J. L. 1987. Isolation of Escherichia coli O157:H7 from retail fresh meats and poultry. Appl. Environmental Microbiology. 53:2394-2369.

156
Duffy, G., Garvey, P., and Sheridan, J. J. 2002a. A Europian study on animal food and biomedicalaspects of E. coli O157:H7, The National Food Centre, Dunsinea, Castleknock, Dublin 15, Ireland. Website:
http://www.teagasc.ie/research/reports/foodprocessing/4545/eopr-4545.htm.
Duffy G., Garvey, P., James J., Sheridan, J. J. 2002b.Teagasc, The National Food Centre, Dunsinea, Castleknock, Dublin 15, Ireland. Website: http://www.teagasc.ie/research/reports/foodprocessing/4545/eopr-4545.htm.
DuPont, H. L., Levine, M. M., Hornick, R. B., and Formal, S. B. 1989. Inoculum size in shigellosis and implications for expected mode of transmission. J. Infect. Dis. 159:1126-1128
Dwivedi, A., Sarin, B. C., Mittar, D. and Sehajpal, P. K. 2003. Optimization Of 38 Kda Based Pcr Assay For Detection Of Mycobacterium Tuberculosis From Clinical Samples. Indian Journal of Tuberculosis. 50: 209-217
Dylla, B. L., Vetter E. A., Hughes J. G., and Cockerill, F. R. 1995. Evaluation of an immunoassay for direct detection of Escherichia coli O157 in stool specimens. J. Clin. Microbiol. 33:222-224.
Dziezak, J. D. 1987. Rapid methods for microbiological analysis of foods. Food Technol. 41:56-73.
Eckert, K. A. and Kunkel, T. A. 1990. High fidelity DNA synthesis by the Thermus aquaticus DNA polymerase. Nucl. Acids Res. 18:3739.44.
Eeles, R. A. and Stamps, A. C. 1993. Managing the method. in Polymerase Chain Reaction (PCR) The Technique and its Application. Austin.12-26
Ehlen, T., and Dubeau, L. 1989. Detection of ras point mutations by polymerase chain reaction using mutation-specific, inosine-containing oligonucleotide primers. Biochem. Biophys. Res. Commun. 160: 441-447.
Eisenhauer, P. B., Chaturvedi, P., Fine, R. E., Ritchie, A. J., Pober, J. S., Cleary, T. G., and Newburg, D. S.. 2001. Tumor necrosis factor alpha increases human cerebral endothelial cell Gb3 and sensitivity to Shiga toxin. Infect.Immun. 69:1889-1894.
Elfath, M. Elnifro, Ahmed, M. Ashshi, Robert J. Cooper, and Paul E. 2000. Klapper Multiplex PCR: Optimization and Application in Diagnostic Virology. Clin. Microbiol. Rev. 13: 559-570
Elgersma, A. V., Zsom, R. L. J., Lyklema, J., Norde, W. 1992a. Kinetics of single and competitive protein adsorption studied by reflectometry and streaming potential measurements. Colloids Surfaces. 65:17-28.
157
Elgersma, A. V., Zsom, R. L. J., Lyklema, J., Norde, W. 1992b. Adsorption competition between albumin and monoclonal immuno-gamma-globulins on polystyrene latices. J Colloid Interface Sci. 152:410-428.
Ellsworth, D. L., Rittenhouse, K. D. and Honeycutt, R. L. 1993. Artifactual variation in randomly amplified polymorphic DNA banding patterns. BioTechniques. 14: 214-217.
Elsinghorst, E. A, and Weitz, J. A. 1994. Epithelial cell invasion and adherence directed by the enterotoxigenic Escherichia coli tib locus is associated with a 104-kilodalton outer membrane protein. Infect Immun. 62:3463-3471.
Elsinghorst, E. A, Kopecko, D. J. 1992. Molecular cloning of epithelial cell invasion determinants from enterotoxigenic Escherichia coli. Infect Immun. 60:2409-2417.
Escherich, T. 1885. Die darmbakterien des neugeborenen und sauglings. Fortshr. Med. 3:5-15.
Ewing, W.H. 1986. Edwards and Ewing's Identification of Enterobacteriaceae, 4th ed. Elsevier, New York. 522, 547-554.
Fields, P. I., Blom, K., Hughes, H. J., Helsel, L. O., Feng, P., and Swaminathan, B. 1997. Molecular characterization of the gene encoding H antigen in Escherichia coli and development of a PCR-restriction fragment length polymorphism test for identification of E. coli O157:H7 and O157:NM. J.Clin.Microbiol. 35:1066-1070.
Flores-Abuxapqui, J. J., Suarez-Itoil, G. J., Heredia-Navarrete, M. R., Puc-Franco, M. A., Franco-Monsreal, J. 1994. Frequency of enterotoxigenic Escherichia coli in infants during the first three months of life. Arch Med Res. 25:303–307.
Fluit, A. C., Terensma, R., Visser, M. J. C., Aarsman, C. J. M., Poppelier, M. J. J., Keller, B. H. I., Klapwijk, P., and Verhoef, J. 1993. Detection of Listeria monocytogenes in cheese with the magnetic immuno-polymerase chain reaction assay. Appl. Environ. Microbiol. 59:1289-1293
Fratamico, P. M., Bagi, L. K., and Pepe, T. 2000. A multiplex polymerase chain reaction assay for rapid detection and identification of Escherichia coli O157:H7 in foods and bovine feces. J. Food Prot. 63:1032-1037.
Fratamico, P., and Strobaugh, T. 1998. Simultaneous detection of Salmonella spp. and Escherichia coli O157:H7 by multiplex PCR. J. Indust. Microbiol. Biotechnol. 21:92-98.
Fratamico, P. M., Schultz, F. J., and Buchanan, R. L. 1992. Rapid isolation of Escherichia coli O157:H7 from enrichment cultures of foods using an immunomagnetic separation method. Food Microbiology. 9: 105-113.

158
Friedrich, A.W., Bielaszewska, M. and Karch, H. 2002a. Diagnosis of Shiga toxin-producing Escherichia coli infections. Journal of Laboratory Medicine. 26:183-190.
Friedrich, A. W., Bielaszewska, M., Zhang, W. L., Pulz, M., Kuczius, T., Ammon, A. and Karch, H. 2002b. Escherichia coli harboring Shiga toxin 2 gene variants: frequency and association with clinical symptoms. Journal of Infectious Diseases. 185:74–84.
Fredricks, D. N., and Relman, D. A. 1999. Application of polymerase chain reaction of the diagnosis of infectious diseases. Clin. Infect. Dis. 29:475-488.
Fung, D. Y. C. 1991. Rapid methods and automation for food microbiology. 1-38. In: Instrumental Methods for Quality Assurance in Foods. D.Y.C. Fung and R.F. Matthews (eds). Marcel Dekker, New York.
Fung, D. Y. C., Cox, N. A. and J. S. Bailey. 1988. Rapid methods and automation in the microbiological examination of food. Dairy Food Sanit. 8:292-296.
Furrer, B., Candrian, U., Hoefelein, Ch., and Luethy, J. 1991. Detection and identification of Listeria monocytogenes in cooked sausage product and in milk by in vitro amplification of haemolysin gene fragments. J. Appl. Bacteriol. 70:372-379.
Galvin, J. P., Looney, C. E., Leflar, C. C., Luddy, M. A., Litchfield, W. S., Freytag, J. W., Miller, W. K. 1983. Particle enhanced photometric immunoassay systems. Nakamura RM Ditto WR Tucker ES, III eds. Clinical laboratory assays: new technology and future directions. 73-95.
Gannon, V. P., D’Souza, S., Graham, T., King, R. K., Rahn, K., and Read, S. 1997. Use of the flagellar H7 gene as a target in multiplex PCR assays and improved specificity in identification of enterohemorrhagic Escherichia coli strains. J.Clin.Microbiol. 35:656-662.
Gannon, V. P. J., Rashed, M., King, R. K., Golsteyn Thomas, E. J. 1993. Detection and characterization of eae gene of Shigalike toxin-producing Escherichia coli using polymerase chain reaction. J. Clin. Microbiol. 31:1268-74
Gannon, V. P. J., King, R. K., Kim, J. Y., and Thomas E. J. G. 1992.Rapid and sensitive method for detection of Shiga-Like Toxin-Producing Esherichia coli in ground beef using the polymerase chain reaction. Applied and Environmental Microbiology.58: 3809-3815.
Gannon, V. P., Teerling, C., Masri, S. A., and Gyles, C. L. 1990. Molecular cloning and nucleotide sequence of another variant of the Escherichia coli Shiga-like toxin II family. J.Gen.Microbiol. 136:1125-1135
159
Garcia, M. E., Blanco, J. L., Caballero, J, and Gargallo-Viola, D. 2002. Anticoagulants interfere with PCR used to diagnose invasive aspergillosis. J. Clin. Microbiol. 40:1567-1568
Gibson, J. R., Sutherland, K., and Owen, R. J. 1994. Inhibition of DNAse activity in PFGE analysis of DNA from Campylobacter jejuni. Lett. Appl. Microbiol. 19:357-358.
Gradil, C., Sampath, M., and Eaglesome M. D.,1994. Detection of verotoxigenic Escherichia coli in bull semen using the polymerase chain reaction. Veterinary microbiology. 42: 239-244.
Griffin, P. M. 1995. Escherichia coli O157:H7 and other enterohemorrhagic Escherichia coli.739-761 in Infections of the Gastrointestinal Tract, M. J. Blaser, P. D. Smith, J. I. Ravdin, H. B. Greenberg, and R. L. Guerrant, eds. New York: Raven Press, Ltd.
Griffin, M., Davis, M. A., Gordon, D. C., Tarr, P. I., Bartleson, C. A., Lewis, J. H., Barrett, T. J., Wells, J. G. 1994. A multistate outbreak of Escherichia coli O157:H7-associated bloody diarrhea and hemolytic uremic syndrome from hamburgers. The Washington experience. JAMA. 272:1349-1353.
Gunzburg, S. T, Chang, B. J, Elliott, S. J, Burke, V, Gracey, M. 1993. Diffuse and enteroaggregative patterns of adherence of enteric Escherichia coli isolated from aboriginal children from the Kimberley region of Western Australia. J Infect Dis. 167:755-758.
Harlow, E. and Lane, D. 1988a. Immunization. In Antibodies: A Laboratory Manual. (Cold Spring Harbor Laboratory, Cold spring Harbor, N.Y). 53-135.
Harlow, E. and Lane, D. 1988b. Antibody molecules. In Antibodies: A Laboratory Manual. (Cold Spring Harbor Laboratory, Cold spring Harbor, N.Y). 7:23
Harlow, E. and Lane, D. 1988c. Immunoaffinity purification. In Antibodies: A Laboratory Manual. (Cold Spring Harbor Laboratory, Cold spring Harbor, N.Y). 511-553.
Harmon, B. G., Brown, C. A., Doyle M. P., and Zhao, T. 2000. Enterohemorrhagic Escherchia coli in Ruminant Hosts. 201-215. In C. A. Brown and C. Bolin (eds.), Emerging Diseases of Animals. ASM Press, Washington D.C.
Hartman PA. 1979. Modificationofconventional methods for recovery of injured coliforms and salmonellae. J. Food Prot. 42:356-361.
Hartman, P. A., Hartman, P. S. and Lanz, W. W. 1975. Violet Red Bile 2 Agar for stressed coliforms. Appl. Microbiol. 29:537-539.

160
Hartung, M. 1993. Occurrence of enteritis-causing salmonellae in food and in domestic animals in 1991. DTW Dtsch. Tierartzl. Wochenschr. 100:259-261.
Herman, L. M. F., De Bloock, J. H. G. E., and Moerrmans R. J. B. 1995. Direct detection of Listeria Monocytogenes in 25 milliliters of raw milk byTwo-Step PCR with Nested primers. Applied and Environmental Microbiology. 61:817-819.
Hidalgo-Alvarez, R., Galisteo-Gonzalez, F. 1995. The adsorption characteristics of immunoglobulins. Heterogeneous Chem Rev. 2:249-268.
Hirayama, T. 1995. Heat-stable enterotoxin of Escherichia coli. In: Moss J., Iglewski B., Vaughan M., and Tu, A. T. , editors. Bacterial toxins and virulence factors in disease. New York, N.Y: Marcel Dekker, Inc. p.281-296.
Hirst, T. R. 1995. Biogenesis of cholera toxin and related oligomeric enterotoxins. In: Moss J, Iglewski B, Vaughan M, Tu A. T. editors. Bacterial toxins and virulence factors in disease. New York, N.Y: Marcel Dekker, Inc. pp. 123–184.
Hol, W. G. J., Sixma, T. K., Merritt, E. A. 1995. Structure and function of E. coli heat-labile enterotoxin and cholera toxin B pentamer. In: Moss J., Iglewski B., Vaughan M., and Tu A.T. Bacterial toxins and virulence factors in disease. New York, N.Y: Marcel Dekker, Inc. 185-223.
Holmes, R. K., Jobling, M. G., Connell, T. D. 1995. Cholera toxin and related enterotoxins of gram-negative bacteria. In: Moss J, Iglewski B, Vaughan M, Tu AT. , editors. Bacterial toxins and virulence factors in disease. New York, N.Y: Marcel Dekker, Inc. 225-255.
Hoque, S. S., Faruque, A. S., Mahalanabis, D., Hasnat, A. 1994. Infectious agents causing acute watery diarrhoea in infants and young children in Bangladesh and their public health implications. J Trop Pediatr. 40:351-354.
Hurst A. 1977. Bacterial injury: a review. Can. J. MicrobioL. 23:935-44
Ibrahim, G. F. 1986. A review of immunoassays and their application to Salmonellae detection in foods. J. Food Prot. 49:299-310.
Innis, M. A., Gelfand, D. H. and Sninsky, J. J. 1995. (ed.) PCR Strategies. Academic Press, San Diego, CA. 347-361.
Innis, M.A. and Gelfland, D.H.1990. Optimization of PCR’s. In PCR protocols: A guide to methods and applications; Eds. Academic Press, New York. 3-12
Innis, M. A., Myambo, K. B., Gelfand, D. H., and Brow, A. D. 1988. DNA sequencing with Thermus aquaticus DNA polymerase and direct sequencing of polymerase chain reaction-amplified DNA. Proc. Natl. Acad. Sci. USA. 85:9436-9440.

161
Ito, H., Yutsudo, T., Hirayama, T., and Takeda Y. 1988. Isolation and some properties of A and B subunits of Vero toxin 2 and in vitro formation of hybrid toxins between subunits of Vero toxin 1 and Vero toxin 2 from Escherichia coli O157:H7. Microb.Pathog. 5:189-195.
Itoh, K., Tezuka, T., Inoue, K., Tada, H., and Suzuki T. 2001. Different binding property of verotoxin-1 and verotoxin-2 against their glycolipid receptor, globotriaosylceramide. Tohoku J. Exp.Med. 195:237-243.
Jackson, M. P., Neill, R. J., O'Brien, A. D., Holmes, R. K., and Newland, J. W. 1987a . Nucleotide sequence analysis and comparison of the structural genes for Shiga-like toxin I and Shiga-like toxin II encoded by bacteriophage from Escherichia coli 933. FEMS Microbiol. Lett. 44:109-114.
Jackson, M. P., Newland, J. W., Holmes, R. K., and O'Brien, A. D. 1987b. Nucleotide sequence analysis of the structural genes for Shiga-like toxin I encoded by bacteriophage 933J from Escherichia coli. Microbial Pathogenesis. 2:147-153.
Jacobsen, C. S. 1995. Microscale detection of specific bacterial DNA in soil with a magnetic capture-hybridization and PCR amplification assay. Appl. Environ. Microbiol. 61:3347-3352.
Jacobsen, C. S., and Rasmussen, O. F. 1992. Development and application of a new method to extract bacterial DNA from soil based on separation of bacteria from soil with cation-exchange resin. Appl. Environ. Microbiol. 58:2458-2462.
Jay, J. M. 1986. Modern food microbiology. Van Nostrand Reonhold, New York, 3rd ed.100.
Jay, J. M. 1985. Analysis of food products for microorganisms or their products by nonculture methods. In Food Analysis Principles and Techniques, ed. DW Gruenwedel, JR Whitaker. 87-126.
Johnson, R. 2004. Pre-harvest Detection and Control of Verotoxin (Shigatoxin)producing Escherichia coli. 3rd World Buiatrics Congress, Laboratory for Foodborne Zoonoses, Health Canada, Guelph, ON, N1G 3W4, Canada.
Johnson, R. P., Clarke, R. C., Wilson, J. B., Read, S. C., Rahn, K., Renwick, S. A., Sandhu, K. S., Alves, D., Karmali, M. A., Lior, H., McEwen, S. A., Spika, J. S., Gyles, C. L. 1996. Growing concerns and recent outbreaks involving non-O157:H7 verotoxigenic Escherichia coli. J. Food Protect. 59:1112-1122.
Johnson W. M, Lior, H. 1988. A new heat-labile cytolethal distending toxin (CLDT) produced by Escherichia coli isolates from clinical material. Microb Pathog. 4:103–113.

162
Johnson, W. M., H. Lior, and G. S. Bezanson. 1983. Cytotoxic Escherichia coli O157:H7 associated with haemorrhagic colitis in Canada. Lancet 1:76.
Kang, D. H., and Fung, D. Y. C. 1999. Development of a medium for differentiation between Escherichia coli and Escherichia coli O157:H7. J. Food Prot. 62:313-317
Kaplan B. S., Trompeter, R. S., Moake J. L. 1992. Hemolytic-uremic syndrome and thrombotic thrombocytopenic purpura. New York: Marcel Dekker, Inc.
Kapperud, G., Vardund, T., Skjerve, E., Homes, E., Michaelsen, T. E. 1993. Detection of pathogenic Yersinia enterocolitica in foods and water by immunomagnetie separation, nested polymerase chain reactions, and colorimetric detection of amplified DNA. AppL Environ. Microbiol. 59:2938-44.
Karch, H., Schubert, S., Zhang D., Zhang W., Schimdt, H., Ölschläger T., and Hacker, J. 1999a. A genomic island, termed high-pathogenicity island is present in certain non-O157 Shiga toxin-producing Escherichia coli clonal lineages. Infect. Immun. 67:5994-6001
Karch, H., Bielaszewska, M., Bitzan, M., Schmidt, H. 1999b. Epidemiology and diagnosis of Shiga toxin-producing Escherichia coli infections. Diagn Microbiol Infect Dis. 34:229-43.
Karmali, M. A. 1989. Infection by verocytotoxin-producing Escherichia coli. Clinical Microbiological Reviews 2:15-38
Karmali M. A., Steele, B. T., Petric, M. 1983. Sporadic cases of hemolytic-uremic syndrome associated with faecal cytotoxin-producing Escherichia coli in stools. Lancet.1: 619-620.
Kassenborg, H., Hedberg, C., Hoekstra, M., Evans, M.C., Chin, A.E., Marcus, R., Vugia, D., Smith, K., Desai, S., Slutsker, L., Griffin, P., and the FoodNet Working Group. 2001. Farm visits and undercooked hamburgers as major risk factors for sporadic Escherichia coli O157:H7 infections-data from a case-control study in five FoodNet sites.
Katcher, H. L., and Schwartz, I. 1994. A distinctive property of Tth DNA polymerase: enzymatic amplification in the presence of phenol. BioTechniques .16:84-92
Kehl, S. C. 2002. Role of the Laboratory in the Diagnosis of Enterohemorrhagic Escherichia coli Infections, Journal of Clinical Microbiology. 40: 2711-2715.
Khan, G., Kangro, H. O., Coates, P. J., and Heath, R. B. 1991. Inhibitory effects of urine on the polymerase chain reaction for cytomegalovirus DNA. J. Clin. Pathol. 44:360-365.

163
Kim, S., Labbe, R., and Ryu S. 2000. Inhibitory Effects of Collagen on the PCR for Detection of Clostridium perfringens. Appl Environ Microbiol. 66:1213-1215.
Kirchgatterer, A., Weber, T., Hinterreiter, M., Knoflach, P. and Allerberger, F. 2002. Haemorrhagic colitis due to Escherichia coli O103:H2 associated with infliximab therapy in a patient with rheumatoid arthritis. Rheumatology. 41: 355-356.
Klein, E. J., Stapp, J. R., Clausen, C. R., Boster, D. R., Wells, J. G., Qin, X., Swerdlow, D. L. and Tarr, P. I. 2002. Shiga toxin-producing Escherichia coli in children with diarrhea: a prospective point-of-care study. Journal of Pediatrics.141: 172-177.
Klein, A., Barsuk, R., Dagan, S., Nusbaum, O., Shouval, D., and Galun E. 1997. Comparison of methods for extraction of nucleic acids from hemolytic serum for PCR amplification of hepatitis B virus DNA sequences. J. Clin. Microbiol. 35:1897–1899.
Klein-Schneegans, A., Gaveriaux, C., Fontaneau, P., Loor, F. 1989a. Indirect double sandwich ELISA for the specific and quantitative measurement of mouse IgM, IgA and IgG subclass. J Immunol Meth.119: 117-25.
Klein-Schneegans, A. S., Kuntz, L., Fonteneau, P., Loor, F. 1989b. Serum concentrations of IgM, IgG1, IgG2b, IgG3 and IgA in C57BL/6 mice and their congenics at the lpr (lymphoproliferation) locus. J Autoimmun. 6:869-75.
Klein-Schneegans, A. S., Kuntz, L., Fonteneau, P., Loor, F. 1989c. An indirect asymmetrical sandwich ELISA using anti-allotype antibodies for the specific and quantitative measurement of mouse IgG2a of Igh-1b allotype. J Immunol Methods. 125:207-213
Koch, C., Hertwig, S., Lurz, R., Appel, B. and Beutin, L. 2001. Isolation of a lysogenic bacteriophage carrying the stx(1(OX3)) gene, which is closely associated with Shiga toxin-producing Escherichia coli strains from sheep and humans. Journal of Clinical Microbiology 39: 3992-3998.
Kohler, G., and Milstein, C. 1975. Continuous cultures of fused ceils secreting antibody of predefined specificity. Nature. 256: 495-97
Konowalchuk, J., Speirs, J. I., and S. Stavric. 1977. Vero response to a cytotoxin of Escherichia coli. Infect.Immun. 18:775-779.
Kroll , R. G. 1993. Microbiological Analysis of Foods. In: DNA Probes ed. G. H. Keller, G. H. and M. M. Manak. 565-588.
Lantz, P. G., Matsson, M., Wadström, T., and Rådström, P. 1997. Removal of PCR inhibitors from human faecal samples through the use of an aqueous two-phase system for sample preparation prior to PCR. J. Microbiol. Methods. 28:159-167.
164
Lantz, P. G., Hahn-Ha¨gerdal, B., and Rådstro¨m, P. 1994a. Sample preparation methods in PCR-based detection of food pathogens. Trends Food Sci. Technol. 5:384-389.
Lantz, P.-G., Tjerneld, F., Borch, E., Hahn-Ha¨gerdal, B., and Rådstro¨m, P. 1994b. Enhanced sensitivity in PCR detection of Listeria monocytogenes in soft cheese through use of an aqueous two-phase system as a sample preparation method. Appl. Environ. Microbiol. 60:3416-3418.
Lawyer, F. C., Stoffel, S., Saiki, R. K., Myambo, K., Drummond, R., and Gelfand, D. H. 1989. Isolation, characterization, and experition in Escherichai coli of the DNA polymerase gene rom Thermus aquaticus. J. Biol. Chem. 206:6427-6437
Lees, D. N., Henshilwood, K., and Dore´, W. J. 1994. Development of a method for detection of enteroviruses in shellfish by PCR with poliovirus as a model. Appl. Environ. Microbiol. 8:2999-3005.
Le Saux, N., Spika, J. S., Friesen, B., Johnson, I., Melnychuck, D., Anderon, C., Dion, R., Rahman, M., and Tostowaryk, W. 1993. Ground beef consumption in noncommercial settings is a risk factor for sporadic Escherichia coli O157:H7 infection in Canada. J Infect Dis 167:500-502.
Levin, R. E. 1969. Electrically heated cuvette chamber for deoxyribonucleic acid melting point determinations. Appl. Microbiol. 18:528.
Levine, M. M., Ferreccio, C., Prado, V., Cayazzo, M., Abrego, P., Martinez , J., Maggi, L., Baldini, M. M., Martin, W., Maneval, D., Kay, B., Guers, L., Lior, H., Wasserman, S. S., Nataro, J. P. 1993. Epidemiologic studies of Escherichia coli diarrheal infections in a low socioeconomic level peri-urban community in Santiago, Chile. Am J Epidemiol. 138:849-869.
Li, Y., and Mustapha, A. 2002. Evaluation of four template preparation methods for polymerase chain reaction-based detection of Salmonella in ground beef and chicken. Letters in Applied Microbiology. 35: 508
Lin, Z., Kurazono, H., Yamasaki, S., and Takeda, Y. 1993. Detection of various verotoxin genes in Escherichia coli by polymerase chain reaction. Microbiol. Immunol. 37:543:548.
Lindqvist, R., Norling, B., and Lambertz, S. T. 1997. A rapid sample preparation method for detection of food pathogens based on buoyant density centrifugation. Appl. Microbiol. 24:306-310.
Lindström, M., Keto, R., Markkula, A., Nevas, M., Hielm, S., and Korkeala, H.(2001). Multiplex PCR Assay for Detection and Identification of Clostridium botulinum Types A, B, E, and F in Food and Fecal Material. Applied and Environmental Microbiology. 67:5694-5699.

165
Ling, H., Boodhoo, A., Hazes, B., Cummings, M. D., Armstrong G. D., Brunton J. L., and Read R. J. 1998. Structure of the shiga-like toxin I B-pentamer complexed with an analogue of its receptor Gb3. Biochemistry. 37:1777-1788.
Lior, H., Borczyk, A. A. 1987. False positive identifications of Escherichia coli O157. Lancet. i:333.
Litchfield, W. J, Craig, A. R., Frey, W. A., Leflar, C. C., Looney, C. E., Luddy, M. A. 1984. Novel shell/core particles for automated immunoassays. Clin Chem. 30:1489-1493.
Lou, Q., Chong, S. K. F., Fitzgerald ,J. F., Siders, J. A., Allen, S. D., and Lee, C. 1997. Rapid and effective method for preparation of fecal specimens for PCR assays. J. Clin. Microbiol. 35:281-283.
Lowry, O. H., Rosbrough, N. J., Farr, A. L. and Randall, R. J. 1951. Protein measurement with the Folin phenol reagent. J. Biol. Chem. 193: 265.
MacDonald, K. W., O’Leary, M. J., Cohen, M. L., Norris, P., Wells, J. G., E., Noll J., Kobayashi, M., and Blake, P.A. 1988. Escherichia coli O157:H7, an emerging gastrointestinal pathogen: Results of a one-year, prospective, population-based study. JAMA. 259:3567-3570.
Manafi, M., and Kremsmaier, B. 2001. Comparative evaluation of different chromogenic/fluorogenic media for detecting Escherichia coli O157:H7 in food. Int J Food Microbiol. 71:257-62.
Mangia, A. H., Duarte, A. N., Duarte, R., Silva, L. A., Bravo, V. L., Leal, M. C. 1993. Aetiology of acute diarrhoea in hospitalized children in Rio de Janeiro City, Brazil. J Trop Pediatr. 39:365-367.
March, S. R. and Ratnam, S. 1989. Latex agglutination test fix detection of Escherichia coli serotype 01.37. Journal of clinical microbiology. 27: 1675-1677.
Mead, P. S., Slutsker, L., Dietz, V., McCaig, L. F., Bresee, J. S., Shapiro, C., Griffin, P. M., Tauxe, R. V. 1999. Food-Related Illness and Death in the United States. Emerg. Infect. Dis. 5:607-625.
Mead, P. S., Finelli, L., Lambert-Fair, M. A., Champ, D., Townes, J., Hutwagner, L., Barrett, T., Spitalny, K., Mintz, E. 1997. Risk factors for sporadic infection with Escherichia coli O157:H7. Arch Intern Med. 157:204-8.
Melton-Celsa, A. and O'Brien, A. 2003. Plant and bacterial toxins as RNA N-glycosidases. In Bacterial Protein Toxins ed. Burns, D., Barbieri, J.T., Iglewski, B.H. and Rappuoli, R. 245-255. Washington, DC: ASM Press
166
Meng, J. and M. P. Doyle. 1998. Microbiology of shiga toxin-producing Escherichia coli in foods, p. 92-108. In A. D. O’Brien and J. B. Kaper (eds.), Escherichia coli O157:H7 and other Shiga toxin-producing E. coli strains. ASM, Washington, DC.
Meyer-Broseta, S., Bastian, S. N., Arne, P. D., Cerf, O., and Sanaa, M. 2001. Review of epidemiological surveys on the prevalence of contamination of healthy cattle with Escherichia coli serogroup O157:H7. Int.J.Hyg.Environ.Health. 203:347-361.
McCarthy, J.,Holbrook, R. and Stephens, P. J. 1998. An improved direct plate method for the enumeration of stressed Escherichia coli O157:H7 from food. J. Food Prot. 61:1093-1097
McCleer, D. R., and Rowe, M. T. 1995. Development of a selective plating technique for the recovery of Escherichia coli O157:H7 after heat stress. Lett. Appl. Microbiol. 21:252-256
Monteiro, L., Bonnemaison, D., Vekris, A., Petry, K. G., Bonnet, J., Vidal, R., Cabrita, J., and Megraud, F. A.1997. Complex polysaccharides as PCR inhibitors in feces: Helicobacter pylori model. J. Clin. Microbiol. 35:995-998.
Morata, P., Queipo-Ortuno M. I., and Colmenero J. de Dios,. 1998. Strategy for optimizing DNA amplification in a peripheral blood PCR assay used for diagnosis of human brucellosis. J. Clin. Microbiol. 36:2443-2446
Mullis, K. B., Faloona, F. A., Scharf, S. J., Saiki, R. K., Horn, G. T., Erlich, H. A. 1986. Specific enzymatic amplification of DNA in vitro: the polymerase chain reaction. Cold Spring Harbor Symp. Quant. Biol. 51:263
Nakamura, M., Ohshima, H., Kondo, T. 1992. Aggregation behavior of antibody-carrying latex particles. J Colloid Interface Sci. 154:393-399.
Nakano, S., Fujimoto, M., Hara, H., Sugimoto N. 1999. Nucleic acid duplex stability: influence of base composition on cation effects. Nucleic Acids Res. 27:2957-2965.
Nataro, J. P., and Kaper, J. B. 1998. Diarrheagenic Escherichia coli. Clin. Microbiol. Rev. 11:142-201.
Neill, M. A., Tarr, P. I.,Taylor, D. N., and Trofa, A. F.1994. Escherichia coli. In Foodborne Disease Handbook, Y. H. Hui, J. R. Gorham, K. D. Murell, and D. O. Cliver, eds. Marcel Decker, Inc. New York.169-213.
Nishikawa, Y., Zhou, Z., Hase, A., Ogasawara, J., Cheasty, T. and Haruki, K. 2000. Relationship of genetic type of Shiga toxin to manifestation of bloody diarrhea due to enterohemorrhagic Escherichia coli serogroup O157 isolates in Osaka City, Japan. Journal of Clinical Microbiology. 38: 2440–2442
167
Notermans, S., Wernars, K. 1991. Immunological methods for detection of foodborne pathogens and their toxins. Int. J. Food Microbiol. 12: 91-102.
Novicki, T. J., Daly, J. A., Mottice, S. L., and Carroll, K. C. 2000. Comparison of sorbitol MacConkey agar and a two-step method which utilizes enzyme-linked immunosorbent assay toxin testing and a chromogenic agar to detect and isolate enterohemorrhagic Escherichia coli. J. Clin. Microbiol. 38:547-551.
O’Brien, A. D., Holmes, R. K. 1996. Protein toxins of Escherichia coli and Salmonella. In: Neidhardt FC, Curtiss III R, Ingraham, J. L., Lin, E. C. C., Low, K. B., Magasanik, B., Reznikoff, W. S., Riley, M., Schaechter, M., Umbarger, H. E., editors. Escherichia coli and Salmonella: cellular and molecular biology. 2nd ed. Washington, D.C: ASM Press. 2788-2802.
O'Brien, A. D., and Holmes, R. K.1987. Shiga and Shiga-like toxins. Microbiol. Rev. 51: 206-220.
O’Brien, A. D. and LaVeck, G. D. 1983. Purification and characterization of a Shigella dysenteriae 1-like toxin produced by Escherichia coli. Infect. Immun. 40:675-683.
O’Brien, A. D., Lively, T. A., Chang, T. W., and Gorbach, S. L. 1983. Purification of Shigella dysenteriae 1 (Shiga)-like toxin from Escherichia coli O157:H7 strain associated with haemorrhagic colitis. Lancet. 2:573.
O'Brien, A. D., LaVeck, G. D., Thompson, M. R., and Formal, S. B. 1982. Production of Shigella dysenteriae type 1-like cytotoxin by Escherichia coli. J. Infect. Dis. 146:763-769
O'Mahony, J., and Hill, C. 2004. Rapid real-time PCR assay for detection and
quantitation of Mycobacterium avium subsp paratuberculosis DNA in artificially
contaminated milk. Applied And Environmental Microbiology 70: 4561-4568.
Ojeda, A., Prado V., Martinez J., Arellano C., Borczyk A., Johnson W., Lior H., and Levine, M. M. 1995. Sorbitol-negative phenotype among enterohemorrhagic Escherichia coli strains of different serotypes and from different sources. J. Clin. Microbiol. 33:2199-2201.
Okrend, A. J. G., Rose, B. E., and Lattuada, C. P. 1992. Isolation of Escherichia coli O157:H7 using O157 specific antibody coated magnetic beads. J. Food Prot. 55:214-217.
Olce´n, P., Lantz, P. G., Ba¨ckman, A., and Rådstro¨m, P. 1995. Rapid diagnosis of bacterial meningitis by a seminested PCR strategy. Scand. J. Infect. Dis. 27: 537-539.

168
Padhye, N. V. and Doyle, M. P. 1992. Escherichia coli O157:H7: Epidemiology, pathogenesis, and methods for detection in food. Journal of food protection. 55: 555-565.
Padhye, N. V., Doyle, M. P. 1991a. Rapid procedure for detecting enterohemorrhagic Escherichia coli O157:H7 in food. Al~pl. Environ. Microbiol. 57: 2693-98.
Padhye, N. V., Doyle, M. P. 1991b. Production and characterization of a monoclonal antibody specific for enterohemorrhagic Escherichia coli of serotypes O157:H7 and O26:H11. J. Clin. Microbiol. 29:99-103.
Padhye, V. V., Zhao, T., Doyle, M. P. 1989. Production and characterisation of monoclonal antibodies to verotoxins 1 and 2 from Escherichia coli of serotype O157:H7. J. Med. Microbiol. 30:219-226.
Palumbo, S., Call, J., Schultz, F., and Williams, A. 1995. Minimum and maximum temperatures for growth and verotoxin production by hemorrhagic strains of Escherichia coli. J. Food Prot. 58:352-356.
Parrish, K. D. and Greenberg, E. P. 1995. A rapid method for Extraction and purification of DNA from dental plaque. Applied and environmental Microbiology. 61: 4120-4123.
Partis, L., Newton, K., Murby, J., and Wells R. J. 1994. Inhibitory effects of enrichment media on the Accuprobe test for Listeria monocytogenes. Appl. Environ. Microbiol. 60:1693-1694.
Paton, J. C., and Paton A. W. 1998a. Pathogenesis and diagnosis of Shiga toxin-producing Escherichia coli infections. Clin. Microbiol. Rev. 11:450-479.
Paton, A. W. and Paton, J. C.1998a. Detection and characterization of Shiga toxigenic Escherichia coli by using multiplex PCR assays for stx1, stx2, eaeA, enterohemorrhagic E. coli hlyA, rfbO111, and rfbO157. J.Clin.Microbiol. 36:598- 602.
Perna, N. T. 2001. Genome sequence of enterhaemorrhagic E. coli O157:H7. Nature. 409: 529-533.
Pièrard, D., Muyldermans, G., Moriau, L., Stevens, D. and Lauwers, S. 1998. Identification of new verocytotoxin type 2 variant B-subunit genes in human and animal Escherichia coli isolates. Journal of Clinical Microbiology. 36:3317-3322.
Pitcher, D. G., Saunders, N.A, and Owen, R. J. 1989. Rapid extraction of bacterial genomic DNA with guanidium thiocyanate. Letters in Applied Microbiology. 8:151-158.

169
Pollard, D. R., Johnson, W. M., Lior, H., Tyler, S. D., and Rozee, K. R.1990. Rapid detection of verotoxin genes in Escherichia coli by the polymerase chain reaction. J. Clin. Microbiol. 28:540-545.
Powell, H. A., Gooding, C. M., Garrett, S. D., Lund, B. M., and McKee, R. A. 1994. Proteinase inhibition of the detection of Listeria monocytogenes in milk using the polymerase chain reaction. Lett. Appl. Microbiol. 18:59-61.
Price, C. P., Newman, D. J. 1997. Light scattering immunoassay.Macmillan Reference London. Principles and practice of immunoassay 2nd ed.443-480.
Ramachandran, V., Hornitzky, M. A., Bettelheim, K.A., Walker, M. J. and Djordjevic, S. P. 2001. The common ovine Shiga toxin 2-containing Escherichia coli serotypes and human isolates of the same serotypes possess a Stx2d toxin type. Journal of Clinical Microbiology. 39: 1932–1937
Ramotar K., Waldhart, B., Church, D., Szumski, R., and Louie, T. J. 1995. Direct detection of verotoxin-producing Escherichia coli in stool samples by PCR. J. of Clinical Microbiol. 33: 519-524.
Ray, B., and Adams, D. M. 1984. Repair and detection of injured microorganisms. 112-113. In M. L. Speck (ed.), Compendium of methods for the microbiological examination of foods. American Public Health Association, Washington, D.C.
Ray, B. 1979. Methods to detect stressed microorganisms. J. Food Prot. 42:346- 55.
Riley, L. W., Remis, R. S., Helgerson S. D., McGee H. B., Wells J. G., Davis, B. R., Hebert R. J., Olcott, E. S., Johnson, L. M., Hargrett, N. T., Blake, P. A., and Cohen, M. L. 1983. Hemorrhagic colitis associated with a rare Escherichia coli serotype. New Engl J Med 308:681-685.
Rios, M., Prado, V., Trucksis, M., Arellano, C., Borie C., Alexandre M., Fica A., and Levine M. M. 1999. Clonal diversity of Chilean isolates of enterohemorrhagic Escherichia coli from patients with hemolytic-uremic syndrome, asymptomatic subjects, animal reservoirs, and food products. J. Clin. Microbiol. 37:778-781.
Rochelle, M., Clavero, S., and Beuchat, L. R. 1996. Survival of Escherichia coli O157:H7 in broth and processed salami as influenced by pH, water activity, and temperature and suitability of media for its recovery. Appl. Environ. Microbiol. 62:2735-2740
Rossen, L., Nørskov, P., Holmstrømet, K., and Rasmussen, O. F. 1992. Inhibition of PCR by components of food samples, microbial diagnostic assays and DNA-extraction solutions. Int. J. Food Microbiol. 17:37–45.

170
Sage, J. R., and Ingham S. C. 1998. Evaluating survival of Escherichia coli O157:H7 in frozen and thawed apple cider: potential use of a hydrophobic grid membrane filter-SD-39 agar method. J. Food Prot. 61:490-494.
Saiki, R. K., Gelfland, D. H., Stoffel, S., Scharf, S. J., Higuchi, R. 1988. Primer-directed enzymatic amplification of DNA with a thermostable DNA polymerase. Science. 239:487-91.
Samadpour, M., Grimm, L. M., Desal, B., Alfi, D., Ongerth, J. E., and Tarr P. I. 1993. Molecular Epidemiology of Esherichia coli O157:H7 strains by bacteriophage y restriction Fragment length polymorphism analysis: application to a multistage foodborne outbreak and a day-care center cluster. Journal of Clinical Microbiology. 31: 3179-3183.
Saxena, S. K., O’Brien, A. D., and Ackerman, E. J. 1989. Shiga toxin, Shiga-like toxin II variant, and ricin are all single-site RNA N-glycosidases of 28 S RNA when microinjected into Xenopus oocytes. J.Biol.Chem. 264:596-601.
Schaechter, M. 2000. Escherichia coli, general biology. In Encyclopedia of Microbiology.2 : 260-269
Scheusner, D. L., Busta, F. F., Speck, M. L. 1971. Inhibition of injured Escherichia coli by several selective agents. Appl. Microbiol. 21:46-49
Scheutz, F., Beutin, L. and Smith, H. 2001a. Clinical detection of verocytotoxin-producing E. coli (VTEC). In Verocytotoxigenic E. coli ed. Duffy, G., Garvey, P. and McDowell, D. 25-56. Trumbull, CT, USA: Food and Nutrition Press Inc.
Scheutz, F., Beutin, L., Pièrard, D. and Smith, H. 2001b. Nomenclature of verocytotoxins. In Verocytotoxigenic E. coli ed. Duffy, G., Garvey, P. and McDowell, D. 447-452. Trumbull, CT, USA: Food and Nutrition Press Inc
Schmidt, H., Scheef, J., Morabito, S., Caprioli, A., Wieler, L.H. and Karch, H. 2000. A new Shiga toxin 2 variant (Stx2f) from Escherichia coli isolated from pigeons. Applied & Environmental Microbiology. 66: 1205-1208.
Schmidt, H., Geitz, C., Tarr, P. I., Frosch, M., and Karch, H. 1999. Non-O157:H7 pathogenic Shiga toxin-producing Escherichia coli: phenotypic and genetic profiling of virulence traits and evidence for clonality. J. Infect. Dis. 179:115-123.
Schultsz, C. 1994. Detection of enterotoxigenic Escherichia coli in stool samples by using nonradioactively labeled oligonucleotide DNA probes and PCR. J Clin Microbiol. 1994:2393–2397.

171
Scotland, S. M., Smith, H. R., Willshaw, G. A., and Rowe B. 1983. Verocytotoxin production in strain of Escherichia coli is determined by genes carried on bacteriophage. Lancet. 2:216
Sernowski, L. P., Ingham, S. C. 1992. Low specificity of the HEC O157 ELISA in screening ground beef for Escherichia coli O157:H7. J. Food Prot. 55:545-47.
Simon, M. C., Gray, D. I., and Cook, N. 1996. DNA extraction and PCR methods for the detection of Listeria monocytogenes in cold-smoked salmon. Appl. Environ. Microbiol. 62:822-824.
Siragusa, G. R. 1995. The effectiveness of carcass decontamination systems for controlling the presence of pathogens on the surfaces of meat animal carcasses. J. Food Safety. 15:229-238.
Slutsker, L., Ries, A. A., Maloney, K., J., Wells , G., Greene, K. D., Griffin, P. M. 1998. A nationwide case-control study of Escherichia coli O157:H7 infection in the United States. J Infect Dis. 177:962-966.
Slutsker, L., Ries, A. A., Greene, K., Wells, D. Hutwagner, J. G., L., and Griffin, P. M. 1997. Escherichia coli O157:H7 diarrhea in the United States: clinical and epidemiologic features. Ann. Intern. Med. 126:505-513.
Smith, R., Miller, K. and Storts, D. R. 1996. Performance optimization of Promega.s Taq DNA Polymerase in PCR. Promega Notes. 56: 24-26.
Sockett, P. N., Cowden, J. M., Lebaigue, S., Ross, D., Adak, G. K. and Evans, H. 1993. Foodborne disease surveillance in England and Wales: 1989-1991. Commun. Dis. Rep. Rev. 3:R159-R173.
Soumet, C., Ermel, G., Fach, P., and Colin, P. 1994. Evaluation of different DNA extraction procedures for the detection of Salmonella from chicken products by polymerase chain reaction. Lett. Appl. Microbiol. 19:294-298.
Speck, M. L., Ray, B. and Read Jr, R. B. 1975. Repair and enumeration of injured coliforms by a plating procedure. Appl. Microbiol. 29:549-550
Stacy-Phipps, S., Mecca, J. J., and Weiss, J. B. 1995. Multiplex PCR assay and simple preparation method for stool specimens detect enterotoxigenic Escherichia coli DNA during course of infection. J. Clin. Microbiol. 33:1054-1059.
Stager, C. E., and Davis, J. R. 1992. Automated systems for identification of microorganisms. Clin. Microbiol. Rev. 5:302-327.

172
Starbuck, M. A. B., Hill, P. J., and Stewart, G. S. A. B. 1992. Ultra sensitive detection of Listeria monocytogenes in milk by the polymerase chaine reactin (PCR). Appl. Microbiol. 15: 248-252.
Starnbach, M. N., Falkow, S., and Tomkins, L. S. 1989. Species-specific detection of Legionella pneumophila in water by DNA amplification and hybridization. J. Clin. Microbiol. 27:1257-1261.
Stills H. F., 1994, Polyclonal antibody production, the biology of the laboratory rabbit, Second Edition, Chapter 20, academic press, Inc. p. 435-448.
Strockbine, N. A., Wells, J. G., Bopp, C. A., and Barrett, T. J. 1998. Overview of detection and subtyping methods. 329-331. In A. D. O’Brien and J. B. Kaper (eds.), Escherichia coli O157:H7 and other Shiga toxin-producing E. coli strains. ASM, Washington, DC.
Strockbine, N. A., Marques, L. R. M., Newland, J. W., Smith, H. W.,Holmes, R. K., and O'Brien, A. D. 1986. Two toxin-converting phages from Escherichia coli O157:H7 strain 933 encode antigenically distinct toxins with similar biologic activities. Infect. Immun. 53:135-140
Strockbine, N. A., Marques, L. R. M., Holmes, R. K., O’Brien, A. D. 1985. Characterization of monoclonal antibodies against Shiga-like toxin from Escherichia coli. Infect. lmmun. 50: 695-700.
Swaminathan, B., and Feng, P. 1994. Rapid detection of food-borne pathogenic bacteria, Annu. Rev. Microbiol., 48: 401-426.
Swaminathan, B., Konger, R. L. 1986. Immunoassays for detecting foodborne bacteria and microbial toxins.
Szabo, E. A., Pemberton, J. M., Gibson, A. M., Eyles, M. J., and Desmarchelier, P. M. 1994. polymerase chain reaction for detection of Clostridium botulinum types A,B, and E in food, soil and infant faces. journal of Applied Baceriology.76: 539-545.
Tarr, P. I., Besser, T. E., Hancock, D. D., Keene, W. E., and Goldoft, M. 1997. Verotoxigenic Escherichia coli infection: United States overview. J. Food Prot. 60:1466-1471.
Tarr, P. I. 1995. Escherichia coli O157:H7: clinical, diagnostic, and epidemiological aspects of human infection. Clin. Infect. Dis. 20:1-10.
Thomas, A., Jiggle, B., Smith, H. R., and Rowe, B. 1994. The detection of verocytotoxin-producing Escherichia coli and Shigella dysenteriae type 1 in faecal specimens

173
using polymerase chain reaction gene amplification. Lett. Appl. Microbiol. 19:406-409.
Todd, W. T. A., and Dundas, S. 2001. The management of VTEC O157 infection. Int. J. Food Microbiol. 66:103-110.
Todd, D., Mawhinney, K. A., and McNulty, M. S. 1992. Detection and differentiation of chicken anemia virus isolates by using the polymerase chain reaction. J. Clin. Microbiol. 30:1661-1666.
Tornieporth, N. G., John, J., Salgado, K., DeJesus, P., Latham. E., Melo, M. C., Gunzburg, S. T., Riley, L. W. 1995. Differentiation of pathogenic Escherichia coli strains in Brazilian children by PCR. J Clin Microbiol. 33:1371–1374.
Tsai, W., Miller, C. E., and Richter, E. R. 2000. Determination of the Sensitivity of a Rapid Escherichia coli O157:H7 Assay for Testing 375-Gram Composite Samples. Applied and Environmental Microbiology. 66: 4149-4151.
Tsai, Y., and Ingham, S. 1997. Survival of Escherichia coli O157:H7 and Salmonella ssp. in acidic condiments. J. Food Prot. 60:751-755.
Tsai, Y.-L., and Olson, B. H. 1992. Detection of low numbers of bacterial cells in soils and sediments by polymerase chain reaction. Appl. Environ. Microbiol. 58:754-757.
Vernozy-Rozand, C. 1997. Detection of Escherichia coli O157:H7 and other verocytotoxin-producing E. coli (VTEC) in food. J. Appl. Microbiol. 82:537-551
Wahlberg, J., Lundeberg, J., Huitman, T., Uhlen, M. 1990. General colorimetric method for DNA diagnostics allowing direct solid-phase sequencing of the positive samples. Proc. Natl. Acad. Sci. USA. 87:6569-73
Wang, S. S. and Levin, R. E. 2005a. Quantification of Vibrio vulnificus using the
Polymerase Chain Reaction. Food Biotechnology 19: 27-35.
Wang, S. S. and Levin, R. E. 2005b. Quantificattitive detection of Vibrio vulnificus in
Shelfish by Competitive Polymerase Chain Reaction. Food Biotechnology.19: 27-
35.
Wang, S. S. and Levin, R. E. 2004. Quantitative determination of Vibrio
parahaemolyticus by polymerase chain reaction Food Biotechnology.18: 279-287.
174
Wang, L., Rothemund, D., Curd, H., and Reeves, P. R. 2000. Sequence diversity of the Escherichia coli H7 fliC genes: implication for a DNA-based typing scheme for E. coli O157:H7. J.Clin.Microbiol. 38:1786-1790.
Wang, L. and Reeves, P. R. 1998. Organization of Escherichia coli O157 O antigen gene cluster and identification of its specific genes. Infect.Immun. 66:3545-3551.
Warseck, M., Ray, B., Speck, M. L. 1973. Repair and enumeration of injured coliforms in frozen foods. AppL Microbiol. 26: 919-24
Weagant, S. D., Bryant, J. L., and Jinneman, K. G. 1994. An improved rapid technique for isolation of Esherichia coli O157:H7 from foods. J. Food protection. 58: 7-12.
Wells, J. G., Davis B. R.,Wachsmuth, I. K., Riley, L. W., Remis, Sokolow, R. S., R., and Morris, G. K. 1983. Laboratory investigation of hemorrhagic colitis outbreaks associated with a rare Escherichia coli serotype. J. Clin. Microbiol. 18:512-520
Wernars K., Heuvelman, C. J., Chakraborty, T., and Notermans, S. H. W. 1991a. Use of the polymerase chain reaction for direct detection of Listeria monocytogenes in soft cheese. J. Appl. Bacteriol. 70:121-126.
Wernars, K., Delfgou, E., Soentoro, P. S., and Notermans, S. 1991b. Successful approach for detection of low numbers of enterotoxigenic Escherichia coli in minced meat by using the polymerase chain reaction. Appl. Environ. Microbiol. 57:1914-1919.
Widjojoatmodjo, M. N., Fluit, A. C., Torensma, R., Verdonk, G. P. H. T., and Verhoef, J. 1992. The magnetic immuno polymerase chain reaction assay for direct detection of Salmonellae in fecal specimens. J. Clin. Microbiol. 30: 3195-3199.
Wiedemann M., Barany, F., and Batt, C. A. 1995. Detection of Listeria monocytogenes by PCR- coupled ligase chain reaction, In: M. A. Innis, D. H. Gelfand, and J. J. Sninsky, (ed.) PCR Strategies. Academic Press, San Diego, CA. 347-361.
Wiedmann, M., Barany, F., Batt, C. A. 1993. Detection of Listeria monocytogenes with a nonisotopic polymerase chain reaction-coupled ligase chain reaction assay. Appl. Environ. Microbiol. 59: 2743-45
Williams J.F. 1989. Optimization strategies for the polymerase chain reaction. BioTechniques 7, 762.9.
Willshaw, G. A., Smith, H. R., Cheasty, T., and O’Brien, S. J. 2001. Use of strain typing to provide evidence for specific interventions in the transmission of VTEC O157 infections. Int.J.Food Microbiol. 66:39-46.
Wilson, J. B., Johnson, R. P., Clarke, R. C., Rahn, K., Renwick, S. A., Alves, D., Karmali, M. A., Michel, P., Orrbine, E., and Spika, J. 1997. Canadian

175
perspectives on verocytotoxin-producing Escherichia coli infection. J. Food Protect. 60:1451-1453
Wilson, I. G. 1997. Inhibition and facilitation of nucleic acid amplification. Appl. Environ. Microbiol. 63:3741-3751.
Wilson, I. G., Gilmour, A., and Cooper J. E. 1993. Detection of enterotoxigenic microorganisms in foods by PCR. In R. G. Kroll, A. Gilmour, and M. Sussman (ed.), New techniques in food and beverage microbiology. Scientific Publishers, Blackwell Oxford, United Kingdom.
Withman, P. K., Yamashiro, C. T., Livak, K. J., and Batt C. A.1996. A PCR-based assay for the detection of Esherichia coli shiga-like toxin genes in ground beef. Applied and Environmental Microbiology. 62: 1347-1353.
Wyatt, G. M. 1992. Antibody technology. In Immunoassays for food-poisoning bacteria and bacterial toxins. AFRC Institute of Food Research, Norwich, UK. 29-67.
Zhao, T., Doyle, M. P., and Besser, R. 1993. Fate of enterohemorrhagic Escherichia coli O157:H7 in apple cider with and without preservatives. Appl. Environ. Microbiol. 59: 2526-2530.

176
Appendixes
7.1 Latex agglutination titration with E.coli O157:H7 and E. coli 4015* Cell E.coli O157:H7 E.coli 4015 Density A B C A B C 1 x 10¹⁰ - - - - - - 5 x 10⁹ - - - - - - 1 x 10⁹ + + + - - - 5 x 10⁸ + + + - - - 1 x 10⁸ ++++ ++++ ++++ - - - 5 x 10⁷ +++ +++ ++ - - - 1 x 10⁷ ++ +++ ++ - - - 5 x 10⁶ + ++ + - - - 1 x 10⁶ + + - - - - 5 x 10⁵ - - - - - - 1 x 10⁵ - - - - - - 5 x 10⁴ - - - - - - 1 x 10⁴ - - - - - - * Latex agglutination assay was done by adding 30 μl of coat/wash buffer to 30μl of different cell density
of either non boiled E. coli O157:H7 or E. coli 4015 suspension into a single welled microscopic slide in triplicates (A, B, and C). A 30-μl of coated beads was then added.
7.2 Latex agglutination assay with various cell densities of boiled E.coli O157:H7**. Cell Boiled E.coli O157:H7 Density A B C Cont. - - - 5 x 10⁸ + - + 1 x 10⁸ + + + 5 x 10⁷ + + + 1 x 10⁷ ++ +++ ++ 5 x 10⁶ ++ ++ + 1 x 10⁶ + + - 5 x 10⁵ - - - 1 x 10⁵ - - - ** Latex agglutination assay was done by adding 30 μl of coat/wash buffer to 30μl of none boiled E. coli
O157:H7 cell suspension into a single welled microscopic slide in triplicates (A, B, and C). A 30-μl of coated beads was then added. Control was done by adding 30μl of E. coli 4015 cell suspension (1 x 10⁸ cells/ ml) instead of E. coli O157:H7.

177
7.3 ELISA titration curve with partially purified VT1 extracted from E. coli O157:H7. Toxin Protein Absorbance at 490 nm* Standard ( ml ) Content (μg) A B C Average error 0.02 0.34 0.351 0.375 0.432 0.386 0.024 0.04 0.68 0.453 0.465 0.495 0.471 0.012 0.06 1.03 0.565 0.551 0.562 0.559 0.004 0.08 1.37 0.700 0.681 - 0.691 0.010 0.10 1.71 0.752 0.725 0.781 0.753 0.016 0.12 2.05 0.852 0.800 0.842 0.831 0.016 0.14 2.39 0.862 0.850 0.891 0.868 0.012 0.16 2.74 0.949 0.901 - 0.925 0.024 0.18 3.08 0.973 0.914 0.901 0.930 0.022 0.20 3.42 0.961 0.941 0.954 0.952 0.010 0.22 3.76 0.991 0.950 0.964 0.968 0.012 0.24 4.10 0.998 0.945 0.975 0.972 0.015 0.26 4.45 0.998 0.943 0.974 0.972 0.016 * Absorbance was taken at 490 nm in triplicates (A, B, and C) using a cuvet capacity of 0.5 ml. Samples
were diluted first in the cuvet and then readings were normalized using the dilution factor of 4. The reading for the control was taken from the ELISA control well.
7.4 Titration of commercial IgG obtained from Difco Lab. using slide agglutination assay**. Antiserum Cell density /ml Dilution 5 x 10⁹ 1 x 10⁹ 5 x 10⁸ 1 x 10⁸ 5 x 10⁷ 1 x 10⁷ 1- 0 +++ +++ +++ - - 1- 2 +++ ++++ +++ + - 1- 4 ++ +++ +++ + - 1- 8 + ++ ++ + - 1- 16 - + + + - - 1- 32 - - + + - - 1- 64 - - - - - - 1- 128 - - - - - - 1- 256 - - - - - - 1- 512 - - - - - - 1- 1024 - - - - - - ** Slide agglutination assay was performed by mixing 0.1 ml of each antiserum dilution with 0.1 ml of varying numbers of cells in PBS using nine-well glass titer plates followed by rotary agitation at 78 rpm for 10 min at room temperature. Agglutination was then visually determined using a visual scale of -, +, +, ++, +++, and ++++, with - being no agglutination.

178
7.5 Effect of cell concentration on agglutination rates with 1/16 antiserum dilution* Time 1 x 10⁹ cells/ml 5 X 10⁸ cells/ml (min) A600 Average Change in
A600 A600 Average Change in
A600 0 1.862
1.830 1.846 -0.000 1.124
1.104 1.114 0.000
1 1.861 1.829
1.845 -0.001 1.138 1.111
1.125 0.011
2 1.861 1.829
1.845 -0.001 1.139 1.112
1.126 0.012
3 1.860 1.828
1.844 -0.002 1.140 1.115
1.128 0.014
4 1.857 1.821
1.839 -0.007 1.143 1.118
1.131 0.017
5 1.853 1.819
1.836 -0.010 1.140 1.119
1.130 0.016
6 1.852 1.816
1.834 -0.012 1.138 1.111
1.125 0.011
7 1.849 1.815
1.832 -0.014 1.133 1.111
1.122 0.008
8 1.847 1.829
1.831 -0.015 1.131 1.110
1.121 0.007
9 1.846 1.828
1.830 -0.016 1.129 1.108
1.119 0.005
10 1.845 1.827
1.829 -0.017 1.128 1.107
1.118 0.004
11 1.845 1.827
1.829 -0.017 1.128 1.107
1.118 0.004
12 1.844 1.826
1.828 -0.018 1.128 1.107
1.118 0.004
13 1.844 1.826
1.828 -0.018 1.128 1.107
1.118 0.004
14 1.843 1.825
1.827 -0.019 1.127 1.106
1.117 0.003
15 1.843 1.825
1.827 -0.019 1.127 1.106
1.117 0.003
16 1.842 1.824
1.826 -0.020 1.127 1.106
1.117 0.003
17 1.842 1.824
1.826 -0.020 1.127 1.106
1.117 0.003
18 1.841 1.823
1.825 -0.021 1.127 1.106
1.117 0.003
19 1.843 1.823
1.824 -0.021 1.127 1.106
1.117 0.003
20 1.842 1.822
1.823 -0.022 1.117 0.003
* A600 resulted from subtracting the controls reading from the samples reading at the designated times above. Reading was taken after adding 0.1 ml of cell suspension into 1.9 ml of pretempered antiserum in PBS to 40oC. A cuvet of 1 cm path length was used. Controls was treated the same but with no cells added.

179
Cont. Appendix.5. Time 2.5 x 10⁸ cells/ml 1 X 10⁸ cells/ml (min) A600 Average Change in
A600 A600 Average Change in
A600 0 0.586
0.560 0.573 0.000 0.336
0.314 0.325 0.000
1 0.591 0.579
0.585 0.012 0.348 0.322
0.335 0.010
2 0.601 0.585
0.593 0.020 0.351 0.327
0.339 0.016
3 0.607 0.601
0.604 0.031 0.360 0.334
0.347 0.024
4 0.618 0.604
0.611 0.038 0.361 0.377
0.349 0.026
5 0.621 0.607
0.614 0.041 0.364 0.342
0.353 0.030
6 0.625 0.611
0.618 0.045 0.369 0.347
0.358 0.035
7 0.627 0.613
0.620 0.047 0.373 0.351
0.362 0.039
8 0.628 0.614
0.621 0.048 0.375 0.357
0.366 0.043
9 0.633 0.615
0.624 0.051 0.376 0.358
0.367 0.044
10 0.635 0.617
0.626 0.053 0.377 0.359
0.368 0.045
11 0.635 0.617
0.626 0.053 0.379 0.361
0.370 0.047
12 0.635 0.615
0.625 0.052 0.381 0.363
0.372 0.049
13 0.633 0.615
0.624 0.051 0.382 0.364
0.373 0.050
14 0.633 0.615
0.624 0.051 0.383 0.365
0.374 0.051
15 0.633 0.615
0.624 0.051 0.384 0.366
0.375 0.052
16 0.632 0.614
0.623 0.050 0.385 0.367
0.376 0.053
17 0.631 0.613
0.622 0.049 0.386 0.368
0.377 0.054
18 0.628 0.611
0.620 0.047 0.387 0.369
0.378 0.055
19 0.627 0.610
0.619 0.046 0.388 0.370
0.379 0.056
20 0.626 0.609
0.618 0.045 0.388 0.370
0.379 0.056

180
Cont. Appendix.5. Time 7.5 x 10⁷ cells/ml 5 X 10⁷ cells/ml (min) A600 Average Change in
A600 A600 Average Change in
A600 0 0.125
0.113 0.119 0.000 0.040
0.021 0.028 0.000
1 0.128 0.116
0.122 0.003 0.042 0.023
0.030 0.002
2 0.130 0.122
0.126 0.007 0.043 0.027
0.035 0.005
3 0.136 0.126
0.131 0.012 0.045 0.031
0.038 0.008
4 0.139 0.131
0.135 0.016 0.048 0.034
0.041 0.011
5 0.145 0.132
0.139 0.020 0.050 0.036
0.043 0.013
6 0.148 0.135
0.142 0.023 0.052 0.038
0.045 0.015
7 0.151 0.138
0.145 0.027 0.054 0.042
0.048 0.018
8 0.153 0.140
0.147 0.029 0.056 0.044
0.050 0.020
9 0.157 0.143
0.150 0.032 0.058 0.046
0.052 0.022
10 0.159 0.147
0.153 0.035 0.060 0.048
0.054 0.024
11 0.164 0.148
0.156 0.038 0.062 0.050
0.056 0.026
12 0.167 0.151
0.159 0.041 0.064 0.052
0.058 0.028
13 0.169 0.153
0.161 0.043 0.064 0.056
0.060 0.030
14 0.173 0.155
0.164 0.046 0.065 0.057
0.061 0.031
15 0.175 0.157
0.166 0.048 0.067 0.059
0.063 0.033
16 0.180 0.158
0.169 0.051 0.068 0.062
0.065 0.035
17 0.182 0.160
0.171 0.053 0.070 0.062
0.066 0.036
18 0.185 0.163
0.174 0.056 0.074 0.064
0.069 0.039
19 0.186 0.164
0.175 0.057 0.075 0.065
0.070 0.040
20 0.188 0.166
0.177 0.059 0.078 0.066
0.072 0.042
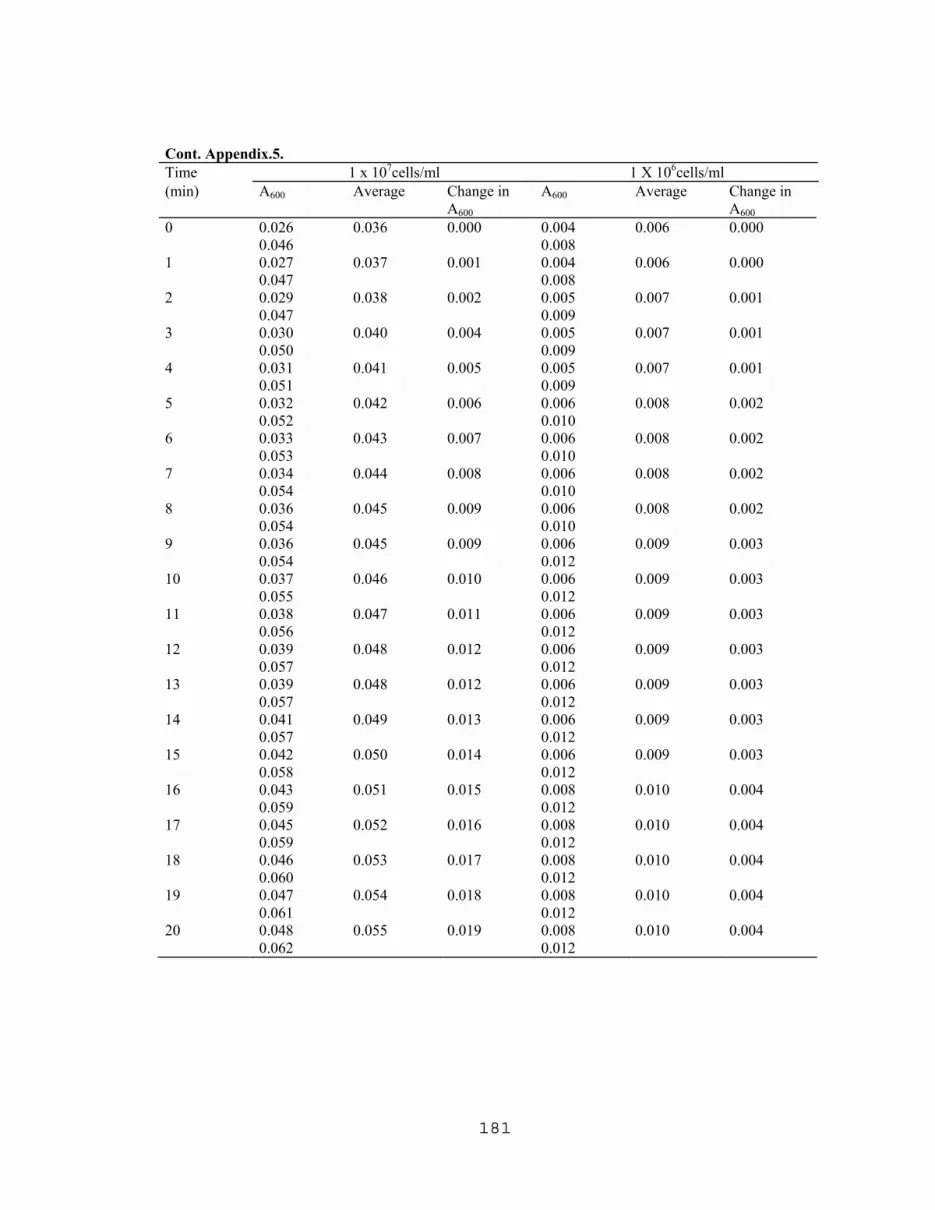
181
Cont. Appendix.5. Time 1 x 10⁷cells/ml 1 X 10⁶cells/ml (min) A600 Average Change in
A600 A600 Average Change in
A600 0 0.026
0.046 0.036 0.000 0.004
0.008 0.006 0.000
1 0.027 0.047
0.037 0.001 0.004 0.008
0.006 0.000
2 0.029 0.047
0.038 0.002 0.005 0.009
0.007 0.001
3 0.030 0.050
0.040 0.004 0.005 0.009
0.007 0.001
4 0.031 0.051
0.041 0.005 0.005 0.009
0.007 0.001
5 0.032 0.052
0.042 0.006 0.006 0.010
0.008 0.002
6 0.033 0.053
0.043 0.007 0.006 0.010
0.008 0.002
7 0.034 0.054
0.044 0.008 0.006 0.010
0.008 0.002
8 0.036 0.054
0.045 0.009 0.006 0.010
0.008 0.002
9 0.036 0.054
0.045 0.009 0.006 0.012
0.009 0.003
10 0.037 0.055
0.046 0.010 0.006 0.012
0.009 0.003
11 0.038 0.056
0.047 0.011 0.006 0.012
0.009 0.003
12 0.039 0.057
0.048 0.012 0.006 0.012
0.009 0.003
13 0.039 0.057
0.048 0.012 0.006 0.012
0.009 0.003
14 0.041 0.057
0.049 0.013 0.006 0.012
0.009 0.003
15 0.042 0.058
0.050 0.014 0.006 0.012
0.009 0.003
16 0.043 0.059
0.051 0.015 0.008 0.012
0.010 0.004
17 0.045 0.059
0.052 0.016 0.008 0.012
0.010 0.004
18 0.046 0.060
0.053 0.017 0.008 0.012
0.010 0.004
19 0.047 0.061
0.054 0.018 0.008 0.012
0.010 0.004
20 0.048 0.062
0.055 0.019 0.008 0.012
0.010 0.004

182
Cont. Appendix.5. Time 1 x 10⁵ cells/ml 1 x 10⁴ cells/ml 1 X 10³ cells/ml 1 X 10² cells/ml (min) A600 Average A600 Average A600 Average A600 Average 0 0.000
0.000 0.000 0.000
0.000 0.000 0.000
0.000 0.000 0.000
0.000 0.000
1 0.000 0.000
0.000 0.000 0.000
0.000 0.000 0.000
0.000 0.000 0.000
0.000
2 0.001 0.001
0.001 0.000 0.001
0.000 0.000 0.000
0.000 0.000 0.000
0.000
3 0.001 0.002
0.001 0.000 0.001
0.000 0.000 0.000
0.000 0.000 0.000
0.000
4 0.001 0.002
0.001 0.000 0.001
0.000 0.000 0.000
0.000 0.000 0.000
0.000
5 0.001 0.002
0.001 0.001 0.001
0.001 0.000 0.000
0.000 0.000 0.000
0.000
6 0.001 0.002
0.001 0.001 0.001
0.001 0.001 0.001
0.001 0.000 0.000
0.000
7 0.002 0.002
0.002 0.001 0.001
0.001 0.001 0.001
0.001 0.000 0.000
0.000
8 0.002 0.003
0.002 0.001 0.001
0.001 0.001 0.001
0.001 0.000 0.001
0.000
9 0.002 0.003
0.002 0.001 0.001
0.001 0.001 0.001
0.001 0.000 0.001
0.000
10 0.002 0.003
0.002 0.001 0.002
0.001 0.001 0.002
0.001 0.001 0.001
0.001
11 0.003 0.003
0.003 0.001 0.002
0.001 0.001 0.002
0.001 0.001 0.001
0.001
12 0.003 0.003
0.003 0.001 0.002
0.001 0.001 0.002
0.001 0.001 0.001
0.001
13 0.003 0.003
0.003 0.002 0.002
0.002 0.001 0.002
0.001 0.001 0.001
0.001
14 0.003 0.003
0.003 0.002 0.002
0.002 0.002 0.002
0.002 0.001 0.001
0.001
15 0.003 0.003
0.003 0.002 0.002
0.002 0.002 0.002
0.002 0.001 0.001
0.001
16 0.003 0.004
0.003 0.002 0.002
0.002 0.002 0.002
0.002 0.001 0.001
0.001
17 0.003 0.004
0.003 0.002 0.003
0.002 0.002 0.003
0.002 0.001 0.001
0.001
18 0.003 0.004
0.003 0.002 0.003
0.002 0.002 0.003
0.002 0.001 0.002
0.001
19 0.004 0.004
0.004 0.003 0.003
0.003 0.002 0.003
0.002 0.001 0.002
0.001
20 0.004 0.004
0.004 0.003 0.003
0.003 0.002 0.003
0.002 0.002 0.002
0.002
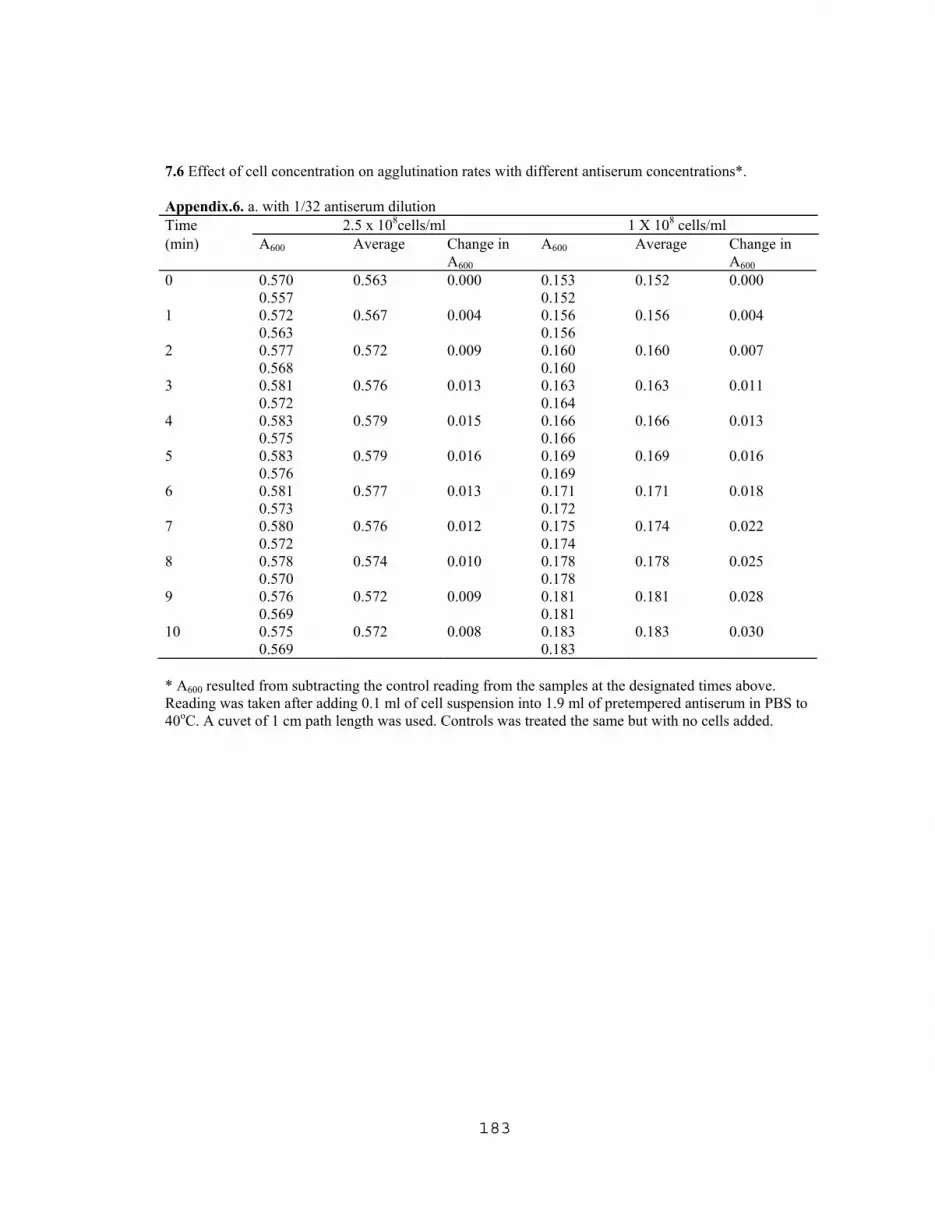
183
7.6 Effect of cell concentration on agglutination rates with different antiserum concentrations*. Appendix.6. a. with 1/32 antiserum dilution Time 2.5 x 10⁸cells/ml 1 X 10⁸ cells/ml (min) A600 Average Change in
A600 A600 Average Change in
A600 0 0.570
0.557 0.563 0.000 0.153
0.152 0.152 0.000
1 0.572 0.563
0.567 0.004 0.156 0.156
0.156 0.004
2 0.577 0.568
0.572 0.009 0.160 0.160
0.160 0.007
3 0.581 0.572
0.576 0.013 0.163 0.164
0.163 0.011
4 0.583 0.575
0.579 0.015 0.166 0.166
0.166 0.013
5 0.583 0.576
0.579 0.016 0.169 0.169
0.169 0.016
6 0.581 0.573
0.577 0.013 0.171 0.172
0.171 0.018
7 0.580 0.572
0.576 0.012 0.175 0.174
0.174 0.022
8 0.578 0.570
0.574 0.010 0.178 0.178
0.178 0.025
9 0.576 0.569
0.572 0.009 0.181 0.181
0.181 0.028
10 0.575 0.569
0.572 0.008 0.183 0.183
0.183 0.030
* A600 resulted from subtracting the control reading from the samples at the designated times above. Reading was taken after adding 0.1 ml of cell suspension into 1.9 ml of pretempered antiserum in PBS to 40oC. A cuvet of 1 cm path length was used. Controls was treated the same but with no cells added.
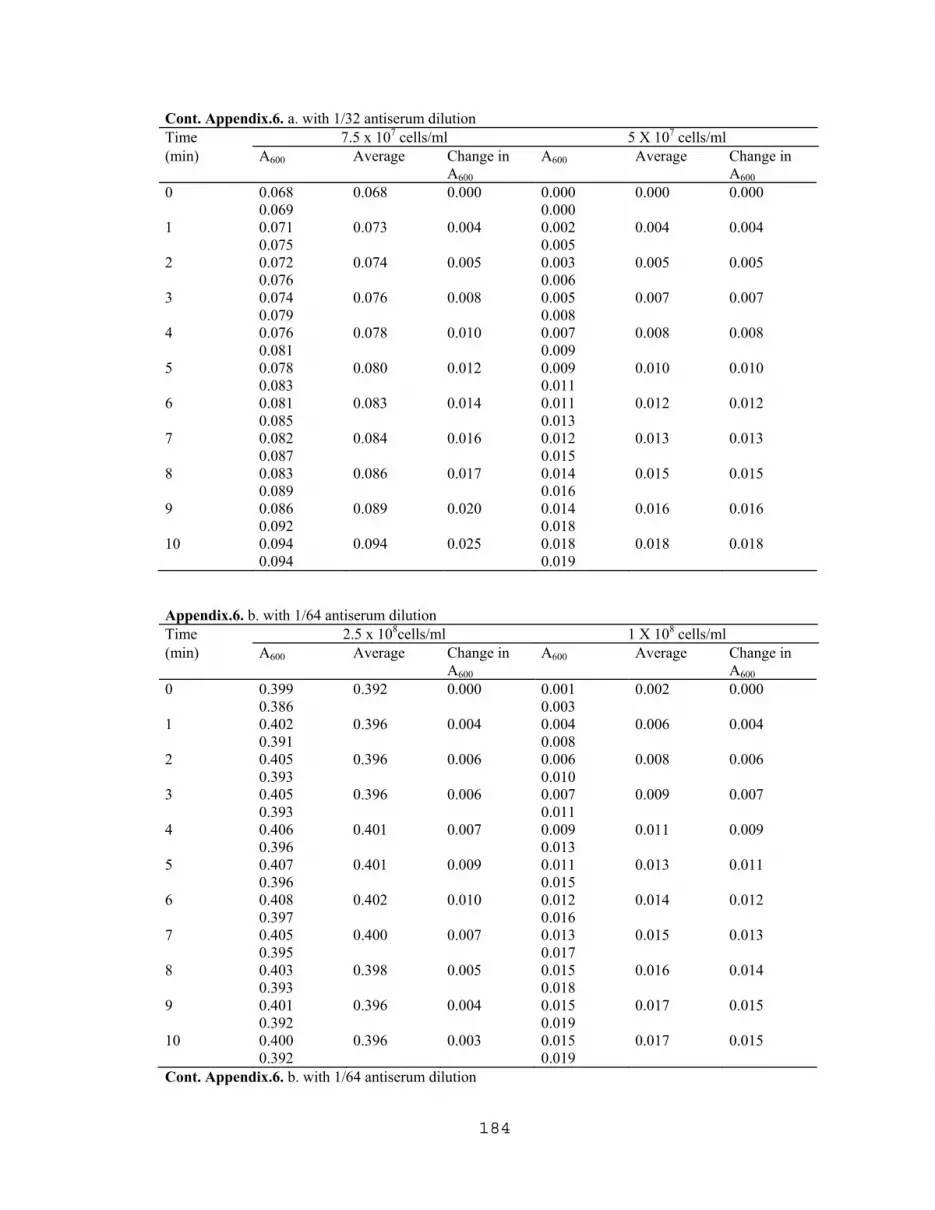
184
Cont. Appendix.6. a. with 1/32 antiserum dilution Time 7.5 x 10⁷ cells/ml 5 X 10⁷ cells/ml (min) A600 Average Change in
A600 A600 Average Change in
A600 0 0.068
0.069 0.068 0.000 0.000
0.000 0.000 0.000
1 0.071 0.075
0.073 0.004 0.002 0.005
0.004 0.004
2 0.072 0.076
0.074 0.005 0.003 0.006
0.005 0.005
3 0.074 0.079
0.076 0.008 0.005 0.008
0.007 0.007
4 0.076 0.081
0.078 0.010 0.007 0.009
0.008 0.008
5 0.078 0.083
0.080 0.012 0.009 0.011
0.010 0.010
6 0.081 0.085
0.083 0.014 0.011 0.013
0.012 0.012
7 0.082 0.087
0.084 0.016 0.012 0.015
0.013 0.013
8 0.083 0.089
0.086 0.017 0.014 0.016
0.015 0.015
9 0.086 0.092
0.089 0.020 0.014 0.018
0.016 0.016
10 0.094 0.094
0.094 0.025 0.018 0.019
0.018 0.018
Appendix.6. b. with 1/64 antiserum dilution Time 2.5 x 10⁸cells/ml 1 X 10⁸ cells/ml (min) A600 Average Change in
A600 A600 Average Change in
A600 0 0.399
0.386 0.392 0.000 0.001
0.003 0.002 0.000
1 0.402 0.391
0.396 0.004 0.004 0.008
0.006 0.004
2 0.405 0.393
0.396 0.006 0.006 0.010
0.008 0.006
3 0.405 0.393
0.396 0.006 0.007 0.011
0.009 0.007
4 0.406 0.396
0.401 0.007 0.009 0.013
0.011 0.009
5 0.407 0.396
0.401 0.009 0.011 0.015
0.013 0.011
6 0.408 0.397
0.402 0.010 0.012 0.016
0.014 0.012
7 0.405 0.395
0.400 0.007 0.013 0.017
0.015 0.013
8 0.403 0.393
0.398 0.005 0.015 0.018
0.016 0.014
9 0.401 0.392
0.396 0.004 0.015 0.019
0.017 0.015
10 0.400 0.392
0.396 0.003 0.015 0.019
0.017 0.015
Cont. Appendix.6. b. with 1/64 antiserum dilution

185
Time 7.5 x 10⁷cells/ml 5 X 10⁷ cells/ml (min) A600 Average Change in
A600 A600 Average Change in
A600 0 0.090
0.088 0.089 0.000 0.005
0.000 0.002 0.000
1 0.092 0.090
0.091 0.002 0.006 0.001
0.003 0.001
2 0.094 0.092
0.093 0.004 0.007 0.002
0.004 0.002
3 0.096 0.093
0.094 0.006 0.008 0.003
0.005 0.003
4 0.097 0.094
0.095 0.007 0.009 0.005
0.007 0.004
5 0.098 0.096
0.097 0.008 0.009 0.006
0.007 0.005
6 0.100 0.098
0.099 0.010 0.011 0.007
0.009 0.006
7 0.101 0.099
0.100 0.011 0.012 0.008
0.010 0.007
8 0.103 0.101
0.102 0.013 0.013 0.008
0.011 0.008
9 0.104 0.102
0.103 0.014 0.014 0.010
0.012 0.009
10 0.106 0.104
0.105 0.016 0.015 0.011
0.013 0.010
Appendix.6. c. with 1/128 antiserum dilution Time 2.5 x 10⁸cells/ml 1 X 10⁸ cells/ml (min) A600 Average Change in
A600 A600 Average Change in
A600 0 0.377
0.385 0.381 0.000 0.000
0.000 0.000 0.000
1 0.376 0.385
0.380 -0.000 0.001 0.002
0.001 0.001
2 0.374 0.385
0.379 -0.001 0.002 0.003
0.002 0.002
3 0.373 0.385
0.379 -0.002 0.003 0.005
0.004 0.004
4 0.372 0.385
0.378 -0.002 0.004 0.006
0.005 0.005
5 0.370 0.385
0.377 -0.003 0.005 0.008
0.006 0.006
6 0.369 0.385
0.377 -0.004 0.005 0.008
0.006 0.006
7 0.368 0.385
0.376 -0.0004 0.005 0.009
0.007 0.007
8 0.366 0.385
0.375 -0.005 0.005 0.009
0.007 0.007
9 0.365 0.383
0.374 -0.005 0.005 0.009
0.007 0.007
10 0.364 0.381
0.372 -0.006 0.006 0.010
0.008 0.008
Cont. Appendix.6. c. with 1/128 antiserum dilution

186
Time 7.5 x 10⁷cells/ml 5 X 10⁷ cells/ml (min) A600 Average Change in
A600 A600 Average Change in
A600 0 0.087
0.086 0.086 0.000 0.001
0.000 0.000 0.000
1 0.089 0.088
0.088 0.002 0.003 0.002
0.002 0.002
2 0.091 0.089
0.090 0.004 0.004 0.003
0.003 0.003
3 0.092 0.090
0.091 0.005 0.005 0.004
0.004 0.004
4 0.093 0.091
0.092 0.006 0.005 0.004
0.004 0.004
5 0.094 0.091
0.092 0.006 0.006 0.005
0.005 0.005
6 0.095 0.093
0.094 0.008 0.007 0.006
0.006 0.006
7 0.095 0.093
0.094 0.008 0.008 0.007
0.007 0.007
8 0.095 0.093
0.094 0.008 0.009 0.008
0.008 0.008
9 0.096 0.093
0.094 0.008 0.010 0.009
0.009 0.009
10 0.096 0.093
0.094 0.008 0.011 0.010
0.010 0.010
7.7 Titration of rabbit's anti E. coli O157 (LVN0) using slide agglutination assay*. a. 1st bleeding Antiserum Cell density /ml Dilution 5 x 10⁹ 1 x 10⁹ 5 x 10⁸ 1 x 10⁸ 5 x 10⁷ 1 x 10⁷ 1- 0 +++ ++++ +++ + - - 1- 2 + ++++ +++ ++ + - 1- 4 - + ++ ++ + - 1- 8 - - + + + - 1- 16 - - - - - - 1- 32 - - - - - - 1- 64 - - - - - - 1- 128 - - - - - - 1- 256 - - - - - - 1- 512 - - - - - - 1- 1024 - - - - - - * Rabbit's anti E.coli O157:H7 was produced locally. A serial dilution was mad as mentioned in the table. Slide agglutination assay was conducted by mixing 0.1 ml of each antiserum dilution with 0.1 ml of varying numbers of cells in PBS using nine-well glass titer plates followed by rotary agitation at 78 rpm for 10 min at room temperature. Agglutination was then visually determined using a visual scale of -, +, +, ++, +++, and ++++, with - being no agglutination.
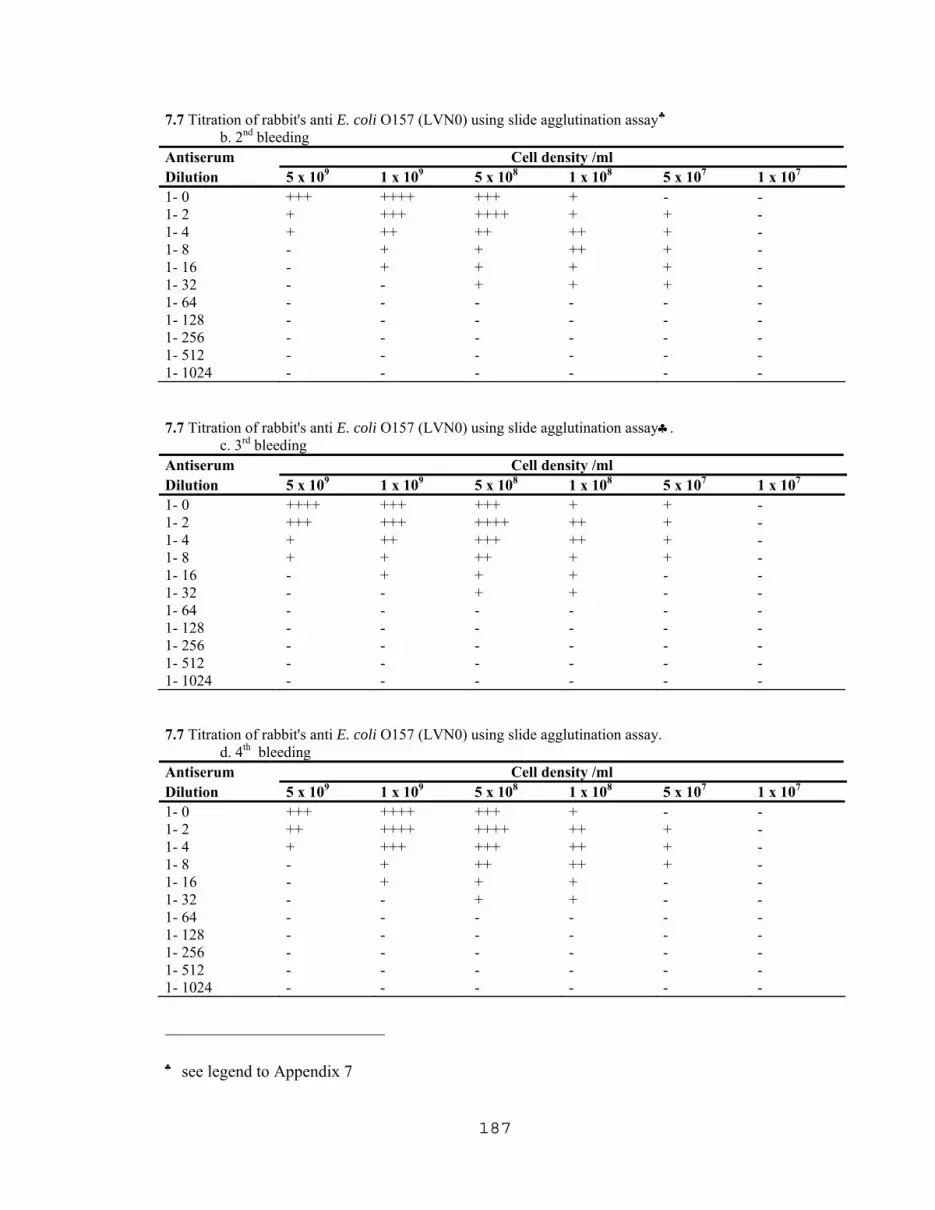
187
7.7 Titration of rabbit's anti E. coli O157 (LVN0) using slide agglutination assay♣ b. 2nd bleeding Antiserum Cell density /ml Dilution 5 x 10⁹ 1 x 10⁹ 5 x 10⁸ 1 x 10⁸ 5 x 10⁷ 1 x 10⁷ 1- 0 +++ ++++ +++ + - - 1- 2 + +++ ++++ + + - 1- 4 + ++ ++ ++ + - 1- 8 - + + ++ + - 1- 16 - + + + + - 1- 32 - - + + + - 1- 64 - - - - - - 1- 128 - - - - - - 1- 256 - - - - - - 1- 512 - - - - - - 1- 1024 - - - - - - 7.7 Titration of rabbit's anti E. coli O157 (LVN0) using slide agglutination assay♣. c. 3rd bleeding Antiserum Cell density /ml Dilution 5 x 10⁹ 1 x 10⁹ 5 x 10⁸ 1 x 10⁸ 5 x 10⁷ 1 x 10⁷ 1- 0 ++++ +++ +++ + + - 1- 2 +++ +++ ++++ ++ + - 1- 4 + ++ +++ ++ + - 1- 8 + + ++ + + - 1- 16 - + + + - - 1- 32 - - + + - - 1- 64 - - - - - - 1- 128 - - - - - - 1- 256 - - - - - - 1- 512 - - - - - - 1- 1024 - - - - - - 7.7 Titration of rabbit's anti E. coli O157 (LVN0) using slide agglutination assay. d. 4th bleeding Antiserum Cell density /ml Dilution 5 x 10⁹ 1 x 10⁹ 5 x 10⁸ 1 x 10⁸ 5 x 10⁷ 1 x 10⁷ 1- 0 +++ ++++ +++ + - - 1- 2 ++ ++++ ++++ ++ + - 1- 4 + +++ +++ ++ + - 1- 8 - + ++ ++ + - 1- 16 - + + + - - 1- 32 - - + + - - 1- 64 - - - - - - 1- 128 - - - - - - 1- 256 - - - - - - 1- 512 - - - - - - 1- 1024 - - - - - -
♣ see legend to Appendix 7

188
7.8 Titration of rabbit's anti E. coli O157 (LVN2,) using slide agglutination assay**. a. 1st bleeding Antiserum Cell density /ml Dilution 5 x 10⁹ 1 x 10⁹ 5 x 10⁸ 1 x 10⁸ 5 x 10⁷ 1 x 10⁷ 1- 0 ++ +++ ++ + - - 1- 2 + +++ ++ + - - 1- 4 + + + + + - 1- 8 - - + + - - 1- 16 - - - - - - 1- 32 - - - - - - 1- 64 - - - - - - 1- 128 - - - - - - 1- 256 - - - - - - 1- 512 - - - - - - 1- 1024 - - - - - - * see legend to Appendix 7 7.8 Titration of rabbit's anti E. coli O157 (LVN2) using slide agglutination assay♣. b. 2nd bleeding Antiserum Cell density /ml Dilution 5 x 10⁹ 1 x 10⁹ 5 x 10⁸ 1 x 10⁸ 5 x 10⁷ 1 x 10⁷ 1- 0 ++ ++ ++ + - - 1- 2 + ++ + + - - 1- 4 + + + + - - 1- 8 - + + + + - 1- 16 - - + + + - 1- 32 - - + + - - 1- 64 - - - - - - 1- 128 - - - - - - 1- 256 - - - - - - 1- 512 - - - - - - 1- 1024 - - - - - - 7.8 Titration of rabbit's anti E. coli O157 (LVN2) using slide agglutination assay♣. c. 3rd bleeding Antiserum Cell density /ml Dilution 5 x 10⁹ 1 x 10⁹ 5 x 10⁸ 1 x 10⁸ 5 x 10⁷ 1 x 10⁷ 1- 0 +++ +++ +++ + - - 1- 2 ++ ++ ++ + - - 1- 4 + + ++ + + - 1- 8 - + + + + - 1- 16 - - + + + - 1- 32 - - - - - - 1- 64 - - - - - - 1- 128 - - - - - - 1- 256 - - - - - - 1- 512 - - - - - - 1- 1024 - - - - - -
♣ see legend to Appendix 7

189
7.8 Titration of rabbit's anti E. coli O157 (LVN2) using slide agglutination assay♣. d. 4th bleeding Antiserum Cell density /ml Dilution 5 x 10⁹ 1 x 10⁹ 5 x 10⁸ 1 x 10⁸ 5 x 10⁷ 1 x 10⁷ 1- 0 +++ +++ ++ + - - 1- 2 ++ +++ +++ ++ + - 1- 4 + ++ ++ ++ + - 1- 8 + ++ ++ + + - 1- 16 - + + + - - 1- 32 - - + + - - 1- 64 - - - - - - 1- 128 - - - - - - 1- 256 - - - - - - 1- 512 - - - - - - 1- 1024 - - - - - - ♣ see legend to Appendix 7
7.9 TKO Calf thymus DNA Standard curve for fluorometric DNA measurements *
0
50
100
150
200
250
300
350
400
450
500
0 100 200 300 400 500
FLU
OR
ES
CE
NC
E IN
TEN
SIT
Y
DNA CONCENTRATION, ng/ml
f (x) =0.916 x + 4.881X = f (x) - 4.881 / 0.916R^ = 0.999
* TKO different concentration of Calf thymus DNA assayed fluorometrically in a total volume of 2.0 ml of
dye solution (10 mM Tris-Cl, 1 mM EDTA, 0.2 M NaCl, and 0.1 mg/ml of Hoechst 33258 dye)


