Embed Size (px)
Citation preview
www.elsevier.com/locate/ejpb
European Journal of Pharmaceutics and Biopharmaceutics 66 (2007) 227–243
Research paper
Development and bioavailability assessment of ramiprilnanoemulsion formulation
Sheikh Shafiq *, Faiyaz Shakeel, Sushma Talegaonkar, Farhan J. Ahmad,Roop K. Khar, Mushir Ali
Department of Pharmaceutics, Jamia Hamdard, Hamdard Nagar, India
Received 10 July 2006; accepted in revised form 11 October 2006Available online 24 October 2006
Abstract
The objective of our investigation was to design a thermodynamically stable and dilutable nanoemulsion formulation of Ramipril,with minimum surfactant concentration that could improve its solubility, stability and oral bioavailability. Formulations were takenfrom the o/w nanoemulsion region of phase diagrams, which were subjected to thermodynamic stability and dispersibility tests. The com-position of optimized formulation was Sefsol 218 (20% w/w), Tween 80 (18% w/w), Carbitol (18% w/w) and standard buffer solution pH5 (44% w/w) as oil, surfactant, cosurfactant and aqueous phase, respectively, containing 5 mg of ramipril showing drug release (95%),droplet size (80.9 nm), polydispersity (0.271), viscosity (10.68 cP), and infinite dilution capability. In vitro drug release of the nanoemul-sion formulations was highly significant (p < 0.01) as compared to marketed capsule formulation and drug suspension. The relative bio-availability of ramipril nanoemulsion to that of conventional capsule form was found to be 229.62% whereas to that of drug suspensionwas 539.49%. The present study revealed that ramipril nanoemulsion could be used as a liquid formulation for pediatric and geriatricpatients and can be formulated as self-nanoemulsifying drug delivery system (SNEDDS) as a unit dosage form.� 2006 Elsevier B.V. All rights reserved.
Keywords: Nanoemulsion; Ramipril; Bioavailability; SNEDDS; Phase diagrams; Solubility; Sefsol 218
1. Introduction
Poor bioavailability can be due to poor solubility, deg-radation in GI lumen, poor membrane permeation andpresystemic elimination [1,2]. By many estimates up to 40percent of new chemical entities (NCEs) discovered bythe pharmaceutical industry today and many existing drugsare poorly soluble or lipophilic compounds which leads topoor oral bioavailability, high intra- and inter-subject var-iability and lack of dose proportionality [3]. Thus, for suchcompounds, the absorption rate from the gastrointestinal(GI) lumen is controlled by dissolution [4]. The ability to
0939-6411/$ - see front matter � 2006 Elsevier B.V. All rights reserved.
doi:10.1016/j.ejpb.2006.10.014
* Corresponding author. Department of Pharmaceutics, Faculty ofPharmacy, Jamia Hamdard, Hamdard Nagar, New Delhi 110062, India.Tel.: +91 9811827028; fax: +91 11 26059688x5307.
E-mail address: [email protected] (S. Shafiq).
deliver poorly soluble drugs will grow in significance inthe coming years as innovator companies rely upon NCEsfor a larger share of the revenue within the pharmaceuticalmarket.
In recent years, much attention has focused on lipid-based formulations to improve the oral bioavailability ofpoorly water soluble drug compounds. In fact, the mostpopular approach is the incorporation of the active lipo-philic component into inert lipid vehicles such as oils,surfactant dispersions, microemulsions, nanoemulsions,self-emulsifying formulations, self-microemulsifyingformulations, emulsions and liposomes [5–19]. Most ofthem increase surface area of the drugs to improve solubili-sation behaviour, as well as permeation. From the view-point of oral drug delivery, lipids are studied ascomponents of various oily liquids and dispersions thatare designed to increase solubility and bioavailability of
228 S. Shafiq et al. / European Journal of Pharmaceutics and Biopharmaceutics 66 (2007) 227–243
drugs belonging to the class II and IV of the biopharma-ceutical drug classification system [4].
One of the promising technologies is nanoemulsiondrug delivery system, which is being applied to enhancethe oral bioavailability of the poorly soluble drugs. Nano-emulsions are thermodynamically stable, transparent (ortranslucent); dispersions of oil and water stabilized byan interfacial film of surfactant molecules having thedroplet size less than 100 nm. Nanoemulsion providesultra low interfacial tensions and large o/w interfacialareas. Nanoemulsions have a higher solubilization capac-ity than simple micellar solutions and their thermodynam-ic stability offers advantages over unstable dispersions,such as emulsions and suspensions, because they can bemanufactured with little energy input (heat or mixing)and have a long shelf life. The nanosized droplets leadingto enormous interfacial areas associated with nanoemul-sions would influence the transport properties of the drug,an important factor in sustained and targeted drug deliv-ery [20,21]. The attraction of formulating o/w nanoemul-sion systems lies in their ability to incorporatehydrophobic drugs into the oil phase thereby enhancingtheir solubility [21]. Nanoemulsions have been reportedto make the plasma concentration profiles and bioavail-ability of drugs more reproducible [3,21–24].
Ramipril {(2S,3aS,6aS)-1-[(2S)-2-[[(1S)-1-(ethoxycar-bonyl)-3-phenylpropyl] amino]-1-oxopropyl]octahydrocy-clopenta[b]pyrrole-2-carboxylic acid}, a potentantihypertensive drug, is almost completely converted toits active metabolite ramiprilat (a dicarboxylic acid) byhydrolytic cleavage of the ester group in the liver whichhas about six times angiotensin converting enzyme (ACE)inhibitor activity of ramipril. Ramipril is a highly lipophilic(log P (octanol/water), 3.32), poorly water soluble drugwith absolute bioavailability of 28–35%, when 5 mg of oralramipril is compared with the same dose given intravenous-ly [25–27]. Ramipril and ramiprilat inhibit ACE whichcatalyses the conversion of angiotensin I to the vasocon-strictor substance, angiotensin II. Inhibition of ACE recep-tor decreases tissue and circulating ACE activity, whichleads to decreased vasopressor activity and decreased aldo-sterone secretion and therefore, causes general vasodilata-tion and lowers blood pressure effectively [28,29]. TheHOPE (heart outcomes prevention evaluation) trialshowed that ramipril therapy significantly reduced the inci-dence of myocardial infarction, stroke or cardiovasculardeath (relative risk 0.78) and reduced total mortality (rela-tive risk 0.84) versus placebo in patients (mean age ofpatients was 65.9 years) with atherosclerotic diseases ordiabetes mellitus [30]. According to study conducted byESCAPE trial group, ramipril is a very effective antihyper-tensive and antiproteinuric agent in children with chronicrenal failure associated with hypertension [31].
The dose of ramipril varies between 2.5 mg and 20 mgand frequently prescribed dose is 5 mg for the adult.Therefore, for the present study, 5 mg dose was selectedfor the development of nanoemulsion formulation. Thus,
the objectives of the present study were to develop andcharacterize an optimal nanoemulsion formulation oframipril using minimum surfactant concentration, so thatnano-sized droplets could be maintained on dilution bythe gastrointestinal (GI) fluids with an aim to increaseits bioavailability and compare it with a marketed cap-sule formulation as well as the drug suspension. Theother objective was to develop a liquid formulation thatcan be used for pediatric patients as well as to develop aself-nanoemulsifying drug delivery (SNEDDS) unit doseformulation.
2. Materials and methods
2.1. Materials for component selection
Ramipril base was a gift sample from RanbaxyResearch Laboratories (Haryana, India). Medium chaintriglyceride (Labrafac�), Caprylo caproyl macrogol-8-glyc-eride (Labrasol�), Polyglyceryl-6-dioleate (Plurol oleique�)were gift samples from Gattefosse (Saint Priest, CedexFrance), Propylene glycol mono caprylic ester (Safsol218�) was gift sample from Nikko Chemicals (Tokyo,Japan). Isopropyl myristate (IPM), Glycerol triacetate(Triacetin), Castor oil, Polyoxyethylene (20) sorbitan monooleic acid (Tween 80�), Diethylene glycol monoethyl ether(Carbitol�), Sodium perchlorate AG, and Acetonitrile(HPLC grade) were purchased from Merck (Schuchardh,Hokenbrunn, Germany). Water was obtained from Milli-Q-water purification system (Millipore, MA). For LC/MS/MS study, all the chemicals and C-18 solid phaseextraction cartridges (Oasis HLB, 30 ng/cc) were a giftfrom Ranbaxy Research Lab. Ltd. (Haryana, India). Allother chemicals were of analytical grade.
2.2. Screening of components
The most important criterion for the screening of com-ponents for nanoemulsion is the solubility of poorly solu-ble drug in oils, surfactants and cosurfactants. Since theaim of this study is to develop an oral formulation, there-fore, solubility of drug in oils is more important as the abil-ity of nanoemulsion to maintain the drug in solubilizedform is greatly influenced by the solubility of the drug inoil phase. The solubility of ramipril in various oils wasdetermined by adding an excess amount of drug in 2 mLof selected oils (Sefsol 218, Triacetin, IPM, Labrafac, Cas-tor oil), distilled water separately in 5 mL capacity stoppervials, and mixed using a vortex mixer. The mixture vialswere then kept at 25 ± 1.0 �C in an isothermal shaker (Nir-mal International, Delhi, India) for 72 h to reach equilibri-um. The equilibrated samples were removed from shakerand centrifuged at 3000 rpm for 15 min. The supernatantwas taken and filtered through a 0.45 lm membrane filter.The concentration of ramipril was determined in oils andwater using HPLC at 210 nm.
S. Shafiq et al. / European Journal of Pharmaceutics and Biopharmaceutics 66 (2007) 227–243 229
2.3. Pseudo-ternary phase diagram study
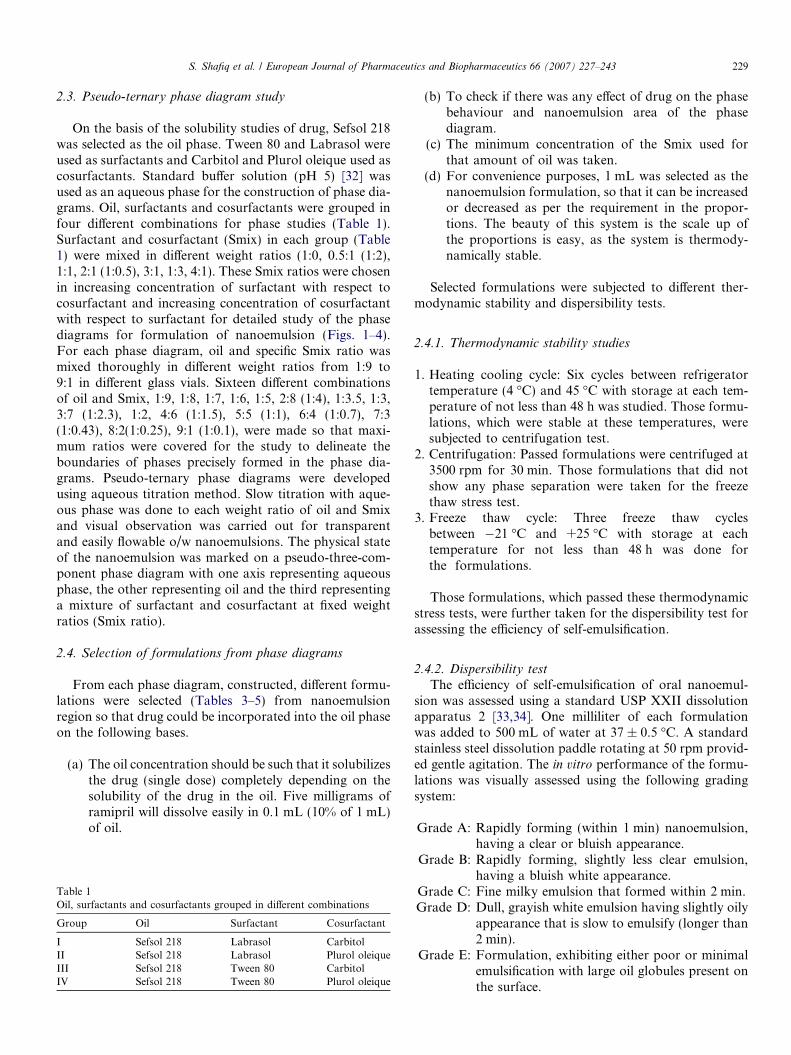
On the basis of the solubility studies of drug, Sefsol 218was selected as the oil phase. Tween 80 and Labrasol wereused as surfactants and Carbitol and Plurol oleique used ascosurfactants. Standard buffer solution (pH 5) [32] wasused as an aqueous phase for the construction of phase dia-grams. Oil, surfactants and cosurfactants were grouped infour different combinations for phase studies (Table 1).Surfactant and cosurfactant (Smix) in each group (Table1) were mixed in different weight ratios (1:0, 0.5:1 (1:2),1:1, 2:1 (1:0.5), 3:1, 1:3, 4:1). These Smix ratios were chosenin increasing concentration of surfactant with respect tocosurfactant and increasing concentration of cosurfactantwith respect to surfactant for detailed study of the phasediagrams for formulation of nanoemulsion (Figs. 1–4).For each phase diagram, oil and specific Smix ratio wasmixed thoroughly in different weight ratios from 1:9 to9:1 in different glass vials. Sixteen different combinationsof oil and Smix, 1:9, 1:8, 1:7, 1:6, 1:5, 2:8 (1:4), 1:3.5, 1:3,3:7 (1:2.3), 1:2, 4:6 (1:1.5), 5:5 (1:1), 6:4 (1:0.7), 7:3(1:0.43), 8:2(1:0.25), 9:1 (1:0.1), were made so that maxi-mum ratios were covered for the study to delineate theboundaries of phases precisely formed in the phase dia-grams. Pseudo-ternary phase diagrams were developedusing aqueous titration method. Slow titration with aque-ous phase was done to each weight ratio of oil and Smixand visual observation was carried out for transparentand easily flowable o/w nanoemulsions. The physical stateof the nanoemulsion was marked on a pseudo-three-com-ponent phase diagram with one axis representing aqueousphase, the other representing oil and the third representinga mixture of surfactant and cosurfactant at fixed weightratios (Smix ratio).
2.4. Selection of formulations from phase diagrams
From each phase diagram, constructed, different formu-lations were selected (Tables 3–5) from nanoemulsionregion so that drug could be incorporated into the oil phaseon the following bases.
(a) The oil concentration should be such that it solubilizesthe drug (single dose) completely depending on thesolubility of the drug in the oil. Five milligrams oframipril will dissolve easily in 0.1 mL (10% of 1 mL)of oil.
Table 1Oil, surfactants and cosurfactants grouped in different combinations
Group Oil Surfactant Cosurfactant
I Sefsol 218 Labrasol CarbitolII Sefsol 218 Labrasol Plurol oleiqueIII Sefsol 218 Tween 80 CarbitolIV Sefsol 218 Tween 80 Plurol oleique
(b) To check if there was any effect of drug on the phasebehaviour and nanoemulsion area of the phasediagram.
(c) The minimum concentration of the Smix used forthat amount of oil was taken.
(d) For convenience purposes, 1 mL was selected as thenanoemulsion formulation, so that it can be increasedor decreased as per the requirement in the propor-tions. The beauty of this system is the scale up ofthe proportions is easy, as the system is thermody-namically stable.
Selected formulations were subjected to different ther-modynamic stability and dispersibility tests.
2.4.1. Thermodynamic stability studies
1. Heating cooling cycle: Six cycles between refrigeratortemperature (4 �C) and 45 �C with storage at each tem-perature of not less than 48 h was studied. Those formu-lations, which were stable at these temperatures, weresubjected to centrifugation test.
2. Centrifugation: Passed formulations were centrifuged at3500 rpm for 30 min. Those formulations that did notshow any phase separation were taken for the freezethaw stress test.
3. Freeze thaw cycle: Three freeze thaw cyclesbetween �21 �C and +25 �C with storage at eachtemperature for not less than 48 h was done forthe formulations.
Those formulations, which passed these thermodynamicstress tests, were further taken for the dispersibility test forassessing the efficiency of self-emulsification.
2.4.2. Dispersibility test
The efficiency of self-emulsification of oral nanoemul-sion was assessed using a standard USP XXII dissolutionapparatus 2 [33,34]. One milliliter of each formulationwas added to 500 mL of water at 37 ± 0.5 �C. A standardstainless steel dissolution paddle rotating at 50 rpm provid-ed gentle agitation. The in vitro performance of the formu-lations was visually assessed using the following gradingsystem:
Grade A: Rapidly forming (within 1 min) nanoemulsion,having a clear or bluish appearance.
Grade B: Rapidly forming, slightly less clear emulsion,having a bluish white appearance.
Grade C: Fine milky emulsion that formed within 2 min.Grade D: Dull, grayish white emulsion having slightly oily
appearance that is slow to emulsify (longer than2 min).
Grade E: Formulation, exhibiting either poor or minimalemulsification with large oil globules present onthe surface.
O/W Nanoemulsion
Aqueous Oil
SmixSmix Ratio: 1:0
O/W Nanoemulsion
Aqueous Oil
SmixSmix Ratio: 1:1
O/W Nanoemulsion
Aqueous Oil
SmixSmix Ratio: 0.5:1
O/W Nanoemulsion
Aqueous Oil
SmixSmix Ratio: 2:1
O/W Nanoemulsion
Aqueous Oil
Smix
Smix Ratio: 3:1
a b
c
e
d
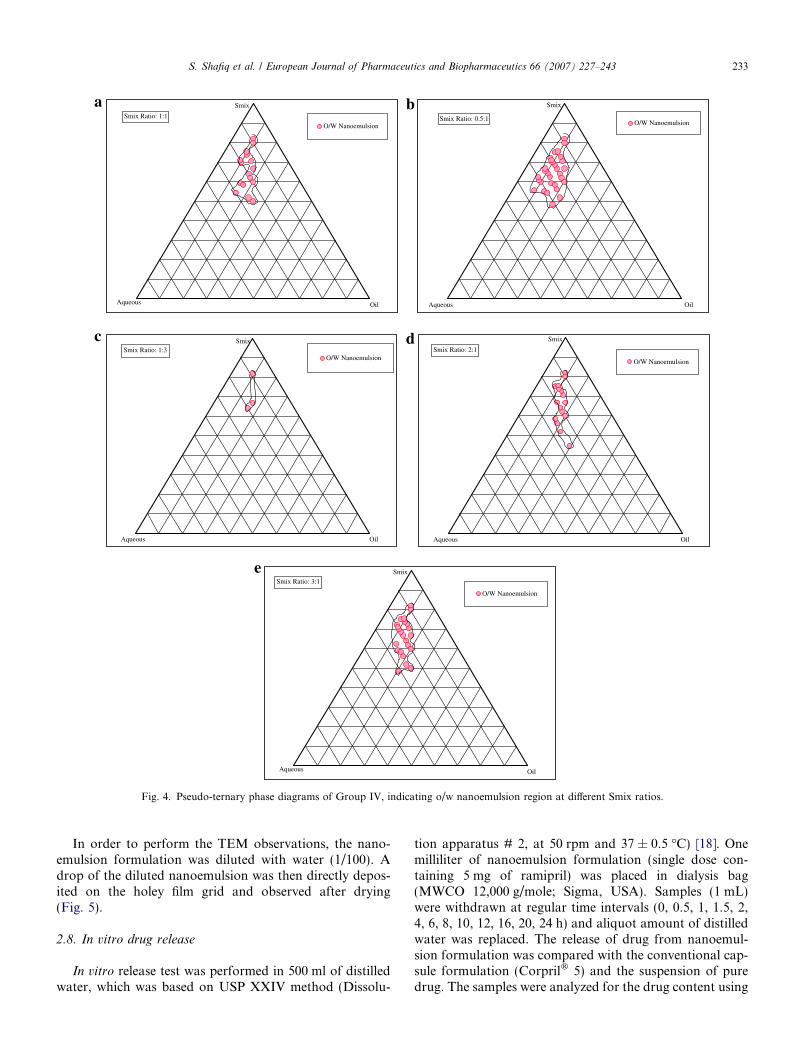
Fig. 1. Pseudo-ternary phase diagrams of Group I, indicating o/w nanoemulsion region at different Smix ratios.
230 S. Shafiq et al. / European Journal of Pharmaceutics and Biopharmaceutics 66 (2007) 227–243
Those formulations that passed the thermodynamicstability and also dispersibility test in Grade A andGrade B were selected for further studies (Table 6).The selected formulations were prepared by dissolving5 mg (single dose) of ramipril in oil (10%, 15%, 20%,25%, 30%). Respective Simx ratio was added to the oil,mixed on the vortex mixer and aqueous phase added.The mixture was mixed on the mixer and the resultingmixture gave nanoemulsion. The quantities added aregiven in Table 6.
2.5. Globule size analysis
The formulation (0.1 mL) was dispersed in 50 mL ofwater in volumetric flask and gently mixed by invertingthe flask. Globule size of the nanoemulsion was determinedby photon correlation spectroscopy that analyzes the fluc-tuations in light scattering due to Brownian motion of theparticles [35], using a Zetasizer 1000 HS (Malvern Instru-ments, UK). Light scattering was monitored at 25 �C at a90� angle (Table 7).
O/W Nanoemulsion
Aqueous Oil
SmixSmix Ratio: 1:1
O/W Nanoemulsion
Aqueous Oil
Smix
Smix Ratio: 0.5:1
O/W Nanoemulsion
Aqueous Oil
SmixSmix Ratio: 1:3
O/W Nanoemulsion
OilAqueous
Smix
Micro emulsion gel area
Smix Ratio: 2:1
O/W Nanoemulsion
Aqueous Oil
SmixSmix Ratio: 3:1
a b
c
e
d
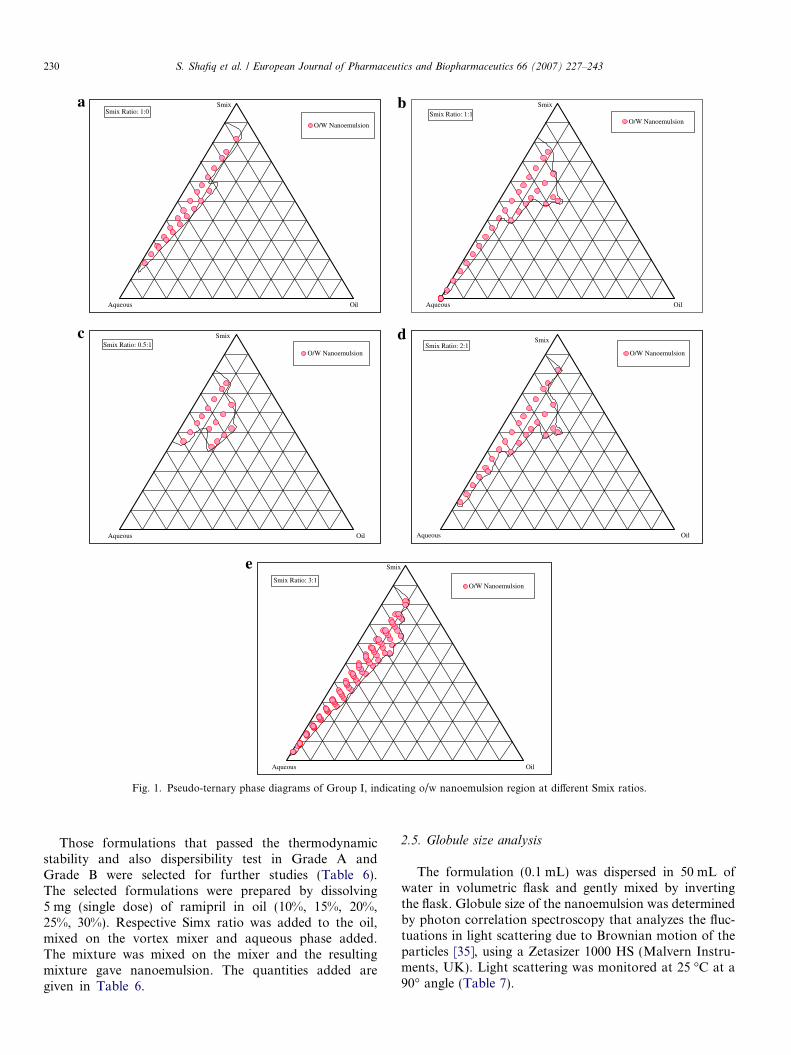
Fig. 2. Pseudo-ternary phase diagrams of Group II, indicating o/w nanoemulsion region at different Smix ratios.
S. Shafiq et al. / European Journal of Pharmaceutics and Biopharmaceutics 66 (2007) 227–243 231
2.6. Viscosity
The viscosity of the formulations (0.5 g) was deter-mined as such without dilution (Table 7) usingBrookfield DV III ultra V6.0 RV cone and plate rhe-ometer (Brookfield Engineering Laboratories, Inc.,Middleboro, MA) using spindle # CPE40 at25 ± 0.5 �C. The software used for the calculationswas Rheocalc V2.6.
2.7. Transmission electron microscopy (TEM)
Morphology and structure of the nanoemulsion werestudied using transmission electron microscopy (TEM)TOPCON 002B operating at 200 kV capable of point-to-point resolution. Combination of bright field imagingat increasing magnification and of diffraction modeswas used to reveal the form and size of thenanoemulsion.
O/W Nanoemulsion
Aqueous Oil
SmixSmix Ratio: 1:0
O/W Nanoemulsion
Aqueous Oil
SmixSmix Ratio: 1:1
O/W Nanoemulsion
Aqueous Oil
SmixSmix Ratio: 1:3
O/W Nanoemulsion
Aqueous Oil
SmixSmix Ratio: 2:1
O/W Nanoemulsion
Nanoemulsion gel
Aqueous Oil
SmixSmix Ratio: 3:1
O/W Nanoemulsion
Aqueous Oil
SmixSmix Ratio: 4:1
O/W Nanoemulsion
Aqueous Oil
SmixSmix Ratio: 0.5:1
a b
c d
e
g
f
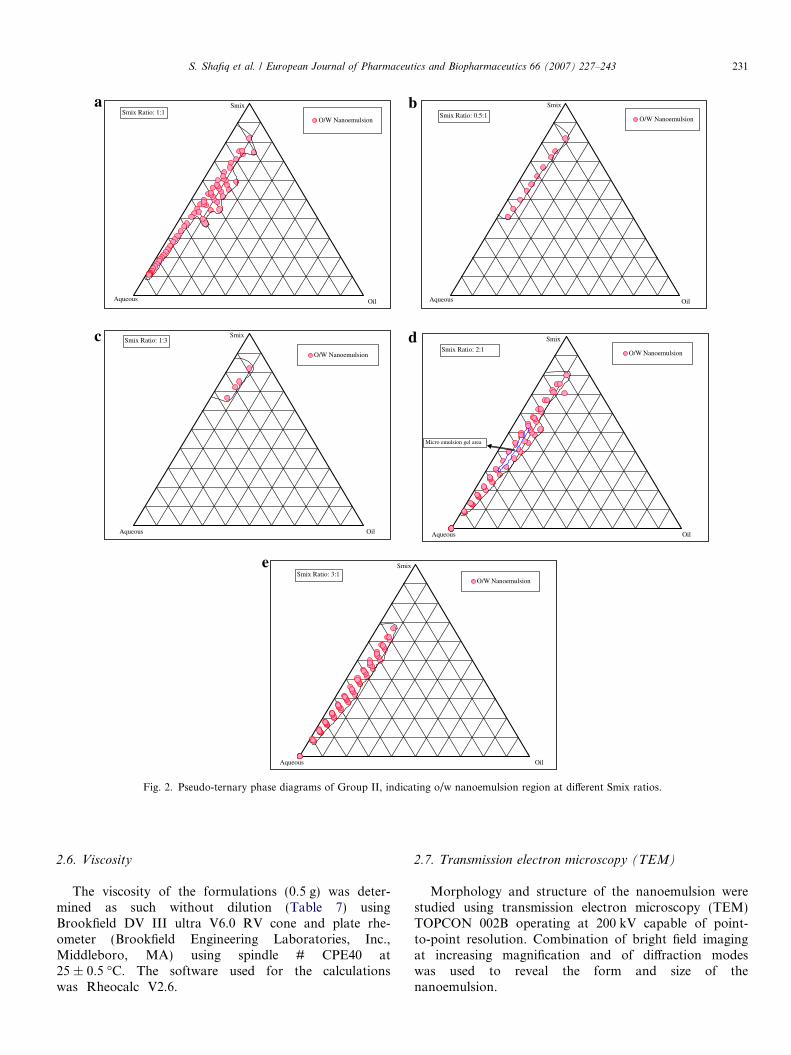
Fig. 3. Pseudo-ternary phase diagrams of Group III, indicating o/w nanoemulsion region at different Smix ratios.
232 S. Shafiq et al. / European Journal of Pharmaceutics and Biopharmaceutics 66 (2007) 227–243
O/W Nanoemulsion
Aqueous Oil
Smix
Smix Ratio: 0.5:1O/W Nanoemulsion
Aqueous Oil
Smix
Smix Ratio: 1:1
O/W Nanoemulsion
Aqueous Oil
SmixSmix Ratio: 1:3
O/W Nanoemulsion
Aqueous Oil
Smix
Smix Ratio: 2:1
O/W Nanoemulsion
Aqueous Oil
SmixSmix Ratio: 3:1
a b
c d
e
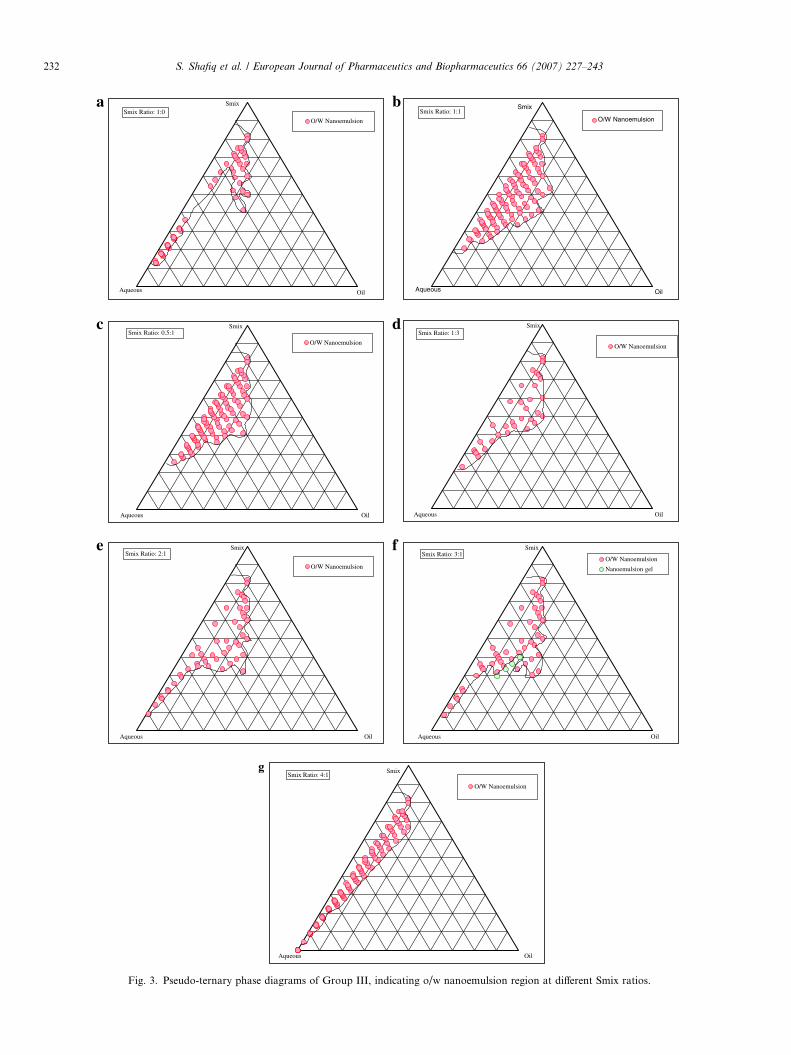
Fig. 4. Pseudo-ternary phase diagrams of Group IV, indicating o/w nanoemulsion region at different Smix ratios.
S. Shafiq et al. / European Journal of Pharmaceutics and Biopharmaceutics 66 (2007) 227–243 233
In order to perform the TEM observations, the nano-emulsion formulation was diluted with water (1/100). Adrop of the diluted nanoemulsion was then directly depos-ited on the holey film grid and observed after drying(Fig. 5).
2.8. In vitro drug release
In vitro release test was performed in 500 ml of distilledwater, which was based on USP XXIV method (Dissolu-
tion apparatus # 2, at 50 rpm and 37 ± 0.5 �C) [18]. Onemilliliter of nanoemulsion formulation (single dose con-taining 5 mg of ramipril) was placed in dialysis bag(MWCO 12,000 g/mole; Sigma, USA). Samples (1 mL)were withdrawn at regular time intervals (0, 0.5, 1, 1.5, 2,4, 6, 8, 10, 12, 16, 20, 24 h) and aliquot amount of distilledwater was replaced. The release of drug from nanoemul-sion formulation was compared with the conventional cap-sule formulation (Corpril� 5) and the suspension of puredrug. The samples were analyzed for the drug content using
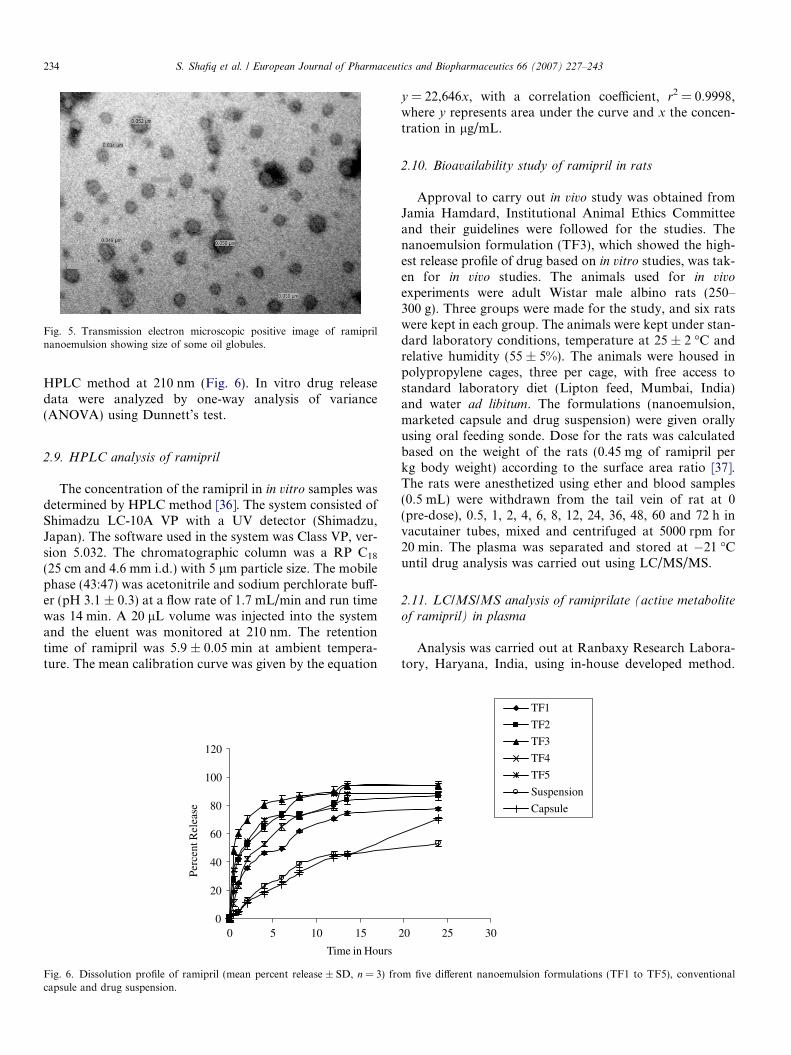
Fig. 5. Transmission electron microscopic positive image of ramiprilnanoemulsion showing size of some oil globules.
234 S. Shafiq et al. / European Journal of Pharmaceutics and Biopharmaceutics 66 (2007) 227–243
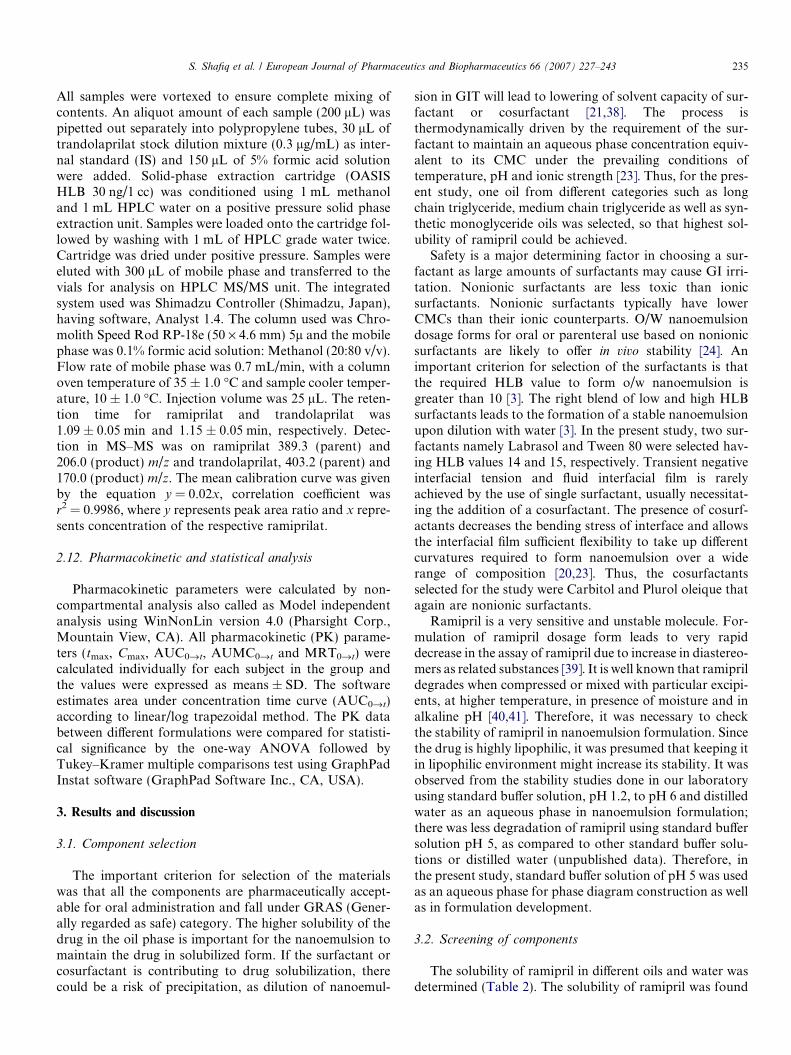
HPLC method at 210 nm (Fig. 6). In vitro drug releasedata were analyzed by one-way analysis of variance(ANOVA) using Dunnett’s test.
2.9. HPLC analysis of ramipril
The concentration of the ramipril in in vitro samples wasdetermined by HPLC method [36]. The system consisted ofShimadzu LC-10A VP with a UV detector (Shimadzu,Japan). The software used in the system was Class VP, ver-sion 5.032. The chromatographic column was a RP C18
(25 cm and 4.6 mm i.d.) with 5 lm particle size. The mobilephase (43:47) was acetonitrile and sodium perchlorate buff-er (pH 3.1 ± 0.3) at a flow rate of 1.7 mL/min and run timewas 14 min. A 20 lL volume was injected into the systemand the eluent was monitored at 210 nm. The retentiontime of ramipril was 5.9 ± 0.05 min at ambient tempera-ture. The mean calibration curve was given by the equation
0
20
40
60
80
100
120
0 5 10 15
Time in Hours
Perc
ent R
elea
se
Fig. 6. Dissolution profile of ramipril (mean percent release ± SD, n = 3) frocapsule and drug suspension.
y = 22,646x, with a correlation coefficient, r2 = 0.9998,where y represents area under the curve and x the concen-tration in lg/mL.
2.10. Bioavailability study of ramipril in rats
Approval to carry out in vivo study was obtained fromJamia Hamdard, Institutional Animal Ethics Committeeand their guidelines were followed for the studies. Thenanoemulsion formulation (TF3), which showed the high-est release profile of drug based on in vitro studies, was tak-en for in vivo studies. The animals used for in vivo
experiments were adult Wistar male albino rats (250–300 g). Three groups were made for the study, and six ratswere kept in each group. The animals were kept under stan-dard laboratory conditions, temperature at 25 ± 2 �C andrelative humidity (55 ± 5%). The animals were housed inpolypropylene cages, three per cage, with free access tostandard laboratory diet (Lipton feed, Mumbai, India)and water ad libitum. The formulations (nanoemulsion,marketed capsule and drug suspension) were given orallyusing oral feeding sonde. Dose for the rats was calculatedbased on the weight of the rats (0.45 mg of ramipril perkg body weight) according to the surface area ratio [37].The rats were anesthetized using ether and blood samples(0.5 mL) were withdrawn from the tail vein of rat at 0(pre-dose), 0.5, 1, 2, 4, 6, 8, 12, 24, 36, 48, 60 and 72 h invacutainer tubes, mixed and centrifuged at 5000 rpm for20 min. The plasma was separated and stored at �21 �Cuntil drug analysis was carried out using LC/MS/MS.
2.11. LC/MS/MS analysis of ramiprilate (active metabolite
of ramipril) in plasma
Analysis was carried out at Ranbaxy Research Labora-tory, Haryana, India, using in-house developed method.
20 25 30
TF1
TF2
TF3
TF4
TF5
Suspension
Capsule
m five different nanoemulsion formulations (TF1 to TF5), conventional
S. Shafiq et al. / European Journal of Pharmaceutics and Biopharmaceutics 66 (2007) 227–243 235
All samples were vortexed to ensure complete mixing ofcontents. An aliquot amount of each sample (200 lL) waspipetted out separately into polypropylene tubes, 30 lL oftrandolaprilat stock dilution mixture (0.3 lg/mL) as inter-nal standard (IS) and 150 lL of 5% formic acid solutionwere added. Solid-phase extraction cartridge (OASISHLB 30 ng/1 cc) was conditioned using 1 mL methanoland 1 mL HPLC water on a positive pressure solid phaseextraction unit. Samples were loaded onto the cartridge fol-lowed by washing with 1 mL of HPLC grade water twice.Cartridge was dried under positive pressure. Samples wereeluted with 300 lL of mobile phase and transferred to thevials for analysis on HPLC MS/MS unit. The integratedsystem used was Shimadzu Controller (Shimadzu, Japan),having software, Analyst 1.4. The column used was Chro-molith Speed Rod RP-18e (50 · 4.6 mm) 5l and the mobilephase was 0.1% formic acid solution: Methanol (20:80 v/v).Flow rate of mobile phase was 0.7 mL/min, with a columnoven temperature of 35 ± 1.0 �C and sample cooler temper-ature, 10 ± 1.0 �C. Injection volume was 25 lL. The reten-tion time for ramiprilat and trandolaprilat was1.09 ± 0.05 min and 1.15 ± 0.05 min, respectively. Detec-tion in MS–MS was on ramiprilat 389.3 (parent) and206.0 (product) m/z and trandolaprilat, 403.2 (parent) and170.0 (product) m/z. The mean calibration curve was givenby the equation y = 0.02x, correlation coefficient wasr2 = 0.9986, where y represents peak area ratio and x repre-sents concentration of the respective ramiprilat.
2.12. Pharmacokinetic and statistical analysis
Pharmacokinetic parameters were calculated by non-compartmental analysis also called as Model independentanalysis using WinNonLin version 4.0 (Pharsight Corp.,Mountain View, CA). All pharmacokinetic (PK) parame-ters (tmax, Cmax, AUC0fit, AUMC0fit and MRT0fit) werecalculated individually for each subject in the group andthe values were expressed as means ± SD. The softwareestimates area under concentration time curve (AUC0fit)according to linear/log trapezoidal method. The PK databetween different formulations were compared for statisti-cal significance by the one-way ANOVA followed byTukey–Kramer multiple comparisons test using GraphPadInstat software (GraphPad Software Inc., CA, USA).
3. Results and discussion
3.1. Component selection
The important criterion for selection of the materialswas that all the components are pharmaceutically accept-able for oral administration and fall under GRAS (Gener-ally regarded as safe) category. The higher solubility of thedrug in the oil phase is important for the nanoemulsion tomaintain the drug in solubilized form. If the surfactant orcosurfactant is contributing to drug solubilization, therecould be a risk of precipitation, as dilution of nanoemul-
sion in GIT will lead to lowering of solvent capacity of sur-factant or cosurfactant [21,38]. The process isthermodynamically driven by the requirement of the sur-factant to maintain an aqueous phase concentration equiv-alent to its CMC under the prevailing conditions oftemperature, pH and ionic strength [23]. Thus, for the pres-ent study, one oil from different categories such as longchain triglyceride, medium chain triglyceride as well as syn-thetic monoglyceride oils was selected, so that highest sol-ubility of ramipril could be achieved.
Safety is a major determining factor in choosing a sur-factant as large amounts of surfactants may cause GI irri-tation. Nonionic surfactants are less toxic than ionicsurfactants. Nonionic surfactants typically have lowerCMCs than their ionic counterparts. O/W nanoemulsiondosage forms for oral or parenteral use based on nonionicsurfactants are likely to offer in vivo stability [24]. Animportant criterion for selection of the surfactants is thatthe required HLB value to form o/w nanoemulsion isgreater than 10 [3]. The right blend of low and high HLBsurfactants leads to the formation of a stable nanoemulsionupon dilution with water [3]. In the present study, two sur-factants namely Labrasol and Tween 80 were selected hav-ing HLB values 14 and 15, respectively. Transient negativeinterfacial tension and fluid interfacial film is rarelyachieved by the use of single surfactant, usually necessitat-ing the addition of a cosurfactant. The presence of cosurf-actants decreases the bending stress of interface and allowsthe interfacial film sufficient flexibility to take up differentcurvatures required to form nanoemulsion over a widerange of composition [20,23]. Thus, the cosurfactantsselected for the study were Carbitol and Plurol oleique thatagain are nonionic surfactants.
Ramipril is a very sensitive and unstable molecule. For-mulation of ramipril dosage form leads to very rapiddecrease in the assay of ramipril due to increase in diastereo-mers as related substances [39]. It is well known that ramiprildegrades when compressed or mixed with particular excipi-ents, at higher temperature, in presence of moisture and inalkaline pH [40,41]. Therefore, it was necessary to checkthe stability of ramipril in nanoemulsion formulation. Sincethe drug is highly lipophilic, it was presumed that keeping itin lipophilic environment might increase its stability. It wasobserved from the stability studies done in our laboratoryusing standard buffer solution, pH 1.2, to pH 6 and distilledwater as an aqueous phase in nanoemulsion formulation;there was less degradation of ramipril using standard buffersolution pH 5, as compared to other standard buffer solu-tions or distilled water (unpublished data). Therefore, inthe present study, standard buffer solution of pH 5 was usedas an aqueous phase for phase diagram construction as wellas in formulation development.
3.2. Screening of components
The solubility of ramipril in different oils and water wasdetermined (Table 2). The solubility of ramipril was found
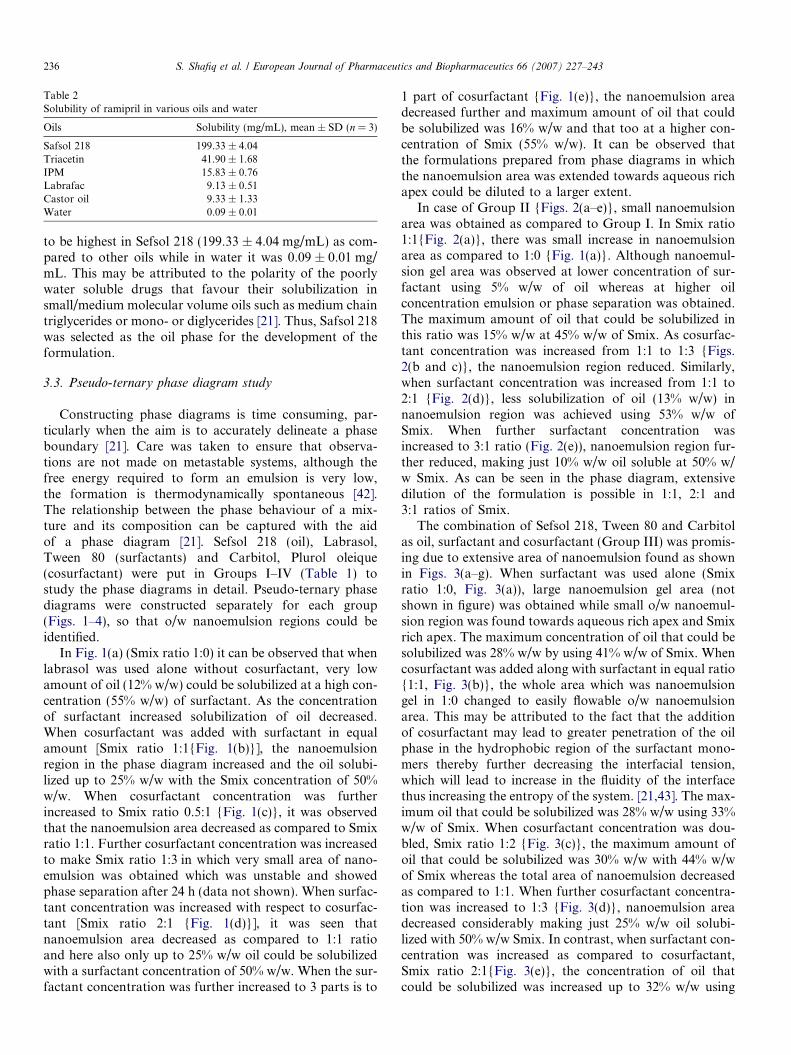
Table 2Solubility of ramipril in various oils and water
Oils Solubility (mg/mL), mean ± SD (n = 3)
Safsol 218 199.33 ± 4.04Triacetin 41.90 ± 1.68IPM 15.83 ± 0.76Labrafac 9.13 ± 0.51Castor oil 9.33 ± 1.33Water 0.09 ± 0.01
236 S. Shafiq et al. / European Journal of Pharmaceutics and Biopharmaceutics 66 (2007) 227–243
to be highest in Sefsol 218 (199.33 ± 4.04 mg/mL) as com-pared to other oils while in water it was 0.09 ± 0.01 mg/mL. This may be attributed to the polarity of the poorlywater soluble drugs that favour their solubilization insmall/medium molecular volume oils such as medium chaintriglycerides or mono- or diglycerides [21]. Thus, Safsol 218was selected as the oil phase for the development of theformulation.
3.3. Pseudo-ternary phase diagram study
Constructing phase diagrams is time consuming, par-ticularly when the aim is to accurately delineate a phaseboundary [21]. Care was taken to ensure that observa-tions are not made on metastable systems, although thefree energy required to form an emulsion is very low,the formation is thermodynamically spontaneous [42].The relationship between the phase behaviour of a mix-ture and its composition can be captured with the aidof a phase diagram [21]. Sefsol 218 (oil), Labrasol,Tween 80 (surfactants) and Carbitol, Plurol oleique(cosurfactant) were put in Groups I–IV (Table 1) tostudy the phase diagrams in detail. Pseudo-ternary phasediagrams were constructed separately for each group(Figs. 1–4), so that o/w nanoemulsion regions could beidentified.
In Fig. 1(a) (Smix ratio 1:0) it can be observed that whenlabrasol was used alone without cosurfactant, very lowamount of oil (12% w/w) could be solubilized at a high con-centration (55% w/w) of surfactant. As the concentrationof surfactant increased solubilization of oil decreased.When cosurfactant was added with surfactant in equalamount [Smix ratio 1:1{Fig. 1(b)}], the nanoemulsionregion in the phase diagram increased and the oil solubi-lized up to 25% w/w with the Smix concentration of 50%w/w. When cosurfactant concentration was furtherincreased to Smix ratio 0.5:1 {Fig. 1(c)}, it was observedthat the nanoemulsion area decreased as compared to Smixratio 1:1. Further cosurfactant concentration was increasedto make Smix ratio 1:3 in which very small area of nano-emulsion was obtained which was unstable and showedphase separation after 24 h (data not shown). When surfac-tant concentration was increased with respect to cosurfac-tant [Smix ratio 2:1 {Fig. 1(d)}], it was seen thatnanoemulsion area decreased as compared to 1:1 ratioand here also only up to 25% w/w oil could be solubilizedwith a surfactant concentration of 50% w/w. When the sur-factant concentration was further increased to 3 parts is to
1 part of cosurfactant {Fig. 1(e)}, the nanoemulsion areadecreased further and maximum amount of oil that couldbe solubilized was 16% w/w and that too at a higher con-centration of Smix (55% w/w). It can be observed thatthe formulations prepared from phase diagrams in whichthe nanoemulsion area was extended towards aqueous richapex could be diluted to a larger extent.
In case of Group II {Figs. 2(a–e)}, small nanoemulsionarea was obtained as compared to Group I. In Smix ratio1:1{Fig. 2(a)}, there was small increase in nanoemulsionarea as compared to 1:0 {Fig. 1(a)}. Although nanoemul-sion gel area was observed at lower concentration of sur-factant using 5% w/w of oil whereas at higher oilconcentration emulsion or phase separation was obtained.The maximum amount of oil that could be solubilized inthis ratio was 15% w/w at 45% w/w of Smix. As cosurfac-tant concentration was increased from 1:1 to 1:3 {Figs.2(b and c)}, the nanoemulsion region reduced. Similarly,when surfactant concentration was increased from 1:1 to2:1 {Fig. 2(d)}, less solubilization of oil (13% w/w) innanoemulsion region was achieved using 53% w/w ofSmix. When further surfactant concentration wasincreased to 3:1 ratio (Fig. 2(e)), nanoemulsion region fur-ther reduced, making just 10% w/w oil soluble at 50% w/w Smix. As can be seen in the phase diagram, extensivedilution of the formulation is possible in 1:1, 2:1 and3:1 ratios of Smix.
The combination of Sefsol 218, Tween 80 and Carbitolas oil, surfactant and cosurfactant (Group III) was promis-ing due to extensive area of nanoemulsion found as shownin Figs. 3(a–g). When surfactant was used alone (Smixratio 1:0, Fig. 3(a)), large nanoemulsion gel area (notshown in figure) was obtained while small o/w nanoemul-sion region was found towards aqueous rich apex and Smixrich apex. The maximum concentration of oil that could besolubilized was 28% w/w by using 41% w/w of Smix. Whencosurfactant was added along with surfactant in equal ratio{1:1, Fig. 3(b)}, the whole area which was nanoemulsiongel in 1:0 changed to easily flowable o/w nanoemulsionarea. This may be attributed to the fact that the additionof cosurfactant may lead to greater penetration of the oilphase in the hydrophobic region of the surfactant mono-mers thereby further decreasing the interfacial tension,which will lead to increase in the fluidity of the interfacethus increasing the entropy of the system. [21,43]. The max-imum oil that could be solubilized was 28% w/w using 33%w/w of Smix. When cosurfactant concentration was dou-bled, Smix ratio 1:2 {Fig. 3(c)}, the maximum amount ofoil that could be solubilized was 30% w/w with 44% w/wof Smix whereas the total area of nanoemulsion decreasedas compared to 1:1. When further cosurfactant concentra-tion was increased to 1:3 {Fig. 3(d)}, nanoemulsion areadecreased considerably making just 25% w/w oil solubi-lized with 50% w/w Smix. In contrast, when surfactant con-centration was increased as compared to cosurfactant,Smix ratio 2:1{Fig. 3(e)}, the concentration of oil thatcould be solubilized was increased up to 32% w/w using
S. Shafiq et al. / European Journal of Pharmaceutics and Biopharmaceutics 66 (2007) 227–243 237
Smix concentration 32% w/w only but the nanoemulsionregion decreased as compared to 1:1. A small nanoemul-sion gel area was also observed which may be due toincreased character of surfactant. When further surfactantconcentration was increased to 3:1{Fig. 3(f)}, and4:1{Fig. 3(g)}, nanoemulsion area in the phase diagramsslowly decreased with increase in nanoemulsion gel area.The maximum concentration of oil that could be solubi-lized in Smix ratio 4:1 was 18% w/w with a very high Smixconcentration of 62% w/w.
In case of Group IV, {Figs. 4(a–e)} the o/w nanoemul-sion area was limited. This combination is good for makingnanoemulsion gel as a large area of this could be achievedin these phase diagrams (data not shown). Thus, this groupwas dropped from further study.
While studying the phase diagrams (Figs 1–4), it can beseen that the free energy of nanoemulsion formation can beconsidered to depend on the extent to which the surfactantlowers the surface tension of the oil–water interface and thechange in dispersion entropy [21]. Thus, a negative freeenergy of formation is achieved when large reduction insurface tension is accompanied by significant favourableentropic changes. In such case nanoemulsion formation isspontaneous and the resulting dispersion is thermodynam-ically stable [21,42]. Therefore, the system that has poten-tial for oral drug delivery is the one in which surfactant
Table 3Thermodynamic stability and dispersibility test of different formulations selec
Smix ratio(S:CoS)
Percentage w/w of different components informulation
Observations bdispersibility te
Oil Smix Aqueous H/C
1:0 (Fig. 1a) 10 50 40p
1:1 (Fig. 1b) 10 40 50p
15 46 39p
20 51 29p
25 50 25p
0.5:1 (Fig. 1c) 10 50 40p
15 50 35p
20 45 35p
25 50 25p
2:1 (Fig. 1d) 10 40 50p
3:1 (Fig. 1e) 10 47 43p
Heating cooling cycle (H/C), centrifugation (Cent.), freeze-thaw cycle (Freez.
Table 4Thermodynamic stability and dispersibility test of different formulation selecte
Smix ratio(S:CoS)
Percentage w/w of different components informulation
Observations basdispersibility test
Oil Smix Aqueous H/C
1:1 (Fig. 2a) 10 55 35p
15 55 30p
2:1 (Fig. 2d) 10 50 40p
3:1 (Fig. 2e) 10 47 45p
Heating cooling cycle (H/C), centrifugation (Cent.), freeze thaw cycle (Freez.
or Smix concentration used should be able to increase thedispersion entropy, reduce the interfacial tension, increasethe interfacial area, lower the free energy of the system toa very low value with the minimum concentration (weightratio), resulting in spontaneous dispersion which is thermo-dynamically stable.
3.4. Selection of formulations from phase diagrams
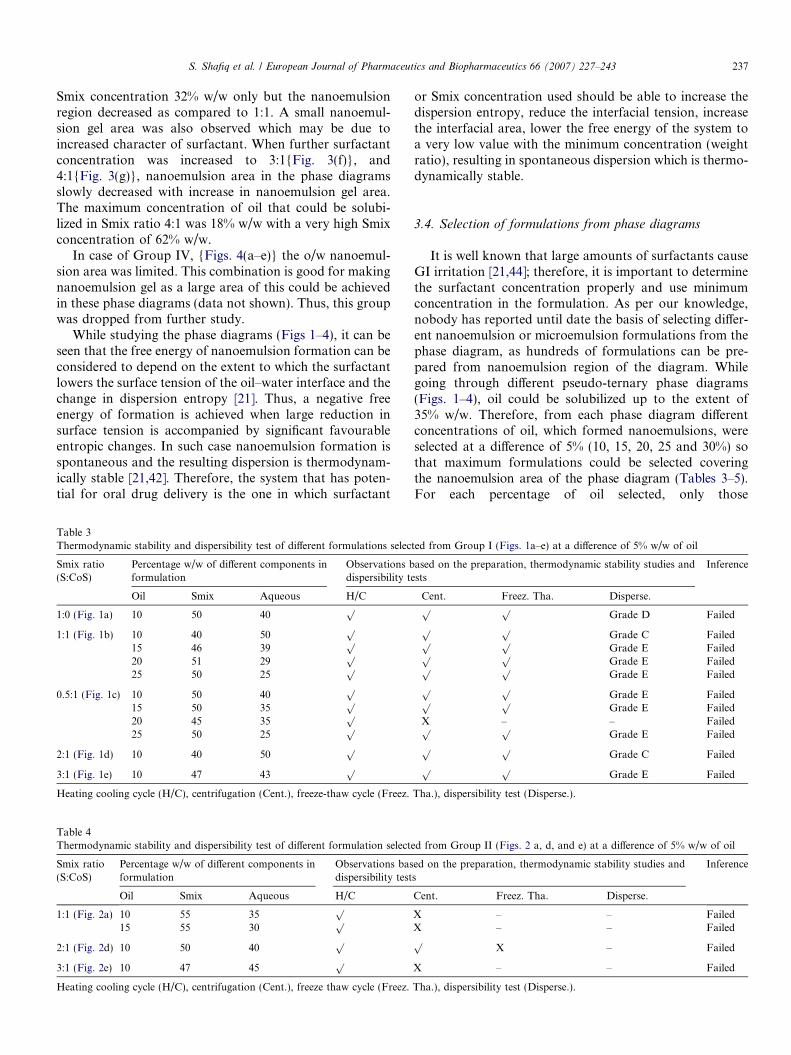
It is well known that large amounts of surfactants causeGI irritation [21,44]; therefore, it is important to determinethe surfactant concentration properly and use minimumconcentration in the formulation. As per our knowledge,nobody has reported until date the basis of selecting differ-ent nanoemulsion or microemulsion formulations from thephase diagram, as hundreds of formulations can be pre-pared from nanoemulsion region of the diagram. Whilegoing through different pseudo-ternary phase diagrams(Figs. 1–4), oil could be solubilized up to the extent of35% w/w. Therefore, from each phase diagram differentconcentrations of oil, which formed nanoemulsions, wereselected at a difference of 5% (10, 15, 20, 25 and 30%) sothat maximum formulations could be selected coveringthe nanoemulsion area of the phase diagram (Tables 3–5).For each percentage of oil selected, only those
ted from Group I (Figs. 1a–e) at a difference of 5% w/w of oil
ased on the preparation, thermodynamic stability studies andsts
Inference
Cent. Freez. Tha. Disperse.p p
Grade D Failedp p
Grade C Failedp pGrade E Failedp pGrade E Failedp pGrade E Failed
p pGrade E Failedp pGrade E Failed
X – – Failedp pGrade E Failed
p pGrade C Failed
p pGrade E Failed
Tha.), dispersibility test (Disperse.).
d from Group II (Figs. 2 a, d, and e) at a difference of 5% w/w of oil
ed on the preparation, thermodynamic stability studies ands
Inference
Cent. Freez. Tha. Disperse.
X – – FailedX – – Failedp
X – Failed
X – – Failed
Tha.), dispersibility test (Disperse.).
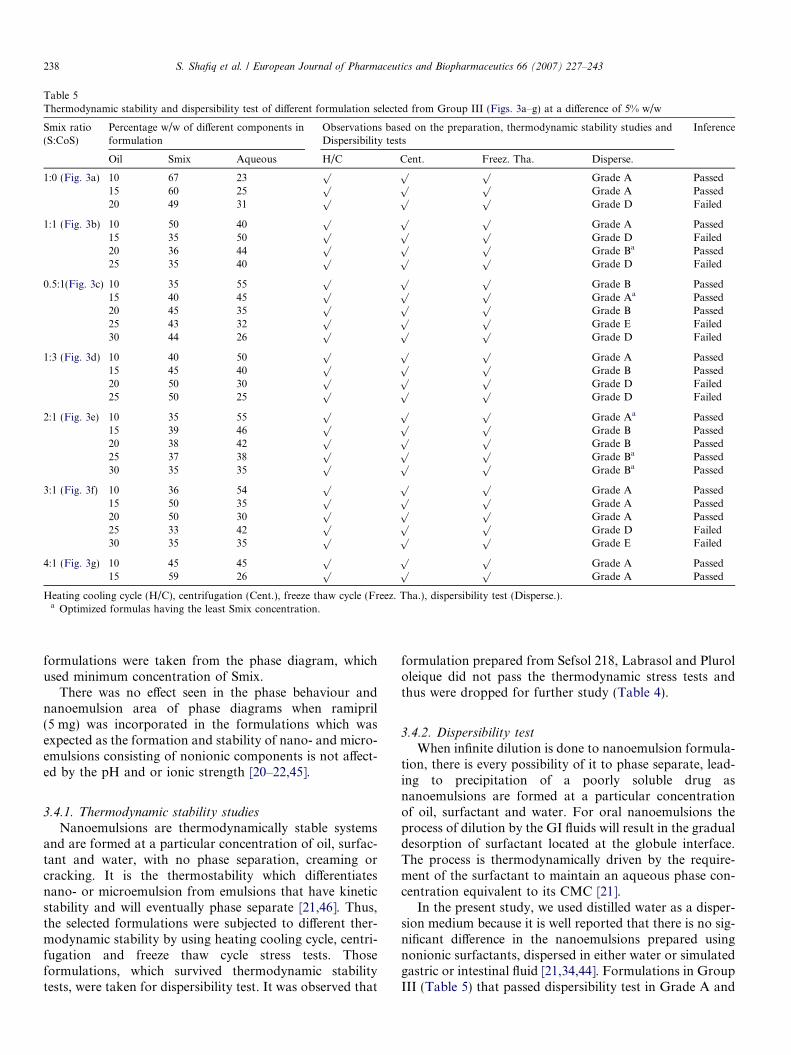
Table 5Thermodynamic stability and dispersibility test of different formulation selected from Group III (Figs. 3a–g) at a difference of 5% w/w
Smix ratio(S:CoS)
Percentage w/w of different components informulation
Observations based on the preparation, thermodynamic stability studies andDispersibility tests
Inference
Oil Smix Aqueous H/C Cent. Freez. Tha. Disperse.
1:0 (Fig. 3a) 10 67 23p p p
Grade A Passed15 60 25
p p pGrade A Passed
20 49 31p p p
Grade D Failed
1:1 (Fig. 3b) 10 50 40p p p
Grade A Passed15 35 50
p p pGrade D Failed
20 36 44p p p
Grade Ba Passed25 35 40
p p pGrade D Failed
0.5:1(Fig. 3c) 10 35 55p p p
Grade B Passed15 40 45
p p pGrade Aa Passed
20 45 35p p p
Grade B Passed25 43 32
p p pGrade E Failed
30 44 26p p p
Grade D Failed
1:3 (Fig. 3d) 10 40 50p p p
Grade A Passed15 45 40
p p pGrade B Passed
20 50 30p p p
Grade D Failed25 50 25
p p pGrade D Failed
2:1 (Fig. 3e) 10 35 55p p p
Grade Aa Passed15 39 46
p p pGrade B Passed
20 38 42p p p
Grade B Passed25 37 38
p p pGrade Ba Passed
30 35 35p p p
Grade Ba Passed
3:1 (Fig. 3f) 10 36 54p p p
Grade A Passed15 50 35
p p pGrade A Passed
20 50 30p p p
Grade A Passed25 33 42
p p pGrade D Failed
30 35 35p p p
Grade E Failed
4:1 (Fig. 3g) 10 45 45p p p
Grade A Passed15 59 26
p p pGrade A Passed
Heating cooling cycle (H/C), centrifugation (Cent.), freeze thaw cycle (Freez. Tha.), dispersibility test (Disperse.).a Optimized formulas having the least Smix concentration.
238 S. Shafiq et al. / European Journal of Pharmaceutics and Biopharmaceutics 66 (2007) 227–243
formulations were taken from the phase diagram, whichused minimum concentration of Smix.
There was no effect seen in the phase behaviour andnanoemulsion area of phase diagrams when ramipril(5 mg) was incorporated in the formulations which wasexpected as the formation and stability of nano- and micro-emulsions consisting of nonionic components is not affect-ed by the pH and or ionic strength [20–22,45].
3.4.1. Thermodynamic stability studies
Nanoemulsions are thermodynamically stable systemsand are formed at a particular concentration of oil, surfac-tant and water, with no phase separation, creaming orcracking. It is the thermostability which differentiatesnano- or microemulsion from emulsions that have kineticstability and will eventually phase separate [21,46]. Thus,the selected formulations were subjected to different ther-modynamic stability by using heating cooling cycle, centri-fugation and freeze thaw cycle stress tests. Thoseformulations, which survived thermodynamic stabilitytests, were taken for dispersibility test. It was observed that
formulation prepared from Sefsol 218, Labrasol and Plurololeique did not pass the thermodynamic stress tests andthus were dropped for further study (Table 4).
3.4.2. Dispersibility test
When infinite dilution is done to nanoemulsion formula-tion, there is every possibility of it to phase separate, lead-ing to precipitation of a poorly soluble drug asnanoemulsions are formed at a particular concentrationof oil, surfactant and water. For oral nanoemulsions theprocess of dilution by the GI fluids will result in the gradualdesorption of surfactant located at the globule interface.The process is thermodynamically driven by the require-ment of the surfactant to maintain an aqueous phase con-centration equivalent to its CMC [21].
In the present study, we used distilled water as a disper-sion medium because it is well reported that there is no sig-nificant difference in the nanoemulsions prepared usingnonionic surfactants, dispersed in either water or simulatedgastric or intestinal fluid [21,34,44]. Formulations in GroupIII (Table 5) that passed dispersibility test in Grade A and
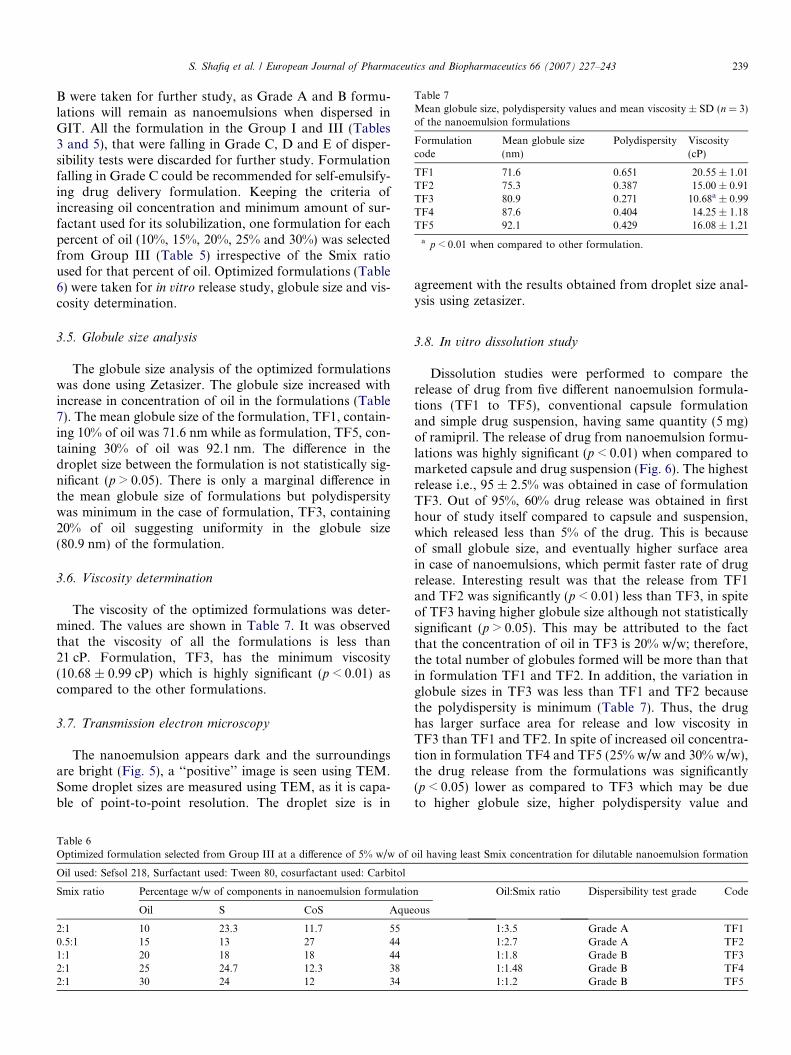
Table 7Mean globule size, polydispersity values and mean viscosity ± SD (n = 3)of the nanoemulsion formulations
Formulationcode
Mean globule size(nm)
Polydispersity Viscosity(cP)
TF1 71.6 0.651 20.55 ± 1.01TF2 75.3 0.387 15.00 ± 0.91TF3 80.9 0.271 10.68a ± 0.99TF4 87.6 0.404 14.25 ± 1.18TF5 92.1 0.429 16.08 ± 1.21
a p < 0.01 when compared to other formulation.
S. Shafiq et al. / European Journal of Pharmaceutics and Biopharmaceutics 66 (2007) 227–243 239
B were taken for further study, as Grade A and B formu-lations will remain as nanoemulsions when dispersed inGIT. All the formulation in the Group I and III (Tables3 and 5), that were falling in Grade C, D and E of disper-sibility tests were discarded for further study. Formulationfalling in Grade C could be recommended for self-emulsify-ing drug delivery formulation. Keeping the criteria ofincreasing oil concentration and minimum amount of sur-factant used for its solubilization, one formulation for eachpercent of oil (10%, 15%, 20%, 25% and 30%) was selectedfrom Group III (Table 5) irrespective of the Smix ratioused for that percent of oil. Optimized formulations (Table6) were taken for in vitro release study, globule size and vis-cosity determination.
3.5. Globule size analysis
The globule size analysis of the optimized formulationswas done using Zetasizer. The globule size increased withincrease in concentration of oil in the formulations (Table7). The mean globule size of the formulation, TF1, contain-ing 10% of oil was 71.6 nm while as formulation, TF5, con-taining 30% of oil was 92.1 nm. The difference in thedroplet size between the formulation is not statistically sig-nificant (p > 0.05). There is only a marginal difference inthe mean globule size of formulations but polydispersitywas minimum in the case of formulation, TF3, containing20% of oil suggesting uniformity in the globule size(80.9 nm) of the formulation.
3.6. Viscosity determination
The viscosity of the optimized formulations was deter-mined. The values are shown in Table 7. It was observedthat the viscosity of all the formulations is less than21 cP. Formulation, TF3, has the minimum viscosity(10.68 ± 0.99 cP) which is highly significant (p < 0.01) ascompared to the other formulations.
3.7. Transmission electron microscopy
The nanoemulsion appears dark and the surroundingsare bright (Fig. 5), a ‘‘positive’’ image is seen using TEM.Some droplet sizes are measured using TEM, as it is capa-ble of point-to-point resolution. The droplet size is in
Table 6Optimized formulation selected from Group III at a difference of 5% w/w of
Oil used: Sefsol 218, Surfactant used: Tween 80, cosurfactant used: Carbitol
Smix ratio Percentage w/w of components in nanoemulsion formulatio
Oil S CoS Aque
2:1 10 23.3 11.7 550.5:1 15 13 27 441:1 20 18 18 442:1 25 24.7 12.3 382:1 30 24 12 34
agreement with the results obtained from droplet size anal-ysis using zetasizer.
3.8. In vitro dissolution study
Dissolution studies were performed to compare therelease of drug from five different nanoemulsion formula-tions (TF1 to TF5), conventional capsule formulationand simple drug suspension, having same quantity (5 mg)of ramipril. The release of drug from nanoemulsion formu-lations was highly significant (p < 0.01) when compared tomarketed capsule and drug suspension (Fig. 6). The highestrelease i.e., 95 ± 2.5% was obtained in case of formulationTF3. Out of 95%, 60% drug release was obtained in firsthour of study itself compared to capsule and suspension,which released less than 5% of the drug. This is becauseof small globule size, and eventually higher surface areain case of nanoemulsions, which permit faster rate of drugrelease. Interesting result was that the release from TF1and TF2 was significantly (p < 0.01) less than TF3, in spiteof TF3 having higher globule size although not statisticallysignificant (p > 0.05). This may be attributed to the factthat the concentration of oil in TF3 is 20% w/w; therefore,the total number of globules formed will be more than thatin formulation TF1 and TF2. In addition, the variation inglobule sizes in TF3 was less than TF1 and TF2 becausethe polydispersity is minimum (Table 7). Thus, the drughas larger surface area for release and low viscosity inTF3 than TF1 and TF2. In spite of increased oil concentra-tion in formulation TF4 and TF5 (25% w/w and 30% w/w),the drug release from the formulations was significantly(p < 0.05) lower as compared to TF3 which may be dueto higher globule size, higher polydispersity value and
oil having least Smix concentration for dilutable nanoemulsion formation
n Oil:Smix ratio Dispersibility test grade Code
ous
1:3.5 Grade A TF11:2.7 Grade A TF21:1.8 Grade B TF31:1.48 Grade B TF41:1.2 Grade B TF5
240 S. Shafiq et al. / European Journal of Pharmaceutics and Biopharmaceutics 66 (2007) 227–243
higher viscosity (Table 7). Thus surface area for the drugrelease may be more in TF3 than TF4 and TF5. In additionto this the higher oil concentration may restrain the releaseof the drug into the medium due to high lipophilic charac-ter of ramipril (log P is 3.32) as the partitioning of drug willbe more towards the oil.
Therefore, the optimized formulation, TF3, havinghigher drug release (95%), optimum globule size(80.9 nm), minimum polydispersity value (0.271), lower vis-
0
20
40
60
80
100
120
140
0 20 40 60 80
Time in hours
Plas
ma
Con
c.(n
g/m
L)
TF3
Capsule
Suspension
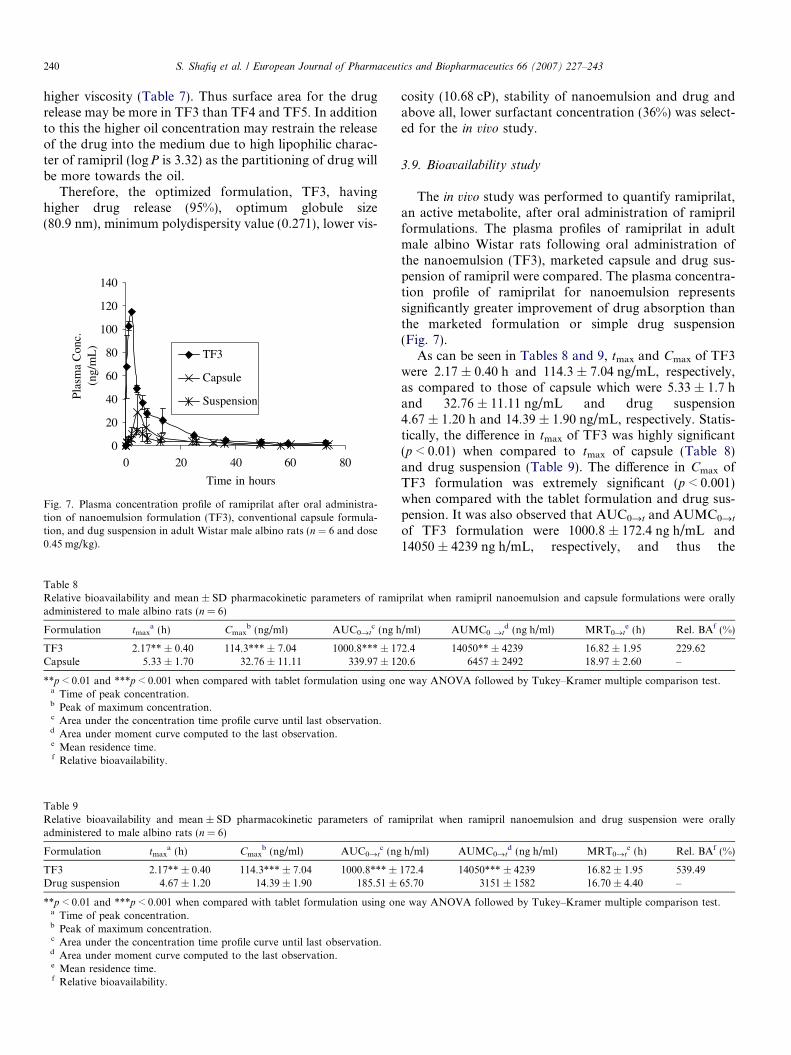
Fig. 7. Plasma concentration profile of ramiprilat after oral administra-tion of nanoemulsion formulation (TF3), conventional capsule formula-tion, and dug suspension in adult Wistar male albino rats (n = 6 and dose0.45 mg/kg).
Table 8Relative bioavailability and mean ± SD pharmacokinetic parameters of ramiadministered to male albino rats (n = 6)
Formulation tmaxa (h) Cmax
b (ng/ml) AUC0fitc (ng h
TF3 2.17** ± 0.40 114.3*** ± 7.04 1000.8*** ± 17Capsule 5.33 ± 1.70 32.76 ± 11.11 339.97 ± 12
**p < 0.01 and ***p < 0.001 when compared with tablet formulation using ona Time of peak concentration.b Peak of maximum concentration.c Area under the concentration time profile curve until last observation.d Area under moment curve computed to the last observation.e Mean residence time.f Relative bioavailability.
Table 9Relative bioavailability and mean ± SD pharmacokinetic parameters of ramadministered to male albino rats (n = 6)
Formulation tmaxa (h) Cmax
b (ng/ml) AUC0fitc (ng
TF3 2.17** ± 0.40 114.3*** ± 7.04 1000.8*** ±Drug suspension 4.67 ± 1.20 14.39 ± 1.90 185.51 ±
**p < 0.01 and ***p < 0.001 when compared with tablet formulation using ona Time of peak concentration.b Peak of maximum concentration.c Area under the concentration time profile curve until last observation.d Area under moment curve computed to the last observation.e Mean residence time.f Relative bioavailability.
cosity (10.68 cP), stability of nanoemulsion and drug andabove all, lower surfactant concentration (36%) was select-ed for the in vivo study.
3.9. Bioavailability study
The in vivo study was performed to quantify ramiprilat,an active metabolite, after oral administration of ramiprilformulations. The plasma profiles of ramiprilat in adultmale albino Wistar rats following oral administration ofthe nanoemulsion (TF3), marketed capsule and drug sus-pension of ramipril were compared. The plasma concentra-tion profile of ramiprilat for nanoemulsion representssignificantly greater improvement of drug absorption thanthe marketed formulation or simple drug suspension(Fig. 7).
As can be seen in Tables 8 and 9, tmax and Cmax of TF3were 2.17 ± 0.40 h and 114.3 ± 7.04 ng/mL, respectively,as compared to those of capsule which were 5.33 ± 1.7 hand 32.76 ± 11.11 ng/mL and drug suspension4.67 ± 1.20 h and 14.39 ± 1.90 ng/mL, respectively. Statis-tically, the difference in tmax of TF3 was highly significant(p < 0.01) when compared to tmax of capsule (Table 8)and drug suspension (Table 9). The difference in Cmax ofTF3 formulation was extremely significant (p < 0.001)when compared with the tablet formulation and drug sus-pension. It was also observed that AUC0fit and AUMC0fit
of TF3 formulation were 1000.8 ± 172.4 ng h/mL and14050 ± 4239 ng h/mL, respectively, and thus the
prilat when ramipril nanoemulsion and capsule formulations were orally
/ml) AUMC0 fitd (ng h/ml) MRT0fit
e (h) Rel. BAf (%)
2.4 14050** ± 4239 16.82 ± 1.95 229.620.6 6457 ± 2492 18.97 ± 2.60 –
e way ANOVA followed by Tukey–Kramer multiple comparison test.
iprilat when ramipril nanoemulsion and drug suspension were orally
h/ml) AUMC0fitd (ng h/ml) MRT0fit
e (h) Rel. BAf (%)
172.4 14050*** ± 4239 16.82 ± 1.95 539.4965.70 3151 ± 1582 16.70 ± 4.40 –
e way ANOVA followed by Tukey–Kramer multiple comparison test.
Tab
le10
Mea
n±
SD
,p
har
mac
ok
inet
icp
aram
eter
so
fra
mip
rila
tw
hen
ram
ipri
ld
osa
gefo
rms
wer
eo
rall
yad
min
iste
red
tom
ale
alb
ino
rats
(n=
6)
PK
Init
ial
rap
idp
rofi
leA
pp
aren
tel
imin
atio
np
rofi
leL
ast
elim
inat
ion
pro
file
TF
3C
aps
Su
spa
TF
3C
aps
Su
spT
F3
Cap
sS
usp
Kel
or
kzb
(h�
1)
0.14
94±
0.03
0.05
08±
0.02
0.04
96±
0.02
0.06
±0.
010.
0419
±0.
040.
0786
±0.
060.
0085
±0.
004
0.02
37±
0.01
00.
1715
±0.
200
t 1/2
c(h
)4.
74±
0.8
15.1
0±
5.90
17.1
0±
10.5
11.2
4±
2.20
26.2
4±
18.3
11.6
7±
6.80
101.
8±
53.9
32.1
9±
13.6
8.90
±9.
30A
UC
0fi
ad
(ng
h/m
l)10
08.5
±17
0.8
372.
17±
133.
718
7.91
±66
.910
39±
189
386
±96
187.
1±
6513
53.3
±37
4.6
431.
45±
138.
019
8.33
±89
.60
AU
MC
0fi
ae
(ng
h/m
l)15
537
±53
0196
36±
4393
3375
.28
±17
6217
475
±57
4311
909
±93
332
87±
1630
9392
5±
5886
912
996
±23
8038
89±
1738
MR
T0
fia
f(h
)14
.94
±2.
5925
.50
±5.
9117
.60
±4.
6016
.51
±2.
6032
.37
±9.
2017
.34
±4.
8067
.10
±31
.90
30.8
2±
4.40
19.6
3±
0.10
aD
rug
susp
ensi
on
.b
Fir
st-o
rder
rate
con
stan
tas
soci
ated
wit
hth
ete
rmin
al(l
og-
lin
ear)
po
rtio
no
fth
ecu
rve.
cH
alf
life
.d
Are
au
nd
ercu
rve
extr
apo
late
dto
infi
nit
y.e
Are
au
nd
erm
ove
men
tcu
rve
wh
enth
eti
me
con
cen
trat
ion
curv
eis
extr
apo
late
dto
infi
nit
y.f
Mea
nre
sid
ence
tim
ew
hen
the
dru
gco
nce
ntr
atio
np
rofi
leis
extr
apo
late
dto
infi
nit
y.
S. Shafiq et al. / European Journal of Pharmaceutics and Biopharmaceutics 66 (2007) 227–243 241
difference was extremely significant (p < 0.001) as com-pared to AUC0fit (339.97 ± 120.6 ng h/mL) and highlysignificant (p< 0.01) AUMC0fit (6457 ± 2492 ng h/mL)of capsule formulation (Table 8). Both the values ofTF3 were extremely significant (p < 0.001) as comparedto drug suspension (Table 9). The difference in the valuesof MRT0fit is not significantly different (p > 0.05) whenthe nanoemulsion, capsule or suspension was compared,as there is no change in the intrinsic properties of the drugwhen it is formulated into different formulations. The rel-ative bioavailability of TF3 to that of conventional cap-sule was 229.62% whereas to that of drug suspension itwas 539.49%.
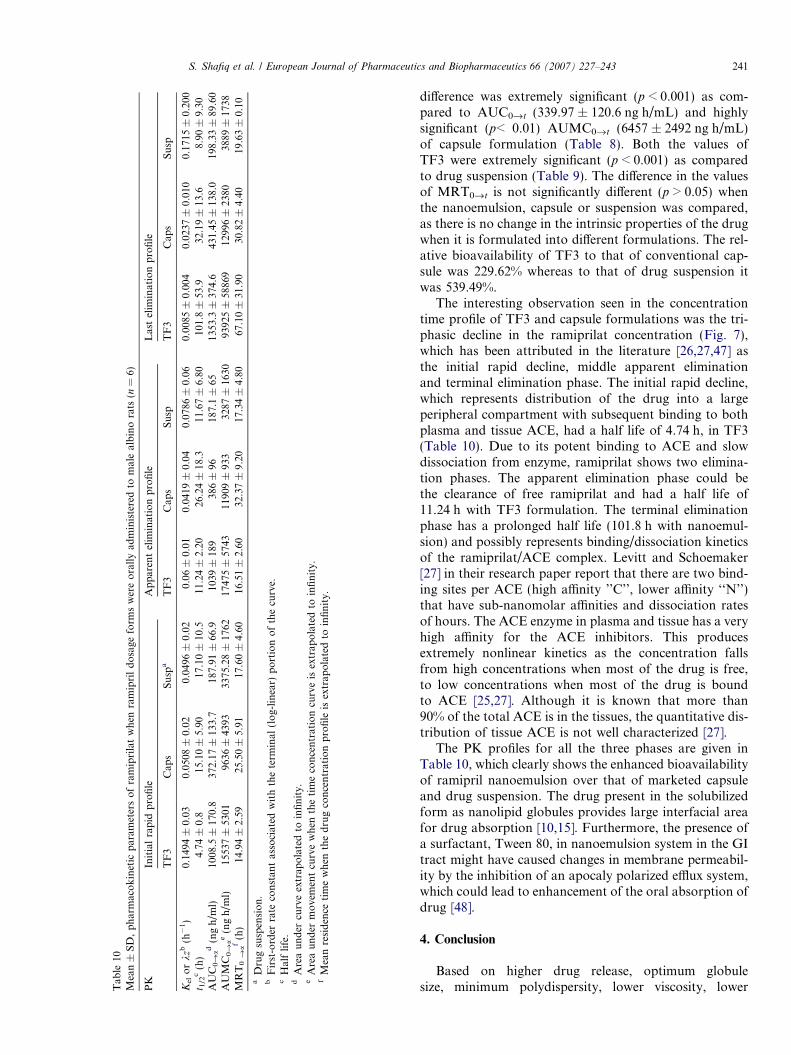
The interesting observation seen in the concentrationtime profile of TF3 and capsule formulations was the tri-phasic decline in the ramiprilat concentration (Fig. 7),which has been attributed in the literature [26,27,47] asthe initial rapid decline, middle apparent eliminationand terminal elimination phase. The initial rapid decline,which represents distribution of the drug into a largeperipheral compartment with subsequent binding to bothplasma and tissue ACE, had a half life of 4.74 h, in TF3(Table 10). Due to its potent binding to ACE and slowdissociation from enzyme, ramiprilat shows two elimina-tion phases. The apparent elimination phase could bethe clearance of free ramiprilat and had a half life of11.24 h with TF3 formulation. The terminal eliminationphase has a prolonged half life (101.8 h with nanoemul-sion) and possibly represents binding/dissociation kineticsof the ramiprilat/ACE complex. Levitt and Schoemaker[27] in their research paper report that there are two bind-ing sites per ACE (high affinity ’’C’’, lower affinity ‘‘N’’)that have sub-nanomolar affinities and dissociation ratesof hours. The ACE enzyme in plasma and tissue has a veryhigh affinity for the ACE inhibitors. This producesextremely nonlinear kinetics as the concentration fallsfrom high concentrations when most of the drug is free,to low concentrations when most of the drug is boundto ACE [25,27]. Although it is known that more than90% of the total ACE is in the tissues, the quantitative dis-tribution of tissue ACE is not well characterized [27].
The PK profiles for all the three phases are given inTable 10, which clearly shows the enhanced bioavailabilityof ramipril nanoemulsion over that of marketed capsuleand drug suspension. The drug present in the solubilizedform as nanolipid globules provides large interfacial areafor drug absorption [10,15]. Furthermore, the presence ofa surfactant, Tween 80, in nanoemulsion system in the GItract might have caused changes in membrane permeabil-ity by the inhibition of an apocaly polarized efflux system,which could lead to enhancement of the oral absorption ofdrug [48].
4. Conclusion
Based on higher drug release, optimum globulesize, minimum polydispersity, lower viscosity, lower
242 S. Shafiq et al. / European Journal of Pharmaceutics and Biopharmaceutics 66 (2007) 227–243
surfactant concentration, higher solubility as well as high-er bioavailability without variable absorption has beenoptimized as nanoemulsion formulation of ramipril con-taining Sefsol 218 (20% w/w), Tween 80 (18% w/w) andCarbitol (18% w/w) as oil, surfactant and cosurfactant,respectively. The in vivo studies revealed significantlygreater extent of absorption than the conventional capsuleformulation. The absorption of ramiprilat from ramiprilnanoemulsion resulted in 2.94-fold increase in bioavail-ability as compared to conventional capsule and 5.4-foldto that of drug suspension. Our studies illustrated thepotential use of ramipril formulated as nanoemulsions,can be used as a liquid formulation for pediatric and geri-atric patients as well can be formulated as SNEDDSusing soft gelatin capsules as unit dosage form. Studiesalso showed how nanoemulsion formulation can be opti-mized for the delivery of hydrophobic compounds withhigher drug loading, minimum surfactant concentrationand proper infinite dilution can be achieved without drugprecipitation.
Acknowledgements
The authors express gratitude to Ranbaxy ResearchLaboratory for carrying out in vivo analysis using LC/MS/MS in their C.P.P. department. Panacea Biotech Ltd,is thanked for carrying out globule size and viscosity anal-ysis in their research laboratory. Dr. Sanjula Baboota andDr. Javeed Ali are gratefully acknowledged for their valu-able discussions and comments.
References
[1] J.A. Bruce, Novel formulation strategies for improving oral bioavail-ability of drugs with poor membrane permeation or presystemicmetabolism, J. Pharm. Sci. 82 (1993) 979–987.
[2] J.R. Robinson, Introduction: semi-solid formulations for oral drugdelivery, B.T. Gattefosse 89 (1996) 11–13.
[3] T.R. Kommuru, B. Gurley, M.A. Khan, I.K. Reddy, Self-emulsifyingdrug delivery systems (SEDDS) of coenzyme Q10: formulationdevelopment and bioavailability assessment, Int. J. Pharm. 212(2001) 233–246.
[4] G.L. Amidon, H. Lennernas, V.P. Shah, J.R. Crison, A theoreticalbasis for a biopharmaceutic drug classification: the correlation ofin vitro drug product dissolution and in vivo bioavailability, Pharm.Res. 12 (1995) 413–420.
[5] V.J. Stella, J. Haslam, N. Yata, H. Okada, S. Lindenbaum,T. Higuchi, Enhancement of bioavailability of a hydrophobic amineantimalarial by formulation with oleic acid in a soft gelatin capsule,J. Pharm. Sci. 67 (1978) 1375–1377.
[6] K.J. Palin, A.J. Phillips, A. Ning, The oral absorption of cefoxitinfrom oil and emulsion vehicles in rats, Int. J. Pharm. 33 (1986)99–104.
[7] A.T.M. Serajuddin, P.C. Shee, D. Mufson, D.F. Bernstein,M.A. Augustine, Effect of vehicle amphiphilicity on the dissolutionand bioavailability of a poorly water soluble drug from soliddispersion, J. Pharm. Sci. 77 (1988) 414–417.
[8] M.G. Wakerly, C.W. Pouton, B.J. Meakin, F.S. Morton, Selfemul-sification of vegetable oil-non-ionic surfactant mixtures, ACS Symp.Series 311 (1986) 242–255.
[9] H. Toguchi, Y. Ogawa, K. Iga, T. Yashiki, T. Shimamoto, Gastro-intestinal absorption of ethyl 2-chloro-3-(4-(2-methyl-2-phenylpro-pyloxy)phenyl) propionate from different dosage forms in rats anddogs, Chem. Pharm. Bull. 38 (1990) 2792–2796.
[10] S.A. Charman, W.N. Charman, M.C. Rogge, T.D. Wilson,F.J. Dutko, C.W. Pouton, Self-emulsifying drug delivery systems:formulation and biopharmaceutic evaluation of an investigationallipophilic compound, Pharm. Res. 9 (1) (1992) 87–93.
[11] T.T. Kararli, T.E. Nedham, M. Griffin, G. Schoenhard, L.J. Ferro,L. Alcorn, Oral delivery of a renin inhibitor compound usingemulsion formulations, Pharm. Res. 9 (1992) 888–893.
[12] R.A. Myers, V.J. Stella, Systemic bioavailability of penclomedine(NSC-338720) from oil-in-water emulsions administered intraduode-nally to rats, Int. J. Pharm. 78 (1992) 217–226.
[13] D.Q.M. Craig, H.S.R. Lievens, K.G. Pitt, D.E. Storey, An investi-gation into the physicochemical properties of self-emulsifying systemsusing low frequency dielectric spectroscopy, surface tension measure-ments and particle size analysis, Int. J. Pharm. 96 (1993) 147–155.
[14] B.J. Aungst, N. Nguyen, N.J. Rogers, S. Rowe, M. Hussain, L.Shum, S. White, Improved oral bioavailability of an HIV proteaseinhibitor using Gelucire 44/14 and Labrasol vehicles, B.T. Gattefosse87 (1994) 49–54.
[15] N.H. Shah, M.T. Carvajal, C.I. Patel, M.H. Infeld, A.W. Malick,Self-emulsifying drug delivery systems (SEDDS) with polyglycolizedglycerides for improving in vitro dissolution and oral absorption oflipophilic drugs, Int. J. Pharm. 106 (1994) 15–23.
[16] R.A. Schwendener, H. Schott, Lipophilic 1-beta-D-arabinofuranosylcytosine derivatives in liposomal formulations for oral and parenteralantileukemic therapy in the murine L1210 leukemia model, J. Cancer.Res. Clin. Oncol. 122 (1996) 723–726.
[17] D.L. Burcham, M.B. Maurin, E.A. Hausner, S.M. Huang, Improvedoral bioavailability of the hypocholesterolemic DMP 565 in dogsfollowing oral dosing in oil and glycol solutions, Biopharm. DrugDispos. 18 (1997) 737–742.
[18] B.K. Kang, J.S. Lee, S.K. Chon, S.Y. Jeong, S. H Yuk,G. Khang, H.B. Lee, S.H. Cho, Development of self-microemul-sifying drug delivery systems (SMEDDS) for oral bioavailabilityenhancement of simvastatin in beagle dogs, Int. J. Pharm. 274(2004) 65–73.
[19] K. Bouchemal, S. Briancon, E. Perrier, H. Fessi, Nano-emulsionformulation using spontaneous emulsification: solvent, oil andsurfactant optimization, Int. J. Pharm. 280 (2004) 241–251.
[20] J. Eccleston, Microemulsions, in: J. Swarbrick, J.C. Boylan (Eds.),Encyclopedia of Pharmaceutical Technology, vol. 9, Marcel Dekker,New York, 1994, pp. 375–421.
[21] M.J. Lawrence, G.D. Rees, Microemulsion-based media as noveldrug delivery systems, Adv. Drug Deliv. Rev. 45 (2000) 89–121.
[22] P.P. Constantinides, Lipid microemulsions for improving drugdissolution and oral absorption and biopharmaceutical aspects,Pharm. Res. 12 (11) (1995) 1561–1572.
[23] K. Kawakami, T. Yoshikawa, Y. Moroto, E. Kanaoka, K. Takah-ashi, Y. Nishihara, K. Masuda, Microemulsion formulation forenhanced absorption of poorly soluble drugs I. Prescription design, J.Control. Release 81 (2002) 65–74.
[24] K. Kawakami, T. Yoshikawa, Y. Moroto, E. Kanaoka, K. Takah-ashi, Y. Nishihara, K. Masuda, Microemulsion formulation forenhanced absorption of poorly soluble drugs II. In vivo study, J.Control. Release 81 (2002) 75–82.
[25] J.M.V. Griensven, R.C. Schoemaker, A.F. Cohen, H.G. Luus,M.S. Grafe, H.J. Rothig, Pharmacokinetics, pharmacodynamicsand bioavailability of the ACE inhibitor ramipril, Eur. J. Clin.Pharmacol. 47 (1995) 513–518.
[26] Rxlist.com, the internet drug index <http://www.rxlist.com/cgi/generic/ramipril_cp.htm/>.
[27] D.G. Levitt, R.C. Schoemaker, Human physiologically based phar-macokinetic model for ACE inhibitors: ramipril and ramiprilat, BMCClin. Pharmacol. 6 (1) (2006), doi:10.1186/1472-6904-6-1.
S. Shafiq et al. / European Journal of Pharmaceutics and Biopharmaceutics 66 (2007) 227–243 243
[28] S. Yusuf, P. Sleight, J. Pogue, J. Bosch, R. Davies, G. Dagenais, Effectsof an angiotensin-converting enzyme inhibitor, ramipril, on cardio-vascular events in high-risk patients. The heart outcomes preventionevaluation study investigators, N. Engl. J. Med. 34 (2000) 145–153.
[29] S. Yusuf, H. Gerstein, B. Hoogwerf, J. Pogue, J. Bosch, B.H.R.Wolffenbuttel, B. Zinman, HOPE study investigators, ramipril andthe development of diabetes, JAMA 286 (2001) 1882–1885.
[30] I.S. Malik, J. Bhatia, J.S. Kooner, Is ramipril cost-effective as well asclinically useful in reducing cardiovascular risk. JACC, Abstracts-special topics (2001) 1242–1247.
[31] E. Wuhl, O. Mehls, F. Schaefer, Antihypertensive efficacy of ramiprilin children with chronic renal failure, Am. J. Hyper. 16 (5) (2003)P-558, part 2.
[32] Indian Pharmacopeia, Reagents and solutions, 1996 Appendix 13, pp.A144–A145.
[33] C.W. Pouton, Formulation of self-emulsifying drug delivery systems,Adv. Drug Deliv. Rev. 25 (1997) 47–58.
[34] S.M. Khoo, A.J. Humberstone, C.J.H. Porter, G.A. Edwards,W.N. Charman, Formulation design and bioavailability assessmentof lipidic self-emulsifying formulations of halofantrine, Int. J. Pharm.167 (1998) 155–164.
[35] D. Attwood, C. Mallon, G. Ktistis, C.J. Taylor, A study on factorsinfluencing the droplet size in nonionic oil-in-water microemulsions,Int. J. Pharm. 88 (1992) 417–422.
[36] F. Belal, I.A. Al-Zaagi, M.A. Gadkariem, M.A. Abounassif,3A stability-indicating LC method for the simultaneous determinationof ramipril and hydrochloride in dosage forms, J. Pharm. Biomed.Anal. 24 (2001) 335–342.
[37] M.N. Gosh, Fundamentals of Experimental Pharmacology, third ed.,Hilton and company, Koltata, 2005, p. 192.
[38] J. Shaji, V. Joshi, Self-micro emulsifying drug delivery system(SMEDDS) for improving bioavailability of hydrophobic drugs and
its potential to give sustain release dosage form, Indian J. Pharm.Educ. 39 (3) (2005) 130–135.
[39] L. Hanysova, M. Vaclavkova, J. Dohnal, J. Klimes, Stability oframipril in the solvents of different pH, J. Pharm. Biomed. Anal. 24(2005) 335–342.
[40] B.L. Hogan, M. Williams, A. Idiculla, T. Veysoglu, E. Parente,Development and validation of a liquid chromatographic method forthe determination of the related substances of ramipril in Altacecapsules, J. Pharm. Biomed. Anal. 23 (2000) 637–651.
[41] US Patent 2006134213.[42] D.Q.M. Craig, S.A. Barker, D. Banning, S.W. Booth, An investiga-
tion into the mechanisms of self-emulsification using particle sizeanalysis and low frequency dielectric spectroscopy, Int. J. Pharm. 114(1995) 103–110.
[43] W. Warisnoicharoen, A.B. Lansley, M.J. Lawrence, Light scatteringinvestigations on dilute non-ionic oil-in-water microemulsions, AAPSPharm. Sci. 2 (2000) 429–448.
[44] L. Ping, A. Ghosh, R.F. Wagner, S. Krill, Y.M. Joshi, A.T.M.Serajuddin, Effect of combined use of nonionic surfactant onformation of oil-in-water microemulsions, Int. J. Pharm. 288 (2005)27–34.
[45] P.K. Ghosh, R.S.R. Murthy, Microemulsions: A potential drugdelivery system, Curr. Drug Deliv. 3 (2006) 167–180.
[46] K. Shinoda, B. Lindman, Organized surfactant systems: microemul-sions, Langmuir 3 (1987) 135–179.
[47] E.R. Debusmann, J.O. Pujadas, W. Lahn, R. Irmisch, F. Jane,T.S. Kuan, J. Mora, U. Walter, H.G. Eckert, P. Hajdu, H. Metzger,Influence of renal function on the pharmacokinetics of ramipril (HOE498), Am. J. Cardiol. 59 (1987) 70D–78D.
[48] C.K. Kim, Y.J. Cho, Z.G. Gao, Preparation and evaluation ofbiphenyl dimethyl dicarboxylate microemulsions for oral delivery, J.Control. Release 70 (2001) 149–155.